Embed Size (px)
Citation preview

Fourth quarter 2016 results
Analyst callKoen Van Gerven, CEO Koen Beeckmans, CFO
Brussels – March 9, 2017
2
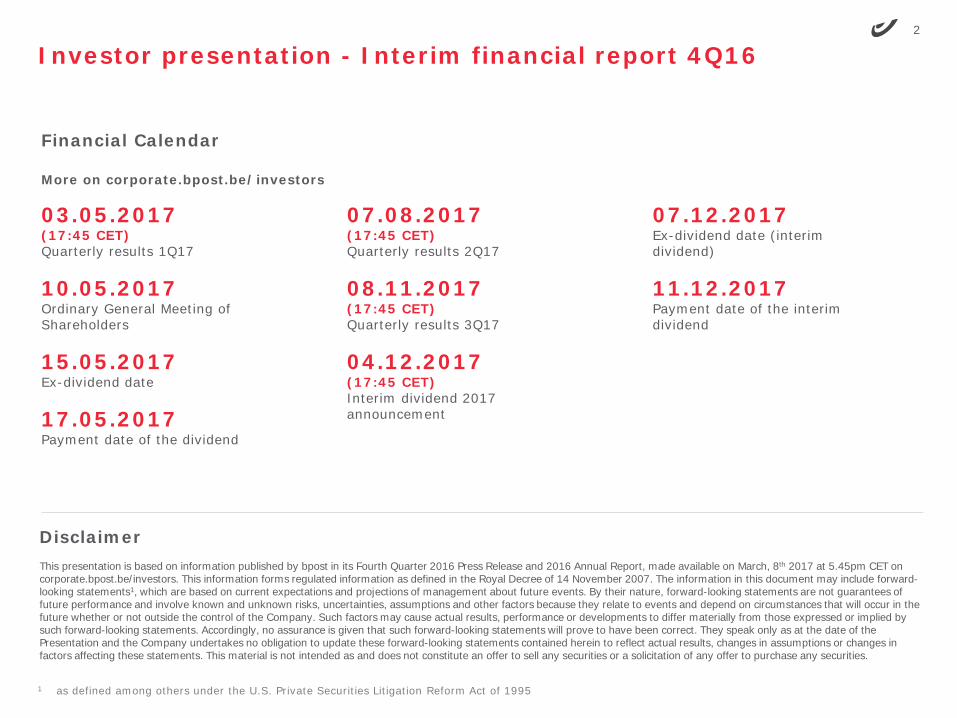
Investor presentation - Interim financial report 4Q16
DisclaimerThis presentation is based on information published by bpost in its Fourth Quarter 2016 Press Release and 2016 Annual Report, made available on March, 8th 2017 at 5.45pm CET on corporate.bpost.be/investors. This information forms regulated information as defined in the Royal Decree of 14 November 2007. The information in this document may include forward-looking statements1, which are based on current expectations and projections of management about future events. By their nature, forward-looking statements are not guarantees of future performance and involve known and unknown risks, uncertainties, assumptions and other factors because they relate to events and depend on circumstances that will occur in the future whether or not outside the control of the Company. Such factors may cause actual results, performance or developments to differ materially from those expressed or implied by such forward-looking statements. Accordingly, no assurance is given that such forward-looking statements will prove to have been correct. They speak only as at the date of the Presentation and the Company undertakes no obligation to update these forward-looking statements contained herein to reflect actual results, changes in assumptions or changes in factors affecting these statements. This material is not intended as and does not constitute an offer to sell any securities or a solicitation of any offer to purchase any securities.
Financial Calendar
1 as defined among others under the U.S. Private Securities Litigation Reform Act of 1995
03.05.2017 (17:45 CET)Quarterly results 1Q17
10.05.2017Ordinary General Meeting of Shareholders
15.05.2017Ex-dividend date
17.05.2017Payment date of the dividend
07.08.2017(17:45 CET)Quarterly results 2Q17
08.11.2017(17:45 CET)Quarterly results 3Q17
04.12.2017(17:45 CET)Interim dividend 2017 announcement
More on corporate.bpost.be/investors
07.12.2017Ex-dividend date (interim dividend)
11.12.2017Payment date of the interim dividend
3
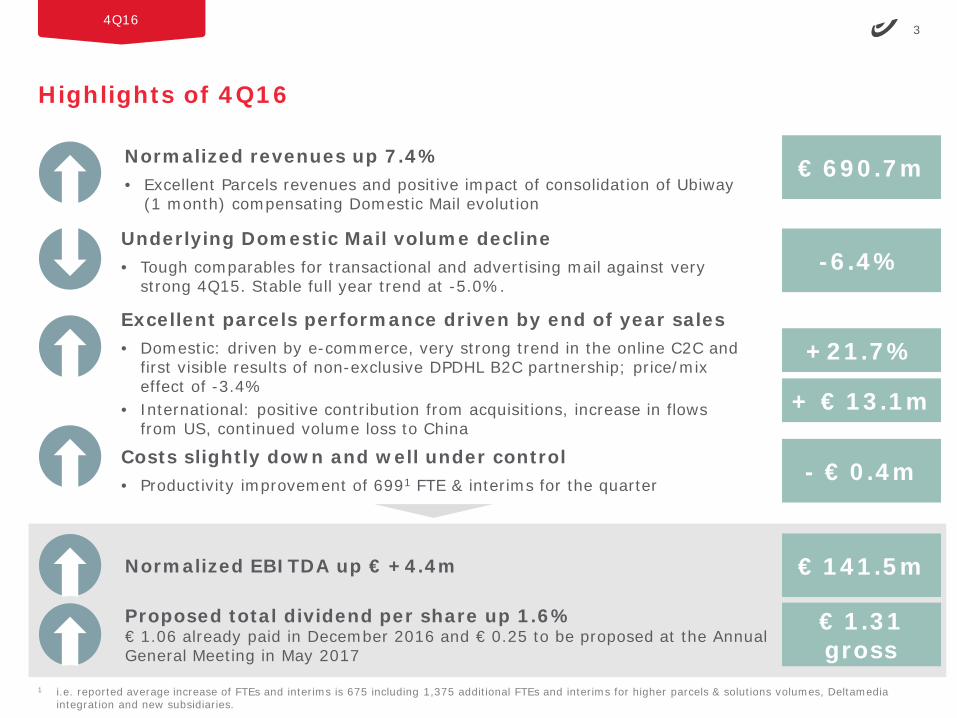
Highlights of 4Q16
4Q16
Underlying Domestic Mail volume decline• Tough comparables for transactional and advertising mail against very
strong 4Q15. Stable full year trend at -5.0%.
Costs slightly down and well under control• Productivity improvement of 6991 FTE & interims for the quarter
Excellent parcels performance driven by end of year sales• Domestic: driven by e-commerce, very strong trend in the online C2C and
first visible results of non-exclusive DPDHL B2C partnership; price/mix effect of -3.4%
• International: positive contribution from acquisitions, increase in flows from US, continued volume loss to China
-6.4%
+21.7%
+ € 13.1m
- € 0.4m
Normalized EBITDA up € +4.4m € 141.5m
€ 1.31 gross
Proposed total dividend per share up 1.6%€ 1.06 already paid in December 2016 and € 0.25 to be proposed at the Annual General Meeting in May 2017
Normalized revenues up 7.4%• Excellent Parcels revenues and positive impact of consolidation of Ubiway
(1 month) compensating Domestic Mail evolution
€ 690.7m
1 i.e. reported average increase of FTEs and interims is 675 including 1,375 additional FTEs and interims for higher parcels & solutions volumes, Deltamediaintegration and new subsidiaries.
4
Highlights FY16 – Results in line with expectations
FY16
EBITDA
EBIT
Domestic Mail
Parcels
Dividend
Normalized1, € million
1 Normalized figures are not audited
FY16: € 586.9m (+0.6%, + € 3.3m)
FY16: € 496.5m (+0.4%, + € 2.1m)
FY16: -5.0% (underlying volume)
FY16: +17.1% (domestic volumes)
Total gross dividend of € 1.31 per share proposed• Interim dividend already paid: € 1.06 (+ € 0.01)• Final dividend of € 0.25 (+ € 0.01)
Topic Results Last outlook for 2016
at least at the same level as 2015
Around -5%
Double digit
at least € 1.29
5
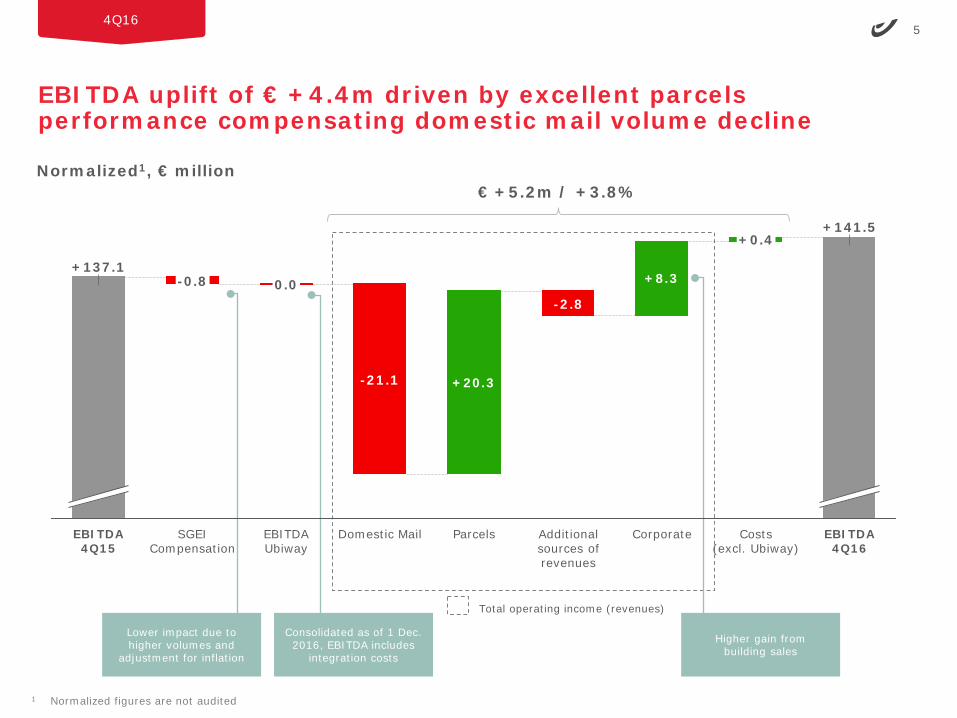
EBITDA uplift of € +4.4m driven by excellent parcels performance compensating domestic mail volume decline
4Q16
Total operating income (revenues)
Normalized1, € million
Lower impact due to higher volumes and
adjustment for inflation
Higher gain from building sales
1 Normalized figures are not audited
+8.3
+20.3
Costs(excl. Ubiway)
-2.8
+0.4
CorporateAdditional sources of revenues
-21.1
Domestic MailSGEI Compensation
0.0-0.8
ParcelsEBITDA 4Q15
+137.1
EBITDAUbiway
+141.5
EBITDA 4Q16
€ +5.2m / +3.8%
Consolidated as of 1 Dec. 2016, EBITDA includes
integration costs
6
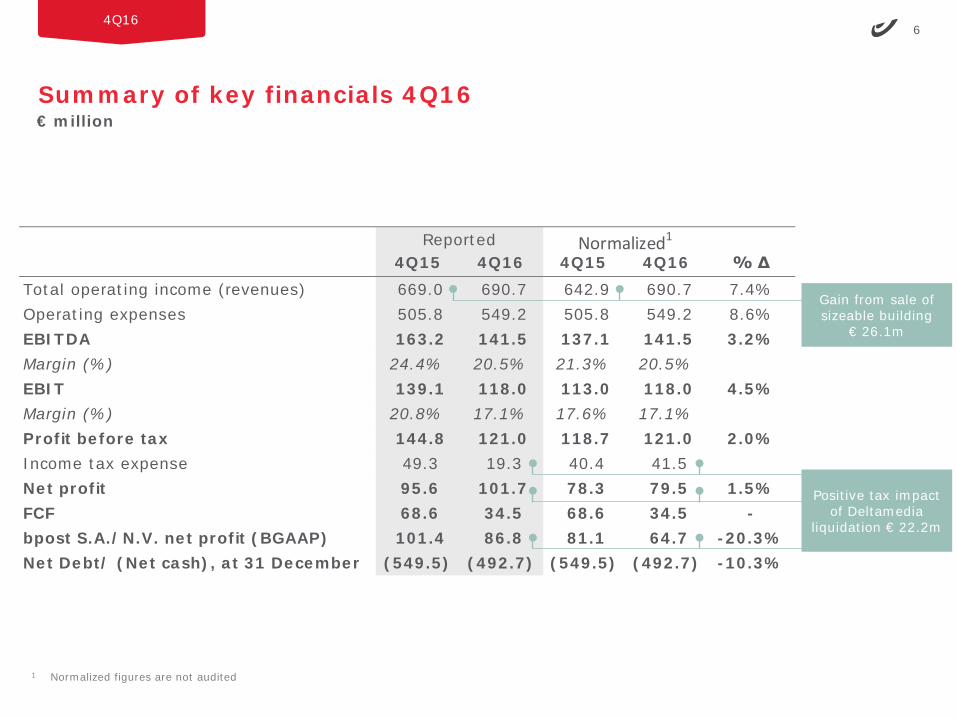
4Q15 4Q16 4Q15 4Q16 % ΔTotal operating income (revenues) 669.0 690.7 642.9 690.7 7.4%Operating expenses 505.8 549.2 505.8 549.2 8.6%EBITDA 163.2 141.5 137.1 141.5 3.2%Margin (%) 24.4% 20.5% 21.3% 20.5%EBIT 139.1 118.0 113.0 118.0 4.5%Margin (%) 20.8% 17.1% 17.6% 17.1%Profit before tax 144.8 121.0 118.7 121.0 2.0%Income tax expense 49.3 19.3 40.4 41.5 Net profit 95.6 101.7 78.3 79.5 1.5%FCF 68.6 34.5 68.6 34.5 -bpost S.A./N.V. net profit (BGAAP) 101.4 86.8 81.1 64.7 -20.3%Net Debt/ (Net cash), at 31 December (549.5) (492.7) (549.5) (492.7) -10.3%
Normalized1Reported
Summary of key financials 4Q16
4Q16
€ million
1 Normalized figures are not audited
Gain from sale of sizeable building
€ 26.1m
Positive tax impact of Deltamedia
liquidation € 22.2m
7
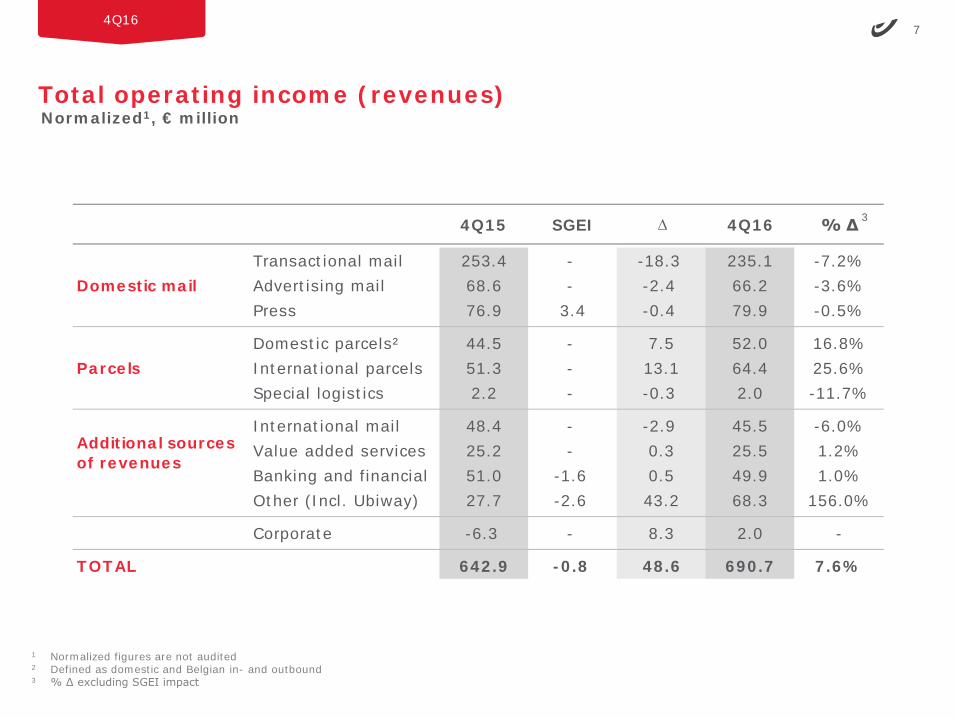
Total operating income (revenues)
4Q16
Normalized1, € million
1 Normalized figures are not audited2 Defined as domestic and Belgian in- and outbound3 % ∆ excluding SGEI impact
4Q15 SGEI ∆ 4Q16 % ∆
Transactional mail 253.4 - -18.3 235.1 -7.2%Advertising mail 68.6 - -2.4 66.2 -3.6%Press 76.9 3.4 -0.4 79.9 -0.5%
Domestic parcels² 44.5 - 7.5 52.0 16.8%International parcels 51.3 - 13.1 64.4 25.6%Special logistics 2.2 - -0.3 2.0 -11.7%
International mail 48.4 - -2.9 45.5 -6.0%Value added services 25.2 - 0.3 25.5 1.2%Banking and financial 51.0 -1.6 0.5 49.9 1.0%Other (Incl. Ubiway) 27.7 -2.6 43.2 68.3 156.0%
Corporate -6.3 - 8.3 2.0 -
642.9 -0.8 48.6 690.7 7.6%
Domestic mail
Parcels
Additional sourcesof revenues
TOTAL
3
8
FY16 domestic mail underlying volume trend in line with guidance at -5.0%
4Q16
Total operating income (revenues), € million
• Tough comparables for transactional (-4.7% 4Q15) and advertising mail (-1.2% 4Q15) against best quarter of 2015.
• Transactional: shift towards cheaper products and continued e-substitution
• Advertising: continued good performance in unaddressed; front-loaded spend in 2016 (more campaigns in 1H16 vs. 2H16) and phasing impact towards 1Q17 (due to timing of Christmas holiday).
• Press: periodicals keeping up well, low renewal rate on newspaper subscriptions contracted in 2H15.
1 4Q16 had 1 working day less vs. 4Q15
-2.1
4Q15 beforeorganic evolution
3.4
-26.1
4Q15
Working dayimpact
398.9
402.3
SGEI
4Q16 381.2
-21.1
Price/Mix 7.1
Volume
1Q16 2Q16 3Q16 4Q16 FY16 1Q16 2Q16 3Q16 4Q16 FY16Transactional mail -5.6% -3.5% -7.8% -7.2% -5.9% -5.3% -4.8% -7.4% -6.4% -5.9%Advertising mail 0.1% -2.2% -1.2% -7.8% -3.0% 0.1% -2.2% -1.2% -7.8% -3.0%Press -2.0% -0.3% -4.2% -4.1% -2.8% -2.0% -0.3% -4.2% -4.1% -2.8%Domestic Mail -4.1% -3.0% -6.1% -7.0% -5.0% -3.9% -3.8% -5.9% -6.4% -5.0%
Reported Underlying 1
9
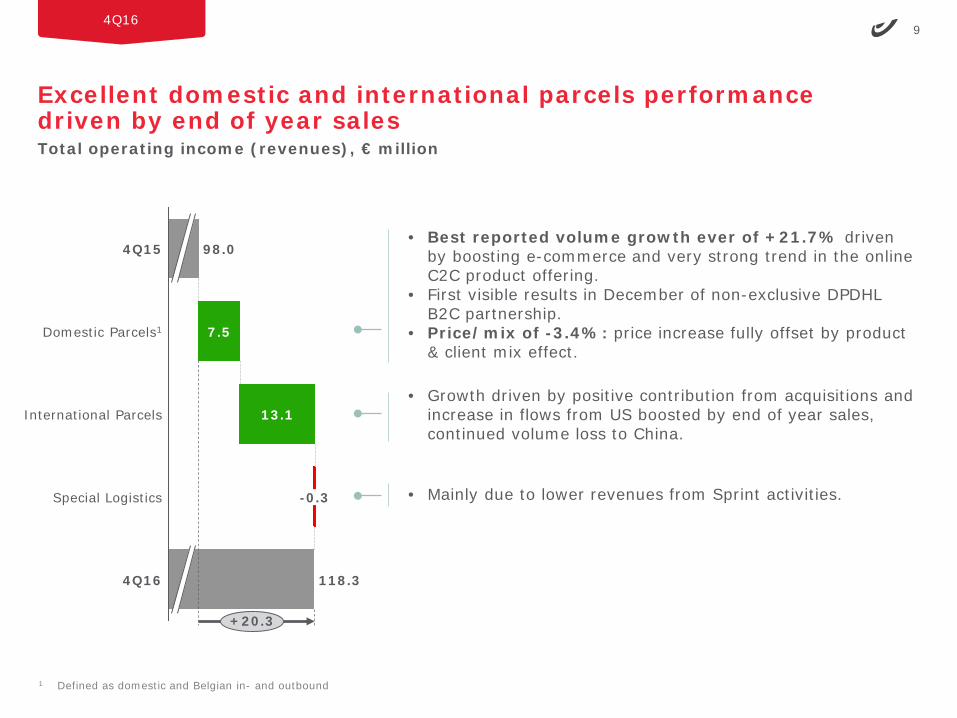
Excellent domestic and international parcels performance driven by end of year sales
4Q16
Total operating income (revenues), € million
Domestic Parcels1
13.1
-0.3
7.5
4Q15 98.0
118.3
+20.3
4Q16
International Parcels
Special Logistics
1 Defined as domestic and Belgian in- and outbound
• Best reported volume growth ever of +21.7% driven by boosting e-commerce and very strong trend in the online C2C product offering.
• First visible results in December of non-exclusive DPDHL B2C partnership.
• Price/mix of -3.4%: price increase fully offset by product & client mix effect.
• Growth driven by positive contribution from acquisitions and increase in flows from US boosted by end of year sales, continued volume loss to China.
• Mainly due to lower revenues from Sprint activities.
10
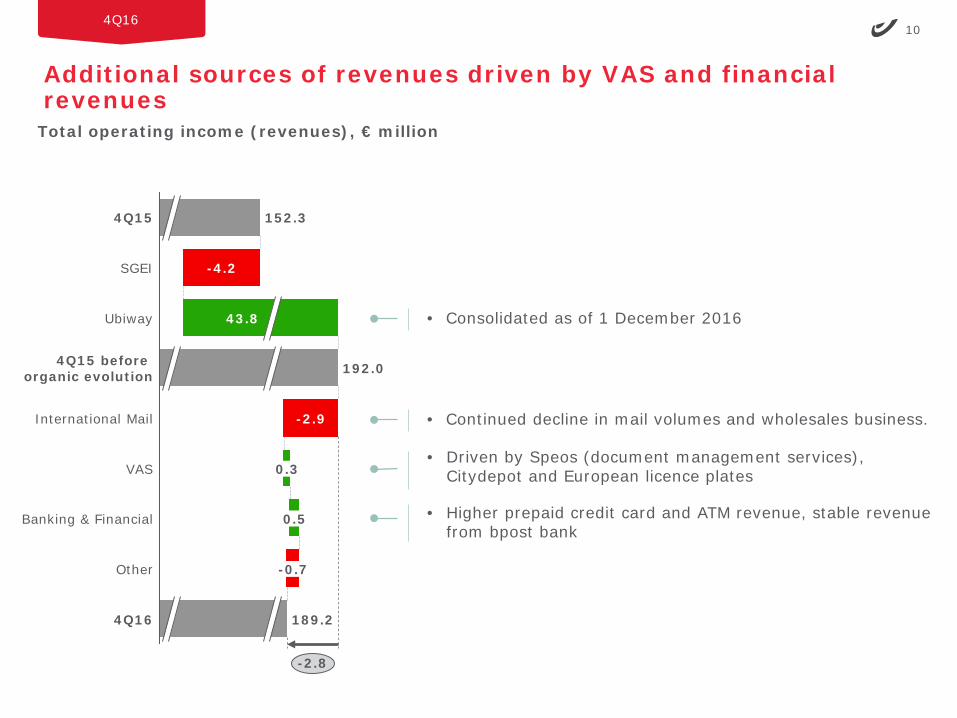
Additional sources of revenues driven by VAS and financial revenues
4Q16
Total operating income (revenues), € million
-4.2
152.3
Banking & Financial
Other
4Q15
International Mail
0.3
Ubiway
189.2
0.5
43.8
SGEI
VAS
192.0
4Q16
4Q15 before organic evolution
-2.8
-2.9
-0.7
• Continued decline in mail volumes and wholesales business.
• Driven by Speos (document management services), Citydepot and European licence plates
• Higher prepaid credit card and ATM revenue, stable revenue from bpost bank
• Consolidated as of 1 December 2016
11
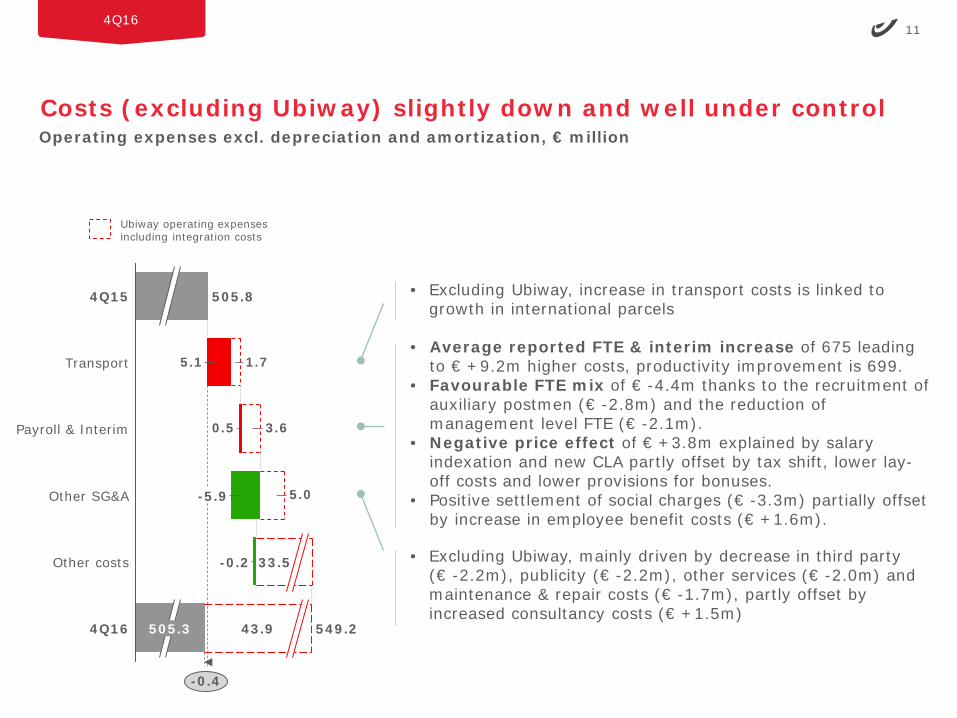
Costs (excluding Ubiway) slightly down and well under control
4Q16
0.5
5.1
5.0
3.6
1.7
Other SG&A
-0.2
505.84Q15
33.5
Transport
-5.9
Payroll & Interim
Other costs
4Q16 549.2505.3 43.9
-0.4
Operating expenses excl. depreciation and amortization, € million
• Excluding Ubiway, increase in transport costs is linked to growth in international parcels
• Excluding Ubiway, mainly driven by decrease in third party (€ -2.2m), publicity (€ -2.2m), other services (€ -2.0m) and maintenance & repair costs (€ -1.7m), partly offset by increased consultancy costs (€ +1.5m)
• Average reported FTE & interim increase of 675 leading to € +9.2m higher costs, productivity improvement is 699.
• Favourable FTE mix of € -4.4m thanks to the recruitment of auxiliary postmen (€ -2.8m) and the reduction of management level FTE (€ -2.1m).
• Negative price effect of € +3.8m explained by salary indexation and new CLA partly offset by tax shift, lower lay-off costs and lower provisions for bonuses.
• Positive settlement of social charges (€ -3.3m) partially offset by increase in employee benefit costs (€ +1.6m).
Ubiway operating expenses including integration costs
12
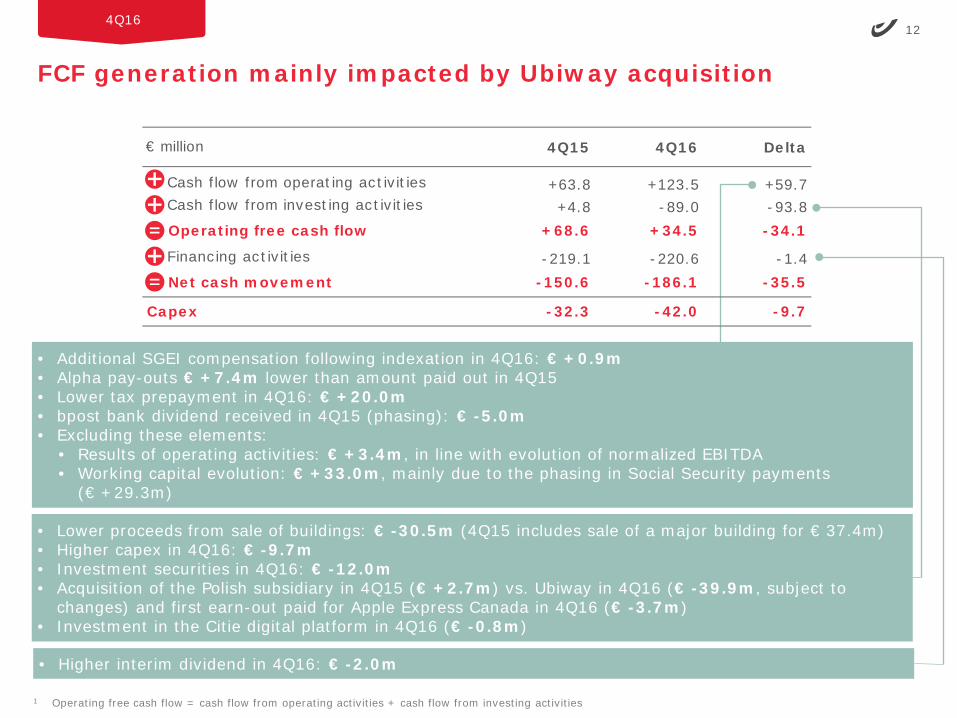
FCF generation mainly impacted by Ubiway acquisition
4Q16
1 Operating free cash flow = cash flow from operating activities + cash flow from investing activities
• Lower proceeds from sale of buildings: € -30.5m (4Q15 includes sale of a major building for € 37.4m)• Higher capex in 4Q16: € -9.7m• Investment securities in 4Q16: € -12.0m• Acquisition of the Polish subsidiary in 4Q15 (€ +2.7m) vs. Ubiway in 4Q16 (€ -39.9m, subject to
changes) and first earn-out paid for Apple Express Canada in 4Q16 (€ -3.7m)• Investment in the Citie digital platform in 4Q16 (€ -0.8m)
• Additional SGEI compensation following indexation in 4Q16: € +0.9m• Alpha pay-outs € +7.4m lower than amount paid out in 4Q15• Lower tax prepayment in 4Q16: € +20.0m• bpost bank dividend received in 4Q15 (phasing): € -5.0m• Excluding these elements:
• Results of operating activities: € +3.4m, in line with evolution of normalized EBITDA• Working capital evolution: € +33.0m, mainly due to the phasing in Social Security payments
(€ +29.3m)
4Q15 4Q16 Delta
Cash flow from operating activities +63.8 +123.5 +59.7Cash flow from investing activities +4.8 -89.0 -93.8Operating free cash flow +68.6 +34.5 -34.1
Financing activities -219.1 -220.6 -1.4Net cash movement -150.6 -186.1 -35.5
-32.3 -42.0 -9.7Capex
€ million
• Higher interim dividend in 4Q16: € -2.0m
13
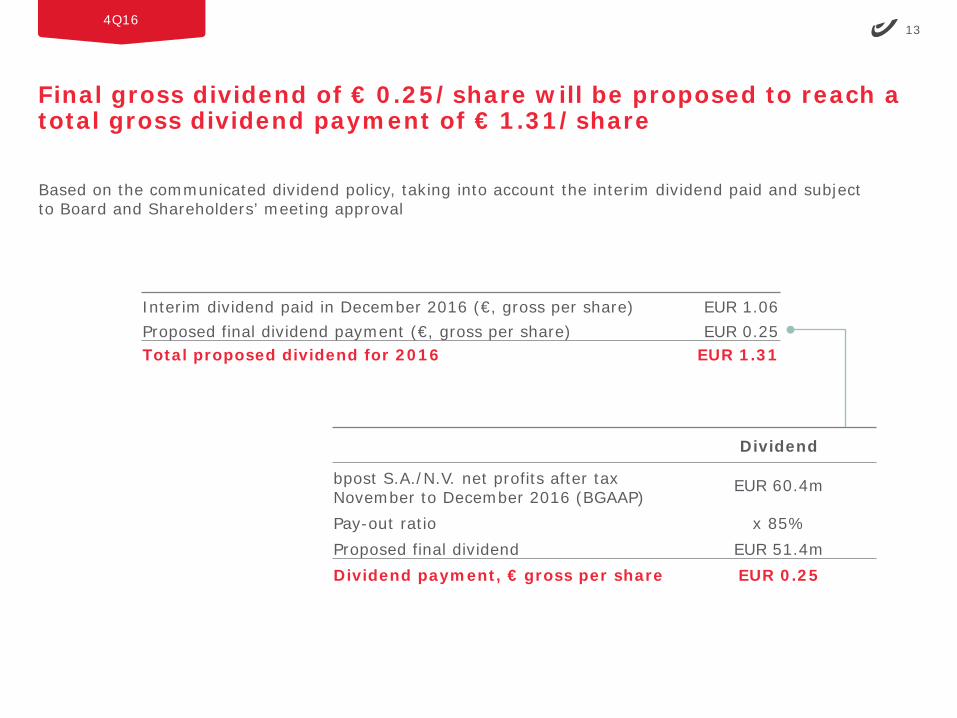
Final gross dividend of € 0.25/share will be proposed to reach a total gross dividend payment of € 1.31/share
4Q16
Dividend
bpost S.A./N.V. net profits after taxNovember to December 2016 (BGAAP)
EUR 60.4m
Pay-out ratio x 85%Proposed final dividend EUR 51.4mDividend payment, € gross per share EUR 0.25
Interim dividend paid in December 2016 (€, gross per share) EUR 1.06Proposed final dividend payment (€, gross per share) EUR 0.25Total proposed dividend for 2016 EUR 1.31
Based on the communicated dividend policy, taking into account the interim dividend paid and subject to Board and Shareholders’ meeting approval
14
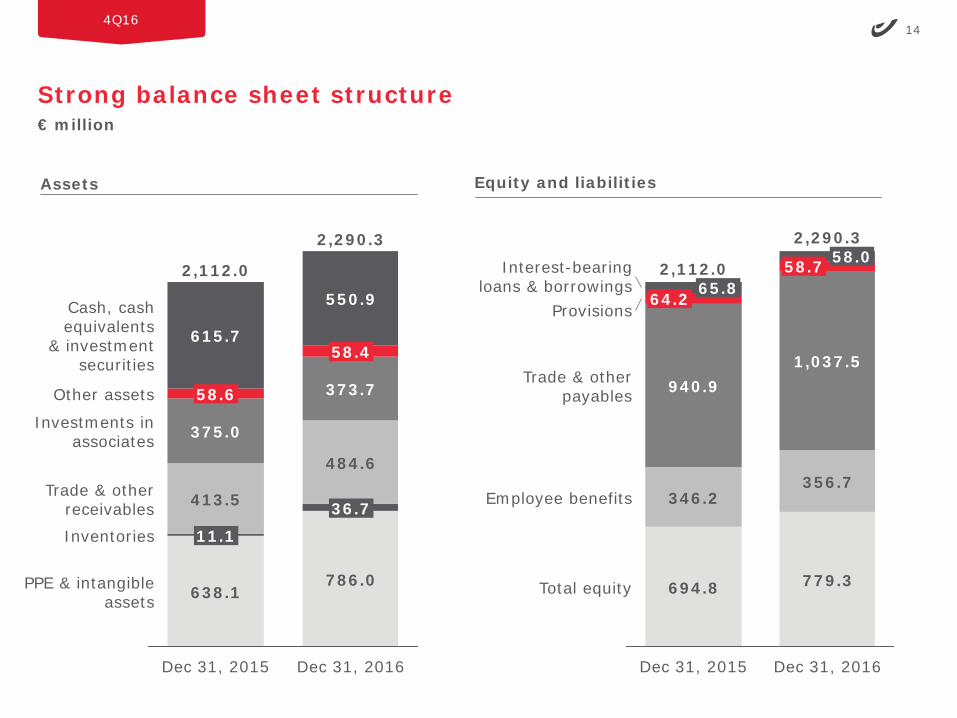
Strong balance sheet structure
4Q16
€ million
Assets Equity and liabilities
PPE & intangibleassets
Inventories
Trade & otherreceivables
Investments inassociates
Other assets
Cash, cashequivalents
& investmentsecurities
Dec 31, 2016
2,112.0
2,290.3
638.1
375.0
58.6
615.7
413.5
11.1
786.0
484.6
373.7
550.9
58.4
36.7
Dec 31, 2015
2,112.0
Dec 31, 2015
58.058.7
1,037.5
356.7
779.3
2,290.3
346.2
940.9
694.8
64.2 65.8Interest-bearing
loans & borrowings
Trade & otherpayables
Provisions
Dec 31, 2016
Total equity
Employee benefits
15
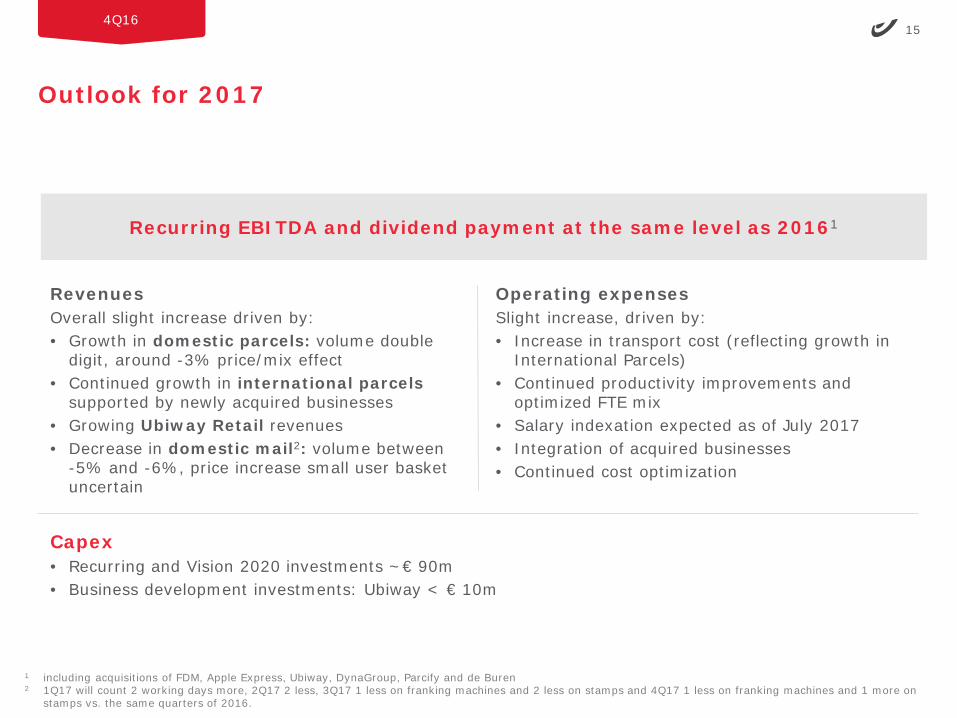
Outlook for 2017
4Q16
1 including acquisitions of FDM, Apple Express, Ubiway, DynaGroup, Parcify and de Buren2 1Q17 will count 2 working days more, 2Q17 2 less, 3Q17 1 less on franking machines and 2 less on stamps and 4Q17 1 less on franking machines and 1 more on
stamps vs. the same quarters of 2016.
Recurring EBITDA and dividend payment at the same level as 20161
RevenuesOverall slight increase driven by:• Growth in domestic parcels: volume double
digit, around -3% price/mix effect• Continued growth in international parcels
supported by newly acquired businesses• Growing Ubiway Retail revenues• Decrease in domestic mail2: volume between
-5% and -6%, price increase small user basket uncertain
Operating expensesSlight increase, driven by:• Increase in transport cost (reflecting growth in
International Parcels) • Continued productivity improvements and
optimized FTE mix• Salary indexation expected as of July 2017• Integration of acquired businesses • Continued cost optimization
Capex• Recurring and Vision 2020 investments ~€ 90m• Business development investments: Ubiway < € 10m
16
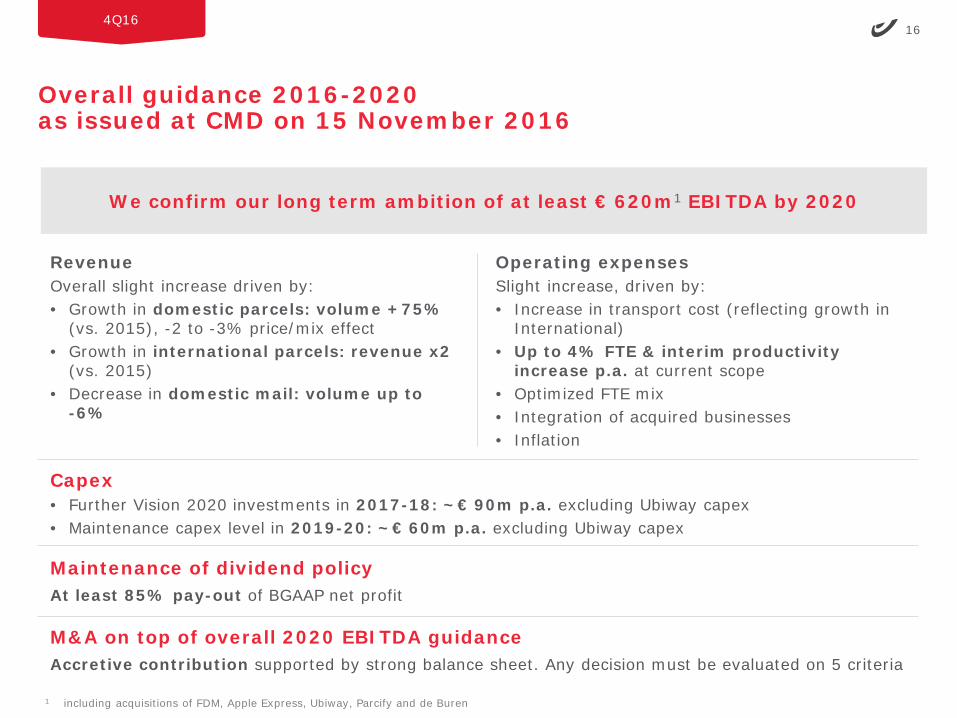
We confirm our long term ambition of at least € 620m1 EBITDA by 2020
4Q16
Overall guidance 2016-2020 as issued at CMD on 15 November 2016
RevenueOverall slight increase driven by:• Growth in domestic parcels: volume +75%
(vs. 2015), -2 to -3% price/mix effect• Growth in international parcels: revenue x2
(vs. 2015)• Decrease in domestic mail: volume up to
-6%
Operating expensesSlight increase, driven by:• Increase in transport cost (reflecting growth in
International) • Up to 4% FTE & interim productivity
increase p.a. at current scope• Optimized FTE mix• Integration of acquired businesses • Inflation
Capex• Further Vision 2020 investments in 2017-18: ~€ 90m p.a. excluding Ubiway capex • Maintenance capex level in 2019-20: ~€ 60m p.a. excluding Ubiway capex
M&A on top of overall 2020 EBITDA guidanceAccretive contribution supported by strong balance sheet. Any decision must be evaluated on 5 criteria
Maintenance of dividend policyAt least 85% pay-out of BGAAP net profit
1 including acquisitions of FDM, Apple Express, Ubiway, Parcify and de Buren

Brussels – March 9, 2017
Appendix: Full year 2016 figures
18
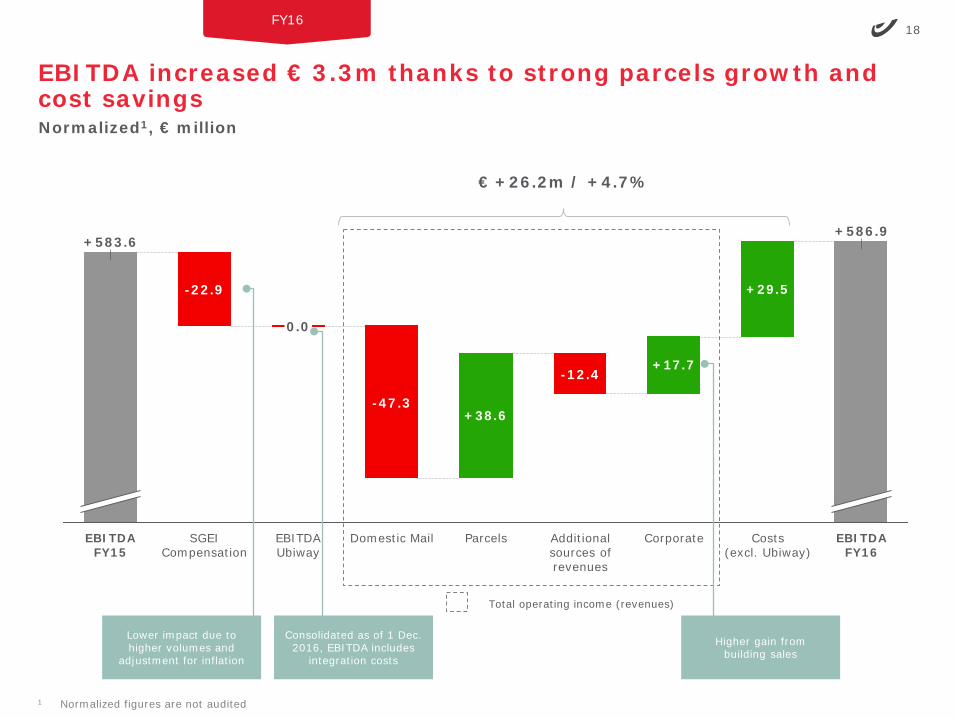
EBITDA increased € 3.3m thanks to strong parcels growth and cost savings
FY16
Total operating income (revenues)
1 Normalized figures are not audited
€ +26.2m / +4.7%
Normalized1, € million
+29.5
+17.7
+38.6
EBITDA FY16
0.0
-47.3
SGEICompensation
EBITDA FY15
Domestic Mail
-22.9
EBITDAUbiway
+583.6
-12.4
Additional sources of revenues
+586.9
Costs(excl. Ubiway)
Parcels Corporate
Consolidated as of 1 Dec. 2016, EBITDA includes
integration costs
Higher gain from building sales
Lower impact due to higher volumes and
adjustment for inflation
19
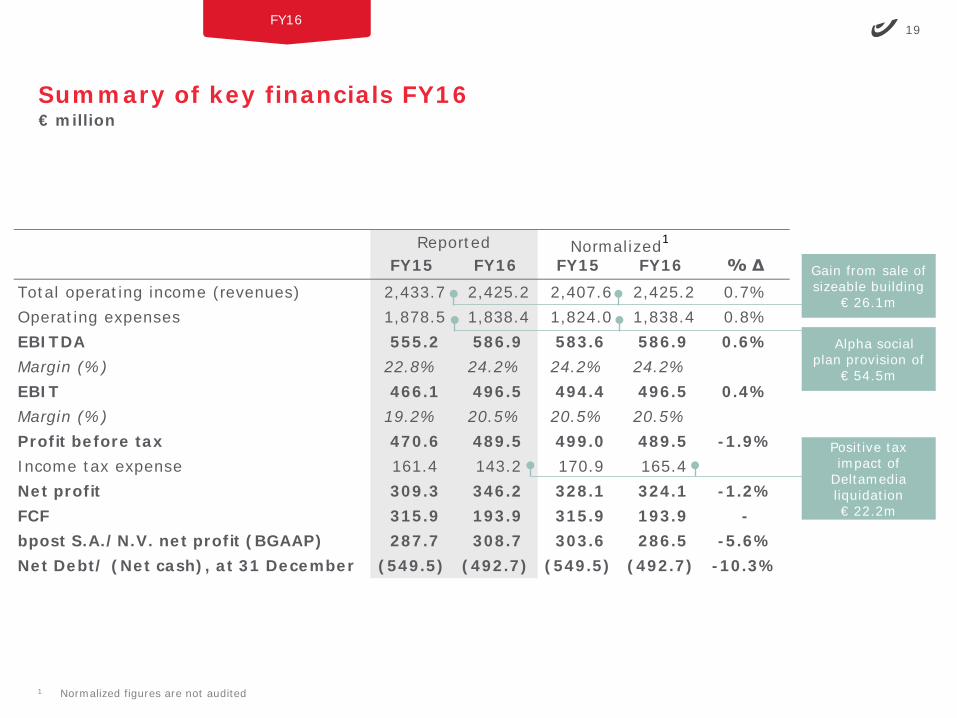
FY15 FY16 FY15 FY16 % ΔTotal operating income (revenues) 2,433.7 2,425.2 2,407.6 2,425.2 0.7%Operating expenses 1,878.5 1,838.4 1,824.0 1,838.4 0.8%EBITDA 555.2 586.9 583.6 586.9 0.6%Margin (%) 22.8% 24.2% 24.2% 24.2%EBIT 466.1 496.5 494.4 496.5 0.4%Margin (%) 19.2% 20.5% 20.5% 20.5%Profit before tax 470.6 489.5 499.0 489.5 -1.9%Income tax expense 161.4 143.2 170.9 165.4 Net profit 309.3 346.2 328.1 324.1 -1.2%FCF 315.9 193.9 315.9 193.9 -bpost S.A./N.V. net profit (BGAAP) 287.7 308.7 303.6 286.5 -5.6%Net Debt/ (Net cash), at 31 December (549.5) (492.7) (549.5) (492.7) -10.3%
Reported Normalized1
Summary of key financials FY16
FY16
1 Normalized figures are not audited
€ million
Alpha social plan provision of
€ 54.5m
Gain from sale of sizeable building
€ 26.1m
Positive tax impact of
Deltamedialiquidation € 22.2m
20
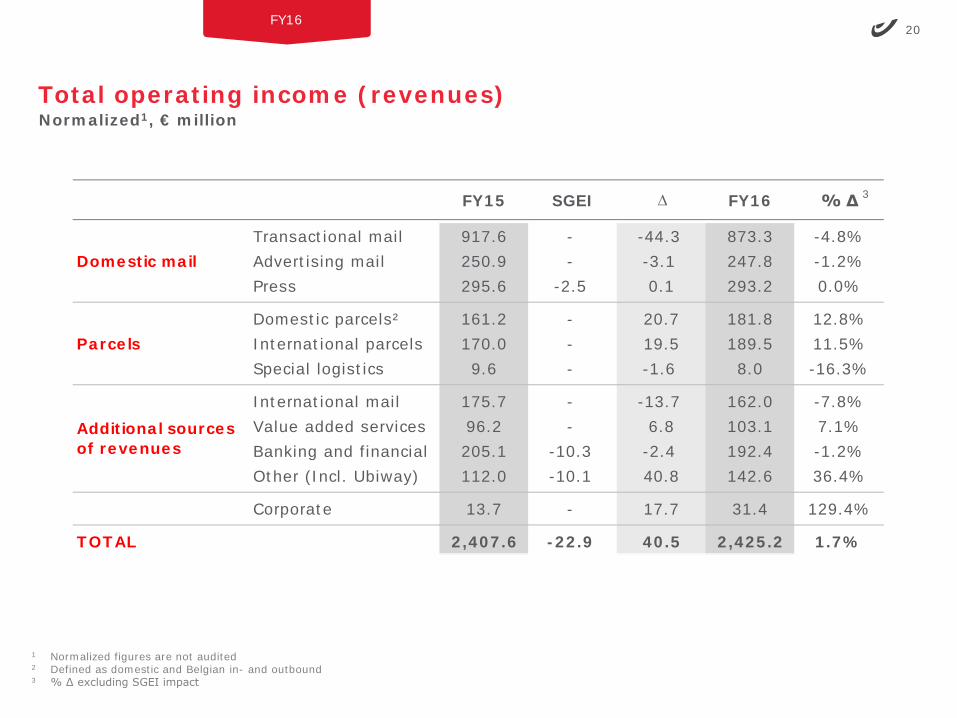
Total operating income (revenues)
FY16
Normalized1, € million
3
1 Normalized figures are not audited2 Defined as domestic and Belgian in- and outbound3 % ∆ excluding SGEI impact
FY15 SGEI ∆ FY16 % ∆
Transactional mail 917.6 - -44.3 873.3 -4.8%Advertising mail 250.9 - -3.1 247.8 -1.2%Press 295.6 -2.5 0.1 293.2 0.0%
Domestic parcels² 161.2 - 20.7 181.8 12.8%International parcels 170.0 - 19.5 189.5 11.5%Special logistics 9.6 - -1.6 8.0 -16.3%
International mail 175.7 - -13.7 162.0 -7.8%Value added services 96.2 - 6.8 103.1 7.1%Banking and financial 205.1 -10.3 -2.4 192.4 -1.2%Other (Incl. Ubiway) 112.0 -10.1 40.8 142.6 36.4%
Corporate 13.7 - 17.7 31.4 129.4%
2,407.6 -22.9 40.5 2,425.2 1.7%
Domestic mail
Parcels
Additional sources of revenues
TOTAL
21
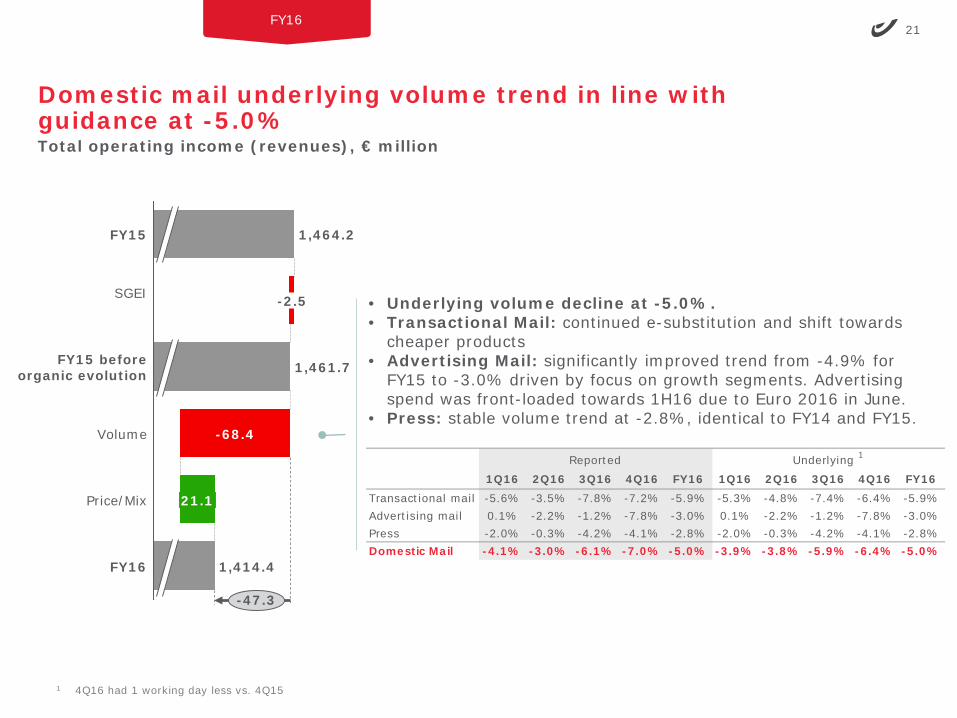
Domestic mail underlying volume trend in line with guidance at -5.0%
FY16
Total operating income (revenues), € million
FY15 1,464.2
-47.3
SGEI
FY16
21.1
FY15 beforeorganic evolution
Price/Mix
-68.4
1,461.7
Volume
-2.5
1,414.4
• Underlying volume decline at -5.0%.• Transactional Mail: continued e-substitution and shift towards
cheaper products • Advertising Mail: significantly improved trend from -4.9% for
FY15 to -3.0% driven by focus on growth segments. Advertising spend was front-loaded towards 1H16 due to Euro 2016 in June.
• Press: stable volume trend at -2.8%, identical to FY14 and FY15.
1 4Q16 had 1 working day less vs. 4Q15
1Q16 2Q16 3Q16 4Q16 FY16 1Q16 2Q16 3Q16 4Q16 FY16Transactional mail -5.6% -3.5% -7.8% -7.2% -5.9% -5.3% -4.8% -7.4% -6.4% -5.9%Advertising mail 0.1% -2.2% -1.2% -7.8% -3.0% 0.1% -2.2% -1.2% -7.8% -3.0%Press -2.0% -0.3% -4.2% -4.1% -2.8% -2.0% -0.3% -4.2% -4.1% -2.8%Domestic Mail -4.1% -3.0% -6.1% -7.0% -5.0% -3.9% -3.8% -5.9% -6.4% -5.0%
Reported Underlying 1
22
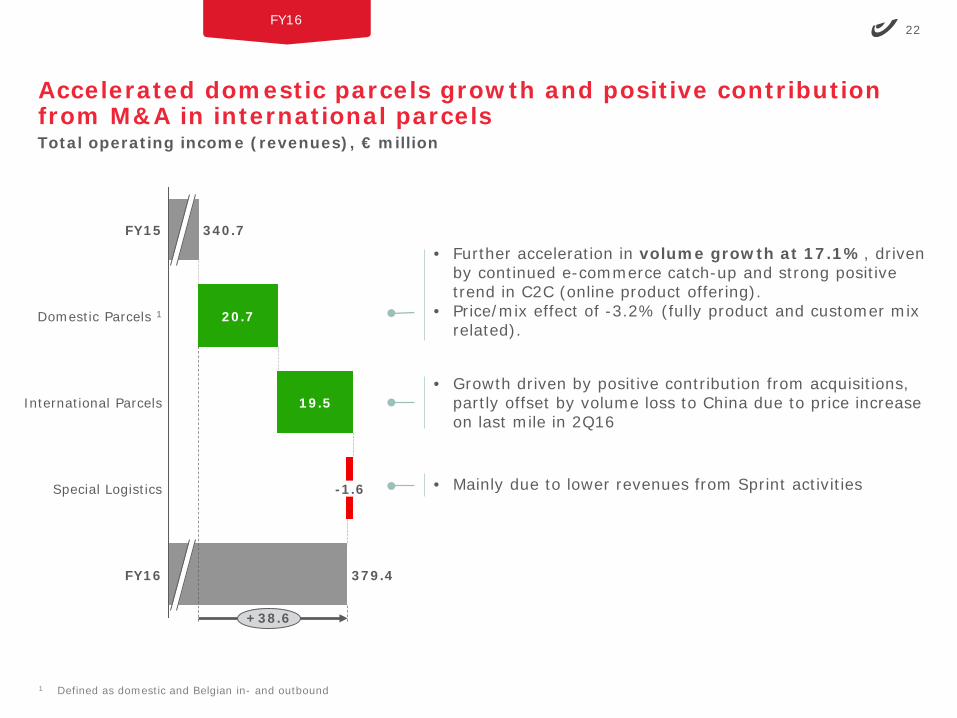
Accelerated domestic parcels growth and positive contribution from M&A in international parcels
FY16
1 Defined as domestic and Belgian in- and outbound
340.7FY15
20.7
379.4
+38.6
FY16
International Parcels 19.5
Domestic Parcels 1
Special Logistics -1.6
Total operating income (revenues), € million
• Further acceleration in volume growth at 17.1%, driven by continued e-commerce catch-up and strong positive trend in C2C (online product offering).
• Price/mix effect of -3.2% (fully product and customer mix related).
• Mainly due to lower revenues from Sprint activities
• Growth driven by positive contribution from acquisitions, partly offset by volume loss to China due to price increase on last mile in 2Q16
23
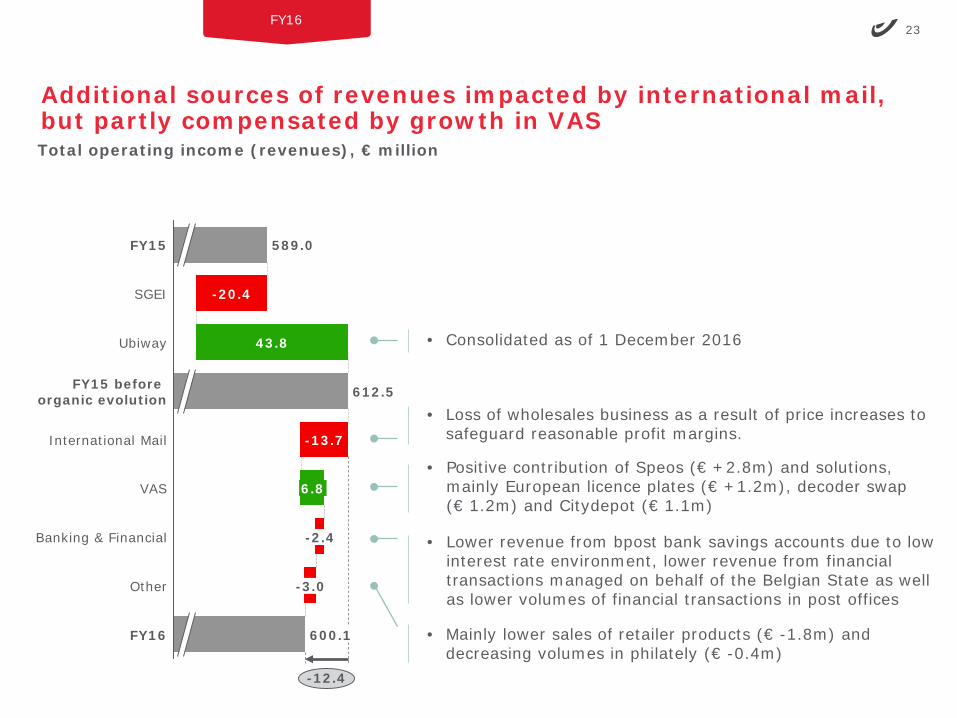
Additional sources of revenues impacted by international mail, but partly compensated by growth in VAS
FY16
-2.4
6.8VAS
-12.4
600.1FY16
Other -3.0
Banking & Financial
International Mail
FY15 before organic evolution
-20.4
-13.7
SGEI
589.0
Ubiway 43.8
612.5
FY15
Total operating income (revenues), € million
• Loss of wholesales business as a result of price increases to safeguard reasonable profit margins.
• Positive contribution of Speos (€ +2.8m) and solutions, mainly European licence plates (€ +1.2m), decoder swap (€ 1.2m) and Citydepot (€ 1.1m)
• Lower revenue from bpost bank savings accounts due to low interest rate environment, lower revenue from financial transactions managed on behalf of the Belgian State as well as lower volumes of financial transactions in post offices
• Consolidated as of 1 December 2016
• Mainly lower sales of retailer products (€ -1.8m) and decreasing volumes in philately (€ -0.4m)
24
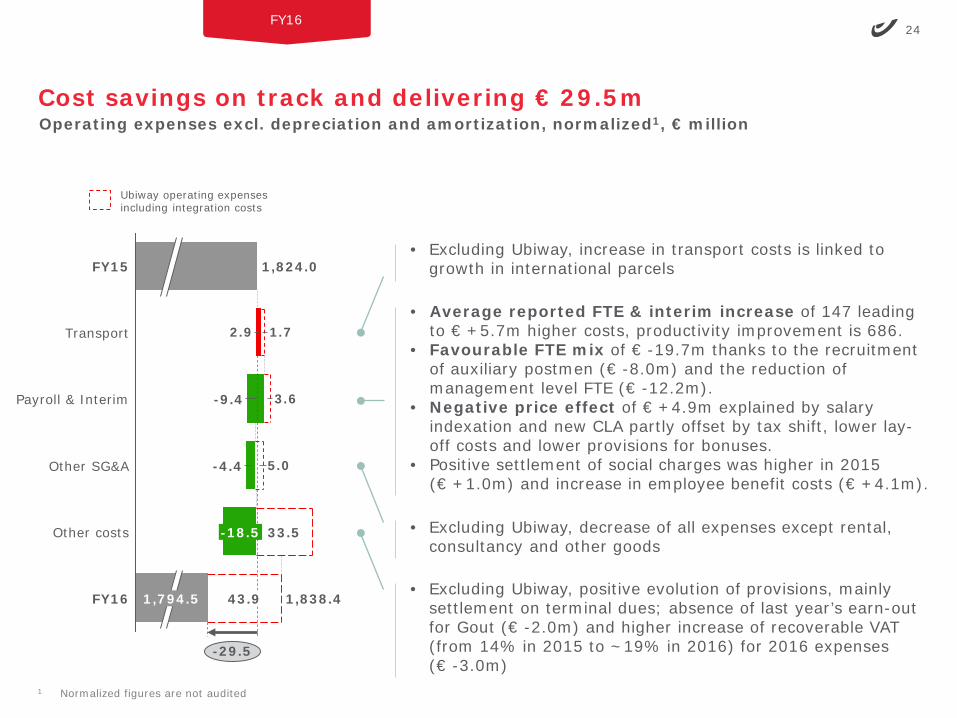
Cost savings on track and delivering € 29.5m
FY16
Operating expenses excl. depreciation and amortization, normalized1, € million
1 Normalized figures are not audited
• Excluding Ubiway, increase in transport costs is linked to growth in international parcels
• Excluding Ubiway, positive evolution of provisions, mainly settlement on terminal dues; absence of last year’s earn-out for Gout (€ -2.0m) and higher increase of recoverable VAT (from 14% in 2015 to ~19% in 2016) for 2016 expenses (€ -3.0m)
• Average reported FTE & interim increase of 147 leading to € +5.7m higher costs, productivity improvement is 686.
• Favourable FTE mix of € -19.7m thanks to the recruitment of auxiliary postmen (€ -8.0m) and the reduction of management level FTE (€ -12.2m).
• Negative price effect of € +4.9m explained by salary indexation and new CLA partly offset by tax shift, lower lay-off costs and lower provisions for bonuses.
• Positive settlement of social charges was higher in 2015 (€ +1.0m) and increase in employee benefit costs (€ +4.1m).
• Excluding Ubiway, decrease of all expenses except rental, consultancy and other goods
2.9
5.0
3.6
1.7
1,824.0
Transport
Payroll & Interim
-4.4
-9.4
FY15
43.9FY16
33.5
1,838.4
Other SG&A
-18.5
1,794.5
Other costs
-29.5
Ubiway operating expenses including integration costs
25
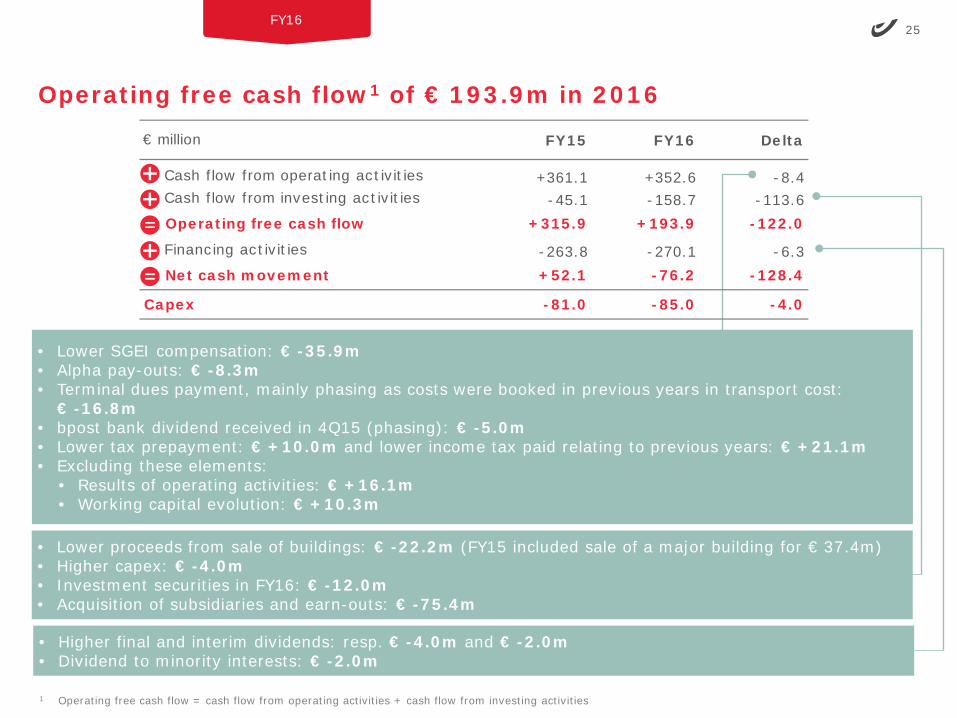
Operating free cash flow1 of € 193.9m in 2016
FY16
• Lower proceeds from sale of buildings: € -22.2m (FY15 included sale of a major building for € 37.4m)• Higher capex: € -4.0m• Investment securities in FY16: € -12.0m• Acquisition of subsidiaries and earn-outs: € -75.4m
• Lower SGEI compensation: € -35.9m• Alpha pay-outs: € -8.3m• Terminal dues payment, mainly phasing as costs were booked in previous years in transport cost:
€ -16.8m• bpost bank dividend received in 4Q15 (phasing): € -5.0m• Lower tax prepayment: € +10.0m and lower income tax paid relating to previous years: € +21.1m• Excluding these elements:
• Results of operating activities: € +16.1m• Working capital evolution: € +10.3m
• Higher final and interim dividends: resp. € -4.0m and € -2.0m• Dividend to minority interests: € -2.0m
FY15 FY16 Delta
Cash flow from operating activities +361.1 +352.6 -8.4Cash flow from investing activities -45.1 -158.7 -113.6Operating free cash flow +315.9 +193.9 -122.0
Financing activities -263.8 -270.1 -6.3Net cash movement +52.1 -76.2 -128.4
-81.0 -85.0 -4.0Capex
€ million
1 Operating free cash flow = cash flow from operating activities + cash flow from investing activities
26
Key contacts
Baudouin de Hepcée
Director External Communication, Investor Relations & Public Affairs
• Email: [email protected]• Direct: +32 (0) 2 276 22 28• Mobile: +32 (0) 476 49 69 58• Address: bpost, Centre Monnaie, 1000 Brussels, Belgium
Saskia Dheedene
Manager Investor Relations
• Email: [email protected]• Direct: +32 (0) 2 276 76 43• Mobile: +32 (0) 477 92 23 43• Address: bpost, Centre Monnaie, 1000 Brussels, Belgium