Embed Size (px)
Citation preview
Blount International, Inc.March 6, 2012
Fourth Quarter 2011 Financial Results Presentation
Cautionary Statements
Certain statements contained in this presentation are forward looking
based on assumptions of future events which may not prove to be
accurate. They involve risk and uncertainty. Actual results may differ
materially from those expected or implied. We direct you to the cautionary
statements detailed in this morning’s press release and Form 8-K and our
recent SEC filings.
Slide 2 March 6, 2012
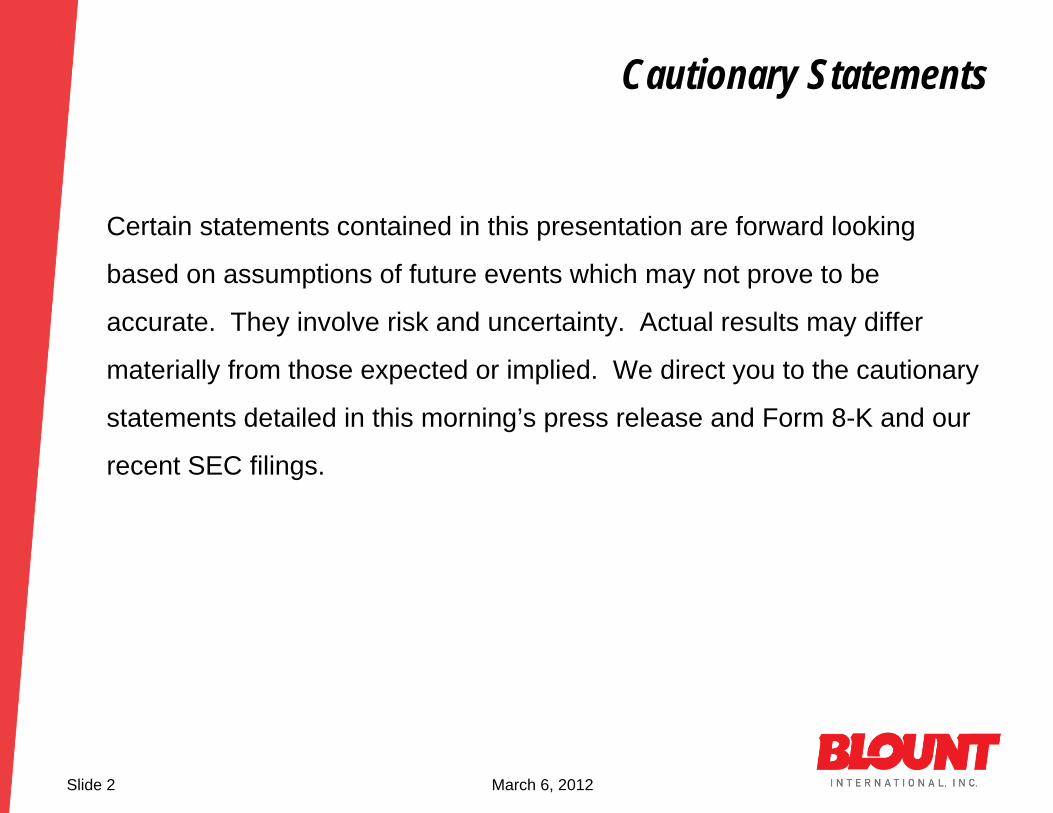
Business overview– Business segments
– Revenue
Fourth quarter and full year 2011 results– Consolidated results
– Segment results
– Cash flow & debt
2012 outlook and strategy
Appendix
NOTE:
As a result of the acquisitions made in 2011, we now operate in two business segments – the Forestry, Lawn, and Garden (“FLAG”) segment and the Farm, Ranch, and Agriculture (“FRAG”) segment.
Index
Slide 3 March 6, 2012
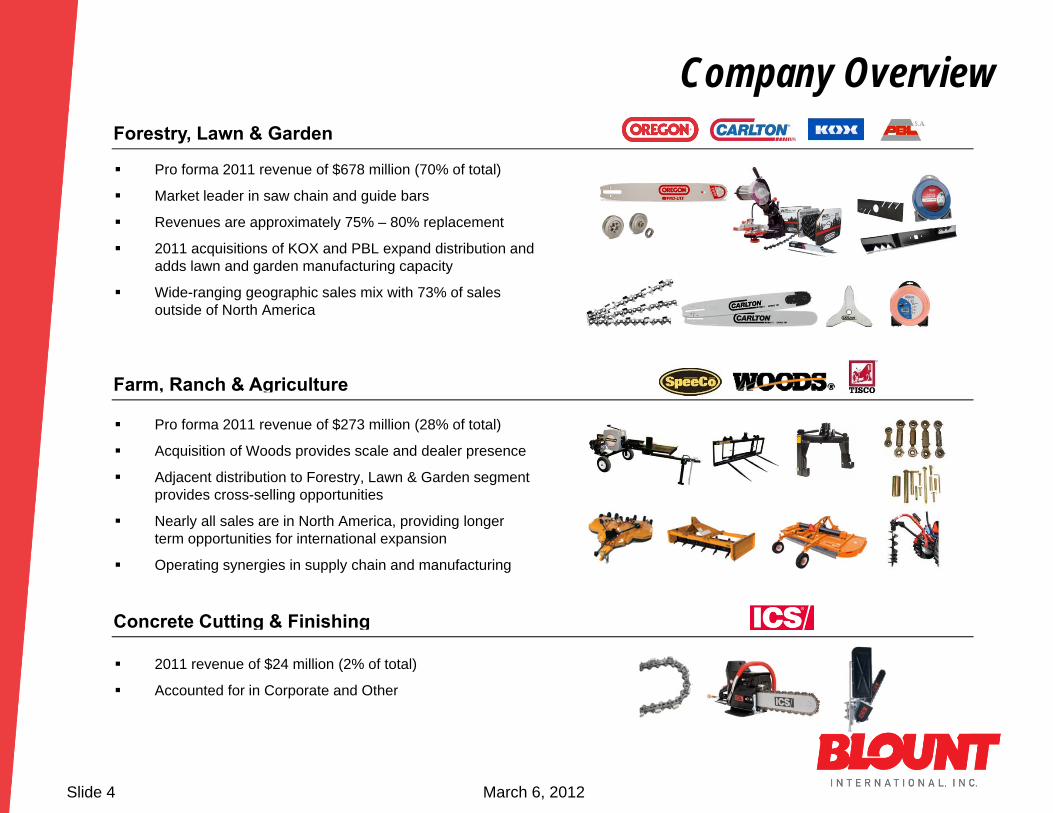
Concrete Cutting & Finishing
Farm, Ranch & Agriculture
Forestry, Lawn & Garden
Company Overview
Slide 4 March 6, 2012
2011 revenue of $24 million (2% of total)
Accounted for in Corporate and Other
Pro forma 2011 revenue of $678 million (70% of total)
Market leader in saw chain and guide bars
Revenues are approximately 75% – 80% replacement
2011 acquisitions of KOX and PBL expand distribution and adds lawn and garden manufacturing capacity
Wide-ranging geographic sales mix with 73% of sales outside of North America
Pro forma 2011 revenue of $273 million (28% of total)
Acquisition of Woods provides scale and dealer presence
Adjacent distribution to Forestry, Lawn & Garden segment provides cross-selling opportunities
Nearly all sales are in North America, providing longer term opportunities for international expansion
Operating synergies in supply chain and manufacturing
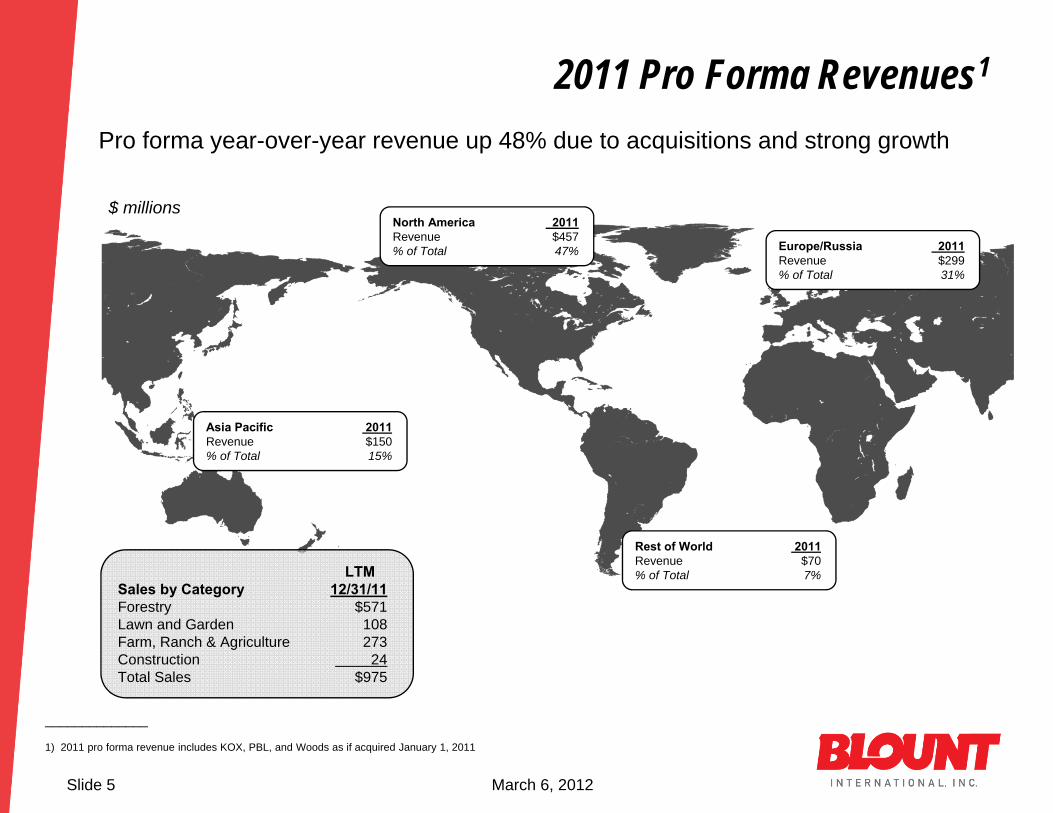
Pro forma year-over-year revenue up 48% due to acquisitions and strong growth
2011 Pro Forma Revenues1
Slide 5 March 6, 2012
North America 2011 Revenue $457% of Total 47%
$ millions
______________
1) 2011 pro forma revenue includes KOX, PBL, and Woods as if acquired January 1, 2011
Europe/Russia 2011Revenue $299% of Total 31%
Rest of World 2011Revenue $70% of Total 7%
Asia Pacific 2011Revenue $150% of Total 15%
LTMSales by Category 12/31/11Forestry $571Lawn and Garden 108Farm, Ranch & Agriculture 273Construction 24Total Sales $975
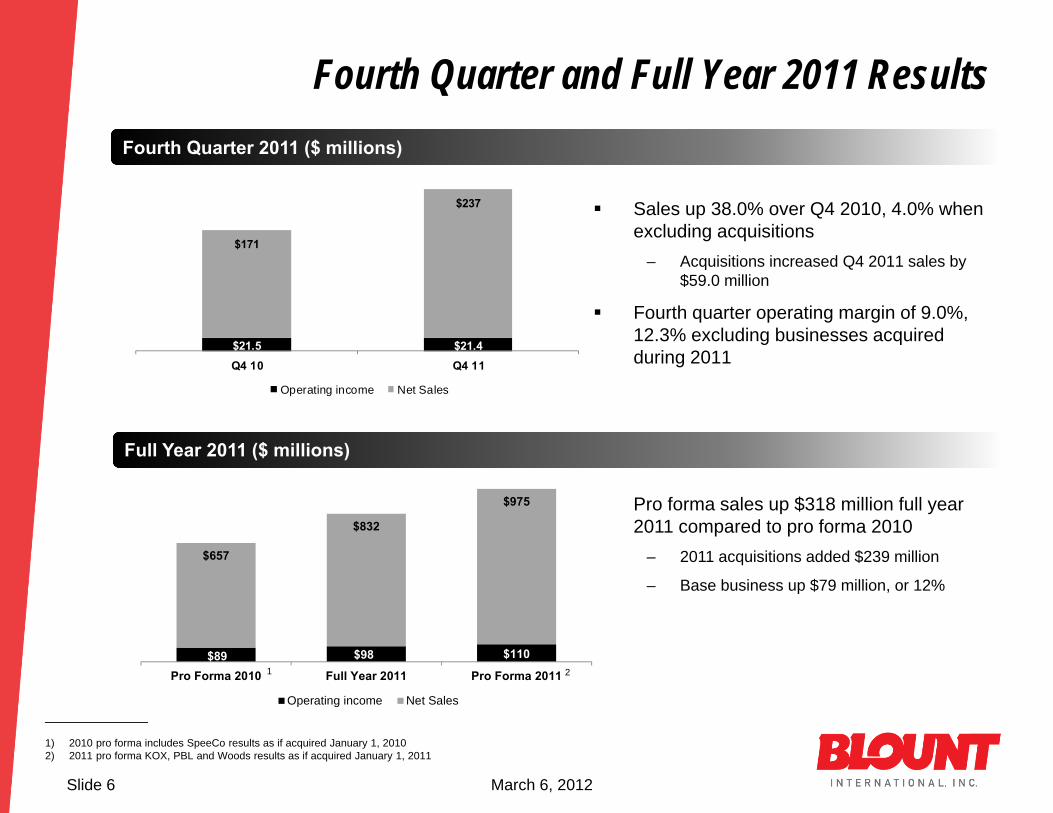
$21.5 $21.4
$171
$237
Q4 10 Q4 11
Operating income Net Sales
Slide 6
Sales up 38.0% over Q4 2010, 4.0% when excluding acquisitions
– Acquisitions increased Q4 2011 sales by $59.0 million
Fourth quarter operating margin of 9.0%, 12.3% excluding businesses acquired during 2011
Fourth Quarter and Full Year 2011 Results
March 6, 2012
______________
1) 2010 pro forma includes SpeeCo results as if acquired January 1, 20102) 2011 pro forma KOX, PBL and Woods results as if acquired January 1, 2011
Pro forma sales up $318 million full year 2011 compared to pro forma 2010
– 2011 acquisitions added $239 million
– Base business up $79 million, or 12%
$89 $98 $110
$657
$832
$975
Pro Forma 2010 Full Year 2011 Pro Forma 2011
Operating income Net Sales
1 2
Full Year 2011 ($ millions)
Fourth Quarter 2011 ($ millions)
Fourth Quarter 2011 Results by Segment
Slide 7 March 6, 2012
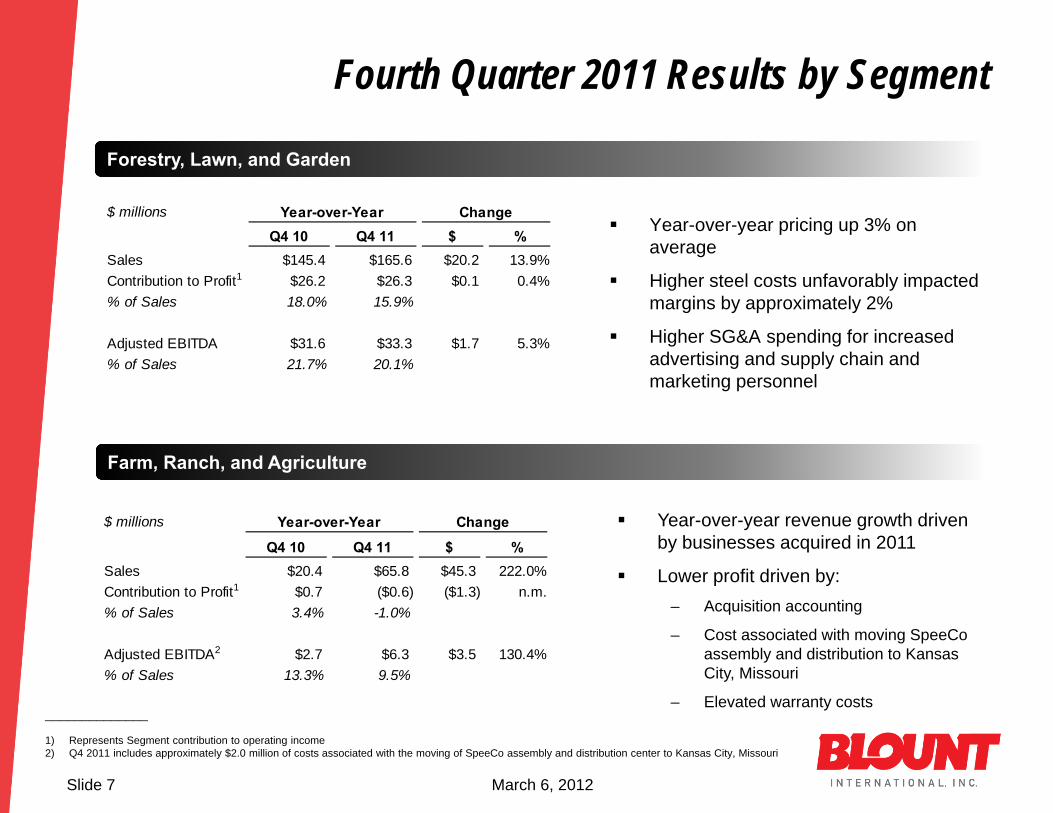
Year-over-year pricing up 3% on average
Higher steel costs unfavorably impacted margins by approximately 2%
Higher SG&A spending for increased advertising and supply chain and marketing personnel
Year-over-year revenue growth driven by businesses acquired in 2011
Lower profit driven by:– Acquisition accounting
– Cost associated with moving SpeeCo assembly and distribution to Kansas City, Missouri
– Elevated warranty costs______________
1) Represents Segment contribution to operating income2) Q4 2011 includes approximately $2.0 million of costs associated with the moving of SpeeCo assembly and distribution center to Kansas City, Missouri
$ millions
Q4 10 Q4 11 $ %Sales $145.4 $165.6 $20.2 13.9%Contribution to Profit1 $26.2 $26.3 $0.1 0.4%% of Sales 18.0% 15.9%
Adjusted EBITDA $31.6 $33.3 $1.7 5.3%% of Sales 21.7% 20.1%
Year-over-Year Change
Farm, Ranch, and Agriculture
Forestry, Lawn, and Garden
$ millions
Q4 10 Q4 11 $ %Sales $20.4 $65.8 $45.3 222.0%Contribution to Profit1 $0.7 ($0.6) ($1.3) n.m.% of Sales 3.4% -1.0%
Adjusted EBITDA2 $2.7 $6.3 $3.5 130.4%% of Sales 13.3% 9.5%
Year-over-Year Change
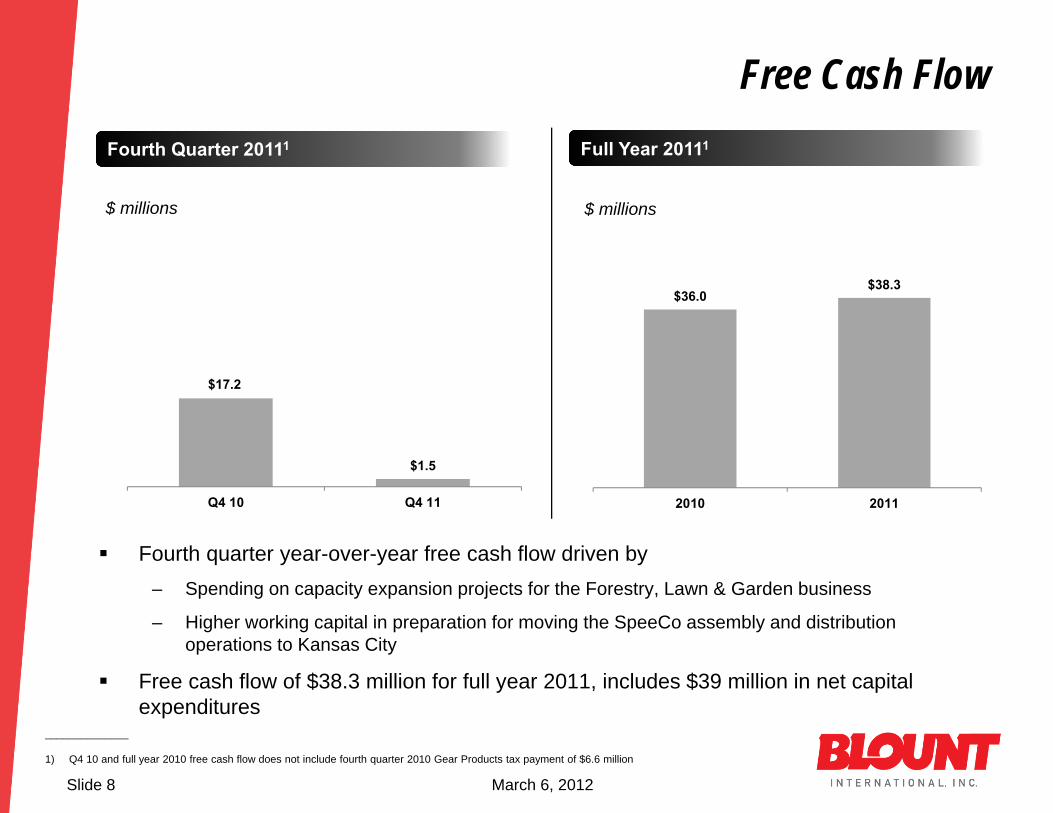
$36.0 $38.3
$0.0
$5.0
$10.0
$15.0
$20.0
$25.0
$30.0
$35.0
$40.0
$45.0
$50.0
2010 2011
Free Cash Flow
Slide 8 March 6, 2012
______________
1) Q4 10 and full year 2010 free cash flow does not include fourth quarter 2010 Gear Products tax payment of $6.6 million
Fourth quarter year-over-year free cash flow driven by– Spending on capacity expansion projects for the Forestry, Lawn & Garden business
– Higher working capital in preparation for moving the SpeeCo assembly and distribution operations to Kansas City
Free cash flow of $38.3 million for full year 2011, includes $39 million in net capital expenditures
$ millions $ millions
Full Year 20111Fourth Quarter 20111
$17.2
$1.5 $0.0
$5.0
$10.0
$15.0
$20.0
$25.0
$30.0
$35.0
$40.0
$45.0
$50.0
Q4 10 Q4 11
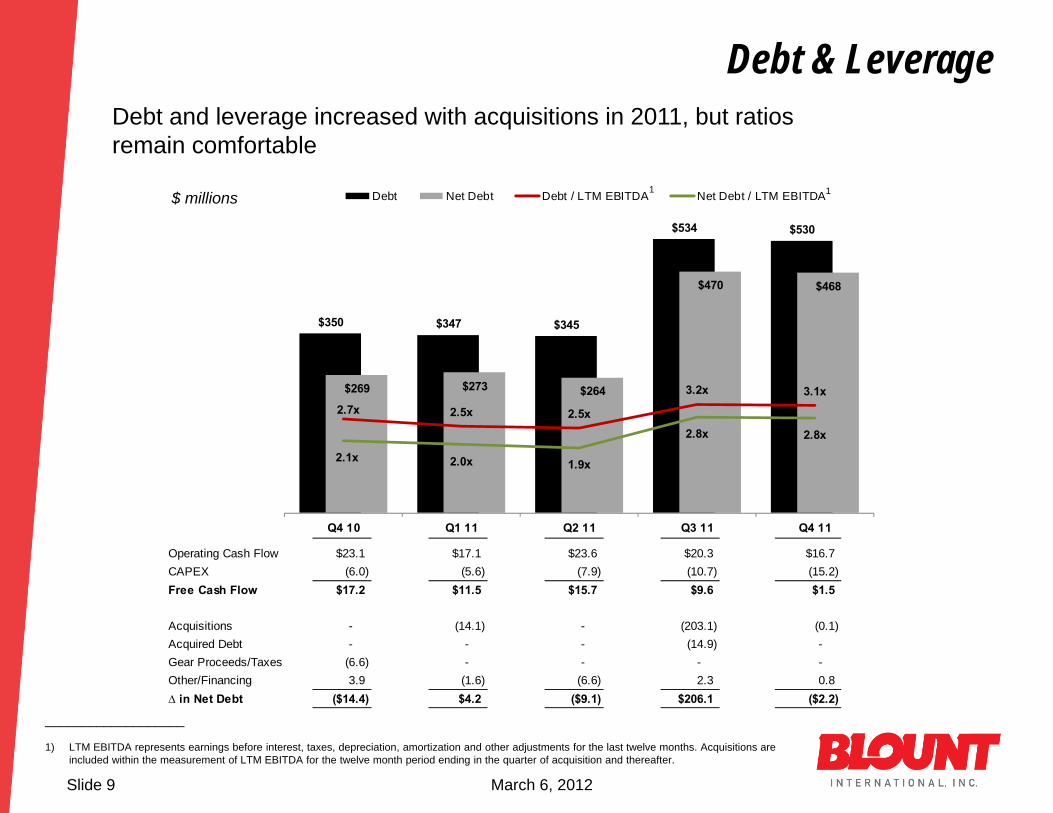
Operating Cash Flow $23.1 $17.1 $23.6 $20.3 $16.7CAPEX (6.0) (5.6) (7.9) (10.7) (15.2) Free Cash Flow $17.2 $11.5 $15.7 $9.6 $1.5
Acquisitions - (14.1) - (203.1) (0.1) Acquired Debt - - - (14.9) - Gear Proceeds/Taxes (6.6) - - - - Other/Financing 3.9 (1.6) (6.6) 2.3 0.8 ∆ in Net Debt ($14.4) $4.2 ($9.1) $206.1 ($2.2)
$350 $347 $345
$534 $530
$269 $273 $264
$470 $468
2.7x 2.5x 2.5x
3.2x 3.1x
2.1x 2.0x 1.9x
2.8x 2.8x
Q4 10 Q1 11 Q2 11 Q3 11 Q4 11
Debt Net Debt Debt / LTM EBITDA Net Debt / LTM EBITDA$ millions1 1
Debt & Leverage
Slide 9
___________________
1) LTM EBITDA represents earnings before interest, taxes, depreciation, amortization and other adjustments for the last twelve months. Acquisitions are included within the measurement of LTM EBITDA for the twelve month period ending in the quarter of acquisition and thereafter.
March 6, 2012
Debt and leverage increased with acquisitions in 2011, but ratios remain comfortable

2012 Outlook and Strategic Direction
Slide 10 March 6, 2012
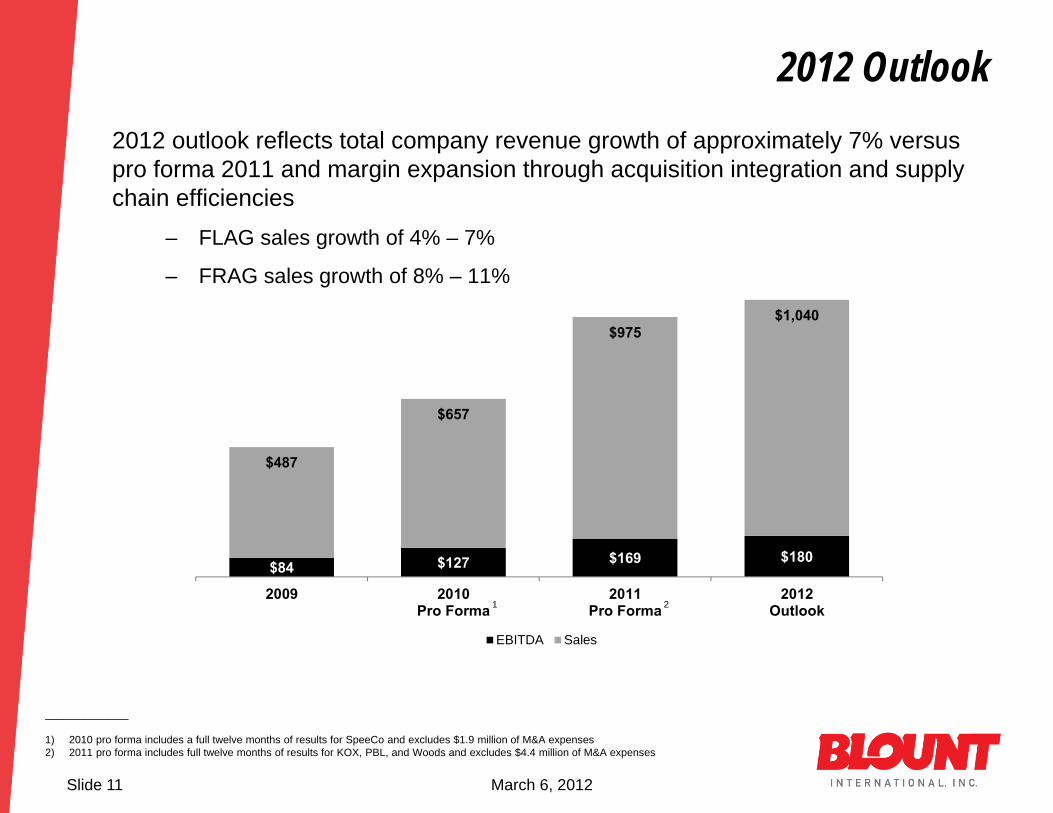
$84 $127 $169 $180
$487
$657
$975$1,040
2009 2010Pro Forma
2011Pro Forma
2012Outlook
EBITDA Sales
2012 Outlook
Slide 11 March 6, 2012
2012 outlook reflects total company revenue growth of approximately 7% versus pro forma 2011 and margin expansion through acquisition integration and supply chain efficiencies
– FLAG sales growth of 4% – 7%
– FRAG sales growth of 8% – 11%
______________
1) 2010 pro forma includes a full twelve months of results for SpeeCo and excludes $1.9 million of M&A expenses2) 2011 pro forma includes full twelve months of results for KOX, PBL, and Woods and excludes $4.4 million of M&A expenses
1 2
Strategy to Drive Shareholder Value
Slide 12 March 6, 2012
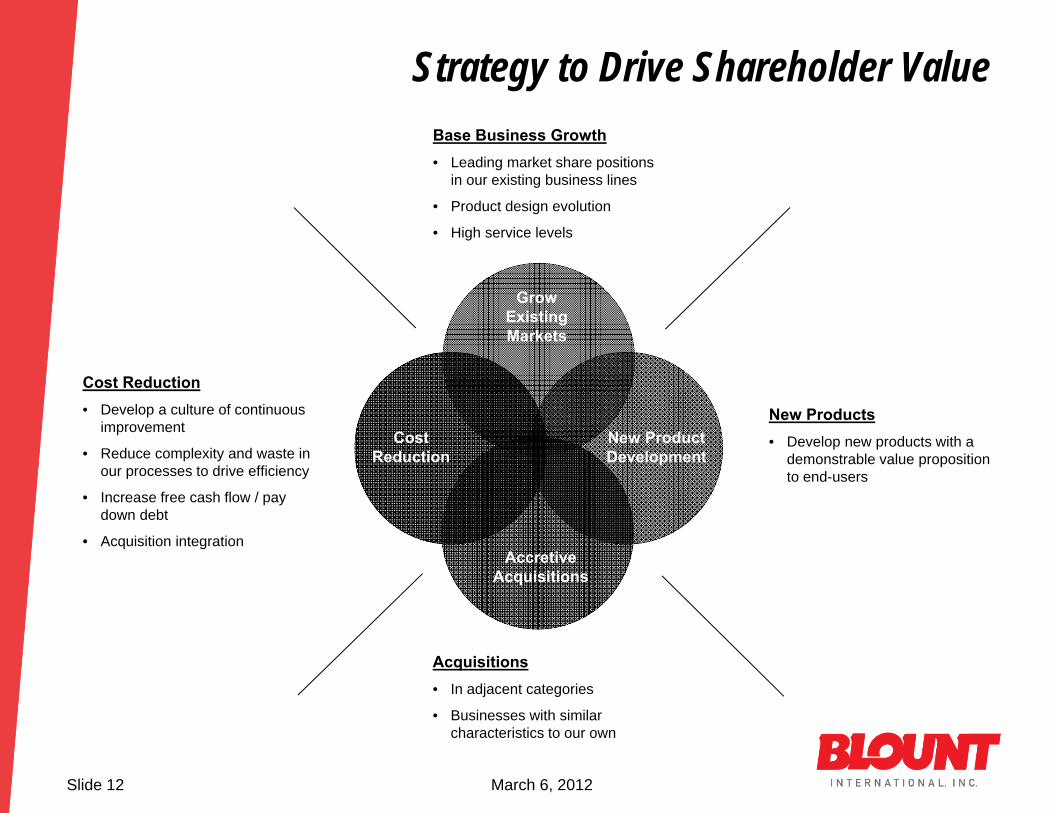
Acquisitions• In adjacent categories
• Businesses with similar characteristics to our own
New Products• Develop new products with a
demonstrable value proposition to end-users
Cost Reduction• Develop a culture of continuous
improvement
• Reduce complexity and waste in our processes to drive efficiency
• Increase free cash flow / pay down debt
• Acquisition integration
Base Business Growth• Leading market share positions
in our existing business lines
• Product design evolution
• High service levels
Cost Reduction
New Product Development
Grow Existing Markets
Accretive Acquisitions
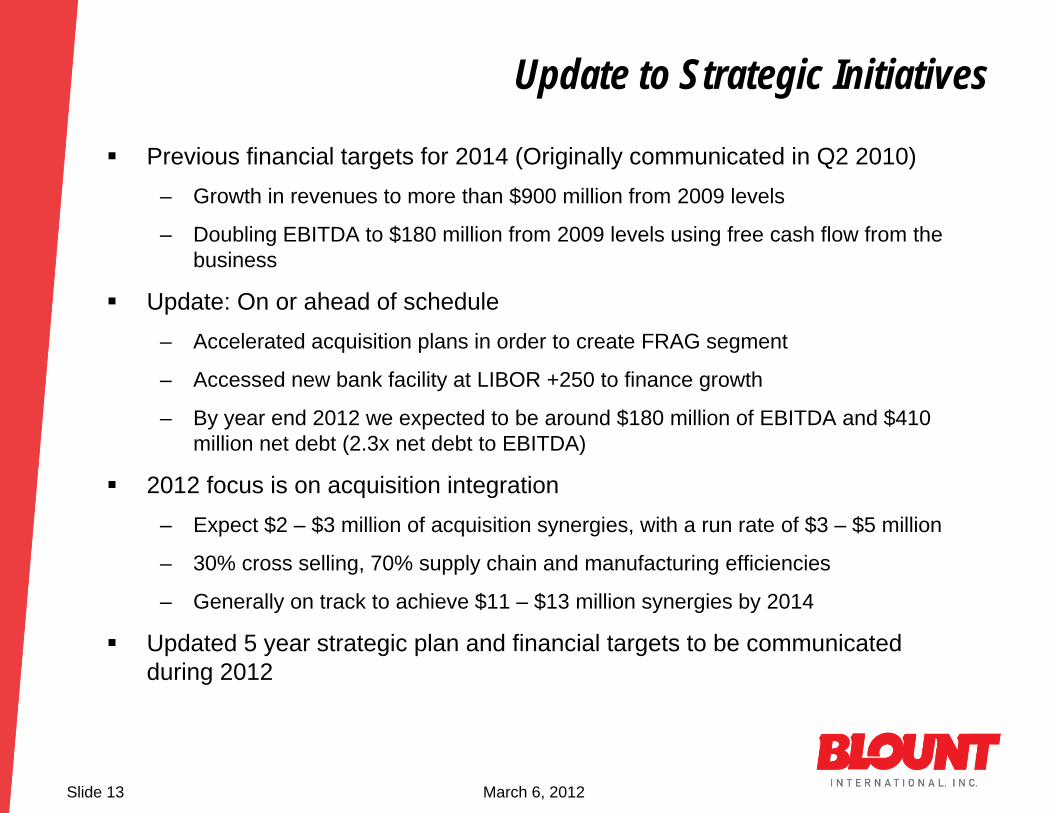
Previous financial targets for 2014 (Originally communicated in Q2 2010)– Growth in revenues to more than $900 million from 2009 levels
– Doubling EBITDA to $180 million from 2009 levels using free cash flow from the business
Update: On or ahead of schedule– Accelerated acquisition plans in order to create FRAG segment
– Accessed new bank facility at LIBOR +250 to finance growth
– By year end 2012 we expected to be around $180 million of EBITDA and $410 million net debt (2.3x net debt to EBITDA)
2012 focus is on acquisition integration– Expect $2 – $3 million of acquisition synergies, with a run rate of $3 – $5 million
– 30% cross selling, 70% supply chain and manufacturing efficiencies
– Generally on track to achieve $11 – $13 million synergies by 2014
Updated 5 year strategic plan and financial targets to be communicated during 2012
Update to Strategic Initiatives
Slide 13 March 6, 2012
Appendix
Slide 14 March 6, 2012
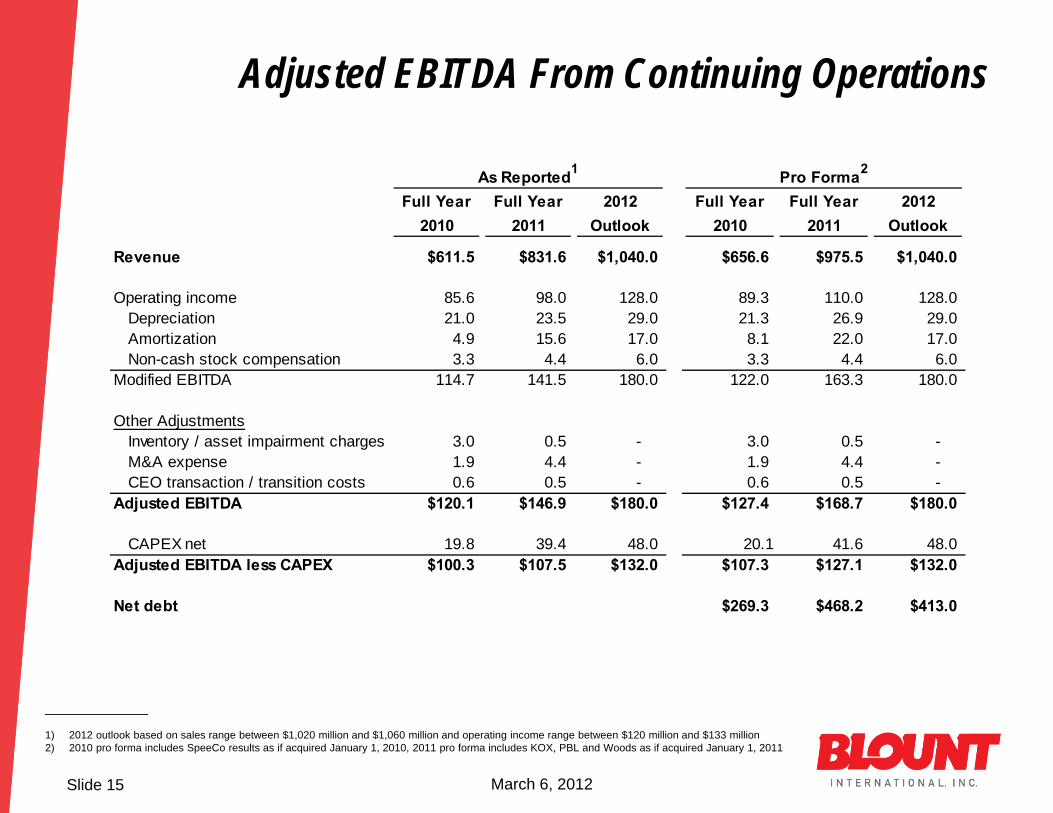
Adjusted EBITDA From Continuing Operations
Slide 15 March 6, 2012
______________
1) 2012 outlook based on sales range between $1,020 million and $1,060 million and operating income range between $120 million and $133 million 2) 2010 pro forma includes SpeeCo results as if acquired January 1, 2010, 2011 pro forma includes KOX, PBL and Woods as if acquired January 1, 2011
Full Year 2010
Full Year 2011
2012 Outlook
Full Year 2010
Full Year 2011
2012 Outlook
Revenue $611.5 $831.6 $1,040.0 $656.6 $975.5 $1,040.0
Operating income 85.6 98.0 128.0 89.3 110.0 128.0Depreciation 21.0 23.5 29.0 21.3 26.9 29.0Amortization 4.9 15.6 17.0 8.1 22.0 17.0Non-cash stock compensation 3.3 4.4 6.0 3.3 4.4 6.0
Modified EBITDA 114.7 141.5 180.0 122.0 163.3 180.0
Other AdjustmentsInventory / asset impairment charges 3.0 0.5 - 3.0 0.5 - M&A expense 1.9 4.4 - 1.9 4.4 - CEO transaction / transition costs 0.6 0.5 - 0.6 0.5 -
Adjusted EBITDA $120.1 $146.9 $180.0 $127.4 $168.7 $180.0
CAPEX net 19.8 39.4 48.0 20.1 41.6 48.0Adjusted EBITDA less CAPEX $100.3 $107.5 $132.0 $107.3 $127.1 $132.0
Net debt $269.3 $468.2 $413.0
As Reported1 Pro Forma2
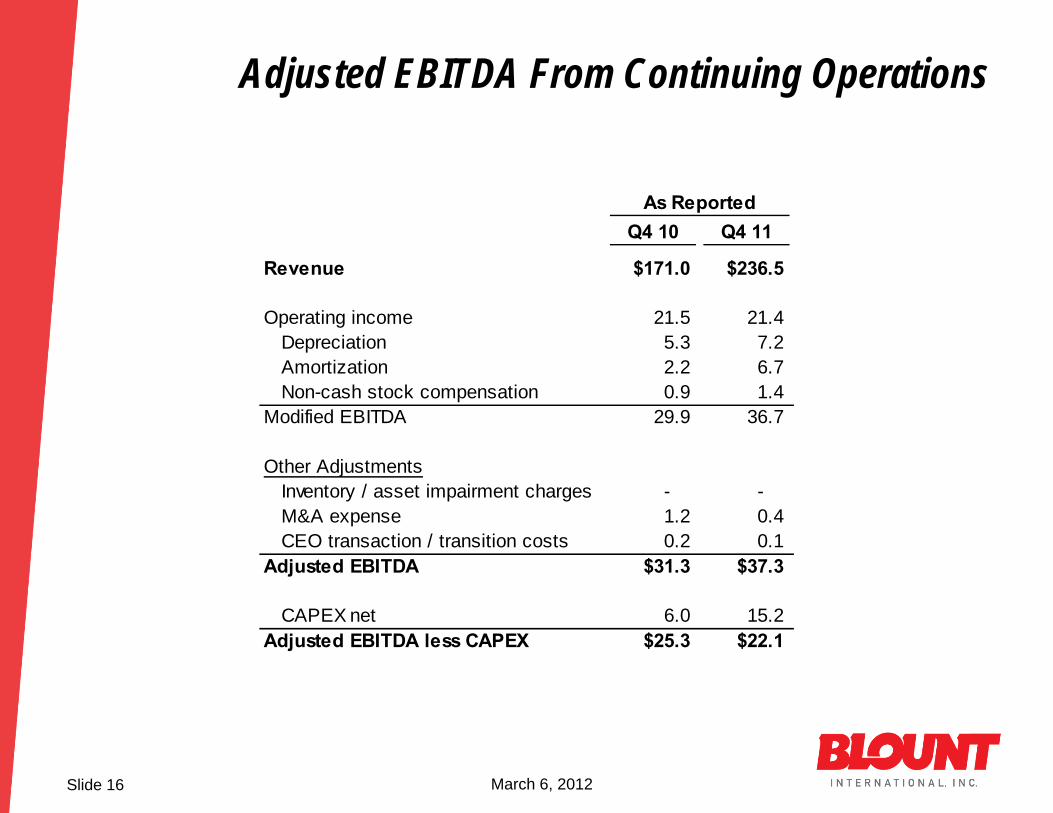
Adjusted EBITDA From Continuing Operations
Slide 16 March 6, 2012
Q4 10 Q4 11
Revenue $171.0 $236.5
Operating income 21.5 21.4Depreciation 5.3 7.2Amortization 2.2 6.7Non-cash stock compensation 0.9 1.4
Modified EBITDA 29.9 36.7
Other AdjustmentsInventory / asset impairment charges - - M&A expense 1.2 0.4CEO transaction / transition costs 0.2 0.1
Adjusted EBITDA $31.3 $37.3
CAPEX net 6.0 15.2Adjusted EBITDA less CAPEX $25.3 $22.1
As Reported
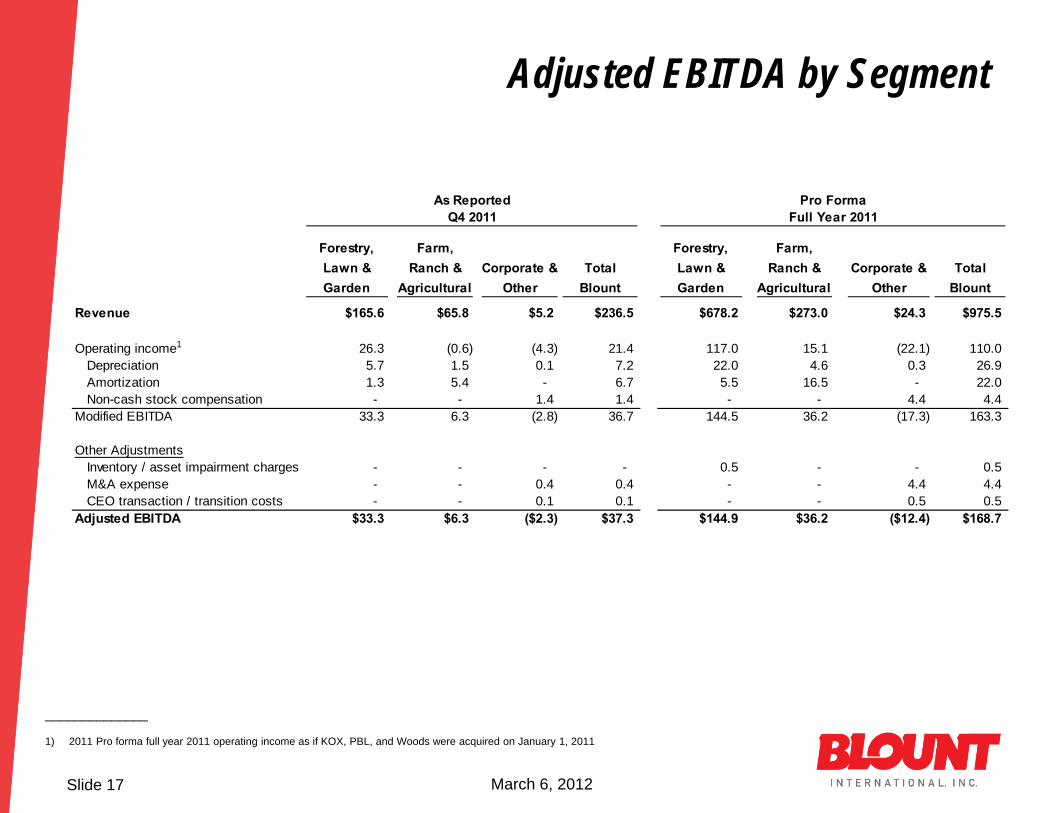
Adjusted EBITDA by Segment
Slide 17 March 6, 2012
______________
1) 2011 Pro forma full year 2011 operating income as if KOX, PBL, and Woods were acquired on January 1, 2011
Forestry, Lawn & Garden
Farm, Ranch &
AgriculturalCorporate &
OtherTotal
Blount
Forestry, Lawn & Garden
Farm, Ranch &
AgriculturalCorporate &
OtherTotal
Blount
Revenue $165.6 $65.8 $5.2 $236.5 $678.2 $273.0 $24.3 $975.5
Operating income1 26.3 (0.6) (4.3) 21.4 117.0 15.1 (22.1) 110.0 Depreciation 5.7 1.5 0.1 7.2 22.0 4.6 0.3 26.9 Amortization 1.3 5.4 - 6.7 5.5 16.5 - 22.0 Non-cash stock compensation - - 1.4 1.4 - - 4.4 4.4
Modified EBITDA 33.3 6.3 (2.8) 36.7 144.5 36.2 (17.3) 163.3
Other AdjustmentsInventory / asset impairment charges - - - - 0.5 - - 0.5 M&A expense - - 0.4 0.4 - - 4.4 4.4 CEO transaction / transition costs - - 0.1 0.1 - - 0.5 0.5
Adjusted EBITDA $33.3 $6.3 ($2.3) $37.3 $144.9 $36.2 ($12.4) $168.7
Q4 2011 Full Year 2011Pro FormaAs Reported