Embed Size (px)
Citation preview
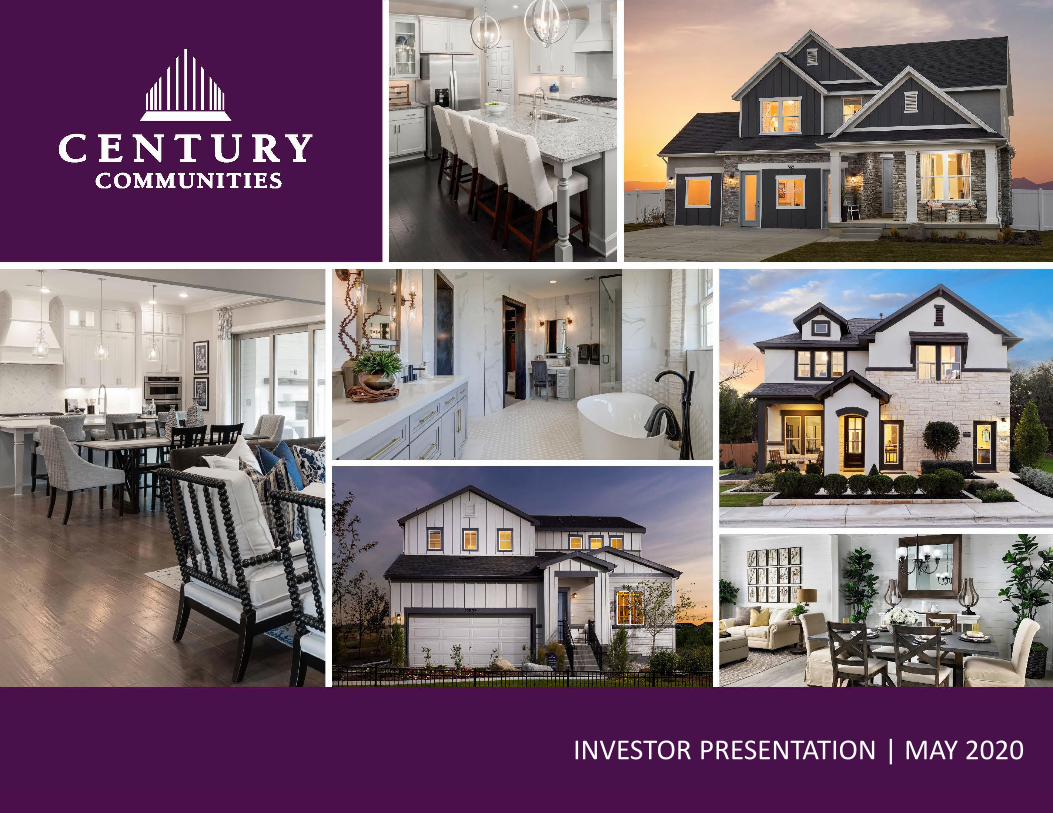
INVESTOR PRESENTATION | MAY 2020

2
FORWARD-LOOKING STATEMENTS
Certain statements in this Investor Presentation may be regarded as "forward-looking statements" within the meaning of the Private Securities Litigation Reform Act of 1995, as amended. Certain forward-
looking statements discuss the Company’s plans, strategies and intentions, and may be identified by reference to a future period or periods or by the use of forward-looking terminology, such as “expects,”
“may,” “will,” “believes,” “should,” “would,” “could,” “approximately,” “anticipates,” “estimates,” “targets,” “intends,” “likely,” “projects,” “positioned,” “strategy,” “future,” and “plans.” In addition, these words may use
the positive or negative or other variations of those terms. All statements other than statements of historical fact are “forward–looking statements” for purposes of federal and state securities laws. There is no
guarantee that any of the events anticipated by these forward-looking statements will occur. These statements involve known and unknown risks, uncertainties and other factors that may cause our actual
results, levels of activity, performance or achievements to differ from those expressed or implied by the forward-looking statement.
These forward-looking statements are based on various assumptions and the current expectations of the management of the Company, and may not be accurate because of risks and uncertainties surrounding
these assumptions and expectations. Certain factors may cause actual results to differ significantly from these forward-looking statements. If any of the events occur, there is no guarantee what effect they will
have on the operations or financial condition of the Company. Major risks, uncertainties and assumptions include, but are not limited to, risks relating to: the Company’s capital and financing needs and
availability; any unforeseen changes to or effects on liabilities, future capital expenditures, revenues, expenses, earnings, synergies, indebtedness, financial condition, losses and future prospects; the
Company’s ability to integrate and operate assets successfully after the closing of an acquisition; demand fluctuations in the housing industry; the effect of general economic conditions, including employment
rates, housing starts, interest rate levels, availability of financing for home mortgages, and the strength of the U.S. dollar; ability to adapt the Company’s business strategy to changing home buying patterns and
trends; ability to identify and acquire desirable land; the impact of the COVID-19 pandemic on the Company’s business operations; and other factors. However, it is not possible to predict or identify all such
factors.
In addition, the Company has disclosed under the heading “Risk Factors” in its Annual Report on Form 10-K for the fiscal year ended December 31, 2019 (the “Annual Report”), filed with the U.S. Securities and
Exchange Commission (the “SEC”) on February 7, 2020, the risk factors which materially affect its business, financial condition and operating results. Investors are encouraged to review the Annual Report for
additional information regarding the risks and uncertainties that may cause actual results to differ materially from those expressed in any forward-looking statement. Forward-looking statements included herein
are made as of the date hereof, and the Company undertakes no obligation to publicly update or revise any forward-looking statement to reflect future events, developments or otherwise, except as may be
required by applicable law.
Non-GAAP Financial Information
This Investor Presentation includes certain non-GAAP financial measures as defined by SEC rules. Such non-GAAP financial measures are presented as a supplemental financial measurements in the
evaluation of our business. We believe the presentation of these financial measures helps investors to assess our operating performance from period to period and enhances understanding of our financial
performance and highlights operational trends. Non-GAAP financial measures are widely used by investors in the valuation, comparison, rating and investment recommendations of companies. However, such
measurements may not be comparable to those of other companies in our industry, which limits their usefulness as a comparative measures. Such measures are not required by or calculated in accordance
with GAAP and should not be considered as a substitutes for net income or any other measure of financial performance reported in accordance with GAAP or as a measure of operating cash flow or liquidity.
Non-Solicitation
The information in this Investor Presentation is for informational purposes only and is neither an offer to sell, nor a solicitation of an offer to subscribe for or buy any securities in any jurisdiction in contravention
of applicable law. No offer of securities shall be made except by means of a prospectus meeting the requirements of Section 10 of the Securities Act of 1933, as amended, and otherwise in accordance with
applicable law.
3
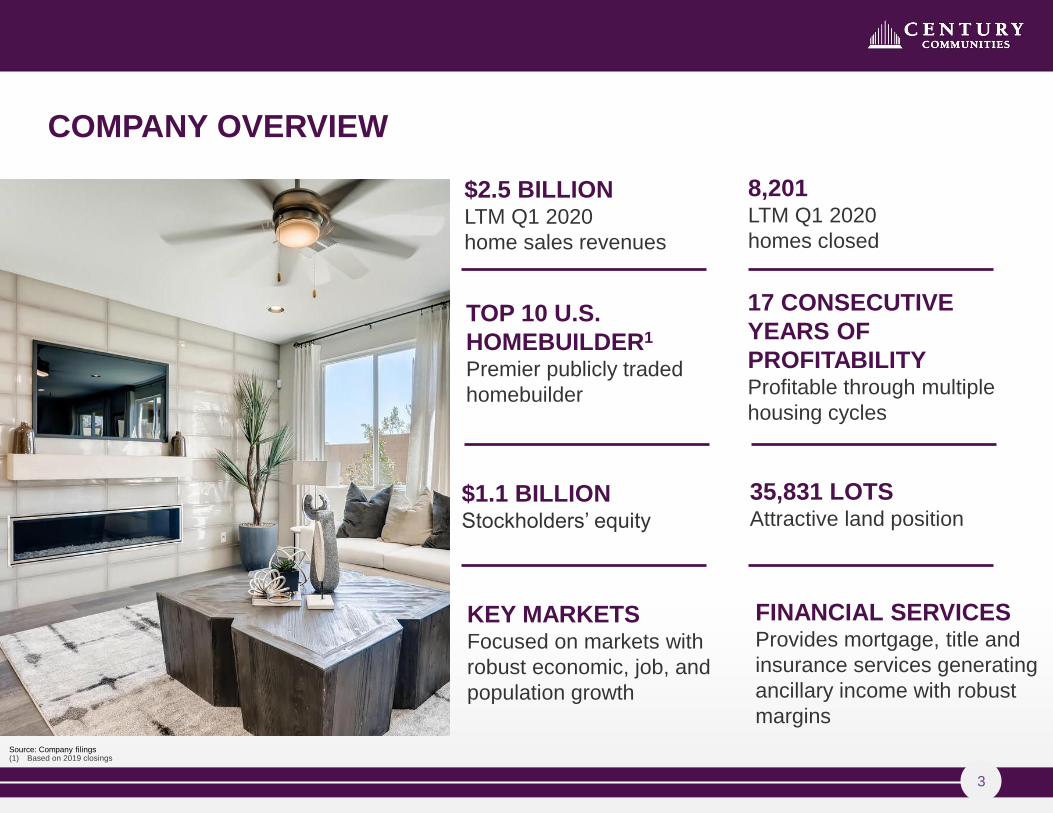
COMPANY OVERVIEW
8,201LTM Q1 2020
homes closed
$2.5 BILLIONLTM Q1 2020
home sales revenues
$1.1 BILLIONStockholders’ equity
TOP 10 U.S.
HOMEBUILDER1
Premier publicly traded
homebuilder
17 CONSECUTIVE
YEARS OF
PROFITABILITYProfitable through multiple
housing cycles
35,831 LOTSAttractive land position
Source: Company filings(1) Based on 2019 closings
KEY MARKETSFocused on markets with
robust economic, job, and
population growth
FINANCIAL SERVICESProvides mortgage, title and
insurance services generating
ancillary income with robust
margins

4
22%
28%
10%
22%
17% West ($549)
Mountain ($717)
Texas ($262)
Southeast ($567)
CenturyComplete ($436)
Source: Company filings(1) Market reportable segments are defined as follows: West (California and Washington), Mountain (Colorado, Nevada and Utah), Texas, Southeast (Georgia, North Carolina, South Carolina and Tennessee), and Century Complete (Alabama, Arizona, Florida,
Georgia, Indiana, Iowa, Michigan, North Carolina, Ohio, South Carolina and Texas)
LTM Q1 2020 HOME SALES
REVENUES ($MM)(1)
LTM Q1 2020 HOME SALE
DELIVERIES(1)
13%
21%
12%20%
35%
West (1,062)
Mountain (1,694)
Texas (981)
Southeast (1,625)
CenturyComplete (2,839)
$2.5B8,201
▪ Entry level buyers represent approximately 82% of Q1 2020 deliveries
Two complementary brands with high exposure to attractive entry-level segment

5
2Q PERFORMANCE UPDATE
▪ 2020 April Net Sales essentially the same, down
less than 1% from prior year
▪ Gross and Net Sales improved sequentially
through April
▪ Cancellations have improved from elevated
levels in March
▪ Now in-line with year-to-date average
▪ Repaid $100M on the line of credit in May
▪ Continue to see states loosen coronavirus-
related restrictions, reopen their economies and
begin to lift social-distancing and stay-at-home
orders

6
KEY INVESTMENT HIGHLIGHTS
▪ Seasoned & Cycle Tested Management Team
▪ Successful History of M&A and Integration
▪ Attractive Entry Level Buyer Focus
▪ Geographically Diverse Top-10 U.S. Builder
▪ Strong Performance Across Financial Metrics
▪ Consistent Track Record of Profitable Growth
▪ Returns Focused Business Model
▪ Strong Balance Sheet with Ample Liquidity
7
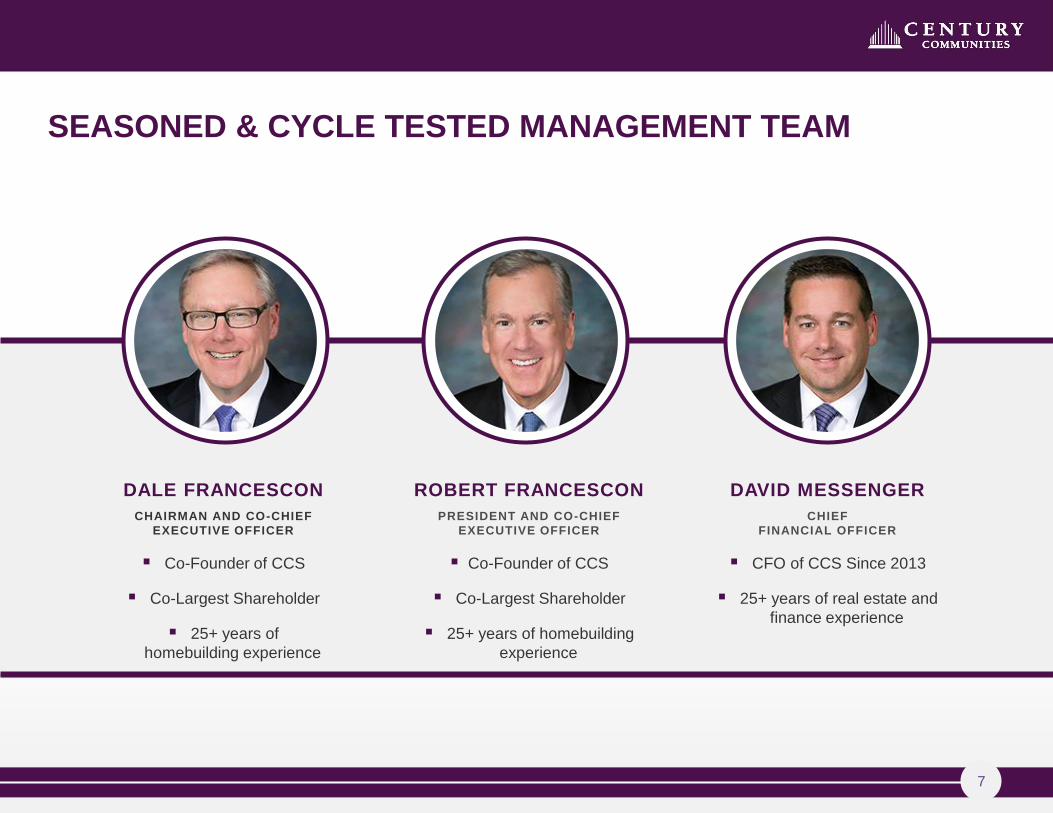
SEASONED & CYCLE TESTED MANAGEMENT TEAM
DALE FRANCESCON
CHAIRMAN AND CO-CHIEF
EXECUTIVE OFFICER
▪ Co-Founder of CCS
▪ Co-Largest Shareholder
▪ 25+ years of
homebuilding experience
ROBERT FRANCESCON
PRESIDENT AND CO-CHIEF
EXECUTIVE OFFICER
▪ Co-Founder of CCS
▪ Co-Largest Shareholder
▪ 25+ years of homebuilding
experience
DAVID MESSENGER
CHIEF
FINANCIAL OFFICER
▪ CFO of CCS Since 2013
▪ 25+ years of real estate and
finance experience
8
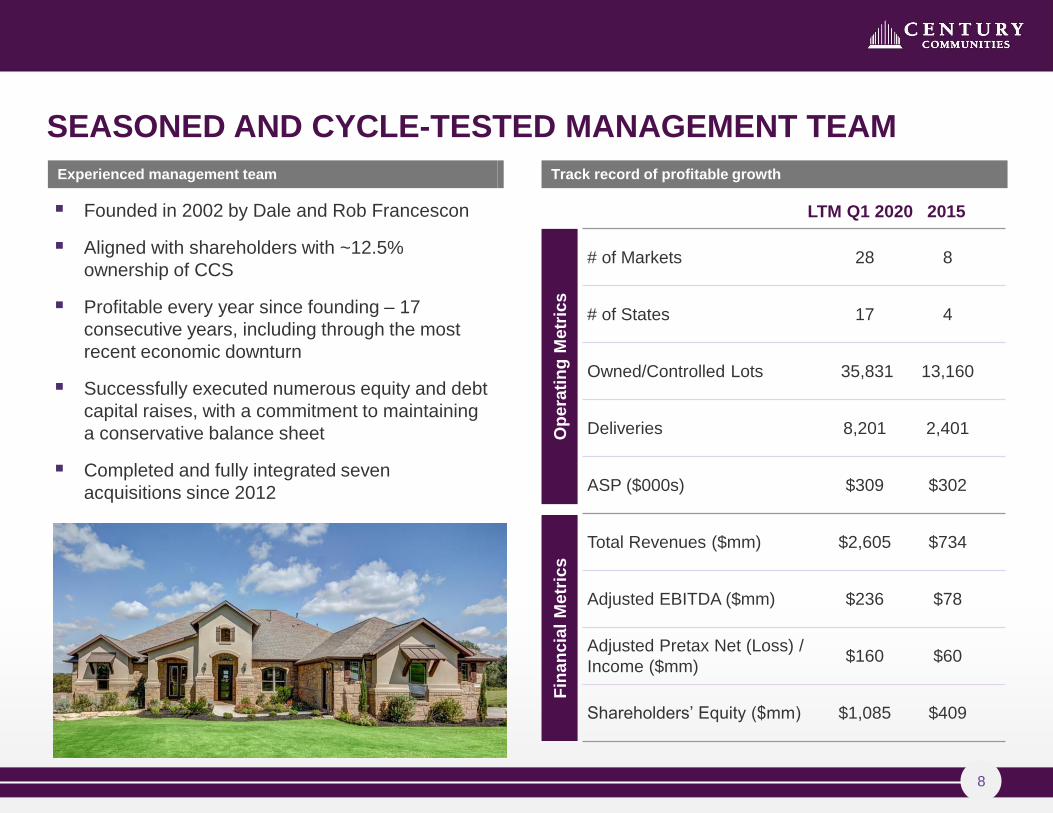
▪ Founded in 2002 by Dale and Rob Francescon
▪ Aligned with shareholders with ~12.5%
ownership of CCS
▪ Profitable every year since founding – 17
consecutive years, including through the most
recent economic downturn
▪ Successfully executed numerous equity and debt
capital raises, with a commitment to maintaining
a conservative balance sheet
▪ Completed and fully integrated seven
acquisitions since 2012
Fin
an
cia
l M
etr
ics
Op
era
tin
g M
etr
ics
2015LTM Q1 2020
Experienced management team
SEASONED AND CYCLE-TESTED MANAGEMENT TEAM
Track record of profitable growth
# of Markets 28 8
# of States 17 4
Owned/Controlled Lots 35,831 13,160
Deliveries 8,201 2,401
ASP ($000s) $309 $302
Total Revenues ($mm) $2,605 $734
Adjusted EBITDA ($mm) $236 $78
Adjusted Pretax Net (Loss) /
Income ($mm)$160 $60
Shareholders’ Equity ($mm) $1,085 $409
9
SUCCESSFUL HISTORY OF M&A AND INTEGRATION
201420152014
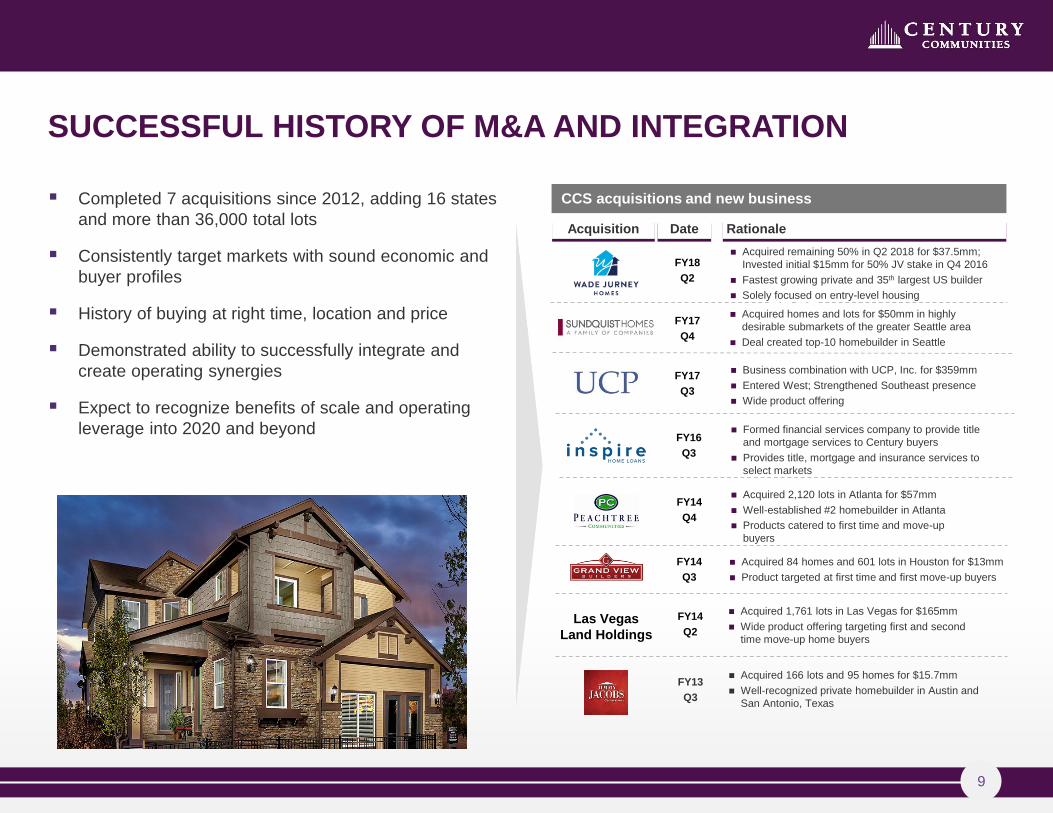
▪ Completed 7 acquisitions since 2012, adding 16 states
and more than 36,000 total lots
▪ Consistently target markets with sound economic and
buyer profiles
▪ History of buying at right time, location and price
▪ Demonstrated ability to successfully integrate and
create operating synergies
▪ Expect to recognize benefits of scale and operating
leverage into 2020 and beyond
CCS acquisitions and new business
2016201 6
Acquisition Date
FY14
Q4
FY18
Q2
FY17
Q3
FY17
Q4
FY14
Q3
FY14
Q2
FY13
Q3
2013
2017
2013
2017Rationale
Acquired 2,120 lots in Atlanta for $57mm
Well-established #2 homebuilder in Atlanta
Products catered to first time and move-up
buyers
Acquired homes and lots for $50mm in highly
desirable submarkets of the greater Seattle area
Deal created top-10 homebuilder in Seattle
Business combination with UCP, Inc. for $359mm
Entered West; Strengthened Southeast presence
Wide product offering
Acquired remaining 50% in Q2 2018 for $37.5mm;
Invested initial $15mm for 50% JV stake in Q4 2016
Fastest growing private and 35th largest US builder
Solely focused on entry-level housing
Acquired 84 homes and 601 lots in Houston for $13mm
Product targeted at first time and first move-up buyers
Acquired 1,761 lots in Las Vegas for $165mm
Wide product offering targeting first and second
time move-up home buyers
Acquired 166 lots and 95 homes for $15.7mm
Well-recognized private homebuilder in Austin and
San Antonio, Texas
Formed financial services company to provide title
and mortgage services to Century buyers
Provides title, mortgage and insurance services to
select markets
FY16
Q3
Las Vegas
Land Holdings
10
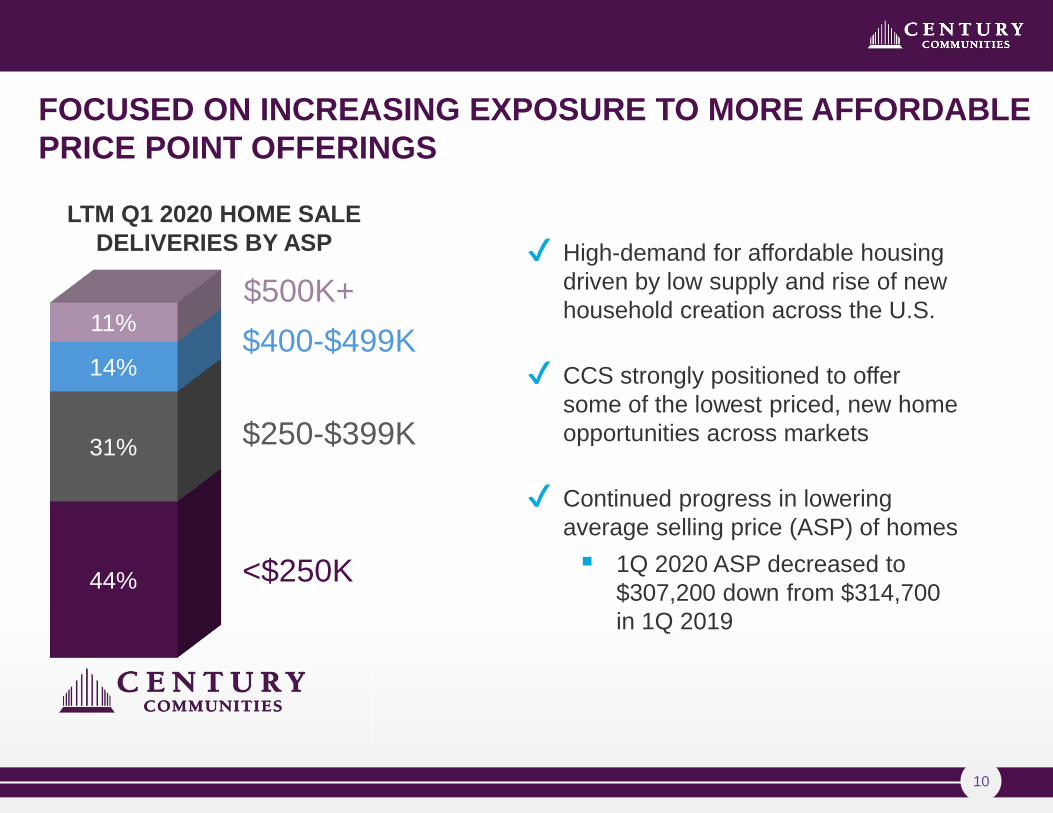
FOCUSED ON INCREASING EXPOSURE TO MORE AFFORDABLE
PRICE POINT OFFERINGS
44%
31%
14%
11%
$500K+
$400-$499K
$250-$399K
<$250K
LTM Q1 2020 HOME SALE
DELIVERIES BY ASP ✔ High-demand for affordable housing
driven by low supply and rise of new
household creation across the U.S.
✔ CCS strongly positioned to offer
some of the lowest priced, new home
opportunities across markets
✔ Continued progress in lowering
average selling price (ASP) of homes
▪ 1Q 2020 ASP decreased to
$307,200 down from $314,700
in 1Q 2019

11
(1) 1Q 2020 Home Sales Revenues and Backlog ASP
TWO COMPLEMENTARY BRANDS WITH HIGH EXPOSURE TO
ATTRACTIVE ENTRY-LEVEL SEGMENT
▪ Broadly targeted customers:
▪ First time homebuyers
▪ First and second move-up buyers
▪ Lifestyle buyers
▪ Customizable and diversified product
offering
▪ Traditional model home sales structure
▪ Targets entry-level customers – 100%
within FHA limits1
▪ Affordable, functional and reliable homes
▪ Acquires finished lots, primarily just in
time inventory
▪ Sells homes primarily through retail
outlets and the internet as opposed to
model homes
▪ Highly scalable business model, which
requires less capital investment and
yields quicker asset turns
BROAD-BASED PORTFOLIO AFFORDABLE HOME BUYER
12
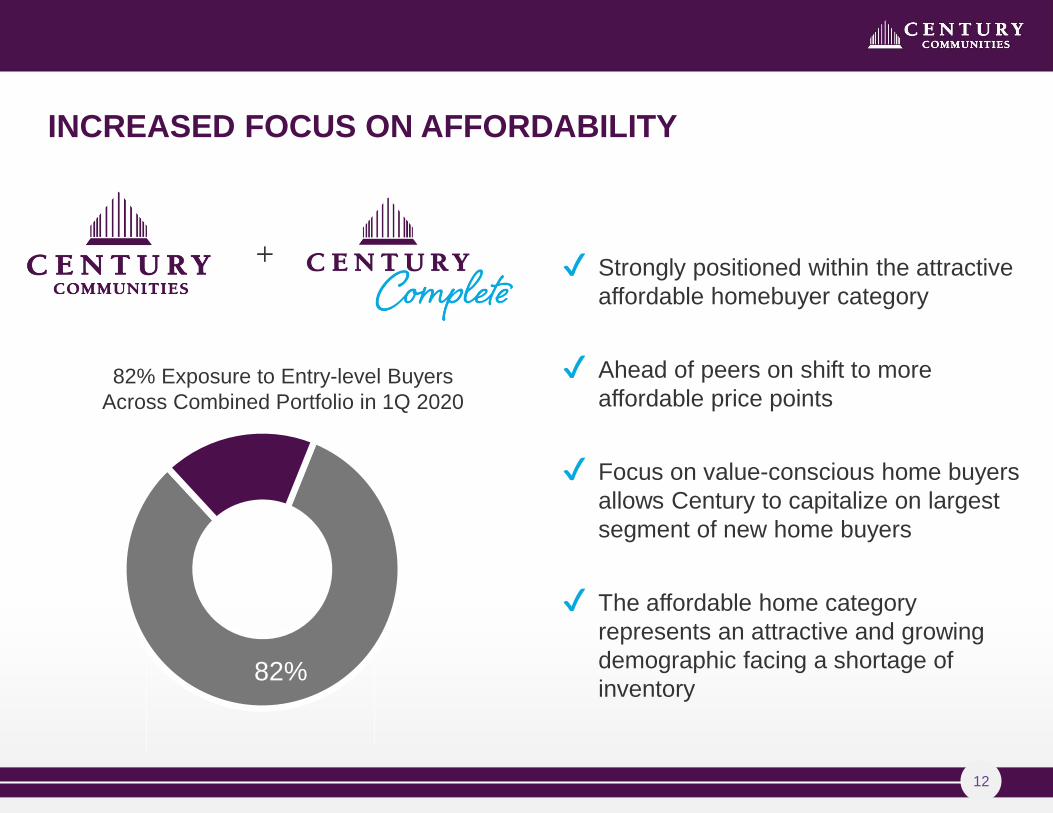
INCREASED FOCUS ON AFFORDABILITY
82%
+
82% Exposure to Entry-level Buyers
Across Combined Portfolio in 1Q 2020
✔ Strongly positioned within the attractive
affordable homebuyer category
✔ Ahead of peers on shift to more
affordable price points
✔ Focus on value-conscious home buyers
allows Century to capitalize on largest
segment of new home buyers
✔ The affordable home category
represents an attractive and growing
demographic facing a shortage of
inventory

13
INCREASED INVESTMENT IN ONLINE HOMEBUYING
RESOURCES ACROSS ENTIRE PORTFOLIO
Century’s comprehensive virtual resources enable
homebuyers to:
✔ Explore floor plans and quick move-in homes
✔ Set up virtual appointments with Onsite Agents through call/chat
✔ Schedule video walkthroughs of homes and communities
✔ Sign contracts electronically
✔ Transfer earnest money deposits electronically
✔ Utilize effective, one-stop financing and closing solutions through
Century’s mortgage, title and insurance companies
14
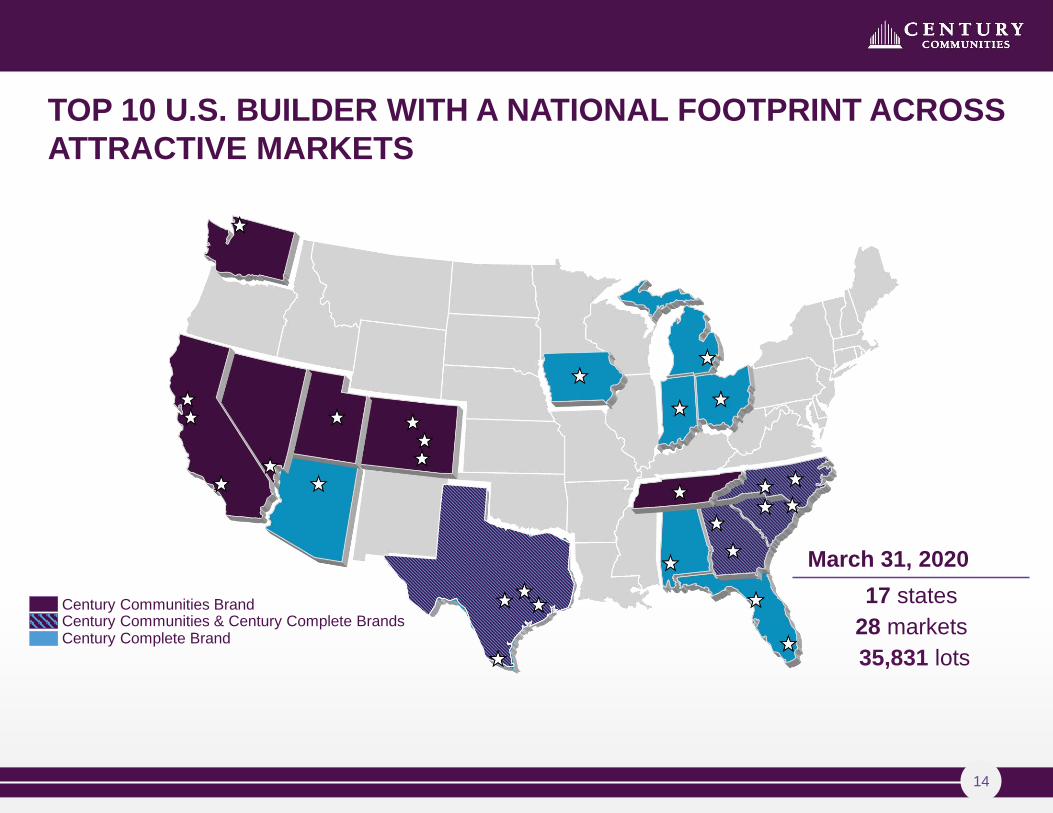
TOP 10 U.S. BUILDER WITH A NATIONAL FOOTPRINT ACROSS
ATTRACTIVE MARKETS
March 31, 2020
17 states
28 markets
35,831 lots
Century Communities BrandCentury Communities & Century Complete BrandsCentury Complete Brand
15
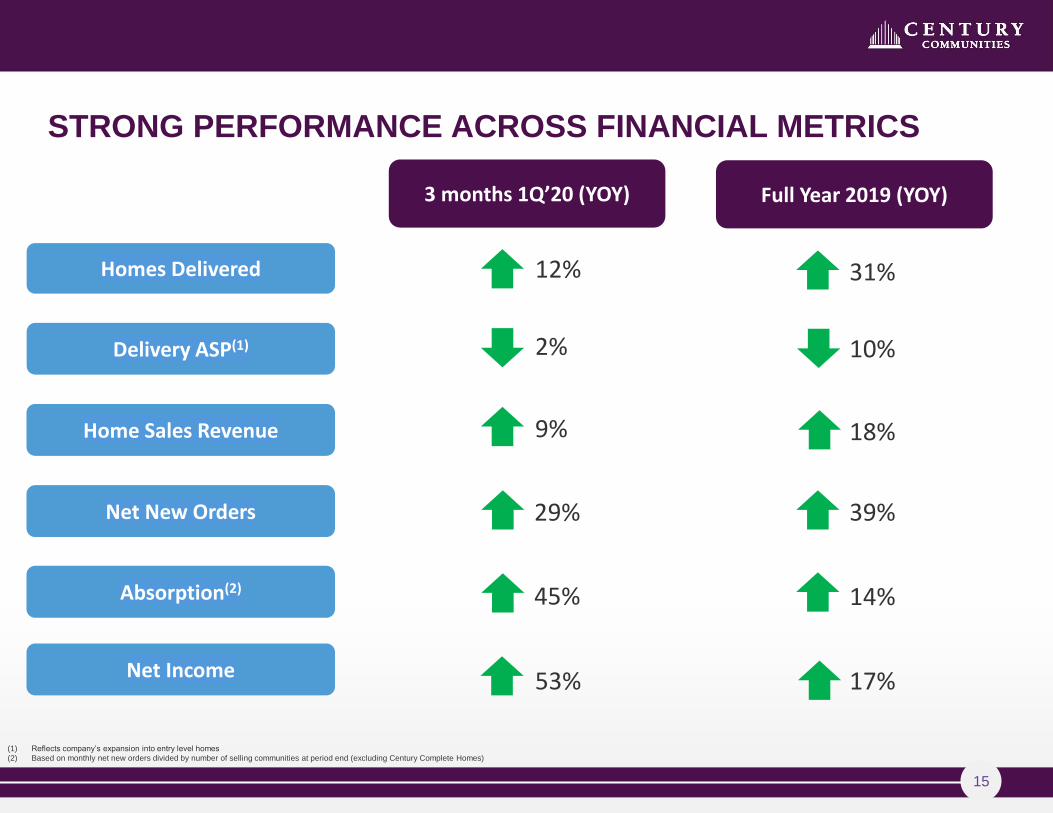
STRONG PERFORMANCE ACROSS FINANCIAL METRICS
Home Sales Revenue
Homes Delivered
Net New Orders
Delivery ASP(1)
Absorption(2)
(1) Reflects company’s expansion into entry level homes
(2) Based on monthly net new orders divided by number of selling communities at period end (excluding Century Complete Homes)
Net Income 53% 17%
45% 14%
29% 39%
9% 18%
2% 10%
12% 31%
3 months 1Q’20 (YOY) Full Year 2019 (YOY)
16
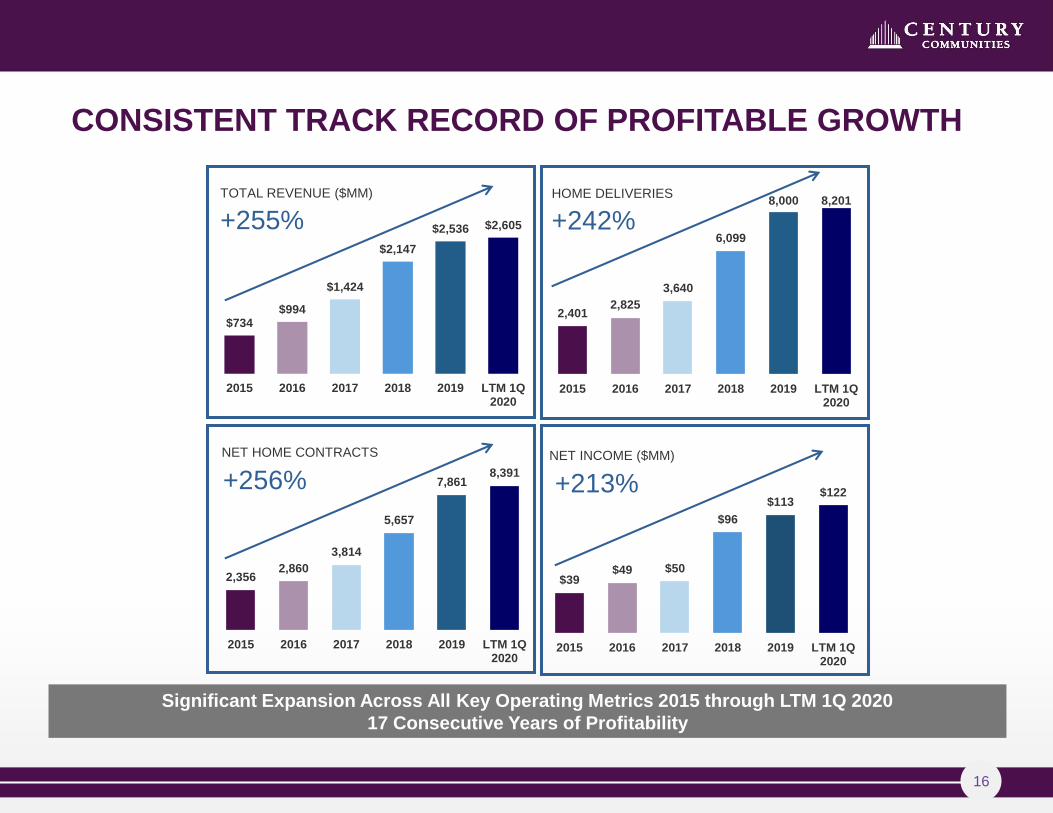
CONSISTENT TRACK RECORD OF PROFITABLE GROWTH
$734$994
$1,424
$2,147
$2,536 $2,605
2015 2016 2017 2018 2019 LTM 1Q2020
2,401 2,825
3,640
6,099
8,000 8,201
2015 2016 2017 2018 2019 LTM 1Q2020
2,356 2,860
3,814
5,657
7,861 8,391
2015 2016 2017 2018 2019 LTM 1Q2020
TOTAL REVENUE ($MM)
+255%
HOME DELIVERIES
+242%
NET HOME CONTRACTS
+256%
Significant Expansion Across All Key Operating Metrics 2015 through LTM 1Q 2020
17 Consecutive Years of Profitability
$39$49 $50
$96
$113$122
2015 2016 2017 2018 2019 LTM 1Q2020
NET INCOME ($MM)
+213%
17
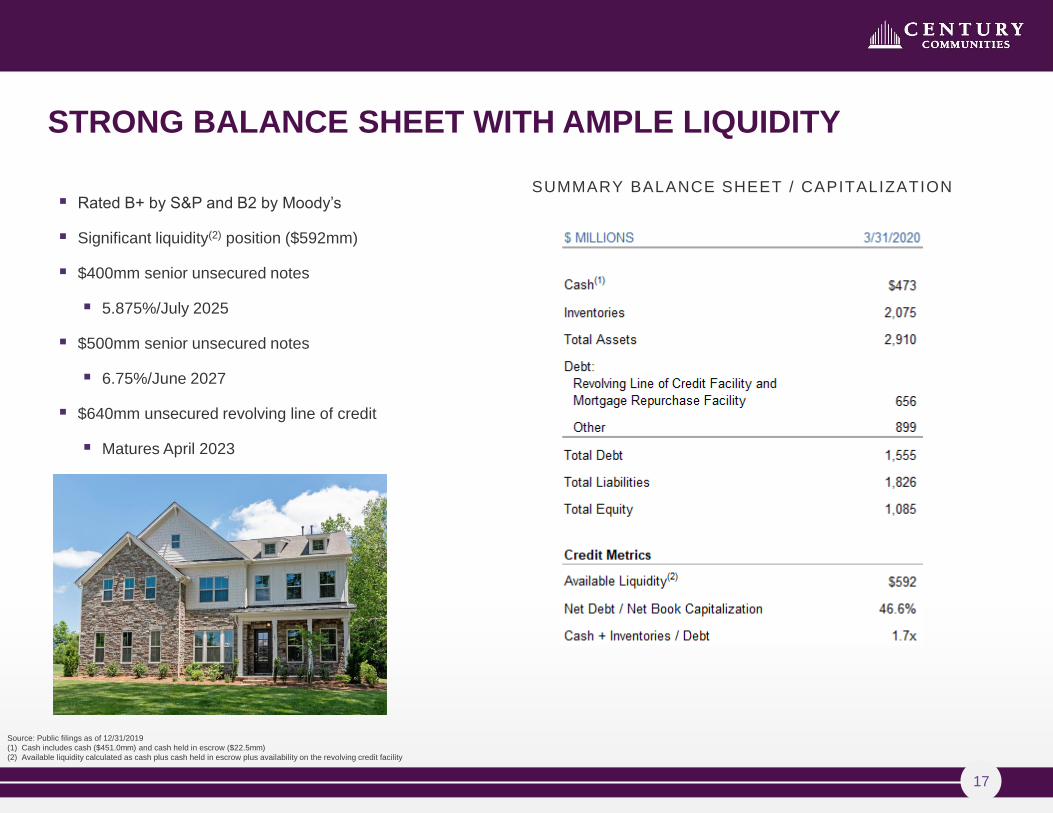
STRONG BALANCE SHEET WITH AMPLE LIQUIDITY
▪ Rated B+ by S&P and B2 by Moody’s
▪ Significant liquidity(2) position ($592mm)
▪ $400mm senior unsecured notes
▪ 5.875%/July 2025
▪ $500mm senior unsecured notes
▪ 6.75%/June 2027
▪ $640mm unsecured revolving line of credit
▪ Matures April 2023
Source: Public filings as of 12/31/2019
(1) Cash includes cash ($451.0mm) and cash held in escrow ($22.5mm)
(2) Available liquidity calculated as cash plus cash held in escrow plus availability on the revolving credit facility
SUMMARY BALANCE SHEET / CAPITALIZATION
18
KEY INVESTMENT HIGHLIGHTS
▪ Seasoned & Cycle Tested Management Team
▪ Successful History of M&A and Integration
▪ Attractive Entry Level Buyer Focus
▪ Geographically Diverse Top-10 U.S. Builder
▪ Strong Performance Across Financial Metrics
▪ Consistent Track Record of Profitable Growth
▪ Returns Focused Business Model
▪ Strong Balance Sheet with Ample Liquidity
19
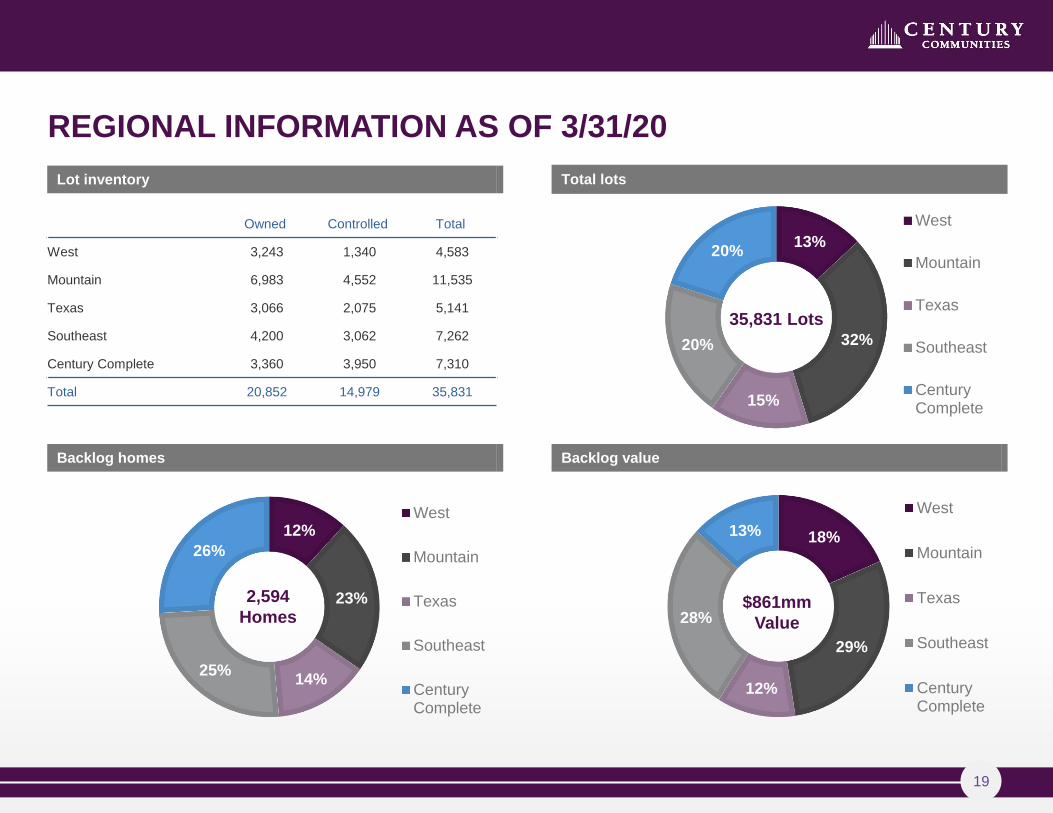
13%
32%
15%
20%
20%
West
Mountain
Texas
Southeast
CenturyComplete
12%
23%
14%25%
26%
West
Mountain
Texas
Southeast
CenturyComplete
18%
29%
12%
28%
13%
West
Mountain
Texas
Southeast
CenturyComplete
REGIONAL INFORMATION AS OF 3/31/20
2,594
Homes
35,831 Lots
$861mm
Value
Total lotsLot inventory
Backlog valueBacklog homes
Owned Controlled Total
West 3,243 1,340 4,583
Mountain 6,983 4,552 11,535
Texas 3,066 2,075 5,141
Southeast 4,200 3,062 7,262
Century Complete 3,360 3,950 7,310
Total 20,852 14,979 35,831

20
HISTORICAL FINANCIALS


![INDEX [] LG-1550 LIEBHERR LTM 1500 LIEBHERR LTM-1400 LIEBHERR LTM-1225 LIEBHERR LTM-1220 LIEBHERR ... Cranes_over100tons.pdf](https://img.pdfslide.us/doc/110x75/5b07232e7f8b9ae9628e08fa/index-lg-1550-liebherr-ltm-1500-liebherr-ltm-1400-liebherr-ltm-1225-liebherr.jpg)