Embed Size (px)
Citation preview

1
Four-Year Review Progress Report November 13, 2019
DEPARTMENT OF PLANNING, BUILDING AND CODE ENFORCEMENT
200 E. SANTA CLARA STREET ▪ SAN JOSE, CA 95113 ___________________________________________________________________
2
TABLE OF CONTENTS
Page
EXECUTIVE SUMMARY ................................................................................................................5
I. BACKGROUND OF ENVISION SAN JOSÉ 2040 GENERAL PLAN ...................................................7
What Is A General Plan? .....................................................................................................7
General Plan Update Task Force .......................................................................................7
Envision San José 2040 ......................................................................................................7
II. BACKGROUND OF THE ENVISION 2040 FOUR-YEAR REVIEW ....................................................9
Purpose of the Four-Year Review Process ........................................................................9
Role of the Envision 2040 Four-Year Review Task Force............................................... 10
2015 Four-Year Review ................................................................................................... 10
2019 Four-Year Review Scope of Work .......................................................................... 12
Four-Year Review Timeline ............................................................................................. 14
III. CHANGES AND TRENDS IN LAND USE AND DEVELOPMENT ...................................................15
Population Trends ............................................................................................................. 15
Economic Overview and Trends ........................................................................................ 15
Development Trends ......................................................................................................... 18
Envision San José 2040 Focused Growth Strategy ............................................................. 26
IV. EVALUATION OF CITY’S ACHIEVEMENT OF KEY GOALS .........................................................31
Economic Development Goals........................................................................................... 31
Fiscal and Infrastructure/Service Goals .............................................................................. 37
Environmental Goals ......................................................................................................... 38
Availability and Affordability of Housing Supply .............................................................. 44
Healthful Community Goals .............................................................................................. 51
V. URBAN VILLAGES...................................................................................................................56
Status of Urban Village Plan Preparation ........................................................................... 56
Urban Village Plan Horizon Shifts ..................................................................................... 56
Development Activity in Urban Villages ........................................................................... 57
VI. NEXT STEPS ..........................................................................................................................60
3
LIST OF ABBREVIATIONS ABAG Association of Bay Area Governments CCSCE Center for Continuing Study of the California Economy CEQA California Environmental Quality Act FY Fiscal Year J/ER Jobs to Employed Resident Ratio OED Office of Economic Development RHNA Regional Housing Needs Allocation UWMP Urban Water Management Plan
LIST OF FIGURES
Figure Page Figure 3.1 Population Projection and Actual Population Growth ..........................................15
Figure 3.2 Job Growth September 2018 to 2019 ...................................................................16
Figure 3.3 Cost of One Square Foot of Office Space in South Bay Area .................................17
Figure 3.4 Percentage of Jobs that are High-, Mid-, and Low-Skill in San Jose and Incomes ..18
Figure 3.5 Average Effective Rents in San Jose and Incomes .................................................19
Figure 3.6 Building Permits Issued for New Residential Units FY11/12 – FY18/19 .................20
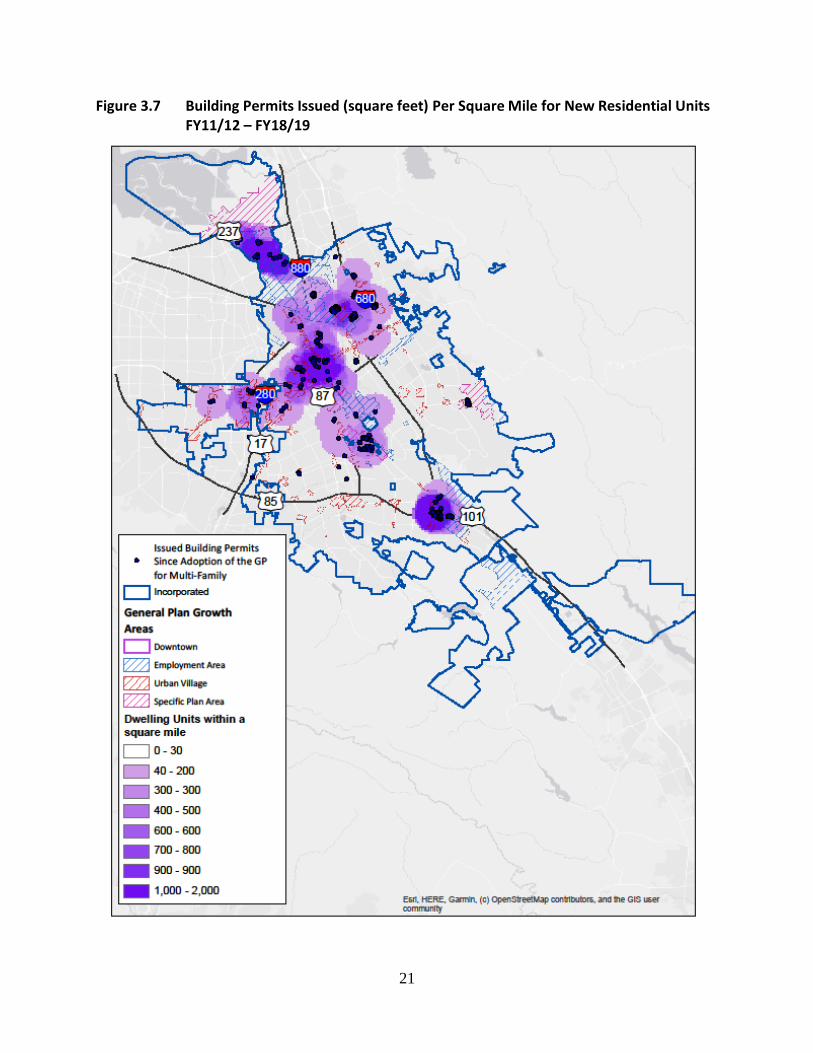
Figure 3.7 Building Permits Issued (square feet) Per Square Mile for New Residential Units FY11/12 – FY18/19 ...............................................................................................21
Figure 3.8 Building Permits Issued and Finaled for New Commercial and Industrial/Office FY11/12 – FY18/19 ...............................................................................................23
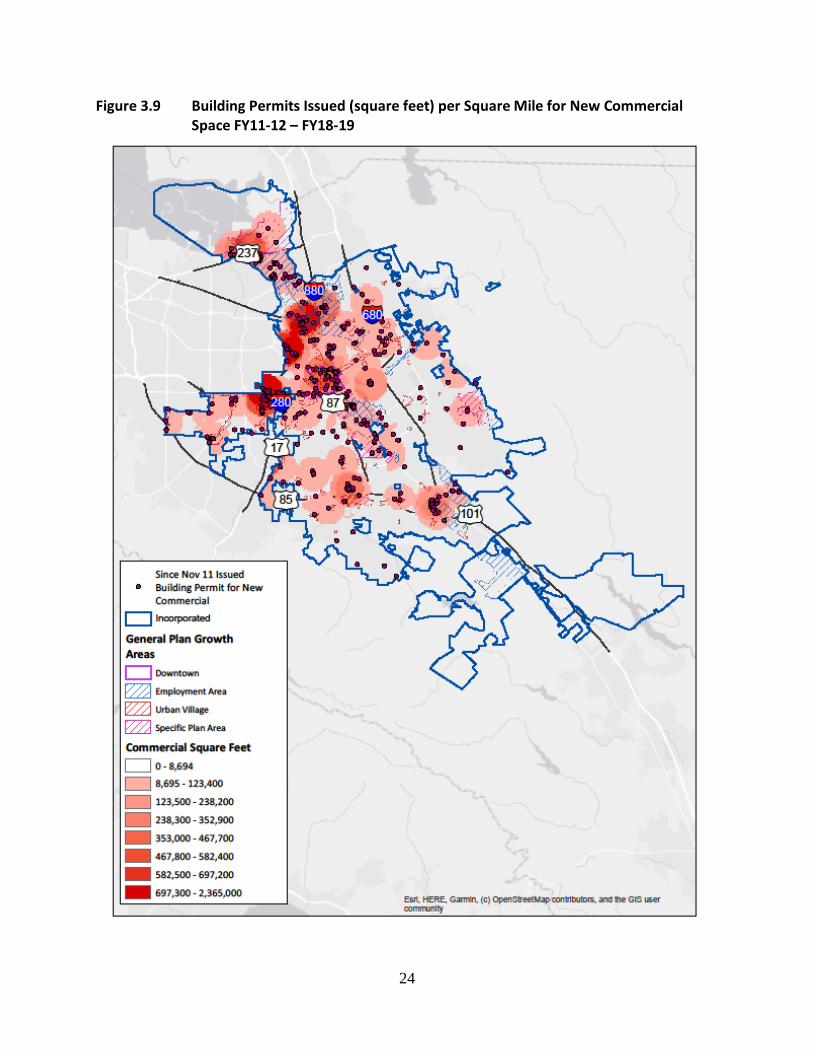
Figure 3.9 Building Permits Issued (square feet) per Square Mile for New Commercial Space FY11-12 – FY18-19 ...............................................................................................24
Figure 3.10 Building Permits Issued (square feet) per Square Mile for New Industrial/Office Space FY11/12 – FY18/19 .....................................................................................25
Figure 3.11 Downtown Development Activity, FY11/12 – FY18/19 .........................................28
Figure 3.12 Coyote Valley Planning Areas ...............................................................................30
LIST OF TABLES
Table Page Table 3.1 Metro Area Job Growth .......................................................................................16
Table 3.2 Top 10 Occupations in the City of San Jose...........................................................17
Table 3.3 Housing Production Since Adoption of Envision San Jose 2040 General Plan ........20
Table 3.4 New Commercial and Industrial/Office Production in Square Feet Since Adoption of 2040 General Plan ...........................................................................................23
Table 4.1 Jobs per Employed Resident for Select Local Cities, 2010-2018 ............................35
Table 4.2 Greenhouse Gas Inventory Comparisons 2014-2017 ............................................42
Table 4.3 Regional Housing Need Allocation (RHNA) (2014-2022) .......................................45
4
Table 4.4 Distribution of Housing Units Planned During the RHNA Period (2014-2022) .......46
Table 4.5 Project Size Applicability to Inclusionary Housing Ordinance and Affordable Housing Impact Fee .............................................................................................48
Table 4.6 Building Permits Issued for Accessory Dwelling Units ...........................................50
Table 4.8 City of San José Commute Modes, Workers 16+ Years (2011-2017) .....................52
Table 5.1 Urban Village Plan Schedule .................................................................................56
Table 5.2 Urban Villages in Horizon 1 ..................................................................................57
Table 5.3 Entitlements in Urban Villages with Adopted Plan ...............................................58
5
EXECUTIVE SUMMARY
The Envision San José 2040 General Plan instituted a Four-Year Review process providing an opportunity to evaluate the City’s achievement of key goals and make mid-course adjustments to the General Plan. The Four-Year Review process entails reconvening the Envision San José 2040 Task Force, who will review and evaluate changes in the planning context and the City’s achievement of planned job growth, implementation of the Urban Village concept, environmental goals, and affordable housing needs. This Four-Year Review Progress Report provides background on the Envision San José 2040 General Plan, land use and development data since the Plan’s adoption, and evaluation of the City’s achievement of key goals.
As the largest city in the Bay Area and the tenth largest city in the country, San José is in a prime position for attracting and creating economic growth and sustainable development. Since the adoption of the Envision San José 2040 General Plan in November 2011, San José has experienced tremendous growth in development, with a vast majority being constructed in the City’s designated Growth Areas. While the increase in smart growth development has helped contribute to San José’s economic growth, the City’s jobs to employed resident (J/ER) ratio has remained stagnant and below the near-term goal of 1.0 J/ER in 2025. The City’s current J/ER of 0.82 indicates that San José continues to be a bedroom-community, where more San José residents leave San José for work in other cities than workers from other communities commute into San José. Since the 2015 General Plan Four-Year Review, the cost of housing statewide and regionally has continued to rise, creating a statewide housing crisis. In response the City Council adopted a Housing Crisis Workplan that established a citywide goal of 25,000 new homes, at least 10,000 of those affordable, be constructed or approved by 2022. The workplan also identified a large number of policy items to address the housing crisis in San Jose. While the cost of housing is still unaffordable for many San Jose residents, the high costs of construction and lower rents relative to the rest of Silicon Valley have resulted in a challenge for residential development in San Jose, with feasibility varying based on location and construction type. That being said, overall, San Jose is on track to meet its Regional Housing Needs Allocation for Market Rate housing during the current RHNA cycle (2014 – 2023), but is behind track on the production of affordable units. The Envision San José 2040 General Plan also sets forth goals and policies relating to infrastructure/City service levels, environmental sustainability, and healthful community living. With minimal projected shortfall and surplus figures, the City’s operating budget is currently in stable position. There is, however, limited capacity to expand much needed services and address the significant backlog of deferred infrastructure and maintenance needs. In 2018, City Council adopted Climate Smart San José, which uses the General Plan as a foundation and goes further by creating a pathway for San José to reach the State’s target of 80% reduction below 1990 levels of greenhouse gas emissions by 2050 as well as further achievement
6
of the Paris Climate Agreement goals. Since the 2015 General Plan Four-Year Review, the City has decreased its overall greenhouse gas emissions by approximately 17%. The City has continued to work toward the ambitious General Plan of reducing the amount of drive alone commute trips to only 40 percent of all trips by 2040. One significant action taken since the previous Four-Year Review was City Council’s adoption of the Transportation Analysis Policy in February 2018 to change the City’s California Environmental Quality Act (CEQA) metric for analyzing traffic impacts from Level of Service (LOS) to Vehicle Miles Traveled (VMT). The new Transportation Analysis Policy will promote development in Planned Growth Areas by streamlining the CEQA review of new higher-density, mixed-use projects that improve air quality by reducing the number of miles driven by automobiles. As of 2017, approximately 76% of San Jose residents commute trips are driven alone.
The Envision San José 2040 General Plan promotes the development of “Urban Villages” to provide active, walkable, bicycle-friendly, transit-oriented, mixed-use urban settings for new housing and job growth. The City Council has approved 12 Urban Village plans since adoption of Envision San José 2040 General Plan, with five additional Horizon 1 Urban Village plans in various stages of development. Since adoption of the General Plan, Planning development permits have been approved for approximately 9,500 housing units and 3.5 million square feet of non-residential uses (e.g., commercial and office) within Urban Villages. While the City has advanced many of the General Plan’s goals, some performance measures remain relatively inconclusive or unchanged at this time. This is to be expected as many of the goals set forth in the General Plan are long term. Some of the primary General Plan implementation challenges include raising the City’s jobs to employed residents ratio, increasing the percentage of affordable housing, furthering mixed-use development in Urban Villages, and increasing non-automobile commute trips.
7
I. BACKGROUND OF ENVISION SAN JOSÉ 2040 GENERAL PLAN
What Is A General Plan? California state law (Government Code Section 65300) requires each city and county to adopt a comprehensive, long-term general plan for the physical development of the city or county, and of any land outside its boundaries which bears relation to its planning. General Plans, often referred to as the “constitution” for future development, are intended to embody the community’s long-term goals and vision in regards to public and private land use. The City of San José’s current General Plan is titled Envision San José 2040.
General Plan Update Task Force The Envision 2040 General Plan Task Force was assembled in 2007 to provide input on the update of the City’s General Plan. The Task Force was comprised of 36 members representing key stakeholder groups, and met on a monthly basis to discuss the future vision of the City and the direction of the Envision San José 2040 General Plan. With finalization of their recommendation to City Council, the Task Force process was completed in the fall of 2011.
Envision San José 2040 The City’s General Plan is a comprehensive, long-range plan representing the official policy statement regarding the future character, land use patterns, and quality of development in San José. The document incorporates all General Plan elements required by State law, and includes wide-ranging goals and policies, as well as a Land Use/Transportation Diagram. On November 1, 2011, the City Council adopted the Envision San José 2040 General Plan, which built on longstanding policies of growth management and added a stronger framework to create great places throughout San José and enhance job growth.
Envision San José 2040 Vision The Envision San José 2040 General Plan Vision sets forth seven guiding community values to articulate an over-arching vision statement: “San José embodies the energy and vitality of its unique human, natural and economic resources.” The seven community values are:
1) Innovative Economy 2) Environmental Leadership 3) Diversity and Social Equity 4) Interconnected City 5) Healthy Neighborhoods
8
6) Quality Education and Services 7) Vibrant Arts and Culture
Envision San José 2040 Major Strategies Twelve Major Strategies are embodied within the Envision San José 2040 General Plan. Collectively, these strategies build on the Vision to directly inform the Land Use/Transportation Diagram and the Goals, Policies and Implementation Actions formulated to guide the physical development of San José and the evolving delivery of City services over the life of the General Plan. The twelve Major Strategies are:
1) Community Based Planning 2) Form Based Plan 3) Focused Growth 4) Innovation/Regional Employment Center 5) Urban Villages 6) Streetscapes for People 7) Measurable Sustainability/Environmental Stewardship 8) Fiscally Strong City 9) Destination Downtown 10) Life Amidst Abundant Natural Resources 11) Design for a Healthful Community 12) Phasing and Periodic Review
Full descriptions of the seven Visions and twelve Major Strategies are located in the first section (Envision San José 2040) of the General Plan: http://www.sanjoseca.gov/DocumentCenter/Home/View/474
9
II. BACKGROUND OF THE ENVISION 2040 FOUR-YEAR REVIEW
Purpose of the Four-Year Review Process The Implementation Chapter (Chapter 7) of the Envision San José 2040 General Plan sets forth Goals and Policies requiring the City to conduct a review of the Plan every four years. The purpose of the Four-Year Review is to evaluate significant changes in the planning context and achievement of key General Plan goals, and consider mid-course adjustments toward implementation of Envision San José 2040. The General Plan Goals and Policies discussing the Four-Year Review process are listed below.
Goal IP-2 Monitor progress toward General Plan Vision, goals and policies through a periodic Major Review. Evaluate the success of the Envision General Plan’s implementation and consider refinement of the Land Use / Transportation Diagram and the Envision General Plan policies to ensure their achievement. Use General Plan Major Reviews to consider increases in available residential development capacity by opening an additional Horizon for development and to assign priority to growth areas within San José for new housing.
Policy IP-2.4 Conduct a Major Review of the Envision General Plan by the City Council every four years to evaluate the City’s achievement of key economic development, fiscal and infrastructure/service goals, greenhouse gas emission reduction goals and targets, water conservation and recycling goals, availability and affordability of housing supply, Healthful Community goals, and to review changes and trends in land use and development. Based on this review, determine the City’s readiness to begin the next Envision General Plan Horizon or to modify the number of “pool” residential units available for non-specific Urban Village areas within the current Plan Horizon. Amend the Land Use / Transportation Diagram and/or Envision General Plan goals, policies, and actions accordingly.
Policy IP-2.5 During each Major Review of the Envision General Plan evaluate input provided by the reconvened Task Force and achievement of the following key General Plan goals to inform the City Council’s decision, regarding needed changes, to begin the next General Plan Horizon, or to increase the number of residential units available for non-specific Urban Village areas:
1. Jobs/Housing Balance – Demonstrate improvement of the City’s jobs to employed resident ratio (J/ER) consistent with achievement of 1.1 jobs per employed resident by the year 2040. 2. Fiscal Sustainability – Demonstrate sustainable improvement above 2010 levels in the level of service for City services provided to the San José community.
10
3. Housing Supply – Verify that the current Planning Horizon contains adequate capacity to meet San José’s Regional Housing Needs Allocation for the upcoming 4-year term. 4. Infrastructure – Confirm that adequate infrastructure and service facilities, especially transit, exist or that a secure plan for them is in place to support the planned jobs and housing capacity in the current and contemplated Horizon.
Policy IP-2.12 Reconvene the Envision San José 2040 Task Force during each Major Review of the Envision General Plan to provide community and stakeholder engagement in reviewing and evaluating success in the implementation of this General Plan and recommending any mid-course actions needed to achieve its goals. Policy MS-17.8 Review and provide input to Urban Water Management Plans prepared by water suppliers to ensure that they maximize water conservation and reuse in order to fulfill San José’s water supply needs. Consider projected water supplies in updated Urban Water Management Plans as part of each Major Review of the Envision General Plan.
Role of the Envision 2040 Four-Year Review Task Force The Envision 2040 Task Force differs from the original 2007 to 2011 Envision 2040 Task Force as the group is not responsible for updating and creating a new General Plan, but rather reviewing the current General Plan’s progress. As stated in Envision 2040, the Task Force is responsible for evaluating success in the implementation of the General Plan and recommending any mid-course actions needed to achieve its goals; specifically:
• Planned job and J/ER goals;
• Implementation of the Urban Village concept;
• Environmental goals, including greenhouse gas reduction and the Green Vision goals; and
• Affordable housing needs (Envision 2040, Major Strategy 12, Chapter 1, pg. 26). The Envision 2040 Four-Year Review Task Force will conclude with recommendations to the City Council on mid-course adjustments to the Envision 2040 General Plan. The City Council will evaluate input from the Task Force, and consider for approval recommended General Plan amendments.
2015 Four-Year Review The first Four-Year Review of the General Plan was initiated in 2015 and concluded in 2016. In
11
May 2015, the City Council provided direction for staff to conduct the Four-Year Review process and approved the scope of work. The Task Force was reconvened by the Mayor’s Office and included both new appointees and appointees who participated on the Task Force that guided the development of the Envision San Jose General Plan between 2007 and 2011. (http://www.sanjoseca.gov/DocumentCenter/View/47374). Former Councilmembers Shirley Lewis and David Pandori served as co-chairs for the 43-member Task Force. Six Task Force meetings were held between November 2015 and April 2016. All meetings were open to the public, and a total of approximately 160 members of the public attended the six meetings. At the final Task Force meeting in April 2016, the Task Force approved a complete set of recommendations for modifications to the General Plan for the City Council to consider. An environmental consultant was hired to conduct an environmental review of the recommended amendments pursuant to the California Environmental Quality Act (CEQA). An Addendum to the Envision San Jose 2040 Final Program Environmental Impact Report (Envision FPEIR) was completed. The first Four-Year Review culminated in December 2016 with City Council approval of the Task Force and staff’s recommendations with minor changes. Key policy changes and direction approved by the City Council included:
• Reduction of overall employment capacity from 470,000 planned jobs to 382,000 planned jobs to set a more achievable jobs to employed resident (J/ER) ratio goal of 1.1/1, and to support implementation of the Urban Village strategy. This policy change has supported development of Urban Village plans and the feasibility of Signature Projects in urban villages. Six Signature Projects have been approved since conclusion of the 2015 Four-Year Review.
• A near term J/ER ratio goal for the year of 2025 of 1 job to 1 employed resident was established, which would represent a “balanced” community.
• A new policy was established that allowed one-hundred percent affordable housing projects to proceed within urban villages ahead of growth horizons or in urban villages without an approved plan. To date, one approved and two pending affordable housing projects are using this policy.
• Affordable housing projects may be developed on sites 1.5-acres or less, outside of growth areas, on properties with a commercial land use designation if the developments meets certain criteria, including that the site be vacant or underutilized, and the site has adjacent properties with a residential General Plan land use designation on at least two sides. To date not projects have been approved using this policy. To increase the number of eligible sites, the City Council approved a change to the criteria in December 2018 to allow projects on sites where only one adjacent property has a residential land use designation (and the project meets the other identified criteria). City Council has also directed staff to make further updates to this policy (Policy H-2.9) to clarify what
12
constitutes an underutilized site. Staff anticipates bringing brining clarifications to this policy to City Council for consideration in winter 2020.
• Prioritize urban village planning efforts on Horizon 2 Light Rail Urban Villages. Three Horizon 2 Light Rail Village plans are currently in different stages of development. Planning staff has completed two community workshops for the North 1st Street Urban Village plan, which is anticipated to be considered by City Council in fall 2020. Grant funding has also been secured for development of the Southwest Expressway and Race Street urban villages, with project initiation and community outreach beginning in 2020, and Council Consideration in 2021.
• The Task Force also recommended that the City Council should add staff capacity to the Planning Division to implement Urban Village Plans and General Plan policies. In May 2018, the City Council increased the General Plan Update Fee (renamed as “Citywide Planning Fee”) fee to stabilize and growth the Citywide Planning function to support implementation of the General Plan. As a result, Citywide Planning has added 10 new positions and filled 6 of those positions using the Citywide Planning fee.
2019 Four-Year Review Scope of Work On June 11, 2019 the City Council approved the 2019 General Plan Four-Year Review scope of work, which included items proposed by staff and items in a memo dated June 7, 2019 from Mayor Liccardo and Councilmembers Jimenez, Peralez, and Arenas. Two additional work items were added verbally during the June 11, 2019 City Council discussion of the Four-Year Review Scope of Work item. A summary of the policy items that will be considered during the 2019 General Plan Four-Year Review include: 1) Coyote Valley
a. Consider potential redistribution of planned job growth from North Coyote Valley.
b. Discuss long-term future North Coyote Valley & Mid-Coyote Urban Reserve.
2) Opportunity Housing
Explore allowing single-family parcels currently designated Residential Neighborhood to redevelop to 2-4 units per parcel with certain parameters.
3) Residential Uses in Underutilized Business Corridors
Explore policies that would allow limited housing in neighborhood business districts and determine shifts in planned housing capacity to facilitate future residential development in those areas.
13
4) Commercial Space Requirements for Affordable Developments
Explore changes to commercial space requirements for affordable housing developments. 5) Urban Village Implementation and Affordable Housing Goals
a. Redistribution of Planned Growth and Urban Village Boundary Modifications: Analyze limited redistribution of planned jobs and housing growth within urban villages, adjustments to urban village boundaries, and removing certain urban villages or adding new urban villages.
b. Mixed-Income Housing within Mixed-Use Developments in Urban Villages: Consider allowing mixed-income housing within mixed-use developments with a significant percentage of restricted affordable homes to proceed within an urban village ahead of a Growth Horizon (General Plan Policy IP-5.12).
c. Urban Village Growth Horizons: Evaluate the City’s jobs/housing balance, fiscal sustainability, housing supply, and infrastructure to determine whether to move Urban Villages that are in a future Horizon (Horizon 2 or Horizon 3) into the current Plan Horizon (General Plan Policy IP-2.5).
d. Residential Pool Units: Consider whether to reset the number of units in the Residential Pool to 5,000 to allow entitlement of residential projects within urban village areas not included within the current plan horizon (General Plan Policy IP-2.11).
e. Other Urban Village Policy Amendments:
• Modify General Plan Policy IP-5.5 to provide more flexibility in the Urban Village planning process for establishing the location, timing and mix of residential and commercial development in an Urban Village Plan area.
• Modify Signature Project Policy IP-5.10 to establish appropriate, clear, and more predictable minimum residential densities for Signature Projects and to establish more clarity on the amount of commercial space that would be required for Signature Projects.
6) Shift Planned Residential Capacity to Downtown
Explore shifts in planned housing capacity to Downtown.
7) Vehicle Miles Traveled Tier II Policies
Consider moving to Tier II of the General Plan’s transportation goals, policies and actions to further support the reduction of VMT and further the achievement of the Green House Gas reduction goals of Climate Smart San Jose.
8) Evergreen-East Hills Development Policy
Explore reworking or closing the EEHDP by examining how the Vehicle Miles Traveled (VMT) metric may influence the evolution of the EEHDP with an emphasis on preventing
14
further residential sprawl in hillside neighborhoods, but allowing mixed-use commercial growth in transit nodes.
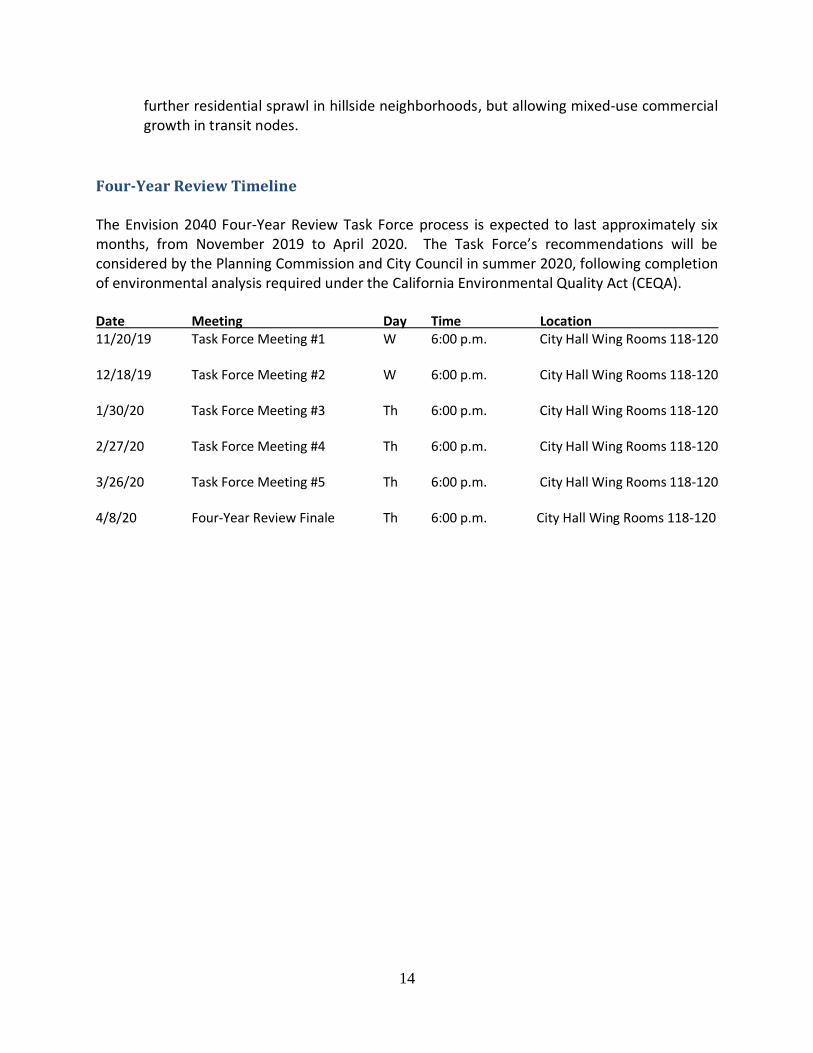
Four-Year Review Timeline The Envision 2040 Four-Year Review Task Force process is expected to last approximately six months, from November 2019 to April 2020. The Task Force’s recommendations will be considered by the Planning Commission and City Council in summer 2020, following completion of environmental analysis required under the California Environmental Quality Act (CEQA). Date Meeting Day Time Location 11/20/19 Task Force Meeting #1 W 6:00 p.m. City Hall Wing Rooms 118-120
12/18/19 Task Force Meeting #2 W 6:00 p.m. City Hall Wing Rooms 118-120 1/30/20 Task Force Meeting #3 Th 6:00 p.m. City Hall Wing Rooms 118-120 2/27/20 Task Force Meeting #4 Th 6:00 p.m. City Hall Wing Rooms 118-120 3/26/20 Task Force Meeting #5 Th 6:00 p.m. City Hall Wing Rooms 118-120 4/8/20 Four-Year Review Finale Th 6:00 p.m. City Hall Wing Rooms 118-120
15
III. CHANGES AND TRENDS IN LAND USE AND DEVELOPMENT
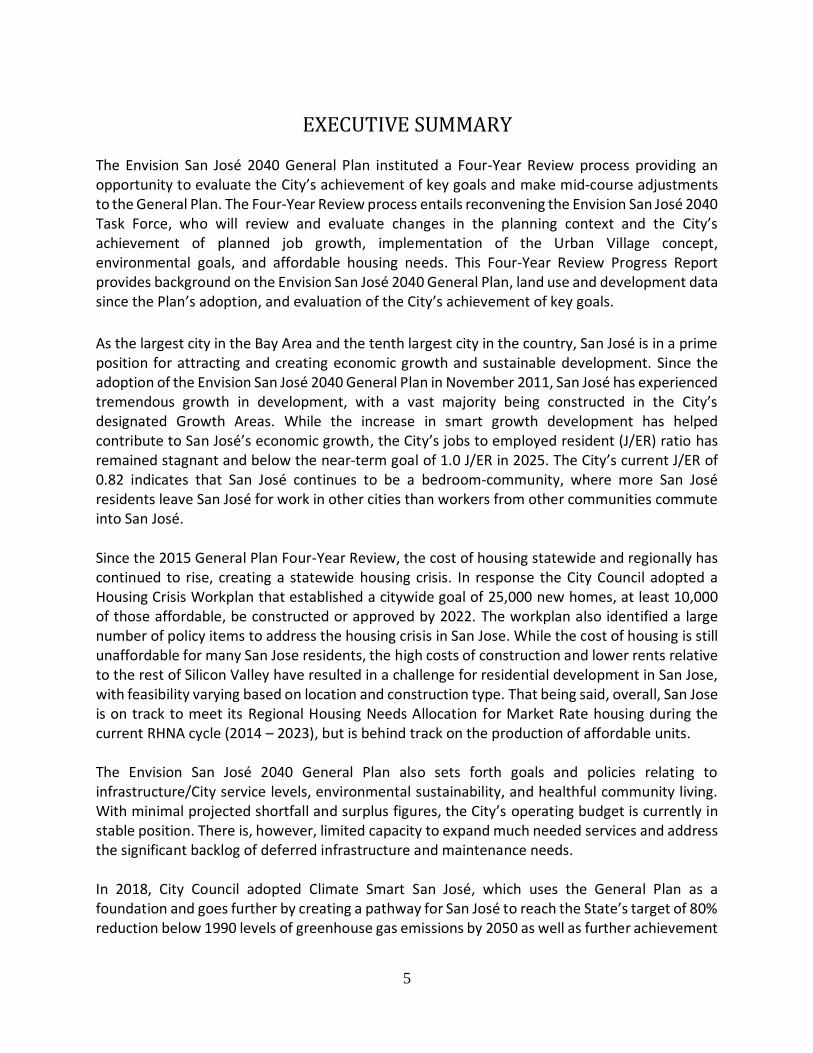
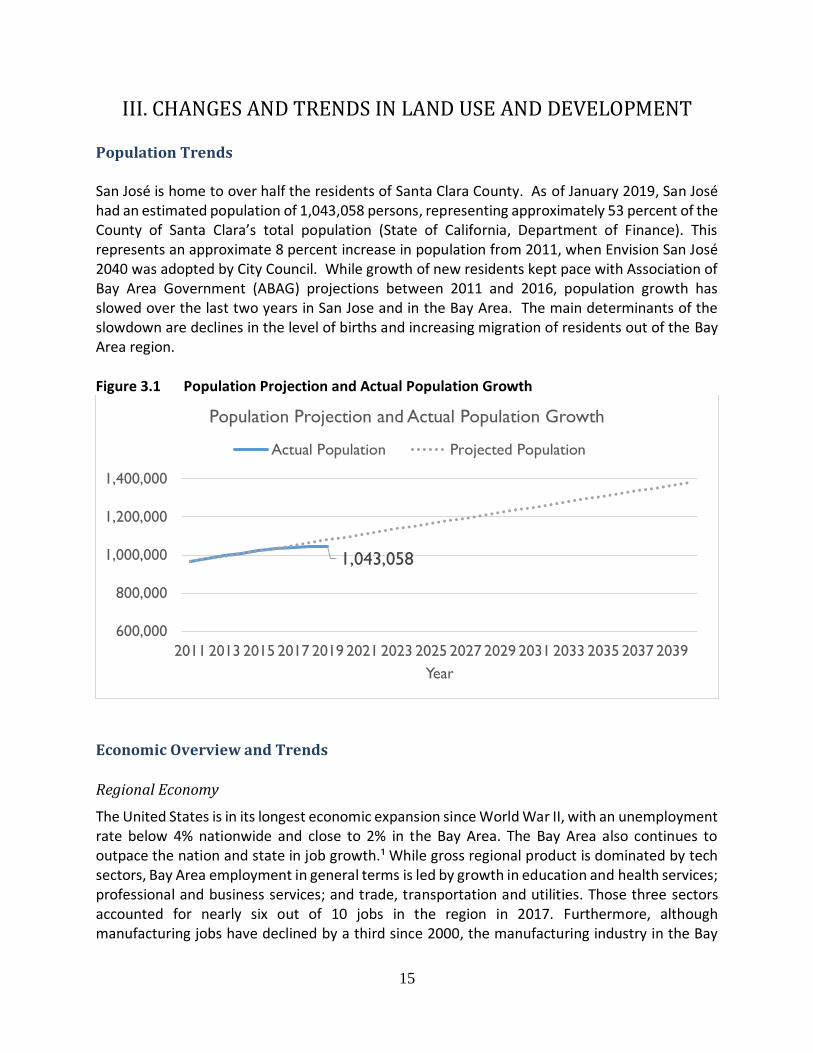
Population Trends San José is home to over half the residents of Santa Clara County. As of January 2019, San José had an estimated population of 1,043,058 persons, representing approximately 53 percent of the County of Santa Clara’s total population (State of California, Department of Finance). This represents an approximate 8 percent increase in population from 2011, when Envision San José 2040 was adopted by City Council. While growth of new residents kept pace with Association of Bay Area Government (ABAG) projections between 2011 and 2016, population growth has slowed over the last two years in San Jose and in the Bay Area. The main determinants of the slowdown are declines in the level of births and increasing migration of residents out of the Bay Area region. Figure 3.1 Population Projection and Actual Population Growth
Economic Overview and Trends
Regional Economy
The United States is in its longest economic expansion since World War II, with an unemployment rate below 4% nationwide and close to 2% in the Bay Area. The Bay Area also continues to outpace the nation and state in job growth.¹ While gross regional product is dominated by tech sectors, Bay Area employment in general terms is led by growth in education and health services; professional and business services; and trade, transportation and utilities. Those three sectors accounted for nearly six out of 10 jobs in the region in 2017. Furthermore, although manufacturing jobs have declined by a third since 2000, the manufacturing industry in the Bay
1,043,058
600,000
800,000
1,000,000
1,200,000
1,400,000
2011 2013 2015 2017 2019 2021 2023 2025 2027 2029 2031 2033 2035 2037 2039
Year
Population Projection and Actual Population Growth
Actual Population Projected Population
16
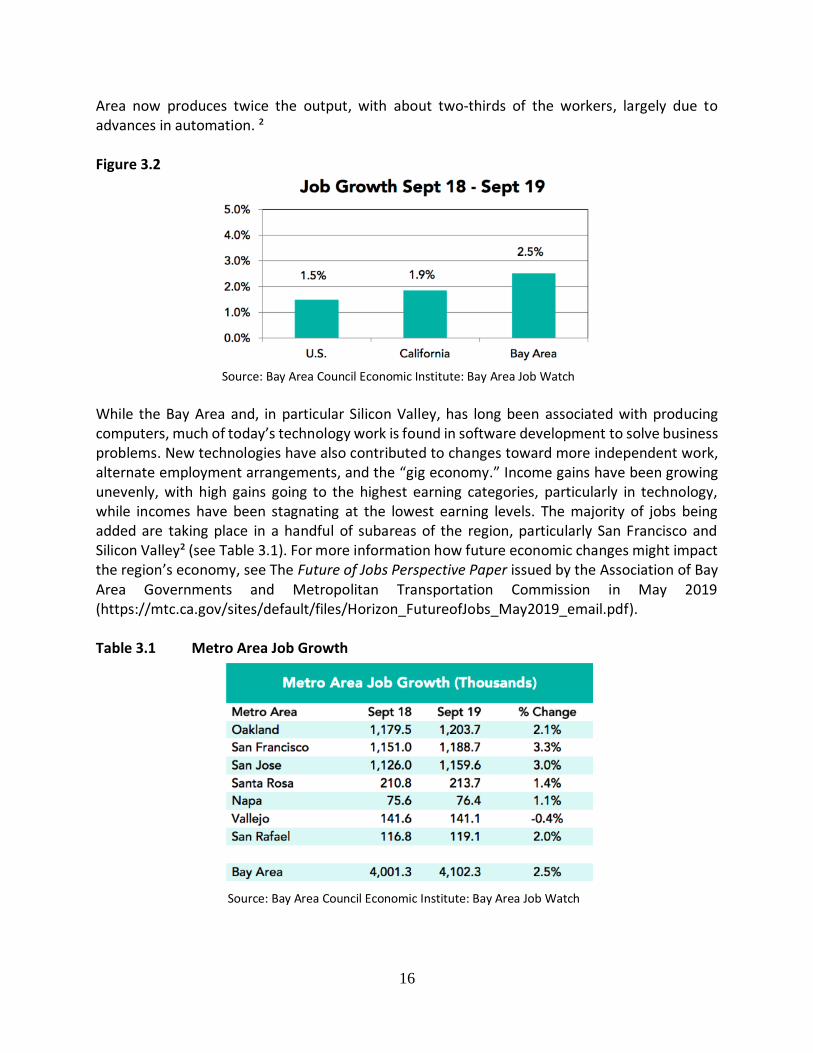
Area now produces twice the output, with about two-thirds of the workers, largely due to advances in automation. ² Figure 3.2 Job Growth September 2018 to 2019 .....................................................................
Source: Bay Area Council Economic Institute: Bay Area Job Watch
While the Bay Area and, in particular Silicon Valley, has long been associated with producing computers, much of today’s technology work is found in software development to solve business problems. New technologies have also contributed to changes toward more independent work, alternate employment arrangements, and the “gig economy.” Income gains have been growing unevenly, with high gains going to the highest earning categories, particularly in technology, while incomes have been stagnating at the lowest earning levels. The majority of jobs being added are taking place in a handful of subareas of the region, particularly San Francisco and Silicon Valley² (see Table 3.1). For more information how future economic changes might impact the region’s economy, see The Future of Jobs Perspective Paper issued by the Association of Bay Area Governments and Metropolitan Transportation Commission in May 2019 (https://mtc.ca.gov/sites/default/files/Horizon_FutureofJobs_May2019_email.pdf). Table 3.1 Metro Area Job Growth
Source: Bay Area Council Economic Institute: Bay Area Job Watch
17
City San Jose Economy
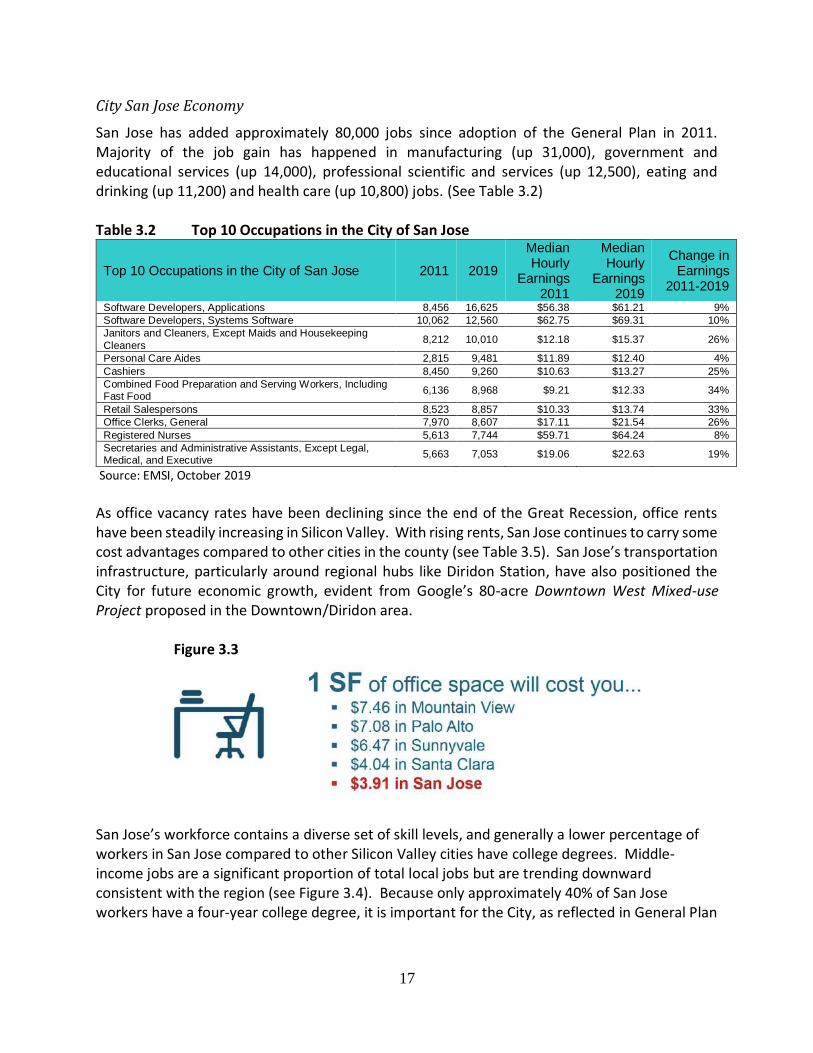
San Jose has added approximately 80,000 jobs since adoption of the General Plan in 2011. Majority of the job gain has happened in manufacturing (up 31,000), government and educational services (up 14,000), professional scientific and services (up 12,500), eating and drinking (up 11,200) and health care (up 10,800) jobs. (See Table 3.2) Table 3.2 Top 10 Occupations in the City of San Jose
Top 10 Occupations in the City of San Jose 2011 2019
Median Hourly
Earnings 2011
Median Hourly
Earnings 2019
Change in Earnings
2011-2019
Software Developers, Applications 8,456 16,625 $56.38 $61.21 9%
Software Developers, Systems Software 10,062 12,560 $62.75 $69.31 10%
Janitors and Cleaners, Except Maids and Housekeeping
Cleaners 8,212 10,010 $12.18 $15.37 26%
Personal Care Aides 2,815 9,481 $11.89 $12.40 4%
Cashiers 8,450 9,260 $10.63 $13.27 25%
Combined Food Preparation and Serving Workers, Including Fast Food
6,136 8,968 $9.21 $12.33 34%
Retail Salespersons 8,523 8,857 $10.33 $13.74 33%
Office Clerks, General 7,970 8,607 $17.11 $21.54 26%
Registered Nurses 5,613 7,744 $59.71 $64.24 8%
Secretaries and Administrative Assistants, Except Legal, Medical, and Executive
5,663 7,053 $19.06 $22.63 19%
Source: EMSI, October 2019
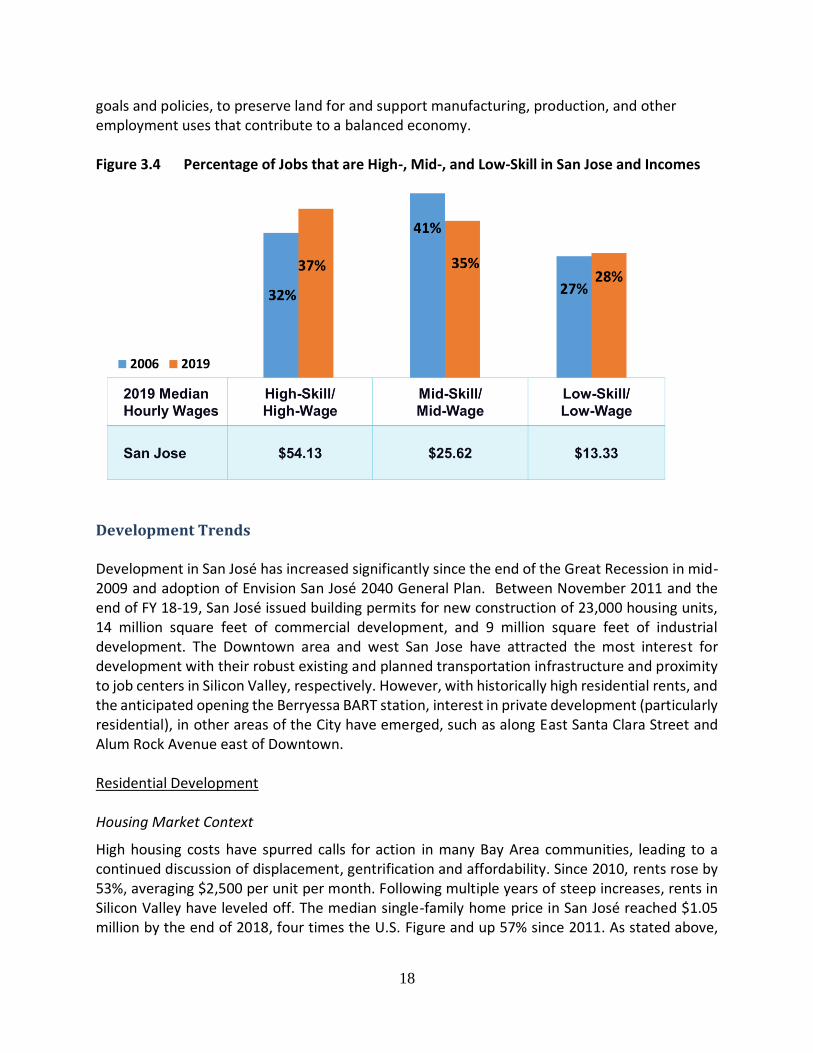
As office vacancy rates have been declining since the end of the Great Recession, office rents have been steadily increasing in Silicon Valley. With rising rents, San Jose continues to carry some cost advantages compared to other cities in the county (see Table 3.5). San Jose’s transportation infrastructure, particularly around regional hubs like Diridon Station, have also positioned the City for future economic growth, evident from Google’s 80-acre Downtown West Mixed-use Project proposed in the Downtown/Diridon area.
Figure 3.3 ..................... Cost of One Square Foot of Office Space in South Bay Area
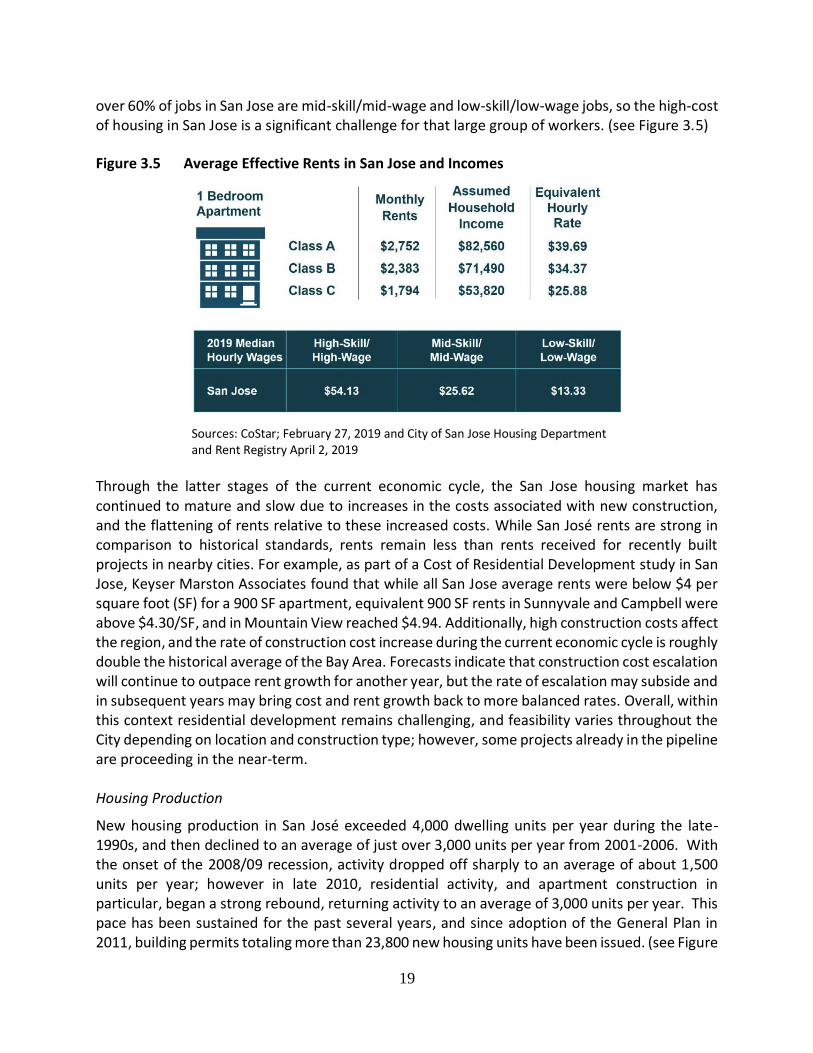
San Jose’s workforce contains a diverse set of skill levels, and generally a lower percentage of workers in San Jose compared to other Silicon Valley cities have college degrees. Middle-income jobs are a significant proportion of total local jobs but are trending downward consistent with the region (see Figure 3.4). Because only approximately 40% of San Jose workers have a four-year college degree, it is important for the City, as reflected in General Plan
18
goals and policies, to preserve land for and support manufacturing, production, and other employment uses that contribute to a balanced economy. Figure 3.4 Percentage of Jobs that are High-, Mid-, and Low-Skill in San Jose and Incomes
Development Trends Development in San José has increased significantly since the end of the Great Recession in mid-2009 and adoption of Envision San José 2040 General Plan. Between November 2011 and the end of FY 18-19, San José issued building permits for new construction of 23,000 housing units, 14 million square feet of commercial development, and 9 million square feet of industrial development. The Downtown area and west San Jose have attracted the most interest for development with their robust existing and planned transportation infrastructure and proximity to job centers in Silicon Valley, respectively. However, with historically high residential rents, and the anticipated opening the Berryessa BART station, interest in private development (particularly residential), in other areas of the City have emerged, such as along East Santa Clara Street and Alum Rock Avenue east of Downtown. Residential Development Housing Market Context
High housing costs have spurred calls for action in many Bay Area communities, leading to a continued discussion of displacement, gentrification and affordability. Since 2010, rents rose by 53%, averaging $2,500 per unit per month. Following multiple years of steep increases, rents in Silicon Valley have leveled off. The median single-family home price in San José reached $1.05 million by the end of 2018, four times the U.S. Figure and up 57% since 2011. As stated above,
19
over 60% of jobs in San Jose are mid-skill/mid-wage and low-skill/low-wage jobs, so the high-cost of housing in San Jose is a significant challenge for that large group of workers. (see Figure 3.5)
Figure 3.5 Average Effective Rents in San Jose and Incomes
Sources: CoStar; February 27, 2019 and City of San Jose Housing Department and Rent Registry April 2, 2019
Through the latter stages of the current economic cycle, the San Jose housing market has continued to mature and slow due to increases in the costs associated with new construction, and the flattening of rents relative to these increased costs. While San José rents are strong in comparison to historical standards, rents remain less than rents received for recently built projects in nearby cities. For example, as part of a Cost of Residential Development study in San Jose, Keyser Marston Associates found that while all San Jose average rents were below $4 per square foot (SF) for a 900 SF apartment, equivalent 900 SF rents in Sunnyvale and Campbell were above $4.30/SF, and in Mountain View reached $4.94. Additionally, high construction costs affect the region, and the rate of construction cost increase during the current economic cycle is roughly double the historical average of the Bay Area. Forecasts indicate that construction cost escalation will continue to outpace rent growth for another year, but the rate of escalation may subside and in subsequent years may bring cost and rent growth back to more balanced rates. Overall, within this context residential development remains challenging, and feasibility varies throughout the City depending on location and construction type; however, some projects already in the pipeline are proceeding in the near-term. Housing Production
New housing production in San José exceeded 4,000 dwelling units per year during the late-1990s, and then declined to an average of just over 3,000 units per year from 2001-2006. With the onset of the 2008/09 recession, activity dropped off sharply to an average of about 1,500 units per year; however in late 2010, residential activity, and apartment construction in particular, began a strong rebound, returning activity to an average of 3,000 units per year. This pace has been sustained for the past several years, and since adoption of the General Plan in 2011, building permits totaling more than 23,800 new housing units have been issued. (see Figure
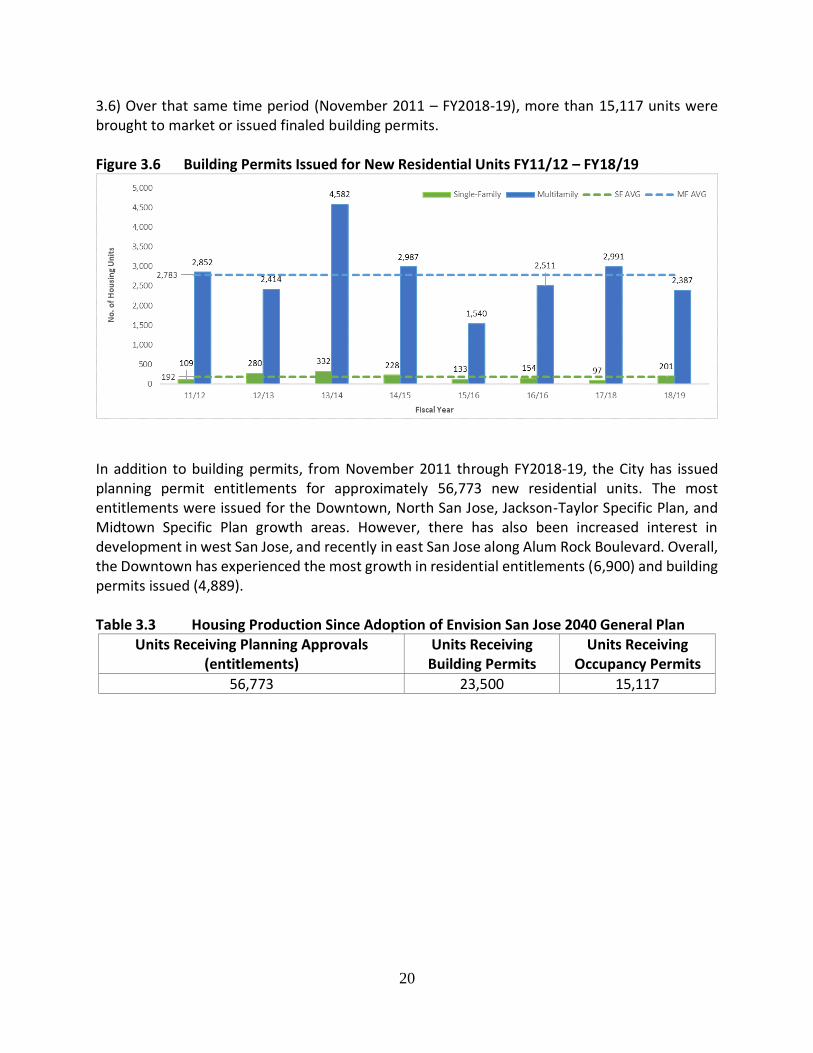
20
3.6) Over that same time period (November 2011 – FY2018-19), more than 15,117 units were brought to market or issued finaled building permits. Figure 3.6 Building Permits Issued for New Residential Units FY11/12 – FY18/19
In addition to building permits, from November 2011 through FY2018-19, the City has issued planning permit entitlements for approximately 56,773 new residential units. The most entitlements were issued for the Downtown, North San Jose, Jackson-Taylor Specific Plan, and Midtown Specific Plan growth areas. However, there has also been increased interest in development in west San Jose, and recently in east San Jose along Alum Rock Boulevard. Overall, the Downtown has experienced the most growth in residential entitlements (6,900) and building permits issued (4,889). Table 3.3 Housing Production Since Adoption of Envision San Jose 2040 General Plan
Units Receiving Planning Approvals (entitlements)
Units Receiving Building Permits
Units Receiving Occupancy Permits
56,773 23,500 15,117
21
Figure 3.7 Building Permits Issued (square feet) Per Square Mile for New Residential Units FY11/12 – FY18/19
22
Commercial and Industrial Development
Commercial and Industrial Market Context
The strong demand for office and R&D space in Silicon Valley, driven by growth in tech employment, has pushed vacancy rates down and commercial rents up across the board, and led to a boom in new commercial/industrial construction. Asking rents for San Jose office space are up 83 percent since 2011, according to Costar. But the City is still relatively more affordable compared to surrounding cities. Partly because of this reason, investors have largely concentrated new development in surrounding communities, and relatively little new office space has come online in San Jose since 2011 – roughly 2.8 million square feet, compared to roughly 8 million square feet in Sunnyvale over the same time period. Nonetheless, developer optimism for San Jose’s market fundamentals has led to large office proposals particularly in West San Jose and Downtown, though it remains to be seen how much of it will actually get financed and built. The largest project on the horizon is from Google Inc., which is planning for a roughly 8 million square foot, mixed use project that would include 3,000 to 5,000 homes, 6.5 million square feet of office, 418,000 square feet of light-industrial, 100,000 square feet of logistics/warehouse space, up to 300 hotel rooms and between 300,000 and 500,000 square feet of retail and other commercial space. In the retail market, San Jose’s retail supply continues to grow and evolve. Since 2011, the City has welcomed several large retail centers that have helped capture additional spending within the city’s borders by taking advantage of key transportation corridors. These include 250,000 SF Coleman Landing (2013); 320,000 SF Village Oaks (2014); 260,000 SF Sun Garden Center (2015); 145,000 SF Sprouts @ Brokaw (2015); 350,000 SF Almaden Ranch (2016) and a new 150,000 SF Costco (2016). Additionally, Westfield Valley Fair is in the final stages of a 650,000 SF expansion that will add a new Bloomingdale’s. While these represent traditional retail development typology, the City is likely to see future retail growth within a more mixed-use context. Additionally, changes to the retail industry itself – including a trend toward more services and food-related business – mean new types of retail occupiers are becoming the norm. Commercial and Industrial/Office Production
Since adoption of the General Plan, approximately 8.6 million square feet of new commercial (including 978 hotel rooms) and industrial/office space has been built in the City. Over that same time period, planning entitlements were issued for over 21.8 million square feet of new commercial and industrial/office development. (see Table 3.4) New commercial construction has been spread throughout the City with concentrations in west and north San Jose, while industrial/office growth has been primarily concentrated in north San Jose. (see Figures 3.9 and 3.10)

23
Table 3.4 New Commercial and Industrial/Office Production in Square Feet Since Adoption of 2040 General Plan
Commercial and Industrial/Office
Entitlements (Planning Approvals)
Commercial and Industrial/Office Space Complete Construction (Final Building Permits)
Number of Hotel Rooms complete construction
21.8M 8.6M 978
Figure 3.8 Building Permits Issued and Finaled for New Commercial and Industrial/Office FY11/12 – FY18/19
2,000
1,223
937 786
1,358
2,394
2,974
3,561
5,072
2,154
0
1,000
2,000
3,000
4,000
5,000
6,000
11/12 12/13 13/14 14/15 15/16 16/17 17/18 18/19
Squ
are
Fee
t in
Th
ou
san
ds
Fiscal Year
Commercial Issued Commercial FinaledIndustrial/Office Issued Industrial/Office Finaled
24
Figure 3.9 Building Permits Issued (square feet) per Square Mile for New Commercial Space FY11-12 – FY18-19

25
Figure 3.10 Building Permits Issued (square feet) per Square Mile for New Industrial/Office Space FY11/12 – FY18/19
26
Envision San José 2040 Focused Growth Strategy The Envision San José 2040 General Plan’s Focused Growth Strategy directs and promotes growth within identified Growth Areas, and strictly limits new residential development outside of Growth Areas to preserve and enhance the quality of established neighborhoods, and reduce environmental and fiscal impacts.” Development in Designated Growth Areas
The Planning Division tracks building permits for any new residential units or non-residential square footage in a Geographic Information Systems (GIS) database to evaluate progress for this measurement. This database is queried to determine the location of permits relative to Growth Areas, which includes Specific Plan Areas, Employment Areas, Urban Villages, and Downtown. Since adoption of the General Plan, approximately 85% of new residential units, 57% of new commercial space and 86% of new industrial/office development have been constructed in designated Growth Areas. CEQA Transition to Vehicle Miles Traveled
In 2013, the State legislature passed Senate Bill 743 (SB 743), which mandates that jurisdictions can no longer use automobile delay, commonly measured by “level of service” (LOS) when doing transportation analysis under CEQA. Rather, the State issued guidelines suggesting using a more holistic metric that can better support smart growth, called “vehicle miles traveled” (VMT). The City is in the process of implementing this change over two phases. In February 2018 the City Council approved amendments to the General Plan and a new Transportation Analysis Policy to change the City’s CEQA metric from LOS to VMT, establishing thresholds in line with State guidelines and General Plan policies. The new Transportation Analysis Policy promotes development in Planned Growth Areas by streamlining the CEQA review of new higher-density, mixed-use projects that improve air quality by reducing the number of miles driven by automobiles. In the second phase, modifications to the City’s transportation policies will be developed to fully implement General Plan goals and streamline the transportation analysis and investment/traffic impact fee process for development projects. During the 2019 General Plan Four-Year Review the Task Force will be examining how the VMT metric may influence the reworking or closing the LOS based Evergreen-East Hills Development Policy, with an emphasis on preventing further residential sprawl in hillside neighborhoods. Evergreen Senior Homes Initiative (Measure B) and Act to Limit Urban Sprawl (Measure C)
In fall 2017 the Nielsen Merksamer law firm submitted a signed petition to the City of San Jose to place the Evergreen Senior Homes Initiative (Initiative), also known as Measure B, on the June 2018 general municipal election ballot. The initiative proposed to amend goals and policies of the Envision San Jose 2040 General Plan and create a citywide Senior Housing Overlay (Citywide Overlay/CSHO) land use designation, coupled with a process to apply the overlay on “underutilized employment lands” in the city. Additionally, the Initiative would have applied the Citywide Overlay to an approximately 200-acre site in the Evergreen Campus Industrial growth
27
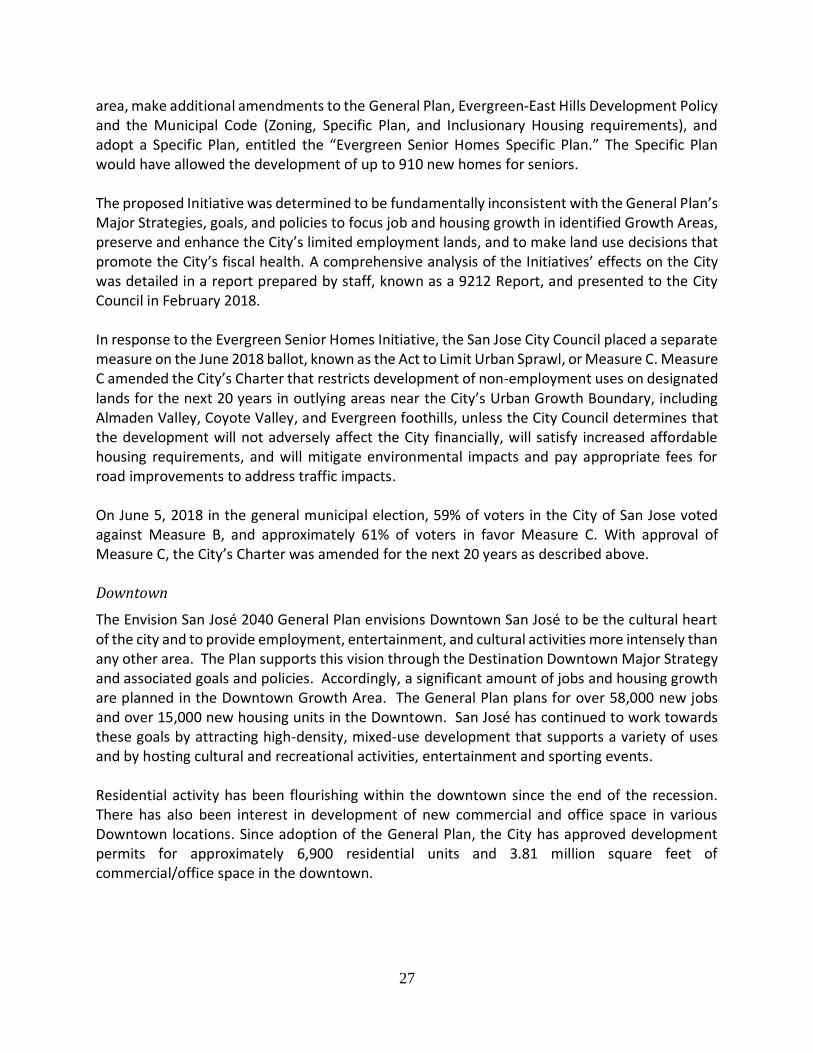
area, make additional amendments to the General Plan, Evergreen-East Hills Development Policy and the Municipal Code (Zoning, Specific Plan, and Inclusionary Housing requirements), and adopt a Specific Plan, entitled the “Evergreen Senior Homes Specific Plan.” The Specific Plan would have allowed the development of up to 910 new homes for seniors. The proposed Initiative was determined to be fundamentally inconsistent with the General Plan’s Major Strategies, goals, and policies to focus job and housing growth in identified Growth Areas, preserve and enhance the City’s limited employment lands, and to make land use decisions that promote the City’s fiscal health. A comprehensive analysis of the Initiatives’ effects on the City was detailed in a report prepared by staff, known as a 9212 Report, and presented to the City Council in February 2018. In response to the Evergreen Senior Homes Initiative, the San Jose City Council placed a separate measure on the June 2018 ballot, known as the Act to Limit Urban Sprawl, or Measure C. Measure C amended the City’s Charter that restricts development of non-employment uses on designated lands for the next 20 years in outlying areas near the City’s Urban Growth Boundary, including Almaden Valley, Coyote Valley, and Evergreen foothills, unless the City Council determines that the development will not adversely affect the City financially, will satisfy increased affordable housing requirements, and will mitigate environmental impacts and pay appropriate fees for road improvements to address traffic impacts. On June 5, 2018 in the general municipal election, 59% of voters in the City of San Jose voted against Measure B, and approximately 61% of voters in favor Measure C. With approval of Measure C, the City’s Charter was amended for the next 20 years as described above. Downtown
The Envision San José 2040 General Plan envisions Downtown San José to be the cultural heart of the city and to provide employment, entertainment, and cultural activities more intensely than any other area. The Plan supports this vision through the Destination Downtown Major Strategy and associated goals and policies. Accordingly, a significant amount of jobs and housing growth are planned in the Downtown Growth Area. The General Plan plans for over 58,000 new jobs and over 15,000 new housing units in the Downtown. San José has continued to work towards these goals by attracting high-density, mixed-use development that supports a variety of uses and by hosting cultural and recreational activities, entertainment and sporting events. Residential activity has been flourishing within the downtown since the end of the recession. There has also been interest in development of new commercial and office space in various Downtown locations. Since adoption of the General Plan, the City has approved development permits for approximately 6,900 residential units and 3.81 million square feet of commercial/office space in the downtown.
28
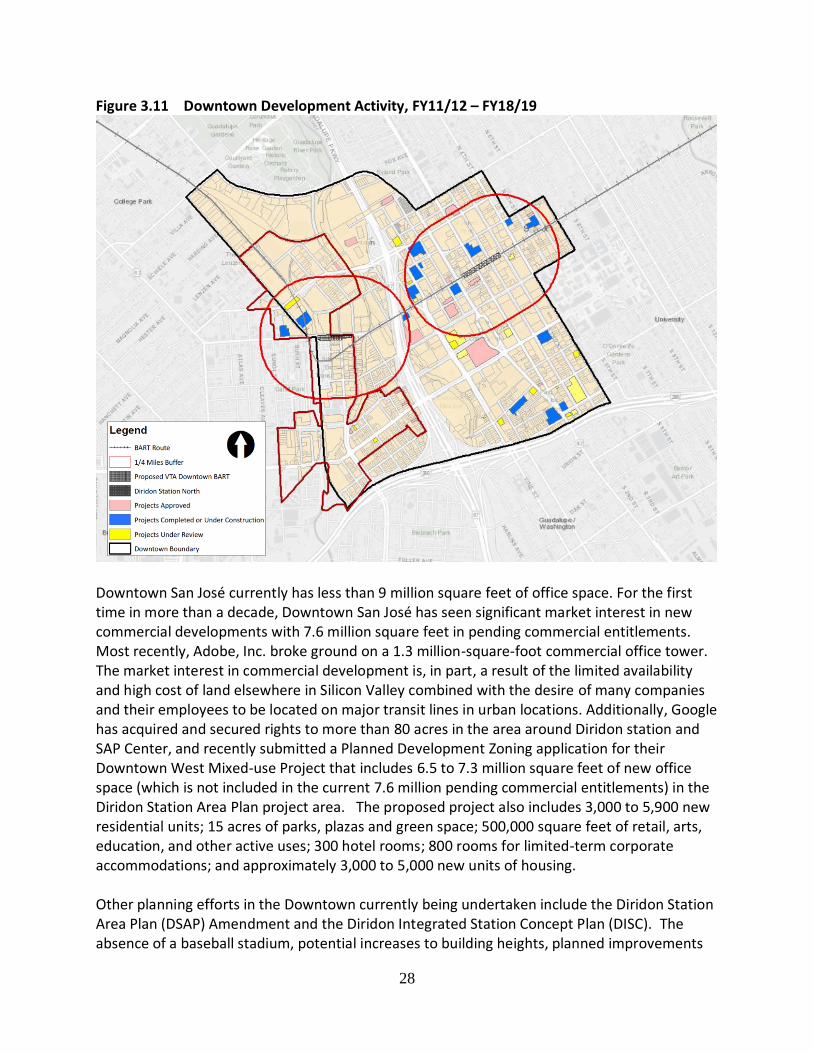
Figure 3.11 Downtown Development Activity, FY11/12 – FY18/19
Downtown San José currently has less than 9 million square feet of office space. For the first time in more than a decade, Downtown San José has seen significant market interest in new commercial developments with 7.6 million square feet in pending commercial entitlements. Most recently, Adobe, Inc. broke ground on a 1.3 million-square-foot commercial office tower. The market interest in commercial development is, in part, a result of the limited availability and high cost of land elsewhere in Silicon Valley combined with the desire of many companies and their employees to be located on major transit lines in urban locations. Additionally, Google has acquired and secured rights to more than 80 acres in the area around Diridon station and SAP Center, and recently submitted a Planned Development Zoning application for their Downtown West Mixed-use Project that includes 6.5 to 7.3 million square feet of new office space (which is not included in the current 7.6 million pending commercial entitlements) in the Diridon Station Area Plan project area. The proposed project also includes 3,000 to 5,900 new residential units; 15 acres of parks, plazas and green space; 500,000 square feet of retail, arts, education, and other active uses; 300 hotel rooms; 800 rooms for limited-term corporate accommodations; and approximately 3,000 to 5,000 new units of housing. Other planning efforts in the Downtown currently being undertaken include the Diridon Station Area Plan (DSAP) Amendment and the Diridon Integrated Station Concept Plan (DISC). The absence of a baseball stadium, potential increases to building heights, planned improvements

29
in the public right-of-way for streets and open space, an eventual new Diridon station, as well as the proposed mixed-use development by Google necessitate a comprehensive amendment of the current DSAP. The City Council will consider approval of the City-initiated DSAP amendments, Google planning entitlements, and all associated environmental documents and legislative changes as part of a comprehensive planning process. The City aims to complete this process in the Fall of 2020. Electrified Caltrain, BART, and High-Speed Rail service will be added to the trains, buses, and light rail that currently serve San José Diridon Station, making Diridon one of the busiest intermodal stations on the West Coast. The California High-Speed Rail Authority (CHSRA), Caltrain, Santa Clara Valley Transportation Authority (VTA), and the City of San José (Partner Agencies) are working together on a plan to expand and redesign Diridon Station, known as the Diridon Integrated Station Concept Plan. The goal is to develop a world-class train station that is integrated with the surrounding land uses, promotes public life and provides smooth connections between the many transit modes. As part of the General Plan Four-Year Review City Council approved scope of work, the Envision San Jose 2040 Task Force will be considering reallocating planned residential growth to the Downtown to accommodate the increased demand for development. Potential shifts in growth capacity recommended by the Task Force would be considered by City Council in fall 2020, closely aligned the City Council’s consideration of the DSAP Amendment and Google’s Downtown West Mixed-use Project. Coyote Valley
On November 6, 2018, San Jose voters passed Measure T, approving a $650 million general obligation bond for Disaster Preparedness, Public Safety and Infrastructure. Measure T authorized the use of bond funds for “preventing flooding and water quality contamination, including the acquisition of open space in Coyote Valley for these purposes,” along with a number of other priorities. The following year on November 6, 2019, the City Council approved actions related to the purchase and sale of the Brandenburg and Sobrato properties in North Coyote Valley totaling 937 acres to create a natural urban preserve. The preservation land will provide public access to open space and trails, green infrastructure supporting flood attenuation and aquifer recharge, protection of habitat to support rare and endangered species, preservation of wildlife linkage between the Diablo and Santa Cruz Mountain Ranges, agriculture preservation, and opportunities for wetland and riparian restoration. For 35 years (since 1984), North Coyote Valley has been designated in city land use plans for campus/industrial uses. (see Figure 3.12) Preservation of open space in North Coyote Valley will require the reallocation of most or all of the 35,000 campus/industrial jobs planned within North Coyote, which will be considered by the Envision 2040 Four-Year Review Task Force. As part of this analysis the City has hired Strategic Economics to analyze the distribution of planned jobs in North Coyote Valley to industry sectors, evaluate the City’s capacity to

30
accommodate future job growth in Growth Areas, and develop strategies to facilitate future economic growth in existing employment areas. Mid-Coyote Valley is designated as an Urban Reserve in the General Plan, and no urban or suburban development is planned to occur there through the year 2040. Given the preservation of North Coyote Valley, the Task Force will also consider the future of Mid Coyote Valley as an Urban Reserve, and opportunities to further advance other key city objectives related to preservation of open space and agriculture, flood and groundwater protection, and climate change resilience. Figure 3.12 Coyote Valley Planning Areas
31
IV. EVALUATION OF CITY’S ACHIEVEMENT OF KEY GOALS
Economic Development Goals The Envision San José 2040 General Plan’s Innovation/Regional Employment Center Major Strategy emphasizes economic development within the City to support San José’s growth as a center of innovation and regional employment. To advance this strategy, the Plan includes economic development goals and policies to support growing San José’s economic role within the region and world, increasing prosperity and opportunity for members of the community, and creating revenue growth for the City that enable delivery of needed infrastructure and desired urban services by:
• Planning for 382,000 new jobs and a Jobs/Employed Resident (J/ER) Ratio of 1.1;
• Supporting job growth within existing job centers;
• Preserving and expanding employment lands; and
• Designating job centers at regional transit stations
Progress Towards Envision San José 2040 Economic Development Goals Below is a summary of actions the City of San José is taking to achieve the Envision San José 2040 General Plan’s economic development goals, including efforts by the City’s Office of Economic Development (OED). Goal IE-1. Proactively manage land uses to provide and enhance economic development and job growth in San José:
San José’s General Plan places a high priority on preserving and growing the City’s jobs base, while also planning for new housing. Specifically, dense employment and new homes are planned near the City’s current and future transit nodes, and these areas have begun attracting significant interest. For instance, a major proposal from Google Inc. calls for 6 to 8 million square feet of development near Diridon Station, including homes, offices, hotel rooms and retail. In addition, 8.5 million square feet of commercial development is currently entitled or under entitlement review in the Downtown Growth Area, where currently only 8.5 million square feet of commercial development exists. The City has attracted large corporate tenants over the last couple of years to new projects such as the 1.5 million square foot Coleman Highline, where Roku and Verizon have recently signed leases. At the same time, the City continues to preserve its industrial land to support manufacturing and other middle-wage-paying jobs. The vacancy rate within San José’s industrial areas is currently around 2 percent, showing strong demand for industrial facilities, and several new warehouse/advanced manufacturing projects are either proposed or under construction. To maintain San José’s retail position, the City in 2019 approved new retail strategies for downtown and citywide, demonstrating support for this crucial economic sector.
32
Goal IE-2. Promote San José as an employment center. Nurture existing and attract new companies of all sizes (large anchor companies, emerging growth companies, small businesses) in industries that will drive the job and revenue growth for our City and regional economy:
Part of the City’s business-attraction effort involves improving perception of San José as a business location. The Office of Economic Development continues to implement a new branding campaign that was launched in 2017, positioning the city as a unique and desirable location for business – a place where entrepreneurs and Fortune 500 companies alike can “make your mark.” The branding initiative included presentations and outreach to local and regional business-oriented organizations, print ads in business media, social media engagement, and sharable web videos showcasing the City’s workplaces, business culture and diverse talent. City staff also engages in regular business outreach, meeting with 300-plus businesses a year to identify site needs, recruit touring tenants and connect companies with services and programs that can benefit their facility or business. While many of those are larger businesses, the City also works to support small business through the Small Business Ally program. It provides two staff members to guide small businesses through the city permitting process and also provide referrals to business support services. The Storefronts grant program is also available to provide grants up to $25,000 to support small businesses activating vacant storefronts citywide. Strengthening middle-income jobs and providing all residents with opportunity remains a priority. In 2018, OED launched MFG: SJ, a nonprofit organization dedicated to servicing and supporting the city’s manufacturing ecosystem. This organization, with two full-time staff members, is the outgrowth of OED’s Silicon Valley Manufacturing Roundtable, a regular regional convening that started in 2011. Goal IE-3. Increase San José’s leadership role and influence in regional, state, and national forums in order to advance City economic development goals and secure greater resources, and support the City’s efforts to become a job center for the region:
San José’s legislative advocacy program focuses on a variety of avenues for the city to influence regional, state and federal policy and programs. For example, in keeping with the job-rich goals of the Envision 2040 General Plan, the City engaged in the regional Plan Bay Area 2040 to advocate for higher jobs numbers in San José. San José was successful in increasing the jobs in the final scenario by roughly 52,000. (The draft preferred scenario included 502,600 jobs in San José while the final scenario included 554,900 jobs.) The final number is still short of the General Plan’s projections, but the City moved the needle in the right direction. San José also advocated for, and received, the most Opportunity Zones in Silicon Valley; the Office of Economic Development submitted information to the California Department of Finance to educate decision-makers on San José’s qualifying census tracts. The federal designation provides a tax incentive for private investment into qualifying real estate, business, and infrastructure projects. San José’s 11 designated Opportunity Zone tracts span the city and offer a variety of investment opportunities.

33
Goal IE-4. Strengthen San José’s connections to the world, and promote San José’s assets and image as a global innovation center to attract economic development, and increase job production in San José:
San José fosters connections around the globe in several ways including air transportation, marketing and international partnerships/exchanges. In recent years, transportation connections have improved as Mineta San José International Airport has continued to increase its nonstop international service, with more nonstop service to Canada and Mexico. Nonstop to Toronto begins May 2020; additional service to the Mexican cities of Leon, Morelia, and Zacatecas started in late 2018. SJC continues to offer nonstop service to Beijing, Cabo San Lucas, Guadalajara, London, Tokyo, and Vancouver. In addition, international access has improved thanks to new nonstop service to the international hubs of Detroit and Newark. The City has also worked to increase overseas awareness through marketing. Recent article placements in The Financial Times and Times of India highlighted San José as a premiere destination for international investment, and a San José feature in an upcoming Japan Times Bay Area issue is in process. Finally, a dedicated International Programs Manager within the San José’s Office of Economic Development focuses on partnerships, business and cultural exchange with international organizations. These include business and government delegations, international trade associations and Sister City groups. Recent examples include delegations from Yongin, Korea; Zhejiang, China; and Vietnam. Goal IE-6. Provide widespread access to diverse employment and training opportunities in San José and strive to increase job growth, particularly jobs that provide self-sufficient wages and health care benefits, to allow the community to broadly share in the region’s prosperity:
San José aims to provide diverse employment opportunity through several programs and strategies. San José’s workforce investment board, Work2Future, provides a variety of programs to support individuals and employers in their workforce needs. A major focus is offering skill upgrade and job training opportunities that enhance opportunities in specific pathways that lead to self-sufficiency. Emphasis is being placed on the advanced manufacturing, construction, healthcare, finance, and information/computer technology industries. Work2Future also led the Sector Partnerships initiative, which strives to align workforce needs with educational pathways. This effort has led to a new pilot certificate in advanced manufacturing at Evergreen Valley College. Another initiative is Work2Future’s pre-apprenticeship program. More than 450 individuals have received a pre-apprenticeship certificate, which allows them to become union apprentices in the building industry. The City also places an emphasis on industrial land preservation in order to ensure that these important industries have spaces to call home within San José.
34
Goal IP-18. Develop and utilize economic development programs to implement the Land Use / Transportation Diagram and Envision General Plan Goals, Policies and Implementation Actions related to job growth, fiscal sustainability, and economic development:
The City implements a variety of development facilitation and business support programs to promote job growth, investment and economic development. Examples include the Small Business Ally Program (increased to two FTEs in 2016); the Downtown High-Rise Incentive Program (renewed in fall 2019); the Foreign Trade Zone program; Opportunity Zones; and the newly created position of Development Facilitation Officer (embedded in the Office of Economic Development). The City also works closely with state and regional partners on problem-solving and connecting companies to beneficial resources. Proactive outreach is key to attracting investment to San José. OED’s Business Outreach Team works to retain, attract and expand driving-industry business. Staff works to follow up on tenant leads, facilitate expansions and provide information on locating in San José. In 2019, OED brought on a full-time staff member to work exclusively on development facilitation for the highest-priority commercial/industrial projects. This was complemented in late 2019 by the addition of a Housing Catalyst Officer, working to attract investment and development interest for high-quality affordable and market-rate housing projects.
Jobs/Employed Resident Ratio (J/ER Ratio) San José is the largest and most urban city located within Silicon Valley, and plays an increasingly important role in the continuing growth of the regional, state, and national economies. San José is, however, the only city in the United States over 500,000 people that is a bedroom community, meaning more San José residents leave San José for work in other cities than workers from other communities commute into San José. This imbalance reduces opportunities for San José to truly be the Capital of Silicon Valley, and has led to significant fiscal and environmental impacts, and quality of life challenges not just for San José but for the region as well. The J/ER ratio is an indicator of a city’s fiscal strength: In general, employment-based development generates city revenue while residential-based development necessitates the provision of city services, the cost of which outweighs the revenue collected. The City monitors its J/ER ratio using a combination of data from the U.S. Census Bureau’s American Community Survey (ACS) and payroll data from the California Employment Development Department (CEDD). According to the most recent data, the City’s J/ER ratio is 0.82, meaning there are 0.82 jobs per every employed resident in San José. (Figure 6.)

35
Table 4.1 Jobs per Employed Resident for Select Local Cities, 2010-2018
J/ER All jobs 2010 2011 2012 2013 2014 2015 2016 2017 2018 San José 0.83 0.80 0.81 0.83 0.82 0.82 0.82 0.85 0.82
Mountain View
1.60 1.77 1.83 2.59 1.84 1.92 1.67 1.74 1.77
Palo Alto 3.00 3.14 3.27 3.20 3.13 3.36 3.33 3.36 3.40
Fremont 0.84 0.85 0.86 0.86 0.90 0.96 0.96 0.98 0.98
Santa Clara 1.75 1.95 2.02 2.02 1.77 1.79 1.70 1.69 1.77
Sunnyvale 1.18 1.18 1.16 1.13 1.06 1.06 1.04 1.08 1.04
San Francisco
1.02 1.16 1.17 1.24 1.26 1.29 1.30 1.29 1.29
Cupertino 1.12 1.23 1.20 1.33 1.47 1.64 1.75 1.85 2.00
Milpitas 0.99 1.17 1.17 1.19 1.18 1.18 1.17 1.26 1.25
As of September 2019, San José has a total of 447,317 payroll and self-employed jobs, of which approximately 76,000 of these jobs were created since the adoption of the General Plan in November 2011 and represents a 21% increase from 2011 (California Employment Development Department). On average, this is approximately 9,500 new jobs per year. The General Plan includes a planned job capacity of 382,000 new jobs, equating to approximately 13,000 new jobs per year (California Employment Development Department). The City monitors progress on the J/ER ratio through use of data from the U.S. Census Bureau’s annual American Community Survey (ACS). An employed resident is a worker who lives in San José. This ratio is an indicator of the City’s jobs/housing balance. As of September 2019, the City’s J/ER ratio was 0.82, meaning there are more employed residents living in San José than there are jobs in the City. In comparison, San José’s J/ER ratio in 2010 was 0.83. Although the J/ER ratio has remained relatively unchanged since adoption of Envision San José 2040 General Plan, the City has made incremental strides in becoming an innovation and regional employment center. Major projects include:
▪ Museum Place in downtown was approved for a 24-story mixed-use development with 19,000 square feet of ground floor retail and 214,000 square feet of office space. (SP17-031)
▪ The Akatiff office development was approved for 982,000 square feet of office square footage within Diridon Area Urban Village. (SP18-020)
▪ A 250-room hotel and 100,000 square feet of commercial uses was approved in North San José. (PDC17-026)
▪ Software company Splunk signed a lease for 301,000 square feet of office space at Santa Row in a new 319,000 square foot office and retail building (700 Santana Row), bringing Splunk’s total leased space at Santana Row to over half a million square feet (Splunk leases 234,000 square feet at 500 Santana Row, adjacent to the new 700 Santana Row office building).
36
▪ Hewlett Packard Enterprise Co. is moving its headquarters from Palo Alto to 220,000 square feet at America Center in North San José, where it will locate about 1,000 employees beginning in 2018.
▪ Roku, a TV streaming platform, signed a lease to occupy over 472,000 square feet of office space in four buildings at Coleman Highland, on Coleman Avenue adjacent to Avaya Stadium.
Job Growth within Existing Job Centers and at Regional Transit Stations
The Envision San José General Plan supports job growth within existing job centers through the Focused Growth major strategy (see Section III). Since adoption of the General Plan, approximately 57% of new commercial space and 86% of newly constructed office/industrial space have been built in designated Growth Areas. General Plan Policy IE-1.8 requires the City to “measure and report the number of jobs created in identified Growth Areas during the City Council’s periodic review of the General Plan.” Due to the lack of available geographically-specific jobs data, the City is unable to report on the exact number of new jobs within individual Growth Areas. However, since the adoption of Envision 2040, the City has approved approximately 18.8 million square feet of commercial and industrial/office development within Growth Areas. As mentioned above, citywide San José has added approximately 76,000 new jobs since 2011 (California Employment Development Department). Diridon Station in the Downtown is San José’s primary regional transit station, served by multiple transit services, including among others, Caltrain, VTA light rail and bus service, Altamont Corridor Express (ACE) and Capitol Corridor train services, as well as Amtrak. Envision San José 2040 General Plan policy IE-1.7 directs the City to advance the Diridon Station Area as a world-class transit hub and key transportation center for Northern California. To lay the groundwork for achieving this policy, City Council approved the Diridon Station Area Plan (DSAP) in 2014. The Diridon Station Area Plan plans for the expansion of the existing Diridon Station and maximum possible build-out of new high-density transit-supportive development within the 250 acre project boundary surrounding the station. Since adoption of DSAP, Google has acquired and secured rights to more than 80 acres in the area around Diridon station and SAP Center, and recently submitted a Planned Development Zoning application for their Downtown West Mixed-use Project that includes 6.5 to 7.3 million square feet of new office space and 300 hotel rooms, as well as residential uses in the Diridon Station Area Plan project area. Other planning efforts in the DSAP area include the Diridon Station Area Plan Amendment and the Diridon Integrated Station Concept Plan (DISC), described in Section III above.
Industrial Conversions
Since 1980, approximately 2,300 acres of employment lands in San Jose have been converted to non-employment uses, resulting in an estimated loss in job capacity between 52,000 and 110,000
37
jobs. Overall, employment lands and light/heavy industrial lands in particular make up a small percentage (2.7%) of the city’s overall land portfolio. Additionally, industrial space vacancy rates are currently low in San Jose (approximately 2%) and demand is high. Industrial businesses provide many quality employment opportunities that do not require a college degree, paying non-management hourly wages ranging from $15 to $35 per hour. The General Plan recognizes the retention of existing industrial lands as necessary to meeting economic development and fiscal sustainability objectives; and prohibits the conversion of lands designated for light and heavy industrial uses to non-industrial uses. Since adoption of Envision San Jose 2040, seven General Plan amendment applications for conversions of industrial designated land to non-industrial land use designations were submitted to the Planning Department. Of the seven applications, five were withdrawn and two were denied by the City Council. As of November 2019, there is one General Plan amendment application on file that proposes to convert industrial designated land to non-industrial (residential) uses.
Fiscal and Infrastructure/Service Goals Key measures for determining the City’s fiscal strength are the Capital and Operating Budgets, including the Capital Improvement Program (CIP). The CIP relies on special funds, construction taxes, and development impact fees. Development impact fees can only be used to mitigate the impact of new development and cannot contribute to City services or deferred infrastructure maintenance because the fees are limited to the extent or degree to which new development generates a demand for various public facilities. In total, the City’s 2018-2019 Adopted Capital Budget and 2019-2023 Adopted CIP reflect a 34.5% increase and a 14% increase, respectively, over the previous fiscal year, due in large part to San José residents passing Measure T – Disaster Preparedness, Public Safety, and Infrastructure Bond. Approved in November 2018, the measure authorized the City to issue up to $650 million in general obligation bonds for investment in city infrastructure, including upgrades to emergency and disaster response facilities, road construction, flood protection, water quality protection, and improvements to other critical infrastructure. Even with the infusion of bond funding, the City continues to lack the resources required to fully maintain and fund its infrastructure portfolio. The City’s General Fund is the primary operating fund used to account for all revenues and expenditures of the City, which are not related to special or capital funds that were created for a specific purpose. As per the “2019-2020 Proposed Operating Budget Message” (http://www.sanjoseca.gov/DocumentCenter/View/84138), a General Fund revised surplus of $5.1 million was projected for 2019-2020. Small shortfalls ranging from -$1.7 million to -$13.7 million and one surplus of $11.4 million in 2022-2023 are projected for the remaining four years of the Forecast. With minimal projected shortfall and surplus figures, the City’s budget is in stable position. However, there is limited capacity to expand much needed services and address the significant backlog of deferred infrastructure and maintenance needs.
38
The General Fund position has improved when compared to the 2019-2023 Forecast issued in March 2018. In the previous Forecast, shortfalls ranging from -$8.9 million to -$15.5 million were projected in each year of the Forecast. The change from the previous forecast reflects the improvement in revenues as well as lower growth in projected costs, particularly retirement costs. In the 2019-2020 Proposed Budget, the total net funding is $4.3 billion for all City funds (General, Special, and Capital). The City’s highest budget priorities this year include homelessness and housing; public safety; the environment; confronting the high cost of housing and living, education and our youth, combatting blight; saving and fiscal sustainability. These priorities, among other items, are addressed in the Capital and Operating Budgets available on the Budget Office website: http://www.sanjoseca.gov/budget.
Environmental Goals In October 2007, the City Council adopted the Green Vision, a 15-year plan with ten bold goals for economic growth, environmental sustainability, and an enhanced quality of life for San José’s residents and businesses. The General Plan incorporates many of the Green Vision goals and extends the City’s measurement of its environmental sustainability through 2040. In April 2015, the City Council directed staff to reprioritize and focus on two overarching goals of the Green Vision: 1) ensuring a more sustainable water supply and 2) reducing greenhouse gas emissions. The City Council memo stated that the Green Vision would no longer be reported annually in a standalone report, but that the remaining goals of the Green Vision should remain within their respective department’s work plans and be reported through the performance-based budget process.
Climate Smart San Jose
For conformance with SB 375, San José is required to develop a Sustainable Community Strategy consistent with City’s goals for Environmental Leadership as well as the economic, fiscal and other goals and policies contained within the Envision 2040 General Plan, per Action Item IP-17.3 of the General Plan. In 2017, led by Environmental Services Department staff, the City began drafting the Green Vision’s replacement, Climate Smart San José. Climate Smart San José uses the General Plan as a foundation and goes further by creating a pathway for San José to reach the State’s target of 80% greenhouse gas emissions reduction below 1990 levels by 2050, as well as a strategy to achieve the Paris Climate Agreement goals, including the reduction in carbon emissions required by 2050 to keep the rise in average global temperature to below two degrees Celsius. The Climate Smart San José plan was approved by the City Council in February 2018.
39
Following extensive community engagement, technical input, consultant analysis, and City department input, the resulting Climate Smart San José plan is framed around four core principles: people-centered, data-driven, inclusive, and implementation-ready. It sets out nine strategies, each associated with quantitative milestones to ensure clear, timely progress tracking. To enable and facilitate implementation, it also includes a City Action Plan and Playbooks for various audiences, including residents and developers. Environmental Services staff have created a Citywide Climate Smart San José Steering Committee and Technical Advisory Group to align City departments and facilitate implementation of the plan. Environmental Services staff also provide semi-annual updates to the City Council on progress implementing the Climate Smart San José plan. The Climate Smart San José Plan sets five bold campaigns with eight goals focusing on energy, water, transportation, greenhouse gas emissions and economy to guide the implementation of the plan to align with the Paris Agreement. Renewables and Electrification
Goal 1. By 2021, San José Clean Energy (SJCE) will offer 100 percent greenhouse gas-free power as a base product: San José Clean Energy (SJCE) launched service to 308,000 residential and commercial customers in February 2019 sourced with 45 percent renewable energy from solar, wind, and geothermal.
Goal 2. By 2040, San José will be the world’s first one gigawatt (GW) solar city. The City of San José has a total installed capacity of 148 MW. Currently there are three action items: 1) Promote existing programs available to San José residents for solar installation incentives, 2) Create a one-stop online resource for residents electing to be a SJCE customer to increase their renewable energy usage, and 3) Develop programs to encourage or incentive usage of solar and other renewable energy in the community. Goal 3. By 2030, 60 percent of all passenger vehicles in the city will be electric, making us the electric car capital of the U.S: In order incentivize electric passenger vehicles, the City needs to expand electric vehicle infrastructure, which includes having readily available charging stations. In September 2019, San José adopted a building reach code ordinance for new residential and commercial construction, which includes vehicle (EV)-readiness, and EV charging and equipment installation. Goal 4. From 2020, 100 percent of new homes will be Zero Net Energy (ZNE) and, by 2030, 25 percent of all existing homes will be energy efficient and all-electric: , Aside from adoption of the reach code building ordinance, the City has developed multiple outreach methods and programs to educate the community on zero net energy, including:
• Energy trainings – education on conservation strategies and improving awareness of state and local energy policies for building requirements and operations,
• Residential heat pump water heater rebate program, and

40
• A program to check out portable induction cooktop and cookware to test out the energy efficient cooking systems.
Meet Jobs to Employed Resident (J/ER) Target
Goal 5. By 2030, San José will create an additional 22 million square feet of commercial workspace located within a half mile of transit. For FY18-19, the City has issued entitlements for 2.35 million square feet of commercial/office/retail within a half mile of transit.
Work Toward Focus Growth Target
Goal 6. By 2030, San José will have developed 40,000 dwelling units in its urban villages and focused growth areas: Since the adoption of the General Plan in 2011, the City has issued planning development permits for approximately 24,696 units within its urban village and focused growth areas as part of the General Plans Focused Growth Major Strategy.
Reduce Per Capita Vehicle Miles Traveled
Goal 7. By 2040, only four out of ten commute trips in San José will be taken in single-occupancy vehicles: Currently, an estimated 76% of San Jose residents’ commute journeys are in single-occupancy vehicles.
Reduce Per Capita Water Use
Goal 8. By 2030, San José will reduce its per capita residential water consumption by 30 percent compared to 2009 levels: In 2018, residential water consumption was 48.69 gallons per person per day, a reduction of 19 percent compared to 2009 levels of residential water consumption of 60 gallons per person per day.
In October 2018, the City of San Jose was named as a winner in in Bloomberg American Cities Climate Challenge, providing resources and support valued up to $2.5 million to support the implementation of Climate Smart San José. Specifically, San Jose will work with Bloomberg and partners to: comprehensively evaluate and update parking requirements for new development to enable no- and low-parking development, particularly in the downtown and other areas around transit; develop and implement a shared electric-vehicle strategy, including education and incentives; identify and implement high-priority segments of the City’s walking and bicycling network and the inclusion of new mobility options such as bike- and scooter-sharing systems; develop a roadmap to eliminate natural gas use in residential housing; and requiring solar and EV-readiness in new construction. As part of its American Cities Climate Challenge (ACCC) commitment, the City agreed to pursue adoption of a “reach code” for new residential and commercial construction, aligned with Climate Smart goals. “Reach Codes” require development projects to exceed the minimum Building Energy Efficiency requirements. In September 2019, City Council adopted a reach code for new residential and nonresidential construction in San Jose. It incentivizes all-electric
41
construction and will require increased energy efficiency and electrification-readiness for developers choosing to maintain the presence of natural gas, a fossil fuel and powerful GHG. It also will require that non-residential construction include solar readiness, and requires additional Electric Vehicle charging readiness and/or electric vehicle service equipment (EVSE) installation for all development types. In October 2019, City approved City Council Policy 8-15 to prohibit natural gas infrastructure in new construction of low-rise multi-family buildings (three stories and under), single-family homes, and accessory dwelling units. The City’s reach code will be effective January 1, 2020.
Greenhouse Gas Emission Reduction Goals and Targets
The City’s General Plan, through the Greenhouse Gas Reduction Strategy, and Climate Smart San José establish a goal for San José to reach the State’s greenhouse gas reduction targets. The State’s current target is an 80% reduction of greenhouse gas emissions below 1990 levels by 2050. Climate Smart San Jose goes further by setting a goal to achieve reductions consistent with the Paris Climate Agreement goals, which is a reduction in carbon emissions by 2050 to keep the rise in average global temperature to below two degrees Celsius. An inventory of community greenhouse gas emissions was prepared during the first Four-Year Review, which found in 2014 (the base year of the inventory), the City’s total emissions were 6,937,796 MTCO2e (metric tons of carbon dioxide equivalent). As part of implementation of the Climate Smart San Jose plan, an updated greenhouse gas emissions inventory was completed in April 2019, with a 2017 baseline year for GHG emissions. The total emissions for the 2017 inventory were calculated at 5,711,665MTCO2e. This represents just over a 17% decrease (-1,226,130MTCO2) from the 2014 Inventory. The greatest declines from 2014-2017 were seen in residential, commercial, and industrial energy sectors, likely from PG&E’s significantly cleaner electricity grid as well as reduced energy consumption. Transportation emissions also declined, but transportation remained the biggest contributor of emissions at 63% of the inventory total. The transportation emissions data in the 2017 inventory was updated to include in-boundary flights, light rail, and public buses and utilized the updated City of San José Travel Forecasting Model, which includes estimated annual vehicles miles traveled data. Overall, the dominance of transportation emissions is consistent with the trend seen in other urban areas in California.
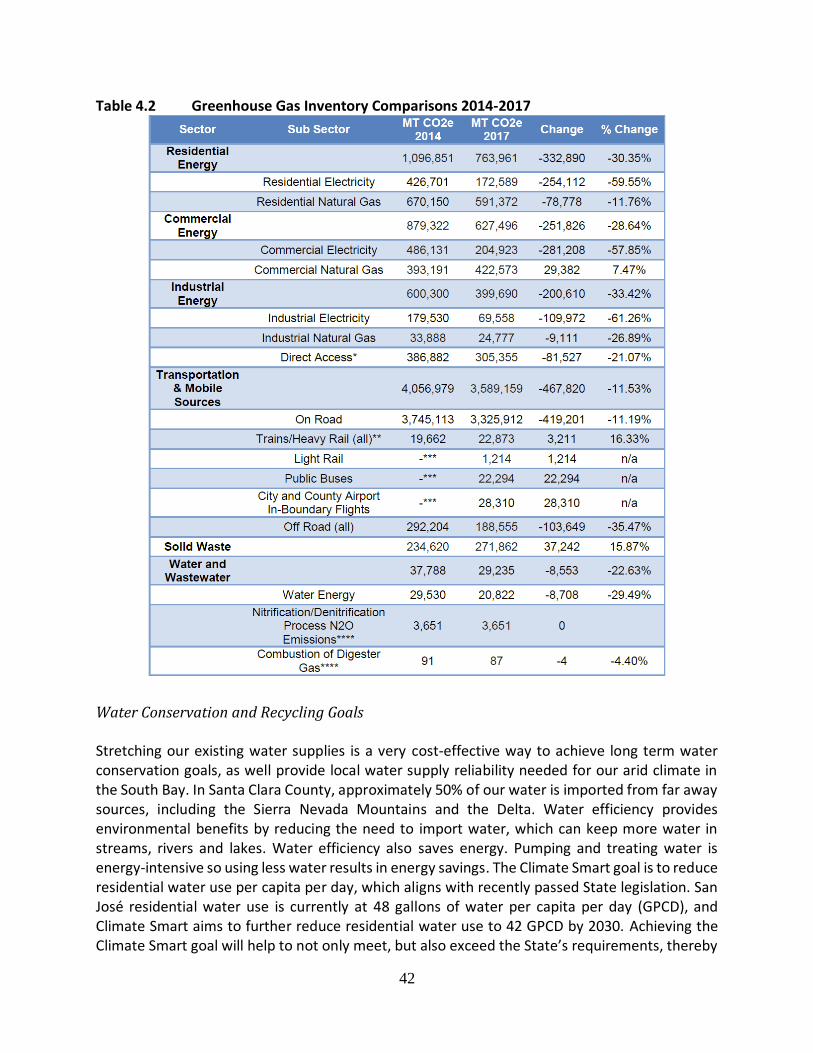
42
Table 4.2 Greenhouse Gas Inventory Comparisons 2014-2017
Water Conservation and Recycling Goals Stretching our existing water supplies is a very cost-effective way to achieve long term water conservation goals, as well provide local water supply reliability needed for our arid climate in the South Bay. In Santa Clara County, approximately 50% of our water is imported from far away sources, including the Sierra Nevada Mountains and the Delta. Water efficiency provides environmental benefits by reducing the need to import water, which can keep more water in streams, rivers and lakes. Water efficiency also saves energy. Pumping and treating water is energy-intensive so using less water results in energy savings. The Climate Smart goal is to reduce residential water use per capita per day, which aligns with recently passed State legislation. San José residential water use is currently at 48 gallons of water per capita per day (GPCD), and Climate Smart aims to further reduce residential water use to 42 GPCD by 2030. Achieving the Climate Smart goal will help to not only meet, but also exceed the State’s requirements, thereby
43
placing San José at the forefront of water efficiency. The General Plan also include goals and policies to track the City’s progress towards achieving our water conservation and recycling goals. Policy MS-17.6. Quantitatively track the City’s education program on the public use of water. Adjust the program as needed to meet Envision General Plan goals: With the Governor’s May 2016 Executive Order to “Make Conservation a Way of Life” and the considerable effort that was put towards educating the public about water supply and efficient water use, the City has remained committed to conservation programs and messaging. Beginning in 2016, Staff participate in public outreach events such as attending a San José Earthquakes game, conducting messaging at Christmas in the park, and hosting workshops in the City service area. Additional outreach was conducted through print and social media such as radio ads, magazine advertisements, LED signage, web ads and through the ESD website. Beginning in 2016, outreach was conducted providing water-savings tips in multiple languages and reached an audience of approximately 200,000. San José residents continue to receive bi-monthly reports comparing their water use to similarly-sized households and receive customized tips on how to continue to increase their water savings. Goal MS-18. Continuously improve water conservation efforts in order to achieve best in class performance. Double the City’s annual water conservation savings by 2040 and achieve half of the Water District’s goal for Santa Clara County on an annual basis: Water conservation efforts are continuing to grow and improve as programs and technologies are evaluated. As of 2016, annual water savings in San José (32 million gallons per day), represented approximately 60% of the countywide water savings of 55 million gallons per day. Policy MS-18.4. Reduce residential per capita water consumption by 25% by 2040: In 2018, Residential water consumption was 48.69 gallons per capita per day a reduction of 19 percent compared to 2009 levels (baseline for General Plan) of residential water consumption of 60 gallons per day. Policy MS-18.6. Achieve by 2040, 50 Million gallons per day of water conservation savings in San José, by reducing water use and increasing water efficiency: The City of San José is currently on track to achieve this water conservation target. Based on data from the most recent Urban Water Management Plans of the three water retailers in San José (San José Municipal Water Systems, San José Water Company, and Great Oaks Water Company), annual water savings were estimated at 32 million gallons per day citywide. Goal MS-19. Recycle or beneficially reuse 100% of the City’s wastewater supply, including the indirect use of recycled water as part of the potable water supply: For calendar year 2018, the City of San José recycled 10.6% of incoming wastewater, which was an average daily use of 11.2 million gallons per day of recycled water.
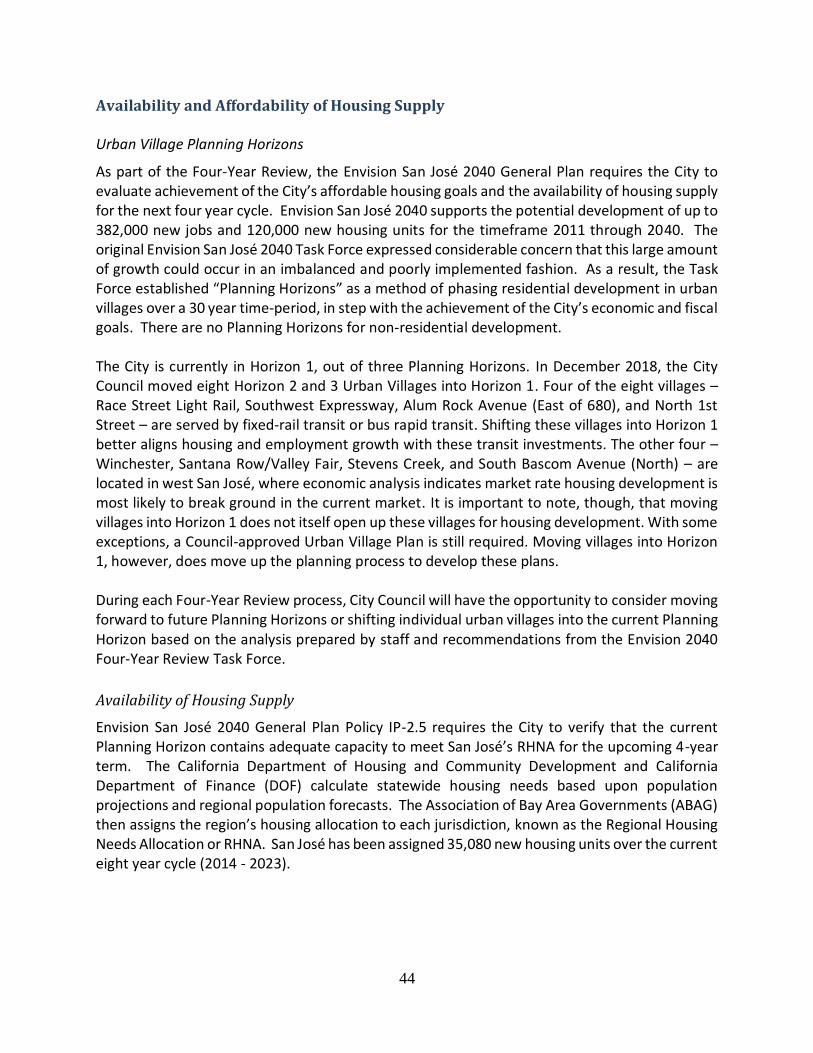
44
Availability and Affordability of Housing Supply Urban Village Planning Horizons
As part of the Four-Year Review, the Envision San José 2040 General Plan requires the City to evaluate achievement of the City’s affordable housing goals and the availability of housing supply for the next four year cycle. Envision San José 2040 supports the potential development of up to 382,000 new jobs and 120,000 new housing units for the timeframe 2011 through 2040. The original Envision San José 2040 Task Force expressed considerable concern that this large amount of growth could occur in an imbalanced and poorly implemented fashion. As a result, the Task Force established “Planning Horizons” as a method of phasing residential development in urban villages over a 30 year time-period, in step with the achievement of the City’s economic and fiscal goals. There are no Planning Horizons for non-residential development. The City is currently in Horizon 1, out of three Planning Horizons. In December 2018, the City Council moved eight Horizon 2 and 3 Urban Villages into Horizon 1. Four of the eight villages – Race Street Light Rail, Southwest Expressway, Alum Rock Avenue (East of 680), and North 1st Street – are served by fixed-rail transit or bus rapid transit. Shifting these villages into Horizon 1 better aligns housing and employment growth with these transit investments. The other four – Winchester, Santana Row/Valley Fair, Stevens Creek, and South Bascom Avenue (North) – are located in west San José, where economic analysis indicates market rate housing development is most likely to break ground in the current market. It is important to note, though, that moving villages into Horizon 1 does not itself open up these villages for housing development. With some exceptions, a Council-approved Urban Village Plan is still required. Moving villages into Horizon 1, however, does move up the planning process to develop these plans. During each Four-Year Review process, City Council will have the opportunity to consider moving forward to future Planning Horizons or shifting individual urban villages into the current Planning Horizon based on the analysis prepared by staff and recommendations from the Envision 2040 Four-Year Review Task Force.
Availability of Housing Supply
Envision San José 2040 General Plan Policy IP-2.5 requires the City to verify that the current Planning Horizon contains adequate capacity to meet San José’s RHNA for the upcoming 4-year term. The California Department of Housing and Community Development and California Department of Finance (DOF) calculate statewide housing needs based upon population projections and regional population forecasts. The Association of Bay Area Governments (ABAG) then assigns the region’s housing allocation to each jurisdiction, known as the Regional Housing Needs Allocation or RHNA. San José has been assigned 35,080 new housing units over the current eight year cycle (2014 - 2023).
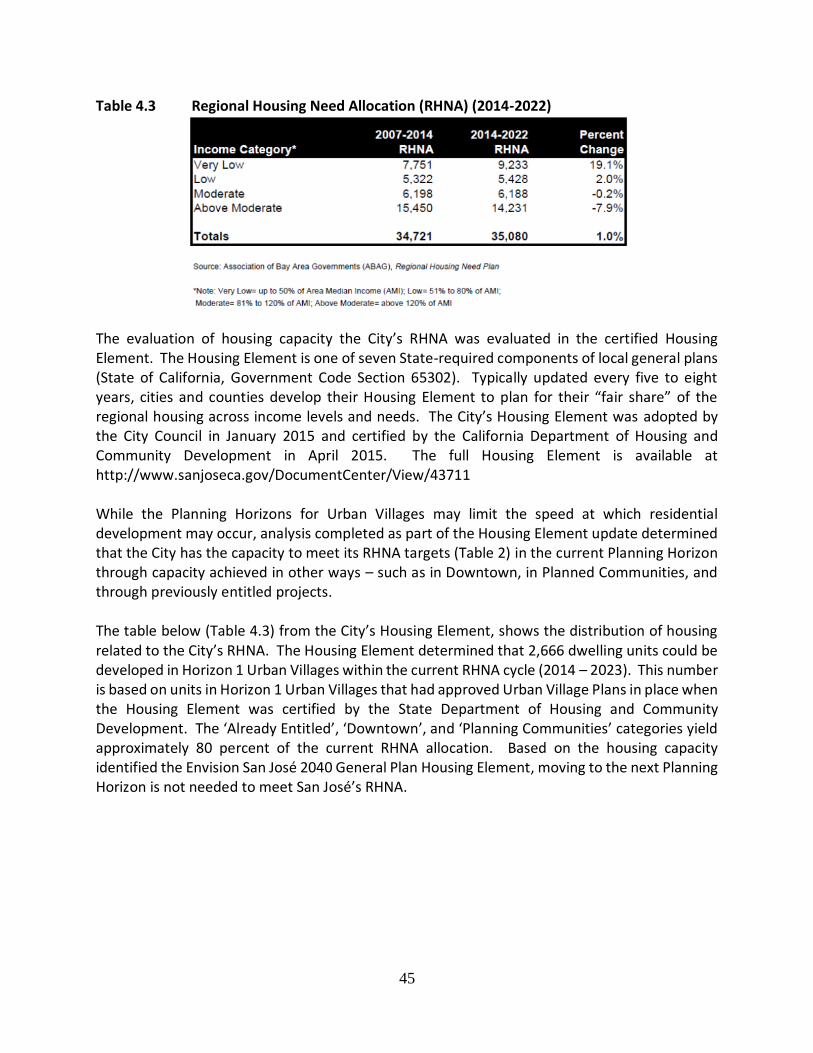
45
Table 4.3 Regional Housing Need Allocation (RHNA) (2014-2022)
The evaluation of housing capacity the City’s RHNA was evaluated in the certified Housing Element. The Housing Element is one of seven State-required components of local general plans (State of California, Government Code Section 65302). Typically updated every five to eight years, cities and counties develop their Housing Element to plan for their “fair share” of the regional housing across income levels and needs. The City’s Housing Element was adopted by the City Council in January 2015 and certified by the California Department of Housing and Community Development in April 2015. The full Housing Element is available at http://www.sanjoseca.gov/DocumentCenter/View/43711 While the Planning Horizons for Urban Villages may limit the speed at which residential development may occur, analysis completed as part of the Housing Element update determined that the City has the capacity to meet its RHNA targets (Table 2) in the current Planning Horizon through capacity achieved in other ways – such as in Downtown, in Planned Communities, and through previously entitled projects. The table below (Table 4.3) from the City’s Housing Element, shows the distribution of housing related to the City’s RHNA. The Housing Element determined that 2,666 dwelling units could be developed in Horizon 1 Urban Villages within the current RHNA cycle (2014 – 2023). This number is based on units in Horizon 1 Urban Villages that had approved Urban Village Plans in place when the Housing Element was certified by the State Department of Housing and Community Development. The ‘Already Entitled’, ‘Downtown’, and ‘Planning Communities’ categories yield approximately 80 percent of the current RHNA allocation. Based on the housing capacity identified the Envision San José 2040 General Plan Housing Element, moving to the next Planning Horizon is not needed to meet San José’s RHNA.
46
Table 4.4 Distribution of Housing Units Planned During the RHNA Period (2014-2022)
In addition, the December 2018 City Council approved shift of eight Urban Villages to Horizon 1 (16,349 planned units), and 4,000 planned units from Horizon 3 Urban Villages to the Downtown (as part of the Downtown Strategy 2040), significantly increased the capacity of planned housing units currently available for entitlement and development.
Affordability of Housing Supply
As mentioned above, San José has been assigned 35,080 new housing units over the current eight year RHNA cycle (2014 - 2023). Of the 35,080 units, approximately 60 percent are assigned as affordable units (see Table 1). Meeting this goal will be difficult due to a variety of challenges in providing affordable housing. Between 2014 and 2018, San José issued building permits for approximately 14,638 new residential units, of which approximately 2,781 (19 percent) were affordable units. The disparity reflects the continued strength of market-rate housing and the challenges in the provision of affordable housing. One of the primary challenges to providing affordable housing is dissolution of the San José Redevelopment Agency in 2011. Without the Redevelopment Agency, an estimated $40 million annually is no longer available to fund affordable housing, and no permanent source of funding identified to fill this gap. Other challenges to building affordable housing include the price of land in San José and construction costs in the Bay Area.
47
Recently-created county and state funding sources for affordable housing production are helping to address this funding gap. Since its passage in November 2016, Santa Clara County Measure A has provided over $122 million in funding for 891 units of affordable housing, including 508 supportive housing units, to be completed by 2022 countywide. The Measure is also funding the rehabilitation of 484 units, including 201 supportive housing units, which should be occupied by the end of 2020. In 2017, the State Legislature passed SB 2, which creates a recording fee on certain real estate transactions. While the exact amount will vary depending on the number of real estate recordings, the City is estimated to receive approximately $3.4 million per year from the fee. Additionally, Proposition 1, which passed in 2018, authorizes $4 billion in state bonds for affordable housing and veterans’ loan programs. Approximately $3 billion of the total will fund the State’s affordable housing rental developments and homeownership programs. The City may be eligible for these funds, although it may be required to provide a matching funding source. To meet San José’s RHNA, the City’s Housing Element includes a multi-component work plan including new construction, rehabilitation, and preservation of affordable housing units, as well as activities to end homelessness, promote equitable development, and create healthy and sustainable communities and neighborhoods. The City has also adopted ordinances, described in more detail below, to support affordable housing associated with new market-rate for-sale and rental projects. Housing Crisis Workplan
In September 2017, the Mayor issued a memorandum entitled “Responding to the Housing Crisis.” The memo set a citywide goal of 25,000 homes, at least 10,000 of those affordable, be constructed or approved by 2022. The memo also identified a large number of items to address the housing crisis. In June 2018, City Council approved a Housing Crisis Workplan developed by Office of Economic Development, Planning, and Housing staff that prioritized implementation of policy actions to facilitate the development of 15,000 market-rate and 10,000 affordable residential units by 2022. Progress toward the goal is based on housing units that have been entitled, units issued building permits, and units completed. Overall, in the first eighteen months of the five-year goal, approximately 30% of the City’s 25,000-unit goal is entitled (2,367), under construction (4,274), or completed (1,432). Key workplan items that City staff is currently working on includes amendments to the North San Jose Area Development Policy to allow a limited amount of residential development (8,000 units) to move forward, development of an Affordable Housing Siting Policy (previously Dispersion Policy), a Commercial Linkage Fee, and assemblage of funds, such as grants, to help build housing in San Jose. For the Affordable Housing Siting Policy, staff is procuring a consultant to analyze factors that would influence where affordable housing is built and to provide recommendations to create a policy. A nexus and feasibility study is being prepared for the Commercial Linkage Fee work item to identify appropriate fee levels for new non-residential development to fund affordable
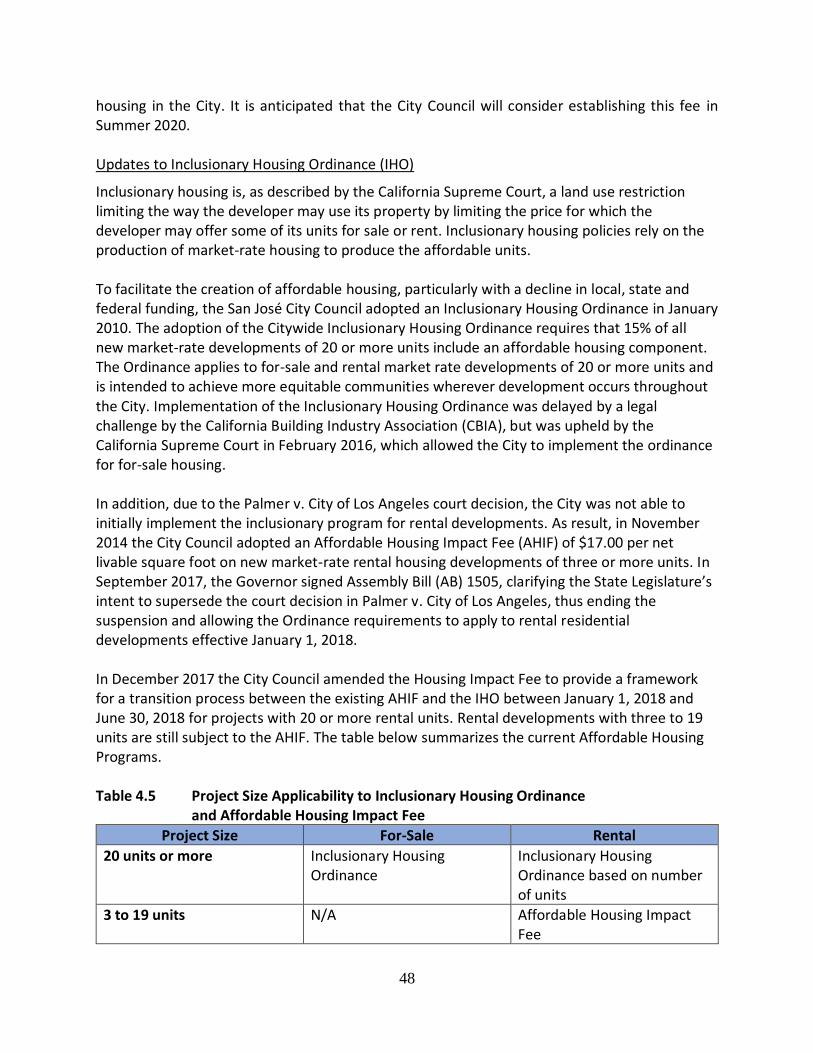
48
housing in the City. It is anticipated that the City Council will consider establishing this fee in Summer 2020. Updates to Inclusionary Housing Ordinance (IHO)
Inclusionary housing is, as described by the California Supreme Court, a land use restriction limiting the way the developer may use its property by limiting the price for which the developer may offer some of its units for sale or rent. Inclusionary housing policies rely on the production of market-rate housing to produce the affordable units. To facilitate the creation of affordable housing, particularly with a decline in local, state and federal funding, the San José City Council adopted an Inclusionary Housing Ordinance in January 2010. The adoption of the Citywide Inclusionary Housing Ordinance requires that 15% of all new market-rate developments of 20 or more units include an affordable housing component. The Ordinance applies to for-sale and rental market rate developments of 20 or more units and is intended to achieve more equitable communities wherever development occurs throughout the City. Implementation of the Inclusionary Housing Ordinance was delayed by a legal challenge by the California Building Industry Association (CBIA), but was upheld by the California Supreme Court in February 2016, which allowed the City to implement the ordinance for for-sale housing. In addition, due to the Palmer v. City of Los Angeles court decision, the City was not able to initially implement the inclusionary program for rental developments. As result, in November 2014 the City Council adopted an Affordable Housing Impact Fee (AHIF) of $17.00 per net livable square foot on new market-rate rental housing developments of three or more units. In September 2017, the Governor signed Assembly Bill (AB) 1505, clarifying the State Legislature’s intent to supersede the court decision in Palmer v. City of Los Angeles, thus ending the suspension and allowing the Ordinance requirements to apply to rental residential developments effective January 1, 2018. In December 2017 the City Council amended the Housing Impact Fee to provide a framework for a transition process between the existing AHIF and the IHO between January 1, 2018 and June 30, 2018 for projects with 20 or more rental units. Rental developments with three to 19 units are still subject to the AHIF. The table below summarizes the current Affordable Housing Programs. Table 4.5 Project Size Applicability to Inclusionary Housing Ordinance
and Affordable Housing Impact Fee
Project Size For-Sale Rental
20 units or more Inclusionary Housing Ordinance
Inclusionary Housing Ordinance based on number of units
3 to 19 units N/A Affordable Housing Impact Fee
49
An October 2019 cost of development study found that except in the most favorable locations, such as west San Jose. The rents and returns are not high enough to cover the high cost of construction and most high density residential development is not likely to be built in current market conditions. The study also found that the current structure of the IHO fee incentivizes developers to pay the in-lieu fee rather than build units onsite. In response, staff proposed a series of changes to the IHO that offer more flexibility for onsite compliance options and incentivize developers to provide more onsite units without increasing net costs. Among other proposed changes, the IHO is proposed to be expanded to also include projects between 5 and 19 units, allow a wider range of AMI levels for rental housing, restructure the fee to encourage onsite compliance, allow affordable units to be located in a separate onsite building, expand offsite unit options, extend affordability periods, create separate requirements for co-living projects to reflect different project design, and extend recertification intervals to 2 years. On November 5, 2019, Council accepted these recommendations and directed the City Attorney to return with an ordinance implementing them. Council also directed Parks, Recreation and Neighborhood Services to explore clarifying whether on site 100% AMI units qualify for a park impact fee credit, and directed staff to develop market areas for in-lieu fee adjustment phase in. Ellis Act Ordinance
The Ellis Act Ordinance establishes the process by which owners of rent stabilized apartments can permanently remove their apartment buildings from the rental market. The City’s current Ellis Act Ordinance requires projects demolishing rent stabilized units that were withdrawn from the market within 5 years to re-control the number of demolished stabilized units or 50% of the newly constructed units, whichever is greater. This requirement can be waived by setting aside 20% of the newly built units as affordable. However, staff analysis and interviews with stakeholders indicated that new Class A developments charged higher rents than the rent-stabilized apartments they replaced, meaning that displaced tenants would be less likely to return to the area. In February 2019, the City Council directed staff to return with additional research on the impact of the Ellis Act Ordinance re-control provisions on new developments. In November 2019, staff returned to City Council with recommended updates to the Ellis Act Ordinance to meet the dual needs of promoting housing production and minimizing displacement of existing tenants. Staff recommended a cap on the 50% re-control requirement at no more than 7 times the number of withdrawn units, which is the amount needed to replace the withdrawn units with affordable units required under the Inclusionary Housing Ordinance. In addition, staff also recommended modifying the waiver provision from 20% onsite to 15% onsite units. The developer would also have to offer displaced tenants the opportunity to either return to the new development at the prior rent plus the rate of the Consumer Price Index for each year the building is under construction, with a 5% rent increase limit thereafter; or displaced tenants are

50
offered an equivalent apartment maintaining their current lease. On November 5, 2019, Council accepted these changes and directed the City Attorney to draft an implementation ordinance. Accessory Dwelling Units
Accessory dwelling units (ADU) are number nine on the City Council Priority List and item number three on the Housing Crisis Workplan. In 2016, City Council adopted a major update to the Accessory Dwelling Unit Ordinance to facilitate construction of ADUs by reducing minimum lot sizes and increasing allowed floor area for ADUs, allowing ADUs on properties zoned R-2 Two Family Residence that have a single family house, updating design standards, and loosening parking requirements. In 2018, the City Council further relaxed ADU regulations by additional reductions in minimum lot size and increased allowed floor area for ADUs, allowing ADUs on properties zoned RM Multiple Residence that have a single family house, allowing two story ADUs and two bedroom ADUs (on lots > 9,000 square feet), and relaxing required setbacks and other development standards. As Zoning Code regulations have been relaxed for secondary units, building permit issuance for ADUs has significantly increased. Between 2016 and 2018, there was nearly a 400 percent increase in the number of permits issued. The increase in permits issued correlates with the Ordinance updates, as demonstrated in Table 4.5. Table 4.6 Building Permits Issued for Accessory Dwelling Units
Calendar Year Permits Issued for ADUs
2016 39
2017 91
2018 190
2019 (as of October 31) 358
General Plan Hearing Cycle for Affordable Housing Projects
The Envision San José 2040 General Plan directs staff to hold one Annual Review hearing for the City Council to review and consider privately proposed General Plan text amendments or site-specific amendments of the Land Use / Transportation Diagram. This policy was adopted so that the City Council could contemplate the cumulative implications of privately proposed amendments considered during a calendar year. In January 2019 in a memo to the Rules and Open Government Committee, Mayor Liccardo and Councilmember Dev Davis recommended that an additional General Plan Amendment Hearing be held to expedite the land use approvals of affordable housing projects.
The City Council approved the recommendation in February 2019 and directed staff to return to Council with a General Plan text amendment to allow an additional hearing for privately proposed General Plan amendments for affordable housing projects. The City Council subsequently approved a City-initiated General Plan text amendment in May 2019 that established one separate General Plan Hearing cycle for non-City-initiated affordable
51
housing projects. Additionally, to ensure that affordable housing is the primary use on the affected property, the text amendment included the creation of a new Affordable Housing Priority Planning Area Overlay Designation (Overlay). The Overlay will be applied to applicants’ properties using the special hearing for affordable housing projects. As of November 2019, no affordable housing projects have used the special General Plan hearing cycle. 2019 General Plan Four-Year Review
The Envision 2040 Four-Year Review Task Force will consider several policy items during the 2019 General Plan Four-Year Review on how the General Plan can better facilitate affordable housing, with the goal of creating diverse communities with access to jobs, transit, and amenities. This includes:
• Exploring allowing single-family parcels designated Residential Neighborhood to redevelop to 2-4 units within specific parameters;
• Explore changes to commercial space requirements for affordable housing developments, particularly in Urban Villages;
• Explore policies that would allow limited housing in neighborhood business districts;
• Consider allowing mixed-income housing with a significant percentage of restricted affordable homes to proceed in urban villages ahead of a Growth Horizon.
Healthful Community Goals The Envision San José 2040 General Plan supports the physical health of community members by promoting walking and bicycling as travel options, encouraging access to healthful foods, and supporting the provision of health care and safety services.
Walking and Bicycling The Land Use and Transportation Chapter of the Envision San José 2040 General Plan includes a set of balanced, long-range, multimodal transportation goals and policies that provide for a transportation network that is safe, efficient, and sustainable. One such policy includes reducing the amount of drive alone commute trips from approximately 78 percent of all commute trips to only 40 percent of all trips. Goals to increase various other modes (e.g., bicycle, walk) accordingly are shown in Table 4.7 below.
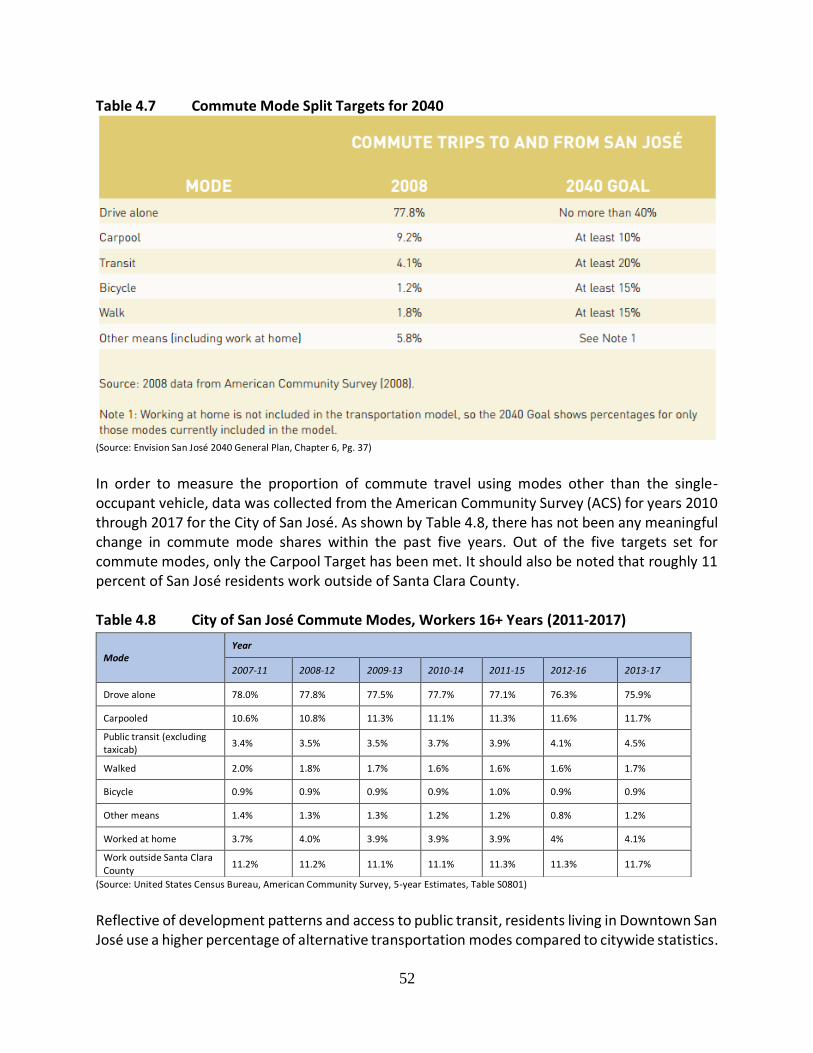
52
Table 4.7 Commute Mode Split Targets for 2040
(Source: Envision San José 2040 General Plan, Chapter 6, Pg. 37)
In order to measure the proportion of commute travel using modes other than the single-occupant vehicle, data was collected from the American Community Survey (ACS) for years 2010 through 2017 for the City of San José. As shown by Table 4.8, there has not been any meaningful change in commute mode shares within the past five years. Out of the five targets set for commute modes, only the Carpool Target has been met. It should also be noted that roughly 11 percent of San José residents work outside of Santa Clara County. Table 4.8 City of San José Commute Modes, Workers 16+ Years (2011-2017)
(Source: United States Census Bureau, American Community Survey, 5-year Estimates, Table S0801)
Reflective of development patterns and access to public transit, residents living in Downtown San José use a higher percentage of alternative transportation modes compared to citywide statistics.
Mode Year
2007-11 2008-12 2009-13 2010-14 2011-15 2012-16 2013-17
Drove alone 78.0% 77.8% 77.5% 77.7% 77.1% 76.3% 75.9%
Carpooled 10.6% 10.8% 11.3% 11.1% 11.3% 11.6% 11.7%
Public transit (excluding taxicab)
3.4% 3.5% 3.5% 3.7% 3.9% 4.1% 4.5%
Walked 2.0% 1.8% 1.7% 1.6% 1.6% 1.6% 1.7%
Bicycle 0.9% 0.9% 0.9% 0.9% 1.0% 0.9% 0.9%
Other means 1.4% 1.3% 1.3% 1.2% 1.2% 0.8% 1.2%
Worked at home 3.7% 4.0% 3.9% 3.9% 3.9% 4% 4.1%
Work outside Santa Clara County
11.2% 11.2% 11.1% 11.1% 11.3% 11.3% 11.7%

53
Between 2013 and 2017, commute modes of Downtown residents included 18% used public transportation (excluding taxicab), 6.7% walked, and 1.4% biked. Although less than citywide statistics, a large portion of Downtown residents commute outside of Downtown for work with approximately 63.7% drove alone between 2013 and 2017.
Other measures of determining whether San José is achieving a balanced transportation network include WalkScore, BikeScore, and TransitScore. These annual online assessments measure a geographical area’s walkability, bikeability, and
access to public transit. As of 2019, San José has a WalkScore of 51 out of 100 (somewhat walkable), a BikeScore of 59 out of 100 (bikeable – some bike infrastructure), and a TransitScore of 41 out of 100 (some transit). The City’s WalkScore increased by three points, TransitScore remained the same, and Bike Score increased by two points since the previous four-year review progress report. Bay Area Bike Share
In 2013, Bay Area Bike Share was introduced as a pilot program for the region. In December 2015, City Council unanimously approved plans to expand San José’s bike share program to 1,000 bicycles with 100 parking stations over the next two years. In 2017, Motivate, the bike share operator, reinvented their bike share system with FordGo Bike and replaced existing equipment with new stations and bicycles. In 2017, the City hosted 45 bike share stations. During 2018, the City planned to add 38 more stations to its system for a total of 83 stations. As of August 2019, the City has 72 stations. Complete build-out of the 83 stations is expected in the next 3-6 months. During summer 2018, in partnership with the City, Ford GoBike started to pilot a 200 bike “dockless” bike share system in North San José. However, Motivate was purchased by Lyft in 2019 and discontinued the dockless pilot and replaced it with a “hybrid” e-bike system (bikes that can be docked or left dockless). The system is known as Bay Wheels. State law provides only basic guidance on regulating bike share systems and e-bikes/e-scooters. DOT has created a new regulatory framework and permit system, coordinated with City Attorney's Office, and adopted by Council in December 2018. This framework applies to "micro-mobility" devices, such as e-scooters. DOT has issued three permits to e-scooter companies, allowing for a total of up to 4,400 scooters. Currently, Lyft (owner of Bay Wheels) have the exclusive right to operate bike share in San José, as granted by the City Council in 2015. Thus, the City will not be issuing any permits to bike share operators for the time-being. Vision Zero San José. A key to transportation mode shift is ensuring that streets are safe for all users: children, elderly, bicyclists, and pedestrians, among others. To improve traffic safety, the City launched Vision Zero San José in April 2015. Vision Zero San José seeks to create a community culture that prioritizes traffic safety and ensures that incidents on the City’s roadways do not result in severe injury or death. Vision Zero San José also identifies Safety Priority Streets, or street
54
segments that have the greatest need for roadway safety improvements, as they have the highest frequency of fatal and severe injuries. In 2017, the Department of Transportation (DOT) expanded the scope of this program from the original 14 Safety Priority Streets; two of the original corridors were extended and three new corridors were added to the program based on the extensive collision and conditions data analysis. This fiscal year, an updated Two-Year Action Plan will be ready in Fall 2019 to expand action to improve safety for active transportation through physical changes, as well as through community education, enforcement, technology, and supporting policies.
Access to Healthful Foods
In order to encourage healthy eating and improve access to healthful foods, a variety of farmer-to-table initiatives have been implemented throughout the community. For example, there are 11 weekly farmer’s markets throughout the City of San José, varying in times and location. In addition to local farmer’s markets, there are several successful urban farms in San José. For example, Veggielution, a 6-acre non-profit community farm at Emma Prusch Farm Park, seeks to create a sustainable food system in San José by teaching the community the importance of eating healthy locally grown food. Volunteer workdays, youth programs, and free community workshops provide the community an opportunity to participate in hands-on activities focused on growing fresh fruits and vegetables. Veggielution also donates produce that it does not sell at their farm stand to local food banks. Additionally, Garden to Table operates a one-acre urban agricultural farm on a vacant lot north of the Downtown. The farm, which was opened in 2013, provides access to fresh produce and educates the broader community on growing their own food. Furthermore, the Santee Open Space and Community Garden opened in 2015, creating locally grown food and a gathering space for the neighborhood. In total, there are 19 active community gardens, totaling approximately 22 acres within the San José city limits. The City adopted the Urban Agriculture Incentive Zone (UAIZ) Ordinance in the fall of 2016. The ordinance created a UAIZ program which allows owners with qualified parcels between 0.1 and 1 acres to apply for a UAIZ contract with the City. Under the UAIZ Program, property owners are required to develop and maintain urban agricultural activities on the parcel. In exchange, the County Assessor is able to reduce the assessed value of the property to the value of irrigated cropland, which can result in significant tax savings. This program helps to carry out General Plan policies related to the promotion of urban agriculture to increase access to healthful foods (particularly in low-income or nutritionally-deficient areas), the availability of local/regionally grown foods, and urban food production. One UAIZ contract was approved in 2016 for Valley Verde on the southwest portion of West San Carlos and Gifford Streets. The site has been operating for five years with the contract ending this year. Valley Verde is planning to not renew their contract and to relocate their operations.
55
Viva CalleSJ On October 2015, PRNS hosted the first Viva CalleSJ event – a free program that temporarily closes San José streets to bring community members together to explore traveling and using the streets without vehicles, such as biking, skating, and walking. Viva CalleSJ has been coordinated in partnership with other city departments including DOT, Police, Fire, and Environmental Services, as well as multiple community partners. To date, five Viva CalleSJ events have been held, totally approximately 400,000 participants. Viva Parks VIVA PARKS! is a PRNS program that brought families together to enjoy summertime activities focusing on health and wellness, physical exercise, and community engagement. The thirteen week series featured a variety of events, including healthy food demonstrations, resources tables, cultural dance performances, bounce houses, group games and classes, free movie nights, and special activities like a climbing wall, skate competitions and hay rides. Four series have been held to date with over 20,000 community participants.
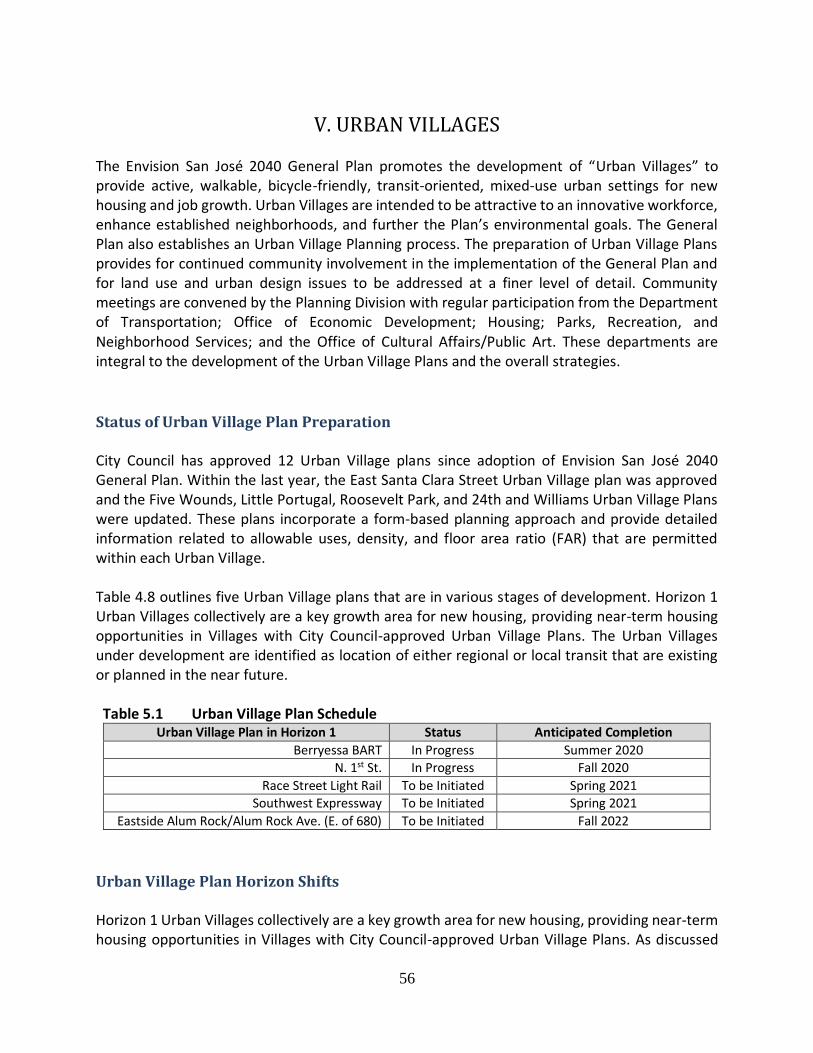
56
V. URBAN VILLAGES The Envision San José 2040 General Plan promotes the development of “Urban Villages” to provide active, walkable, bicycle-friendly, transit-oriented, mixed-use urban settings for new housing and job growth. Urban Villages are intended to be attractive to an innovative workforce, enhance established neighborhoods, and further the Plan’s environmental goals. The General Plan also establishes an Urban Village Planning process. The preparation of Urban Village Plans provides for continued community involvement in the implementation of the General Plan and for land use and urban design issues to be addressed at a finer level of detail. Community meetings are convened by the Planning Division with regular participation from the Department of Transportation; Office of Economic Development; Housing; Parks, Recreation, and Neighborhood Services; and the Office of Cultural Affairs/Public Art. These departments are integral to the development of the Urban Village Plans and the overall strategies.
Status of Urban Village Plan Preparation City Council has approved 12 Urban Village plans since adoption of Envision San José 2040 General Plan. Within the last year, the East Santa Clara Street Urban Village plan was approved and the Five Wounds, Little Portugal, Roosevelt Park, and 24th and Williams Urban Village Plans were updated. These plans incorporate a form-based planning approach and provide detailed information related to allowable uses, density, and floor area ratio (FAR) that are permitted within each Urban Village. Table 4.8 outlines five Urban Village plans that are in various stages of development. Horizon 1 Urban Villages collectively are a key growth area for new housing, providing near-term housing opportunities in Villages with City Council-approved Urban Village Plans. The Urban Villages under development are identified as location of either regional or local transit that are existing or planned in the near future. Table 5.1 Urban Village Plan Schedule
Urban Village Plan in Horizon 1 Status Anticipated Completion
Berryessa BART In Progress Summer 2020 N. 1st St. In Progress Fall 2020
Race Street Light Rail To be Initiated Spring 2021
Southwest Expressway To be Initiated Spring 2021
Eastside Alum Rock/Alum Rock Ave. (E. of 680) To be Initiated Fall 2022
Urban Village Plan Horizon Shifts Horizon 1 Urban Villages collectively are a key growth area for new housing, providing near-term housing opportunities in Villages with City Council-approved Urban Village Plans. As discussed
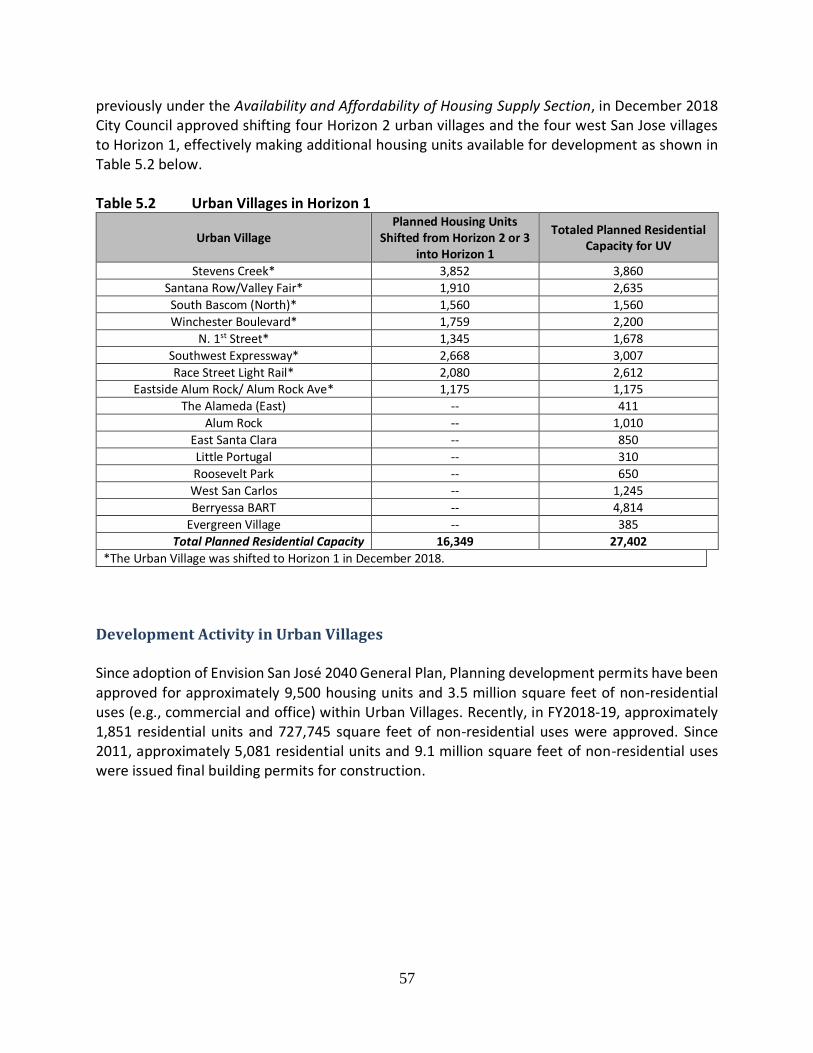
57
previously under the Availability and Affordability of Housing Supply Section, in December 2018 City Council approved shifting four Horizon 2 urban villages and the four west San Jose villages to Horizon 1, effectively making additional housing units available for development as shown in Table 5.2 below. Table 5.2 Urban Villages in Horizon 1
Urban Village Planned Housing Units
Shifted from Horizon 2 or 3 into Horizon 1
Totaled Planned Residential Capacity for UV
Stevens Creek* 3,852 3,860
Santana Row/Valley Fair* 1,910 2,635
South Bascom (North)* 1,560 1,560
Winchester Boulevard* 1,759 2,200
N. 1st Street* 1,345 1,678
Southwest Expressway* 2,668 3,007
Race Street Light Rail* 2,080 2,612 Eastside Alum Rock/ Alum Rock Ave* 1,175 1,175
The Alameda (East) -- 411
Alum Rock -- 1,010
East Santa Clara -- 850
Little Portugal -- 310
Roosevelt Park -- 650
West San Carlos -- 1,245
Berryessa BART -- 4,814
Evergreen Village -- 385
Total Planned Residential Capacity 16,349 27,402
*The Urban Village was shifted to Horizon 1 in December 2018.
Development Activity in Urban Villages Since adoption of Envision San José 2040 General Plan, Planning development permits have been approved for approximately 9,500 housing units and 3.5 million square feet of non-residential uses (e.g., commercial and office) within Urban Villages. Recently, in FY2018-19, approximately 1,851 residential units and 727,745 square feet of non-residential uses were approved. Since 2011, approximately 5,081 residential units and 9.1 million square feet of non-residential uses were issued final building permits for construction.
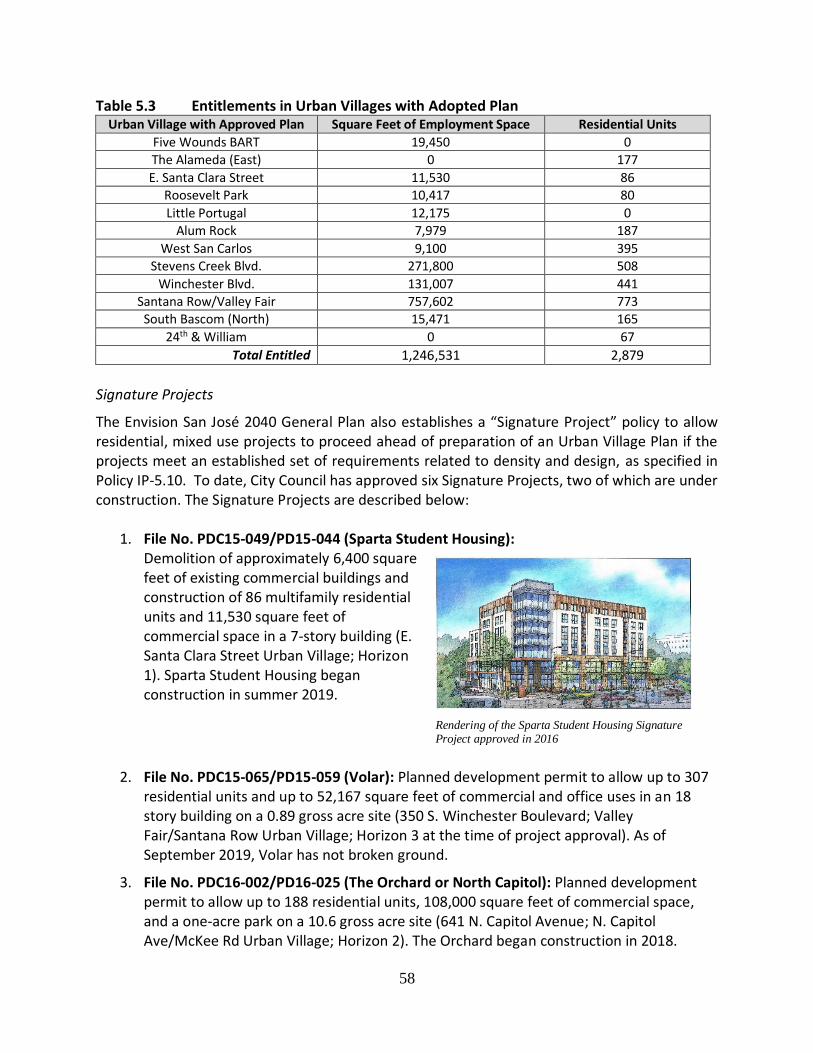
58
Table 5.3 Entitlements in Urban Villages with Adopted Plan Urban Village with Approved Plan Square Feet of Employment Space Residential Units
Five Wounds BART 19,450 0
The Alameda (East) 0 177
E. Santa Clara Street 11,530 86 Roosevelt Park 10,417 80
Little Portugal 12,175 0
Alum Rock 7,979 187
West San Carlos 9,100 395
Stevens Creek Blvd. 271,800 508
Winchester Blvd. 131,007 441 Santana Row/Valley Fair 757,602 773
South Bascom (North) 15,471 165
24th & William 0 67
Total Entitled 1,246,531 2,879
Signature Projects
The Envision San José 2040 General Plan also establishes a “Signature Project” policy to allow residential, mixed use projects to proceed ahead of preparation of an Urban Village Plan if the projects meet an established set of requirements related to density and design, as specified in Policy IP-5.10. To date, City Council has approved six Signature Projects, two of which are under construction. The Signature Projects are described below:
1. File No. PDC15-049/PD15-044 (Sparta Student Housing): Demolition of approximately 6,400 square feet of existing commercial buildings and construction of 86 multifamily residential units and 11,530 square feet of commercial space in a 7-story building (E. Santa Clara Street Urban Village; Horizon 1). Sparta Student Housing began construction in summer 2019.
2. File No. PDC15-065/PD15-059 (Volar): Planned development permit to allow up to 307 residential units and up to 52,167 square feet of commercial and office uses in an 18 story building on a 0.89 gross acre site (350 S. Winchester Boulevard; Valley Fair/Santana Row Urban Village; Horizon 3 at the time of project approval). As of September 2019, Volar has not broken ground.
3. File No. PDC16-002/PD16-025 (The Orchard or North Capitol): Planned development permit to allow up to 188 residential units, 108,000 square feet of commercial space, and a one-acre park on a 10.6 gross acre site (641 N. Capitol Avenue; N. Capitol Ave/McKee Rd Urban Village; Horizon 2). The Orchard began construction in 2018.
Rendering of the Sparta Student Housing Signature Project approved in 2016
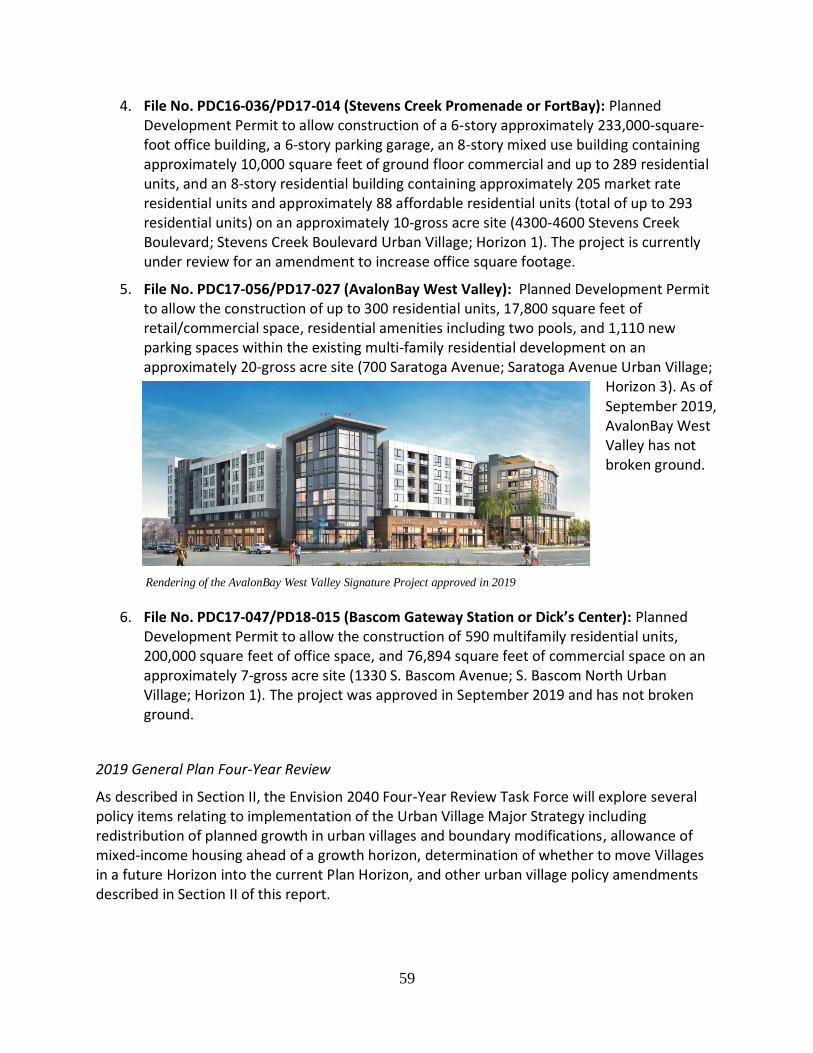
59
4. File No. PDC16-036/PD17-014 (Stevens Creek Promenade or FortBay): Planned Development Permit to allow construction of a 6-story approximately 233,000-square-foot office building, a 6-story parking garage, an 8-story mixed use building containing approximately 10,000 square feet of ground floor commercial and up to 289 residential units, and an 8-story residential building containing approximately 205 market rate residential units and approximately 88 affordable residential units (total of up to 293 residential units) on an approximately 10-gross acre site (4300-4600 Stevens Creek Boulevard; Stevens Creek Boulevard Urban Village; Horizon 1). The project is currently under review for an amendment to increase office square footage.
5. File No. PDC17-056/PD17-027 (AvalonBay West Valley): Planned Development Permit to allow the construction of up to 300 residential units, 17,800 square feet of retail/commercial space, residential amenities including two pools, and 1,110 new parking spaces within the existing multi-family residential development on an approximately 20-gross acre site (700 Saratoga Avenue; Saratoga Avenue Urban Village;
Horizon 3). As of September 2019, AvalonBay West Valley has not broken ground.
6. File No. PDC17-047/PD18-015 (Bascom Gateway Station or Dick’s Center): Planned Development Permit to allow the construction of 590 multifamily residential units, 200,000 square feet of office space, and 76,894 square feet of commercial space on an approximately 7-gross acre site (1330 S. Bascom Avenue; S. Bascom North Urban Village; Horizon 1). The project was approved in September 2019 and has not broken ground.
2019 General Plan Four-Year Review
As described in Section II, the Envision 2040 Four-Year Review Task Force will explore several policy items relating to implementation of the Urban Village Major Strategy including redistribution of planned growth in urban villages and boundary modifications, allowance of mixed-income housing ahead of a growth horizon, determination of whether to move Villages in a future Horizon into the current Plan Horizon, and other urban village policy amendments described in Section II of this report.
Rendering of the AvalonBay West Valley Signature Project approved in 2019
60
VI. NEXT STEPS
As directed by the Envision San José 2040 General Plan, the reconvened Envision San José 2040 Task Force is responsible for evaluating success in the achievement of key goals and recommending mid-course adjustments needed to improve implementation of the Plan (see Section II of this report). The City Council approved a scope of work in June 2019 that identifies policy work items for the Four-Year Review that are intended to advance implementation of the General Plan. Over the next six months (November 2019 to April 2020) the Envision San José 2040 Four-Year Review Task Force will meet to evaluate and consider focused adjustments to the General Plan. The Envision 2040 Four-Year Review Task Force will conclude with recommendations to the City Council. The City Council will evaluate input from the Task Force and consider General Plan amendments to implement the recommendations developed during the Envision San José 2040 Four-Year Review Task Force process.