Embed Size (px)
Citation preview
ORIGINAL RESEARCH ARTICLEpublished: 02 December 2013doi: 10.3389/fncel.2013.00231
Four-dimensional multi-site photolysis of cagedneurotransmittersMary Ann Go1, Minh-Son To1,2, Christian Stricker1,3, Stephen Redman1, Hans-A. Bachor4,
Greg J. Stuart1 and Vincent R. Daria1*
1 Eccles Institute of Neuroscience, John Curtin School of Medical Research, The Australian National University, Canberra, ACT, Australia2 Department of Human Physiology and Centre for Neuroscience, Flinders University, Adelaide, SA, Australia3 Medical School, College of Medicine, Biology and Environment, The Australian National University, Canberra, ACT, Australia4 Department of Quantum Science, Research School of Physics and Engineering, The Australian National University, Canberra, ACT, Australia
Edited by:
Michael Hausser, University CollegeLondon, UK
Reviewed by:
Stéphane Dieudonné, IBENS, FranceJeff Magee, Howard HuguesMedical Institute, USA
*Correspondence:
Vincent R. Daria, John Curtin Schoolof Medical Research, The AustralianNational University, Bldg. 131 GarranRoad, Canberra , ACT 0200,Australiae-mail: [email protected]
Neurons receive thousands of synaptic inputs that are distributed in space and time.The systematic study of how neurons process these inputs requires a technique tostimulate multiple yet highly targeted points of interest along the neuron’s dendritictree. Three-dimensional multi-focal patterns produced via holographic projection combinedwith two-photon photolysis of caged compounds can provide for highly localized releaseof neurotransmitters within each diffraction-limited focus, and in this way emulatesimultaneous synaptic inputs to the neuron. However, this technique so far cannotachieve time-dependent stimulation patterns due to fundamental limitations of thehologram-encoding device and other factors that affect the consistency of controlledsynaptic stimulation. Here, we report an advanced technique that enables the designand application of arbitrary spatio-temporal photostimulation patterns that resemblephysiological synaptic inputs. By combining holographic projection with a programmablehigh-speed light-switching array, we have overcome temporal limitations with holographicprojection, allowing us to mimic distributed activation of synaptic inputs leading toaction potential generation. Our experiments uniquely demonstrate multi-site two-photonglutamate uncaging in three dimensions with submillisecond temporal resolution.Implementing this approach opens up new prospects for studying neuronal synapticintegration in four dimensions.
Keywords: two-photon photolysis, holographic projection, two-photon microscopy, caged neurotransmitters,
synaptic integration
1. INTRODUCTIONPhotostimulation using caged neurotransmitters (Callaway andKatz, 1993; Denk, 1994) and light-activated ion channels (Nagelet al., 2003; Boyden et al., 2005) have revolutionized the capacityto study the brain. Information processing in neuronal networksis achieved via signaling between neurons at synapses. Thus, con-trolled and localized activation of synapses offers the possibility tosystematically study how individual neurons in the brain processinformation. Two-photon (2P) photolysis of caged compoundsallows the simulation of highly localized release of neurotransmit-ter, enabling targeted activation of receptors at single synapses.Through activation of multiple synapses, it is possible to studyhow neurons integrate synaptic inputs to generate action poten-tials (APs). However, to date it has not been possible to activatesynapses arbitrarily along the three-dimensional dendritic arborof a neuron using realistic spatio-temporal [i.e., four-dimensional(4D)] patterns of light that resemble physiological inputs.
Laser-scanning systems utilizing galvanometer (GM) mirrors(Gasparini and Magee, 2001; Matsuzaki et al., 2001; Branco et al.,2010) implemented in conventional two-photon laser-scanningmicroscopes provide quasi-simultaneous multi-site stimulationby scanning the laser beam at fast rates (∼10 kHz; i.e., switch-ing time of ∼100 μs). These scanning systems, however, are
two-dimensional and are restricted to a single optical plane. Ahigh-speed 3D scanning system has been described utilizing fouracousto-optic modulators (AOMs) (Reddy et al., 2008). This sys-tem has been used to monitor neuronal activity via calciumimaging (Reddy et al., 2008; Katona et al., 2012). However, usingfour AOMs results in low optical throughput, and the disper-sion through the AOM crystal significantly decreases 2P efficiencydue to pulse broadening. Consequently, such a system has notbeen utilized for multi-site photolysis of caged neurotransmittersin 3D.
Beam-shaping techniques using a spatial light modulator(SLM) can split a single laser beam into several beamlets andgenerate arbitrary illumination patterns for photostimulation.These techniques have been demonstrated for photostimulationwith shaped illumination in single-photon (1P) (Lutz et al.,2008; Zahid et al., 2010) and 2P (Dal Maschio et al., 2010;Papagiakoumou et al., 2010), and for a multi-foci photostimula-tion pattern in 1P (Anselmi et al., 2011; Yang et al., 2011) and2P (Nikolenko et al., 2008). 1P excitation exhibits poor local-ized excitation along the optical axis. While 2P photostimulationoffers the required axial resolution, previous studies have onlyshowed stimulation in a single plane. We recently demonstrated2P photolysis of caged neurotransmitters using holographic
Frontiers in Cellular Neuroscience www.frontiersin.org December 2013 | Volume 7 | Article 231 | 1
CELLULAR NEUROSCIENCE
Go et al. 4D multi-site photostimulation
projection of an arbitrary 3D multi-foci uncaging pattern (Goet al., 2012). While holographic projection allows simultane-ous multi-site photostimulation in 3D, the slow response of theSLM (∼10–30 ms) remains the limiting factor in achieving fastswitching light patterns within physiologically relevant timescales(∼1 ms). Here, we overcome this limitation by temporally gat-ing the 3D multi-foci uncaging pattern generated by the SLMusing a high-speed spatial light switching array provided by adigital micro-mirror device (DMD). The programmable array ofmicro-mirrors can be used to independently control each beamletin less than a millisecond (∼0.7 ms) allowing the multi-site pat-tern to be changed with submillisecond speed. Random spatialstimulation patterns in 3D are therefore possible within physi-ologically relevant timescales. We demonstrate the performanceof such a system as a tool for studying neuronal integration byuncaging glutamate at multiple foci with submillisecond resolu-tion and thereby stimulate dendritic spines on different dendriticbranches.
2. MATERIALS AND METHODS2.1. MICROSCOPE DESIGNOur time-gated holographic microscope system employs an SLM,encoded with a phase hologram to generate a multi-focal excita-tion pattern from the incident laser beam, and a DMD, which actsas a spatial light switch allowing independent switching of theindividual foci. The resulting spatio-temporal excitation patternis used for glutamate uncaging. We also use GM scanning mirrors
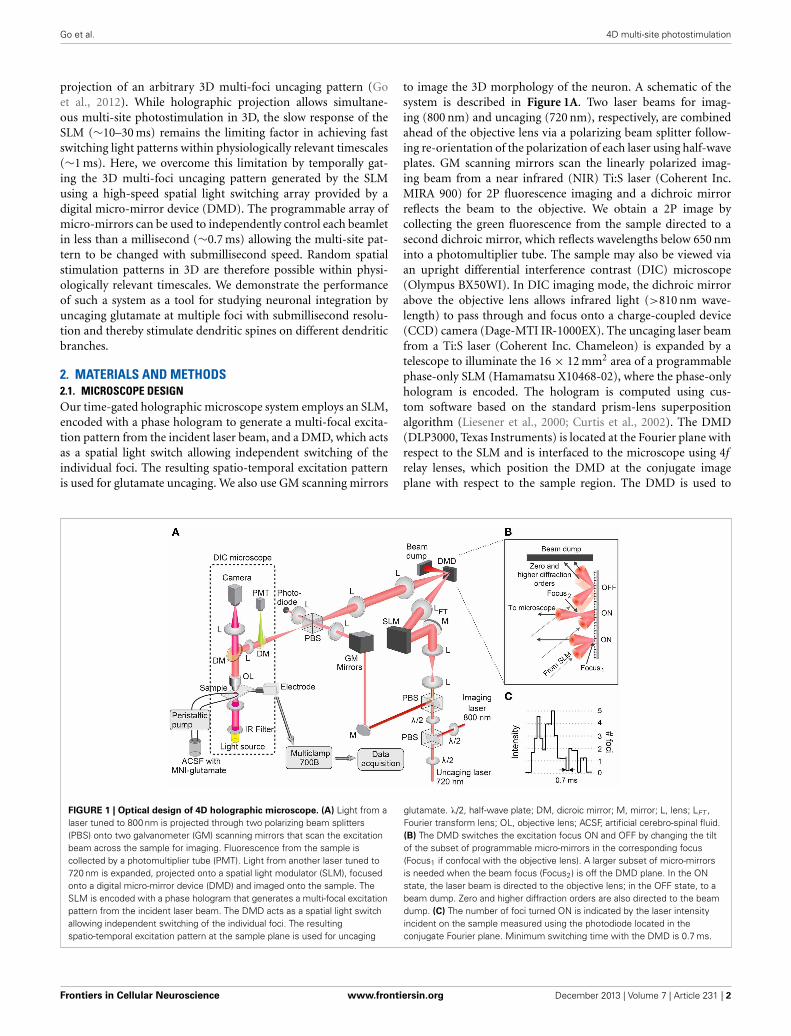
to image the 3D morphology of the neuron. A schematic of thesystem is described in Figure 1A. Two laser beams for imag-ing (800 nm) and uncaging (720 nm), respectively, are combinedahead of the objective lens via a polarizing beam splitter follow-ing re-orientation of the polarization of each laser using half-waveplates. GM scanning mirrors scan the linearly polarized imag-ing beam from a near infrared (NIR) Ti:S laser (Coherent Inc.MIRA 900) for 2P fluorescence imaging and a dichroic mirrorreflects the beam to the objective. We obtain a 2P image bycollecting the green fluorescence from the sample directed to asecond dichroic mirror, which reflects wavelengths below 650 nminto a photomultiplier tube. The sample may also be viewed viaan upright differential interference contrast (DIC) microscope(Olympus BX50WI). In DIC imaging mode, the dichroic mirrorabove the objective lens allows infrared light (>810 nm wave-length) to pass through and focus onto a charge-coupled device(CCD) camera (Dage-MTI IR-1000EX). The uncaging laser beamfrom a Ti:S laser (Coherent Inc. Chameleon) is expanded by atelescope to illuminate the 16 × 12 mm2 area of a programmablephase-only SLM (Hamamatsu X10468-02), where the phase-onlyhologram is encoded. The hologram is computed using cus-tom software based on the standard prism-lens superpositionalgorithm (Liesener et al., 2000; Curtis et al., 2002). The DMD(DLP3000, Texas Instruments) is located at the Fourier plane withrespect to the SLM and is interfaced to the microscope using 4frelay lenses, which position the DMD at the conjugate imageplane with respect to the sample region. The DMD is used to
FIGURE 1 | Optical design of 4D holographic microscope. (A) Light from alaser tuned to 800 nm is projected through two polarizing beam splitters(PBS) onto two galvanometer (GM) scanning mirrors that scan the excitationbeam across the sample for imaging. Fluorescence from the sample iscollected by a photomultiplier tube (PMT). Light from another laser tuned to720 nm is expanded, projected onto a spatial light modulator (SLM), focusedonto a digital micro-mirror device (DMD) and imaged onto the sample. TheSLM is encoded with a phase hologram that generates a multi-focal excitationpattern from the incident laser beam. The DMD acts as a spatial light switchallowing independent switching of the individual foci. The resultingspatio-temporal excitation pattern at the sample plane is used for uncaging
glutamate. λ/2, half-wave plate; DM, dicroic mirror; M, mirror; L, lens; LFT ,Fourier transform lens; OL, objective lens; ACSF, artificial cerebro-spinal fluid.(B) The DMD switches the excitation focus ON and OFF by changing the tiltof the subset of programmable micro-mirrors in the corresponding focus(Focus1 if confocal with the objective lens). A larger subset of micro-mirrorsis needed when the beam focus (Focus2) is off the DMD plane. In the ONstate, the laser beam is directed to the objective lens; in the OFF state, to abeam dump. Zero and higher diffraction orders are also directed to the beamdump. (C) The number of foci turned ON is indicated by the laser intensityincident on the sample measured using the photodiode located in theconjugate Fourier plane. Minimum switching time with the DMD is 0.7 ms.
Frontiers in Cellular Neuroscience www.frontiersin.org December 2013 | Volume 7 | Article 231 | 2
Go et al. 4D multi-site photostimulation
individually switch each beamlet of the excitation pattern ON orOFF. In the ON state, the micro-mirrors direct the laser light tothe sample (see Figure 1B). In the OFF state, the laser light isdirected to a beam dump. The relay lenses are chosen to ensurethat the back aperture of the objective lens is filled and that thearea of the DMD encompasses the field of view of the objectivelens (200 μm2 for a 1.0 NA 40× objective).
The dimension of one micro-mirror in the DMD is smallerthan the diffraction-limited focal spot of the Fourier transform(FT) lens, with an effective numerical aperture (NA) of ∼0.1.Hence, it takes a small set of micro-mirrors to switch a singlebeamlet of the multi-focal pattern ON and direct it to the samplefor uncaging (see Figure 1B). When the holographic focus gener-ated by the SLM is either above or below the plane of the DMD,a larger subset of micro-mirrors is needed. The size of the sub-set of micro-mirrors is calculated based on the conical angle ofthe focus with respect to the NA of the FT lens and the operat-ing wavelength (720 nm). Figure 1C shows the relative intensityin the sample plane as measured by a photo-diode located at theconjugate Fourier plane (see Figure 1A) for different numbers offocal spots turned ON by the DMD. The intensity is more or lessquantized and gives information on the number of foci active foruncaging. The DMD receives 24 bit RGB data at 60 Hz throughits electronic video interface, with each color channel (RGB) hav-ing 8-bit depth. We operated the DMD in 1-bit monochromemode. In this mode, a single image frame consists of 24 1-bitplanes which encode the micro-mirror state at consecutive timeepochs. Since each plane is weighted equally, this allows temporalsequences to be read out at 1440 Hz. By driving the DMD this way,the minimum switching time for a full ON–OFF cycle is 0.7 ms(see Figure 1C).
The setup is also equipped with a micromanipulator (SutterInstruments), peristaltic pump (Gilson Minipuls 3) and ampli-fier (MultiClamp 700B, Molecular Devices) for electrophysiol-ogy. We use custom software developed in Labview (NationalInstruments) to control the acquisition of 3D 2P images, thecalculation of the appropriate hologram for projection of pho-tostimulation sites, and the laser intensity via a polarizing beamsplitter and a half-wave plate on a motorized rotation mount.
2.2. TISSUE PREPARATION AND ELECTROPHYSIOLOGYThree hundred micrometer thick slices of rat somatosen-sory cortex and hippocampus (P22–35) were prepared with avibratome (Leica VT1200S). The slices were cut in ice-cold oxy-genated artificial cerebrospinal fluid (ACSF) that contained (inmM): 1.25 NaH2PO4, 1.0 MgCl2, 125.0 NaCl, 2.5 KCl, 2.0 CaCl2,25.0 NaHCO3, and 10.0 glucose. Slices were incubated in oxy-genated ACSF at 34◦C for 30 min and kept at room temperaturebefore being transferred to the recording chamber. Animal exper-iments were performed with the protocol approved by the AnimalEthics Committee of the Australian National University.
We filled neurons through the recording patch pipette (R =3.5–4.5 M�) with an intracellular solution containing (in mM):115 K-gluconate, 20 KCl, 10 HEPES, 10 phospho-kreatine, 4 ATP-Mg, 0.3 GTP, 5.4 biocytin, and 0.1 Alexa-488 (Invitrogen).Whole-cell current clamp recordings of layer II/III and V pyra-midal cells were obtained with a MultiClamp 700B. Current
was injected when necessary to maintain a resting membranepotential of −70 mV. For the experiments in Figures 3D–F, theresting membrane potential was depolarized to −55 mV to allowfor APs to be more easily generated. Data analysis was donewith AxoGraph X and Matlab. We calculated peak currents andvoltages by averaging 5–12 trials.
2.3. TWO-PHOTON IMAGINGNeurons filled with 0.1 mM Alexa-488 were imaged at 800 nmwith 12–22 mW laser power. The dye was allowed to diffuse intothe neuron for 20–30 min before imaging. Image stacks of 800 ×800 pixels in a single plane were generated by imaging individ-ual planes in 1 μm increments along the z-axis. ImageJ (NationalInstitute of Health) was used for 3D visualization.
2.4. TWO-PHOTON GLUTAMATE UNCAGINGWe determined the potential sites on the dendritic tree for pho-tostimulation from the 3D image map of the fluorescently labeledneuron. The appropriate phase hologram for the desired multi-focal pattern around the neuron was then calculated and encodedonto the SLM. The DMD was used to switch individual sites ONor OFF.
MNI-caged glutamate (Tocris Bioscience) was bath-applied(3 mM) and uncaged at 720 nm in the presence of 0.1 mMcyclothiazide using 9–30 mW power per uncaging spot. A closedrecirculating system using a peristaltic pump was used to mini-mize the ACSF volume. An automated drift correction algorithmwas run before every uncaging event to ensure that the photo-stimulation sites remained optimized.
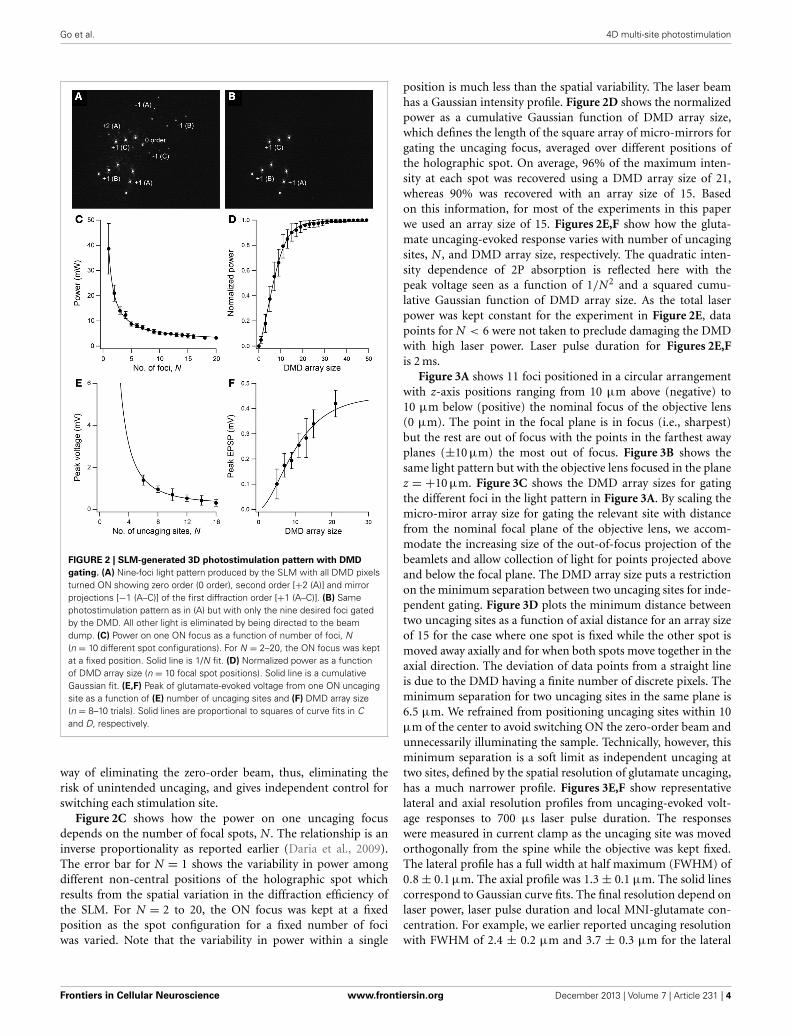
3. RESULTS3.1. TIME-GATED HOLOGRAPHIC SYSTEMOur microscope design builds on an earlier reported two-photonholographic microscope system capable of simultaneous multi-site photostimulation in 3D (Go et al., 2012). The incorporationof a DMD allows for full-cycle (OFF–ON–OFF) switching of pho-tostimulation patterns within 0.7 ms. This is a rate that is notpossible with just the SLM alone, which has a response timeof ∼10–30 ms. Although high-speed shutter systems can operateon the same submillisecond timescale, they do not allow inde-pendent switching of multiple foci. The addition of the DMDto our set-up also “cleans up” the 3D multi-site photostimula-tion pattern produced by the SLM. The DMD offers a convenientway to eliminate the spurious light patterns that normally resultfrom holographic projection using a phase-only SLM with finitespace-bandwidth product (Palima and Daria, 2006, 2007; Goet al., 2011). To visualize the different foci, we placed a reflec-tive surface (e.g., glass slide) in the sample plane and imaged thereflected light leaked through the dichroic mirror directly abovethe objective lens (see Figure 1A). Figure 2A shows the photo-stimulation pattern produced by the SLM projected onto thesample with all DMD pixels in the ON position. Figure 2B showsthe same photostimulation pattern with only the intended ninefoci switched ON. Note that the undiffracted (i.e., zero-order; seeimage center in Figure 2A) beam from the SLM is missing in thelatter, as are other higher diffraction orders and mirror projec-tions of the first orders. The DMD therefore provides an easy
Frontiers in Cellular Neuroscience www.frontiersin.org December 2013 | Volume 7 | Article 231 | 3
Go et al. 4D multi-site photostimulation
FIGURE 2 | SLM-generated 3D photostimulation pattern with DMD
gating. (A) Nine-foci light pattern produced by the SLM with all DMD pixelsturned ON showing zero order (0 order), second order [+2 (A)] and mirrorprojections [−1 (A–C)] of the first diffraction order [+1 (A–C)]. (B) Samephotostimulation pattern as in (A) but with only the nine desired foci gatedby the DMD. All other light is eliminated by being directed to the beamdump. (C) Power on one ON focus as a function of number of foci, N(n = 10 different spot configurations). For N = 2–20, the ON focus was keptat a fixed position. Solid line is 1/N fit. (D) Normalized power as a functionof DMD array size (n = 10 focal spot positions). Solid line is a cumulativeGaussian fit. (E,F) Peak of glutamate-evoked voltage from one ON uncagingsite as a function of (E) number of uncaging sites and (F) DMD array size(n = 8–10 trials). Solid lines are proportional to squares of curve fits in Cand D, respectively.
way of eliminating the zero-order beam, thus, eliminating therisk of unintended uncaging, and gives independent control forswitching each stimulation site.
Figure 2C shows how the power on one uncaging focusdepends on the number of focal spots, N. The relationship is aninverse proportionality as reported earlier (Daria et al., 2009).The error bar for N = 1 shows the variability in power amongdifferent non-central positions of the holographic spot whichresults from the spatial variation in the diffraction efficiency ofthe SLM. For N = 2 to 20, the ON focus was kept at a fixedposition as the spot configuration for a fixed number of fociwas varied. Note that the variability in power within a single
position is much less than the spatial variability. The laser beamhas a Gaussian intensity profile. Figure 2D shows the normalizedpower as a cumulative Gaussian function of DMD array size,which defines the length of the square array of micro-mirrors forgating the uncaging focus, averaged over different positions ofthe holographic spot. On average, 96% of the maximum inten-sity at each spot was recovered using a DMD array size of 21,whereas 90% was recovered with an array size of 15. Basedon this information, for most of the experiments in this paperwe used an array size of 15. Figures 2E,F show how the gluta-mate uncaging-evoked response varies with number of uncagingsites, N, and DMD array size, respectively. The quadratic inten-sity dependence of 2P absorption is reflected here with thepeak voltage seen as a function of 1/N2 and a squared cumu-lative Gaussian function of DMD array size. As the total laserpower was kept constant for the experiment in Figure 2E, datapoints for N < 6 were not taken to preclude damaging the DMDwith high laser power. Laser pulse duration for Figures 2E,Fis 2 ms.
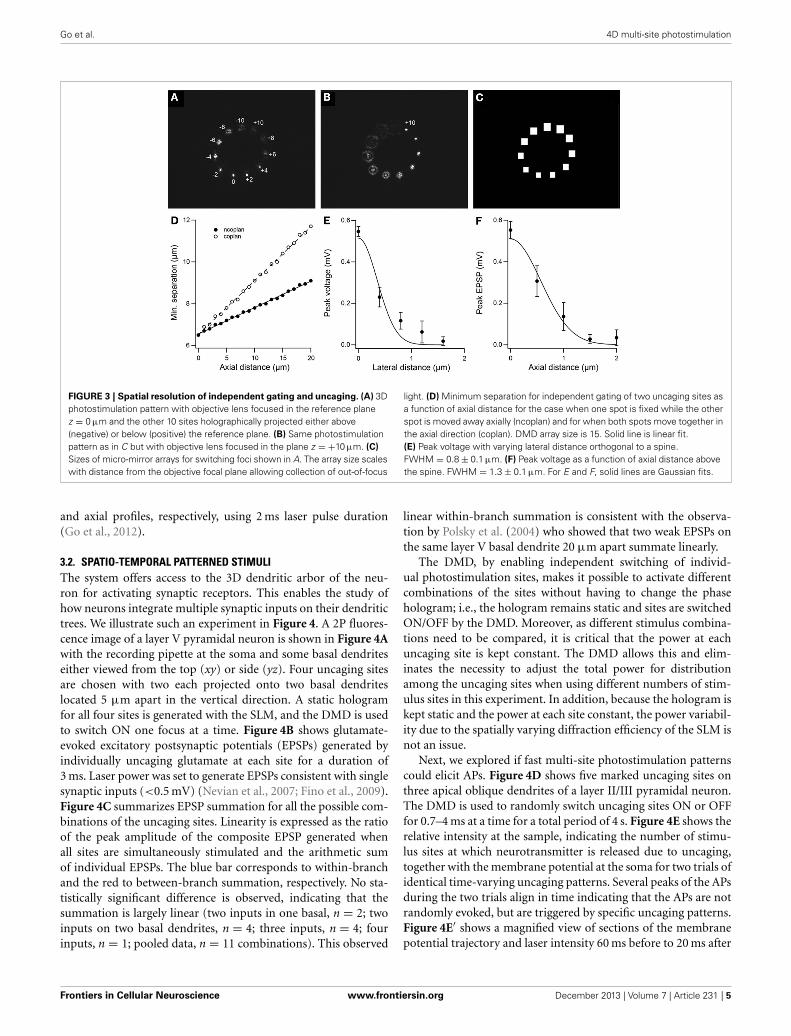
Figure 3A shows 11 foci positioned in a circular arrangementwith z-axis positions ranging from 10 μm above (negative) to10 μm below (positive) the nominal focus of the objective lens(0 μm). The point in the focal plane is in focus (i.e., sharpest)but the rest are out of focus with the points in the farthest awayplanes (±10 μm) the most out of focus. Figure 3B shows thesame light pattern but with the objective lens focused in the planez = +10 μm. Figure 3C shows the DMD array sizes for gatingthe different foci in the light pattern in Figure 3A. By scaling themicro-miror array size for gating the relevant site with distancefrom the nominal focal plane of the objective lens, we accom-modate the increasing size of the out-of-focus projection of thebeamlets and allow collection of light for points projected aboveand below the focal plane. The DMD array size puts a restrictionon the minimum separation between two uncaging sites for inde-pendent gating. Figure 3D plots the minimum distance betweentwo uncaging sites as a function of axial distance for an array sizeof 15 for the case where one spot is fixed while the other spot ismoved away axially and for when both spots move together in theaxial direction. The deviation of data points from a straight lineis due to the DMD having a finite number of discrete pixels. Theminimum separation for two uncaging sites in the same plane is6.5 μm. We refrained from positioning uncaging sites within 10μm of the center to avoid switching ON the zero-order beam andunnecessarily illuminating the sample. Technically, however, thisminimum separation is a soft limit as independent uncaging attwo sites, defined by the spatial resolution of glutamate uncaging,has a much narrower profile. Figures 3E,F show representativelateral and axial resolution profiles from uncaging-evoked volt-age responses to 700 μs laser pulse duration. The responseswere measured in current clamp as the uncaging site was movedorthogonally from the spine while the objective was kept fixed.The lateral profile has a full width at half maximum (FWHM) of0.8 ± 0.1 μm. The axial profile was 1.3 ± 0.1 μm. The solid linescorrespond to Gaussian curve fits. The final resolution depend onlaser power, laser pulse duration and local MNI-glutamate con-centration. For example, we earlier reported uncaging resolutionwith FWHM of 2.4 ± 0.2 μm and 3.7 ± 0.3 μm for the lateral
Frontiers in Cellular Neuroscience www.frontiersin.org December 2013 | Volume 7 | Article 231 | 4
Go et al. 4D multi-site photostimulation
FIGURE 3 | Spatial resolution of independent gating and uncaging. (A) 3Dphotostimulation pattern with objective lens focused in the reference planez = 0 μm and the other 10 sites holographically projected either above(negative) or below (positive) the reference plane. (B) Same photostimulationpattern as in C but with objective lens focused in the plane z = +10 μm. (C)
Sizes of micro-mirror arrays for switching foci shown in A. The array size scaleswith distance from the objective focal plane allowing collection of out-of-focus
light. (D) Minimum separation for independent gating of two uncaging sites asa function of axial distance for the case when one spot is fixed while the otherspot is moved away axially (ncoplan) and for when both spots move together inthe axial direction (coplan). DMD array size is 15. Solid line is linear fit.(E) Peak voltage with varying lateral distance orthogonal to a spine.FWHM = 0.8 ± 0.1 μm. (F) Peak voltage as a function of axial distance abovethe spine. FWHM = 1.3 ± 0.1 μm. For E and F, solid lines are Gaussian fits.
and axial profiles, respectively, using 2 ms laser pulse duration(Go et al., 2012).
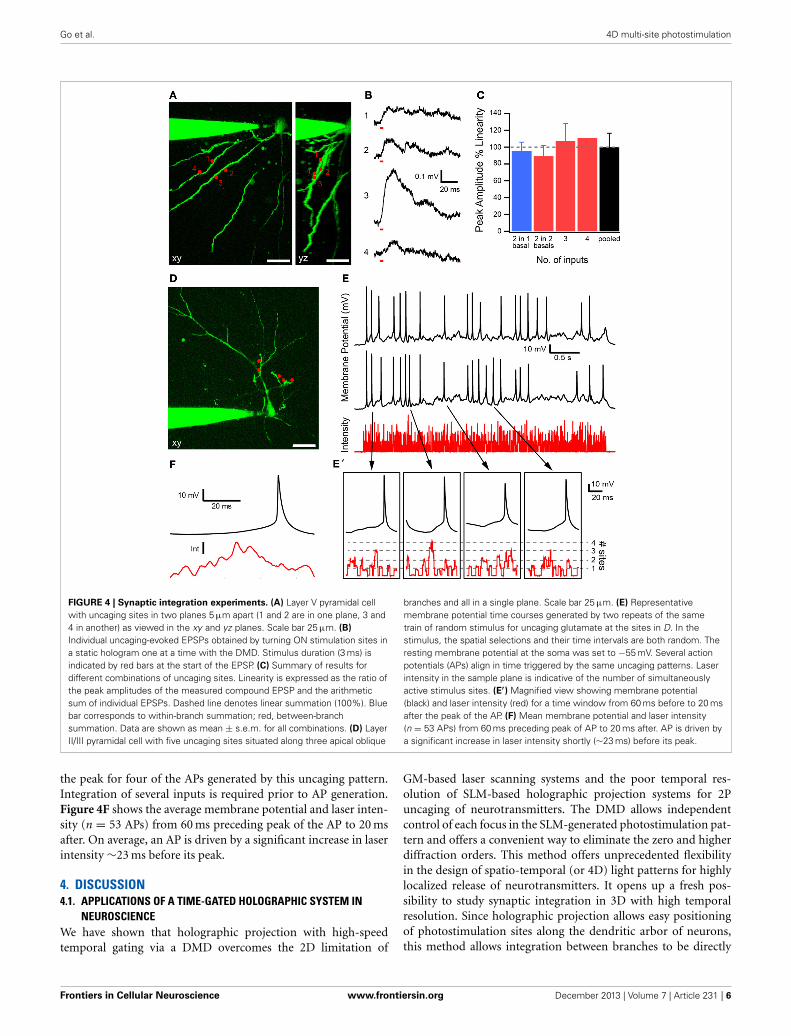
3.2. SPATIO-TEMPORAL PATTERNED STIMULIThe system offers access to the 3D dendritic arbor of the neu-ron for activating synaptic receptors. This enables the study ofhow neurons integrate multiple synaptic inputs on their dendritictrees. We illustrate such an experiment in Figure 4. A 2P fluores-cence image of a layer V pyramidal neuron is shown in Figure 4Awith the recording pipette at the soma and some basal dendriteseither viewed from the top (xy) or side (yz). Four uncaging sitesare chosen with two each projected onto two basal dendriteslocated 5 μm apart in the vertical direction. A static hologramfor all four sites is generated with the SLM, and the DMD is usedto switch ON one focus at a time. Figure 4B shows glutamate-evoked excitatory postsynaptic potentials (EPSPs) generated byindividually uncaging glutamate at each site for a duration of3 ms. Laser power was set to generate EPSPs consistent with singlesynaptic inputs (<0.5 mV) (Nevian et al., 2007; Fino et al., 2009).Figure 4C summarizes EPSP summation for all the possible com-binations of the uncaging sites. Linearity is expressed as the ratioof the peak amplitude of the composite EPSP generated whenall sites are simultaneously stimulated and the arithmetic sumof individual EPSPs. The blue bar corresponds to within-branchand the red to between-branch summation, respectively. No sta-tistically significant difference is observed, indicating that thesummation is largely linear (two inputs in one basal, n = 2; twoinputs on two basal dendrites, n = 4; three inputs, n = 4; fourinputs, n = 1; pooled data, n = 11 combinations). This observed
linear within-branch summation is consistent with the observa-tion by Polsky et al. (2004) who showed that two weak EPSPs onthe same layer V basal dendrite 20 μm apart summate linearly.
The DMD, by enabling independent switching of individ-ual photostimulation sites, makes it possible to activate differentcombinations of the sites without having to change the phasehologram; i.e., the hologram remains static and sites are switchedON/OFF by the DMD. Moreover, as different stimulus combina-tions need to be compared, it is critical that the power at eachuncaging site is kept constant. The DMD allows this and elim-inates the necessity to adjust the total power for distributionamong the uncaging sites when using different numbers of stim-ulus sites in this experiment. In addition, because the hologram iskept static and the power at each site constant, the power variabil-ity due to the spatially varying diffraction efficiency of the SLM isnot an issue.
Next, we explored if fast multi-site photostimulation patternscould elicit APs. Figure 4D shows five marked uncaging sites onthree apical oblique dendrites of a layer II/III pyramidal neuron.The DMD is used to randomly switch uncaging sites ON or OFFfor 0.7–4 ms at a time for a total period of 4 s. Figure 4E shows therelative intensity at the sample, indicating the number of stimu-lus sites at which neurotransmitter is released due to uncaging,together with the membrane potential at the soma for two trials ofidentical time-varying uncaging patterns. Several peaks of the APsduring the two trials align in time indicating that the APs are notrandomly evoked, but are triggered by specific uncaging patterns.Figure 4E′ shows a magnified view of sections of the membranepotential trajectory and laser intensity 60 ms before to 20 ms after
Frontiers in Cellular Neuroscience www.frontiersin.org December 2013 | Volume 7 | Article 231 | 5
Go et al. 4D multi-site photostimulation
FIGURE 4 | Synaptic integration experiments. (A) Layer V pyramidal cellwith uncaging sites in two planes 5 μm apart (1 and 2 are in one plane, 3 and4 in another) as viewed in the xy and yz planes. Scale bar 25 μm. (B)
Individual uncaging-evoked EPSPs obtained by turning ON stimulation sites ina static hologram one at a time with the DMD. Stimulus duration (3 ms) isindicated by red bars at the start of the EPSP. (C) Summary of results fordifferent combinations of uncaging sites. Linearity is expressed as the ratio ofthe peak amplitudes of the measured compound EPSP and the arithmeticsum of individual EPSPs. Dashed line denotes linear summation (100%). Bluebar corresponds to within-branch summation; red, between-branchsummation. Data are shown as mean ± s.e.m. for all combinations. (D) LayerII/III pyramidal cell with five uncaging sites situated along three apical oblique
branches and all in a single plane. Scale bar 25 μm. (E) Representativemembrane potential time courses generated by two repeats of the sametrain of random stimulus for uncaging glutamate at the sites in D. In thestimulus, the spatial selections and their time intervals are both random. Theresting membrane potential at the soma was set to −55 mV. Several actionpotentials (APs) align in time triggered by the same uncaging patterns. Laserintensity in the sample plane is indicative of the number of simultaneouslyactive stimulus sites. (E′) Magnified view showing membrane potential(black) and laser intensity (red) for a time window from 60 ms before to 20 msafter the peak of the AP. (F) Mean membrane potential and laser intensity(n = 53 APs) from 60 ms preceding peak of AP to 20 ms after. AP is driven bya significant increase in laser intensity shortly (∼23 ms) before its peak.
the peak for four of the APs generated by this uncaging pattern.Integration of several inputs is required prior to AP generation.Figure 4F shows the average membrane potential and laser inten-sity (n = 53 APs) from 60 ms preceding peak of the AP to 20 msafter. On average, an AP is driven by a significant increase in laserintensity ∼23 ms before its peak.
4. DISCUSSION4.1. APPLICATIONS OF A TIME-GATED HOLOGRAPHIC SYSTEM IN
NEUROSCIENCEWe have shown that holographic projection with high-speedtemporal gating via a DMD overcomes the 2D limitation of
GM-based laser scanning systems and the poor temporal res-olution of SLM-based holographic projection systems for 2Puncaging of neurotransmitters. The DMD allows independentcontrol of each focus in the SLM-generated photostimulation pat-tern and offers a convenient way to eliminate the zero and higherdiffraction orders. This method offers unprecedented flexibilityin the design of spatio-temporal (or 4D) light patterns for highlylocalized release of neurotransmitters. It opens up a fresh pos-sibility to study synaptic integration in 3D with high temporalresolution. Since holographic projection allows easy positioningof photostimulation sites along the dendritic arbor of neurons,this method allows integration between branches to be directly
Frontiers in Cellular Neuroscience www.frontiersin.org December 2013 | Volume 7 | Article 231 | 6
Go et al. 4D multi-site photostimulation
investigated. This is crucial since in pyramidal neurons, whichare abundant in several regions of the central nervous systemin mammals (Spruston, 2008), apical oblique and basal den-drites collectively receive the vast majority of excitatory synapses(Larkman, 1991; Megias et al., 2001; Wang et al., 2007). Thismethod could also be applied to the spatio-temporal control ofneuronal activity which allows probing of neural coding, i.e., whatkinds of spatio-temporal input patterns a neuron responds to. Inaddition, uncaging may be extended to neuronal populations. Bygenerating a multi-cell holographic stimulation pattern and usingthe DMD to sequentially evoke suprathreshold 2P activation ofneurons in a population, connections to a patched neuron may bedetermined. This facilitates a fast method for finding connectedpairs, for instance. This multiplexing technique may also be usedfor population calcium imaging in the study of network activity(Ducros et al., 2013) and the interaction between different sub-networks. Another potential field of application for these 4D lightpatterns is optogenetics. By using sculptured light to activate spe-cific subnetworks of genetically labeled neuronal populations, aneven higher degree of selectivity can be achieved than is possiblewith traditional optogenetic approaches alone (Liu et al., 2012;Lovett-Barron et al., 2012).
4.2. RELATIONSHIP WITH OTHER WORKThe basic component of holographic projection is a phase-onlyliquid crystal (LC) SLM encoded with a computer-generatedphase hologram. The response time of the LC is dependent on itsphase retardation rate, which relates to the operating wavelengthof the SLM (Wu, 1986). This response time is typically ∼10 ms,but addressing via computer video output further limits the tem-poral resolution to ∼30 ms. There have been several attempts toincrease the response time of SLMs (Dayton et al., 2001; Kirbyand Love, 2004), but no technique using spatially addressableSLMs has achieved multi-level phase-only modulation to performa full OFF–ON–OFF cycle of the hologram at submillisecondtimescales. Thalhammer et al. (2013) recently demonstrated high-speed hologram transition using a device with an extended phasemap of up to 4π and choosing the minimum route in phaseshift for each pixel in between transitions. This technique allowsfor one-way transitions of 1–3 ms. An iterative hologram opti-mization routine is necessary to improve the diffraction efficiencywith the reduced phase representation of the hologram. Whilethis technique can potentially be applied to 4D photostimulation,changing the hologram introduces spurious light patterns duringhologram transitions, which could result in unwanted uncaging.While a high-speed shutter or an acousto-optic deflector can beused to turn OFF the light during transitions, the projection ofzero and higher diffraction orders can still pose a potential issuewhen the hologram is ON especially when the iterative optimiza-tion routine does not produce an efficient hologram for a specificstimulation pattern.
Holographic projection with binary phase modulations(0 and π) has been demonstrated recently for the study of neu-ronal circuits (Reutsky-Gefen et al., 2013). SLMs employing ferro-electric LCs have fast response times (∼0.5 ms). However, binaryholograms produce mirror projections of equal light intensity inaddition to the zero order. This reduces the power available for
stimulation (after blocking zero order and mirror projection) tosignificantly less than 40%. While such technique can well beapplied for 1P excitation, either for optogenetics or uncaging, itslow optical throughput can be an issue when applying the tech-nique to 2P uncaging in 4D. Moreover, even for a fixed numberof foci, global changes in the binary hologram impact the inten-sity level of each focus and could introduce variable 2P uncagingresponses. Changing the number of foci necessitates dynamiccontrol of the laser intensity affecting both 1P and 2P uncagingmodes.
Our technique uniquely distinguishes itself from existing tech-niques in that it uses a conventional phase-only SLM with slowrefresh rate combined with a DMD, which enables indepen-dent gating of the holographically projected multiple foci athigh speeds. Here, the SLM first modulates the phase of theincoming laser beam to generate the desired multi-focal spa-tial profile before the DMD allows each focus to be individuallyturned ON or OFF. Thus, there is minimal loss of laser intensitycompared to the method of using DMDs to remove unwantedlight from a wide-field illumination to shape the excitation light(Bednarkiewicz et al., 2008; Zhu et al., 2012).
4.3. CHALLENGES AND FUTURE DEVELOPMENTSThe DMD array size sets a minimum lateral distance between twouncaging sites for independent gating. For an array size of 15,the minimum distance is 6.5 μm. This is a soft limit as gluta-mate uncaging has a much narrower profile (0.8 ± 0.1 μm lateralFWHM) and considerable overlap between two DMD arrays isneeded to induce two-photon uncaging in the OFF site. However,we can further decrease this distance with a slight adjustment inthe optical system. By replacing the FT lens (see LFT in Figure 1A)between the SLM and DMD with one with a shorter focal length,we can achieve smaller foci on the DMD and consequently requiresmaller DMD array sizes for gating. This, however, will increasethe incident power density level on the DMD and will requirehigh-tolerance mirror coatings to prevent damage.
Our system uses a DMD (DLP3000) from an evaluation mod-ule (DLP LightCrafter, Texas Instruments). We retained only thecomponents in the module necessary to address the bare DMD viathe video interface and removed the other components (e.g., lightsource and projection lenses). The DMD is electronically drivenat 1440 Hz when delivering the uncaging binary pattern via thecomputer’s digital video output. This rate can be increased upto 4 kHz (250 μs) when 96 frames are preloaded onto the on-board memory of the DMD’s driver circuit but this would give atotal of only 24 ms of stimulation. Alternatively, one can use moreadvanced DMD systems (e.g., DLP V-module, ViALUX), whichare capable of switching rates of up to 22 kHz. One limitation inthis work is the low damage threshold of the DMD componentitself. Since it is not designed for use with high power light sources(e.g., lasers), illuminating the DMD for long periods with focusedlaser spots damages the device. Such a technical constraint couldbe overcome by custom fabricating DMDs with specific mir-ror coatings to tolerate higher power levels. In this work, theDMD was potentially stretched to its limits by positioning it inthe Fourier plane where the holographically projected foci fromthe 2P laser were incident. Long sequences of spatio-temporal
Frontiers in Cellular Neuroscience www.frontiersin.org December 2013 | Volume 7 | Article 231 | 7
Go et al. 4D multi-site photostimulation
stimulation patterns are not possible with the current device.Nonetheless, even with the limits of the current device it is appar-ent that the combination of SLM and DMD can be cooperativelyapplied to the study of synaptic integration.
In summary, holographic projection using an SLM combinedwith high-speed temporal gating via a DMD allows the gen-eration of random spatio-temporal stimulation patterns in 3Dwith submillisecond temporal resolution, and in this way offersunprecedented flexibility in the design of 4D light patterns forhighly localized release of neurotransmitters. Implementing thisapproach opens up a wide range of prospects for the study ofneuronal circuits.
ACKNOWLEDGMENTSThis work is supported by the Australian Research CouncilDiscovery Project (contract no. DP120102191).
SUPPLEMENTARY MATERIALThe Supplementary Material for this article can be foundonline at: http://www.frontiersin.org/journal/10.3389/fncel.2013.00231/abstract
Supplementary movie file showing DMD switching of SLM-generated multi-focal photostimulation pattern.
REFERENCESAnselmi, F., Ventalon, C., Begue, A., Ogden, D., and Emiliani, V. (2011). Three-
dimensional imaging and photostimulation by remote-focusing and holo-graphic light patterning. Proc. Natl. Acad. Sci. U.S.A. 108, 19504–19509. doi:10.1073/pnas.1109111108
Bednarkiewicz, A., Bouhifd, M., and Whelan, M. P. (2008). Digital micromir-ror device as a spatial illuminator for fluorescence lifetime and hyperspectralimaging. Appl. Opt. 47, 1193–1199. doi: 10.1364/AO.47.001193
Boyden, E. S., Zhang, F., Bamberg, E., Nagel, G., and Deisseroth, K. (2005).Millisecond-timescale, genetically targeted optical control of neural activity.Nat. Neurosci. 8, 1263–1268. doi: 10.1038/nn1525
Branco, T., Clark, B. A., and Hausser, M. (2010). Dendritic discrimination oftemporal input sequences in cortical neurons. Science 329, 1671–1675. doi:10.1126/science.1189664
Callaway, E. M., and Katz, L. C. (1993). Photostimulation using caged glutamatereveals functional circuitry in living brain slices. Proc. Natl. Acad. Sci. U.S.A. 90,7661–7665. doi: 10.1073/pnas.90.16.7661
Curtis, J., Koss, B. A., and Grier, D. (2002). Dynamic holographic optical tweezers.Opt. Commun. 207, 169–175. doi: 10.1016/S0030-4018(02)01524-9
Dal Maschio, M., Difato, F., Beltramo, R., Blau, A., Benfenati, F., andFellin, T. (2010). Simultaneous two-photon imaging and photostimula-tion with structured light illumination. Opt. Express 18, 18720–18731. doi:10.1364/OE.18.018720
Daria, V. R., Stricker, C., Bowman, R., Redman, S., and Bachor, H. A. (2009).Arbitrary multisite two-photon excitation in four dimensions. Appl. Phys. Lett.95, 093791. doi: 10.1063/1.3216581
Dayton, D., Browne, S., Gonglewski, J., and Restaino, S. (2001). Characterizationand control of a multi-element dual-frequency liquid-crystal device for high-speed adaptive optical wave-front correction. Appl. Opt. 40, 2345–2355. doi:10.1364/AO.40.002345
Denk, W. (1994). Two-photon scanning photochemical microscopy: mappingligand-gated ion channel distributions. Proc. Natl. Acad. Sci. U.S.A. 91,6629–6633. doi: 10.1073/pnas.91.14.6629
Ducros, M., Houssen, Y. G., Bradley, J., De Sars, V., and Charpak, S. (2013).Encoded multisite two-photon microscopy. Proc. Natl. Acad. Sci. U.S.A. 110,13138–13143. doi: 10.1073/pnas.1307818110
Fino, E., Araya, R., Peterka, D. S., Salierno, M., Etchenique, R., and Yuste, R. (2009).Rubi-glutamate: two-photon and visible-light photoactivation of neurons anddendritic spines. Front. Neural Circuits 3:2. doi: 10.3389/neuro.04.002.2009
Gasparini, C., and Magee, J. C. (2001). State-dependent dendritic computa-tion in hippocampal ca1 pyramidal neurons. J. Neurosci. 26, 2088–2100. doi:10.1523/JNEUROSCI.4428-05.2006
Go, M. A., Ng, P. F., Bachor, H. A., and Daria, V. R. (2011). Optimal complex fieldholographic projection. Opt. Lett. 36, 3073–3075. doi: 10.1364/OL.36.003073
Go, M. A., Stricker, C., Redman, S., Bachor, H. A., and Daria, V. R. (2012).Simultaneous two-photon imaging and photostimulation with structured lightillumination. J. Biophoton. 5, 745–753. doi: 10.1002/jbio.201100101
Katona, G., Szalay, G., Mak, P., Kaszs, A., Veress, M., Hillier, D., et al. (2012). Fasttwo-photon in vivo imaging with three-dimensional random-access scanning inlarge tissue volumes. Nat. Methods 9, 201–208. doi: 10.1038/nmeth.1851
Kirby, A., and Love, G. (2004). Fast, large and controllable phase modula-tion using dual frequency liquid crystals. Opt. Express 12, 1470–1475. doi:10.1364/OPEX.12.001470
Larkman, A. U. (1991). Dendritic morphology of pyramidal neurons of the rat:spine distributions. J. Comp. Neurol. 306, 332–343. doi: 10.1002/cne.903060209
Liesener, J., Reichester, M., Haist, T., and Tiziani, H. J. (2000). Multi-functionaloptical tweezers using computer generated holograms. Opt. Commun. 185,77–82. doi: 10.1016/S0030-4018(00)00990-1
Liu, X., Ramirez, S., Pang, P. T., Puryear, C. B., Govindarajan, A., Deisseroth, K.,et al. (2012). Optogenetic stimulation of a hippocampal engram activates fearmemory recall. Nature 484, 381–385. doi: 10.1038/nature11028
Lovett-Barron, M., Turi, G. F., Kaifosh, P., Lee, P. H., Bolze, F., Sun, X. H., et al.(2012). Regulation of neuronal input transformations by tunable dendriticinhibition. Nat. Neurosci. 15, 423–430. doi: 10.1038/nn.3024
Lutz, C., Otis, T., DeSars, V., Charpak, S., DiGregorio, D., and Emiliani, V. (2008).Holographic photolysis of caged neurotransmitters. Nat. Methods 5, 821–827.doi: 10.1038/nmeth.1241
Matsuzaki, M., Ellis-Davies, G. C. R., Nemoto, T., Miyashita, Y., Iino, M., andKasai, H. (2001). Dendritic spine geometry is critical for ampa receptor expres-sion in hippocampal ca1 pyramidal neurons. Nat. Neurosci. 4, 1086–1092. doi:10.1038/nn736
Megias, M., Emri, Z., Freund, T. F., and Gulyas, A. I. (2001). Total number and dis-tribution of inhibitory and excitatory synapses on hippocampal ca1 pyramidalcells. Neuroscience 102, 527–540. doi: 10.1016/S0306-4522(00)00496-6
Nagel, G., Szellas, T., Huhn, W., Kateriya, S., Adeishvili, N., Berthold, P.,et al. (2003). Channelrhodopsin-2, a directly light-gated cation-selectivemembrane channel. Proc. Natl. Acad. Sci. U.S.A. 100, 13940–13945. doi:10.1073/pnas.1936192100
Nevian, T., Larkum, M. E., Polsky, A., and Schiller, J. (2007). Properties of basaldendrites of layer 5 pyramidal neurons: a direct patch-clamp recording study.Nat. Neurosci. 10, 206–214. doi: 10.1038/nn1826
Nikolenko, V., Watson, B., Araya, R., Woodruff, A., Peterka, D., and Yuste,R. (2008). Microscopy: scanless two-photon imaging and photostimu-lation using spatial light modulators. Front. Neural Circuits 2:5. doi:10.3389/neuro.04.005.2008
Palima, D., and Daria, V. R. (2006). Effect of spurious diffraction orders in arbi-trary multi-foci patterns produced via phase-only holograms. Appl. Opt. 45,6689–6693. doi: 10.1364/AO.45.006689
Palima, D., and Daria, V. R. (2007). Holographic projection of arbitrary lightpatterns with a suppressed zero-order beam. Appl. Opt. 46, 4197–4201. doi:10.1364/AO.46.004197
Papagiakoumou, E., Anselmi, F., Bgue, A., de Sars, V., Glückstad, J., Isacoff,E. Y., et al. (2010). Scanless two-photon excitation of channelrhodopsin-2. Nat.Methods 7, 848–854. doi: 10.1038/nmeth.1505
Polsky, A., Mel, B. W., and Schiller, J. (2004). Computational subunits in thindendrites of pyramidal cells. Nat. Neurosci. 7, 621–627. doi: 10.1038/nn1253
Reddy, G. D., Kelleher, K., Fink, R., and Saggau, P. (2008). Three-dimensionalrandom access multi-photon microscopy for functional imaging of neuronalactivity. Nat. Neurosci. 11, 713–720. doi: 10.1038/nn.2116
Reutsky-Gefen, I., Golan, L., Farah, N., Schejter, A., Tsur, L., Brosh, I., et al. (2013).Holographic optogenetic stimulation of patterned neuronal activity for visionrestoration. Nat. Commun. 4:1509. doi: 10.1038/ncomms2500
Spruston, N. (2008). Pyramidal neurons: dendritic structure and synaptic integra-tion. Nat. Rev. Neurosci. 9, 206–221. doi: 10.1038/nrn2286
Thalhammer, G., Bowman, R., Love, G., Padgett, M., and Ritsch-Marte,M. (2013). Speeding up liquid crystal slms using overdrive with phasechange reduction. Opt. Express 21, 1779–1797. doi: 10.1364/OE.21.001779
Frontiers in Cellular Neuroscience www.frontiersin.org December 2013 | Volume 7 | Article 231 | 8

Go et al. 4D multi-site photostimulation
Wang, S., Szobota, S., Wang, Y., Volgraf, M., Liu, Z., Sun, C., et al. (2007). All opticalinterface for parallel, remote, and spatiotemporal control of neuronal activity.Nano. Lett. 7, 3859–3863. doi: 10.1021/nl072783t
Wu, S. (1986). Phase retardation dependent optical response time of parallel-aligned liquid crystals. J. Appl. Phys. 60, 1836–1838. doi: 10.1063/1.337228
Yang, S., Papagiakoumou, E., Guillon, M., de Sars, V., Tang, C.-M., and Emiliani,V. (2011). Three-dimensional holographic photostimulation of the dendriticarbor. J. Neural Eng. 8:046002. doi: 10.1088/1741-2560/8/4/046002
Zahid, M., Vlez-Fort, M., Papagiakoumou, E., Ventalon, C., Angulo, M. C.,and Emiliani, V. (2010). Holographic photolysis for multiple cell stimula-tion in mouse hippocampal slices. PLoS ONE 5:e9431. doi: 10.1371/jour-nal.pone.0009431
Zhu, P., Fajardo, O., Shum, J., SchŁrer, Y. P. Z., and Friedrich, R. W. (2012).High-resolution optical control of spatiotemporal neuronal activity patternsin zebrafish using a digital micromirror device. Nat. Prot. 7, 1410–1425. doi:10.1038/nprot.2012.072
Conflict of Interest Statement: The authors declare that the research was con-ducted in the absence of any commercial or financial relationships that could beconstrued as a potential conflict of interest.
Received: 20 July 2013; accepted: 06 November 2013; published online: 02 December2013.Citation: Go MA, To M-S, Stricker C, Redman S, Bachor H-A, Stuart GJ and DariaVR (2013) Four-dimensional multi-site photolysis of caged neurotransmitters. Front.Cell. Neurosci. 7:231. doi: 10.3389/fncel.2013.00231This article was submitted to the journal Frontiers in Cellular Neuroscience.Copyright © 2013 Go, To, Stricker, Redman, Bachor, Stuart and Daria. This is anopen-access article distributed under the terms of the Creative Commons AttributionLicense (CC BY). The use, distribution or reproduction in other forums is permitted,provided the original author(s) or licensor are credited and that the original publica-tion in this journal is cited, in accordance with accepted academic practice. No use,distribution or reproduction is permitted which does not comply with these terms.
Frontiers in Cellular Neuroscience www.frontiersin.org December 2013 | Volume 7 | Article 231 | 9


![Impacts of aerosols and clouds on photolysis frequencies and ... of aerosols and cloud… · [2] Photolysis reactions play a very important role in atmospheric chemistry. Ozone photolysis](https://img.pdfslide.us/doc/110x75/5f07e35b7e708231d41f41d6/impacts-of-aerosols-and-clouds-on-photolysis-frequencies-and-of-aerosols-and.jpg)