Embed Size (px)
Citation preview

Founded on food,
focused on service.
Q3 FY2016 Earnings Call • May 4, 2016
Forward Looking Statements
• This presentation includes, and our response to various questions may include, certain
forward‐looking statements, estimates, and projections with respect to our anticipated future
performance, including the statements in the “Fiscal 2016 Outlook” section of this
presentation (collectively, “Forward‐Looking Statements”). Words such as “estimates,”
“expects,” “contemplates,” “anticipates,” “projects,” “plans,” “intends,” “believes,”
“forecasts,” “may,” “could,” “should,” and variations of such words or similar expressions
are intended to identify Forward‐Looking Statements.
• Forward‐Looking Statements reflect various assumptions of the Company’s management
that may or may not prove to be correct and are not guarantees of the Company’s future
performance or results. The Company’s actual results could differ materially from those
anticipated in the Forward‐Looking Statements.
• These Forward‐Looking Statements are subject to various risks and uncertainties, including
those described under “Risk Factors” section in our Prospectus dated October 1, 2015,
which was filed with the Securities and Exchange Commission (the “SEC”) pursuant to Rule
424(b) of the Securities Act on October 2, 2015, as such factors may be updated from time to
time in the Company’s periodic filings with the SEC and which are accessible on the SEC’s
website at www.sec.gov.
• The Company is not required and does not intend to update or alter any Forward‐Looking
Statements in this presentation or any other information that may be furnished to any
recipient, whether as a result of new information, future events, or otherwise.
1
Statement Regarding Non-GAAP Financial Measures
• This presentation includes several financial measures that are not calculated in accordance
with GAAP, including EBITDA, Adjusted EBITDA, Adjusted Cost of Goods Sold, Adjusted
Gross Profit, Adjusted Operating Expense, Adjusted Operating Profit, Adjusted Net Income,
and Adjusted Diluted Earnings per Share.
• Such measures are not recognized terms under GAAP, should not be considered in isolation
or as a substitute for measures prepared in accordance with GAAP, and are not indicative of
net income (loss) as determined under GAAP.
• EBITDA, Adjusted EBITDA, Adjusted Cost of Goods Sold, Adjusted Gross Profit, Adjusted
Operating Expense, Adjusted Operating Profit, Adjusted Net Income, and Adjusted Diluted
Earnings per Share and other non-GAAP financial measures have limitations that should be
considered before using these measures to evaluate the Company’s liquidity or financial
performance.
• EBITDA, Adjusted EBITDA, Adjusted Cost of Goods Sold, Adjusted Gross Profit, Adjusted
Operating Expense, Adjusted Operating Profit, Adjusted Net Income, and Adjusted Diluted
Earnings per Share, as presented, may not be comparable to similarly titled measures of
other companies because of varying methods of calculation.
2

George Holm
Chief Executive Officer

Q3 FY2016 Highlights
• Double-digit Adjusted EBITDA growth
10% - 12% growth range outlook provided
• Share Gains
Strong organic Case growth
• Expanded Margins
Grew independent restaurant case volume by at least 6% over the
prior year
Continued effective cost management
Adjusted EBITDA as a % of Gross Profit grew 60 bps
4

Q3 FY2016 Results
• Case volume growth of 4.1%
• Net sales increased 3.0% to $3.9 billion
• Gross profit increased 6.5% to $480.8 million
• Operating profit increased 38.7% to $37.6 million
• Net income increased 224.1% to $9.4 million
• Adjusted EBITDA1 increased 10.2% to $76.4 million
• Adj. EBITDA margin, as a % of Gross Profit, expanded 60 bps
to 15.9%
• Adj. diluted EPS increased 36.4% to $0.15 per share
51 For reconciliation of non-GAAP to GAAP measures see the Appendix

First Nine Months FY2016 Results
• Case volume growth of 4.5%
• Net sales increased 4.0% to $11.7 billion
• Gross profit increased 6.7% to $1.4 billion
• Operating profit increased 26.7% to $135.4 million
• Net income increased 75.3% to $39.1 million
• Adj. EBITDA1 increased 11.4% to $251.9 million
• Adj. EBITDA margin, as a % of Gross Profit, expanded 80 bps
to 17.4%
• Adj. diluted EPS increased 35.6% to $0.61 per share
1 For reconciliation of non-GAAP to GAAP measures see the Appendix 6

PFG Customized
7
• PFG entered into an agreement to provide
distribution solutions to all of Red Lobster’s
670+ U.S. restaurants
• Agreement solidifies PFG Customized’s position as
the premier distributor to full-service chain restaurants
• Red Lobster will be served from within Customized’s existing
distribution network
Increases Customized’s annualized sales by more than $500MM
Accretive to Adjusted EBITDA and EPS in FY2017
Accretive to return on invested capital
• PFG Customized will begin rolling out service to Red Lobster in our
fiscal first and second quarters of 2017

Q3 FY2016 Segment Results
Net Sales EBITDA
$ MM $ vs. PY $ MM $ vs. PY
Performance
Foodservice$2,298.7 + 4.1% $63.0 + 19.3%
PFG
Customized957.9 (3.2%) 9.7 + 1.0%
Vistar 651.2 + 9.0% 26.7 + 4.7%
8

Bob Evans
Chief Financial Officer

Q3 Financial Results
10
$ million, except per share
Q3 FY2016 Q3 FY2015 Growth
Cases + 4.1%
Net Sales $ 3,909.1 $ 3,795.5 + 3.0%
Gross Profit 480.8 451.6 + 6.5%
Operating Expense 443.2 424.5 + 4.4%
Operating Profit 37.6 27.1 + 38.7%
Net Income 9.4 2.9 + 224.1%
Diluted EPS $0.09 $0.03 + 200.0%
Adjusted EBITDA 1 76.4 69.3 10.2%
Adj. EBITDA1/Gross Profit 15.9% 15.3% 60 bps
Adjusted Net Income 1 15.5 9.6 + 61.5%
Adjusted Diluted EPS 1 $0.15 $0.11 + 36.4%
1 For reconciliation of non-GAAP to GAAP measures see the Appendix

PFG’s Profit Margin Expansion
11
• Performance Foodservice:
− Shift mix to Independents
and proprietary
Performance Brands
• Vistar:
− Penetrate new channels
leveraging our existing
distribution network
• Customized:
− Win new customers to
leverage our existing
distribution network
Adj. EBITDA Margin
as a % of Gross Profit
15.7%
17.8%16.6%
17.4%
0%
4%
8%
12%
16%
20%
FY2010 FY2015 FY2015 FY2016
YTD
+ 210 bps + 80 bps

Q3 Cash Flow and Balance Sheet
• YTD Cash Flow highlights
Operating Cash Flow of $117.6MM vs. 28.4MM PY
CapEx of $68.0MM vs. $63.7MM PY
Acquisitions of $40.2MM vs. $0.4MM PY
• Net Debt
Q3 FY2015 quarter end: $ 1,494.8MM
Q3 FY2016 quarter end: $ 1,203.4MM
Improvement vs. PY: $ 291.4MM
• Net Debt / TTM Adjusted EBITDA1 leverage
Q3 FY 2016 quarter end: 3.4X
Q3 FY 2015 quarter end: 4.7X
Improvement: 1.3X
121 For reconciliation of non-GAAP to GAAP measures see the Appendix

Asset-Based Lending Facility (ABL)
13
• In Q3 FY2016 , an amendment to PFG’s ABL facility went into effect
Upsized the ABL Facility from $1.4 billion to $1.6 billion
Lowered interest rate grid for LIBOR based loans by 25 basis points
Extended the maturity to February 2021
• PFG borrowed $200 million under the ABL facility and repaid $200
million of loans under our second lien term loan facility
This payment, plus the lower interest rate grid under the ABL facility,
will save PFG cash interest of approximately $9 million over the next
12 months, which is expected to translate into 5¢ per share after-tax
One-time non-cash charge of approximately $5.8 million, or 3¢ per
share, was recognized in the third quarter in interest expense

Fiscal 2016 Outlook
• PFG’s provides Fiscal 2016 Adjusted EBITDA1
growth versus PY
outlook:
53 vs. 52 weeks: 10% – 12%
52 vs. 52 weeks: 8% – 10%
• For fiscal 2016, PFG narrows our outlook to the 10% to 12% range
• As a reminder, the 53rd week is worth approximately 2% points of
growth for the year and falls in the 4th quarter
141 For reconciliation of non-GAAP to GAAP measures see the Appendix

What we really do is deliver.
15

Non-GAAP Financial Measures
16
PERFORMANCE FOOD GROUP COMPANY
Non-GAAP Reconciliation (Unaudited)
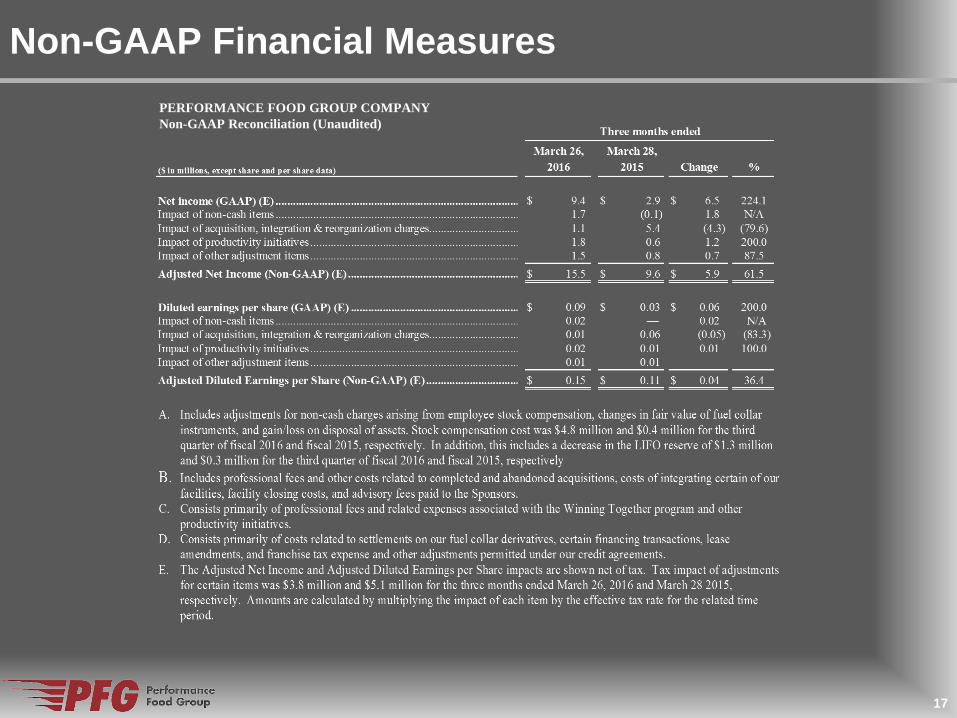
Non-GAAP Financial Measures
17
PERFORMANCE FOOD GROUP COMPANY
Non-GAAP Reconciliation (Unaudited)

Non-GAAP Financial Measures
18
PERFORMANCE FOOD GROUP COMPANY
Non-GAAP Reconciliation (Unaudited)

Non-GAAP Financial Measures
PERFORMANCE FOOD GROUP COMPANY
Non-GAAP Reconciliation (Unaudited)
19

Non-GAAP Financial Measures
20
PERFORMANCE FOOD GROUP COMPANY
Non-GAAP Reconciliation (Unaudited)
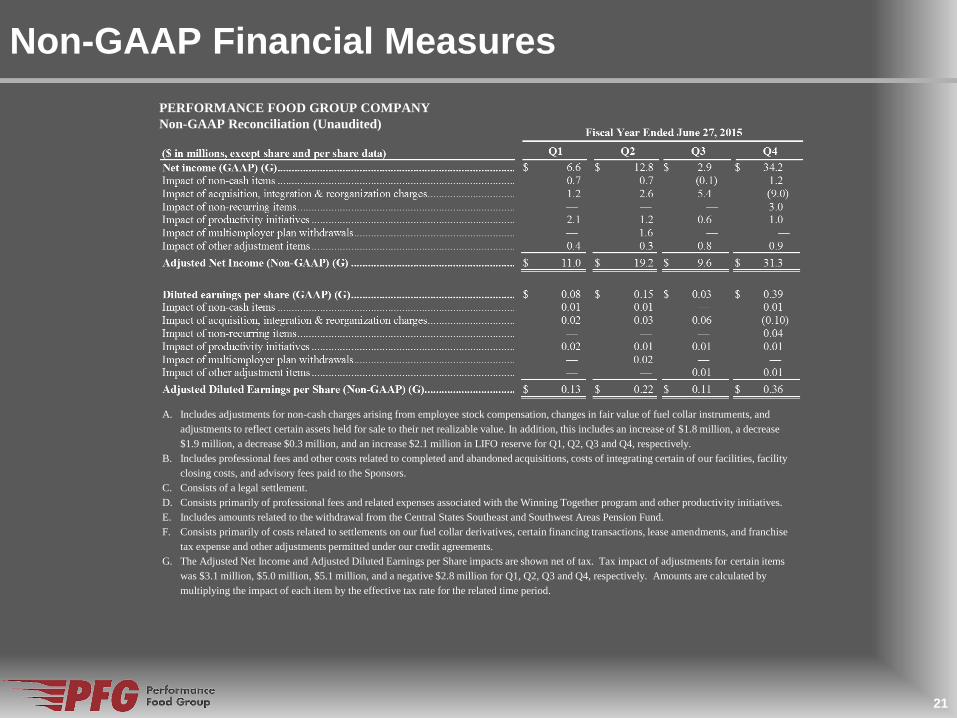
Non-GAAP Financial Measures
21
PERFORMANCE FOOD GROUP COMPANY
Non-GAAP Reconciliation (Unaudited)
A. Includes adjustments for non-cash charges arising from employee stock compensation, changes in fair value of fuel collar instruments, and
adjustments to reflect certain assets held for sale to their net realizable value. In addition, this includes an increase of $1.8 million, a decrease
$1.9 million, a decrease $0.3 million, and an increase $2.1 million in LIFO reserve for Q1, Q2, Q3 and Q4, respectively.
B. Includes professional fees and other costs related to completed and abandoned acquisitions, costs of integrating certain of our facilities, facility
closing costs, and advisory fees paid to the Sponsors.
C. Consists of a legal settlement.
D. Consists primarily of professional fees and related expenses associated with the Winning Together program and other productivity initiatives.
E. Includes amounts related to the withdrawal from the Central States Southeast and Southwest Areas Pension Fund.
F. Consists primarily of costs related to settlements on our fuel collar derivatives, certain financing transactions, lease amendments, and franchise
tax expense and other adjustments permitted under our credit agreements.
G. The Adjusted Net Income and Adjusted Diluted Earnings per Share impacts are shown net of tax. Tax impact of adjustments for certain items
was $3.1 million, $5.0 million, $5.1 million, and a negative $2.8 million for Q1, Q2, Q3 and Q4, respectively. Amounts are calculated by
multiplying the impact of each item by the effective tax rate for the related time period.


![An Overview on Homomorphic Encryption Algorithmsreltech/PFG/2018/PFG-18-28.pdfnew ideas [17], [21]. In parallel, some applications were developed to operate on data encrypted by those](https://img.pdfslide.us/doc/110x75/5f49432cc8cab04d5164b934/an-overview-on-homomorphic-encryption-algorithms-reltechpfg2018pfg-18-28pdf.jpg)