Embed Size (px)
Citation preview

Forest Structure & Distribution Across the Giant Panda Geographic Range
Forest Structure & Distribution Across the Giant Panda Geographic Range
Jianguo (Jack) Liu (Michigan State University)Zhiyun Ouyang (Chinese Academy of Sciences)Jiaguo Qi (Michigan State University)Andrés Viña (Michigan State University)

National Conservation ProgramsNational Conservation Programs
National Forest Conservation Program (NFCP)
Grain-to-Green Program (GTGP)
Liu et al., PNAS. 2008.

Giant Panda HabitatGiant Panda Habitat
• Forest cover (broadleaf, coniferous and mixed)
• Altitudinal range between 1200-3800 m
• < 45o slopes• > 95% of diet is
composed of bamboo
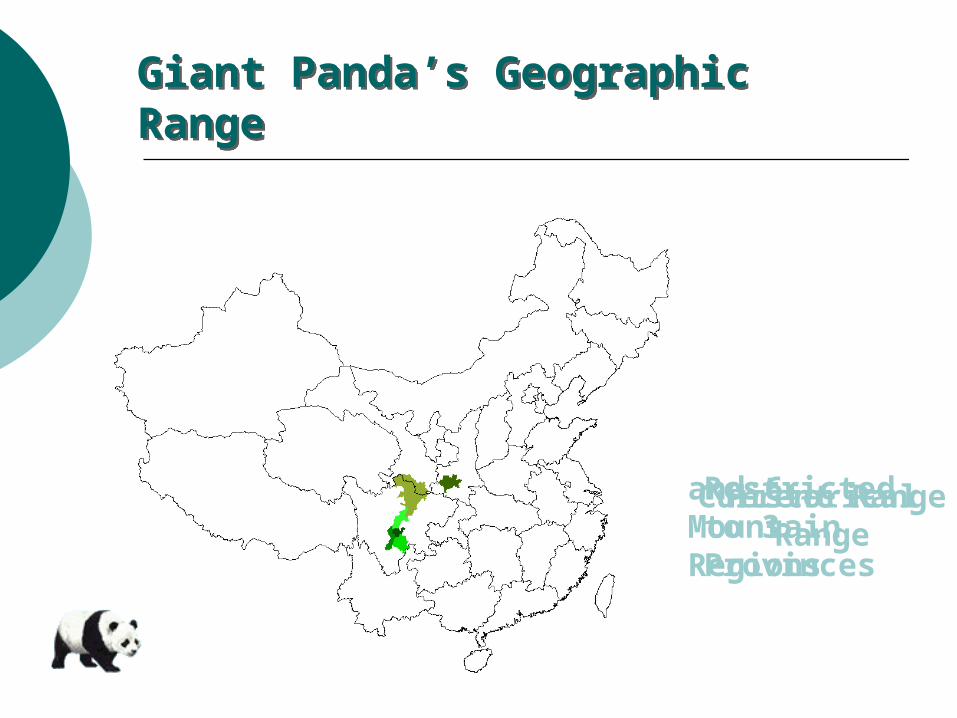
Giant Panda’s Geographic RangeGiant Panda’s Geographic Range
Historical RangeCurrent RangeRestricted to 3 Provinces
and 6 Mountain Regions

ObjectivesObjectives
Assess the spatial distribution of forests
Evaluate structural characteristics of the forests at plot scales
Develop techniques for up-scaling from plots to the entire panda geographic range

Field DataField Data
540 field plots: Forest cover/type Elevation, slope,
aspect Stem density & basal
area Tree species
composition Presence of Giant
Panda signs

MODIS 2004-2007
Forest DistributionForest Distribution
Forest Cover ~ 30% of Giant Panda Range
Coniferous ~ 48%
Deciduous Broadleaf ~ 32%
Mixed ~ 20%
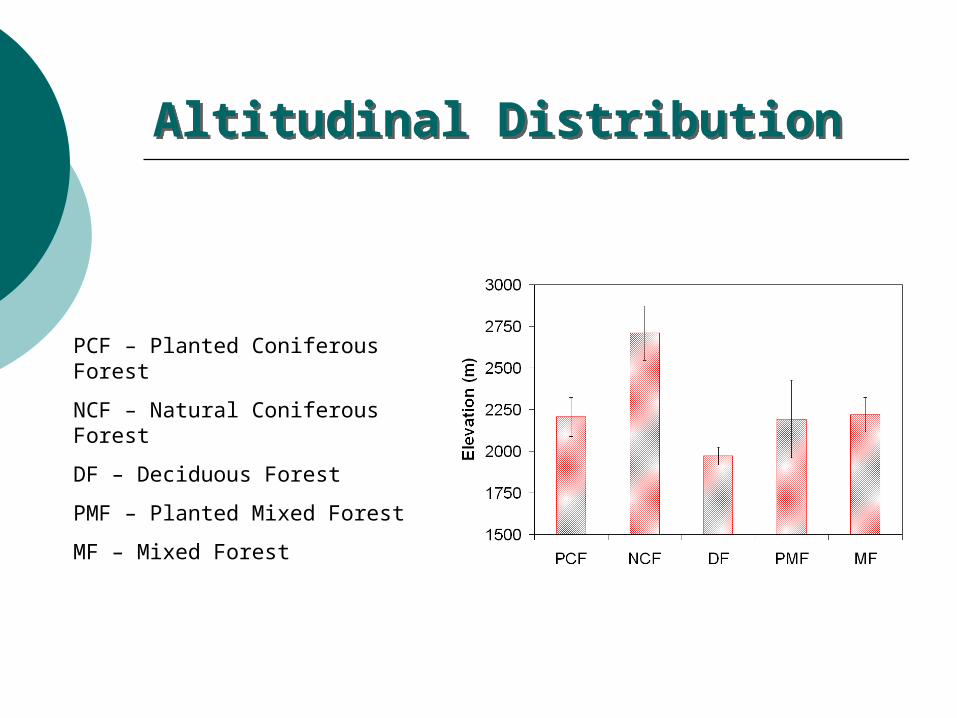
Altitudinal DistributionAltitudinal Distribution
PCF – Planted Coniferous Forest
NCF – Natural Coniferous Forest
DF – Deciduous Forest
PMF – Planted Mixed Forest
MF – Mixed Forest
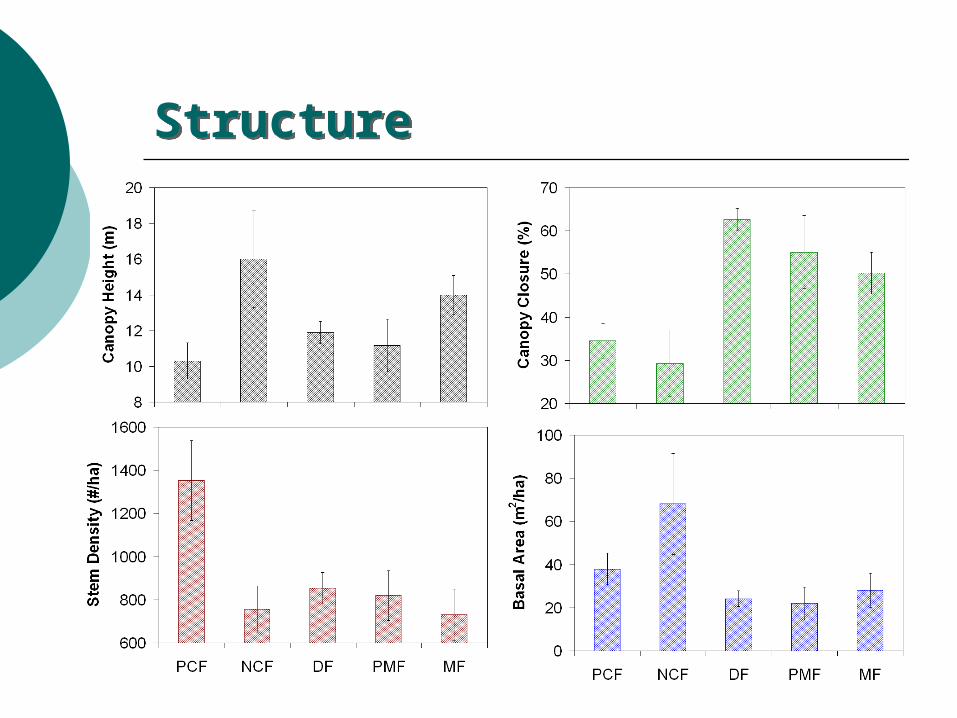
StructureStructure

210 tree species in 109 genera
22 Bamboo species in 6 genera
Few species are widespread across the entire study area
0
10
20
30
40
50
60
70
1 2 3 4 5 6 7 8 9 10 11 12 13 14 15 16 17 18 19 20
Number of Plots
Nu
mb
er o
f T
axa
Species DiversitySpecies Diversity

Species DiversitySpecies Diversity

Mantel TestsInter-plot Floristic & RS Similarity Matrices
Mantel TestsInter-plot Floristic & RS Similarity Matrices
Euclidean/Jaccard Matrices
Tree Spp. Similarity p-value
Spectral Similarity 0.133 < 0.05
NDVI Time Series Similarity
0.360 < 0.001
VARI Time Series Similarity
0.382 < 0.001

Floristic and Phenologic OrdinationsFloristic and Phenologic Ordinations
Floristic – Non-metric multidimensional scaling
Phenologic – Polar Coordinate Transformation

Floristic vs. PhenologicFloristic vs. Phenologic

Nature Reserve RepresentationNature Reserve Representation

ConclusionsConclusions
Forest constitutes a dominant land cover type
Altitudinal gradient explains the distribution of forest types
Significant structural differences occur among forest types

ConclusionsConclusions
A significant relation was found between floristic and phenologic similarities
Time series of VARI exhibited the highest relationship with floristic similarity
Time series of vegetation indices thus constitute suitable surrogates for evaluating floristic similarity across large geographic regions.
Thanks!Thanks!