Embed Size (px)
Citation preview

Foresight resultsand insights to the Black sea
PeaceBuilding networkInterim Technical Report
About CMI and BSPN
About CMI Crisis Management Initiative (CMI) is a Finnish independent non-profit organisation that works to resolve
conflict and build sustainable peace across the globe. Founded in 2000 by President and Nobel Peace Prize
Laureate Martti Ahtisaari, CMI now has a team of over 60 professionals dedicated to conflict prevention
and resolution, and field offices in several regions in the world in addition to our offices in Helsinki and
Brussels.
As a private diplomacy organisation, CMI works to prevent and resolve violent conflict by involving all
actors relevant to achieving peace. We do this by supporting regional mediation capacity and skills, by
bringing together local actors and facilitating confidence-building dialogues, by strengthening the
sustainability of peace through new approaches, and by rapidly providing flexible mediation support at
different stages of the peace process. Our work is based on a strong commitment to long-term processes
and collaboration with local partners.
About BSPN The Black Sea Peacebuilding Network (BSPN) is designed to increase civil society contribution to conflict
resolution in the Black Sea region. The BSPN has allowed civil societies in Armenia, Azerbaijan, Georgia,
Moldova, Russia, Turkey and Ukraine to work towards a common goal and to produce positive precedents.
The project has created networks for national and regional civil societies to build greater regional capacity
in conflict transformation by operating at the grassroots level in the region.
All seven member countries have their own Expert Councils for Conflict Transformation and Peace
Initiatives. The expert councils elaborate alternative and unbiased recommendations for conflict resolution
and peace initiatives. The overall goal of the project is to enable civil society organisations in the seven
Black Sea countries to reach a critical mass in order to become a full-fledged stakeholders in conflict
resolution, and thus to pressure regional governments to work towards peace in the region. The
anticipated impact is enhanced national civil society peacebuilding capacity, ultimately aimed at promoting
sustainable peace in the Black Sea Region.
The Expert Councils for Conflict Transformation and Peace Initiatives in each country are assisted in their
endeavour by CMI’s local partners who act at a national level as a resource centre for the active
peacebuilding community.
The Black Sea Peacebuilding Network is financed by the Finnish Ministry for Foreign Affairs.
Team and partner information
CMI team
Dr Jari Kaivo-oja, Foresight Method Advisor
Dr Ville Brummer, Foresight Method Advisor
Mr Erno Miettinen, Project Officer
Mr Mikheil Mirziashvili, Senior Project Manager
Partners
Armenia: The International Center for Human Development. http://www.ichd.org
Azerbaijan: Helsinki Citizens Assembly – Azerbaijan National Committee. http://www.hca-az.org
Georgia: Georgian Foundation for Strategic and International Studies. http://www.gfsis.org
Republic of Moldova: Institute for Public Policy. http://www.ipp.md
Russian Federation: Carnegie Moscow Center. http://www.carnegie.ru
Turkey: Helsinki Citizens’ Assembly. http://www.hyd.org
Ukraine: Association of Middle East Studies. http://www.uames.org.ua
1
Contents 1 Introduction ............................................................................................................................................... 2
2 The foresight study and workshops in the countries of the Black Sea Peacebuilding Network ............... 3
3 The foresight results of workshops: Country-specific results ................................................................... 6
3.1 Foresight analyses: Russia ................................................................................................................. 6
3.2 Foresight analyses: Turkey ................................................................................................................ 9
3.3 Foresight analyses: Ukraine ............................................................................................................. 11
3.4 Foresight analyses: Armenia ............................................................................................................ 14
3.5 Foresight analyses: Georgia ............................................................................................................. 15
3.6 Foresight analyses: Azerbaijan ........................................................................................................ 18
3.7 Foresight analyses: Moldova ........................................................................................................... 20
4 Comparative trend variable analysis ....................................................................................................... 21
4.1 Social media ..................................................................................................................................... 21
4.2 Brain drain ....................................................................................................................................... 22
4.3 Refugees and IDPs ........................................................................................................................... 24
4.4 Ethnic minorities .............................................................................................................................. 25
4.5 Religious tensions ............................................................................................................................ 26
4.6 Unemployment ................................................................................................................................ 27
4.7 Energy security ................................................................................................................................ 28
4.8 End of cheap oil ............................................................................................................................... 30
4.9 Pollution........................................................................................................................................... 31
4.10 Nuclear power ................................................................................................................................. 32
4.11 Sochi Olympics ................................................................................................................................. 33
4.12 Power centres .................................................................................................................................. 34
4.13 Rule of Law ...................................................................................................................................... 36
4.14 Political participation ....................................................................................................................... 37
4.15 Extreme movements ....................................................................................................................... 38
4.16 Summary of trend variable analyses ............................................................................................... 39
5 Summary of the report ............................................................................................................................ 41
6 References ............................................................................................................................................... 42
2
1 Introduction Today security issues are no longer simply state- and military-centric issues. This report thus aims to
analyse the background factors behind violent conflicts in the Black Sea region. Many critical security
studies have noted that the so-called billiard-ball model with simple causal relationships does not work in
international politics (Booth 2004). Processes leading to conflicts are today more or less complex and multi-
layered (see e.g. Ohmae 1999, Buzan et al. 2007). The challenge of this report is to identify key drivers,
which can potentially increase the probability of violent conflict. We shall also identify those trends, which
have the biggest impact on violent conflict.
As typical with foresight research, foresight contributes to public decision-making and informs policy by
providing systematic knowledge about relevant trends and developments in various environments.
Foresight can provide useful information and knowledge for public policymaking at three distinct levels.
Firstly, the results of foresight can be utilised in the field of intelligence work, where the aim is to gather
systematic foreknowledge of changes in trends and potential new emerging issues and risks that should be
addressed in public policy and strategies. Secondly, foresight results can be used in the field of enhancing
reflective mutual social learning processes among policy makers. Thirdly, the diagnosis and insights of
foresight processes can help the public decision-makers to formulate better informed and better prepared
future visions and grand strategies of politics (Habegger 2010, 49–50, Kuosa 2012, 137–138). Almost
needless to say, also international agencies, NGOs and governments can use foresight analyses in various
contexts of international politics.
The foresight analyses in this report act as a driver of reflective mutual social learning processes among
policy makers that stimulate the generation of common public policy visions. We want also to provide
information and knowledge to civil society organisations. The foresight analyses in this report provide
country-specific information and knowledge and trend-related information and knowledge.
In this report we summarise key results and findings of the foresight workshops in the Expert Councils of
the Black Sea Peacebuilding Network (BSPN), which were held in Turkey, Moldova, Russia, Ukraine,
Armenia, Georgia and Azerbaijan. The workshops were run in May–June 2012 in the capital cities of each
country, except in Ukraine where the seminar was held in Simferopol, the capital of the Crimean
autonomous region. The objective of this report is to provide decision-makers tools and insights for
analyzing conflicts and security issues. The foresight cycle in the Black Sea Peacebuilding Network (BSPN) is
two years.
This report is focused on first year key activities, which include analyses of key trends, which could lead to
violent conflicts in the Black Sea region. Conflicts can be local, national or broader international conflicts.
From these alternative perspectives we want to present some results which are relevant for (1) the whole
Black Sea region, (2) each BSPN county, and also (2) cross-border conflicts.
The analysed trends are based on the previous workshops and policy dialogues of the Black Sea
Peacebuilding Network (BSPN). In this way, foresight analyses continue logically and systemically the
valuable work and other activities of the BSPN. In the next phase of the foresight process, the emphasis will
be in the policy recommendations, which support constructive solutions. The BSPN foresight process has a
strong nature of piloting and testing foresight methods and tools.
One key challenge of the foresight analyses is to identify similarities and differences between the countries
concerning the drivers of conflicts. We are piloting and demonstrating the methodology, which could be
3
useful also in other conflict prevention and transformation processes. Especially we want: (1) to analyse
what kind of trends and recommendations are most crucial in view of development of conflicts in the Black
Sea Region, and (2) to create systematic process for comparing the results from different countries.
We want to underline that the objective is not to get final, implementable results at this point of the
foresight process.
The report is organised in the following way. In the second chapter, the background of the foresight study is
reported. In the third chapter, we shall report the results for each country of evaluations (probability and
impact evaluation) and the results of cross-impact analysis. In the fourth chapter, the specific results of 15
trends are reported. In the fifth chapter, a short summary is presented.
2 The foresight study and workshops in the countries of the Black Sea
Peacebuilding Network In chapter 4, we shortly present the background of foresight analyses on each country. The results are
presented for Russia, Turkey, Ukraine, Armenia, Georgia, Azerbaijan and Moldova — the seven BSPN
countries. The workshops were organised on the following dates:
Istanbul, Turkey: 12 May 2012
Chisinau, Moldova: 14 May 2012
Moscow, Russia: 17 May 2012
Yerevan, Armenia: 23 May 2012
Tbilisi, Georgia: 25 May 2012
Simferopol, Ukraine: 2 June 2012
Baku, Azerbaijan: 5 June 2012
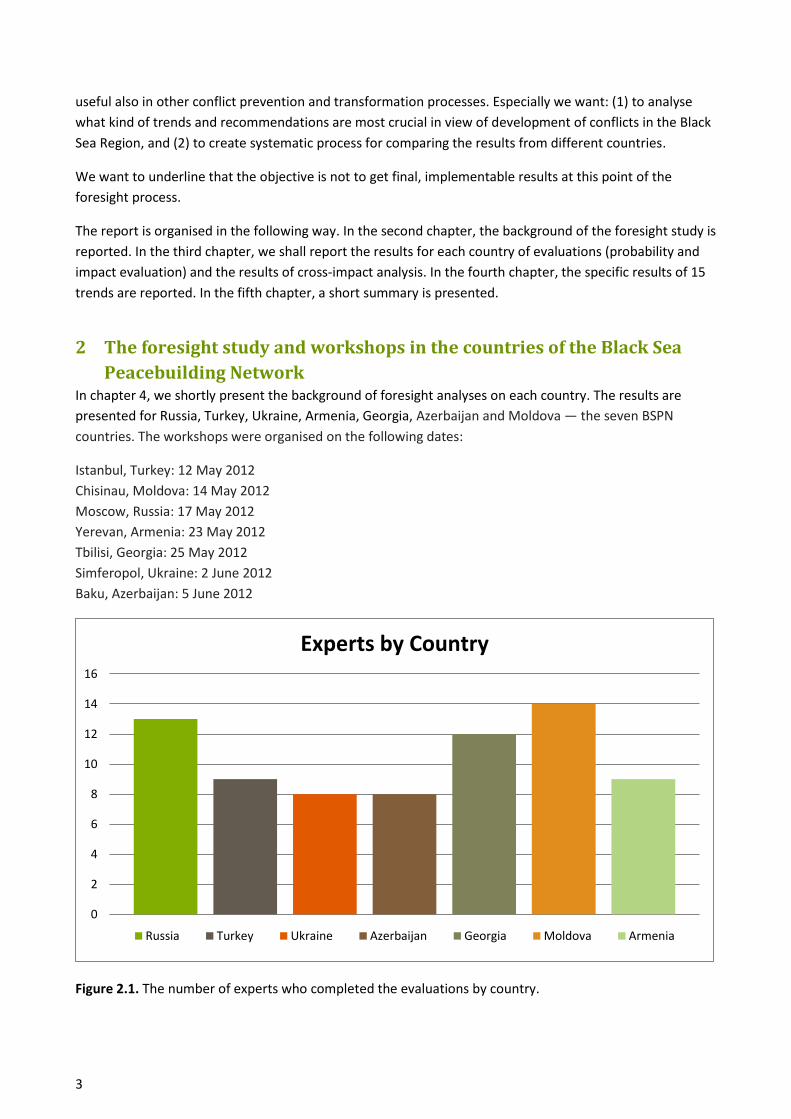
Figure 2.1. The number of experts who completed the evaluations by country.
0
2
4
6
8
10
12
14
16
Experts by Country
Russia Turkey Ukraine Azerbaijan Georgia Moldova Armenia
4
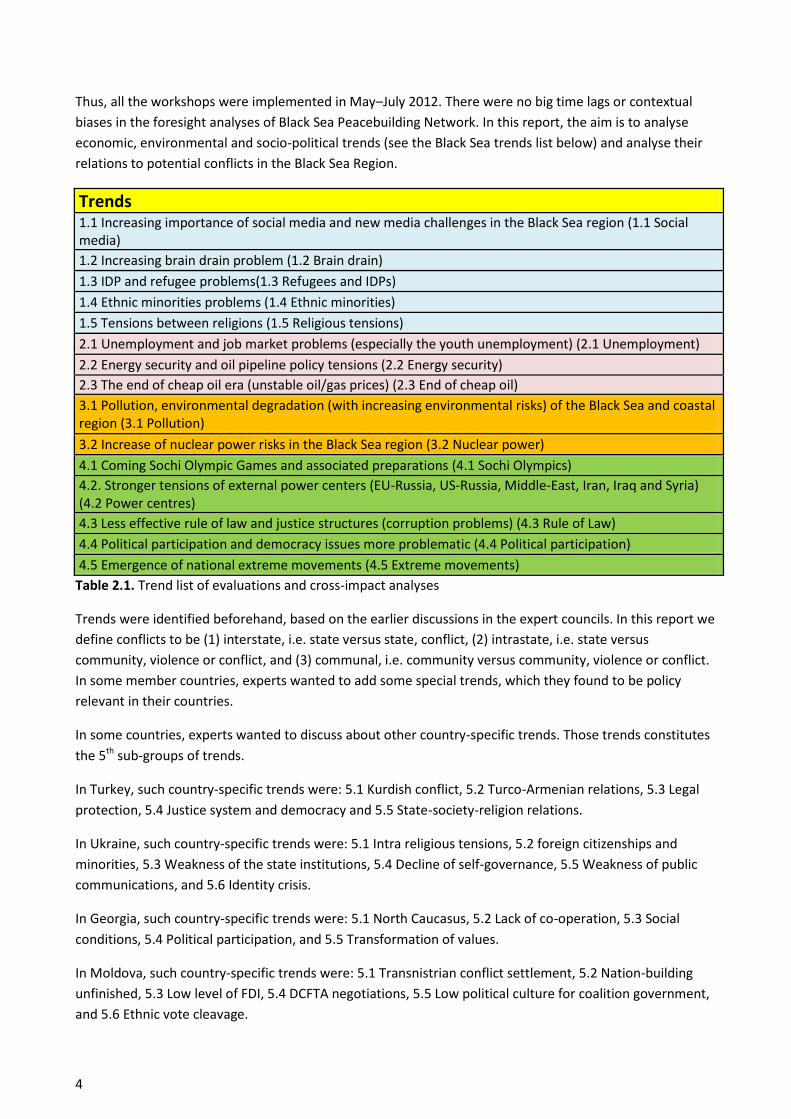
Thus, all the workshops were implemented in May–July 2012. There were no big time lags or contextual
biases in the foresight analyses of Black Sea Peacebuilding Network. In this report, the aim is to analyse
economic, environmental and socio-political trends (see the Black Sea trends list below) and analyse their
relations to potential conflicts in the Black Sea Region.
Trends 1.1 Increasing importance of social media and new media challenges in the Black Sea region (1.1 Social media)
1.2 Increasing brain drain problem (1.2 Brain drain)
1.3 IDP and refugee problems(1.3 Refugees and IDPs)
1.4 Ethnic minorities problems (1.4 Ethnic minorities)
1.5 Tensions between religions (1.5 Religious tensions)
2.1 Unemployment and job market problems (especially the youth unemployment) (2.1 Unemployment)
2.2 Energy security and oil pipeline policy tensions (2.2 Energy security)
2.3 The end of cheap oil era (unstable oil/gas prices) (2.3 End of cheap oil)
3.1 Pollution, environmental degradation (with increasing environmental risks) of the Black Sea and coastal region (3.1 Pollution)
3.2 Increase of nuclear power risks in the Black Sea region (3.2 Nuclear power)
4.1 Coming Sochi Olympic Games and associated preparations (4.1 Sochi Olympics)
4.2. Stronger tensions of external power centers (EU-Russia, US-Russia, Middle-East, Iran, Iraq and Syria) (4.2 Power centres)
4.3 Less effective rule of law and justice structures (corruption problems) (4.3 Rule of Law)
4.4 Political participation and democracy issues more problematic (4.4 Political participation)
4.5 Emergence of national extreme movements (4.5 Extreme movements)
Table 2.1. Trend list of evaluations and cross-impact analyses
Trends were identified beforehand, based on the earlier discussions in the expert councils. In this report we
define conflicts to be (1) interstate, i.e. state versus state, conflict, (2) intrastate, i.e. state versus
community, violence or conflict, and (3) communal, i.e. community versus community, violence or conflict.
In some member countries, experts wanted to add some special trends, which they found to be policy
relevant in their countries.
In some countries, experts wanted to discuss about other country-specific trends. Those trends constitutes
the 5th sub-groups of trends.
In Turkey, such country-specific trends were: 5.1 Kurdish conflict, 5.2 Turco-Armenian relations, 5.3 Legal
protection, 5.4 Justice system and democracy and 5.5 State-society-religion relations.
In Ukraine, such country-specific trends were: 5.1 Intra religious tensions, 5.2 foreign citizenships and
minorities, 5.3 Weakness of the state institutions, 5.4 Decline of self-governance, 5.5 Weakness of public
communications, and 5.6 Identity crisis.
In Georgia, such country-specific trends were: 5.1 North Caucasus, 5.2 Lack of co-operation, 5.3 Social
conditions, 5.4 Political participation, and 5.5 Transformation of values.
In Moldova, such country-specific trends were: 5.1 Transnistrian conflict settlement, 5.2 Nation-building
unfinished, 5.3 Low level of FDI, 5.4 DCFTA negotiations, 5.5 Low political culture for coalition government,
and 5.6 Ethnic vote cleavage.
5
The concept of trend and basic question of the workshop was defined in the following way. A trend is a
socio-political, economic, environmental or technical driver (variable) that may contribute to the
development of a violent conflict.
The basic structure of the workshops was the following:
Economic, environmental and socio-political trends (based on policy papers and materials of the BSPN);
Prioritisation (trends: probability and impact), and
Cross-Impact analysis (impacts of trends).
Evaluation included two key issues: impact and probability. These issues were defined in the following
ways:
Impact – How strong an impact the trend may have to the development of a violent conflict(s) in the Black
Sea Region, and
Probability – How probable the trend will have the described impact.
In the BSPN workshops, participants discussed also the question of how the trends may cause conflicts.
They also discussed and identified developments, a specific chain of events starting from a trend(s) leading
to a serious conflict.
Evaluation in the workshops was carried out using Likert scale 1–5:
0 – no impact / impossible,
1 – small impact / small probability,
2 – moderate impact / moderate probability,
3 – rather strong impact / rather probable,
4 – strong impact / probable,
5 – very strong impact / very probable.
Cross-impact analysis is the general name given to a family of foresight techniques designed to evaluate
changes in the probability of the occurrence of a given set of events, consequent on the actual occurrence
of one of them. Here we have applied this technique to critical trends relevant for violent conflict in the
Black Sea region. The major benefit of using a cross impact analysis is the ability to show how one trend
(variable) impacts another trend (variable).
On the basis of the CIA technique we can identify drivers, which are highly influential trends (variables) and
so called driven trends (or buffer variables), which are highly dependent variables. For policymakers, critical
drivers are key variables, because they make things happen. Driven variables are more problematic,
because they are so much driven by other trends and variables. We can also identify trends which are “in
between” these driver and driven trends: less influential and non-dependent variables (active variables),
and influential and dependent variables (reactive variables) (Gordon & Hayward 1968, 100-116).
6
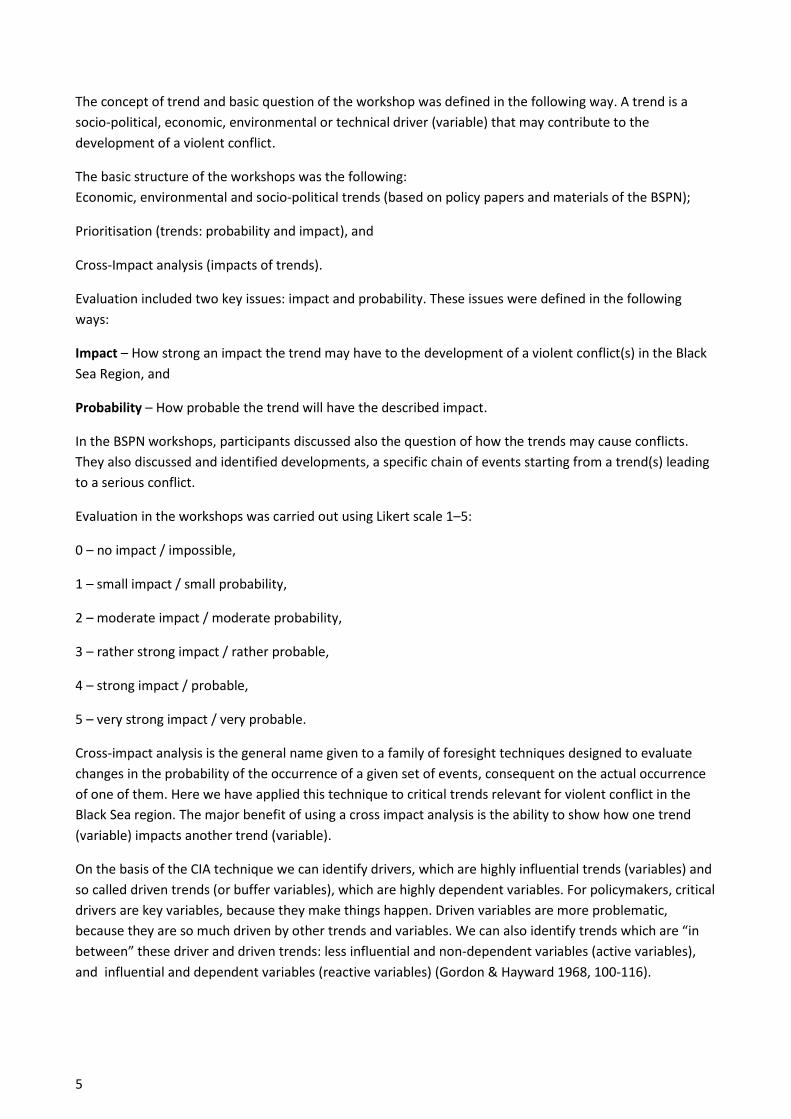
Figure 2.2. Variable interpretation
We can present following interpretations of variables (see e.g. Alter 1979). Active variables allow effective
changes in the system and thus have the potential to re-stabilize it in a new state. They are of major
interest for the strategic process.
Critical driver variables have to be handled with caution because they have very big potential for driving
and changing processes, but they can easily get out of control, or destabilize the system. For the emergence
of violent conflicts these driver variables are very critical ones.
Reactive variables in the reactive zone represent important indicators but have no steering potential.
Dependent buffer variables have a limited effect on the system, and the neutral zone provides variables for
self-regulation but again no good candidates for steering.
In chapters 3 and 4 we shall report the key findings of workshop results in the BSPS network. We pay
special attention to critical drivers and driven buffer variables.
3 The foresight results of workshops: Country-specific results
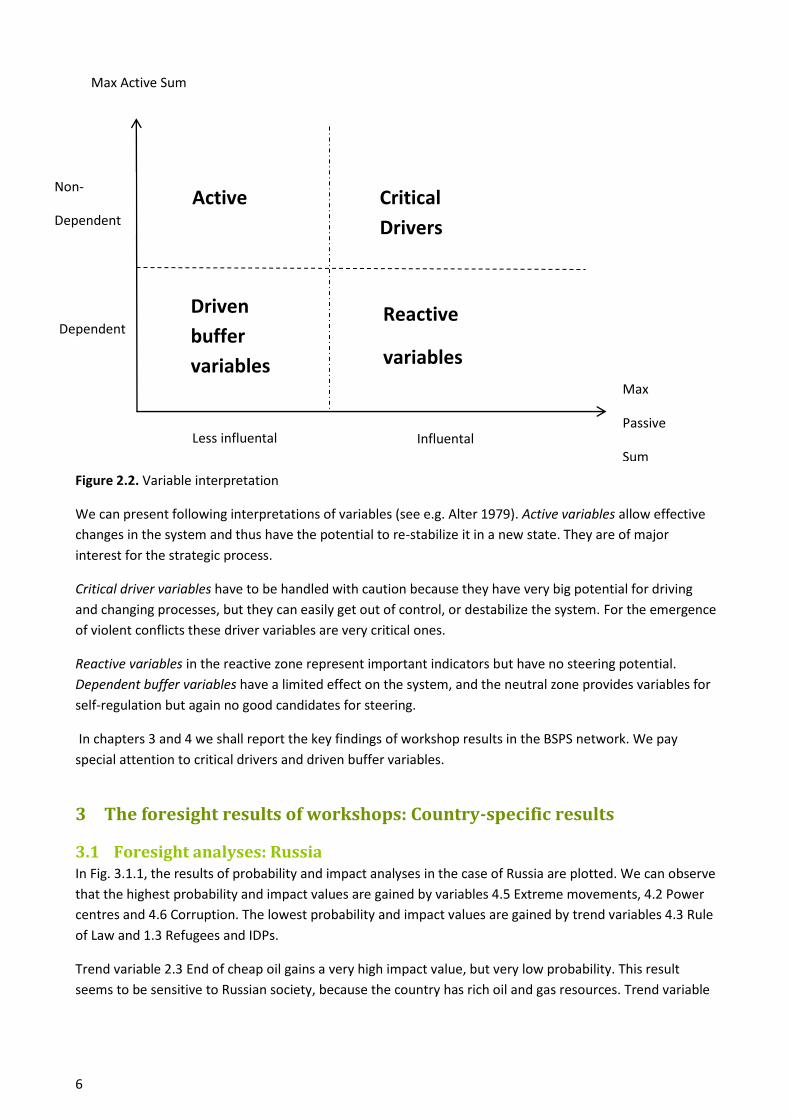
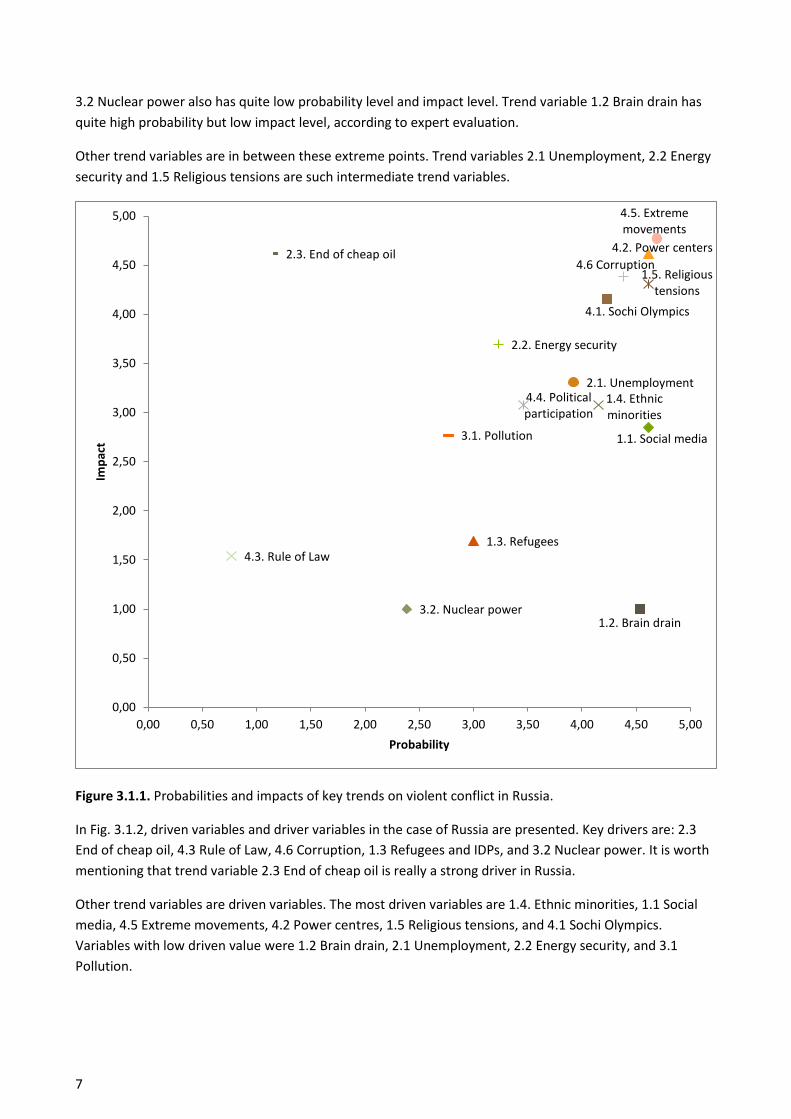
3.1 Foresight analyses: Russia In Fig. 3.1.1, the results of probability and impact analyses in the case of Russia are plotted. We can observe
that the highest probability and impact values are gained by variables 4.5 Extreme movements, 4.2 Power
centres and 4.6 Corruption. The lowest probability and impact values are gained by trend variables 4.3 Rule
of Law and 1.3 Refugees and IDPs.
Trend variable 2.3 End of cheap oil gains a very high impact value, but very low probability. This result
seems to be sensitive to Russian society, because the country has rich oil and gas resources. Trend variable
Critical
Drivers
Driven
buffer
variables
Less influental Influental
Dependent
Non-
Dependent
t
Reactive
variables
Active
Max Active Sum
Max
Passive
Sum
7
3.2 Nuclear power also has quite low probability level and impact level. Trend variable 1.2 Brain drain has
quite high probability but low impact level, according to expert evaluation.
Other trend variables are in between these extreme points. Trend variables 2.1 Unemployment, 2.2 Energy
security and 1.5 Religious tensions are such intermediate trend variables.
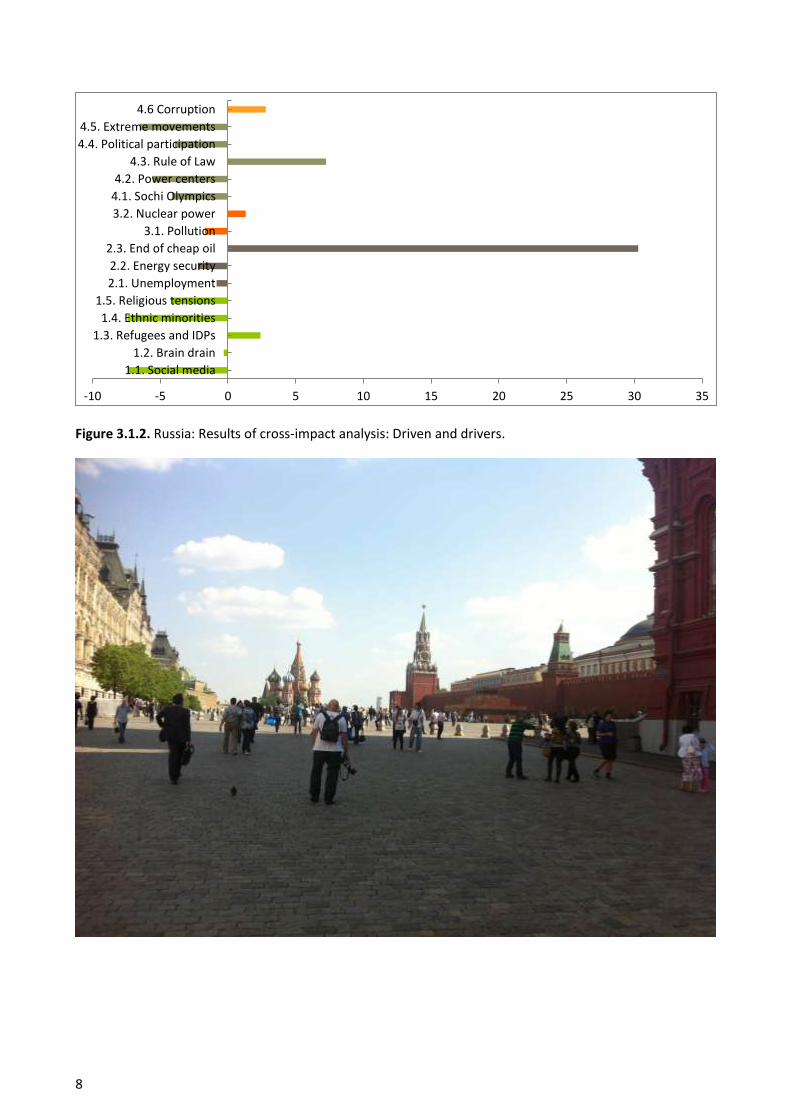
Figure 3.1.1. Probabilities and impacts of key trends on violent conflict in Russia.
In Fig. 3.1.2, driven variables and driver variables in the case of Russia are presented. Key drivers are: 2.3
End of cheap oil, 4.3 Rule of Law, 4.6 Corruption, 1.3 Refugees and IDPs, and 3.2 Nuclear power. It is worth
mentioning that trend variable 2.3 End of cheap oil is really a strong driver in Russia.
Other trend variables are driven variables. The most driven variables are 1.4. Ethnic minorities, 1.1 Social
media, 4.5 Extreme movements, 4.2 Power centres, 1.5 Religious tensions, and 4.1 Sochi Olympics.
Variables with low driven value were 1.2 Brain drain, 2.1 Unemployment, 2.2 Energy security, and 3.1
Pollution.
1.1. Social media
1.2. Brain drain
1.3. Refugees
1.4. Ethnic minorities
1.5. Religious tensions
2.1. Unemployment
2.2. Energy security
2.3. End of cheap oil
3.1. Pollution
3.2. Nuclear power
4.1. Sochi Olympics
4.2. Power centers
4.3. Rule of Law
4.4. Political participation
4.5. Extreme movements
4.6 Corruption
0,00
0,50
1,00
1,50
2,00
2,50
3,00
3,50
4,00
4,50
5,00
0,00 0,50 1,00 1,50 2,00 2,50 3,00 3,50 4,00 4,50 5,00
Imp
act
Probability
8
Figure 3.1.2. Russia: Results of cross-impact analysis: Driven and drivers.
-10 -5 0 5 10 15 20 25 30 35
1.1. Social media
1.2. Brain drain
1.3. Refugees and IDPs
1.4. Ethnic minorities
1.5. Religious tensions
2.1. Unemployment
2.2. Energy security
2.3. End of cheap oil
3.1. Pollution
3.2. Nuclear power
4.1. Sochi Olympics
4.2. Power centers
4.3. Rule of Law
4.4. Political participation
4.5. Extreme movements
4.6 Corruption
9
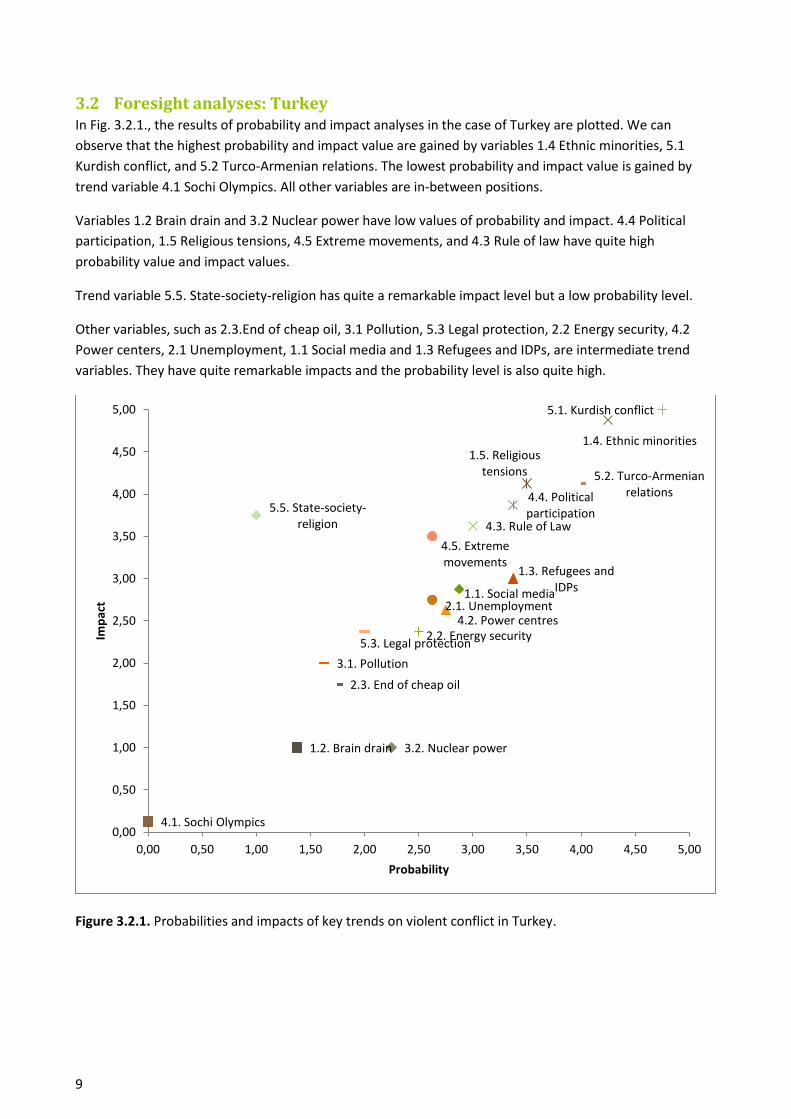
3.2 Foresight analyses: Turkey In Fig. 3.2.1., the results of probability and impact analyses in the case of Turkey are plotted. We can
observe that the highest probability and impact value are gained by variables 1.4 Ethnic minorities, 5.1
Kurdish conflict, and 5.2 Turco-Armenian relations. The lowest probability and impact value is gained by
trend variable 4.1 Sochi Olympics. All other variables are in-between positions.
Variables 1.2 Brain drain and 3.2 Nuclear power have low values of probability and impact. 4.4 Political
participation, 1.5 Religious tensions, 4.5 Extreme movements, and 4.3 Rule of law have quite high
probability value and impact values.
Trend variable 5.5. State-society-religion has quite a remarkable impact level but a low probability level.
Other variables, such as 2.3.End of cheap oil, 3.1 Pollution, 5.3 Legal protection, 2.2 Energy security, 4.2
Power centers, 2.1 Unemployment, 1.1 Social media and 1.3 Refugees and IDPs, are intermediate trend
variables. They have quite remarkable impacts and the probability level is also quite high.
Figure 3.2.1. Probabilities and impacts of key trends on violent conflict in Turkey.
1.1. Social media
1.2. Brain drain
1.3. Refugees and IDPs
1.4. Ethnic minorities 1.5. Religious
tensions
2.1. Unemployment
2.2. Energy security
2.3. End of cheap oil
3.1. Pollution
3.2. Nuclear power
4.1. Sochi Olympics
4.2. Power centres
4.3. Rule of Law
4.4. Political participation
4.5. Extreme movements
5.1. Kurdish conflict
5.2. Turco-Armenian relations
5.3. Legal protection
5.5. State-society-religion
0,00
0,50
1,00
1,50
2,00
2,50
3,00
3,50
4,00
4,50
5,00
0,00 0,50 1,00 1,50 2,00 2,50 3,00 3,50 4,00 4,50 5,00
Imp
act
Probability
10
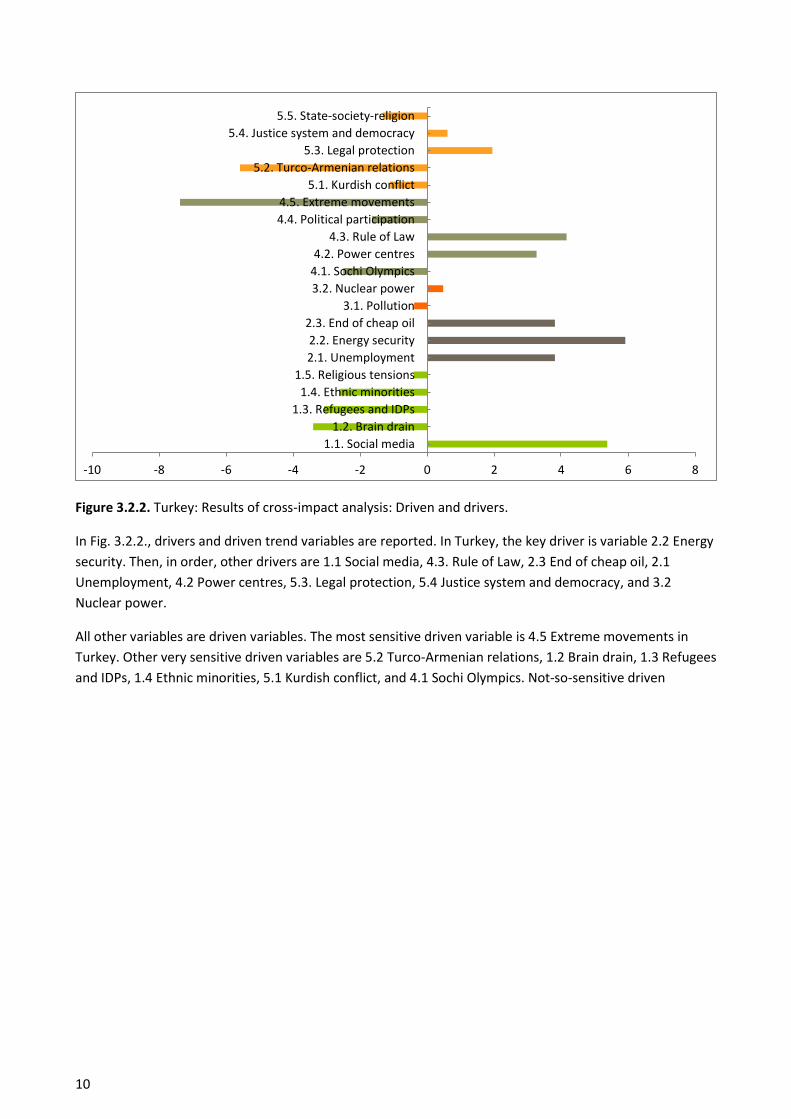
Figure 3.2.2. Turkey: Results of cross-impact analysis: Driven and drivers.
In Fig. 3.2.2., drivers and driven trend variables are reported. In Turkey, the key driver is variable 2.2 Energy
security. Then, in order, other drivers are 1.1 Social media, 4.3. Rule of Law, 2.3 End of cheap oil, 2.1
Unemployment, 4.2 Power centres, 5.3. Legal protection, 5.4 Justice system and democracy, and 3.2
Nuclear power.
All other variables are driven variables. The most sensitive driven variable is 4.5 Extreme movements in
Turkey. Other very sensitive driven variables are 5.2 Turco-Armenian relations, 1.2 Brain drain, 1.3 Refugees
and IDPs, 1.4 Ethnic minorities, 5.1 Kurdish conflict, and 4.1 Sochi Olympics. Not-so-sensitive driven
-10 -8 -6 -4 -2 0 2 4 6 8
1.1. Social media
1.2. Brain drain
1.3. Refugees and IDPs
1.4. Ethnic minorities
1.5. Religious tensions
2.1. Unemployment
2.2. Energy security
2.3. End of cheap oil
3.1. Pollution
3.2. Nuclear power
4.1. Sochi Olympics
4.2. Power centres
4.3. Rule of Law
4.4. Political participation
4.5. Extreme movements
5.1. Kurdish conflict
5.2. Turco-Armenian relations
5.3. Legal protection
5.4. Justice system and democracy
5.5. State-society-religion
11
variables are 3.1 Pollution, and 1.5 Religious tensions.
3.3 Foresight analyses: Ukraine
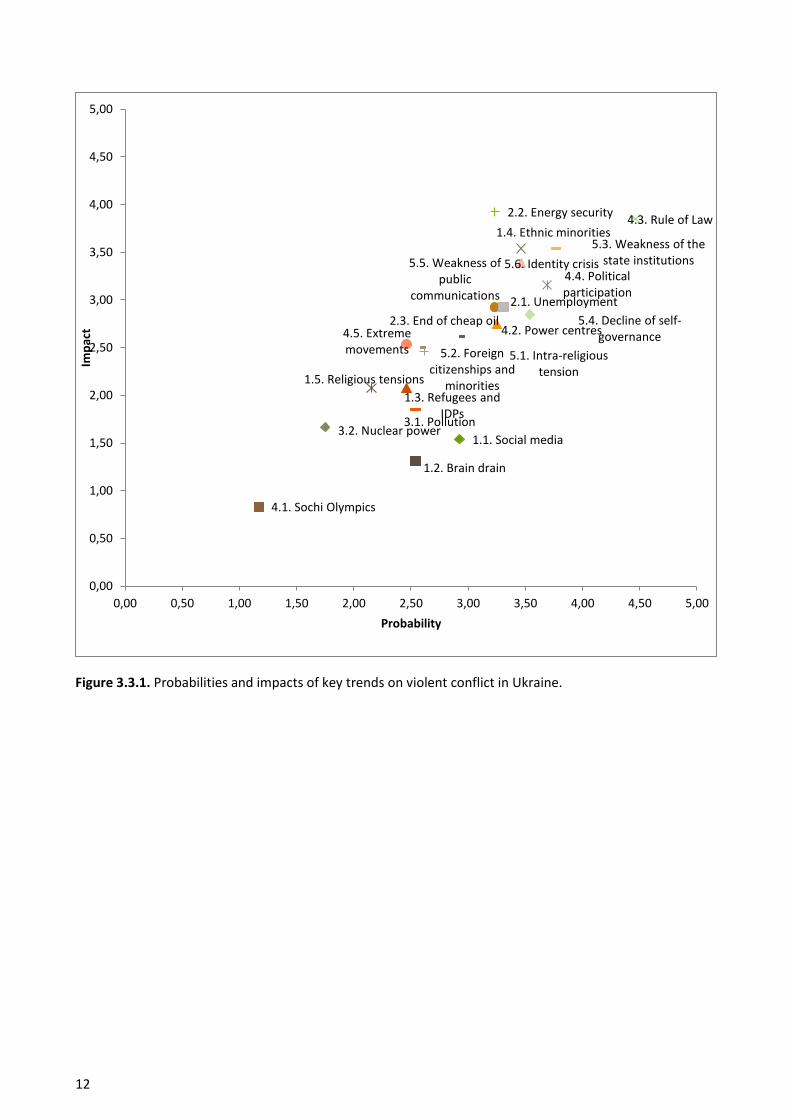
Results of probability evaluation and impact evaluation are presented in Fig. 3.3.1. In general, all trend
variables are quite clustered. The following variables have very high probabilities and high impact levels:
4.3 Rule of Law, 5.3 Weakness of state institutions, 5.6 Identity crisis, 2.2 Energy security, 1.4 Ethnic
minorities, 5.5 Weakness of public communication, 2.1 Unemployment, 5.4 Decline of self-governance, 2.3
End of cheap oil, and 2.1 Power centres.
Trend variable 4.1 Sochi Olympics has low probability value and low impact value. Trend variables 3.2
Nuclear power, 1.2 Brain drain, 3.1 Pollution, and 1.1. Social media also have low impact values and low
probability levels.
Intermediate trend variables are 1.5 Religious tensions, 1.3 Refugees and IDPs, 5.2 Foreign tension
citizenships and minorities, 5.1 Intra-religious movements, and 4.5 Extreme movements.
12
Figure 3.3.1. Probabilities and impacts of key trends on violent conflict in Ukraine.
1.1. Social media
1.2. Brain drain
1.3. Refugees and IDPs
1.4. Ethnic minorities
1.5. Religious tensions
2.1. Unemployment
2.2. Energy security
2.3. End of cheap oil
3.1. Pollution 3.2. Nuclear power
4.1. Sochi Olympics
4.2. Power centres
4.3. Rule of Law
4.4. Political participation
4.5. Extreme movements 5.1. Intra-religious
tension
5.2. Foreign citizenships and
minorities
5.3. Weakness of the state institutions
5.4. Decline of self-governance
5.5. Weakness of public
communications
5.6. Identity crisis
0,00
0,50
1,00
1,50
2,00
2,50
3,00
3,50
4,00
4,50
5,00
0,00 0,50 1,00 1,50 2,00 2,50 3,00 3,50 4,00 4,50 5,00
Imp
act
Probability
13
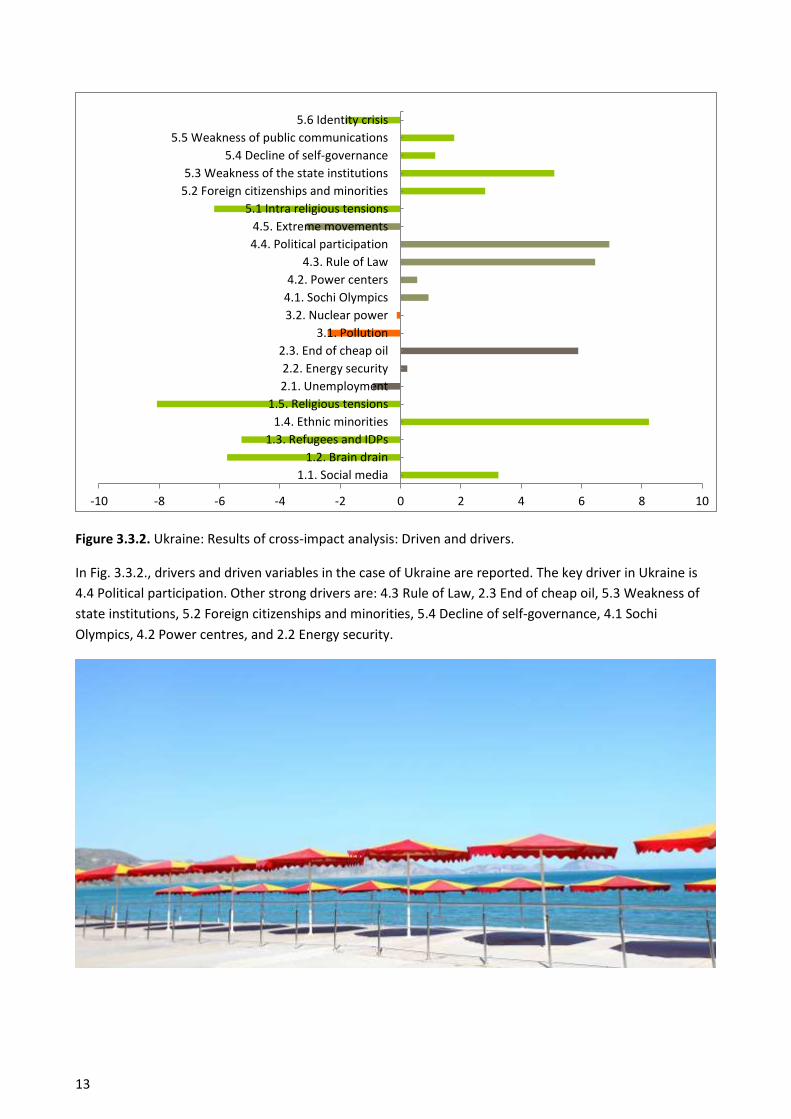
Figure 3.3.2. Ukraine: Results of cross-impact analysis: Driven and drivers.
In Fig. 3.3.2., drivers and driven variables in the case of Ukraine are reported. The key driver in Ukraine is
4.4 Political participation. Other strong drivers are: 4.3 Rule of Law, 2.3 End of cheap oil, 5.3 Weakness of
state institutions, 5.2 Foreign citizenships and minorities, 5.4 Decline of self-governance, 4.1 Sochi
Olympics, 4.2 Power centres, and 2.2 Energy security.
-10 -8 -6 -4 -2 0 2 4 6 8 10
1.1. Social media
1.2. Brain drain
1.3. Refugees and IDPs
1.4. Ethnic minorities
1.5. Religious tensions
2.1. Unemployment
2.2. Energy security
2.3. End of cheap oil
3.1. Pollution
3.2. Nuclear power
4.1. Sochi Olympics
4.2. Power centers
4.3. Rule of Law
4.4. Political participation
4.5. Extreme movements
5.1 Intra religious tensions
5.2 Foreign citizenships and minorities
5.3 Weakness of the state institutions
5.4 Decline of self-governance
5.5 Weakness of public communications
5.6 Identity crisis
14
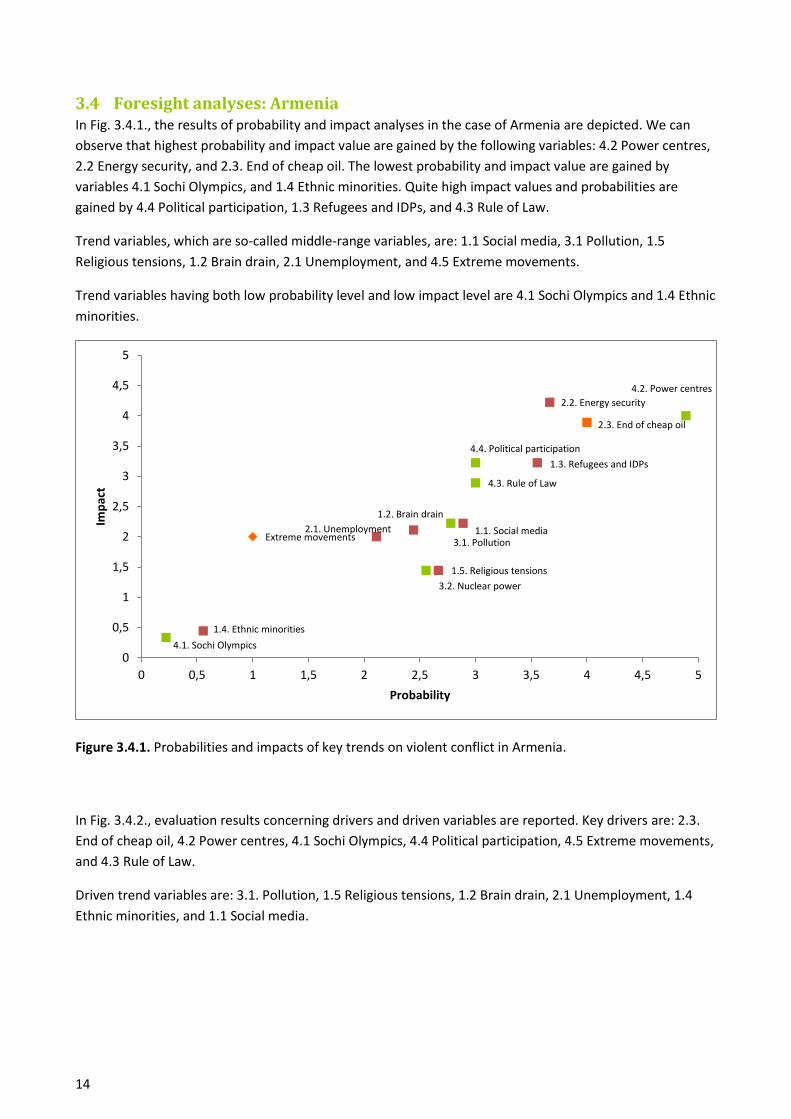
3.4 Foresight analyses: Armenia In Fig. 3.4.1., the results of probability and impact analyses in the case of Armenia are depicted. We can
observe that highest probability and impact value are gained by the following variables: 4.2 Power centres,
2.2 Energy security, and 2.3. End of cheap oil. The lowest probability and impact value are gained by
variables 4.1 Sochi Olympics, and 1.4 Ethnic minorities. Quite high impact values and probabilities are
gained by 4.4 Political participation, 1.3 Refugees and IDPs, and 4.3 Rule of Law.
Trend variables, which are so-called middle-range variables, are: 1.1 Social media, 3.1 Pollution, 1.5
Religious tensions, 1.2 Brain drain, 2.1 Unemployment, and 4.5 Extreme movements.
Trend variables having both low probability level and low impact level are 4.1 Sochi Olympics and 1.4 Ethnic
minorities.
Figure 3.4.1. Probabilities and impacts of key trends on violent conflict in Armenia.
In Fig. 3.4.2., evaluation results concerning drivers and driven variables are reported. Key drivers are: 2.3.
End of cheap oil, 4.2 Power centres, 4.1 Sochi Olympics, 4.4 Political participation, 4.5 Extreme movements,
and 4.3 Rule of Law.
Driven trend variables are: 3.1. Pollution, 1.5 Religious tensions, 1.2 Brain drain, 2.1 Unemployment, 1.4
Ethnic minorities, and 1.1 Social media.
1.1. Social media
1.2. Brain drain
1.3. Refugees and IDPs
1.4. Ethnic minorities
1.5. Religious tensions
2.1. Unemployment
2.2. Energy security
2.3. End of cheap oil
3.1. Pollution
3.2. Nuclear power
4.1. Sochi Olympics
4.2. Power centres
4.3. Rule of Law
4.4. Political participation
Extreme movements
0
0,5
1
1,5
2
2,5
3
3,5
4
4,5
5
0 0,5 1 1,5 2 2,5 3 3,5 4 4,5 5
Imp
act
Probability
15
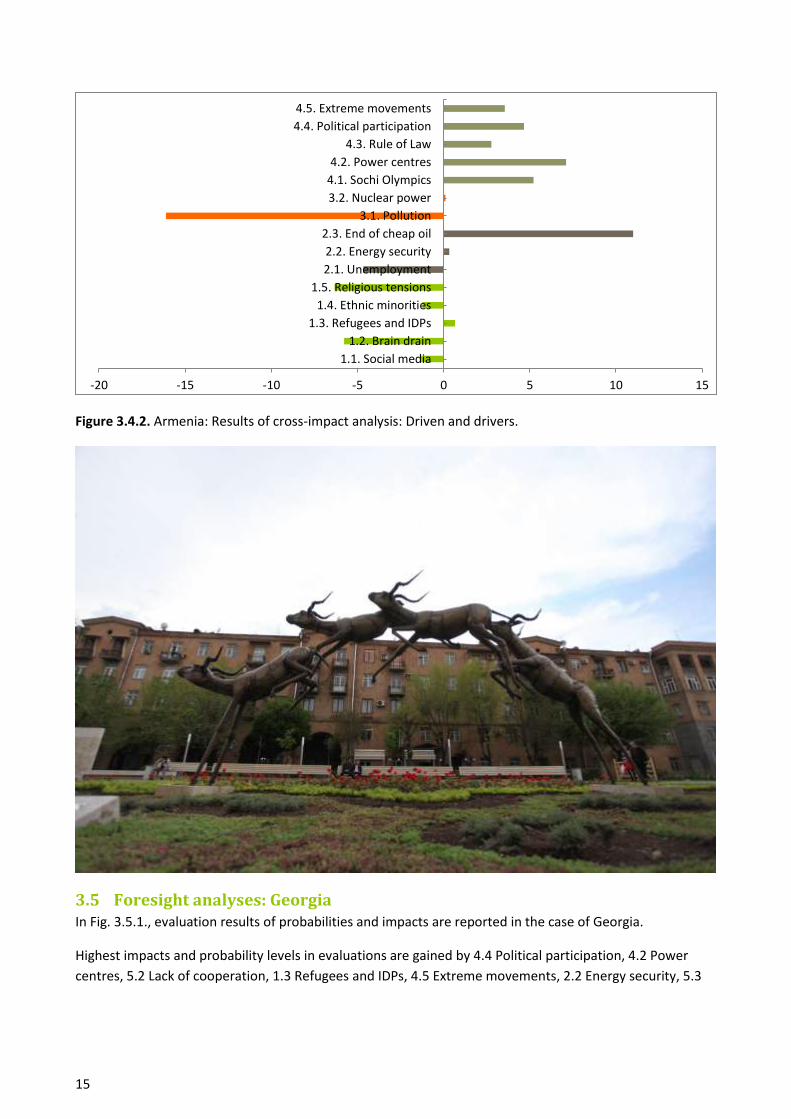
Figure 3.4.2. Armenia: Results of cross-impact analysis: Driven and drivers.
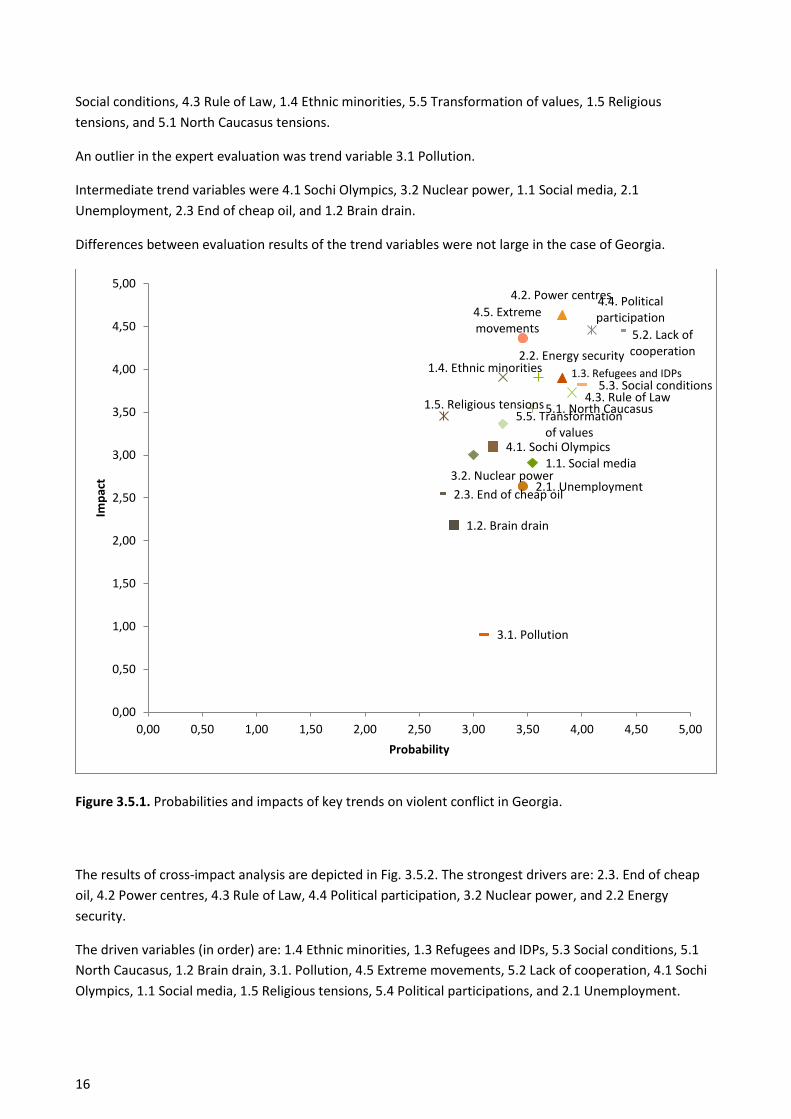
3.5 Foresight analyses: Georgia In Fig. 3.5.1., evaluation results of probabilities and impacts are reported in the case of Georgia.
Highest impacts and probability levels in evaluations are gained by 4.4 Political participation, 4.2 Power
centres, 5.2 Lack of cooperation, 1.3 Refugees and IDPs, 4.5 Extreme movements, 2.2 Energy security, 5.3
-20 -15 -10 -5 0 5 10 15
1.1. Social media
1.2. Brain drain
1.3. Refugees and IDPs
1.4. Ethnic minorities
1.5. Religious tensions
2.1. Unemployment
2.2. Energy security
2.3. End of cheap oil
3.1. Pollution
3.2. Nuclear power
4.1. Sochi Olympics
4.2. Power centres
4.3. Rule of Law
4.4. Political participation
4.5. Extreme movements
16
Social conditions, 4.3 Rule of Law, 1.4 Ethnic minorities, 5.5 Transformation of values, 1.5 Religious
tensions, and 5.1 North Caucasus tensions.
An outlier in the expert evaluation was trend variable 3.1 Pollution.
Intermediate trend variables were 4.1 Sochi Olympics, 3.2 Nuclear power, 1.1 Social media, 2.1
Unemployment, 2.3 End of cheap oil, and 1.2 Brain drain.
Differences between evaluation results of the trend variables were not large in the case of Georgia.
Figure 3.5.1. Probabilities and impacts of key trends on violent conflict in Georgia.
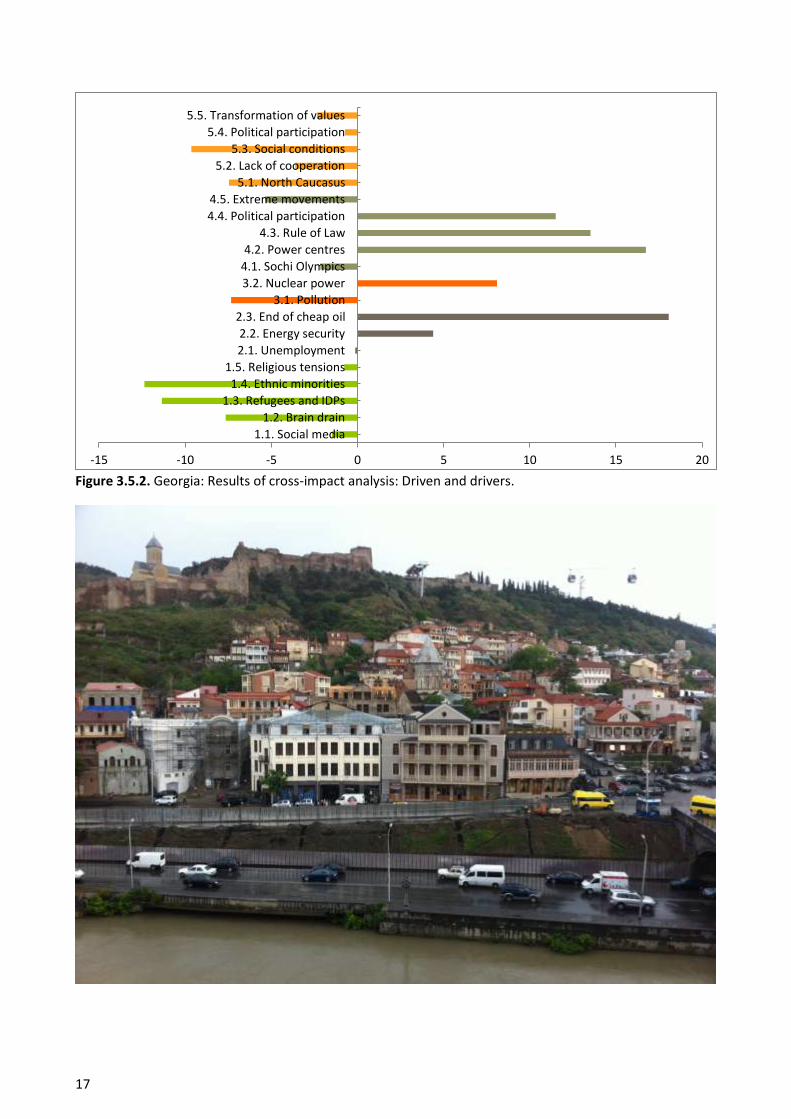
The results of cross-impact analysis are depicted in Fig. 3.5.2. The strongest drivers are: 2.3. End of cheap
oil, 4.2 Power centres, 4.3 Rule of Law, 4.4 Political participation, 3.2 Nuclear power, and 2.2 Energy
security.
The driven variables (in order) are: 1.4 Ethnic minorities, 1.3 Refugees and IDPs, 5.3 Social conditions, 5.1
North Caucasus, 1.2 Brain drain, 3.1. Pollution, 4.5 Extreme movements, 5.2 Lack of cooperation, 4.1 Sochi
Olympics, 1.1 Social media, 1.5 Religious tensions, 5.4 Political participations, and 2.1 Unemployment.
1.1. Social media
1.2. Brain drain
1.3. Refugees and IDPs 1.4. Ethnic minorities
1.5. Religious tensions
2.1. Unemployment
2.2. Energy security
2.3. End of cheap oil
3.1. Pollution
3.2. Nuclear power
4.1. Sochi Olympics
4.2. Power centres
4.3. Rule of Law
4.4. Political participation 4.5. Extreme
movements
5.1. North Caucasus
5.2. Lack of cooperation
5.3. Social conditions
5.5. Transformation of values
0,00
0,50
1,00
1,50
2,00
2,50
3,00
3,50
4,00
4,50
5,00
0,00 0,50 1,00 1,50 2,00 2,50 3,00 3,50 4,00 4,50 5,00
Imp
act
Probability
17
Figure 3.5.2. Georgia: Results of cross-impact analysis: Driven and drivers.
-15 -10 -5 0 5 10 15 20
1.1. Social media
1.2. Brain drain
1.3. Refugees and IDPs
1.4. Ethnic minorities
1.5. Religious tensions
2.1. Unemployment
2.2. Energy security
2.3. End of cheap oil
3.1. Pollution
3.2. Nuclear power
4.1. Sochi Olympics
4.2. Power centres
4.3. Rule of Law
4.4. Political participation
4.5. Extreme movements
5.1. North Caucasus
5.2. Lack of cooperation
5.3. Social conditions
5.4. Political participation
5.5. Transformation of values
18
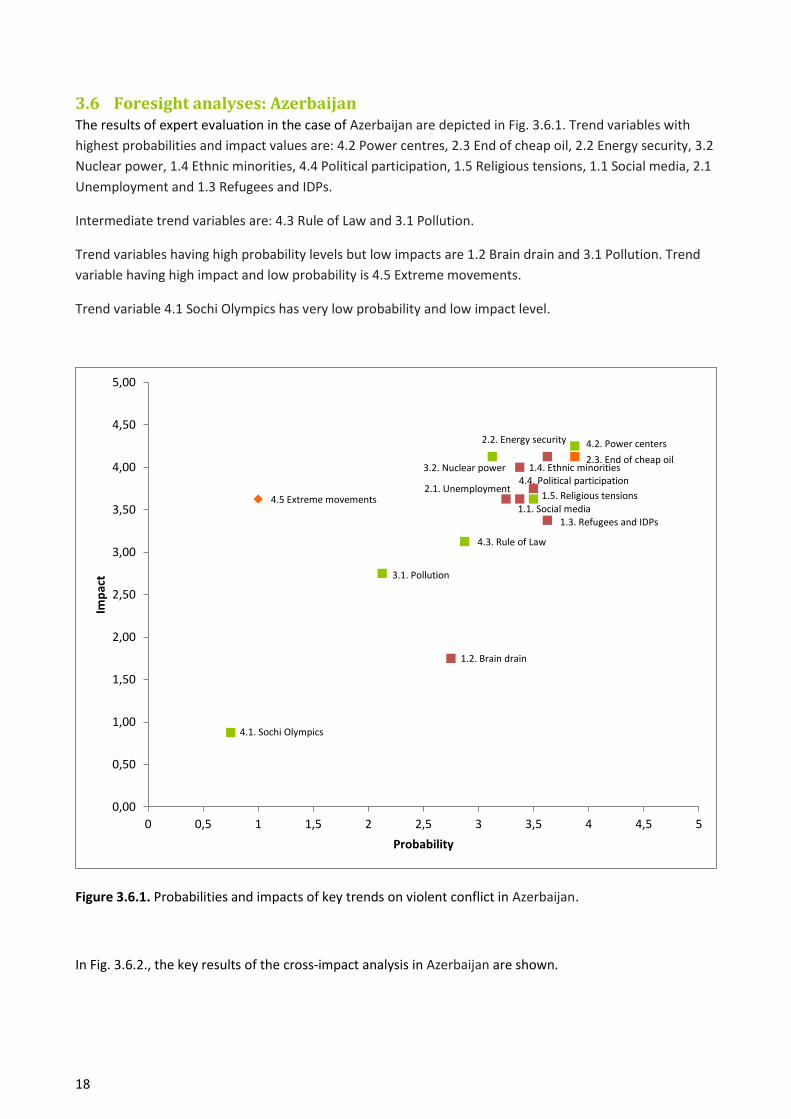
3.6 Foresight analyses: Azerbaijan The results of expert evaluation in the case of Azerbaijan are depicted in Fig. 3.6.1. Trend variables with
highest probabilities and impact values are: 4.2 Power centres, 2.3 End of cheap oil, 2.2 Energy security, 3.2
Nuclear power, 1.4 Ethnic minorities, 4.4 Political participation, 1.5 Religious tensions, 1.1 Social media, 2.1
Unemployment and 1.3 Refugees and IDPs.
Intermediate trend variables are: 4.3 Rule of Law and 3.1 Pollution.
Trend variables having high probability levels but low impacts are 1.2 Brain drain and 3.1 Pollution. Trend
variable having high impact and low probability is 4.5 Extreme movements.
Trend variable 4.1 Sochi Olympics has very low probability and low impact level.
Figure 3.6.1. Probabilities and impacts of key trends on violent conflict in Azerbaijan.
In Fig. 3.6.2., the key results of the cross-impact analysis in Azerbaijan are shown.
1.1. Social media
1.2. Brain drain
1.3. Refugees and IDPs
1.4. Ethnic minorities
1.5. Religious tensions 2.1. Unemployment
2.2. Energy security
2.3. End of cheap oil
3.1. Pollution
3.2. Nuclear power
4.1. Sochi Olympics
4.2. Power centers
4.3. Rule of Law
4.4. Political participation
4.5 Extreme movements
0,00
0,50
1,00
1,50
2,00
2,50
3,00
3,50
4,00
4,50
5,00
0 0,5 1 1,5 2 2,5 3 3,5 4 4,5 5
Imp
act
Probability
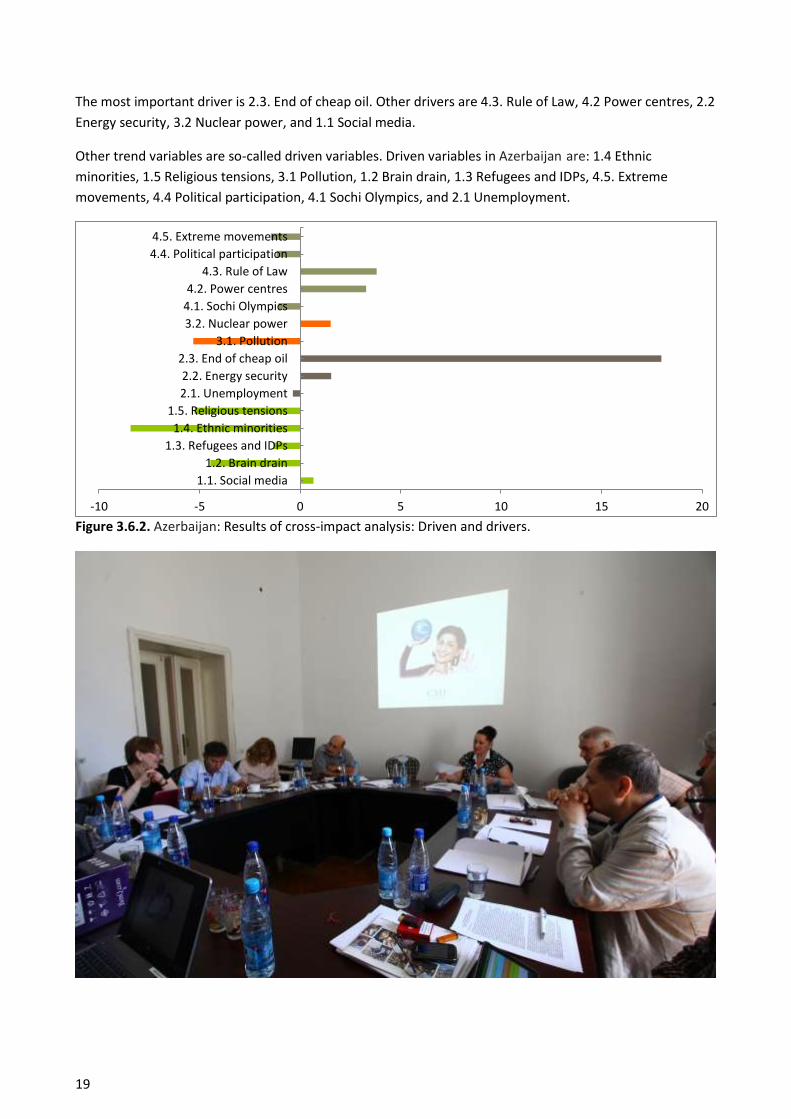
19
The most important driver is 2.3. End of cheap oil. Other drivers are 4.3. Rule of Law, 4.2 Power centres, 2.2
Energy security, 3.2 Nuclear power, and 1.1 Social media.
Other trend variables are so-called driven variables. Driven variables in Azerbaijan are: 1.4 Ethnic
minorities, 1.5 Religious tensions, 3.1 Pollution, 1.2 Brain drain, 1.3 Refugees and IDPs, 4.5. Extreme
movements, 4.4 Political participation, 4.1 Sochi Olympics, and 2.1 Unemployment.
Figure 3.6.2. Azerbaijan: Results of cross-impact analysis: Driven and drivers.
-10 -5 0 5 10 15 20
1.1. Social media
1.2. Brain drain
1.3. Refugees and IDPs
1.4. Ethnic minorities
1.5. Religious tensions
2.1. Unemployment
2.2. Energy security
2.3. End of cheap oil
3.1. Pollution
3.2. Nuclear power
4.1. Sochi Olympics
4.2. Power centres
4.3. Rule of Law
4.4. Political participation
4.5. Extreme movements
20
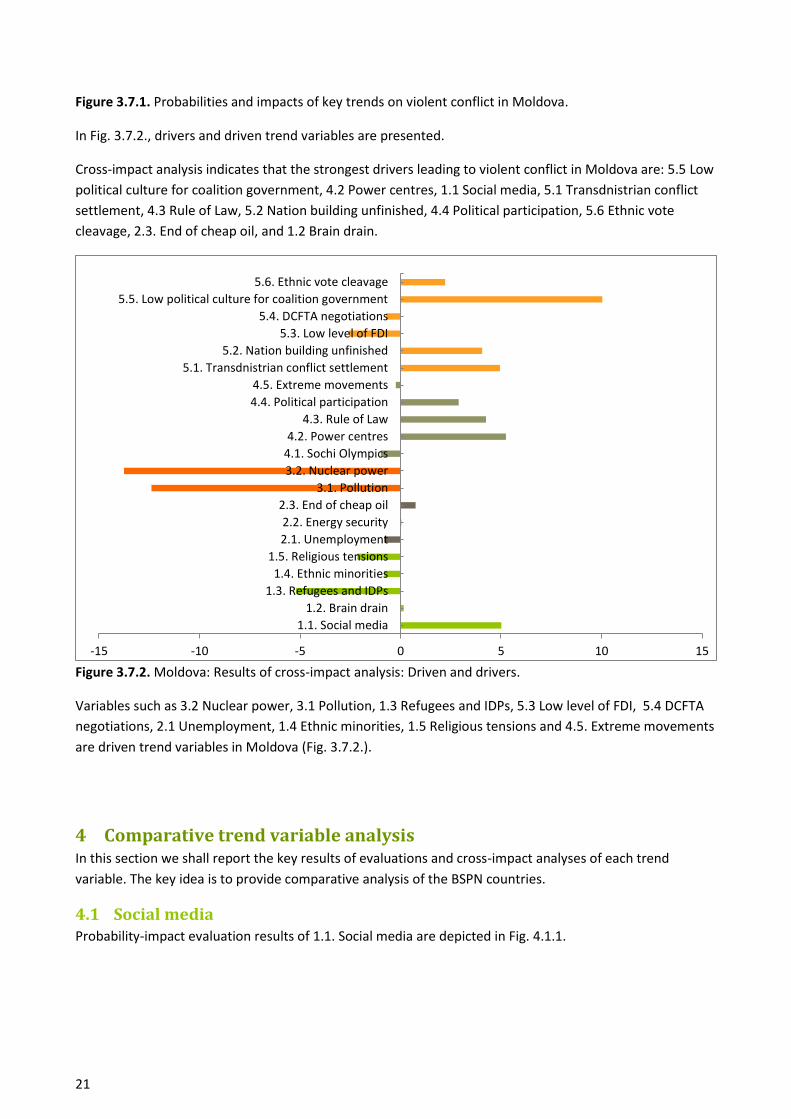
3.7 Foresight analyses: Moldova The results of the workshop in Moldova concerning probability evaluations and impact evaluations are
reported in Fig. 3.7.1. As a general observation we can note that differences between trend variables are
not large. Most variables have high values of probability and impact. Very high probability levels and impact
levels are gained by the following variables: 5.8 Relations with Russia, 2.2 Energy Security, 4.2 Power
centres, 4.4 Political participation, 5.6 Ethnic vote cleavage, 5.2 Nation building unfinished, 5.7 Citizenship
issues, 5.11 Shadow economy, 2.1. Unemployment, 1.1 Social media, 1.4 Ethnic minorities, 5.9 Relations
with USA & EU, 5.3 Low level of FDI, 2.3 End of cheap oil, 5.10 Relations with Ukraine, 4.5 Extreme
movements, and 1.3 Refugees and IDPs.
Intermediate trend variables in Fig. 3.7.1. are 5.5 Low political culture for coalition governments, 1.5
Religious tensions, 3.1 Pollution, and 1.2 Brain drain.
Low probability levels and low impact levels are gained by trend variables 4.1 Sochi Olympics,
5.1,Transdnistrian conflict settlement, and 3.2 Nuclear power.
1.1. Social media
1.2. Brain drain
1.3. Refugees and IDPs
1.4. Ethnic minorities
1.5. Religious tensions
2.1. Unemployment
2.2. Energy security
2.3. End of cheap oil
3.1. Pollution 3.2. Nuclear power
4.1. Sochi Olympics
4.2. Power centres
4.3. Rule of Law
4.4. Political participation
4.5. Extreme movements
5.1. Transdnistrian conflict settlement
5.2. Nation building unfinished
5.3. Low level of FDI
5.5. Low political culture for coalition
government
5.6. Ethnic vote cleavage
5.7 Citizenship issue and policies
5.8 Relations with Russia
5.9 Relations with US & EU
5.10 Relations with Ukraine
5.11 Shadow economy
0,00
0,50
1,00
1,50
2,00
2,50
3,00
3,50
4,00
4,50
5,00
0,00 0,50 1,00 1,50 2,00 2,50 3,00 3,50 4,00 4,50 5,00
Imp
act
Probability
21
Figure 3.7.1. Probabilities and impacts of key trends on violent conflict in Moldova.
In Fig. 3.7.2., drivers and driven trend variables are presented.
Cross-impact analysis indicates that the strongest drivers leading to violent conflict in Moldova are: 5.5 Low
political culture for coalition government, 4.2 Power centres, 1.1 Social media, 5.1 Transdnistrian conflict
settlement, 4.3 Rule of Law, 5.2 Nation building unfinished, 4.4 Political participation, 5.6 Ethnic vote
cleavage, 2.3. End of cheap oil, and 1.2 Brain drain.
Figure 3.7.2. Moldova: Results of cross-impact analysis: Driven and drivers.
Variables such as 3.2 Nuclear power, 3.1 Pollution, 1.3 Refugees and IDPs, 5.3 Low level of FDI, 5.4 DCFTA
negotiations, 2.1 Unemployment, 1.4 Ethnic minorities, 1.5 Religious tensions and 4.5. Extreme movements
are driven trend variables in Moldova (Fig. 3.7.2.).
4 Comparative trend variable analysis In this section we shall report the key results of evaluations and cross-impact analyses of each trend
variable. The key idea is to provide comparative analysis of the BSPN countries.
4.1 Social media Probability-impact evaluation results of 1.1. Social media are depicted in Fig. 4.1.1.
-15 -10 -5 0 5 10 15
1.1. Social media
1.2. Brain drain
1.3. Refugees and IDPs
1.4. Ethnic minorities
1.5. Religious tensions
2.1. Unemployment
2.2. Energy security
2.3. End of cheap oil
3.1. Pollution
3.2. Nuclear power
4.1. Sochi Olympics
4.2. Power centres
4.3. Rule of Law
4.4. Political participation
4.5. Extreme movements
5.1. Transdnistrian conflict settlement
5.2. Nation building unfinished
5.3. Low level of FDI
5.4. DCFTA negotiations
5.5. Low political culture for coalition government
5.6. Ethnic vote cleavage
22
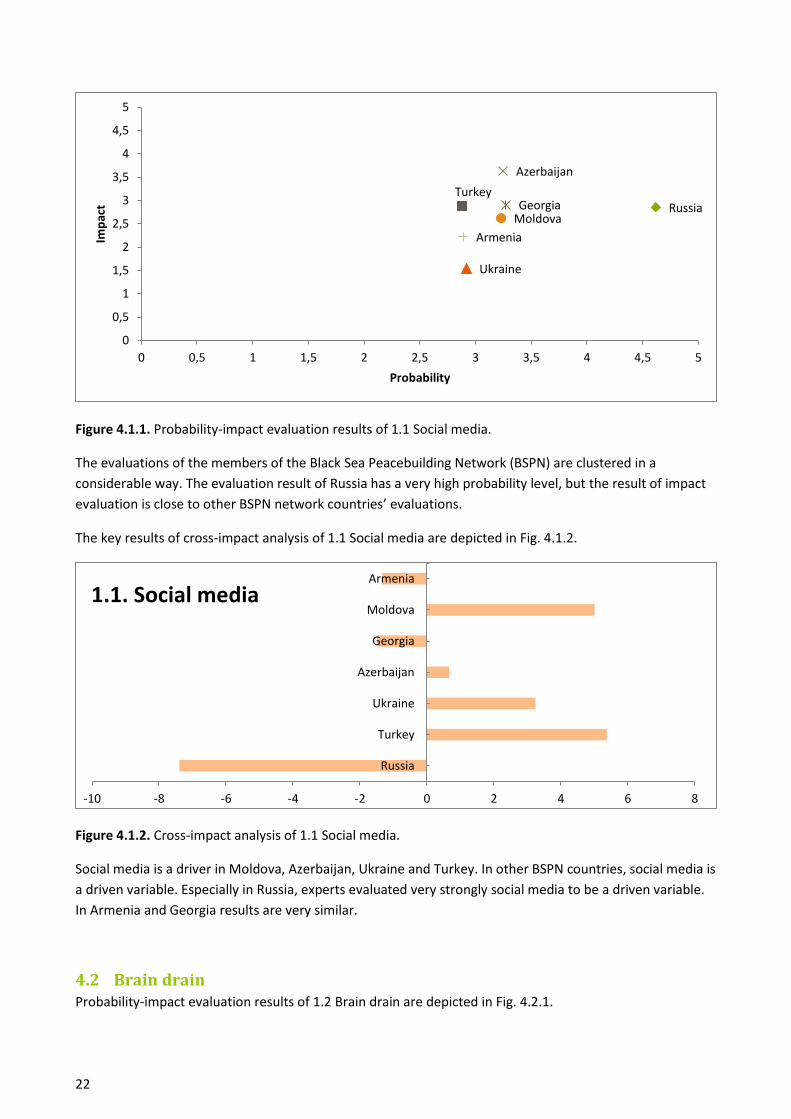
Figure 4.1.1. Probability-impact evaluation results of 1.1 Social media.
The evaluations of the members of the Black Sea Peacebuilding Network (BSPN) are clustered in a
considerable way. The evaluation result of Russia has a very high probability level, but the result of impact
evaluation is close to other BSPN network countries’ evaluations.
The key results of cross-impact analysis of 1.1 Social media are depicted in Fig. 4.1.2.
Figure 4.1.2. Cross-impact analysis of 1.1 Social media.
Social media is a driver in Moldova, Azerbaijan, Ukraine and Turkey. In other BSPN countries, social media is
a driven variable. Especially in Russia, experts evaluated very strongly social media to be a driven variable.
In Armenia and Georgia results are very similar.
4.2 Brain drain Probability-impact evaluation results of 1.2 Brain drain are depicted in Fig. 4.2.1.
Russia Turkey
Ukraine
Azerbaijan
Georgia Moldova
Armenia
0
0,5
1
1,5
2
2,5
3
3,5
4
4,5
5
0 0,5 1 1,5 2 2,5 3 3,5 4 4,5 5
Imp
act
Probability
-10 -8 -6 -4 -2 0 2 4 6 8
Russia
Turkey
Ukraine
Azerbaijan
Georgia
Moldova
Armenia
1.1. Social media
23
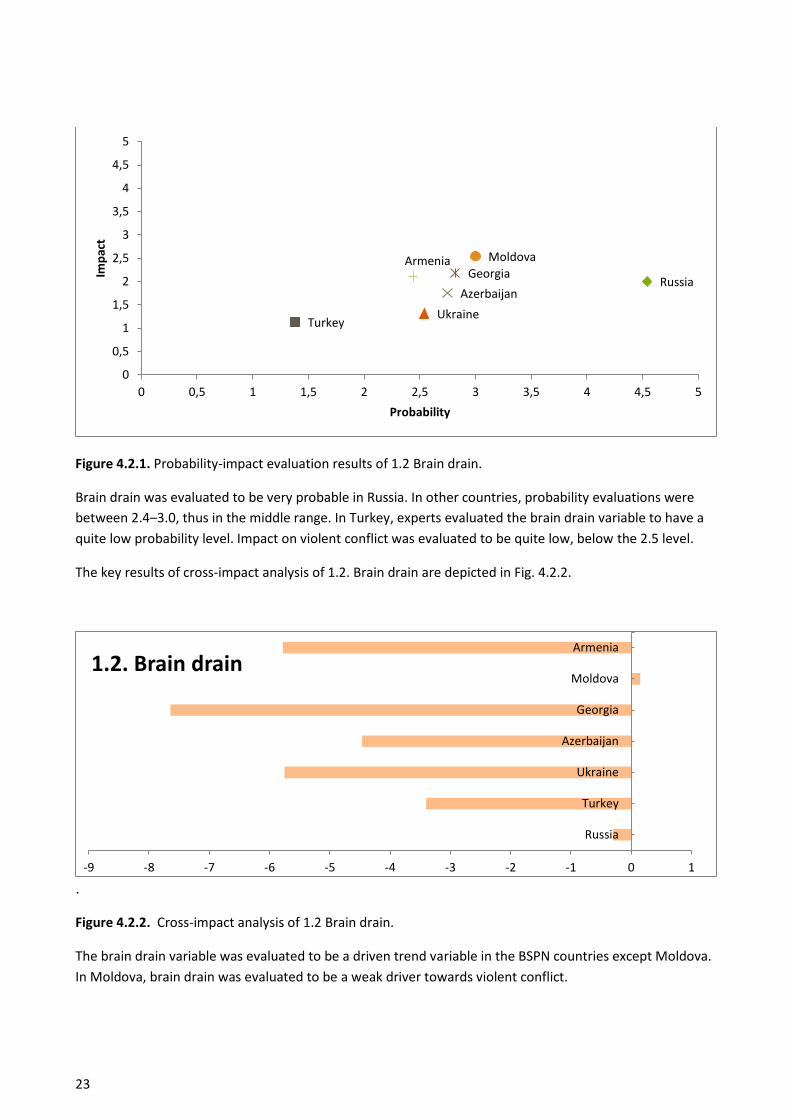
Figure 4.2.1. Probability-impact evaluation results of 1.2 Brain drain.
Brain drain was evaluated to be very probable in Russia. In other countries, probability evaluations were
between 2.4–3.0, thus in the middle range. In Turkey, experts evaluated the brain drain variable to have a
quite low probability level. Impact on violent conflict was evaluated to be quite low, below the 2.5 level.
The key results of cross-impact analysis of 1.2. Brain drain are depicted in Fig. 4.2.2.
.
Figure 4.2.2. Cross-impact analysis of 1.2 Brain drain.
The brain drain variable was evaluated to be a driven trend variable in the BSPN countries except Moldova.
In Moldova, brain drain was evaluated to be a weak driver towards violent conflict.
Russia
Turkey Ukraine
Azerbaijan
Georgia
Moldova Armenia
0
0,5
1
1,5
2
2,5
3
3,5
4
4,5
5
0 0,5 1 1,5 2 2,5 3 3,5 4 4,5 5
Imp
act
Probability
-9 -8 -7 -6 -5 -4 -3 -2 -1 0 1
Russia
Turkey
Ukraine
Azerbaijan
Georgia
Moldova
Armenia
1.2. Brain drain
24
4.3 Refugees and IDPs Probability-impact evaluation results of 1.3 Refugees and IDPs are depicted in Fig. 4.3.1.
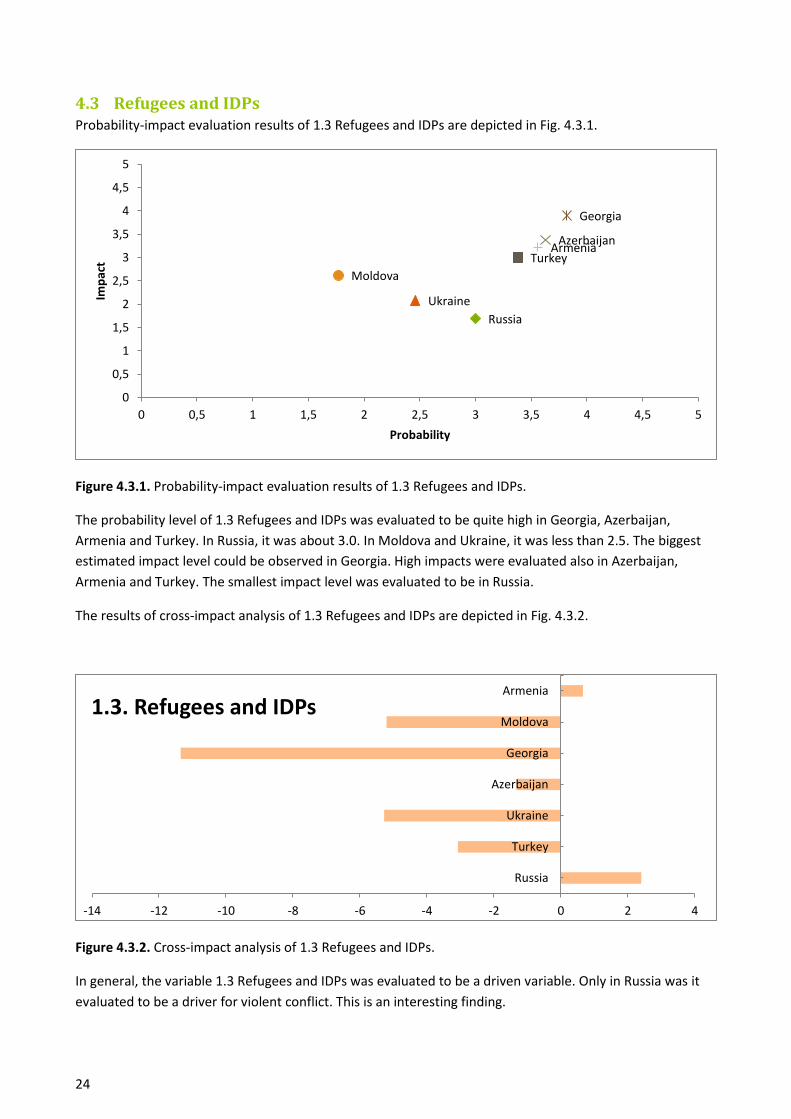
Figure 4.3.1. Probability-impact evaluation results of 1.3 Refugees and IDPs.
The probability level of 1.3 Refugees and IDPs was evaluated to be quite high in Georgia, Azerbaijan,
Armenia and Turkey. In Russia, it was about 3.0. In Moldova and Ukraine, it was less than 2.5. The biggest
estimated impact level could be observed in Georgia. High impacts were evaluated also in Azerbaijan,
Armenia and Turkey. The smallest impact level was evaluated to be in Russia.
The results of cross-impact analysis of 1.3 Refugees and IDPs are depicted in Fig. 4.3.2.
Figure 4.3.2. Cross-impact analysis of 1.3 Refugees and IDPs.
In general, the variable 1.3 Refugees and IDPs was evaluated to be a driven variable. Only in Russia was it
evaluated to be a driver for violent conflict. This is an interesting finding.
Russia
Turkey
Ukraine
Azerbaijan
Georgia
Moldova
Armenia
0
0,5
1
1,5
2
2,5
3
3,5
4
4,5
5
0 0,5 1 1,5 2 2,5 3 3,5 4 4,5 5
Imp
act
Probability
-14 -12 -10 -8 -6 -4 -2 0 2 4
Russia
Turkey
Ukraine
Azerbaijan
Georgia
Moldova
Armenia
1.3. Refugees and IDPs
25
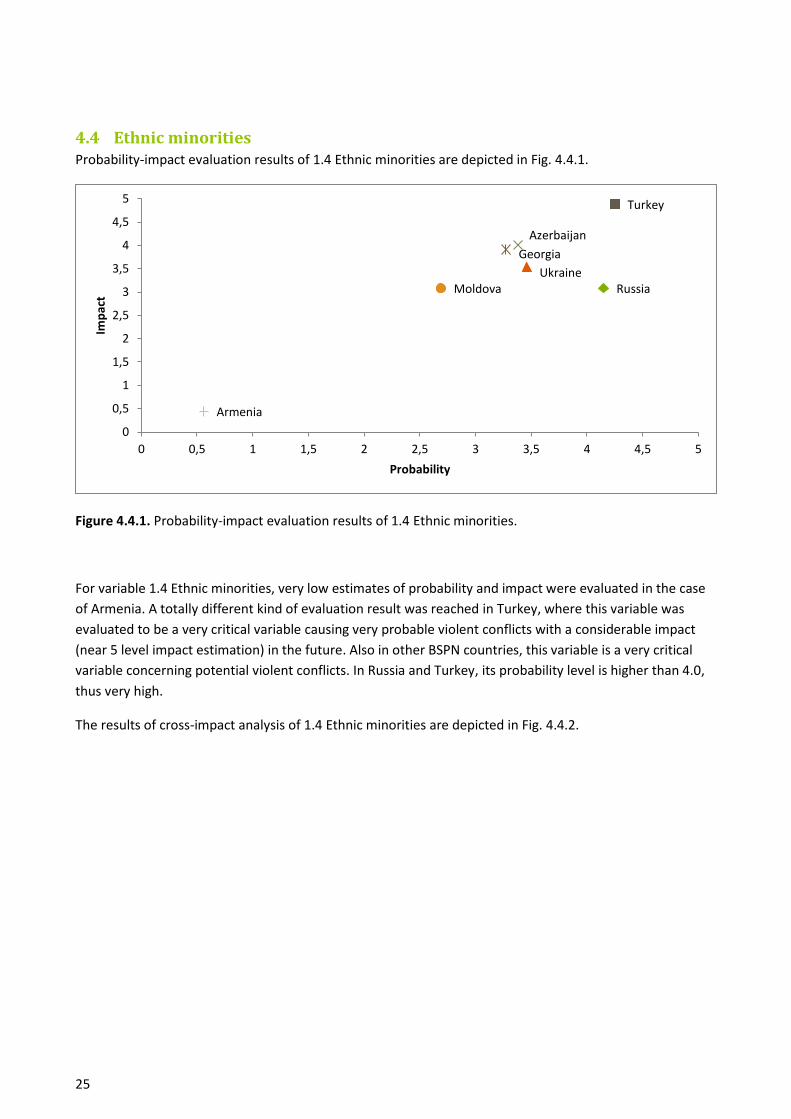
4.4 Ethnic minorities Probability-impact evaluation results of 1.4 Ethnic minorities are depicted in Fig. 4.4.1.
Figure 4.4.1. Probability-impact evaluation results of 1.4 Ethnic minorities.
For variable 1.4 Ethnic minorities, very low estimates of probability and impact were evaluated in the case
of Armenia. A totally different kind of evaluation result was reached in Turkey, where this variable was
evaluated to be a very critical variable causing very probable violent conflicts with a considerable impact
(near 5 level impact estimation) in the future. Also in other BSPN countries, this variable is a very critical
variable concerning potential violent conflicts. In Russia and Turkey, its probability level is higher than 4.0,
thus very high.
The results of cross-impact analysis of 1.4 Ethnic minorities are depicted in Fig. 4.4.2.
Russia
Turkey
Ukraine
Azerbaijan
Georgia
Moldova
Armenia
0
0,5
1
1,5
2
2,5
3
3,5
4
4,5
5
0 0,5 1 1,5 2 2,5 3 3,5 4 4,5 5
Imp
act
Probability
26
Figure 4.4.2. Cross-impact analysis of 1.4 Ethnic minorities.
Variable 1.4 Ethnic minorities was estimated by experts to be a driven variable in almost all BSPN countries.
Only in Ukraine was it estimated to be a driver trend variable.
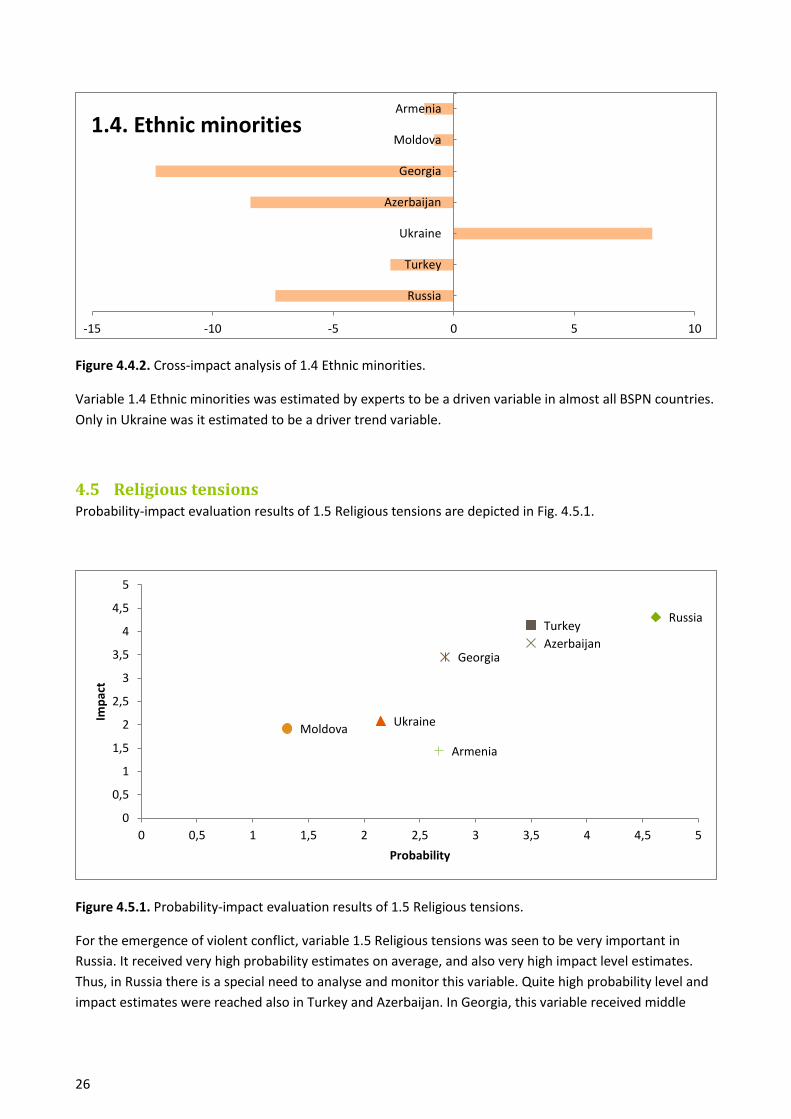
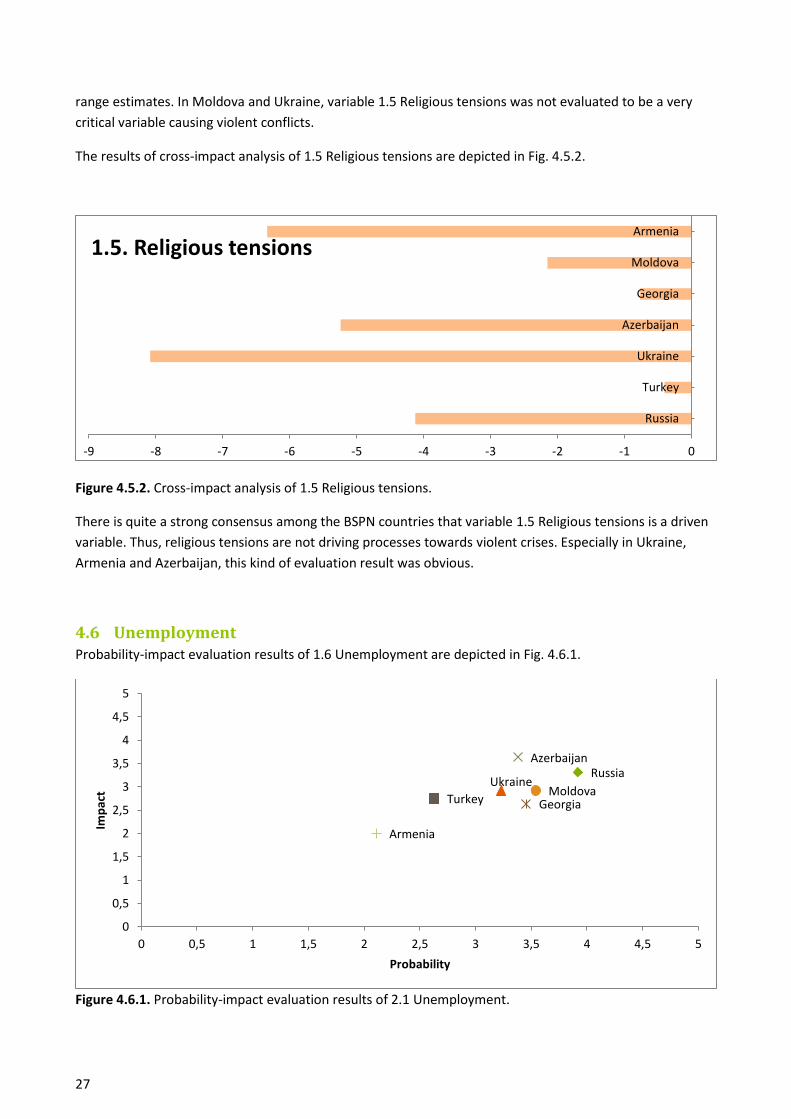
4.5 Religious tensions Probability-impact evaluation results of 1.5 Religious tensions are depicted in Fig. 4.5.1.
Figure 4.5.1. Probability-impact evaluation results of 1.5 Religious tensions.
For the emergence of violent conflict, variable 1.5 Religious tensions was seen to be very important in
Russia. It received very high probability estimates on average, and also very high impact level estimates.
Thus, in Russia there is a special need to analyse and monitor this variable. Quite high probability level and
impact estimates were reached also in Turkey and Azerbaijan. In Georgia, this variable received middle
-15 -10 -5 0 5 10
Russia
Turkey
Ukraine
Azerbaijan
Georgia
Moldova
Armenia
1.4. Ethnic minorities
Russia Turkey
Ukraine
Azerbaijan Georgia
Moldova
Armenia
0
0,5
1
1,5
2
2,5
3
3,5
4
4,5
5
0 0,5 1 1,5 2 2,5 3 3,5 4 4,5 5
Imp
act
Probability
27
range estimates. In Moldova and Ukraine, variable 1.5 Religious tensions was not evaluated to be a very
critical variable causing violent conflicts.
The results of cross-impact analysis of 1.5 Religious tensions are depicted in Fig. 4.5.2.
Figure 4.5.2. Cross-impact analysis of 1.5 Religious tensions.
There is quite a strong consensus among the BSPN countries that variable 1.5 Religious tensions is a driven
variable. Thus, religious tensions are not driving processes towards violent crises. Especially in Ukraine,
Armenia and Azerbaijan, this kind of evaluation result was obvious.
4.6 Unemployment Probability-impact evaluation results of 1.6 Unemployment are depicted in Fig. 4.6.1.
Figure 4.6.1. Probability-impact evaluation results of 2.1 Unemployment.
-9 -8 -7 -6 -5 -4 -3 -2 -1 0
Russia
Turkey
Ukraine
Azerbaijan
Georgia
Moldova
Armenia
1.5. Religious tensions
Russia
Turkey
Ukraine
Azerbaijan
Georgia Moldova
Armenia
0
0,5
1
1,5
2
2,5
3
3,5
4
4,5
5
0 0,5 1 1,5 2 2,5 3 3,5 4 4,5 5
Imp
act
Probability
28
In general, variable 2.1 Unemployment is a critical factor probably causing violent conflicts in the Black Sea
region. Only in Armenia was unemployment evaluated to lower levels of probability and impact.
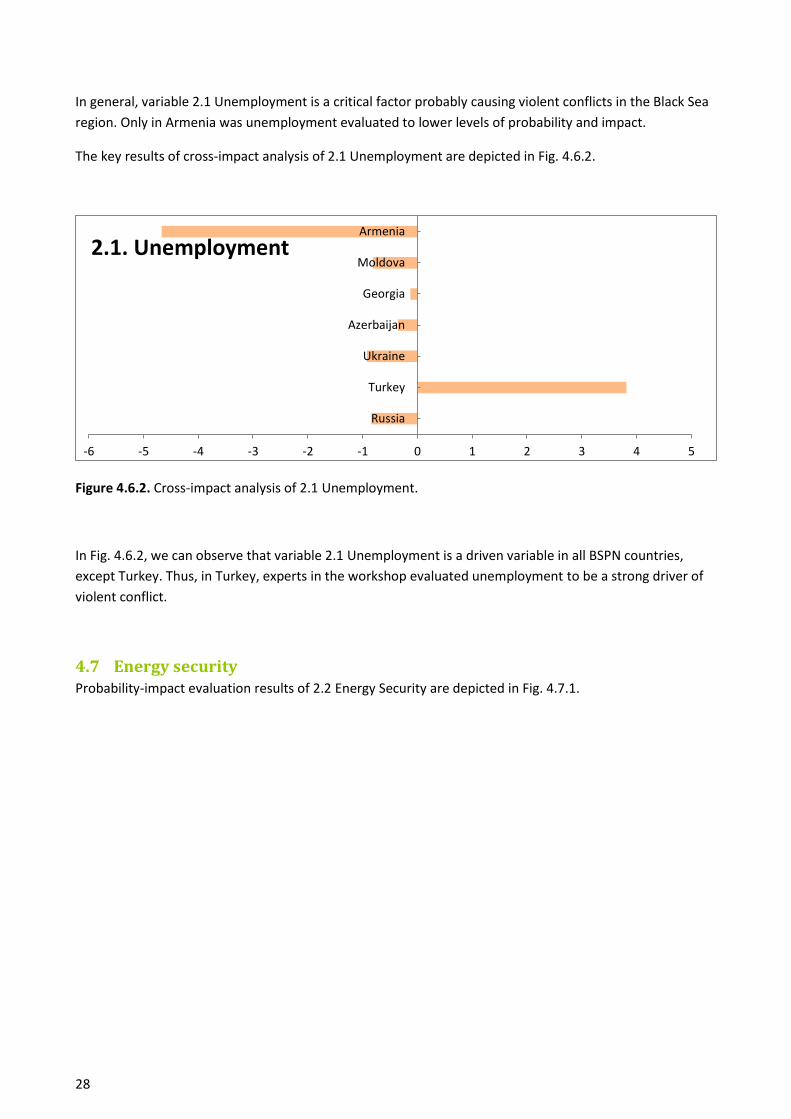
The key results of cross-impact analysis of 2.1 Unemployment are depicted in Fig. 4.6.2.
Figure 4.6.2. Cross-impact analysis of 2.1 Unemployment.
In Fig. 4.6.2, we can observe that variable 2.1 Unemployment is a driven variable in all BSPN countries,
except Turkey. Thus, in Turkey, experts in the workshop evaluated unemployment to be a strong driver of
violent conflict.
4.7 Energy security Probability-impact evaluation results of 2.2 Energy Security are depicted in Fig. 4.7.1.
-6 -5 -4 -3 -2 -1 0 1 2 3 4 5
Russia
Turkey
Ukraine
Azerbaijan
Georgia
Moldova
Armenia
2.1. Unemployment
29
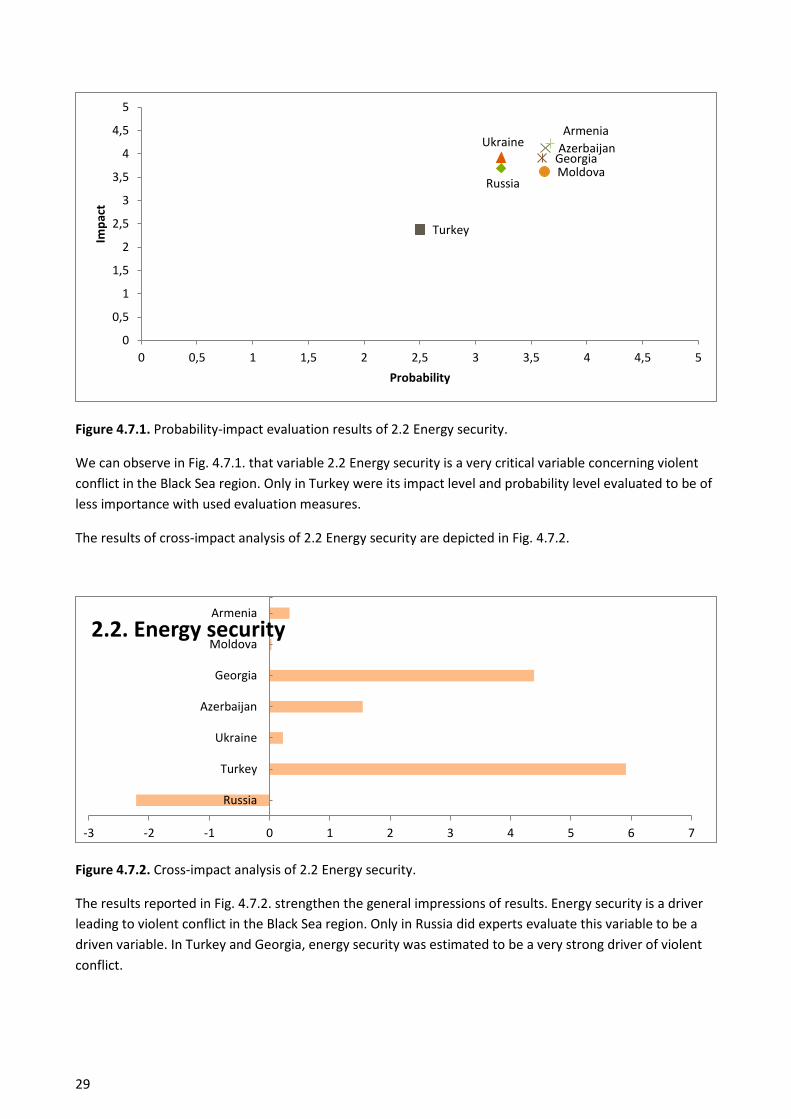
Figure 4.7.1. Probability-impact evaluation results of 2.2 Energy security.
We can observe in Fig. 4.7.1. that variable 2.2 Energy security is a very critical variable concerning violent
conflict in the Black Sea region. Only in Turkey were its impact level and probability level evaluated to be of
less importance with used evaluation measures.
The results of cross-impact analysis of 2.2 Energy security are depicted in Fig. 4.7.2.
Figure 4.7.2. Cross-impact analysis of 2.2 Energy security.
The results reported in Fig. 4.7.2. strengthen the general impressions of results. Energy security is a driver
leading to violent conflict in the Black Sea region. Only in Russia did experts evaluate this variable to be a
driven variable. In Turkey and Georgia, energy security was estimated to be a very strong driver of violent
conflict.
Russia
Turkey
Ukraine Azerbaijan Georgia Moldova
Armenia
0
0,5
1
1,5
2
2,5
3
3,5
4
4,5
5
0 0,5 1 1,5 2 2,5 3 3,5 4 4,5 5
Imp
act
Probability
-3 -2 -1 0 1 2 3 4 5 6 7
Russia
Turkey
Ukraine
Azerbaijan
Georgia
Moldova
Armenia
2.2. Energy security
30
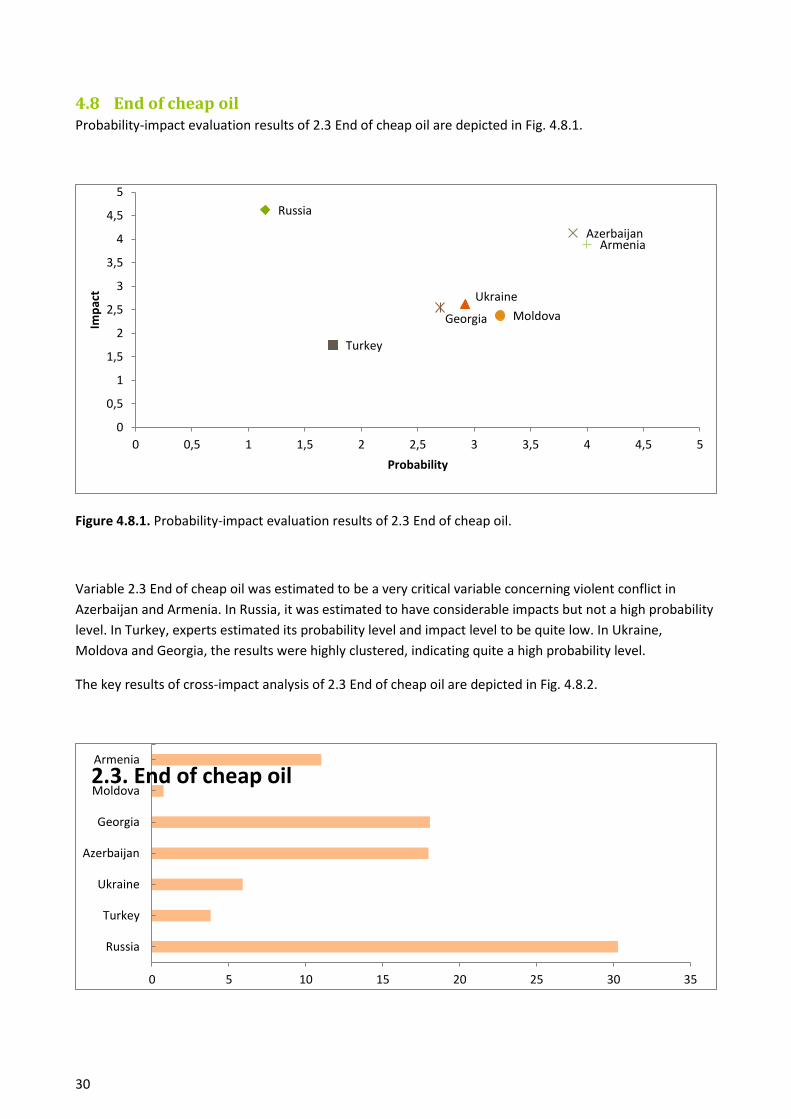
4.8 End of cheap oil Probability-impact evaluation results of 2.3 End of cheap oil are depicted in Fig. 4.8.1.
Figure 4.8.1. Probability-impact evaluation results of 2.3 End of cheap oil.
Variable 2.3 End of cheap oil was estimated to be a very critical variable concerning violent conflict in
Azerbaijan and Armenia. In Russia, it was estimated to have considerable impacts but not a high probability
level. In Turkey, experts estimated its probability level and impact level to be quite low. In Ukraine,
Moldova and Georgia, the results were highly clustered, indicating quite a high probability level.
The key results of cross-impact analysis of 2.3 End of cheap oil are depicted in Fig. 4.8.2.
Russia
Turkey
Ukraine
Azerbaijan
Georgia Moldova
Armenia
0
0,5
1
1,5
2
2,5
3
3,5
4
4,5
5
0 0,5 1 1,5 2 2,5 3 3,5 4 4,5 5
Imp
act
Probability
0 5 10 15 20 25 30 35
Russia
Turkey
Ukraine
Azerbaijan
Georgia
Moldova
Armenia
2.3. End of cheap oil
31
Figure 4.8.2. Cross-impact analysis of 2.3 End of cheap oil.
Fig. 4.8.2. verifies that Variable 2.3 End of cheap oil is estimated to be one of the key drivers of violent
conflict in the Black Sea region.
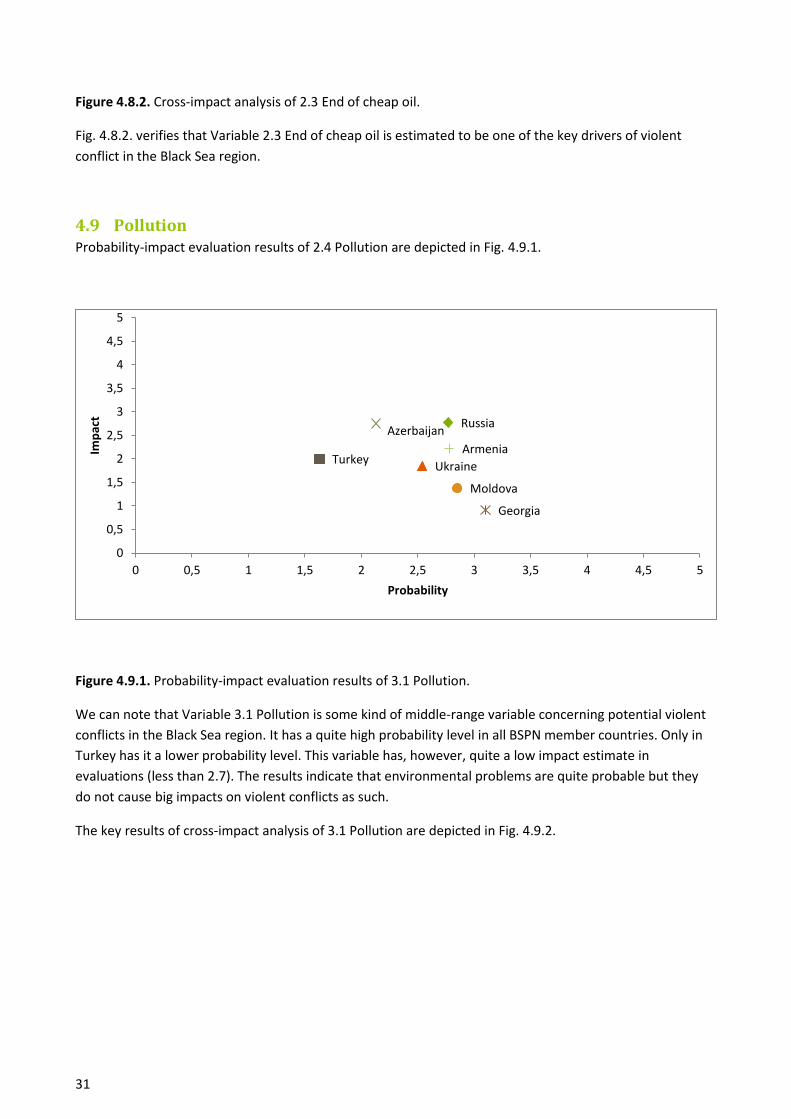
4.9 Pollution Probability-impact evaluation results of 2.4 Pollution are depicted in Fig. 4.9.1.
Figure 4.9.1. Probability-impact evaluation results of 3.1 Pollution.
We can note that Variable 3.1 Pollution is some kind of middle-range variable concerning potential violent
conflicts in the Black Sea region. It has a quite high probability level in all BSPN member countries. Only in
Turkey has it a lower probability level. This variable has, however, quite a low impact estimate in
evaluations (less than 2.7). The results indicate that environmental problems are quite probable but they
do not cause big impacts on violent conflicts as such.
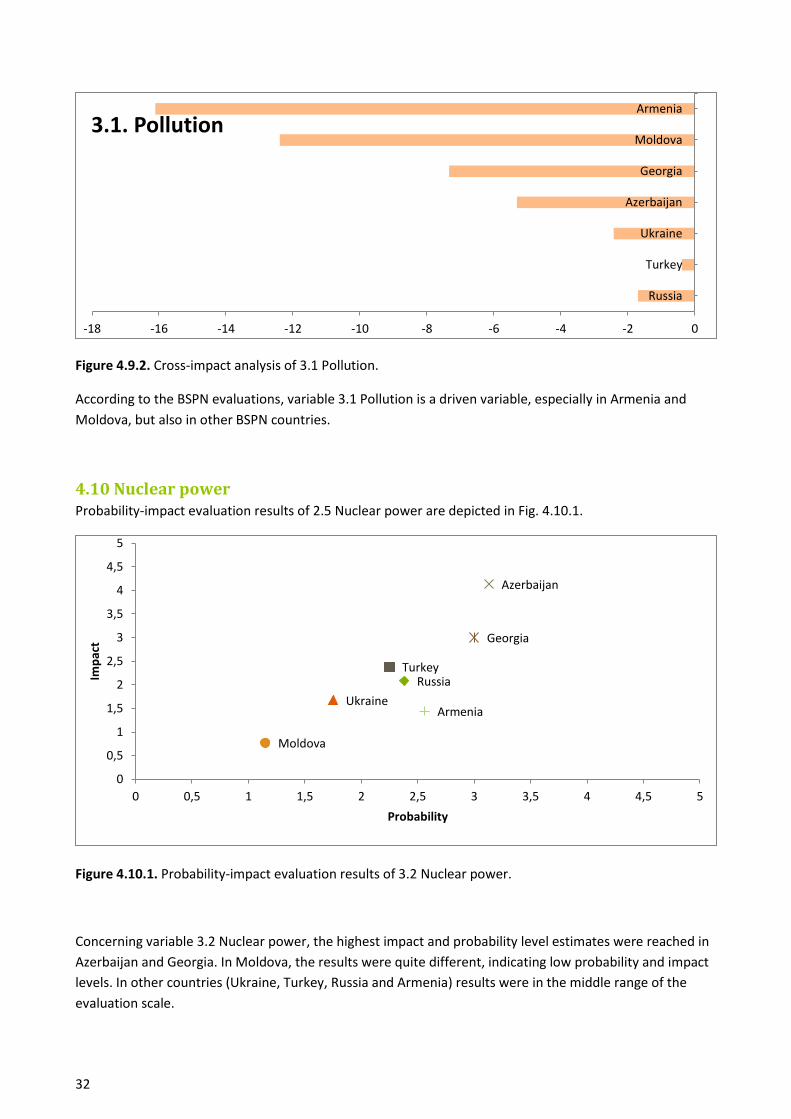
The key results of cross-impact analysis of 3.1 Pollution are depicted in Fig. 4.9.2.
Russia
Turkey Ukraine
Azerbaijan
Georgia
Moldova
Armenia
0
0,5
1
1,5
2
2,5
3
3,5
4
4,5
5
0 0,5 1 1,5 2 2,5 3 3,5 4 4,5 5
Imp
act
Probability
32
Figure 4.9.2. Cross-impact analysis of 3.1 Pollution.
According to the BSPN evaluations, variable 3.1 Pollution is a driven variable, especially in Armenia and
Moldova, but also in other BSPN countries.
4.10 Nuclear power Probability-impact evaluation results of 2.5 Nuclear power are depicted in Fig. 4.10.1.
Figure 4.10.1. Probability-impact evaluation results of 3.2 Nuclear power.
Concerning variable 3.2 Nuclear power, the highest impact and probability level estimates were reached in
Azerbaijan and Georgia. In Moldova, the results were quite different, indicating low probability and impact
levels. In other countries (Ukraine, Turkey, Russia and Armenia) results were in the middle range of the
evaluation scale.
-18 -16 -14 -12 -10 -8 -6 -4 -2 0
Russia
Turkey
Ukraine
Azerbaijan
Georgia
Moldova
Armenia
3.1. Pollution
Russia Turkey
Ukraine
Azerbaijan
Georgia
Moldova
Armenia
0
0,5
1
1,5
2
2,5
3
3,5
4
4,5
5
0 0,5 1 1,5 2 2,5 3 3,5 4 4,5 5
Imp
act
Probability
33
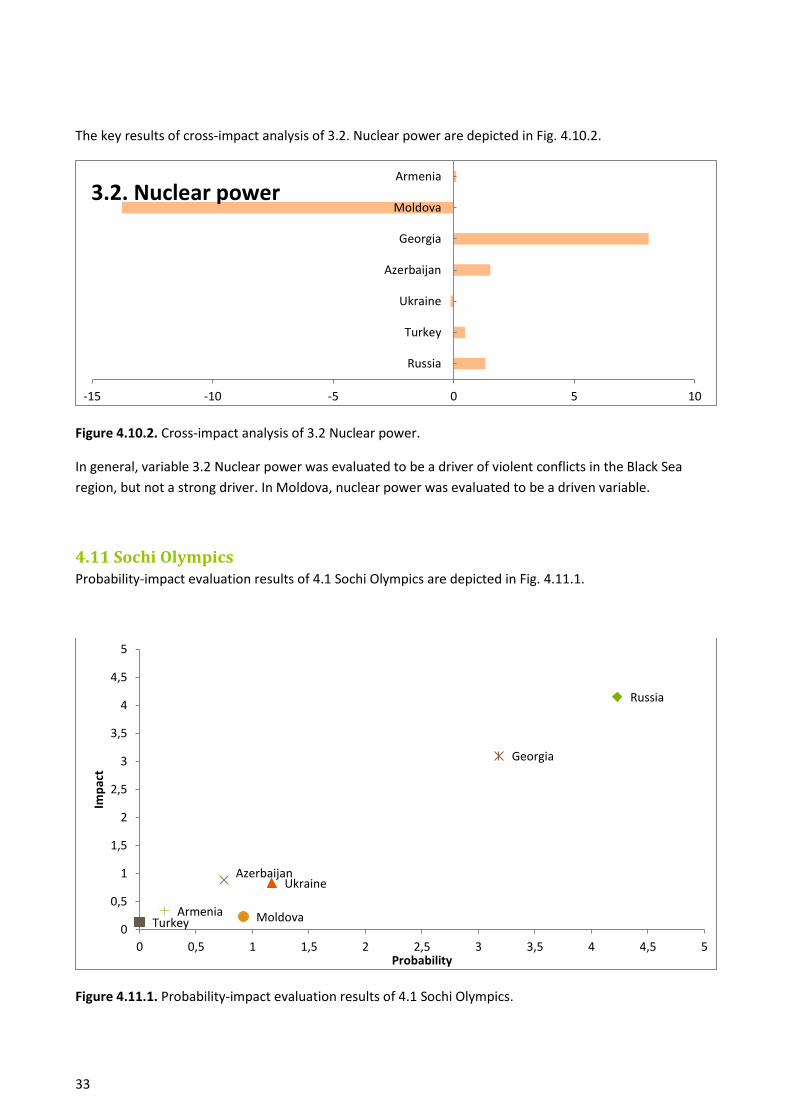
The key results of cross-impact analysis of 3.2. Nuclear power are depicted in Fig. 4.10.2.
Figure 4.10.2. Cross-impact analysis of 3.2 Nuclear power.
In general, variable 3.2 Nuclear power was evaluated to be a driver of violent conflicts in the Black Sea
region, but not a strong driver. In Moldova, nuclear power was evaluated to be a driven variable.
4.11 Sochi Olympics Probability-impact evaluation results of 4.1 Sochi Olympics are depicted in Fig. 4.11.1.
Figure 4.11.1. Probability-impact evaluation results of 4.1 Sochi Olympics.
-15 -10 -5 0 5 10
Russia
Turkey
Ukraine
Azerbaijan
Georgia
Moldova
Armenia
3.2. Nuclear power
Russia
Turkey
Ukraine Azerbaijan
Georgia
Moldova Armenia
0
0,5
1
1,5
2
2,5
3
3,5
4
4,5
5
0 0,5 1 1,5 2 2,5 3 3,5 4 4,5 5
Imp
act
Probability
34
The results concerning trend variable 4.1 Sochi Olympics are interesting. In Russia, this variable was
evaluated to have a very high probability and a very high impact level. Also in Georgia, experts evaluated
the Sochi Olympics to have quite high probability and impact levels. In other BSPN counties, this trend
variable was estimated to have low impact and low probability levels.
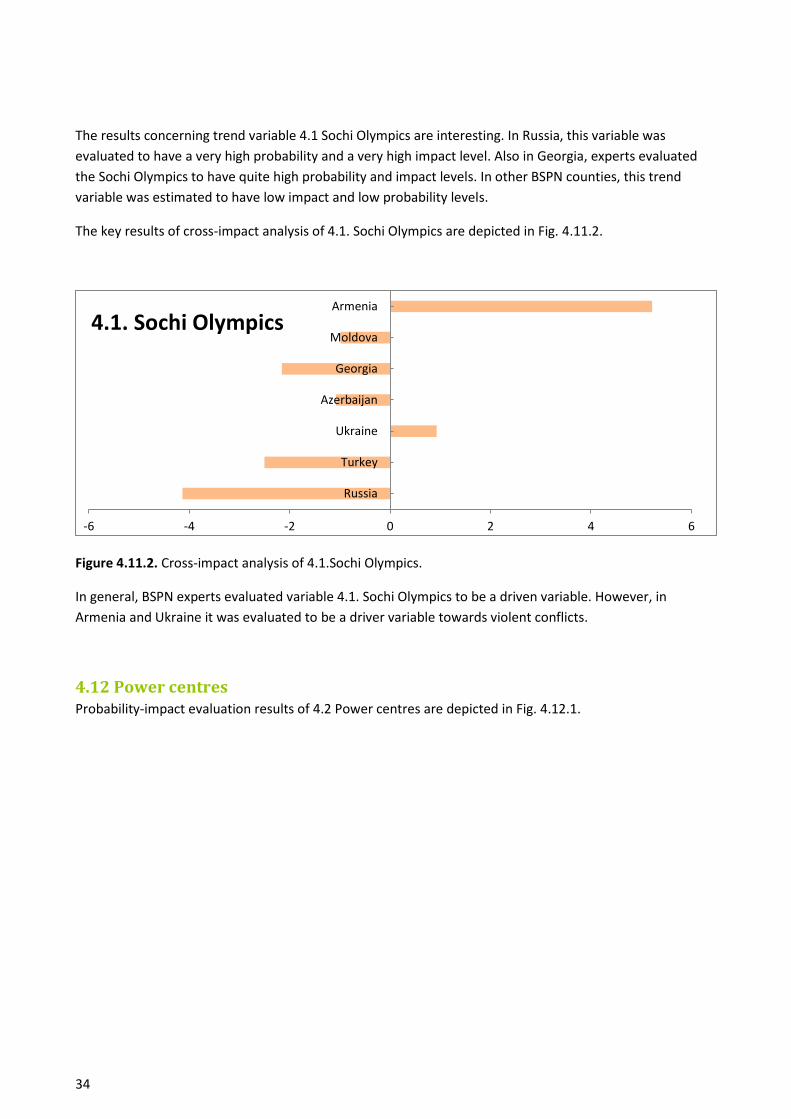
The key results of cross-impact analysis of 4.1. Sochi Olympics are depicted in Fig. 4.11.2.
Figure 4.11.2. Cross-impact analysis of 4.1.Sochi Olympics.
In general, BSPN experts evaluated variable 4.1. Sochi Olympics to be a driven variable. However, in
Armenia and Ukraine it was evaluated to be a driver variable towards violent conflicts.
4.12 Power centres Probability-impact evaluation results of 4.2 Power centres are depicted in Fig. 4.12.1.
-6 -4 -2 0 2 4 6
Russia
Turkey
Ukraine
Azerbaijan
Georgia
Moldova
Armenia
4.1. Sochi Olympics
35
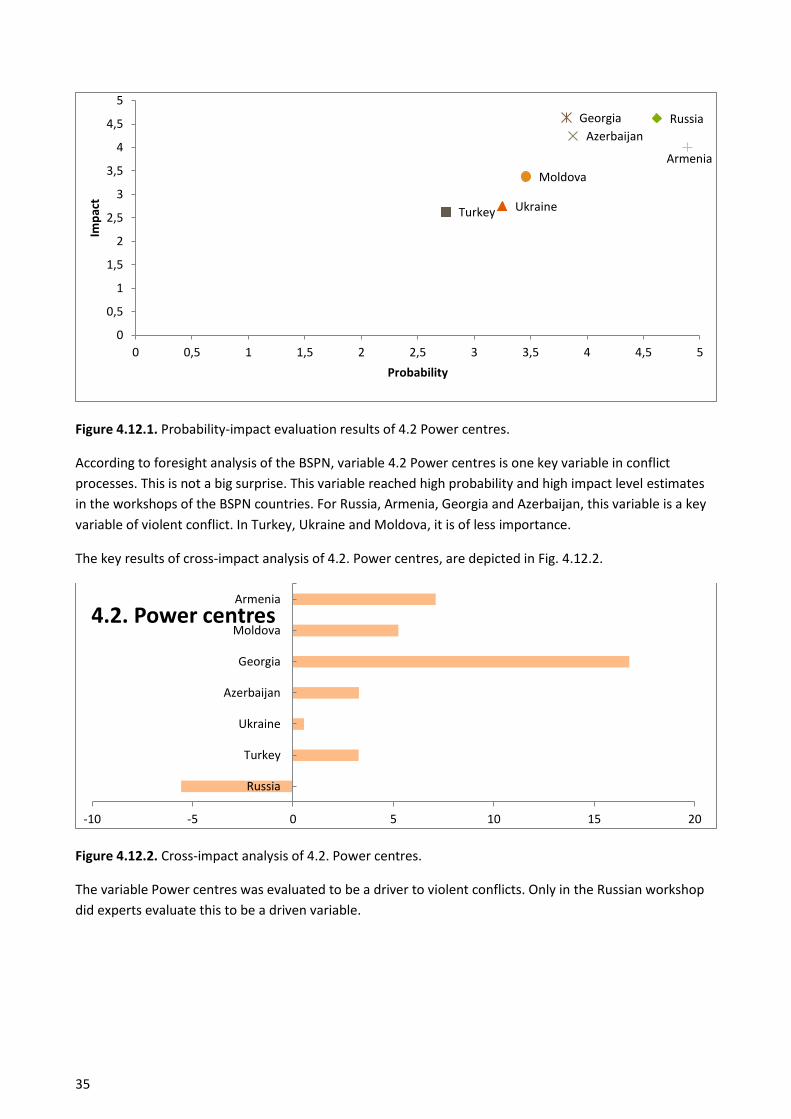
Figure 4.12.1. Probability-impact evaluation results of 4.2 Power centres.
According to foresight analysis of the BSPN, variable 4.2 Power centres is one key variable in conflict
processes. This is not a big surprise. This variable reached high probability and high impact level estimates
in the workshops of the BSPN countries. For Russia, Armenia, Georgia and Azerbaijan, this variable is a key
variable of violent conflict. In Turkey, Ukraine and Moldova, it is of less importance.
The key results of cross-impact analysis of 4.2. Power centres, are depicted in Fig. 4.12.2.
Figure 4.12.2. Cross-impact analysis of 4.2. Power centres.
The variable Power centres was evaluated to be a driver to violent conflicts. Only in the Russian workshop
did experts evaluate this to be a driven variable.
Russia
Turkey Ukraine
Azerbaijan
Georgia
Moldova
Armenia
0
0,5
1
1,5
2
2,5
3
3,5
4
4,5
5
0 0,5 1 1,5 2 2,5 3 3,5 4 4,5 5
Imp
act
Probability
-10 -5 0 5 10 15 20
Russia
Turkey
Ukraine
Azerbaijan
Georgia
Moldova
Armenia
4.2. Power centres
36
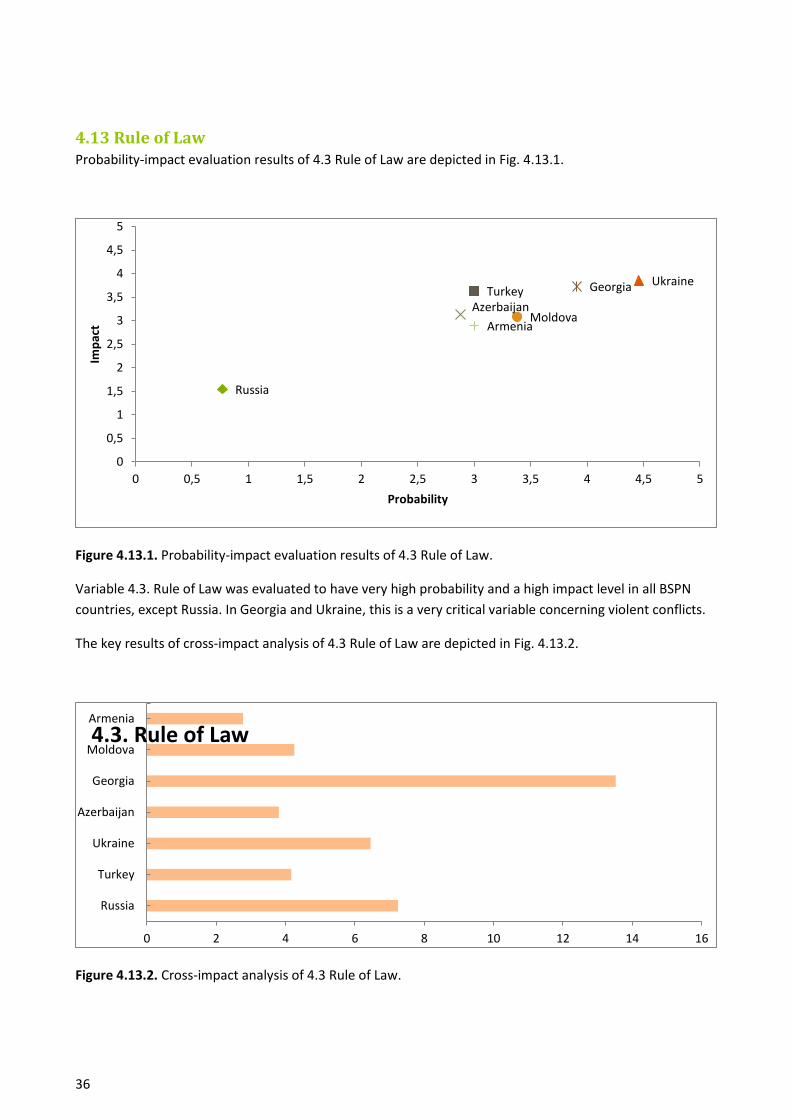
4.13 Rule of Law Probability-impact evaluation results of 4.3 Rule of Law are depicted in Fig. 4.13.1.
Figure 4.13.1. Probability-impact evaluation results of 4.3 Rule of Law.
Variable 4.3. Rule of Law was evaluated to have very high probability and a high impact level in all BSPN
countries, except Russia. In Georgia and Ukraine, this is a very critical variable concerning violent conflicts.
The key results of cross-impact analysis of 4.3 Rule of Law are depicted in Fig. 4.13.2.
Figure 4.13.2. Cross-impact analysis of 4.3 Rule of Law.
Russia
Turkey Ukraine
Azerbaijan
Georgia
Moldova Armenia
0
0,5
1
1,5
2
2,5
3
3,5
4
4,5
5
0 0,5 1 1,5 2 2,5 3 3,5 4 4,5 5
Imp
act
Probability
0 2 4 6 8 10 12 14 16
Russia
Turkey
Ukraine
Azerbaijan
Georgia
Moldova
Armenia
4.3. Rule of Law
37
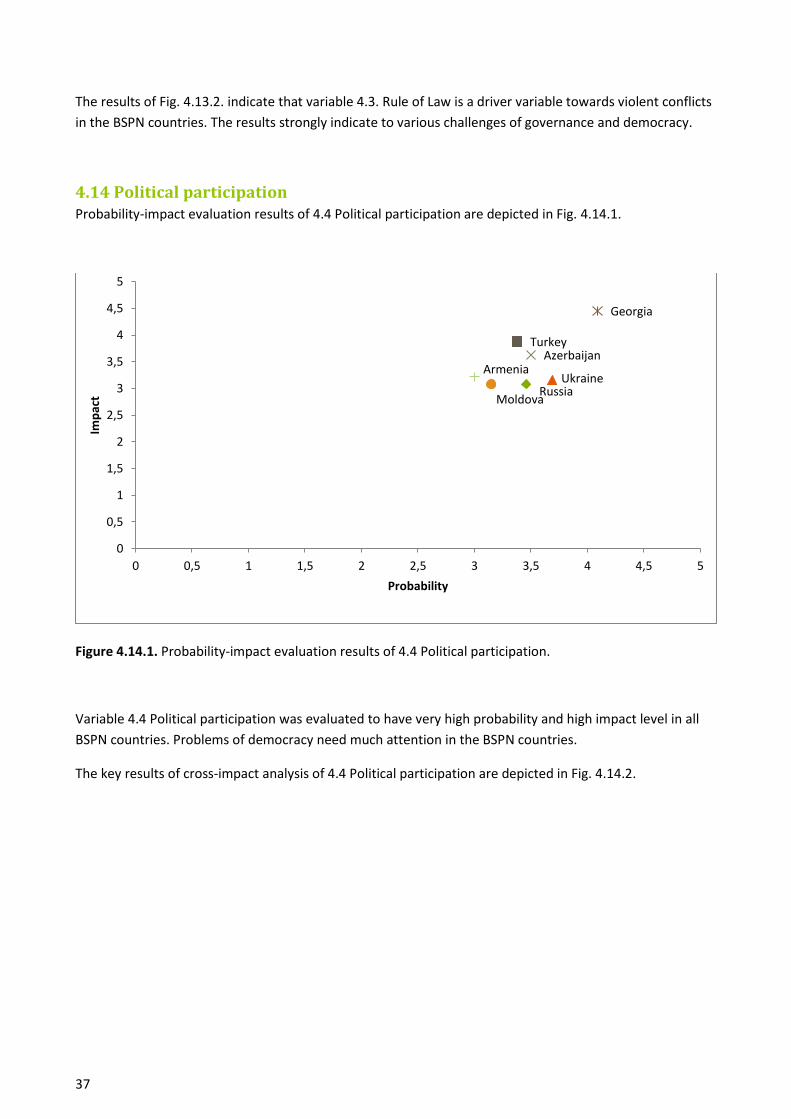
The results of Fig. 4.13.2. indicate that variable 4.3. Rule of Law is a driver variable towards violent conflicts
in the BSPN countries. The results strongly indicate to various challenges of governance and democracy.
4.14 Political participation Probability-impact evaluation results of 4.4 Political participation are depicted in Fig. 4.14.1.
Figure 4.14.1. Probability-impact evaluation results of 4.4 Political participation.
Variable 4.4 Political participation was evaluated to have very high probability and high impact level in all
BSPN countries. Problems of democracy need much attention in the BSPN countries.
The key results of cross-impact analysis of 4.4 Political participation are depicted in Fig. 4.14.2.
Russia
Turkey
Ukraine
Azerbaijan
Georgia
Moldova
Armenia
0
0,5
1
1,5
2
2,5
3
3,5
4
4,5
5
0 0,5 1 1,5 2 2,5 3 3,5 4 4,5 5
Imp
act
Probability
38
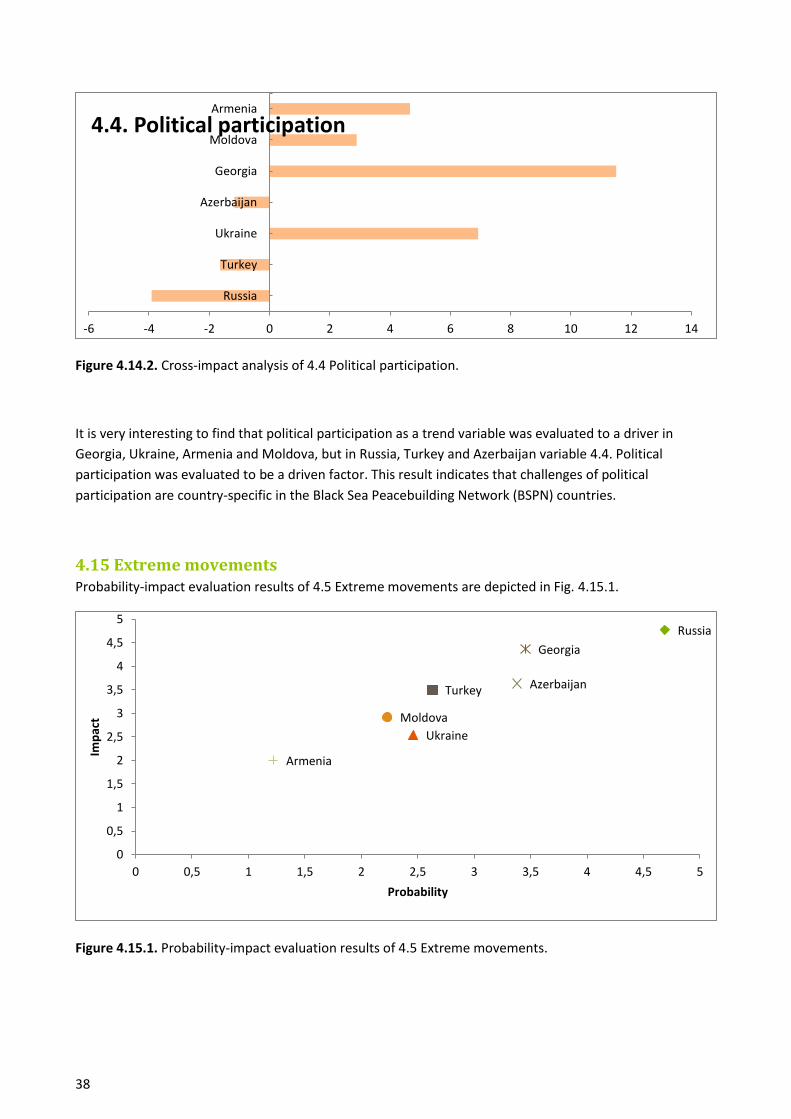
Figure 4.14.2. Cross-impact analysis of 4.4 Political participation.
It is very interesting to find that political participation as a trend variable was evaluated to a driver in
Georgia, Ukraine, Armenia and Moldova, but in Russia, Turkey and Azerbaijan variable 4.4. Political
participation was evaluated to be a driven factor. This result indicates that challenges of political
participation are country-specific in the Black Sea Peacebuilding Network (BSPN) countries.
4.15 Extreme movements Probability-impact evaluation results of 4.5 Extreme movements are depicted in Fig. 4.15.1.
Figure 4.15.1. Probability-impact evaluation results of 4.5 Extreme movements.
-6 -4 -2 0 2 4 6 8 10 12 14
Russia
Turkey
Ukraine
Azerbaijan
Georgia
Moldova
Armenia
4.4. Political participation
Russia
Turkey
Ukraine
Azerbaijan
Georgia
Moldova
Armenia
0
0,5
1
1,5
2
2,5
3
3,5
4
4,5
5
0 0,5 1 1,5 2 2,5 3 3,5 4 4,5 5
Imp
act
Probability
39
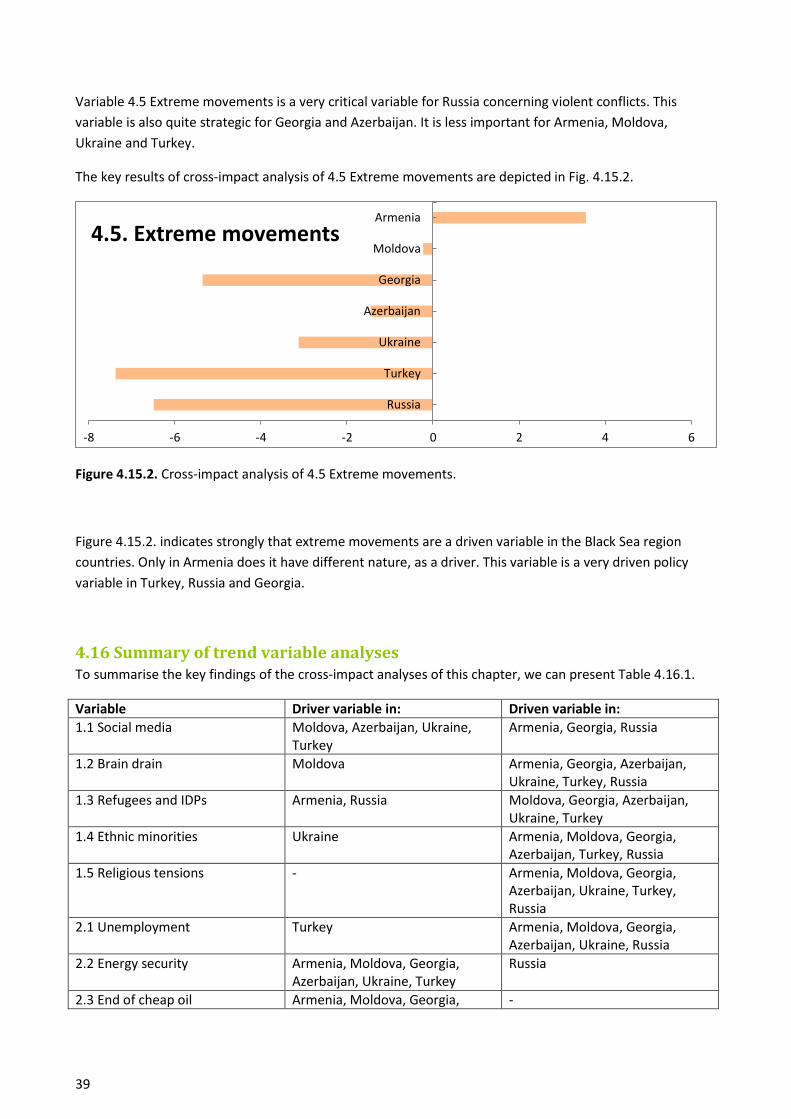
Variable 4.5 Extreme movements is a very critical variable for Russia concerning violent conflicts. This
variable is also quite strategic for Georgia and Azerbaijan. It is less important for Armenia, Moldova,
Ukraine and Turkey.
The key results of cross-impact analysis of 4.5 Extreme movements are depicted in Fig. 4.15.2.
Figure 4.15.2. Cross-impact analysis of 4.5 Extreme movements.
Figure 4.15.2. indicates strongly that extreme movements are a driven variable in the Black Sea region
countries. Only in Armenia does it have different nature, as a driver. This variable is a very driven policy
variable in Turkey, Russia and Georgia.
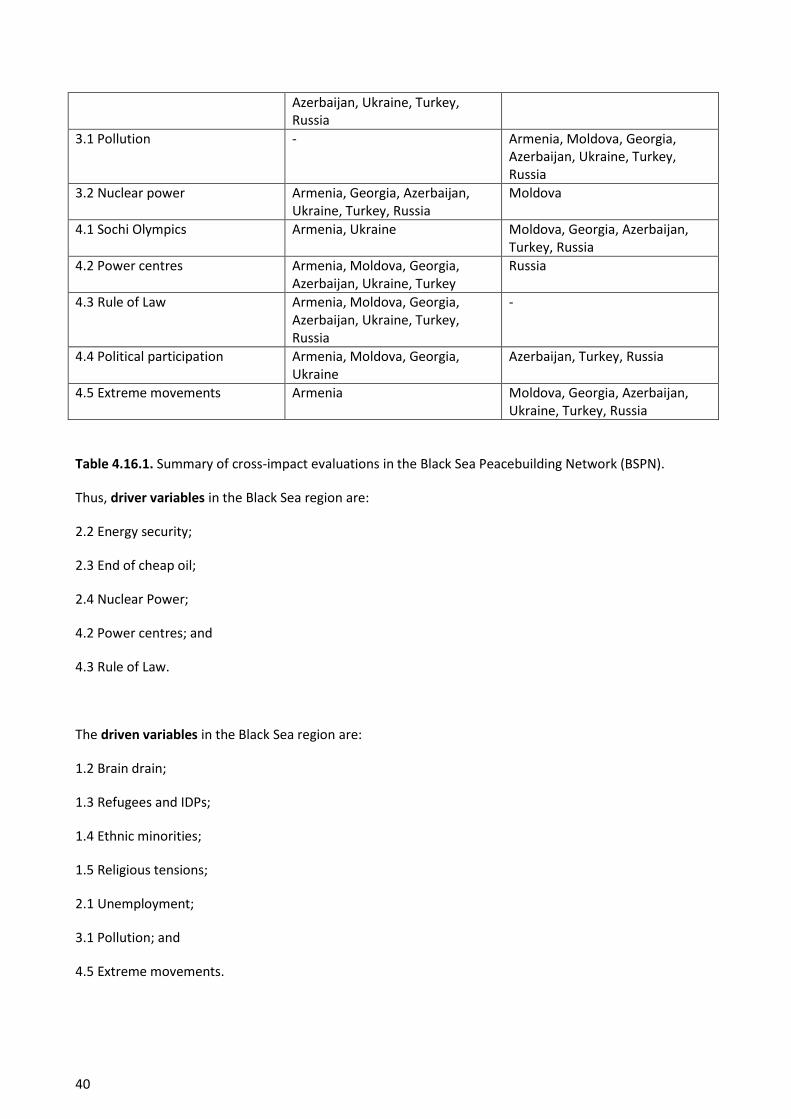
4.16 Summary of trend variable analyses To summarise the key findings of the cross-impact analyses of this chapter, we can present Table 4.16.1.
Variable Driver variable in: Driven variable in:
1.1 Social media Moldova, Azerbaijan, Ukraine, Turkey
Armenia, Georgia, Russia
1.2 Brain drain Moldova Armenia, Georgia, Azerbaijan, Ukraine, Turkey, Russia
1.3 Refugees and IDPs Armenia, Russia Moldova, Georgia, Azerbaijan, Ukraine, Turkey
1.4 Ethnic minorities Ukraine Armenia, Moldova, Georgia, Azerbaijan, Turkey, Russia
1.5 Religious tensions - Armenia, Moldova, Georgia, Azerbaijan, Ukraine, Turkey, Russia
2.1 Unemployment Turkey Armenia, Moldova, Georgia, Azerbaijan, Ukraine, Russia
2.2 Energy security Armenia, Moldova, Georgia, Azerbaijan, Ukraine, Turkey
Russia
2.3 End of cheap oil Armenia, Moldova, Georgia, -
-8 -6 -4 -2 0 2 4 6
Russia
Turkey
Ukraine
Azerbaijan
Georgia
Moldova
Armenia
4.5. Extreme movements
40
Azerbaijan, Ukraine, Turkey, Russia
3.1 Pollution - Armenia, Moldova, Georgia, Azerbaijan, Ukraine, Turkey, Russia
3.2 Nuclear power Armenia, Georgia, Azerbaijan, Ukraine, Turkey, Russia
Moldova
4.1 Sochi Olympics Armenia, Ukraine Moldova, Georgia, Azerbaijan, Turkey, Russia
4.2 Power centres Armenia, Moldova, Georgia, Azerbaijan, Ukraine, Turkey
Russia
4.3 Rule of Law Armenia, Moldova, Georgia, Azerbaijan, Ukraine, Turkey, Russia
-
4.4 Political participation Armenia, Moldova, Georgia, Ukraine
Azerbaijan, Turkey, Russia
4.5 Extreme movements Armenia Moldova, Georgia, Azerbaijan, Ukraine, Turkey, Russia
Table 4.16.1. Summary of cross-impact evaluations in the Black Sea Peacebuilding Network (BSPN).
Thus, driver variables in the Black Sea region are:
2.2 Energy security;
2.3 End of cheap oil;
2.4 Nuclear Power;
4.2 Power centres; and
4.3 Rule of Law.
The driven variables in the Black Sea region are:
1.2 Brain drain;
1.3 Refugees and IDPs;
1.4 Ethnic minorities;
1.5 Religious tensions;
2.1 Unemployment;
3.1 Pollution; and
4.5 Extreme movements.
41
Trend variables, which are more or less intermediate variables having different nature in different BSPN
countries, are:
1.1 Social media;
4.1 Sochi Olympics; and
4.4 Political participation.
It may be good to pay attention to some variable where one country was an outlier in the cross-impact
analysis. Russia was an outlier in the variable analyses of 2.2 Energy security and 4.2 Power centres.
Moldova was an outlier in the variable analyses of 1.2 Brain drain and 3.2 Nuclear power. Turkey was an
outlier in the variable analysis of 2.1 Unemployment. Armenia was an outlier in the variable analysis of 4.5
extreme movements. All these special cases need careful attention in the context of policy dialogue.
5 Summary of the report Predicting the future is notoriously difficult. Foresight analyses serve a useful purpose by stimulating
human responses to avoid possible crises and disasters.
If we want somehow to generally summarise the results and factors, which are the most important for the
emergence of violent conflict and potential conflict resolution, such issues like energy production and
distribution systems, governance structures and democratic institutions are critical factors behind violent
conflicts in the Black Sea region.
Trend variables, which are very important as such, but are not easily governed by decision-makers and
agencies in the Black Sea region, are connected to such issues as migration, refugees and IDPs, brain drain,
ethnic minorities, religious tensions, unemployment and extreme movements.
In this report, there are many detailed results and findings. All of them require more reflection by the Black
Sea Peacebuilding Network (BSPN) members. When the BSPN moves to the next phase of the foresight
project – to the policy options and policy dialogue phase – these background results of foresight analyses
are going to be useful. Obviously, many policy options need more discussion and reflection by the BSPN.
42
6 References Alter, S. (1979) The evaluation of generic cross-impact models. Futures. Vol. 11., No. 2, 132-150.
Booth, K. (2004) Critical Security Studies and World Politics. Boulder: Lynne Rienner Publishers.
Buzan, B., Ware, A. & Hoffman-Martinot, V. (2007) People, States and Fear: An Agenda for International
Security Studies in the Post-Cold War Period. 2nd Edition. Colchester: ECPR Press.
Gordon, T.J. (1994) Cross-impact Method, United Nations University Millennium Project, pp. 1–2. Web:
http://www.lampsacus.com/documents/CROSSIMPACT.pdf
Gordon, T.J. & Hayward, H. (1968) Initial experiments with the cross-impact matrix method of forecasting.
Futures, Vol. 1, 100–116.
Habegger, B. (2010) Strategic foresight in public policy: Reviewing the experiences of UK, Singapore, and
the Netherlands. Futures. Vol., 42, 49–58.
Hough, P. (2007) Understanding Global Security.2nd Edition. New York: Routledge.
Kuosa, T. (2012) The Evolution of Strategic Foresight. Navigating Public Policy Making. Surrey, England:
Gower Publishing. Applied Research.
Ohmae, K. (1999) The Borderless World: Power and Strategy in the Interlinked World. London: Harper
Paperbacks.