Embed Size (px)
Citation preview
Banco de PortugalE U R O S Y S T E M
Working Papers 06|2013
FOREIGN DIRECT INVESTMENT AND INSTITUTIONAL
REFORM: EVIDENCE AND AN APPLICATION TO
PORTUGAL
Paulo Júlio
Ricardo Pinheiro-Alves
José Tavares

working papers
06 | 2013
March 2013
The analyses, opinions and fi ndings of these papers represent
the views of the authors, they are not necessarily those of the
Banco de Portugal or the Eurosystem
FOREIGN DIRECT INVESTMENT AND INSTITUTIONAL REFORM: EVIDENCE AND AN APPLICATION TO
PORTUGAL
Paulo Júlio
Ricardo Pinheiro-Alves
José Tavares
Please address correspondence to
Paulo Júlio
Banco de Portugal, Economics and Research Department
Av. Almirante Reis 71, 1150-012 Lisboa, Portugal
Tel.: 351 21 312 8411, email: [email protected]

BANCO DE PORTUGAL
Av. Almirante Reis, 71
1150-012 Lisboa
www.bportugal.pt
Edition
Economics and Research Department
Lisbon, 2013
ISBN 978-989-678-168-2
ISSN 2182-0422 (online)
Legal Deposit no. 3664/83

Foreign Direct Investment and Institutional Reform:
Evidence and an Application to Portugal∗
Paulo Julio† Ricardo Pinheiro–Alves‡ Jose Tavares§
First draft: March 14, 2011
This version: March 13, 2013
Abstract
We examine the role of geographic, economic, and institutional factors in attractingForeign Direct Investment (FDI) in Europe, using a cross-section of inward bilateralinvestments. We estimate and assess the expected benefits, the required reform efforts,and the efficiency of reform options corresponding to a convergence of Portuguese in-stitutions to EU standards. We conclude that improving home institutions is likely tohave a quantitatively very significant role in attracting FDI. Geographical and marketsize factors also play a role. Reforms promoting the independence of financial institu-tions and a leaner bureaucracy, lowering political risk and corruption, and improvingthe investment code may significantly affect the amount of bilateral inward FDI thatis targeted to Portugal.
JEL Classification: F30 H00Keywords: Foreign Direct Investment, Institutions, Portugal, European Union
∗We are extremely grateful to Francisco Veiga and to all participants in the 5th Annual Meeting of thePortuguese Economic Journal (Aveiro, July 2011), and in the 14th INFER Annual Conference (Coimbra,May 2012) for precious comments and suggestions, and to Ines Cabo, Marta Campos, and Sara Almeidafor excellent research assistance. Jose Tavares thanks Nova Forum and the Fundacao para a Ciencia eTecnologia for financial support. This article was prepared while Paulo Julio was employed at the Office forStrategy and Studies—Portuguese Ministry of Economy and Employment—and the author acknowledgesall the support provided therein. The opinions expressed in this article represent the views of the authorsand do not necessarily correspond to those of Banco de Portugal or of the Portuguese Ministry of Economyand Employment. A previous version of this article circulated under the title “FDI and Institutional Reformin Portugal.”†Banco de Portugal, Economics and Research Department. Corresponding author: pfjulio@bportugal.
pt‡Office for Strategy and Studies—Portuguese Ministry of Economy and Employment—and Instituto de
Artes Visuais, Design e Marketing.§NOVA School of Business and Economics and Centre for Economic Policy Research—London.

1 Introduction
Since the 1990s, Foreign Direct Investment (FDI) has gained importance in an increasingly
globalized economy, for both developing and developed countries. The United Nations
Conference on Trade and Development (UNCTAD) reports an increase in FDI stocks from
13 to over 30 percent of GDP in developing countries and from 9 to 32 percent of GDP in
developed economies, in the period between 1990 and 2010. In 2008, prior to the financial
crisis, developed economies hosted around 75 percent of the world’s FDI, more than half
targeted to the European Union (EU).1 Both the enlargement of the EU to former planned
economies of the East and the financial and economic crisis of 2008–2012 suggest the
relevance of studying institutions as an attractor of FDI. Portugal, a small open economy
in the western periphery of Europe, subject to high external indebtedness and a structural
adjustment program since 2011, is particularly vulnerable to changes in FDI flows for both
structural and cyclical reasons.
A large fraction of the increase in inward FDI from the 1990s follows the rising inter-
nationalization of multinational firms, along with a decrease in the costs of transferring
the production abroad. A firm deciding to export is able to concentrate production in
one place, benefiting from scale economies, but may have to incur large transaction costs,
such as those related with transportation and licensing a product abroad. FDI lessens
some transaction costs at the expense of raising others, namely those related with commu-
nication, personnel training, language, and unfamiliarity with the local business context,
including government practices. FDI may also allow multinational firms to access natural
resources and strategic assets, less expensive or more qualified labor, and more favorable
regulations and business practices (Dunning, 2008).2 Recent worldwide developments, such
as the reduction in intra-regional transaction costs and improvements in the institutional
and legal framework, as well as in business practices, have markedly contributed to the
expansion of foreign investments across the globe.
From the viewpoint of host countries, FDI also brings several advantages in addition to
the direct effects on output and employment levels. FDI is often associated with techno-
logical transfer, the introduction of management skills and business culture, and changes
in the productive structure of a country. In addition to the business environment, it may
be a lever to improve local host country institutions (Larraın and Tavares, 2004). As such,
FDI may be more conducive to long-run growth and development than other forms of
portfolio inflows or trade in goods and services (Barrell and Pain, 1997; Borensztein et al.,
1998). FDI may also impact the balance of payments, as multinational firms have a greater
propensity to export than do domestic firms.
1In 2010, that percentage fell to below 65 percent.2Horstmann and Markusen (1992) and Brainard (1997) develop a proximity-concentration model to
explain multi-plant multinationals and two-way horizontal FDI, which arise when access to markets becomesless expensive relative to exporting.
1
It is not surprising that a substantial amount of research has been devoted to explore
the determinants of FDI. A first wave of research articles focused solely on economic and
geographic determinants, including host-country market size, economic growth, openness,
and the geographical distance between countries. More recently, a few articles have sug-
gested that institutional and political risk factors have a role in explaining inward FDI.
Better institutions promote FDI for a variety of reasons. First, good governance is as-
sociated with higher economic growth, itself an important driver of FDI. Second, better
governance is usually associated with lower corruption and business costs. Finally, good
institutions foster political stability and decrease political uncertainty. FDI is therefore
expected to flow to countries with a stable economic environment and strong institutions,
where, ceteris paribus, running a business is a more promising endeavor.
In this article we first evaluate the role of different economic and institutional factors
in attracting bilateral FDI to a cross-section of European countries. We demonstrate that
good institutions favoring economic freedom and low political risk are key driving forces
of FDI. In particular, a strong and impartial legal environment, characterized by low cor-
ruption levels and the respect and protection of property rights, an independent financial
system and a leaner bureaucracy, and a transparent and efficient foreign investment code,
are major institutional drivers of inward FDI. We then measure the effects on inward FDI of
reforming Portuguese institutions. We construct three indicators based on Tavares (2004)
and Cavalcanti et al. (2008), measuring the benefit of reform in terms of FDI, the required
reform effort, and the efficiency of the reform, i.e. the benefit per required effort of each
reform. For those areas in which Portugal is lagging behind the EU, the most promising
reforms consist in promoting the independence of financial institutions from state control,
lowering corruption, and improving the transparency and bureaucracy associated with the
foreign investment code.
The article is organized as follows. The next section briefly reviews the literature.
Section 3 presents the data collected and used in the empirical analysis. Section 4 introduces
the econometric methodology, and Section 5 discusses the results. Section 6 analyzes the
prospects for institutional reform in Portugal. Section 7 concludes.
2 Literature Review
The empirical literature on FDI initially focused on economic and geographical factors.3
An increased awareness of institutional factors associated with regional integration agree-
ments changed the panorama. As intra-regional transaction costs were reduced, national
jurisdictions tended to rely more heavily on business facilitation measures that provide
incoming firms with a suitable business environment. An institutional and beneficial “race
to the top” takes place among jurisdictions (UNCTAD, 1999).
3See Blonigen (2005) and Caves (2007) for a survey of the literature.
2
Schneider and Frey (1985) were among the first to assess the empirical relevance of policy
and institutional factors, uncovering a negative relationship between political instability
and incoming investment. Biswas (2002) shows that both institutional and traditional
factors are important determinants of FDI inflows, and Stevens (2000) and Benassy-Quere
et al. (2007) present evidence that political and institutional factors explain FDI, after
controlling for several economic factors. The inclusion of institutional variables often greatly
diminishes the estimated impact of economic variables, such as taxation, on FDI (Hajkova
et al., 2006). Wei (2000) and Wei and Shleifer (2000) conclude that corruption reduces
inward FDI. If firms or individuals need to pay bribes in order to obtain permits, licenses,
or access to other government services, the costs of doing business increase and inward FDI
is discouraged. Larraın and Tavares (2004) show that, in addition to the detrimental effect
of corruption on FDI, the opposite effect, whereby higher exogenous levels of incoming
FDI decrease local corruption, is also present and is empirically relevant. Incoming FDI
may be a better deterrent of corruption than openness to trade in goods and services.
Several studies (e.g. Lee and Mansfield, 1996; Knack and Keefer, 1995) show that the
composition of FDI inflows is positively affected by the degree of protection of property
rights and intellectual property. FDI inflows also respond to the efficiency of the legal
system (Buch et al., 2005) and to the extent of entry barriers (Alesina et al., 2005). Other
studies, developed in the context of the Doing Business project, address the role of the
legal system (Djankov et al., 2002), the regulation of entry (Djankov, 2009), the regulation
of labor markets (Botero et al., 2004), and investors’ protection (Djankov et al., 2008).4
3 Data
Our purpose is explaining inward FDI stocks from 86 source countries to 28 European host
countries.5 Both source and host countries were selected according to data availability.
Over 90 percent of Europe’s inward FDI originates from the source countries included, and
selection bias should therefore not be a major issue. The literature has advocated the use
of FDI stocks relative to flows, as the former are based on accumulated flows—hence less
volatile—and are the relevant decision variable for a firm in the long term. In addition, FDI
stocks are a better measure of capital ownership (Benassy-Quere et al., 2007). We use a
3-year average for FDI stocks, a practice followed in the literature (Wei and Shleifer, 2000;
Stein and Daude, 2007) to avoid the influence of sudden changes in FDI’s valuation. The
period analyzed is 2005–2007. As a check for robustness, we also produce estimates using
net accumulated FDI over the same time period. Data were collected from the Eurostat
4As with economic factors, the literature is not consensual on the role of institutional variables inexplaining FDI. For example, Bevan and Estrin (2004) and Wheeler and Mody (1992) find no significantimpact of institutional risk on FDI into Eastern European transition economies and on the location of USforeign affiliates, respectively.
5See the appendix for a detailed description of the data and for a list of countries covered.
3
database.
We explain inward FDI according to an augmented gravity-type model, using geo-
graphic, economic, and institutional regressors. As for geographical factors, we include
the physical distance between host and source countries’ capitals—which can be seen as
a proxy for transaction costs, including transport and communication costs, and cultural
and language barriers—and a border dummy variable, which takes the value of 1 only if
source and host countries share a common border. A greater distance between source and
host countries is expected to have a negative impact on FDI, whereas a common border
should have a positive effect.
Our key economic variables are the host country’s GDP (a proxy for market size), the
GDP growth rate (a proxy for market growth), and labor costs.6 GDP and GDP growth are
expected to have a positive impact on FDI.7 The role of labor costs is less straightforward,
since they may reflect labor productivity.8 We also consider the degree of openness—the
share of imports plus exports over GDP—as a measure of trade flows. Naturally, openness
should have a positive effect on inward FDI.9
Our study also considers the role of education, measured by the mean years of schooling
in each country. Some studies, including Altomonte and Guagliano (2003), argue that
education has an ambiguous effect on FDI. On the one hand, more education implies
higher labor productivity, but, on the other, education is associated with higher wage
costs.10 Finally, we include the Effective Average Tax Rate (EATR) as a measure of the
6One cannot include per capita GDP and labor costs simultaneously in the model, as these variables arehighly correlated. The role of growth on FDI would be more appropriately measured by a variable capturingexpected future growth, but coherent estimates of GDP growth across countries are very hard to come by.
7Market size or market potential, usually measured as GDP, population, or economic growth, is themost extensively discussed economic determinant of FDI. Billington (1999) and Scaperlanda and Balough(1983) find that market size and growth have a statistically significant impact on FDI locations. Using asimultaneous equations model, Tsai (1994) also shows that domestic market size is a key determinant of FDI,while the role of growth is dubious. Janicki and Wunnava (2004) show that GDP positively affected FDItowards EU accession candidate countries. Other studies on the relationship between market size variablesand FDI include Love and Lage-Hidalgo (2000), Barrell and Pain (1996), Wheeler and Mody (1992), Culem(1988), and Kravis and Lipsey (1982).
8While it may be expected that labor costs have a negative impact on inward FDI, as shown in Janickiand Wunnava (2004), Bevan and Estrin (2004), Barrell and Pain (1996), and Culem (1988), several otherstudies (e.g. Tsai, 1994; Wheeler and Mody, 1992; Kravis and Lipsey, 1982) found insignificant or positiverelationships. The mixed evidence is probably due to the role of labor productivity in FDI, which ispositively correlated with—and often compensates for—labor costs.
9The degree of openness has been studied, inter alia, by Bajo-Rubio and Sosvilla-Rivero (1994) andCulem (1988), the former analyzing determinants of FDI in Spain, and the latter FDI inflows among sixindustrialized countries. Both studies conclude that the degree of openness affects inward FDI positively.Wheeler and Mody (1992), on the other hand, find no statistically significant relationship between opennessand FDI, and Grubert and Mutti (1991) find mixed evidence on the effects of trade barriers on FDI.
10Walsh and Yu (2010) find that education has a negligible or slightly counter-intuitive negative effecton FDI, depending on whether one considers FDI toward industry or services. Altomonte and Guagliano(2003) find that education has a negative effect on a multinational’s probability to invest in Central andEastern European or in Mediterranean countries if investment is geared toward traditional industries, anda positive and significant impact for investment in services.
4

tax burden.11
GDP, growth, and openness were collected from the Eurostat database, and labor costs
from AMECO. Mean years of schooling were taken from Barro and Lee’s (2010) database,
whereas the effective average tax rate was kindly provided by Michael Overesch.12 Regres-
sors are for the year 2004, with the exception of mean years of schooling, which was collected
for 2005 due to data restrictions. We explain average incoming FDI for the 2005–2007 pe-
riod using economic and institutional data for the year 2004 so that potential endogeneity
issues are avoided.13
To obtain a characterization of the institutional environment that is as complete as
possible, we use three distinct databases: the Index of Economic Freedom from the Heritage
Foundation, the Political Risk Rating database from the Political Risk Services Group, and
the Doing Business database from the World Bank.
Data for the Index of Economic Freedom cover the institutional framework in the sec-
ond half of 2003 and in the first half of 2004. The Index of Economic Freedom is composed
of ten different components: business freedom, trade freedom, fiscal freedom, government
freedom, monetary freedom, investment freedom, financial freedom, property rights, cor-
ruption freedom, and labor freedom. It is expected that societies with better scores in terms
of economic freedom attract higher levels of FDI, as they offer investors greater protection
of property rights, lower tax burdens, fewer restrictive regulations, less bureaucracy, and
less corruption.14
The Political Risk Rating, collected for the year 2004, comprises twelve indicators: gov-
ernment stability, socioeconomic conditions, investment profile, internal conflicts, external
conflicts, corruption, military in politics, law and order, ethnic tensions, religious tensions,
democratic accountability, and bureaucracy quality. Naturally, higher instability levels and
economic as well as political uncertainty make investments riskier, leading to an expected
11The statutory tax rate is the relevant variable for companies seeking to shift income towards low taxcountries, whereas the effective average tax rate reflects the incentives (such as investment tax credits andaccelerated depreciation) that are granted to firms when the investment occurs (Grubert and Mutti, 1991).The effective marginal tax rate captures incentives to use new capital once the location choice has beenmade. Thus, the effective average tax rate should be the most important decision variable for multinationalsseeking to invest abroad (Devereux and Griffith, 1998). An extensive survey of the relationship betweentaxes and FDI is provided by de Mooij and Ederveen (2003). The empirical analysis of the effects of taxationon FDI dates back at least to Hartman (1984, 1985), who uncovered a negative relationship between thetwo variables. Using a panel approach, Cassou (1997) finds that host country corporate tax rates havea significant negative impact on investment flows. Related conclusions are shared by Grubert and Mutti(1991) and Devereux and Griffith (1998). Hines (1996) finds that state taxes significantly influenced thepattern of FDI in the United States.
12See Overesch and Rincke (2009).13These are particularly important for GDP and GDP growth (Borensztein et al., 1998; Barrell and Pain,
1997).14The Index of Economic Freedom is available at www.heritage.org/index. Economic freedom is the right
of every citizen to control his or her own labor and property. As put forward by the Heritage Foundation,“In a free society, individuals are free to make their own production and consumption decisions, protectedand unconstrained by the state.”
5

decrease in incoming FDI.
Finally, the Doing Business database evaluates the cost of starting, operating, and
closing a medium-sized firm in a given country, complementing the more generic information
on business regulations reported by the Index of Economic Freedom. The data collected
respect the 2006 report, which addresses business regulations as of June 1, 2005, and
covers 33 variables in nine different areas—starting a business, dealing with construction
permits, registering property, getting credit, protecting investors, paying taxes, trading
across borders, enforcing contracts, and closing a business.15 For convenience, we converted
each of the 33 variables into indexes, according to the min-max standardization method.16
To facilitate the interpretation of estimates, this conversion was made such that higher
values are associated with better institutional performance. The resulting indexes were
then summarized into the nine categories.
The original Index of Economic Freedom indicators range from 0 to 100. For the
Political Risk Rating, the range changes across indicators, being either 0–12, 0–6, or 0–4.
To ease comparisons across institutional indicators, all indexes were rescaled to the 0–10
range (no rounding was made), with higher scores always indicating better performances.
This is also the range used in the min-max standardization of Doing Business indicators.
Ideally, one would explain FDI stocks, which are based on past accumulated flows,
with institutional indicators well placed in the past. However, some institutional indicators
that are used herein are available only since the mid-2000s (Doing Business) or mid-1990s
(Index of Economic Freedom). As institutions tend to change slowly over time, we use
institutional indicators for the mid-2000s as proxies for a country’s level of institutional
performance in earlier periods. A similar argument is used in Tavares (2004), who explains
GDP growth between 1960 and 1995 with the institutional framework in the 1990s. Within
the FDI literature, Wei (2000) and Benassy-Quere et al. (2007) also explain FDI stocks
with institutional indicators that are not very distant in time.
In the final section we rely on more recent available institutional data—from the 2012
Index of Economic Freedom, the 2012 Doing Business report, and the 2006 Political Risk
Rating—to evaluate institutional reform in Portugal.
15The Doing Business report is a co-publication of the World Bank and the International Finance Cor-poration, and the data are available at www.doingbusiness.org. Data for the nine different areas of DoingBusiness were first made available in the 2006 report.
16The min-max standardization method normalized to the 0–10 range implies that each variable is con-verted to an index according to the formula
Scorek = 10factork − factormin
factormax − factormin
if higher factor values imply better performances (e.g., strength of legal rights, recovery rate when closinga business), or
Scorek = 10 − 10factork − factormin
factormax − factormin
if higher factor values imply poorer performances (e.g., procedures, time, cost).
6
4 Econometric Methodology
The gravity model was first developed in the context of international trade (Eaton and
Tamura, 1995), but it has also been successfully applied to explain bilateral FDI (Wei, 2000;
Wei and Shleifer, 2000). In its simplest formulation, the gravity model states that the larger
the economic mass of the countries involved and the smaller the distance between them, the
higher the predicted bilateral inward FDI. In this article we use an augmented version of
the gravity model that takes into account other economic and institutional factors affecting
incoming FDI. We use a cross-section specification. A panel setup requires a considerably
long time span—3–4 time periods, each composed of a 5-year average, totaling 15–20 years
of observations. The poor availability of institutional regressors for an earlier time period,
as well as the number of missing FDI observations as one goes back in time, have dictated
our choice. Also, the panel fixed effects model does not allow the estimation of time
invariant regressors, such as geographic factors. Denoting by j the source country and by
i the host country, we first estimate the following augmented gravity-type equation
log(FDIij) = αcj + β1DISTANCEij + β2ECOi + β3INSTi + εij (1)
where FDIij is the inward FDI stock from country j to country i, DISTANCEij is a vector
composed of the physical distance between country j’s and country i’s capitals and the
border dummy variable, ECOi is a vector containing economic indicators for the host
country—namely GDP, GDP growth, labor costs, the degree of openness, education, and
the effective average tax rate—and finally, INSTi is a vector of institutional variables for
the host country. Besides FDIij , the distance between source and host countries, GDP,
and labor costs enter (1) in logarithmic form, which contributes to the homoscedasticity
of the error term. Nonetheless, heteroskedasticity-consistent standard errors are reported.
Furthermore, a double-log specification shows the best fit to the data, consistently delivering
high values for the R2 and more precise estimates for the coefficients, as suggested by Stein
and Daude (2007). We implement a quasi-fixed effects model, i.e. we include source country
dummies, represented in (1) by the vector cj . These dummy variables are meant to capture
all specific characteristics of the source country that affect the volume of outward FDI, such
as the level of GDP, per capita GDP, or the institutional framework. Finally, εij is an i.i.d.
error term assumed to be normally distributed.
To estimate the double-log model in equation (1) by OLS, all zero-FDI observations
have to be dropped, as the logarithm of zero is not defined. Around 37 percent of our
sample corresponds to zero-FDI observations. This results in a censored-sample problem,
which can lead to inconsistency. A common way to deal with censored observations is to
use a Tobit model (Gao, 2005; Stein and Daude, 2007). This approach can be justified
by considering that stocks below a certain threshold are incorrectly recorded as zeros, or
that the desired level of investment is positive, but the presence of fixed costs of investing
7

abroad leads to observed zero-FDI values when the desired investment is below a certain
threshold.17 Thus, besides OLS estimation, we also estimate (1) using a Tobit model, in
which the assumed threshold is log(1/3).18
The validity of OLS and Tobit estimates relies crucially on the assumption that εij is
statistically independent of the regressors. A priori, there is no reason for this assumption
to hold, and thus both procedures may lead to inconsistent estimators. To deal with this
issue, Silva and Tenreyro (2006) suggest estimating models such as (1) in multiplicative
form, through a Poisson Pseudo-Maximum-Likelihood (PPML) estimator.19 The equation
to be estimated becomes
FDIij = exp[αcj + β1DISTANCEij + β2ECOi + β3INSTi
]ζij (2)
where ζij = exp(εij). In addition to dealing with inconsistency, equation (2) rightly con-
siders the existence zero-FDI values.
As a robustness exercise, we also estimate (1) and (2) using net accumulated FDI in
place of FDI stocks. Accumulated FDI should be mostly related with a country’s current
institutional performance, whereas FDI stocks should better reflect the long-term influence
of institutions. However, besides the issues already described that make stocks preferable to
flows, it should be noted that in the case of PPML estimation, we have to drop negative FDI
accumulations—around 18 percent of our observations—which may lead to less accurate
estimates. With OLS estimation, the issue is even more severe, as one must also drop
zero-FDI accumulations—around 31 percent of the sample. In sum, the estimates with
accumulated FDI are presented for reasons of completeness, and not as an alternative to
the main specification with FDI stocks.
Another issue is the high degree of correlation among the different institutional indica-
tors, which leads to problems of near multi-collinearity in the case of simultaneous inclusion
in the regressions. Consequently, the resulting estimates have a low probability of being
close to their true values, due to variance inflation (Hwang and Nettleton, 2003). We tackle
this issue through three distinct approaches. First, for each institutional database, we run
a Principal Component Analysis (PCA), followed by a varimax rotation, in order to sum-
marize the information in a smaller set of indicators.20 The resulting components can, in
most cases, be associated with an identifiable institutional area, though the resulting aggre-
17In this case, desired FDI is the latent variable, equaling realized FDI for values above a certain threshold,but unobserved for values below that threshold. Some authors have proposed using log(1 + FDIij) orlog(a + FDIij) (where a is a parameter to be estimated) instead of log(FDIij) as the dependent variable inorder to estimate (1) while retaining zero-FDI observations (e.g. Eichengreen and Irwin, 1995; Wei, 2000).However, this approach is completely ad hoc, and the results become dependent on the measurement unit.
18Chosen as the minimum value of the average of inward FDI stocks for the 2005–2007 period—1/3 millioneuros.
19We are extremely grateful to the editor for pointing out this approach to us.20This was preceded by the KMO and Bartlett’s test of sphericity, which indicate whether the PCA is an
appropriate approach or not.
8
gation is sometimes too broad to extract specific conclusions about particular institutional
indicators. Besides reducing the dimension of variables to be analyzed, the resulting score
vectors are orthogonal to each other, diminishing by construction the correlations between
institutional factors in our sample. The new summary institutional variables are then used
in (1) and (2) to measure the effects of institutions on FDI.
To assess the robustness of these results, we reduce the dimension of our database
through an alternative method—the direct, unweighted, aggregation of variables. In other
words, we use the information from the rotated factor loadings matrix to identify those
indicators that are highly correlated among themselves, and which can therefore be aggre-
gated into a new variable. The aggregation is done by taking the simple average across
these indicators, and the resulting variables can be interpreted as factor-based scores.
The main disadvantage of the two approaches above is that, as the base correlation
between institutional variables is high, the resulting aggregation is somewhat broad. An
example: the effect of bureaucracy and corruption on FDI cannot be disentangled from one
another. This may or may not be an issue, depending on the degree of detail we seek. The
same is true for the effect of the costs of starting or closing a business.
As an attempt to evaluate the individual effect of institutions on inward FDI while
avoiding problems caused by near multi-collinearity, we also estimate equations (1) and (2)
adding each institutional variable in succession—an empiricist approach widely followed in
the literature (Chakrabarti, 2001; Walsh and Yu, 2010). We interpret these results with
caution, as the coefficient from each institutional variable included may suffer from omitted
variable bias.
5 Results
5.1 Economic Determinants of FDI
Table 1 reports the results for the baseline specification, in which no institutional variable
is included. Columns (1) to (3) present results for FDI stocks, and columns (4) to (6)
for accumulated FDI. The coefficients obtained with OLS do not differ substantially from
those for the Tobit model, suggesting that the censored-sample problem is not serious in our
sample. On the other hand, coefficients obtained with PPML estimation differ considerably
from those of OLS and Tobit estimation for some regressors, in particular for distance and
labor costs. We focus our discussion on columns (3) and (6), as PPML can appropriately
handle zero-FDI values and relies on weaker assumptions than the alternatives. Border
effects affect inward FDI very significantly: according to column (3), the investment of
a country in its neighbor is about 66 percent (e0.505 − 1) higher than the investment in a
similar country with which the source country does not share a common border.21 Distance
is also a key determinant, as an increase of 1 percent in the number of kilometers between
21We report marginal effects for non-logarithmic regressors using the formula eβ − 1.
9
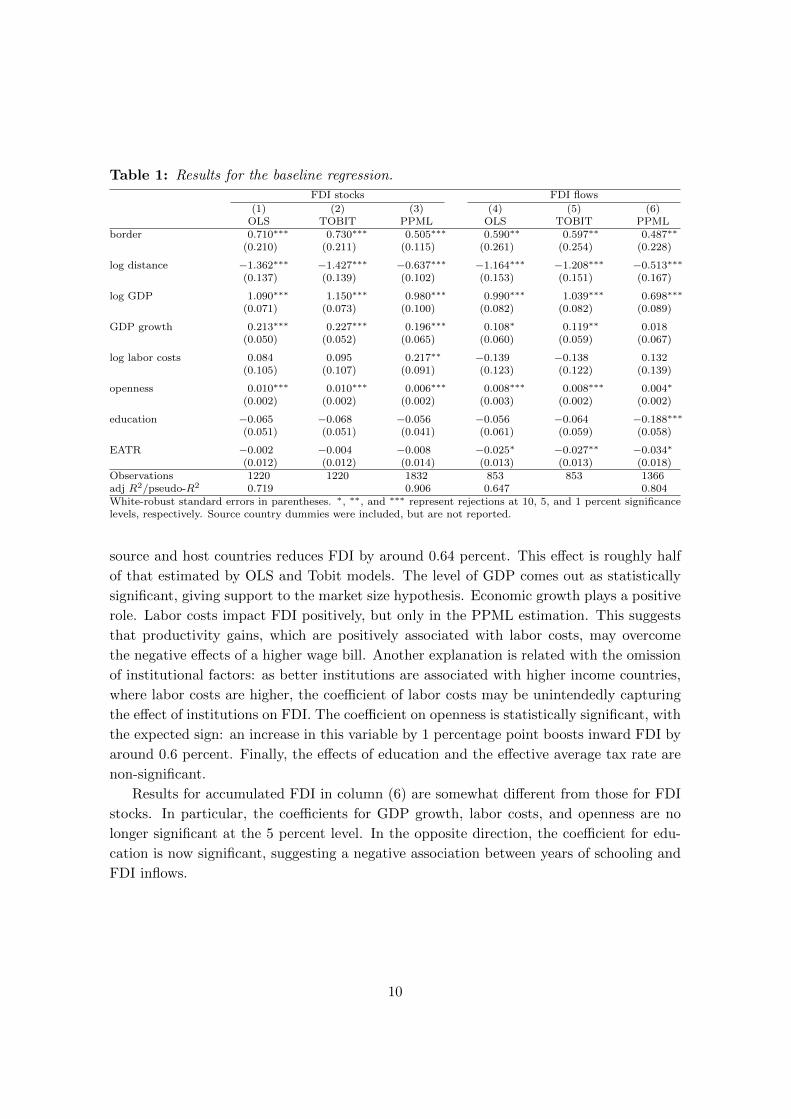
Table 1: Results for the baseline regression.
FDI stocks FDI flows
(1) (2) (3) (4) (5) (6)OLS TOBIT PPML OLS TOBIT PPML
border 0.710∗∗∗ 0.730∗∗∗ 0.505∗∗∗ 0.590∗∗ 0.597∗∗ 0.487∗∗
(0.210) (0.211) (0.115) (0.261) (0.254) (0.228)
log distance −1.362∗∗∗ −1.427∗∗∗ −0.637∗∗∗ −1.164∗∗∗ −1.208∗∗∗ −0.513∗∗∗
(0.137) (0.139) (0.102) (0.153) (0.151) (0.167)
log GDP 1.090∗∗∗ 1.150∗∗∗ 0.980∗∗∗ 0.990∗∗∗ 1.039∗∗∗ 0.698∗∗∗
(0.071) (0.073) (0.100) (0.082) (0.082) (0.089)
GDP growth 0.213∗∗∗ 0.227∗∗∗ 0.196∗∗∗ 0.108∗ 0.119∗∗ 0.018(0.050) (0.052) (0.065) (0.060) (0.059) (0.067)
log labor costs 0.084 0.095 0.217∗∗ −0.139 −0.138 0.132(0.105) (0.107) (0.091) (0.123) (0.122) (0.139)
openness 0.010∗∗∗ 0.010∗∗∗ 0.006∗∗∗ 0.008∗∗∗ 0.008∗∗∗ 0.004∗
(0.002) (0.002) (0.002) (0.003) (0.002) (0.002)
education −0.065 −0.068 −0.056 −0.056 −0.064 −0.188∗∗∗
(0.051) (0.051) (0.041) (0.061) (0.059) (0.058)
EATR −0.002 −0.004 −0.008 −0.025∗ −0.027∗∗ −0.034∗
(0.012) (0.012) (0.014) (0.013) (0.013) (0.018)Observations 1220 1220 1832 853 853 1366adj R2/pseudo-R2 0.719 0.906 0.647 0.804White-robust standard errors in parentheses. ∗, ∗∗, and ∗∗∗ represent rejections at 10, 5, and 1 percent significancelevels, respectively. Source country dummies were included, but are not reported.
source and host countries reduces FDI by around 0.64 percent. This effect is roughly half
of that estimated by OLS and Tobit models. The level of GDP comes out as statistically
significant, giving support to the market size hypothesis. Economic growth plays a positive
role. Labor costs impact FDI positively, but only in the PPML estimation. This suggests
that productivity gains, which are positively associated with labor costs, may overcome
the negative effects of a higher wage bill. Another explanation is related with the omission
of institutional factors: as better institutions are associated with higher income countries,
where labor costs are higher, the coefficient of labor costs may be unintendedly capturing
the effect of institutions on FDI. The coefficient on openness is statistically significant, with
the expected sign: an increase in this variable by 1 percentage point boosts inward FDI by
around 0.6 percent. Finally, the effects of education and the effective average tax rate are
non-significant.
Results for accumulated FDI in column (6) are somewhat different from those for FDI
stocks. In particular, the coefficients for GDP growth, labor costs, and openness are no
longer significant at the 5 percent level. In the opposite direction, the coefficient for edu-
cation is now significant, suggesting a negative association between years of schooling and
FDI inflows.
10

5.2 Institutional Determinants of FDI: Principal Components and Factor
Scores
We now add the institutional dimension as a determinant of FDI, undertaking two alter-
native aggregate approaches: a Principal Components Analysis (PCA) and a factor-based
scores analysis. Information on different institutional indicators is aggregated in a smaller
set of variables, which can then be simultaneously included in the regressions with no risk
of high collinearity. The disadvantage, which we seek to overcome with a third approach in
the next subsection, is that information may become general and non-operative as to the
best possible reforms.
5.2.1 A Principal Components Analysis
We use the PCA to summarize the indicators from the Index of Economic Freedom, the
Political Risk Rating, and the Doing Business into a smaller set of variables. We then run
the specifications using the newly created variables to capture the institutional framework
of a country.
Using the standard eigenvalue-based criterion, with a cut-off value of 1, we identify two
components in the Index of Economic Freedom, jointly explaining 65 percent of total vari-
ance. The rotated factor loading matrix associates the first component score—hereinafter
“firms’ freedom”—with elements that influence the regular activity of business firms, po-
tentially impacting their profitability. This component includes property rights, business
freedom, and freedom from corruption (with factor loadings above 0.8); financial freedom
and investment freedom (with factor loadings above 0.7); monetary freedom, labor freedom,
and trade freedom (with factor loadings above 0.6). The second component score—which
we term “public sector freedom”—measures the public sector effects on economic freedom
(fiscal freedom and government freedom).
When applied to the 12 political risk variables from the Political Risk Rating, the PCA
identifies three components, explaining more than 69 percent of total variance. The first
component is interpreted as “political risk,” and relates to political risk factors directly af-
fecting firms. The rotated factor loadings associate this component with the quality of the
bureaucracy, investment profile, and socioeconomic conditions (with factor loadings above
0.8); corruption, the presence of the military in politics, and democratic accountability
(with factor loadings above 0.7); law and order, and the occurrence of internal and ex-
ternal conflicts (with factor loadings above 0.6). The second component reflects primarily
religious and ethnic tensions, and to a lesser extent internal conflicts, and is simply termed
“political tensions.” The last component relates to “government stability,” though it has a
relevant correlation with democratic accountability as well. In this component, government
stability loads with a positive value and democratic accountability with a negative value.
Hence, higher values are associated with greater government stability, but lower democratic
11
accountability.22 Some individual variables load into more than one component. This is
the case of internal conflicts—with a factor loading of 0.6 in both the political risk compo-
nent and the political tensions component—and democratic accountability—with a factor
loading of 0.7 in the political risk component and of -0.5 in the government stability com-
ponent. This is a natural outcome of the PCA methodology, and purportedly reflects the
importance of the original variable to more than one institutional dimension of relevance.
The standard eigenvalue-based criterion applied to the nine areas of Doing Business
identifies two factors, but factor loadings did not suggest a clear interpretation of the
components. We opted to extract only one factor from the Doing Business database,
interpreted as representing an overall measure of the cost of doing business. This component
represents 45 percent of total variance, and is positively correlated with all 33 individual
Doing Business index variables.
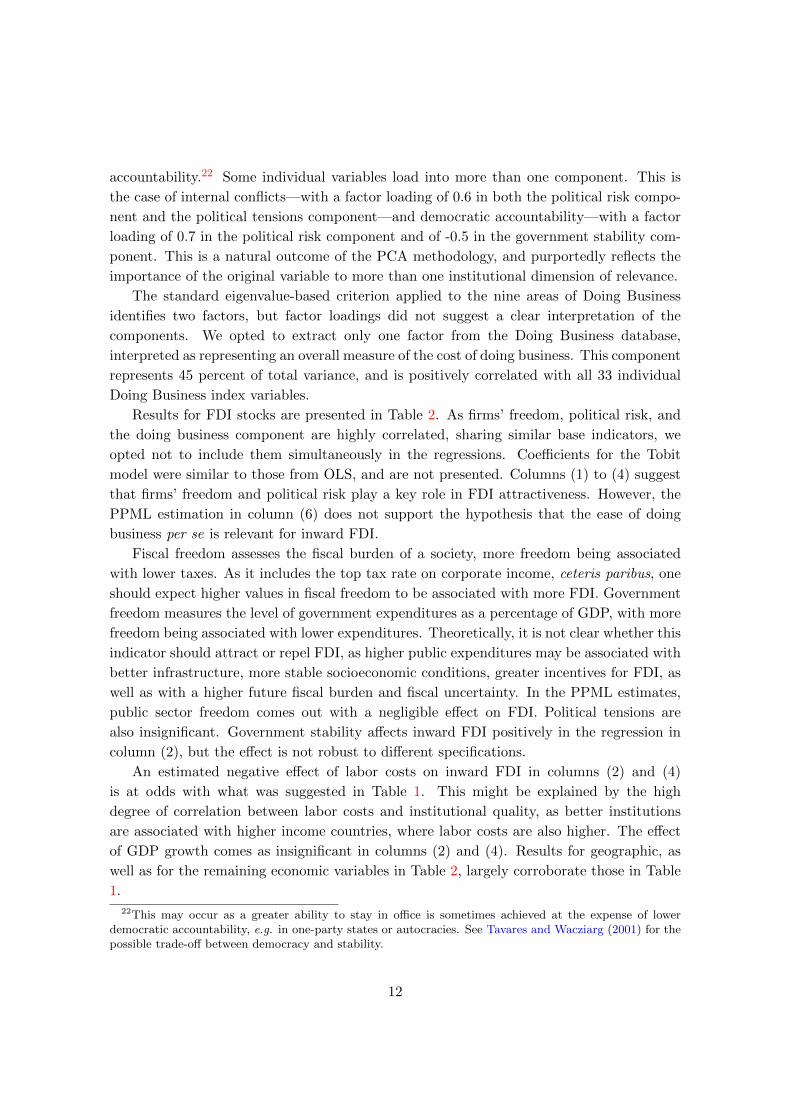
Results for FDI stocks are presented in Table 2. As firms’ freedom, political risk, and
the doing business component are highly correlated, sharing similar base indicators, we
opted not to include them simultaneously in the regressions. Coefficients for the Tobit
model were similar to those from OLS, and are not presented. Columns (1) to (4) suggest
that firms’ freedom and political risk play a key role in FDI attractiveness. However, the
PPML estimation in column (6) does not support the hypothesis that the ease of doing
business per se is relevant for inward FDI.
Fiscal freedom assesses the fiscal burden of a society, more freedom being associated
with lower taxes. As it includes the top tax rate on corporate income, ceteris paribus, one
should expect higher values in fiscal freedom to be associated with more FDI. Government
freedom measures the level of government expenditures as a percentage of GDP, with more
freedom being associated with lower expenditures. Theoretically, it is not clear whether this
indicator should attract or repel FDI, as higher public expenditures may be associated with
better infrastructure, more stable socioeconomic conditions, greater incentives for FDI, as
well as with a higher future fiscal burden and fiscal uncertainty. In the PPML estimates,
public sector freedom comes out with a negligible effect on FDI. Political tensions are
also insignificant. Government stability affects inward FDI positively in the regression in
column (2), but the effect is not robust to different specifications.
An estimated negative effect of labor costs on inward FDI in columns (2) and (4)
is at odds with what was suggested in Table 1. This might be explained by the high
degree of correlation between labor costs and institutional quality, as better institutions
are associated with higher income countries, where labor costs are also higher. The effect
of GDP growth comes as insignificant in columns (2) and (4). Results for geographic, as
well as for the remaining economic variables in Table 2, largely corroborate those in Table
1.
22This may occur as a greater ability to stay in office is sometimes achieved at the expense of lowerdemocratic accountability, e.g. in one-party states or autocracies. See Tavares and Wacziarg (2001) for thepossible trade-off between democracy and stability.
12
Table 2: Results for FDI stocks—PCA approach.
(1) (2) (3) (4) (5) (6)OLS PPML OLS PPML OLS PPML
border 0.742∗∗∗ 0.596∗∗∗ 0.707∗∗∗ 0.630∗∗∗ 0.691∗∗∗ 0.548∗∗∗
(0.208) (0.119) (0.211) (0.117) (0.212) (0.122)
log distance −1.370∗∗∗ −0.587∗∗∗ −1.332∗∗∗ −0.536∗∗∗ −1.424∗∗∗ −0.628∗∗∗
(0.140) (0.113) (0.143) (0.116) (0.143) (0.112)
log GDP 1.076∗∗∗ 0.905∗∗∗ 1.097∗∗∗ 1.092∗∗∗ 1.183∗∗∗ 1.030∗∗∗
(0.071) (0.090) (0.073) (0.101) (0.073) (0.099)
GDP growth 0.259∗∗∗ 0.110 0.306∗∗∗ 0.148∗ 0.397∗∗∗ 0.282∗∗∗
(0.068) (0.081) (0.068) (0.078) (0.088) (0.105)
log labor costs −0.611∗∗∗ −0.466∗∗ −0.205 −0.541∗∗∗ −0.088 0.251(0.226) (0.203) (0.211) (0.186) (0.220) (0.233)
openness 0.007∗∗ 0.003 0.009∗∗∗ 0.005∗∗ 0.021∗∗∗ 0.013∗∗∗
(0.003) (0.002) (0.003) (0.002) (0.004) (0.004)
education −0.111∗ 0.035 −0.202∗∗∗ −0.110 −0.315∗∗∗ −0.166∗∗
(0.061) (0.055) (0.063) (0.070) (0.080) (0.078)
EATR 0.019 0.017 0.012 −0.007 0.028∗ 0.014(0.014) (0.015) (0.014) (0.014) (0.016) (0.015)
Institutional factors
firms’ freedom 0.759∗∗∗ 0.527∗∗∗
(0.125) (0.156)
public sector freedom −0.397∗∗∗ −0.075 −0.120 −0.020 −0.387∗∗∗ −0.021(0.101) (0.080) (0.094) (0.071) (0.102) (0.089)
political risk 0.751∗∗∗ 0.831∗∗∗
(0.195) (0.205)
political tensions 0.060 −0.031 0.074 0.025 0.057 0.066(0.112) (0.112) (0.116) (0.104) (0.122) (0.127)
government stability 0.038 0.385∗∗ −0.340∗∗∗ 0.147 −0.347∗∗∗ −0.039(0.142) (0.152) (0.123) (0.162) (0.133) (0.180)
doing business 0.549∗∗∗ 0.066(0.116) (0.136)
Observations 1220 1832 1220 1832 1211 1768adj R2/pseudo-R2 0.730 0.910 0.724 0.913 0.732 0.910White-robust standard errors in parentheses. ∗, ∗∗, and ∗∗∗ represent rejections at 10, 5, and 1 percent significancelevels, respectively. Source country dummies were included, but are not displayed.
Results for flows in Table 3 confirm previous conclusions: firms’ freedom and political
risk are relevant factors in FDI attractiveness, while the ease of doing business plays a
lesser role. In the case of PPML estimates, the indicator for government stability is sig-
nificant when firms’ freedom or political risk are included in the regression, hinting that
long-standing governments, associated with lower uncertainty regarding fiscal policies, are
advantageous for FDI inflows. Public sector freedom and political tensions seem to play no
role.
5.2.2 A Factor-Based Scores Approach
We now use the information from the rotated factor loadings matrix to aggregate the vari-
ables which loaded into the same component. This robustness exercise has two advantages
13

Table 3: Results for FDI flows—PCA approach.
(1) (2) (3) (4) (5) (6)OLS PPML OLS PPML OLS PPML
border 0.589∗∗ 0.579∗∗∗ 0.575∗∗ 0.587∗∗∗ 0.560∗∗ 0.601∗∗∗
(0.262) (0.220) (0.265) (0.225) (0.273) (0.217)
log distance −1.187∗∗∗ −0.452∗∗∗ −1.152∗∗∗ −0.404∗∗ −1.240∗∗∗ −0.486∗∗∗
(0.157) (0.169) (0.159) (0.171) (0.165) (0.165)
log GDP 0.998∗∗∗ 0.701∗∗∗ 1.013∗∗∗ 0.864∗∗∗ 1.118∗∗∗ 0.866∗∗∗
(0.082) (0.098) (0.082) (0.108) (0.084) (0.102)
GDP growth 0.070 −0.201∗∗ 0.110 −0.134 0.295∗∗∗ 0.094(0.081) (0.088) (0.080) (0.085) (0.113) (0.102)
log labor costs −0.810∗∗∗ −1.023∗∗∗ −0.523∗∗ −0.945∗∗∗ −0.205 0.107(0.253) (0.308) (0.235) (0.235) (0.267) (0.276)
openness 0.005∗ 0.000 0.007∗∗ 0.002 0.021∗∗∗ 0.014∗∗∗
(0.003) (0.002) (0.003) (0.002) (0.005) (0.004)
education −0.023 −0.055 −0.081 −0.165∗∗ −0.272∗∗∗ −0.278∗∗∗
(0.072) (0.064) (0.074) (0.069) (0.101) (0.082)
EATR −0.015 −0.024 −0.019 −0.042∗∗ 0.008 −0.017(0.016) (0.020) (0.016) (0.019) (0.020) (0.021)
Institutional factors
firms’ freedom 0.524∗∗∗ 0.540∗∗∗
(0.153) (0.183)
public sector freedom −0.271∗∗ −0.159 −0.082 −0.079 −0.296∗∗ −0.022(0.119) (0.122) (0.115) (0.107) (0.123) (0.130)
political risk 0.506∗∗ 0.731∗∗∗
(0.245) (0.277)
political tensions 0.171 −0.036 0.191 0.020 0.253∗ 0.186(0.134) (0.132) (0.137) (0.128) (0.149) (0.144)
government stability 0.288∗ 0.804∗∗∗ 0.027 0.554∗∗∗ −0.116 0.251(0.164) (0.194) (0.143) (0.176) (0.165) (0.183)
doing business 0.256∗ −0.224(0.142) (0.148)
Observations 853 1366 853 1366 845 1312adj R2/pseudo-R2 0.651 0.816 0.648 0.817 0.655 0.816White-robust standard errors in parentheses. ∗, ∗∗, and ∗∗∗ represent rejections at 10, 5, and 1 percent significancelevels, respectively. Source country dummies were included, but are not displayed.
relative to PCA. First, it allows us to overcome the caveat that PCA scores representing a
given component have some residual correlations with other components, something which
affects results in some instances. Second, contrary to PCA scores, factor-based scores are
quantitatively interpretable, as variables are measured in indexes. A potential disadvan-
tage is that now weights are not optimally computed, but chosen. The new variables are
aggregated by taking the simple average across the indicators identified in the PCA as
loading into the same component.
Results for FDI stocks are presented in Table 4. In the case of PPML estimation, firms’
freedom and political risk have a positive effect on inward FDI, respectively of 31 (e0.273−1)
and 59 (e0.463 − 1) percent for each point increase in the indicator. Doing business remains
insignificant, as before, and the same holds for public sector freedom and political tensions.
Government stability seems to boost FDI, with an effect comprised between 14 (e0.132 − 1)
14
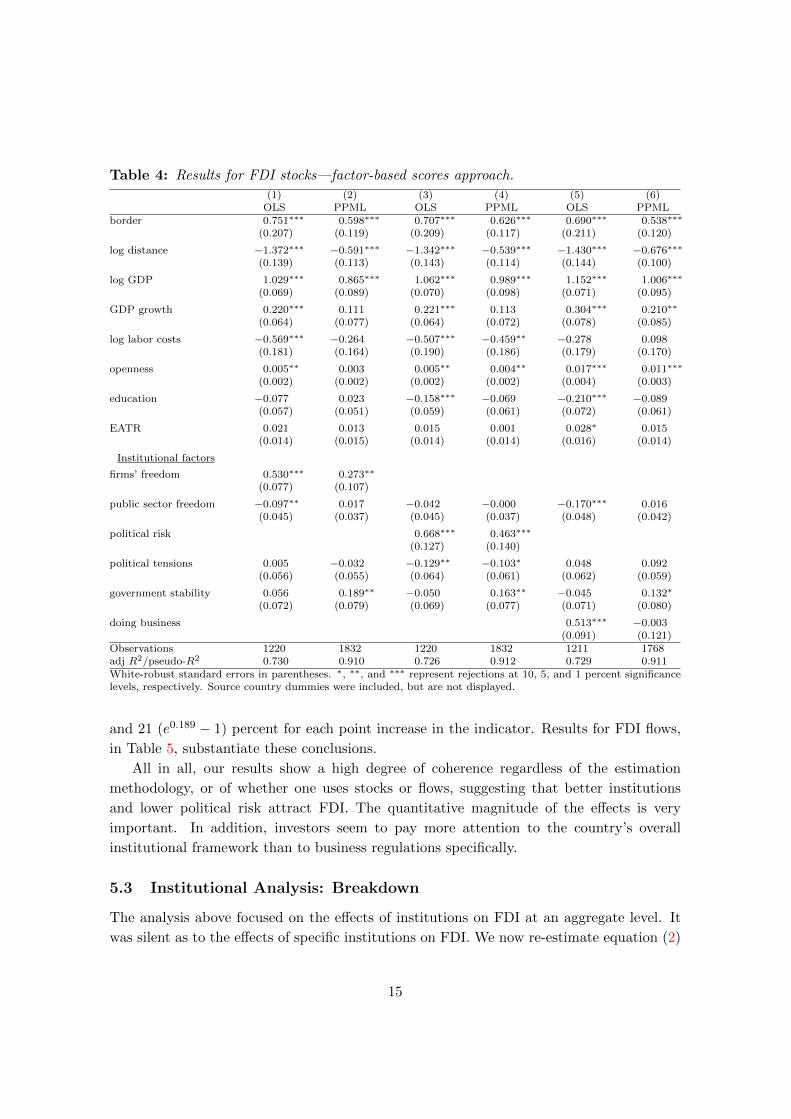
Table 4: Results for FDI stocks—factor-based scores approach.
(1) (2) (3) (4) (5) (6)OLS PPML OLS PPML OLS PPML
border 0.751∗∗∗ 0.598∗∗∗ 0.707∗∗∗ 0.626∗∗∗ 0.690∗∗∗ 0.538∗∗∗
(0.207) (0.119) (0.209) (0.117) (0.211) (0.120)
log distance −1.372∗∗∗ −0.591∗∗∗ −1.342∗∗∗ −0.539∗∗∗ −1.430∗∗∗ −0.676∗∗∗
(0.139) (0.113) (0.143) (0.114) (0.144) (0.100)
log GDP 1.029∗∗∗ 0.865∗∗∗ 1.062∗∗∗ 0.989∗∗∗ 1.152∗∗∗ 1.006∗∗∗
(0.069) (0.089) (0.070) (0.098) (0.071) (0.095)
GDP growth 0.220∗∗∗ 0.111 0.221∗∗∗ 0.113 0.304∗∗∗ 0.210∗∗
(0.064) (0.077) (0.064) (0.072) (0.078) (0.085)
log labor costs −0.569∗∗∗ −0.264 −0.507∗∗∗ −0.459∗∗ −0.278 0.098(0.181) (0.164) (0.190) (0.186) (0.179) (0.170)
openness 0.005∗∗ 0.003 0.005∗∗ 0.004∗∗ 0.017∗∗∗ 0.011∗∗∗
(0.002) (0.002) (0.002) (0.002) (0.004) (0.003)
education −0.077 0.023 −0.158∗∗∗ −0.069 −0.210∗∗∗ −0.089(0.057) (0.051) (0.059) (0.061) (0.072) (0.061)
EATR 0.021 0.013 0.015 0.001 0.028∗ 0.015(0.014) (0.015) (0.014) (0.014) (0.016) (0.014)
Institutional factors
firms’ freedom 0.530∗∗∗ 0.273∗∗
(0.077) (0.107)
public sector freedom −0.097∗∗ 0.017 −0.042 −0.000 −0.170∗∗∗ 0.016(0.045) (0.037) (0.045) (0.037) (0.048) (0.042)
political risk 0.668∗∗∗ 0.463∗∗∗
(0.127) (0.140)
political tensions 0.005 −0.032 −0.129∗∗ −0.103∗ 0.048 0.092(0.056) (0.055) (0.064) (0.061) (0.062) (0.059)
government stability 0.056 0.189∗∗ −0.050 0.163∗∗ −0.045 0.132∗
(0.072) (0.079) (0.069) (0.077) (0.071) (0.080)
doing business 0.513∗∗∗ −0.003(0.091) (0.121)
Observations 1220 1832 1220 1832 1211 1768adj R2/pseudo-R2 0.730 0.910 0.726 0.912 0.729 0.911White-robust standard errors in parentheses. ∗, ∗∗, and ∗∗∗ represent rejections at 10, 5, and 1 percent significancelevels, respectively. Source country dummies were included, but are not displayed.
and 21 (e0.189 − 1) percent for each point increase in the indicator. Results for FDI flows,
in Table 5, substantiate these conclusions.
All in all, our results show a high degree of coherence regardless of the estimation
methodology, or of whether one uses stocks or flows, suggesting that better institutions
and lower political risk attract FDI. The quantitative magnitude of the effects is very
important. In addition, investors seem to pay more attention to the country’s overall
institutional framework than to business regulations specifically.
5.3 Institutional Analysis: Breakdown
The analysis above focused on the effects of institutions on FDI at an aggregate level. It
was silent as to the effects of specific institutions on FDI. We now re-estimate equation (2)
15
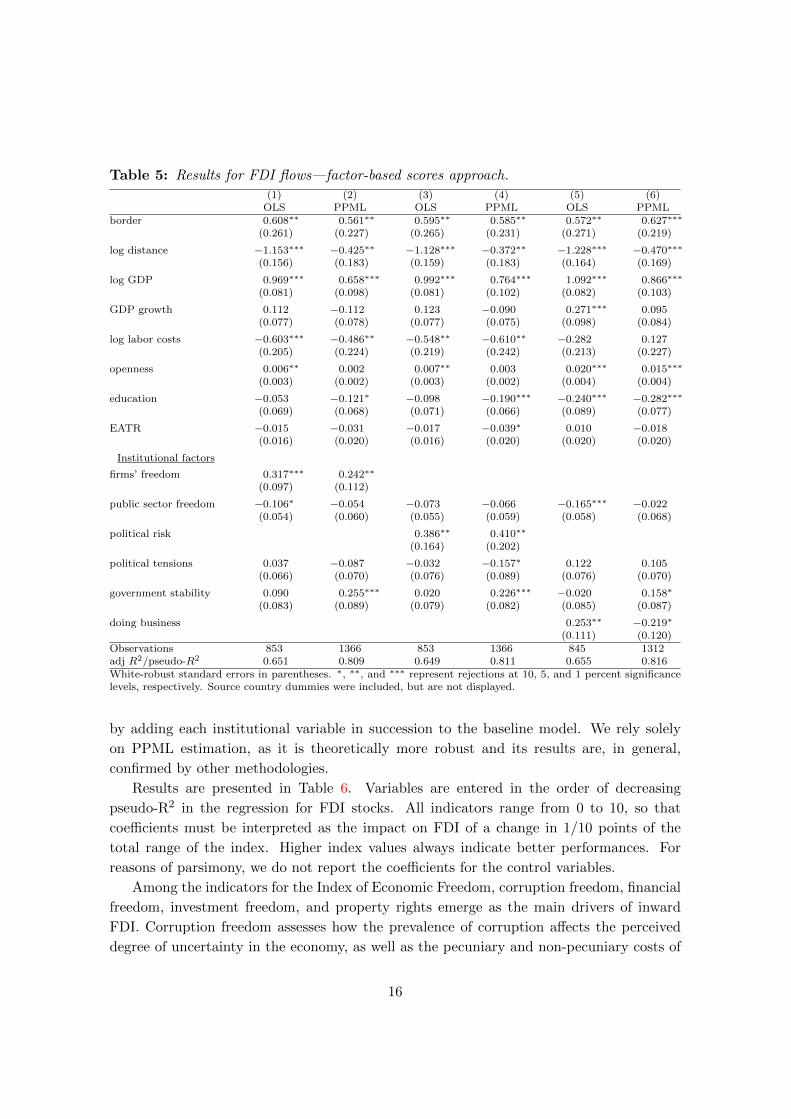
Table 5: Results for FDI flows—factor-based scores approach.
(1) (2) (3) (4) (5) (6)OLS PPML OLS PPML OLS PPML
border 0.608∗∗ 0.561∗∗ 0.595∗∗ 0.585∗∗ 0.572∗∗ 0.627∗∗∗
(0.261) (0.227) (0.265) (0.231) (0.271) (0.219)
log distance −1.153∗∗∗ −0.425∗∗ −1.128∗∗∗ −0.372∗∗ −1.228∗∗∗ −0.470∗∗∗
(0.156) (0.183) (0.159) (0.183) (0.164) (0.169)
log GDP 0.969∗∗∗ 0.658∗∗∗ 0.992∗∗∗ 0.764∗∗∗ 1.092∗∗∗ 0.866∗∗∗
(0.081) (0.098) (0.081) (0.102) (0.082) (0.103)
GDP growth 0.112 −0.112 0.123 −0.090 0.271∗∗∗ 0.095(0.077) (0.078) (0.077) (0.075) (0.098) (0.084)
log labor costs −0.603∗∗∗ −0.486∗∗ −0.548∗∗ −0.610∗∗ −0.282 0.127(0.205) (0.224) (0.219) (0.242) (0.213) (0.227)
openness 0.006∗∗ 0.002 0.007∗∗ 0.003 0.020∗∗∗ 0.015∗∗∗
(0.003) (0.002) (0.003) (0.002) (0.004) (0.004)
education −0.053 −0.121∗ −0.098 −0.190∗∗∗ −0.240∗∗∗ −0.282∗∗∗
(0.069) (0.068) (0.071) (0.066) (0.089) (0.077)
EATR −0.015 −0.031 −0.017 −0.039∗ 0.010 −0.018(0.016) (0.020) (0.016) (0.020) (0.020) (0.020)
Institutional factors
firms’ freedom 0.317∗∗∗ 0.242∗∗
(0.097) (0.112)
public sector freedom −0.106∗ −0.054 −0.073 −0.066 −0.165∗∗∗ −0.022(0.054) (0.060) (0.055) (0.059) (0.058) (0.068)
political risk 0.386∗∗ 0.410∗∗
(0.164) (0.202)
political tensions 0.037 −0.087 −0.032 −0.157∗ 0.122 0.105(0.066) (0.070) (0.076) (0.089) (0.076) (0.070)
government stability 0.090 0.255∗∗∗ 0.020 0.226∗∗∗ −0.020 0.158∗
(0.083) (0.089) (0.079) (0.082) (0.085) (0.087)
doing business 0.253∗∗ −0.219∗
(0.111) (0.120)Observations 853 1366 853 1366 845 1312adj R2/pseudo-R2 0.651 0.809 0.649 0.811 0.655 0.816White-robust standard errors in parentheses. ∗, ∗∗, and ∗∗∗ represent rejections at 10, 5, and 1 percent significancelevels, respectively. Source country dummies were included, but are not displayed.
by adding each institutional variable in succession to the baseline model. We rely solely
on PPML estimation, as it is theoretically more robust and its results are, in general,
confirmed by other methodologies.
Results are presented in Table 6. Variables are entered in the order of decreasing
pseudo-R2 in the regression for FDI stocks. All indicators range from 0 to 10, so that
coefficients must be interpreted as the impact on FDI of a change in 1/10 points of the
total range of the index. Higher index values always indicate better performances. For
reasons of parsimony, we do not report the coefficients for the control variables.
Among the indicators for the Index of Economic Freedom, corruption freedom, financial
freedom, investment freedom, and property rights emerge as the main drivers of inward
FDI. Corruption freedom assesses how the prevalence of corruption affects the perceived
degree of uncertainty in the economy, as well as the pecuniary and non-pecuniary costs of
16
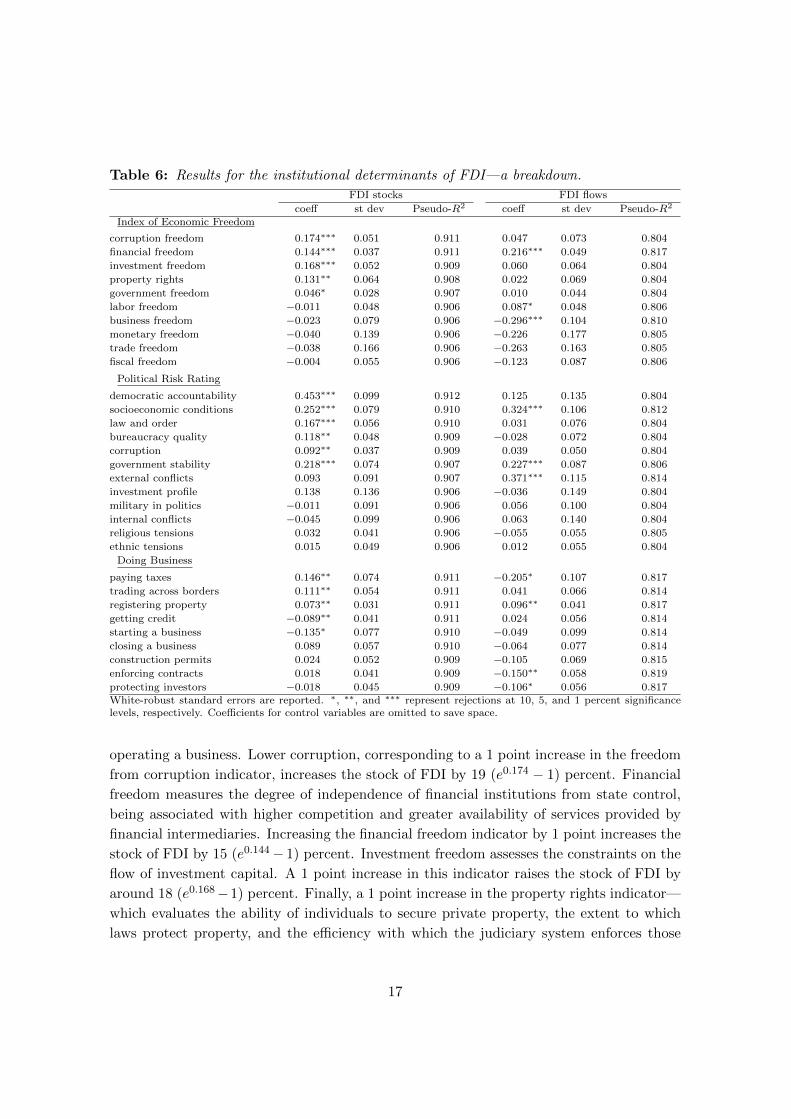
Table 6: Results for the institutional determinants of FDI—a breakdown.
FDI stocks FDI flows
coeff st dev Pseudo-R2 coeff st dev Pseudo-R2
Index of Economic Freedom
corruption freedom 0.174∗∗∗ 0.051 0.911 0.047 0.073 0.804
financial freedom 0.144∗∗∗ 0.037 0.911 0.216∗∗∗ 0.049 0.817
investment freedom 0.168∗∗∗ 0.052 0.909 0.060 0.064 0.804
property rights 0.131∗∗ 0.064 0.908 0.022 0.069 0.804
government freedom 0.046∗ 0.028 0.907 0.010 0.044 0.804
labor freedom −0.011 0.048 0.906 0.087∗ 0.048 0.806
business freedom −0.023 0.079 0.906 −0.296∗∗∗ 0.104 0.810
monetary freedom −0.040 0.139 0.906 −0.226 0.177 0.805
trade freedom −0.038 0.166 0.906 −0.263 0.163 0.805
fiscal freedom −0.004 0.055 0.906 −0.123 0.087 0.806
Political Risk Rating
democratic accountability 0.453∗∗∗ 0.099 0.912 0.125 0.135 0.804
socioeconomic conditions 0.252∗∗∗ 0.079 0.910 0.324∗∗∗ 0.106 0.812
law and order 0.167∗∗∗ 0.056 0.910 0.031 0.076 0.804
bureaucracy quality 0.118∗∗ 0.048 0.909 −0.028 0.072 0.804
corruption 0.092∗∗ 0.037 0.909 0.039 0.050 0.804
government stability 0.218∗∗∗ 0.074 0.907 0.227∗∗∗ 0.087 0.806
external conflicts 0.093 0.091 0.907 0.371∗∗∗ 0.115 0.814
investment profile 0.138 0.136 0.906 −0.036 0.149 0.804
military in politics −0.011 0.091 0.906 0.056 0.100 0.804
internal conflicts −0.045 0.099 0.906 0.063 0.140 0.804
religious tensions 0.032 0.041 0.906 −0.055 0.055 0.805
ethnic tensions 0.015 0.049 0.906 0.012 0.055 0.804
Doing Business
paying taxes 0.146∗∗ 0.074 0.911 −0.205∗ 0.107 0.817
trading across borders 0.111∗∗ 0.054 0.911 0.041 0.066 0.814
registering property 0.073∗∗ 0.031 0.911 0.096∗∗ 0.041 0.817
getting credit −0.089∗∗ 0.041 0.911 0.024 0.056 0.814
starting a business −0.135∗ 0.077 0.910 −0.049 0.099 0.814
closing a business 0.089 0.057 0.910 −0.064 0.077 0.814
construction permits 0.024 0.052 0.909 −0.105 0.069 0.815
enforcing contracts 0.018 0.041 0.909 −0.150∗∗ 0.058 0.819
protecting investors −0.018 0.045 0.909 −0.106∗ 0.056 0.817White-robust standard errors are reported. ∗, ∗∗, and ∗∗∗ represent rejections at 10, 5, and 1 percent significancelevels, respectively. Coefficients for control variables are omitted to save space.
operating a business. Lower corruption, corresponding to a 1 point increase in the freedom
from corruption indicator, increases the stock of FDI by 19 (e0.174 − 1) percent. Financial
freedom measures the degree of independence of financial institutions from state control,
being associated with higher competition and greater availability of services provided by
financial intermediaries. Increasing the financial freedom indicator by 1 point increases the
stock of FDI by 15 (e0.144 − 1) percent. Investment freedom assesses the constraints on the
flow of investment capital. A 1 point increase in this indicator raises the stock of FDI by
around 18 (e0.168−1) percent. Finally, a 1 point increase in the property rights indicator—
which evaluates the ability of individuals to secure private property, the extent to which
laws protect property, and the efficiency with which the judiciary system enforces those
17
same laws—raises inward FDI by around 14 (e0.131 − 1) percent. The remaining indicators
have a negligible estimated effect on inward FDI.
As to the Political Risk Rating indicators, our results hint at an important effect of
low political risk and good institutions on inbound FDI. The most important indicators
are: democratic accountability, measuring the extent to which governments respond to
citizens, with an effect of approximately 57 (e0.453 − 1) percent in FDI for each point
increase; socioeconomic conditions, which evaluate the extent to which social dissatisfaction
constrains government action, with an impact of 29 (e0.252−1) percent; government stability,
which assesses the government’s ability to stay in office, with an impact of 24 (e0.218 − 1)
percent; law and order, measuring the strength and impartiality of the legal system and
whether laws are widely respected, with an impact of 18 (e0.167 − 1) percent; bureaucracy
quality, which measures the strength, quality, and autonomy of the bureaucracy, with an
impact of 13 (e0.118 − 1) percent; and corruption, with an impact of 10 (e0.092 − 1) percent.
The empirical results suggest that multinational firms direct their investments to stable
and well-functioning democracies, with lean bureaucracies and lower corruption levels.
Doing Business indicators have a lesser impact on inward FDI. Table 6 puts into evidence
that only some business regulations, namely those related with paying taxes, export and
import activities, and property registration, affect FDI positively.
Specifications using FDI stocks yield higher pseudo-R2 than specifications for FDI flows,
suggesting that institutional determinants of FDI operate most clearly over extended pe-
riods of time. In the short run, issues such as special market opportunities, specific and
lumpy investments, and sudden policy changes may take precedence over stable and efficient
institutions, making flows more volatile and harder to predict.
6 Institutional Reform in Portugal: Some Policy Directions
We now strive to understand how institutional reform in Portugal may impact the country’s
ability to attract FDI. We examine and compare the impact of specific, item by item,
reforms that bring Portuguese institutions to the same standard as that in the EU. We
base our analysis on the latest institutional data we have access to, namely the 2012 Index
of Economic Freedom, the 2012 Doing Business, and the Political Risk Rating for 2006.
Our exercise closely follows Tavares (2004), who proposed three measures of institutional
reform: the first assessing the benefits of reform in terms of a dependent variable of choice,
the second the reform effort, given by some measure of distance between current institutions
and the desired institutional status, and finally the ratio of the first by the second indicator,
a measure of the efficiency of the reform effort.23
We examine separately each institutional indicator for which Portugal is lagging behind
23Another application can be found in Cavalcanti et al. (2008), where the potential of institutional reformsin Brazil is assessed.
18
the EU standard. The analysis takes both the EU-15 and the EU-27 as comparison bench-
marks, as the latter include several transition economies whose institutions are generally
lagging and, at the same time, undergoing profound changes.24 The impact of reforming
institution k to the EU level is given by the exponential of the estimated coefficient for each
institutional indicator, as computed in the previous section, multiplied by the institutional
difference between Portugal and the average EU indicator. That is
Impact on FDIk = exp(β3,k(INSTEU,k − INSTP,k)
)− 1 (3)
where INSTi,k denotes the institutional index of institution k in country i, i = EU,P (where
EU stands for the EU average and P for Portugal) and β3,k is the respective coefficient.25
Obviously, the higher the value of (3), the more promising are the prospects for reform in
that area. This may occur for different reasons: either that institution has a large impact
on inbound FDI, or Portuguese institutions have a lot of leeway for betterment, or both.
The “cost of reform,” i.e., the required effort to bring the Portuguese institutional index
closer to that of the EU, can be proxied, albeit imperfectly, by
Required reform effortk =INSTEU,k − INSTP,k
INSTP,k(4)
Equation (4) measures the distance of the Portuguese institutional index relative to the
EU average, i.e., the required institutional change needed for Portugal to bring itself onto
a par with the EU. Higher values suggest that more effort has to be exerted in order for
the reform to be successful.
The third measure of institutional reform evaluates the efficiency of the reform, i.e.,
the impact on FDI of each unit of effort put into the reform. In a sense, it gives the “bang
for the buck” for each specific reform, computed as the ratio of (3) over (4)
Efficiency of reformk =Impact on FDIk
Required reform effortk(5)
A value of 1 indicates a one-to-one relationship between inbound FDI and the reform effort.
That is, any reform requiring a given percentage increase in the institutional indicator for
convergence with the EU would give rise to exactly the same percentage increase in inward
FDI. The higher the value of (5), the more promising is the reform in that area in terms of
efficiency, that is, the higher the increase in FDI for each unit of effort put into the reform.
In Tables 7 and 8 we evaluate reform possibilities on the basis of PPML estimation
and FDI stocks. As it only makes sense to evaluate the benefits of potential reforms for
24As data for Cyprus and Malta are not available in our database, the EU-27 actually comprises only 25countries.
25In our computations, we take into account that a change in the Portuguese institutional index alsochanges the EU average institutional index.
19

Table 7: Reforming Portuguese institutions. Impact on FDI, required reform effort, andefficiency of reform versus the EU-27.
(1) (2)(3)
(4)(5) (6) (7)
(2)-(1) e(4)(3)-1 (3)/(1) (5)/(6)
indexPortugal
indexEU-27
difference coefficientimpacton FDI
(%)
requiredreformeffort
efficiencyof reform
Agg. institutional indicators
firms’ freedom∗∗ 6.82 7.38 0.57 0.27 16.8 8.3 2.0political risk∗∗∗ 8.38 8.34 −0.05 0.46
Index of Economic Freedom
corruption freedom∗∗∗ 6.00 6.34 0.34 0.17 6.1 5.7 1.1financial freedom∗∗∗ 6.00 7.00 1.00 0.14 15.5 16.7 0.9investment freedom∗∗∗ 7.00 7.83 0.83 0.17 15.0 11.9 1.3property rights∗∗ 7.00 7.13 0.13 0.13 1.7 1.8 0.9government freedom∗ 2.55 2.83 0.28 0.05 1.3 10.8 0.1
Political Risk Rating
democratic accountability∗∗∗ 10.00 9.62 −0.38 0.45socioeconomic conditions∗∗∗ 6.70 6.60 −0.10 0.25law and order∗∗∗ 8.33 8.24 −0.10 0.17bureaucracy quality∗∗ 7.50 8.02 0.52 0.12 6.3 6.9 0.9corruption∗∗ 6.67 5.94 −0.72 0.09government stability∗∗∗ 7.12 6.57 −0.55 0.22
Doing Business
paying taxes∗∗∗ 6.77 6.73 −0.04 0.15trading across borders∗∗ 8.01 7.82 −0.19 0.11registering property∗ 8.49 7.03 −1.46 0.07∗, ∗∗, and ∗∗∗ represent the variables which are significant at the 10, 5, and 1 percent significance levels, respectively.The reform measures are only computed for the statistical significant variables in which Portugal has an inferiorperformance relative to the European Union. The index for the EU-27 excludes Portugal.
areas in which Portugal lags behind the EU average level, we ignore any indicators where
the opposite holds. Any area whose coefficient in the above estimates is not statistically
significant is ignored in the following exercise.
Table 7 shows that Portugal is lagging behind the EU-27 average mostly in the indi-
cators for the Index of Economic Freedom. The most promising area for reform relates
to restrictions to investment, i.e. investment freedom, due to the comparatively high effi-
ciency and its large impact on FDI. This indicator considers restrictions on FDI and the
degree of transparency of the foreign investment code. Raising the independence of the fi-
nancial system from government control, i.e. financial freedom, to the EU-27 level also has
a substantial impact on inward FDI, although at the expense of a higher effort. Lowering
corruption levels, measured by the corruption freedom indicator, and improving the quality
of the bureaucracy are also promising candidates for reform. Finally, a reform raising firms’
freedom to the EU-27 level can boost inward FDI by around 17 percent.
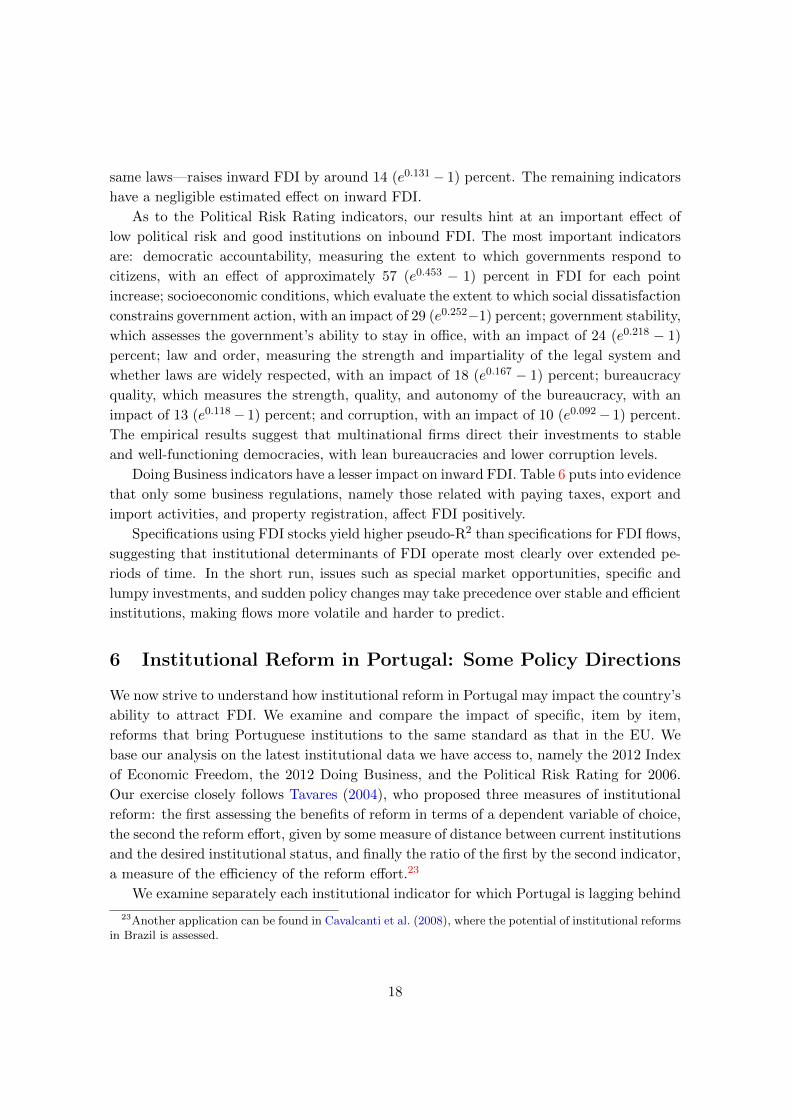
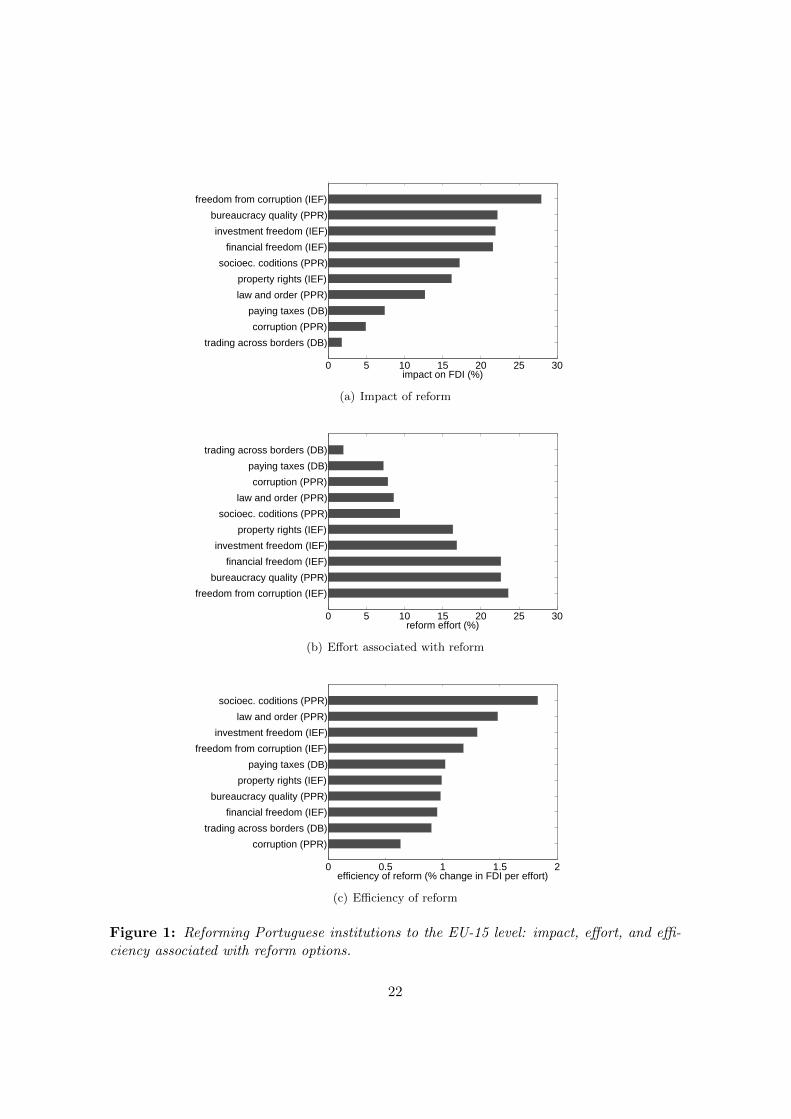
When Portugal is compared with the EU-15, in Table 8, the estimated impact of reforms
is naturally higher. Figure 1 provides a graphical depiction of the effects of reforming
Portuguese institutions to the EU-15 level. Among the indicators for the Index of Economic
Freedom, investment freedom continues to be the most promising reform. One must also
20
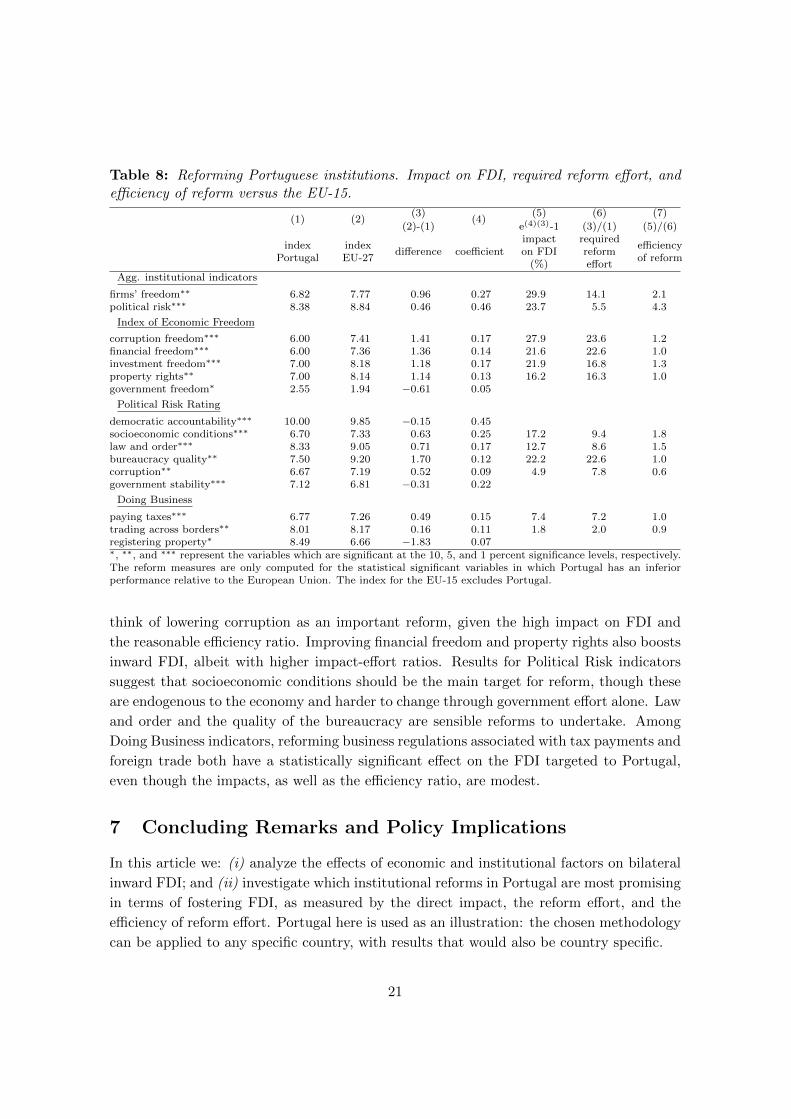
Table 8: Reforming Portuguese institutions. Impact on FDI, required reform effort, andefficiency of reform versus the EU-15.
(1) (2)(3)
(4)(5) (6) (7)
(2)-(1) e(4)(3)-1 (3)/(1) (5)/(6)
indexPortugal
indexEU-27
difference coefficientimpacton FDI
(%)
requiredreformeffort
efficiencyof reform
Agg. institutional indicators
firms’ freedom∗∗ 6.82 7.77 0.96 0.27 29.9 14.1 2.1political risk∗∗∗ 8.38 8.84 0.46 0.46 23.7 5.5 4.3
Index of Economic Freedom
corruption freedom∗∗∗ 6.00 7.41 1.41 0.17 27.9 23.6 1.2financial freedom∗∗∗ 6.00 7.36 1.36 0.14 21.6 22.6 1.0investment freedom∗∗∗ 7.00 8.18 1.18 0.17 21.9 16.8 1.3property rights∗∗ 7.00 8.14 1.14 0.13 16.2 16.3 1.0government freedom∗ 2.55 1.94 −0.61 0.05
Political Risk Rating
democratic accountability∗∗∗ 10.00 9.85 −0.15 0.45socioeconomic conditions∗∗∗ 6.70 7.33 0.63 0.25 17.2 9.4 1.8law and order∗∗∗ 8.33 9.05 0.71 0.17 12.7 8.6 1.5bureaucracy quality∗∗ 7.50 9.20 1.70 0.12 22.2 22.6 1.0corruption∗∗ 6.67 7.19 0.52 0.09 4.9 7.8 0.6government stability∗∗∗ 7.12 6.81 −0.31 0.22
Doing Business
paying taxes∗∗∗ 6.77 7.26 0.49 0.15 7.4 7.2 1.0trading across borders∗∗ 8.01 8.17 0.16 0.11 1.8 2.0 0.9registering property∗ 8.49 6.66 −1.83 0.07∗, ∗∗, and ∗∗∗ represent the variables which are significant at the 10, 5, and 1 percent significance levels, respectively.The reform measures are only computed for the statistical significant variables in which Portugal has an inferiorperformance relative to the European Union. The index for the EU-15 excludes Portugal.
think of lowering corruption as an important reform, given the high impact on FDI and
the reasonable efficiency ratio. Improving financial freedom and property rights also boosts
inward FDI, albeit with higher impact-effort ratios. Results for Political Risk indicators
suggest that socioeconomic conditions should be the main target for reform, though these
are endogenous to the economy and harder to change through government effort alone. Law
and order and the quality of the bureaucracy are sensible reforms to undertake. Among
Doing Business indicators, reforming business regulations associated with tax payments and
foreign trade both have a statistically significant effect on the FDI targeted to Portugal,
even though the impacts, as well as the efficiency ratio, are modest.
7 Concluding Remarks and Policy Implications
In this article we: (i) analyze the effects of economic and institutional factors on bilateral
inward FDI; and (ii) investigate which institutional reforms in Portugal are most promising
in terms of fostering FDI, as measured by the direct impact, the reform effort, and the
efficiency of reform effort. Portugal here is used as an illustration: the chosen methodology
can be applied to any specific country, with results that would also be country specific.
21
0 5 10 15 20 25 30
trading across borders (DB)
corruption (PPR)
paying taxes (DB)
law and order (PPR)
property rights (IEF)
socioec. coditions (PPR)
financial freedom (IEF)
investment freedom (IEF)
bureaucracy quality (PPR)
freedom from corruption (IEF)
impact on FDI (%)
(a) Impact of reform
0 5 10 15 20 25 30
freedom from corruption (IEF)
bureaucracy quality (PPR)
financial freedom (IEF)
investment freedom (IEF)
property rights (IEF)
socioec. coditions (PPR)
law and order (PPR)
corruption (PPR)
paying taxes (DB)
trading across borders (DB)
reform effort (%)
(b) Effort associated with reform
0 0.5 1 1.5 2
corruption (PPR)
trading across borders (DB)
financial freedom (IEF)
bureaucracy quality (PPR)
property rights (IEF)
paying taxes (DB)
freedom from corruption (IEF)
investment freedom (IEF)
law and order (PPR)
socioec. coditions (PPR)
efficiency of reform (% change in FDI per effort)
(c) Efficiency of reform
Figure 1: Reforming Portuguese institutions to the EU-15 level: impact, effort, and effi-ciency associated with reform options.
22
We add three distinct datasets to the traditional analysis of the determinants of FDI.
These are the Index of Economic Freedom, the Political Risk Rating of the International
Country Risk Guide, and the Doing Business. We find that countries with better institu-
tions, in addition to better economic performances, are able to attract considerably larger
amounts of FDI. Amidst institutional factors, the most important are associated with the
legal and bureaucratic environment, the prevalence of corruption and the degree of protec-
tion of property rights, the independence of the financial system, restrictions on investment
and the transparency of the foreign investment code, and the extent to which the govern-
ment is accountable. Business friendly regulations, taken alone, do not seem to play an
important role in FDI attractiveness.
As to the analysis of reform possibilities in Portugal, our results indicate that the
country should focus on decreasing corruption and lessening restrictions on investment,
namely those related with the transparency of the foreign investment code. Other areas to
be addressed, albeit at the cost of a higher effort, are the protection of private property,
the independence of the financial system, and the strength, quality, and impartiality of the
bureaucracy.
In sum, our approach demonstrates the joint relevance of institutions as a means to
attract FDI inflows, and uses a methodology that, for a given country, discriminates among
several possible institutional reforms regarding their impact on FDI, the required reform
effort, and the efficiency of the reform effort.
References
Alesina, A., S. Ardagna, G. Nicoletti and F. Schiantarelli, “Regulation and investment,”
J Eur Econ Assoc 3 (2005), 791–825.
Altomonte, C. and C. Guagliano, “Comparative study of FDI in Central and Eastern Europe
and the Mediterranean,” Econ Systems 27 (2003), 223–246.
Bajo-Rubio, O. and S. Sosvilla-Rivero, “An econometric analysis of foreign direct investment
in Spain, 1964–89,” South Econ J 61 (1994), 104–120.
Barrell, R. and N. Pain, “An econometric analysis of U.S. foreign direct investment,” Rev Econ
Stat 78 (1996), 200–207.
———, “Foreign direct investment, technological change, and economic growth within Europe,”
Econ J 107 (1997), 1770–1786.
Barro, R. and J. Lee, “Barro–Lee Dataset,” Korea University, Seoul. Available at: www.
barrolee.com. (2010).
Benassy-Quere, A., M. Coupet and T. Mayer, “Institutional determinants of foreign direct
investment,” The World Economy 30 (2007), 764–782.
Bevan, A. and S. Estrin, “The determinants of foreign direct investment into European transition
economies,” J Comp Econ 32 (2004), 775–787.
23
Billington, N., “The location of foreign direct investment: an empirical analysis,” Appl Econ 31
(1999), 65–76.
Biswas, R., “Determinants of foreign direct investment,” Rev Dev Econ 6 (2002), 492–504.
Blonigen, B., “A review of the empirical literature on FDI determinants,” Atlantic Econ J 33
(2005), 383–403.
Borensztein, E., J. De Gregorio and J. Lee, “How does foreign direct investment affect
economic growth?,” J Int Econ 45 (1998), 115–135.
Botero, J., S. Djankov, R. La Porta, F. Lopez-de Silanes and A. Shleifer, “The regu-
lation of labor,” Q J Econ 119 (2004), 1339–1382.
Brainard, S. L., “An empirical assessment of the proximity-concentration trade-off between multi-
national sales and trade,” Am Econ Rev 87 (1997), 520–544.
Buch, C., J. Kleinert, A. Lipponer and F. Toubal, “Determinants and effects of foreign
direct investment: evidence from German firm-level data,” Econ Policy 20 (2005), 52–110.
Cassou, S., “The link between tax rates and foreign direct investment,” Appl Econ 29 (1997),
1295–1301.
Cavalcanti, T., A. Magalhaes and J. Tavares, “Institutions and economic development in
Brazil,” The Quarterly Review of Economics and Finance 48 (2008), 412–432.
Caves, R., Multinational enterprise and economic analysis (Cambridge Univ Pr, 2007).
Chakrabarti, A., “The determinants of foreign direct investment: sensitivity analysis of cross-
country regressions,” Kyklos 54 (2001), 89–114.
Culem, C., “The locational determinant of direct foreign investment among industrialized coun-
tries,” Eur Econ Rev 32 (1988), 885–904.
de Mooij, R. and S. Ederveen, “Taxation and foreign direct investment: a synthesis of empirical
research,” Int Tax Public Finan 10 (2003), 673–693.
Devereux, M. and R. Griffith, “Taxes and the location of production: evidence from a panel
of U.S. multinationals,” J Public Econ 68 (1998), 335–367.
Djankov, S., “The regulation of entry: a survey,” World Bank Res Obser 24 (2009), 183.
Djankov, S., R. La Porta, F. Lopez-de Silanes and A. Shleifer, “Courts: the lex mundi
project,” NBER Working Paper No. 8890 (2002).
Djankov, S., R. L. Porta, F. L. de Silanes and A. Shleifer, “The law and economics of
self-dealing,” J Financ Econ (2008), 430–465.
Dunning, J., Multinational enterprises and the global economy (Cheltenham: Edward Elgar, 2008).
Eaton, J. and A. Tamura, “Bilateralism and regionalism in Japanese and U.S. trade and direct
foreign investment patterns,” NBER Working Paper No. 4758 (1995).
Eichengreen, B. and D. Irwin, “Trade blocs, currency blocs and the reorientation of world
trade in the 1930s,” J Int Econ 38 (1995), 1–24.
Gao, T., “Foreign direct investment from developing Asia: some distinctive features,” Econ Lett
86 (2005), 29–35.
Grubert, H. and J. Mutti, “Taxes, tariffs and transfer pricing in multinational corporate decision
making,” Rev Econ Stat 73 (1991), 285–293.
24
Hajkova, D., G. Nicoletti, L. Vartia and K.-Y. Yoo, “Taxation, business environment and
FDI location in OECD countries,” OECD Working Paper No.502 (2006).
Hartman, D., “Tax policy and foreign direct investment in the United States,” Natl Tax J 37
(1984), 475–487.
———, “Tax policy and foreign direct investment,” J Public Econ 26 (1985), 107–121.
Hines, J., “Altered states: taxes and the location of foreign direct investment in America,” Am
Econ Rev 86 (1996), 1076–1094.
Horstmann, I. and J. Markusen, “Endogenous market structures in international trade (natura
facit saltum),” J Int Econ 32 (1992), 109–129.
Hwang, J. and D. Nettleton, “Principal components regression with data chosen components
and related methods,” Technometrics 45 (2003), 70–79.
Janicki, H. and P. Wunnava, “Determinants of foreign direct investment: empirical evidence
from E.U. accession candidates,” Appl Econ 36 (2004), 505–509.
Knack, S. and P. Keefer, “Institutions and economic performance: cross-country tests using
alternative institutional measures,” Econ Politics 7 (1995), 207–227.
Kravis, I. and R. Lipsey, “The location of overseas production and production for exports by
U.S. multinational firms,” J Int Econ 12 (1982), 201–223.
Larraın, B. and J. Tavares, “Does Foreign Direct Investment Decrease Corruption?,” Cuadernos
de economıa 41 (2004), 199–215.
Lee, J.-Y. and E. Mansfield, “Intellectual property protection and U.S. foreign direct invest-
ment,” Rev Econ Stat 78 (1996), 181–186.
Love, J. and F. Lage-Hidalgo, “Analysing the determinants of U.S. direct investment in Mex-
ico,” Appl Econ 32 (2000), 1259–1267.
Overesch, M. and J. Rincke, “The dynamics of corporate tax setting in Europe, 1984–2006,”
CESifo Working Paper No. 2535 (2009).
Scaperlanda, A. and R. Balough, “Determinants of U.S. direct investment in the E.E.C.:
revisited,” Eur Econ Rev 21 (1983), 381–390.
Schneider, F. and B. Frey, “Economic and political developments of foreign direct investment,”
World Dev 13 (1985), 161–175.
Silva, J. and S. Tenreyro, “The log of gravity,” The Review of Economics and Statistics 88
(2006), 641–658.
Stein, E. and C. Daude, “Longitude matters: time zones and the location of foreign direct
investment,” J Int Econ 71 (2007), 96–112.
Stevens, G., “Politics, economics and investment: explaining plant and equipment spending by
U.S. direct investors in Argentina, Brazil and Mexico,” J Int Momey Financ 19 (2000), 153–183.
Tavares, J., “Institutions and economic growth in Portugal: a quantitative exploration,” Port
Econ J 3 (2004), 49–79.
Tavares, J. and R. Wacziarg, “How democracy affects growth,” European Economic Review 45
(2001), 1341–1378.
Tsai, P.-L., “Determinants of foreign direct investment and its impact on economic growth,” J
25
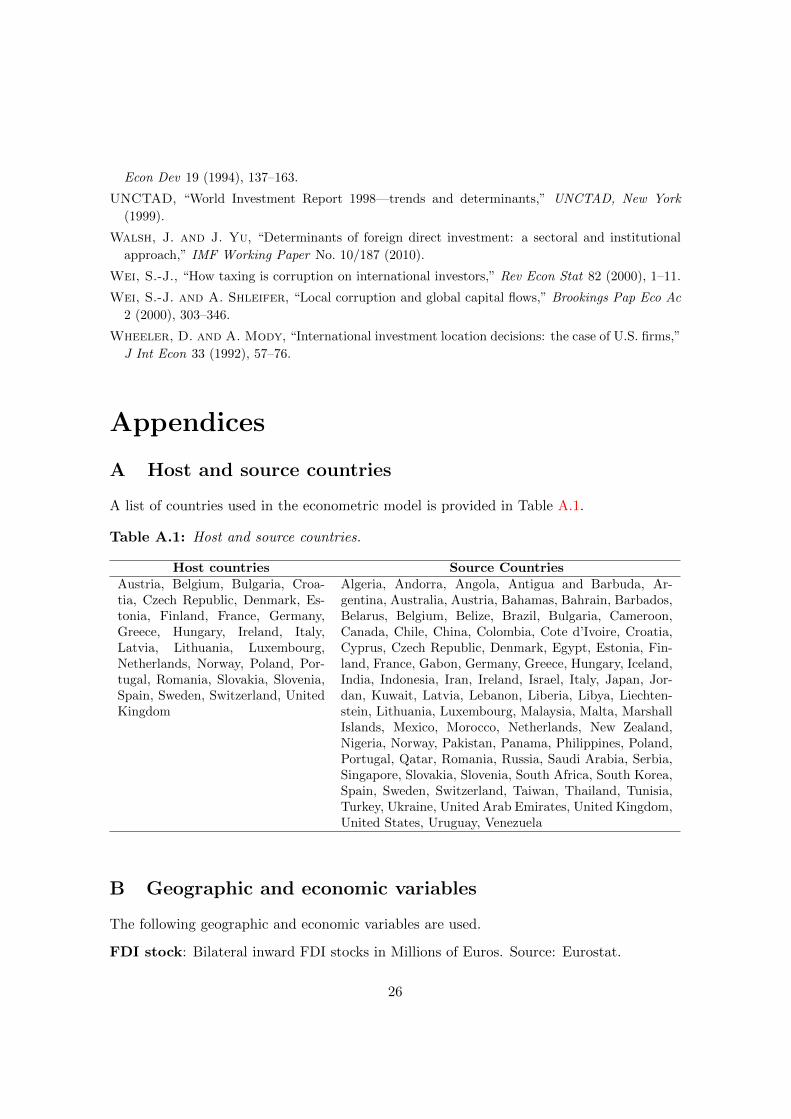
Econ Dev 19 (1994), 137–163.
UNCTAD, “World Investment Report 1998—trends and determinants,” UNCTAD, New York
(1999).
Walsh, J. and J. Yu, “Determinants of foreign direct investment: a sectoral and institutional
approach,” IMF Working Paper No. 10/187 (2010).
Wei, S.-J., “How taxing is corruption on international investors,” Rev Econ Stat 82 (2000), 1–11.
Wei, S.-J. and A. Shleifer, “Local corruption and global capital flows,” Brookings Pap Eco Ac
2 (2000), 303–346.
Wheeler, D. and A. Mody, “International investment location decisions: the case of U.S. firms,”
J Int Econ 33 (1992), 57–76.
Appendices
A Host and source countries
A list of countries used in the econometric model is provided in Table A.1.
Table A.1: Host and source countries.
Host countries Source CountriesAustria, Belgium, Bulgaria, Croa-tia, Czech Republic, Denmark, Es-tonia, Finland, France, Germany,Greece, Hungary, Ireland, Italy,Latvia, Lithuania, Luxembourg,Netherlands, Norway, Poland, Por-tugal, Romania, Slovakia, Slovenia,Spain, Sweden, Switzerland, UnitedKingdom
Algeria, Andorra, Angola, Antigua and Barbuda, Ar-gentina, Australia, Austria, Bahamas, Bahrain, Barbados,Belarus, Belgium, Belize, Brazil, Bulgaria, Cameroon,Canada, Chile, China, Colombia, Cote d’Ivoire, Croatia,Cyprus, Czech Republic, Denmark, Egypt, Estonia, Fin-land, France, Gabon, Germany, Greece, Hungary, Iceland,India, Indonesia, Iran, Ireland, Israel, Italy, Japan, Jor-dan, Kuwait, Latvia, Lebanon, Liberia, Libya, Liechten-stein, Lithuania, Luxembourg, Malaysia, Malta, MarshallIslands, Mexico, Morocco, Netherlands, New Zealand,Nigeria, Norway, Pakistan, Panama, Philippines, Poland,Portugal, Qatar, Romania, Russia, Saudi Arabia, Serbia,Singapore, Slovakia, Slovenia, South Africa, South Korea,Spain, Sweden, Switzerland, Taiwan, Thailand, Tunisia,Turkey, Ukraine, United Arab Emirates, United Kingdom,United States, Uruguay, Venezuela
B Geographic and economic variables
The following geographic and economic variables are used.
FDI stock: Bilateral inward FDI stocks in Millions of Euros. Source: Eurostat.
26
Accumulated FDI: Bilateral FDI inflows in Millions of Euros. Source: Eurostat.
Border: Dummy variable which takes the value of 1 only if the source and host countries
share a common border. Source: Authors’ calculations.
Distance: Distance, in Kilometers, between source and host countries’ capitals, calculated
using the great circle distance. Data is freely available on the Internet.
GDP: Gross Domestic Product in Millions of Euros at current market prices. Source:
Eurostat.
GDP growth: Real GDP growth rate (percentage) relative to the previous year. Source:
Eurostat.
Labor cost: Yearly nominal compensation per employee in thousands of Euros. Source:
AMECO.
Openness: Degree of openness, measured by the ratio of exports plus imports over GDP.
Source: Eurostat.
Education: Mean years of schooling. Source: Barro and Lee (2010).
EATR: Effective average tax rate in the host country (percentage). The data was kindly
provided by Michael Overesch (see Overesch and Rincke, 2009).
C Index of Economic Freedom
The Index of Economic Freedom is computed by the Heritage Foundation, and the data
can be found on their website (www.heritage.org/index). The overall index of economic
freedom is constructed by taking the simple average across 10 different indicators.
Business Freedom: Measures the ability to start, operate, and close a business for a
medium-sized company, thus representing the overall burden from regulation and govern-
ment efficiency in the regulatory process.
Trade Freedom: Composite measure of the absence of tariff and non-tariff barriers that
affect imports and exports of goods and services. It is based on the trade-weighted average
tariff rate and on non-tariff barriers.
Fiscal Freedom: Measures the tax burden—on both individual and corporate incomes,
and others—imposed by the government, as a percentage of GDP.
Government Freedom: Assesses the level of government expenditures on GDP, higher
expenditures being associated with lower scores.
Monetary Freedom: Measures price stability (the weighted average inflation rate for the
last three years) and price controls. More inflation and price controls yield lower scores.
Investment Freedom: Evaluates a variety of restrictions imposed on investment, namely
restrictions on FDI, transparency and bureaucracy in the foreign investment code, re-
27
strictions on land ownership, sectoral investment restrictions, expropriation of investments
without fair compensation, foreign exchange controls, and capital controls.
Financial Freedom: Measures bank security and the independence of the financial sys-
tem from government control. This score comprises the extent of government regulation in
the financial system, the extent of state intervention in banks, the difficulty of operating
financial services, and the government influence on the allocation of credit.
Property Freedom: Assesses the ability of individuals to accumulate private property,
secured by clear laws that are fully enforced by the state. It measures the extent to which
laws protect private property, the degree of enforcement of those laws, the likelihood of
expropriation, the independence of the judiciary system and the level of corruption within
it, and the ability of individuals and business men to enforce contracts.
Freedom from Corruption: Measures the degree of corruption within a country.
Labor Freedom: Measures several aspects of the legal and regulatory framework of a
country’s labor market, such as regulations on the minimum wage, laws inhibiting layoffs,
regulatory burdens on hiring, among others.
All indexes were rescaled to the 0–10 range to ease the exposition. A higher score always
indicates a better performance.
D Political Risk Rating
The International Country Risk Guide computes 22 variables in three categories of risk:
political, financial, and economic. The Political Risk Rating includes 12 variables, covering
political and social attributes. Although some of them are more related with inward FDI
than others, all are used in the principal components analysis, as explained in the main
text. In order to facilitate the comparison in the magnitude of the coefficients, we converted
all indexes to the 0–10 range.
Government stability: Assesses the government’s ability to carry out its declared pro-
gram and to stay in office. It is constructed from three subcomponents: government unity,
legislative strength, and popular support.
Socioeconomic conditions: Assesses the pressures that could constrain government ac-
tion or fuel social dissatisfaction. It is constructed from three subcomponents: unemploy-
ment, consumer confidence, and poverty.
Investment profile: Assesses the risks to investment that are not covered by other eco-
nomic, political, and financial risk components. It is constructed from three subcompo-
nents: contract viability/expropriation, profile repatriation, and payment delays.
28

Internal conflict: Assesses the political violence and its potential impact on governance.
It is constructed from three subcomponents: civil war/coup threat, terrorism/political vi-
olence, and civil disorder.
External conflict: Assesses the risk to the government from foreign action, originating
from both non-violent and violent pressures. It is constructed from three subcomponents:
war, cross-border conflict, and foreign pressures.
Corruption: Assesses the level of corruption in the political system, including bribes,
exchange controls, and tax assessments, among others.
Military in politics: Measures the involvement of military in politics, which distorts
government policy and diminishes democratic accountability.
Religious tensions: Measures the involvement of religious groups—which often seek to
replace civil laws with religious laws, thus distorting and constraining government action—
in politics.
Law and order: Measures the strength and impartiality of the legal system and the pop-
ular observance of the law.
Ethnic tensions: Measures racial, nationality, and language tensions, which give rise to
intolerance and unwillingness to make compromises.
Democratic accountability: Measures the responsiveness of the government to its peo-
ple. The score for this component is based on the following types of governance: alternating
democracy, dominating democracy, de facto one-party state, de jure one-party state, and
autarchy.
Bureaucracy quality: Measures the institutional strength and quality of the bureau-
cracy, and the extent to which bureaucracy is autonomous from the political pressure and
has a well-established mechanism for recruitment and training.
E Ease of Doing Business
The World Bank’s Doing Business database measures business regulations and thereby the
cost of a firm operating in a country. More specifically, it provides quantitative assessment
for starting a business, dealing with construction permits, registering property, getting
credit, protecting investors, paying taxes, trading across borders, enforcing contracts and
closing a business, in a total of 33 raw factors, described below. For the analysis, these
factors were aggregated into nine indexes ranging from 0 to 10, each summarizing a specific
topic of doing business. We proceeded as follows. First, we represented each raw factor by
an index, ranging from 0 to 10, according to the min-max standardization method,
29
Scorek = 10factork − factormin
factormax − factormin
if higher factor values imply better performances (e.g., strength of legal rights, recovery
rate when closing a business), or
Scorek = 10 − 10factork − factormin
factormax − factormin
if higher factor values imply poorer performances (e.g., procedures, time, cost).
This was done for all countries in the database. According to these formulas, all scores
are organized such that higher values always indicate better performances. The topic score
is the simple average of all factors that comprise that topic. An overall ease of doing
business index is created by taking the simple average of the nine topic scores.
E.1 Starting a business
The starting a business index measures all procedures, costs, and time that are formally
required for an entrepreneur to start up and formally operate an industrial or commercial
business. It includes the following factors.
Procedures: Number of interactions of the company founders with external parties in
order to formally start operating a business.
Time: Median duration in calendar days, indicated by lawyers, that is necessary to com-
plete a procedure with minimum follow-up with government agencies and no extra pay-
ments.
Cost: All official fees and fees for legal or professional services if such services are required
by law in order to start operating a business. It is recorded as a percentage of the economy’s
income per capita.
Minimum Capital: The amount that the entrepreneur needs to deposit in a bank or
with a notary before registration and up to three months following incorporation in order
to start operating a business. It is recorded as a percentage of the economy’s income per
capita.
E.2 Dealing with construction permits
The dealing with construction permits index measures all procedures required for a busi-
ness in the construction industry to build a standardized warehouse, as well as the costs
and time required to complete the procedures. It includes the following factors.
Procedures: Number of procedures required for a business in the construction industry
to build a standardized warehouse.
30
Time: Median duration in calendar days that is necessary to complete the required pro-
cedures, as indicated by local experts.
Cost: All fees associated with completing the procedures to legally build a warehouse. The
cost is recorded as a percentage of the economy’s income per capita.
E.3 Registering property
The registering a property index records the necessary procedures that a businessperson
must incur to purchase a property from another businessperson and to transfer the prop-
erty title to his name, as well as the associated costs and time. It includes the following
factors.
Procedures: Number of procedures that are legally or in practice required for registering
a property.
Time: Median duration indicated by property lawyers, notaries, or registry officials to
complete the procedures for registering a property.
Cost: All the necessary fees to register a property. This variable is recorded as a percentage
of the property value.
E.4 Getting credit
The getting credit index measures the legal rights of borrowers and lenders with respect to
secured transactions and the sharing of credit information. It includes the following factors.
Strength of legal rights: Index that measures the degree to which collateral and bank-
ruptcy laws protect the rights of borrowers and lenders and thus facilitate lending. It ranges
from 0 to 10.
Depth of credit information: Index that assesses the rules and practices affecting the
coverage, scope, and accessibility of credit information, regardless of whether this infor-
mation is available through a public credit registry or through a private credit bureau. It
ranges from 0 to 6.
Public registry coverage: Reports the number of individuals and firms listed in a public
credit registry with information on their borrowing history over the past five years. It is
measured as a percentage of adults aged 15 and above.
Private bureau coverage: Reports the number of individuals and firms listed by a pri-
vate credit bureau with information on their borrowing history over the past five years.
The number is expressed as a percentage of the adult population aged 15 and above.
31
E.5 Strength of investor protection
The strength of investor protection index measures the strength of minority shareholder
protection against directors’ misuse of corporate assets for personal gain. It includes the
following factors.
Extent of disclosure: Index that assesses who can approve related-party transactions and
the requirements for external and internal disclosure in case of related-party transactions.
It ranges from 0 to 10.
Extent of director liability: Index that measures the ability of shareholders to hold
the interested party and the approving body liable in case of a prejudicial related-party
transaction, the availability of legal remedies (damages, repayment of profits, fines, impris-
onment, and rescission of the transaction), and the ability of shareholders to sue. It ranges
from 0 to 10.
Ease of shareholder suits: Index that measures the documents and information available
during trial and the access to internal corporate documents. It ranges from 0 to 10.
E.6 Paying taxes
The paying taxes index measures the tax burden and mandatory contributions that a
medium-size company must pay in a given year, as well as the administrative burden of
paying taxes and contributions. It includes the following factors.
Payments: Reflects the total number of taxes and contributions paid, including consump-
tion taxes, as well as the method of payment, the frequency of payment, and the frequency
of filing, for a company during the second year of operation.
Time: Measures the hours per year a company spends to prepare, file, and pay the cor-
porate tax, the value added tax, and social contributions. It includes the time spent to
collect information and to compute the amount payable.
Total tax rate: Measures all taxes and contributions (corporate taxes, social contribu-
tions, labor taxes, property taxes, and other taxes) paid by firms as a percentage of total
profits.
E.7 Trading across borders
The trading across borders index measures procedural requirements for exporting and im-
porting a standardized cargo of goods by ocean transport. It includes the following factors.
Documents to export: Number of bank documents, customs clearance documents, port
and terminal handling documents, and transport documents required for exporting.
32
Documents to import: Number of bank documents, customs clearance documents, port
and terminal handling documents, and transport documents required for importing.
Time to export: Time (in calendar days) to obtain all documents required for inland
transport and handling, for customs clearance and inspections, and for port and terminal
handling for exporting a standardized cargo.
Time to import: Time (in calendar days) to obtain all documents required for inland
transport and handling, for customs clearance and inspections, and for port and terminal
handling for importing a standardized cargo.
Cost to export: Measures the costs (in US dollars per container) of all documentation,
inland transport and handling, customs clearance and inspections, and port and terminal
handling for exporting a standardized cargo.
Cost to import: Measures the costs (in US dollars per container) of all documentation,
inland transport and handling, customs clearance and inspections, and port and terminal
handling for importing a standardized cargo.
E.8 Enforcing contracts
The enforcing contracts index measures the efficiency of the judicial system in resolving a
commercial dispute. It includes the following factors.
Procedures: Number of procedures resulting from a commercial dispute, either between
the parties or between them and the court officer. It comprises the steps to file the case,
the steps for trial and judgment, and the steps to enforce the judgment.
Time: Number of calendar days, from the moment the lawsuit is filed in court until
settlement. It includes the necessary time to file and serve the case, the time of the trial,
and the time to enforce the judgment.
Cost: Average attorney fees, court costs (including expert fees) and enforcement costs a
firm must bear if a commercial dispute goes to trial. It is measured as a percentage of
claims.
E.9 Closing a business
The closing a business index measures the time, cost, and outcome of insolvency proceed-
ings involving domestic entities. It includes the following factors.
Time: Calendar years required for creditors to recover their credit.
Cost: Court fees, fees of insolvency administrators, lawyers’ fees, and assessors’ and auc-
tioneers’ fees required to close a business. It is measured as a percentage of the debtor’s
estate value.
33

Recovery rate: Measures the percentage recovered by creditors, i.e., the present value of
debt that can be recovered.
34

Banco de Portugal | Working Papers i
WORKING PAPERS
2010
1/10 MEASURING COMOVEMENT IN THE TIME-FREQUENCY SPACE
— António Rua
2/10 EXPORTS, IMPORTS AND WAGES: EVIDENCE FROM MATCHED FIRM-WORKER-PRODUCT PANELS
— Pedro S. Martins, Luca David Opromolla
3/10 NONSTATIONARY EXTREMES AND THE US BUSINESS CYCLE
— Miguel de Carvalho, K. Feridun Turkman, António Rua
4/10 EXPECTATIONS-DRIVEN CYCLES IN THE HOUSING MARKET
— Luisa Lambertini, Caterina Mendicino, Maria Teresa Punzi
5/10 COUNTERFACTUAL ANALYSIS OF BANK MERGERS
— Pedro P. Barros, Diana Bonfi m, Moshe Kim, Nuno C. Martins
6/10 THE EAGLE. A MODEL FOR POLICY ANALYSIS OF MACROECONOMIC INTERDEPENDENCE IN THE EURO AREA
— S. Gomes, P. Jacquinot, M. Pisani
7/10 A WAVELET APPROACH FOR FACTOR-AUGMENTED FORECASTING
— António Rua
8/10 EXTREMAL DEPENDENCE IN INTERNATIONAL OUTPUT GROWTH: TALES FROM THE TAILS
— Miguel de Carvalho, António Rua
9/10 TRACKING THE US BUSINESS CYCLE WITH A SINGULAR SPECTRUM ANALYSIS
— Miguel de Carvalho, Paulo C. Rodrigues, António Rua
10/10 A MULTIPLE CRITERIA FRAMEWORK TO EVALUATE BANK BRANCH POTENTIAL ATTRACTIVENESS
— Fernando A. F. Ferreira, Ronald W. Spahr, Sérgio P. Santos, Paulo M. M. Rodrigues
11/10 THE EFFECTS OF ADDITIVE OUTLIERS AND MEASUREMENT ERRORS WHEN TESTING FOR STRUCTURAL BREAKS
IN VARIANCE
— Paulo M. M. Rodrigues, Antonio Rubia
12/10 CALENDAR EFFECTS IN DAILY ATM WITHDRAWALS
— Paulo Soares Esteves, Paulo M. M. Rodrigues
13/10 MARGINAL DISTRIBUTIONS OF RANDOM VECTORS GENERATED BY AFFINE TRANSFORMATIONS OF
INDEPENDENT TWO-PIECE NORMAL VARIABLES
— Maximiano Pinheiro
14/10 MONETARY POLICY EFFECTS: EVIDENCE FROM THE PORTUGUESE FLOW OF FUNDS
— Isabel Marques Gameiro, João Sousa
15/10 SHORT AND LONG INTEREST RATE TARGETS
— Bernardino Adão, Isabel Correia, Pedro Teles
16/10 FISCAL STIMULUS IN A SMALL EURO AREA ECONOMY
— Vanda Almeida, Gabriela Castro, Ricardo Mourinho Félix, José Francisco Maria
17/10 FISCAL INSTITUTIONS AND PUBLIC SPENDING VOLATILITY IN EUROPE
— Bruno Albuquerque
Banco de Portugal | Working Papers ii
18/10 GLOBAL POLICY AT THE ZERO LOWER BOUND IN A LARGE-SCALE DSGE MODEL
— S. Gomes, P. Jacquinot, R. Mestre, J. Sousa
19/10 LABOR IMMOBILITY AND THE TRANSMISSION MECHANISM OF MONETARY POLICY IN A MONETARY UNION
— Bernardino Adão, Isabel Correia
20/10 TAXATION AND GLOBALIZATION
— Isabel Correia
21/10 TIME-VARYING FISCAL POLICY IN THE U.S.
— Manuel Coutinho Pereira, Artur Silva Lopes
22/10 DETERMINANTS OF SOVEREIGN BOND YIELD SPREADS IN THE EURO AREA IN THE CONTEXT OF THE ECONOMIC
AND FINANCIAL CRISIS
— Luciana Barbosa, Sónia Costa
23/10 FISCAL STIMULUS AND EXIT STRATEGIES IN A SMALL EURO AREA ECONOMY
— Vanda Almeida, Gabriela Castro, Ricardo Mourinho Félix, José Francisco Maria
24/10 FORECASTING INFLATION (AND THE BUSINESS CYCLE?) WITH MONETARY AGGREGATES
— João Valle e Azevedo, Ana Pereira
25/10 THE SOURCES OF WAGE VARIATION: AN ANALYSIS USING MATCHED EMPLOYER-EMPLOYEE DATA
— Sónia Torres,Pedro Portugal, John T.Addison, Paulo Guimarães
26/10 THE RESERVATION WAGE UNEMPLOYMENT DURATION NEXUS
— John T. Addison, José A. F. Machado, Pedro Portugal
27/10 BORROWING PATTERNS, BANKRUPTCY AND VOLUNTARY LIQUIDATION
— José Mata, António Antunes, Pedro Portugal
28/10 THE INSTABILITY OF JOINT VENTURES: LEARNING FROM OTHERS OR LEARNING TO WORK WITH OTHERS
— José Mata, Pedro Portugal
29/10 THE HIDDEN SIDE OF TEMPORARY EMPLOYMENT: FIXED-TERM CONTRACTS AS A SCREENING DEVICE
— Pedro Portugal, José Varejão
30/10 TESTING FOR PERSISTENCE CHANGE IN FRACTIONALLY INTEGRATED MODELS: AN APPLICATION TO WORLD
INFLATION RATES
— Luis F. Martins, Paulo M. M. Rodrigues
31/10 EMPLOYMENT AND WAGES OF IMMIGRANTS IN PORTUGAL
— Sónia Cabral, Cláudia Duarte
32/10 EVALUATING THE STRENGTH OF IDENTIFICATION IN DSGE MODELS. AN A PRIORI APPROACH
— Nikolay Iskrev
33/10 JOBLESSNESS
— José A. F. Machado, Pedro Portugal, Pedro S. Raposo
2011
1/11 WHAT HAPPENS AFTER DEFAULT? STYLIZED FACTS ON ACCESS TO CREDIT
— Diana Bonfi m, Daniel A. Dias, Christine Richmond
2/11 IS THE WORLD SPINNING FASTER? ASSESSING THE DYNAMICS OF EXPORT SPECIALIZATION
— João Amador
Banco de Portugal | Working Papers iii
3/11 UNCONVENTIONAL FISCAL POLICY AT THE ZERO BOUND
— Isabel Correia, Emmanuel Farhi, Juan Pablo Nicolini, Pedro Teles
4/11 MANAGERS’ MOBILITY, TRADE STATUS, AND WAGES
— Giordano Mion, Luca David Opromolla
5/11 FISCAL CONSOLIDATION IN A SMALL EURO AREA ECONOMY
— Vanda Almeida, Gabriela Castro, Ricardo Mourinho Félix, José Francisco Maria
6/11 CHOOSING BETWEEN TIME AND STATE DEPENDENCE: MICRO EVIDENCE ON FIRMS’ PRICE-REVIEWING
STRATEGIES
— Daniel A. Dias, Carlos Robalo Marques, Fernando Martins
7/11 WHY ARE SOME PRICES STICKIER THAN OTHERS? FIRM-DATA EVIDENCE ON PRICE ADJUSTMENT LAGS
— Daniel A. Dias, Carlos Robalo Marques, Fernando Martins, J. M. C. Santos Silva
8/11 LEANING AGAINST BOOM-BUST CYCLES IN CREDIT AND HOUSING PRICES
— Luisa Lambertini, Caterina Mendicino, Maria Teresa Punzi
9/11 PRICE AND WAGE SETTING IN PORTUGAL LEARNING BY ASKING
— Fernando Martins
10/11 ENERGY CONTENT IN MANUFACTURING EXPORTS: A CROSS-COUNTRY ANALYSIS
— João Amador
11/11 ASSESSING MONETARY POLICY IN THE EURO AREA: A FACTOR-AUGMENTED VAR APPROACH
— Rita Soares
12/11 DETERMINANTS OF THE EONIA SPREAD AND THE FINANCIAL CRISIS
— Carla Soares, Paulo M. M. Rodrigues
13/11 STRUCTURAL REFORMS AND MACROECONOMIC PERFORMANCE IN THE EURO AREA COUNTRIES: A MODEL-
BASED ASSESSMENT
— S. Gomes, P. Jacquinot, M. Mohr, M. Pisani
14/11 RATIONAL VS. PROFESSIONAL FORECASTS
— João Valle e Azevedo, João Tovar Jalles
15/11 ON THE AMPLIFICATION ROLE OF COLLATERAL CONSTRAINTS
— Caterina Mendicino
16/11 MOMENT CONDITIONS MODEL AVERAGING WITH AN APPLICATION TO A FORWARD-LOOKING MONETARY
POLICY REACTION FUNCTION
— Luis F. Martins
17/11 BANKS’ CORPORATE CONTROL AND RELATIONSHIP LENDING: EVIDENCE FROM RETAIL LOANS
— Paula Antão, Miguel A. Ferreira, Ana Lacerda
18/11 MONEY IS AN EXPERIENCE GOOD: COMPETITION AND TRUST IN THE PRIVATE PROVISION OF MONEY
— Ramon Marimon, Juan Pablo Nicolini, Pedro Teles
19/11 ASSET RETURNS UNDER MODEL UNCERTAINTY: EVIDENCE FROM THE EURO AREA, THE U.K. AND THE U.S.
— João Sousa, Ricardo M. Sousa
20/11 INTERNATIONAL ORGANISATIONS’ VS. PRIVATE ANALYSTS’ FORECASTS: AN EVALUATION
— Ildeberta Abreu
21/11 HOUSING MARKET DYNAMICS: ANY NEWS?
— Sandra Gomes, Caterina Mendicino

Banco de Portugal | Working Papers iv
22/11 MONEY GROWTH AND INFLATION IN THE EURO AREA: A TIME-FREQUENCY VIEW
— António Rua
23/11 WHY EX(IM)PORTERS PAY MORE: EVIDENCE FROM MATCHED FIRM-WORKER PANELS
— Pedro S. Martins, Luca David Opromolla
24/11 THE IMPACT OF PERSISTENT CYCLES ON ZERO FREQUENCY UNIT ROOT TESTS
— Tomás del Barrio Castro, Paulo M.M. Rodrigues, A.M. Robert Taylor
25/11 THE TIP OF THE ICEBERG: A QUANTITATIVE FRAMEWORK FOR ESTIMATING TRADE COSTS
— Alfonso Irarrazabal, Andreas Moxnes, Luca David Opromolla
26/11 A CLASS OF ROBUST TESTS IN AUGMENTED PREDICTIVE REGRESSIONS
— Paulo M.M. Rodrigues, Antonio Rubia
27/11 THE PRICE ELASTICITY OF EXTERNAL DEMAND: HOW DOES PORTUGAL COMPARE WITH OTHER EURO AREA
COUNTRIES?
— Sónia Cabral, Cristina Manteu
28/11 MODELING AND FORECASTING INTERVAL TIME SERIES WITH THRESHOLD MODELS: AN APPLICATION TO
S&P500 INDEX RETURNS
— Paulo M. M. Rodrigues, Nazarii Salish
29/11 DIRECT VS BOTTOM-UP APPROACH WHEN FORECASTING GDP: RECONCILING LITERATURE RESULTS WITH
INSTITUTIONAL PRACTICE
— Paulo Soares Esteves
30/11 A MARKET-BASED APPROACH TO SECTOR RISK DETERMINANTS AND TRANSMISSION IN THE EURO AREA
— Martín Saldías
31/11 EVALUATING RETAIL BANKING QUALITY SERVICE AND CONVENIENCE WITH MCDA TECHNIQUES: A CASE
STUDY AT THE BANK BRANCH LEVEL
— Fernando A. F. Ferreira, Sérgio P. Santos, Paulo M. M. Rodrigues, Ronald W. Spahr
2012
1/12 PUBLIC-PRIVATE WAGE GAPS IN THE PERIOD PRIOR TO THE ADOPTION OF THE EURO: AN APPLICATION
BASED ON LONGITUDINAL DATA
— Maria Manuel Campos, Mário Centeno
2/12 ASSET PRICING WITH A BANK RISK FACTOR
— João Pedro Pereira, António Rua
3/12 A WAVELET-BASED ASSESSMENT OF MARKET RISK: THE EMERGING MARKETS CASE
— António Rua, Luis C. Nunes
4/12 COHESION WITHIN THE EURO AREA AND THE U. S.: A WAVELET-BASED VIEW
— António Rua, Artur Silva Lopes
5/12 EXCESS WORKER TURNOVER AND FIXED-TERM CONTRACTS: CAUSAL EVIDENCE IN A TWO-TIER SYSTEM
— Mário Centeno, Álvaro A. Novo
6/12 THE DYNAMICS OF CAPITAL STRUCTURE DECISIONS
— Paula Antão, Diana Bonfi m
7/12 QUANTILE REGRESSION FOR LONG MEMORY TESTING: A CASE OF REALIZED VOLATILITY
— Uwe Hassler, Paulo M. M. Rodrigues, Antonio Rubia
Banco de Portugal | Working Papers v
8/12 COMPETITION IN THE PORTUGUESE ECONOMY: AN OVERVIEW OF CLASSICAL INDICATORS
— João Amador, Ana Cristina Soares
9/12 MARKET PERCEPTION OF FISCAL SUSTAINABILITY: AN APPLICATION TO THE LARGEST EURO AREA ECONOMIES
— Maximiano Pinheiro
10/12 THE EFFECTS OF PUBLIC SPENDING EXTERNALITIES
— Valerio Ercolani, João Valle e Azevedo
11/12 COLLATERAL REQUIREMENTS: MACROECONOMIC FLUCTUATIONS AND MACRO-PRUDENTIAL POLICY
— Caterina Mendicino
12/12 WAGE RIGIDITY AND EMPLOYMENT ADJUSTMENT AT THE FIRM LEVEL: EVIDENCE FROM SURVEY DATA
— Daniel A. Dias, Carlos Robalo Marques, Fernando Martins
13/12 HOW TO CREATE INDICES FOR BANK BRANCH FINANCIAL PERFORMANCE MEASUREMENT USING MCDA
TECHNIQUES: AN ILLUSTRATIVE EXAMPLE
— Fernando A. F. Ferreira, Paulo M. M. Rodrigues, Sérgio P. Santos, Ronald W. Spahr
14/12 ON INTERNATIONAL POLICY COORDINATION AND THE CORRECTION OF GLOBAL IMBALANCES
— Bruno Albuquerque, Cristina Manteu
15/12 IDENTIFYING THE DETERMINANTS OF DOWNWARD WAGE RIGIDITY: SOME METHODOLOGICAL
CONSIDERATIONS AND NEW EMPIRICAL EVIDENCE
— Daniel A. Dias, Carlos Robalo Marques, Fernando Martins
16/12 SYSTEMIC RISK ANALYSIS USING FORWARD-LOOKING DISTANCE-TO-DEFAULT SERIES
— Martín Saldías
17/12 COMPETITION IN THE PORTUGUESE ECONOMY: INSIGHTS FROM A PROFIT ELASTICITY APPROACH
— João Amador, Ana Cristina Soares
18/12 LIQUIDITY RISK IN BANKING: IS THERE HERDING?
— Diana Bonfi m, Moshe Kim
19/12 BANK SIZE AND LENDING SPECIALIZATION
— Diana Bonfi m, Qinglei Dai
2013
01/13 MACROECONOMIC FORECASTING USING LOW-FREQUENCY FILTERS
— João Valle e Azevedo, Ana Pereira
02/13 EVERYTHING YOU ALWAYS WANTED TO KNOW ABOUT SEX DISCRIMINATION
— Ana Rute Cardoso, Paulo Guimarães, Pedro Portugal
03/13 IS THERE A ROLE FOR DOMESTIC DEMAND PRESSURE ON EXPORT PERFORMANCE?
— Paulo Soares Esteves, António Rua
04/13 AGEING AND FISCAL SUSTAINABILITY IN A SMALL EURO AREA ECONOMY
— Gabriela Castro, José R. Maria, Ricardo Mourinho Félix, Cláudia Rodrigues Braz
05/13 MIND THE GAP! THE RELATIVE WAGES OF IMMIGRANTS IN THE PORTUGUESE LABOUR MARKET
— Sónia Cabral, Cláudia Duarte
06/13 FOREIGN DIRECT INVESTMENT AND INSTITUTIONAL REFORM: EVIDENCE AND AN APPLICATION TO PORTUGAL
— Paulo Júlio, Ricardo Pinheiro-Alves, José Tavares