Embed Size (px)
Citation preview

ADAPT IT INTERIM RESULTS PRESENTATION 2017
INTERIM RESULTS PRESENTATIONfor the six months ended 31 December
2017

ADAPT IT INTERIM RESULTS PRESENTATION 2017
BUSINESS OVERVIEW
1

ADAPT IT INTERIM RESULTS PRESENTATION 2017
ABOUT ADAPT IT
Education | Manufacturing | Financial Services | Energy | Hospitality
1 000 employees10 000 customers40 countries in Africa and the rest of the worldLevel 3 B-BBEE contributorJSE listed ADI Software and Services Provider
VISIONTo be the leading provider of specialised software
PURPOSEGrowing our people and solutions - enabling our clients
to achieve more
2

ADAPT IT INTERIM RESULTS PRESENTATION 2017
10 YEARS OF GROWTH
3
OCT 2007 OCT 2008 AUG 2009 OCT 2012 NOV 2013 SEPT 2014 OCT 2015 JUL 2017 NOV 2017
InfoWave mergeswith Adapt IT
creating a software business
Adapt IT, specialising in
manufacturingsoftware, moves
to the main board of the JSE
Education specialisation
through the acquisition of Integrated Tertiary
Software (ITS)—a leader in tertiary
education ERP systems expanding the
company into Europe and Australasia
The Swicon360acquisition extends the manufacturing offering with SAP
Human CapitalManagement
Business ProcessOutsourcing
Energy sectorentry through the
Aquilonacquisition
expands Adapt IT into Africa’s
growing energy sector, serving
major oilcompanies
AddedTelecommunications
intelligencemanagement software
through theAspiviaUnison
acquisition
Financial ServicesSector is entered
through the acquisition of CQS
Micros South Africa, a leader in
Hospitality Software, is acquired by
Adapt IT
The Telecommunications
division expands footprint in Australia, Mauritius and the restof Africa through the acquisition of LGR -CP’s to be fulfilled
MILESTONES
20145th fastest growing African
Tech Company
2017R1 billion annualised
turnover
20172nd in the Sunday Times Top
100 companies
2020R3 billion annualised
turnover target

ADAPT IT INTERIM RESULTS PRESENTATION 2017
DIRECTORATE
4
CRAIG CHAMBERS
CFA, PDM, BComIndependent
Non-Executive Chairman
Appointed 3 May 2011
BONGIWE NTULI
CA (SA)Independent
Non-Executive Director
Appointed 27 May 2008
CATHERINE KOFFMAN
BA, LLB, LLMIndependent
Non-Executive Director
Appointed 9 February 2015
OLIVER FORTUIN
MBAIndependent
Non-Executive Director
Appointed 8 February 2013
SIBUSISO SHABALALA
BComChief
Executive Officer
Appointed 5 December 2007
TIFFANY DUNSDON
CA (SA)Commercial
Director
Appointed 18 April 2002
NOMBALIMBAMBO
CA (SA)Chief
Financial Officer
Appointed 18 August 2016

ADAPT IT INTERIM RESULTS PRESENTATION 2017
SECTOR FOCUS
5
EDUCATIONMANUFACTURING FINANCIAL SERVICES
ENERGY HOSPITALITY
ADAPT IT INTERIM RESULTS PRESENTATION 2017
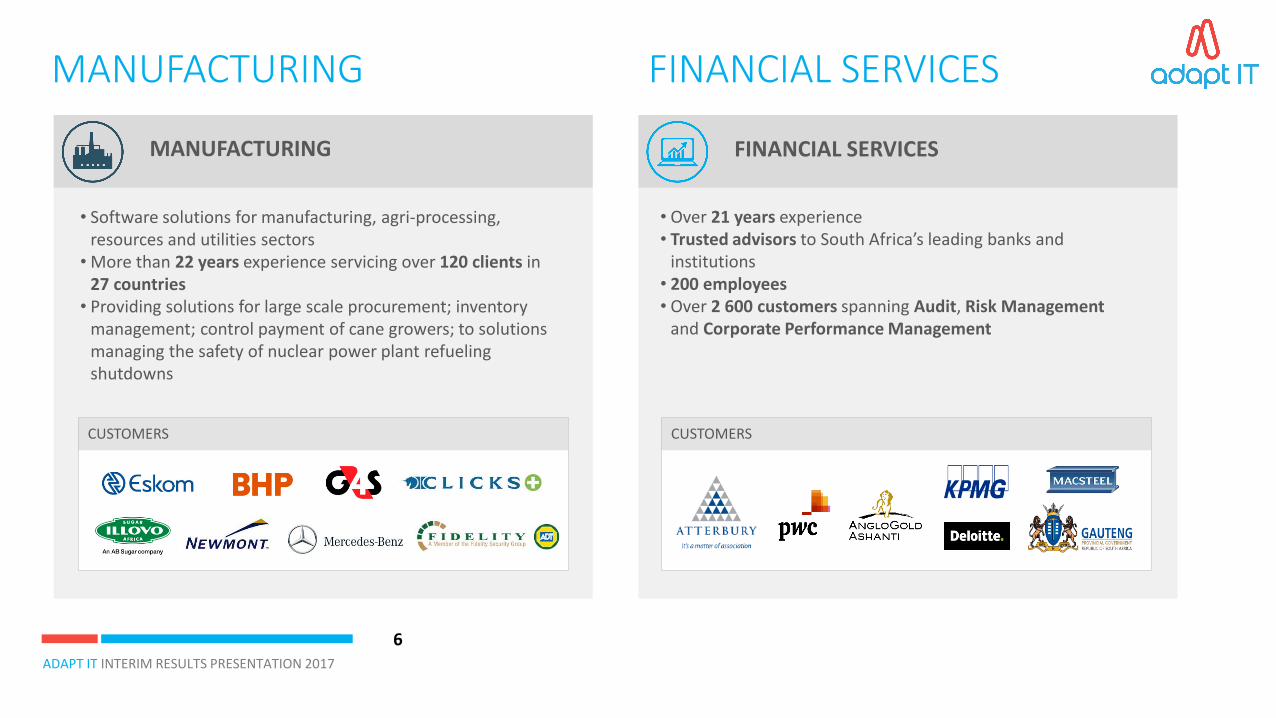
MANUFACTURING
• Software solutions for manufacturing, agri-processing, resources and utilities sectors
• More than 22 years experience servicing over 120 clients in 27 countries
• Providing solutions for large scale procurement; inventory management; control payment of cane growers; to solutions managing the safety of nuclear power plant refueling shutdowns
MANUFACTURING
CUSTOMERS
6
FINANCIAL SERVICES
CUSTOMERS
• Over 21 years experience• Trusted advisors to South Africa’s leading banks and
institutions• 200 employees• Over 2 600 customers spanning Audit, Risk Management
and Corporate Performance Management
FINANCIAL SERVICES
ADAPT IT INTERIM RESULTS PRESENTATION 2017
ENERGY
CUSTOMERS
7
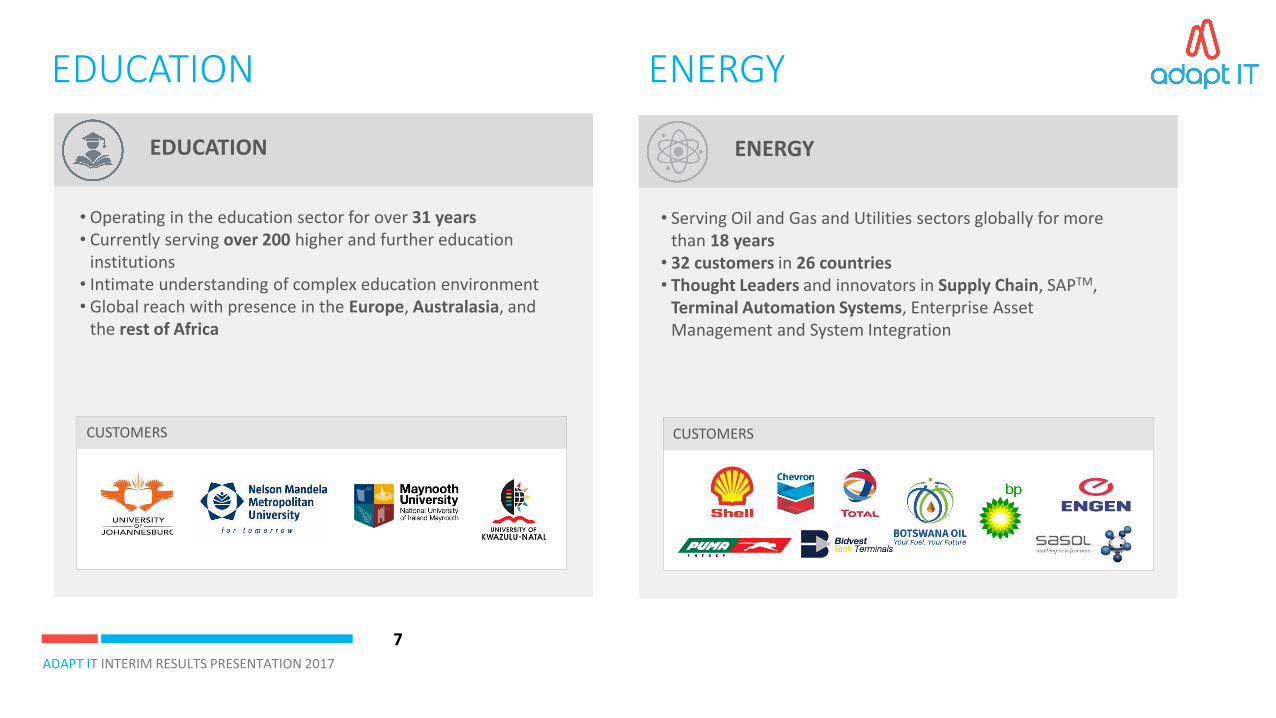
• Serving Oil and Gas and Utilities sectors globally for more than 18 years
• 32 customers in 26 countries• Thought Leaders and innovators in Supply Chain, SAPTM,
Terminal Automation Systems, Enterprise Asset Management and System Integration
EDUCATION
• Operating in the education sector for over 31 years• Currently serving over 200 higher and further education
institutions• Intimate understanding of complex education environment• Global reach with presence in the Europe, Australasia, and
the rest of Africa
CUSTOMERS
EDUCATION ENERGY
ADAPT IT INTERIM RESULTS PRESENTATION 2017
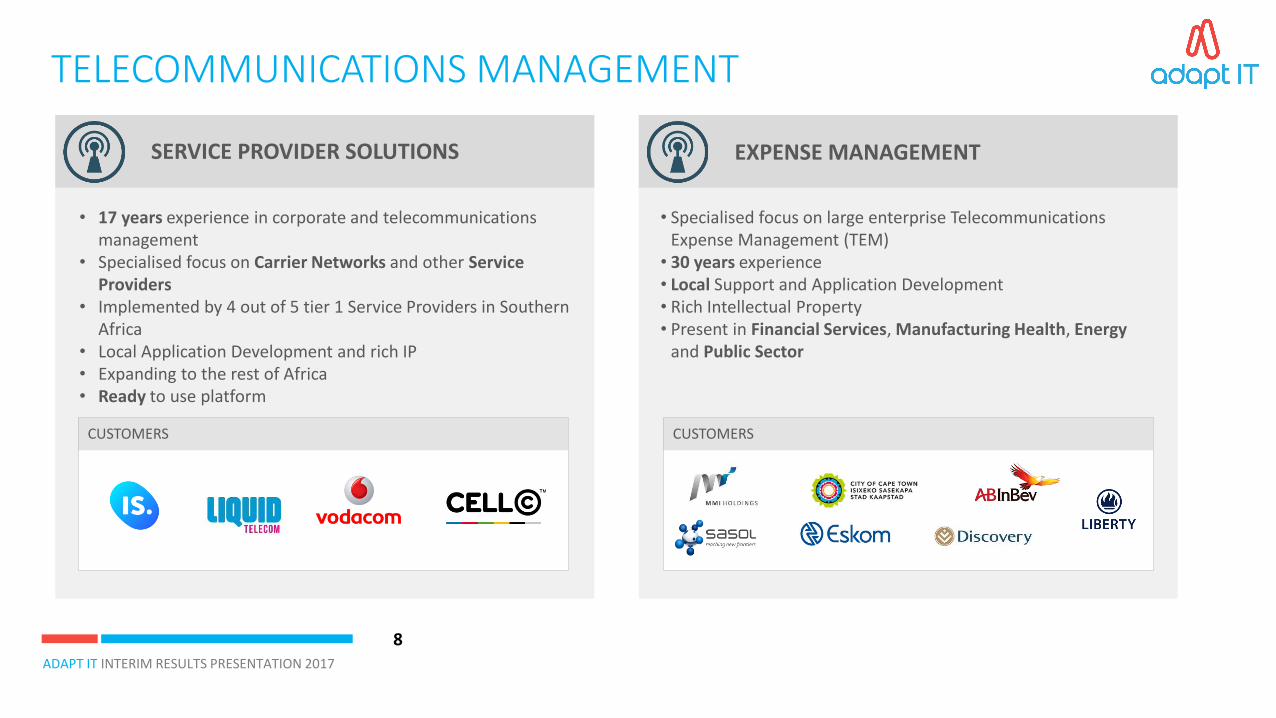
EXPENSE MANAGEMENTSERVICE PROVIDER SOLUTIONS
CUSTOMERSCUSTOMERS
8
• 17 years experience in corporate and telecommunications management
• Specialised focus on Carrier Networks and other Service Providers
• Implemented by 4 out of 5 tier 1 Service Providers in Southern Africa
• Local Application Development and rich IP• Expanding to the rest of Africa• Ready to use platform
• Specialised focus on large enterprise Telecommunications Expense Management (TEM)
• 30 years experience • Local Support and Application Development• Rich Intellectual Property• Present in Financial Services, Manufacturing Health, Energy
and Public Sector
TELECOMMUNICATIONS MANAGEMENT

ADAPT IT INTERIM RESULTS PRESENTATION 2017
HOSPITALITY
CUSTOMERS
HOSPITALITY
• Positions Adapt IT as a leader in the hospitality, retail, and food and beverage industries
• Over 20 years experience, 360 employees• Specialising in the resale, support, and deployment of
Oracle Hospitality software and hardware products• Hospitality management software market expected to grow
at a compound annual growth rate of 6.14% until 2020
9
ADAPT IT INTERIM RESULTS PRESENTATION 2017
CUSTOMERSSOLUTIONS
KEY ATTRIBUTESBACKGROUND
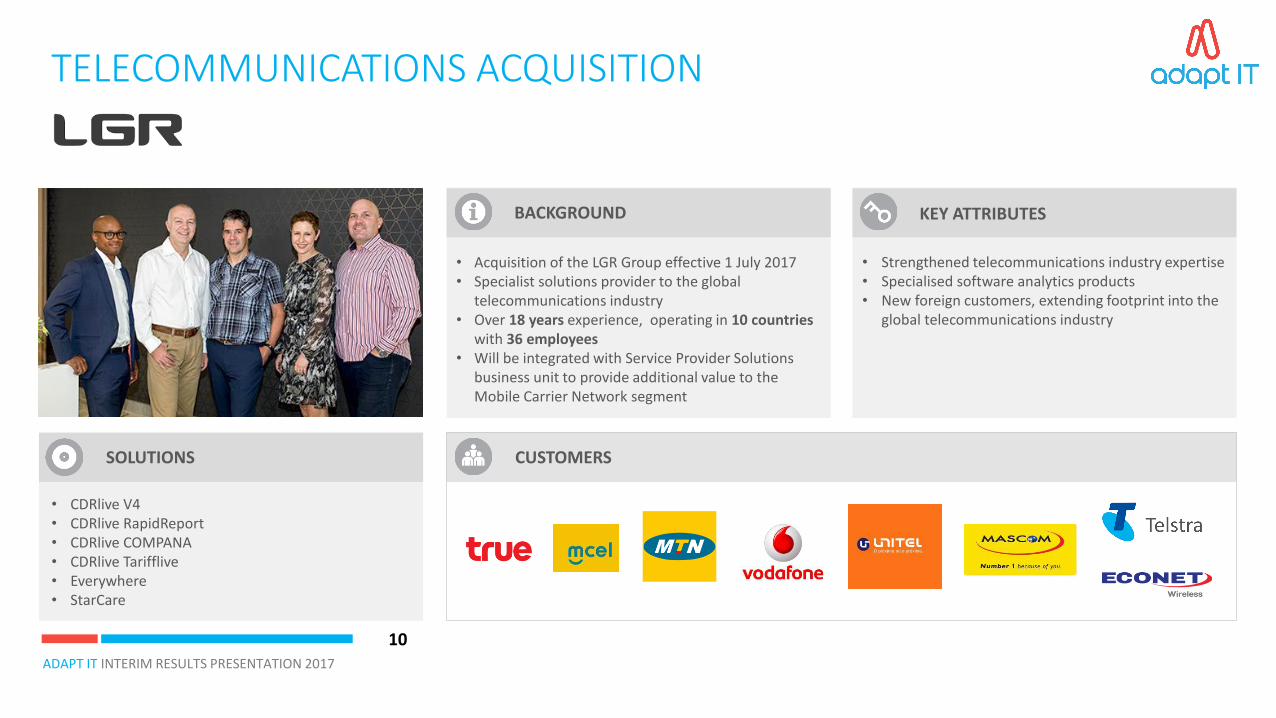
TELECOMMUNICATIONS ACQUISITION
10
• Acquisition of the LGR Group effective 1 July 2017• Specialist solutions provider to the global
telecommunications industry• Over 18 years experience, operating in 10 countries
with 36 employees• Will be integrated with Service Provider Solutions
business unit to provide additional value to the Mobile Carrier Network segment
• Strengthened telecommunications industry expertise• Specialised software analytics products• New foreign customers, extending footprint into the
global telecommunications industry
• CDRlive V4• CDRlive RapidReport• CDRlive COMPANA• CDRlive Tarifflive• Everywhere• StarCare

ADAPT IT INTERIM RESULTS PRESENTATION 2017
LEVEL 3 B-BBEE CONTRIBUTOR
SCORECARD 2017TARGET SCORE
Ownership 21.07 25
Management and Control 14.66 23
Skills Development 17.20 20
Enterprise and Supplier Development 48.28 50
Socio-Economic Development 12.00 12
OVERALL SCORE 113.21 130
TRANSFORMATION
11

ADAPT IT INTERIM RESULTS PRESENTATION 2017
12
FINANCIAL HIGHLIGHTS

ADAPT IT INTERIM RESULTS PRESENTATION 2017
INTERIM RESULTS | 31 DECEMBER 2017
13
FINANCIAL HIGHLIGHTS
TURNOVER
46% 29%EBITDA
11% NORMALISED HEPS
22%HEPS
ADAPT IT INTERIM RESULTS PRESENTATION 2017
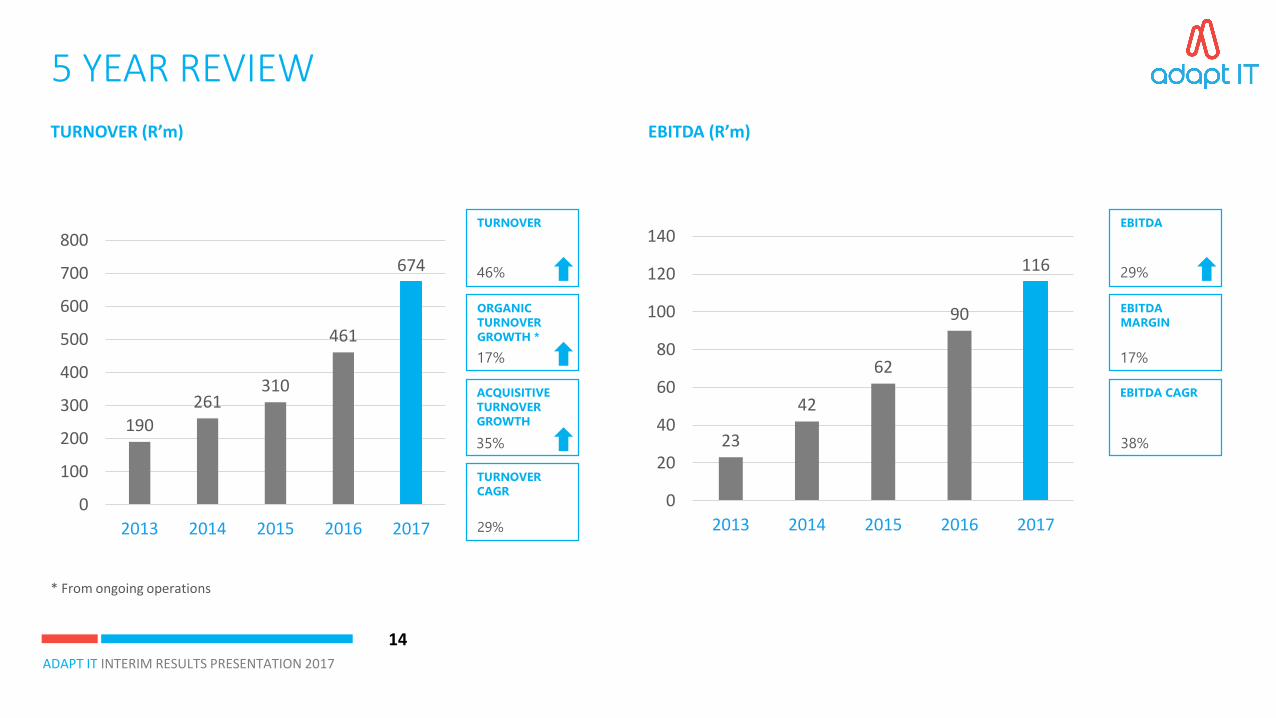
TURNOVER
CAGR
29%
190
261310
461
674
0
100
200
300
400
500
600
700
800
2013 2014 2015 2016 2017
23
42
62
90
116
0
20
40
60
80
100
120
140
2013 2014 2015 2016 2017
17%
ORGANIC
TURNOVER
GROWTH *
35%
ACQUISITIVE
TURNOVER
GROWTH
46%
TURNOVER
5 YEAR REVIEW
TURNOVER (R’m) EBITDA (R’m)
14
17%
EBITDA
MARGIN
38%
EBITDA CAGR
29%
EBITDA
* From ongoing operations
ADAPT IT INTERIM RESULTS PRESENTATION 2017
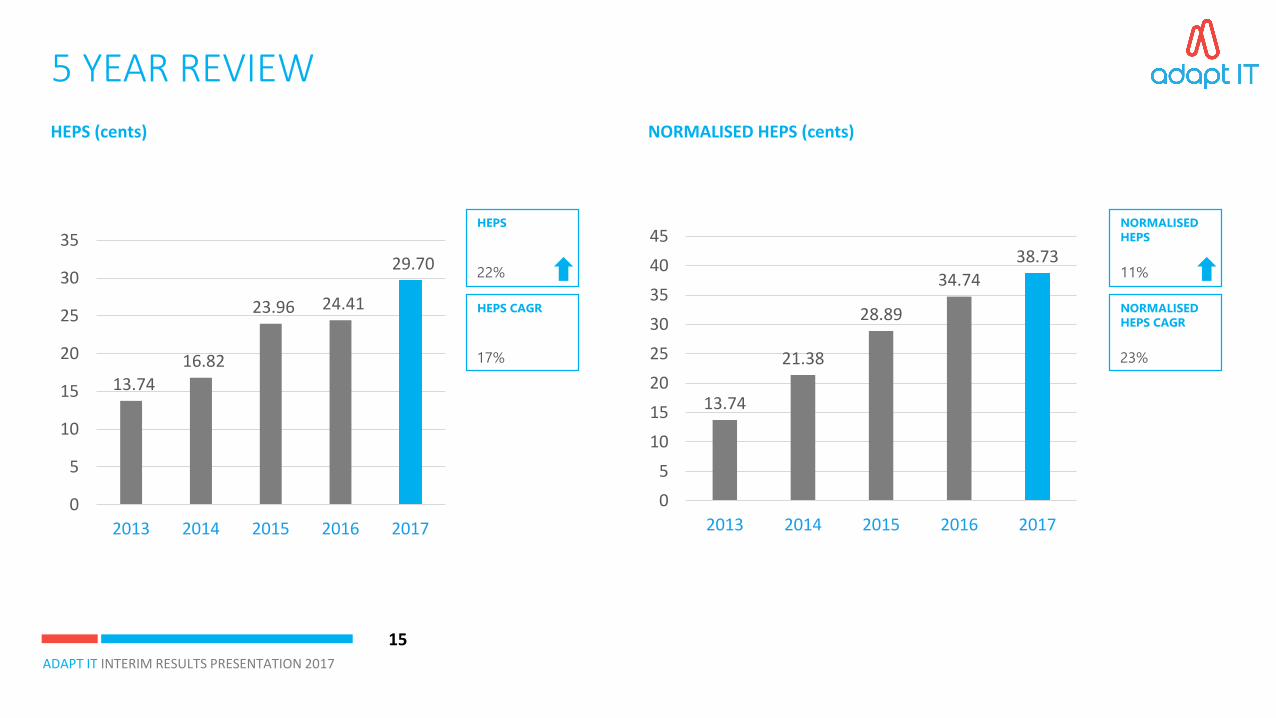
13.7416.82
23.96 24.41
29.70
0
5
10
15
20
25
30
35
2013 2014 2015 2016 2017
13.74
21.38
28.89
34.74
38.73
0
5
10
15
20
25
30
35
40
45
2013 2014 2015 2016 2017
5 YEAR REVIEW
HEPS (cents) NORMALISED HEPS (cents)
15
17%
HEPS CAGR
22%
HEPS
23%
NORMALISED
HEPS CAGR
11%
NORMALISED
HEPS
ADAPT IT INTERIM RESULTS PRESENTATION 2017
ABRIDGED CONSOLIDATED STATEMENTS
16
Unaudited 6 months ended
31 Dec 2017
R’000
Unaudited 6 months ended
31 Dec 2016
R’000
Audited year ended 30 June
2017
R’000
Period-on-period change
%
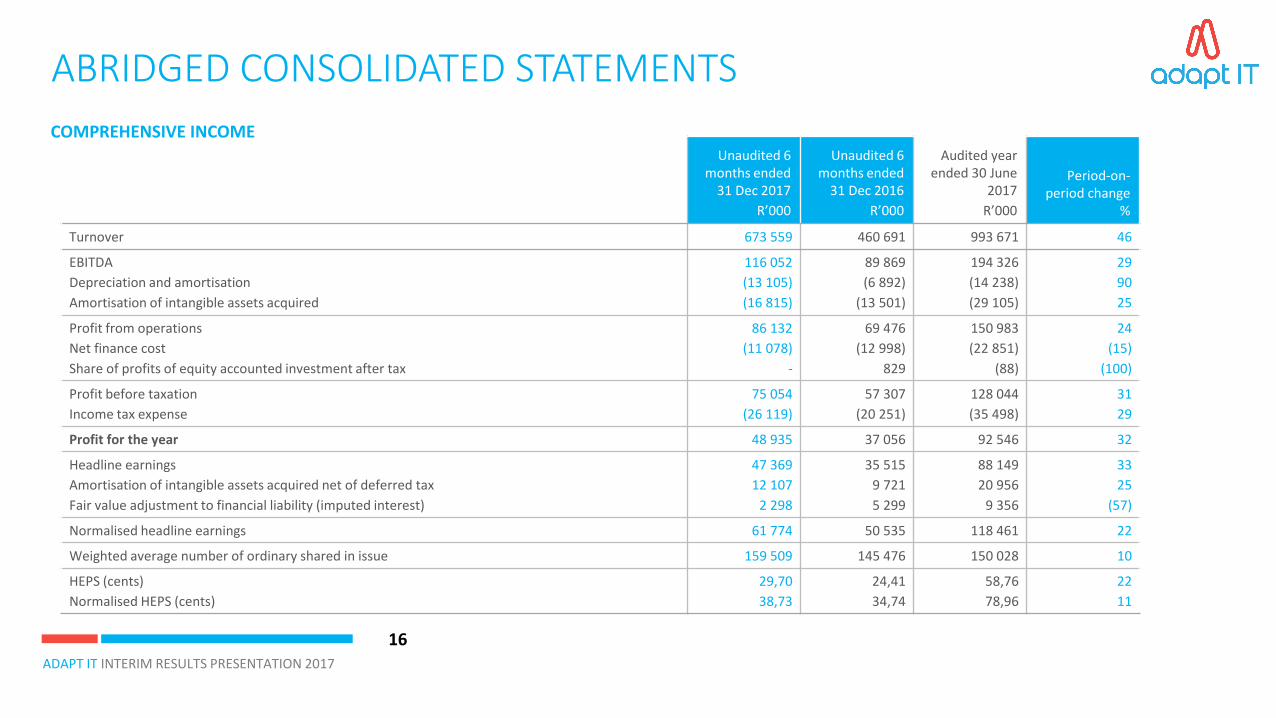
Turnover 673 559 460 691 993 671 46
EBITDA
Depreciation and amortisation
Amortisation of intangible assets acquired
116 052
(13 105)
(16 815)
89 869
(6 892)
(13 501)
194 326
(14 238)
(29 105)
29
90
25
Profit from operations
Net finance cost
Share of profits of equity accounted investment after tax
86 132
(11 078)
-
69 476
(12 998)
829
150 983
(22 851)
(88)
24
(15)
(100)
Profit before taxation
Income tax expense
75 054
(26 119)
57 307
(20 251)
128 044
(35 498)
31
29
Profit for the year 48 935 37 056 92 546 32
Headline earnings
Amortisation of intangible assets acquired net of deferred tax
Fair value adjustment to financial liability (imputed interest)
47 369
12 107
2 298
35 515
9 721
5 299
88 149
20 956
9 356
33
25
(57)
Normalised headline earnings 61 774 50 535 118 461 22
Weighted average number of ordinary shared in issue 159 509 145 476 150 028 10
HEPS (cents)
Normalised HEPS (cents)
29,70
38,73
24,41
34,74
58,76
78,96
22
11
COMPREHENSIVE INCOME

ADAPT IT INTERIM RESULTS PRESENTATION 2017
ABRIDGED CONSOLIDATED STATEMENTS
17
Unaudited 6 months
ended 31 Dec 2017
R’000
Unaudited 6 months
ended 31 Dec 2016
R’000
Audited year ended 30
June 2017
R’000
Non-current assets
Current assets
926 724
508 144
773 367
377 959
730 781
355 666
Total assets 1 434 868 1 151 326 1 086 447
Total equity
Non-current liabilities
Current liabilities
708 053
305 289
421 526
608 289
253 145
289 892
668 537
193 178
224 732
Total equity and liabilities 1 434 868 1 151 326 1 086 447
Gearing ratio 40% 26% 15%
FINANCIAL POSITION

ADAPT IT INTERIM RESULTS PRESENTATION 2017
ABRIDGED CONSOLIDATED STATEMENTS
18
CASH FLOWS
Unaudited 6 months
ended 31 Dec 2017
R’000
Unaudited 6 months
ended 31 Dec 2016
R’000
Audited year ended 30
June 2017
R’000
OPERATING ACTIVITIES
Cash generated from / (utilised in ) operations
Finance income
Finance costs
Dividends paid
Taxation paid
33 2731 754
(10 671)(24 492)(32 333)
(8 056)968
(9 993)(19 634)(25 816)
139 3251 601
(16 249)(23 359)(42 102)
Net cash flow (utilised in) / generated from operating activities
Net cash flows utilised in investment activities
Net cash inflow from financing activities
(32 469)(115 526)
133 154
(62 531)(25 722)
96 108
59 216(59 487)
20 903
Net (decrease) / increase in cash resources
Exchange differences on translation
Cash and cash equivalents at beginning of period
(14 841)951
98 049
7 855845
77 724
20 632(307)
77 724
Cash and cash equivalents at end of period 84 159 86 424 98 049

ADAPT IT INTERIM RESULTS PRESENTATION 2017
19
SECTOR RESULTS

ADAPT IT INTERIM RESULTS PRESENTATION 2017
SECTOR CONTRIBUTION - TURNOVER
20
12%24% 14% 24%26%
EDUCATIONMANUFACTURING FINANCIAL SERVICES
ENERGY HOSPITALITY
ADAPT IT INTERIM RESULTS PRESENTATION 2017
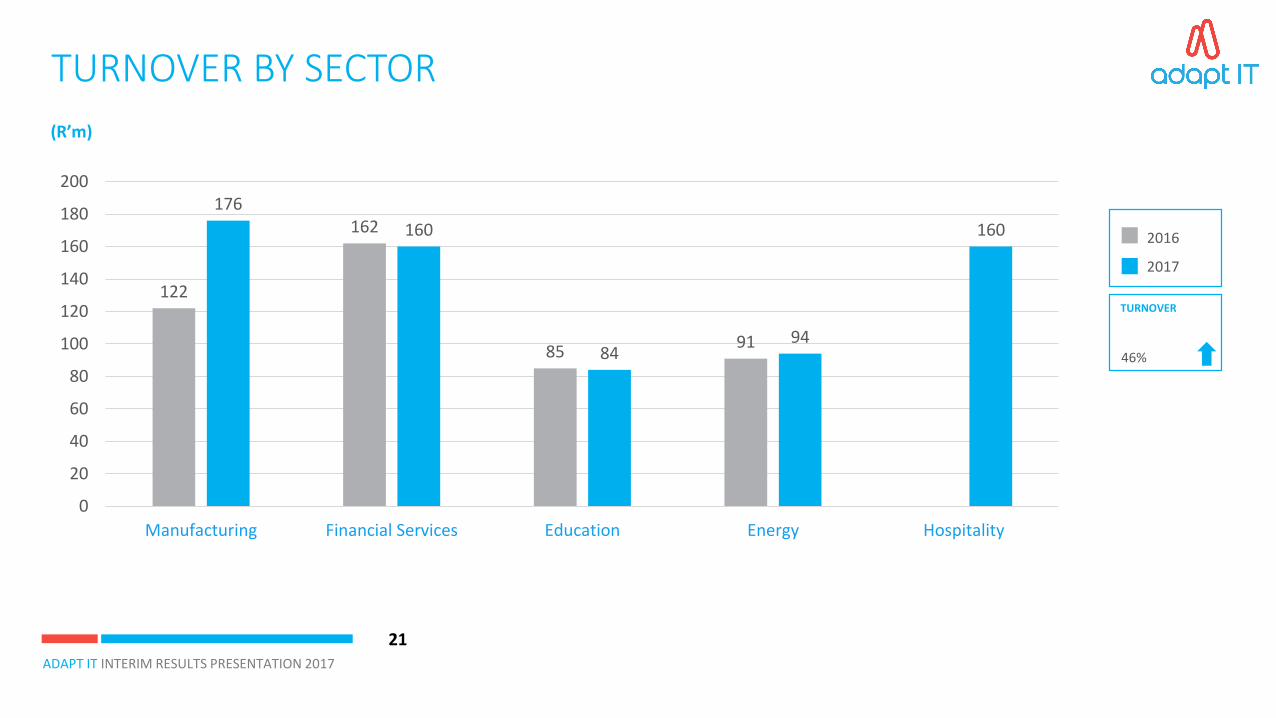
122
162
8591
176
160
8494
160
0
20
40
60
80
100
120
140
160
180
200
Manufacturing Financial Services Education Energy Hospitality
TURNOVER BY SECTOR
(R’m)
21
2016
2017
46%
TURNOVER

ADAPT IT INTERIM RESULTS PRESENTATION 2017
EBITDA BY SECTOR
22
(R’m)
2016
2017
29%
EBITDA
30
24
15
22
38
22
14
20
25
0
5
10
15
20
25
30
35
40
Manufacturing Financial Services Education Energy Hospitality

ADAPT IT INTERIM RESULTS PRESENTATION 2017
TURNOVER MIX
23
90% Rands
5%US $
2%Australian $
2%Euro
1%Other
CURRENCY
83% South Africa
12%Other African countries
2%The Americas
2%Australasia
1%Europe
GEOGRAPHY

ADAPT IT INTERIM RESULTS PRESENTATION 2017
24
LOOKING AHEAD

ADAPT IT INTERIM RESULTS PRESENTATION 2017
STRATEGY FOR INTERNATIONAL EXPANSIONG
RO
WTH
COMPLEXITY
PHASE 1: SINGLE MARKETEstablish competitive position;Grow, defend and unlock potential;Optimise performance
South Africa- Cape Town- Durban- Johannesburg- Pretoria
PHASE 2: PROXIMATE REGIONAL EXPANSIONGeographical expansion form core market;Leverage core capabilities;Building growth capabilities
SADC- Namibia- Botswana- Mozambique- Zambia- Zimbabwe- Malawi
PHASE 3: MULTI-REGIONAL HUBMultiple hubs;Leverage growth capabilities;Develop scalable infrastructureAdapt to changing risk and compliance profile
East Africa- Kenya- Tanzania- Uganda- Rwanda- Ethiopia
Indian Ocean- Mauritius
West Africa- Nigeria- Ghana- Sierra Leone- Cameroon- Benin- Gambia
Central Africa- DRC- Congo
PHASE 4: INTERNATIONAL EXPANSIONIntegrated rest of Africa and Global expansion
P1
P2
P3
P4
Australasia- Australia- New Zealand

ADAPT IT INTERIM RESULTS PRESENTATION 2017
CAPITAL RAISING NEW B-BBEE CODESGEARING
PROFITABLE WITH GOOD TRACK RECORD NEW GEOGRAPHIESSIZEABLE ACQUISITIONS
ACQUISITION CRITERIA AND FUNDING
26
• > 25% up to 100% of turnover
• High annuity income ratio
• Sector specialisation
• Niche IP
• Strong management
• Good cultural fit
• Africa
• Rest of world
• Up to 50% of balance sheet • Private placement • Improve equity ownership

ADAPT IT INTERIM RESULTS PRESENTATION 2017
INVESTMENT CASE
27
SHARE MOVEMENT
• Sector diversified
• Solid growth record
• Successful acquisitions
TRACK RECORD
• Annuity income
• Organic growth across sectors
• Software and services
GROWTH STRATEGY
• Strong turnover growth
• Improved annuity turnover
PERFORMANCE
31 Dec 2017
SHAREHOLDER DISTRIBUTION
Free float 76%
Held by Directors, Management and Staff 24%
Share liquidity 16%
Estimated future dilution (from transactions already executed)
1%0
20
40
60
80
100
120
140
January 2017 March 2017 May 2017 July 2017 September 2017 November 2017
Adapt IT
Software &Computer (J953)
EOH
J203 - FTSE/JSE AllShare