Embed Size (px)
Citation preview
DIVISION OF MONETARY AFFAIRS For release at 2:00 p.m. ET May 2, 2016
TO: HEADS OF RESEARCH AT ALL FEDERAL RESERVE BANKS
Enclosed for distribution to respondents is a national summary of the April 2016
Senior Loan Officer Opinion Survey on Bank Lending Practices.
Enclosures:
April 2016 Senior Loan Officer Opinion Survey on Bank Lending Practices This document is available on the Federal Reserve Board’s web site (http://www.federalreserve.gov/econresdata/statisticsdata.htm)
1
The April 2016 Senior Loan Officer Opinion Survey on Bank Lending Practices The April 2016 Senior Loan Officer Opinion Survey on Bank Lending Practices addressed changes in the standards and terms on, and demand for, bank loans to businesses and households over the past three months.1 This summary discusses the responses from 70 domestic banks and 22 U.S. branches and agencies of foreign banks.2 Regarding loans to businesses, the April survey results indicated that, on balance, banks tightened their standards on commercial and industrial (C&I) and commercial real estate (CRE) loans over the first quarter of 2016.3 The survey results indicated that demand for C&I loans had weakened and that demand for CRE loans had strengthened during the first quarter on net.
The first of two sets of special questions asked banks about lending to firms in the oil and natural gas drilling or extraction sector. The majority of domestic banks reported that loans to firms in this sector account for less than 5 percent of their outstanding C&I loans. In contrast, the majority of foreign banks reported that loans to firms in this sector account for more than 5 percent of their outstanding C&I loans. On balance, both domestic and foreign banks expect delinquency and charge-off rates on such loans to deteriorate over 2016 and noted that they were undertaking several actions to mitigate the risk of loan losses. In addition, on balance, banks indicated that the credit quality of loans made to businesses and households located in regions of the United States that are dependent on the energy sector had deteriorated somewhat.
The second set of special questions asked banks about their CRE lending policies and securitization activity. On balance, banks reported leaving most CRE loan terms unchanged over the past year. In response to conditions in the commercial mortgage-backed securities (CMBS) market over the past six months, on balance, banks reported increasing the volume of origination of CRE loans while decreasing the volume of CRE loan securitization. When asked about the
1 Respondent banks received the survey on or after March 29, 2016, and responses were due by
April 12, 2016. 2 Unless otherwise indicated, this document refers to reports from domestic respondents. 3 For questions that ask about lending standards or terms, reported net fractions equal the fraction of banks
that reported having tightened (“tightened considerably” or “tightened somewhat”) minus the fraction of banks that reported having eased (“eased considerably” or “eased somewhat”). For questions that ask about loan demand, reported net fractions equal the fraction of banks that reported stronger demand (“substantially stronger” or “moderately stronger”) minus the fraction of banks that reported weaker demand (“substantially weaker” or “moderately weaker”). For this summary, when standards, terms, or demand are said to have “remained basically unchanged,” the net percentage of respondent banks that reported either tightening or easing of standards or terms, or stronger or weaker demand, is between 0 and 5 percent; the modifier “modest” refers to net percentages between 5 and 10 percent; the modifier “moderate” refers to net percentages between 10 and 20 percent; the modifier “significant” refers to net percentages between 20 and 50 percent; and the modifier “majority” refers to net percentages over 50 percent.
2
anticipated large amount of CRE loans originated in 2006 and currently held in CMBS that will need to be refinanced over the next six months, some banks noted they expect standards for these refinancings to be somewhat tighter than the standards they expect to apply to other CRE loans.
Regarding loans to households, banks reported having eased lending standards on most types of residential real estate (RRE) mortgage loans, while demand for these loans strengthened over the first quarter. Modest net fractions of banks reported easing lending standards on credit cards and other consumer loans, whereas lending standards for auto loans remained basically unchanged. Over the first quarter, banks reported stronger demand across all consumer loan categories.
Lending to Businesses
(Table 1, questions 1–23; Table 2, questions 1–18) Questions on commercial and industrial lending. On balance, a moderate net fraction of banks reported a tightening of lending standards for C&I loans to large and middle-market firms over the past three months.4 Meanwhile, only a modest net fraction of banks reported tightening lending standards for C&I loans to small firms. Banks reported that they tightened some C&I loan terms for large and middle-market firms: A moderate net fraction of banks reported that they had increased premiums charged on riskier loans, a modest net fraction of banks reported that loan covenants had tightened, and most other terms to such firms remained basically unchanged on net. Banks reported mixed responses regarding changes in loan terms for small firms. A majority of the domestic respondents that tightened either standards or terms on C&I loans over the past three months cited a less favorable or more uncertain economic outlook as well as a worsening of industry-specific problems affecting borrowers as important reasons. Meanwhile, a significant net fraction of foreign respondents reported a tightening of lending standards for C&I loans.
Regarding the demand for C&I loans, on balance, a modest net fraction of large banks reported that demand from large and middle-market firms was weaker during the first quarter, whereas demand remained basically unchanged for loans to small firms. Among the banks that reported weaker loan demand, customers’ decreased investment in plant or equipment was the most commonly cited reason, though customers’ reduced needs to finance merger and acquisition activity, accounts receivable, and inventories were also cited by the majority of respondents.
4 The survey asked respondents separately about their standards for, and demand from, large and middle-
market firms, which are generally defined as firms with annual sales of $50 million or more, and small firms, which are those with annual sales of less than $50 million.
3
Furthermore, a moderate net fraction of foreign bank respondents reported that demand for C&I loans weakened over the first quarter of 2016.
Special questions on commercial and industrial lending. The April survey asked a set of special questions about lending to firms in the oil and natural gas drilling or extraction sector. Of banks that made loans to such firms, the majority of domestic banks indicated that such lending accounts for less than 5 percent of their outstanding C&I loans, whereas the majority of foreign banks reported that loans to firms in this sector account for more than 5 percent of their outstanding C&I loans. The majority of both domestic and foreign banks reported that they expect delinquency and charge-off rates on loans to firms in the oil and natural gas drilling or extraction sector to deteriorate somewhat over the remainder of 2016. At the same time, the majority of both domestic and foreign banks reported taking a variety of actions to mitigate loan losses over the past year, including tightening lending policies on new loans or lines of credit made to firms in this sector, restructuring outstanding loans, requiring additional collateral, and setting aside additional reserves for a potential increase in loan losses. A significant percentage of banks also reported enforcing material adverse change clauses or other covenants to limit draws on existing credit lines to firms in this sector, tightening lending policies on new loans or lines of credit to firms in other sectors, and hedging the risks arising from declines in energy prices through derivatives contracts.
On balance, banks indicated a spillover from the energy sector onto credit quality of loans made to businesses and households located in energy-sector-dependent regions. In particular, a significant net fraction of banks reported that credit quality deteriorated for both auto loans and non-energy-sector C&I loans somewhat over the past year. Furthermore, moderate fractions of banks indicated that CRE loans, consumer credit card loans, and consumer loans other than credit card and auto loans made to businesses and households in these regions also deteriorated somewhat over the past year.
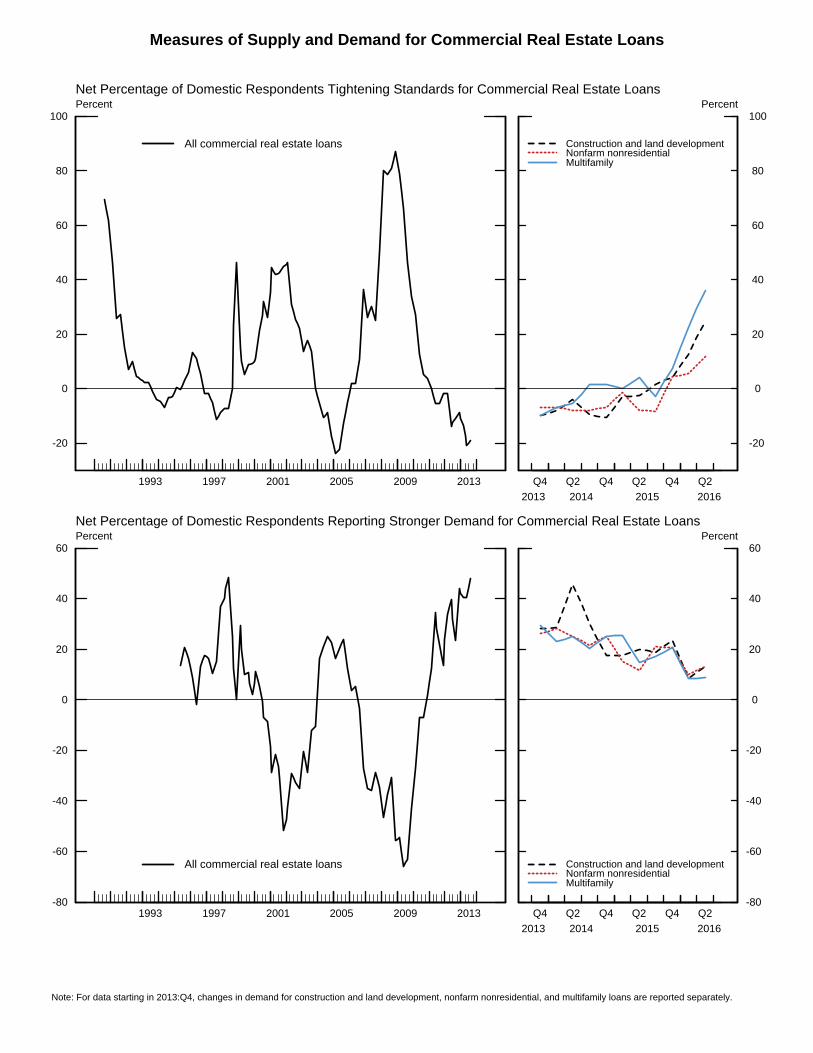
Questions on commercial real estate lending. On net, survey respondents indicated that their lending standards for CRE loans of all types tightened during the first quarter.5 A significant net fraction of banks reported tightening standards for construction and land development loans and loans secured by multifamily residential properties, whereas a moderate net fraction of banks reported tightening standards for loans secured by nonfarm nonresidential properties.
During the first quarter of 2016, on balance, banks indicated that they had experienced stronger demand for all three types of CRE loans. Moderate net fractions of banks reported stronger demand for construction and land development loans and loans secured by nonfarm
5 The three categories of CRE loans that banks are asked to consider are construction and land development loans, loans secured by nonfarm nonresidential properties, and loans secured by multifamily residential properties.
4
nonresidential properties, and a modest net fraction of banks reported stronger demand for loans secured by multifamily residential properties. Meanwhile, nearly all foreign banks reported leaving CRE lending standards basically unchanged, while a significant net fraction of foreign banks reported experiencing weaker demand for such loans.
Special questions on commercial real estate lending. The April survey included a set of special questions regarding CRE lending activities. First, banks were asked about changes over the past year in their lending policies for CRE loans. In particular, moderate net fractions of banks reported increasing maximum loan size and tightening loan-to-value ratios, while a modest net fraction reported tightening debt-service coverage ratios. Survey respondents indicated that other loan terms remained basically unchanged, on net, over the past year.
Next, banks were asked about their responses to conditions in the CMBS markets over the past six months. A moderate net fraction of banks reported moderately increasing the volume of origination of CRE loans, while a significant fraction reported moderately decreasing the volume of CRE loan securitization. On balance, banks reported that demand for loans or lines of credit from nonbank financial institutions, used to fund their CRE loan pipelines prior to securitization, remained basically unchanged over the past six months, while a moderate fraction of banks indicated tightening standards applied to such loans or lines of credit during this period. When asked about the anticipated large amount of CRE loans originated in 2006 and currently held in CMBS that will need to be refinanced over the next six months, a moderate net fraction of banks noted they expect standards for these refinancings to be somewhat tighter than standards they expect to apply to other CRE loans.
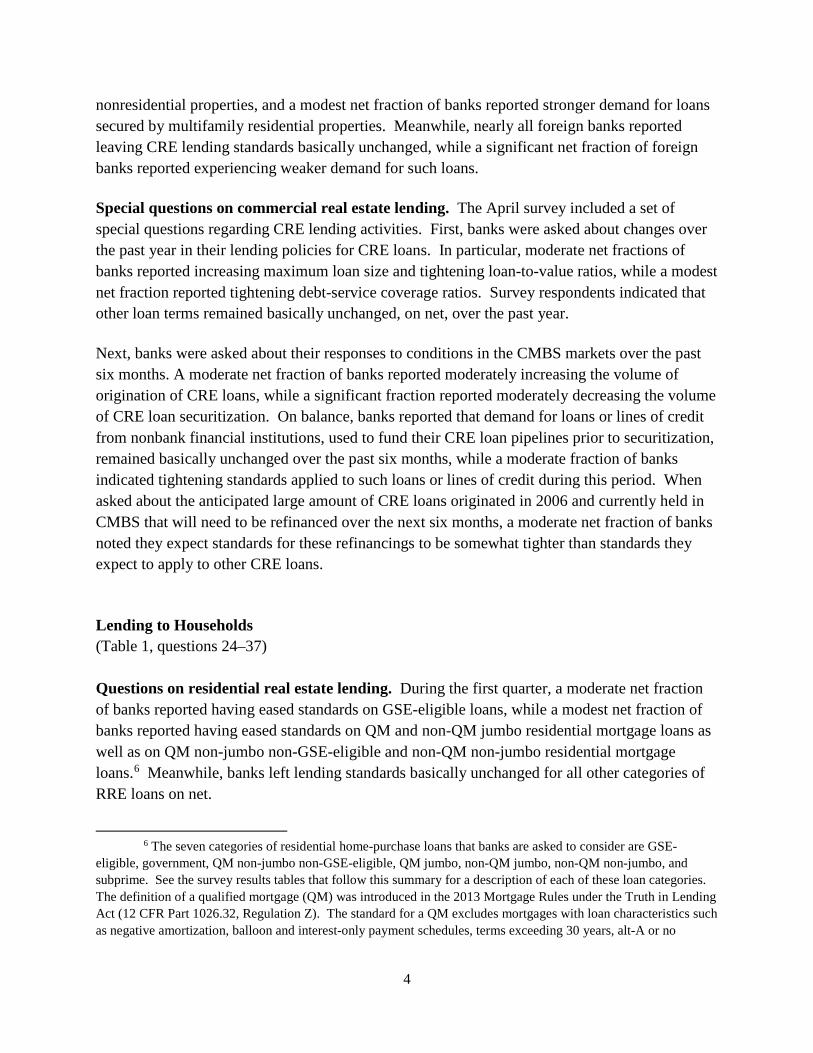
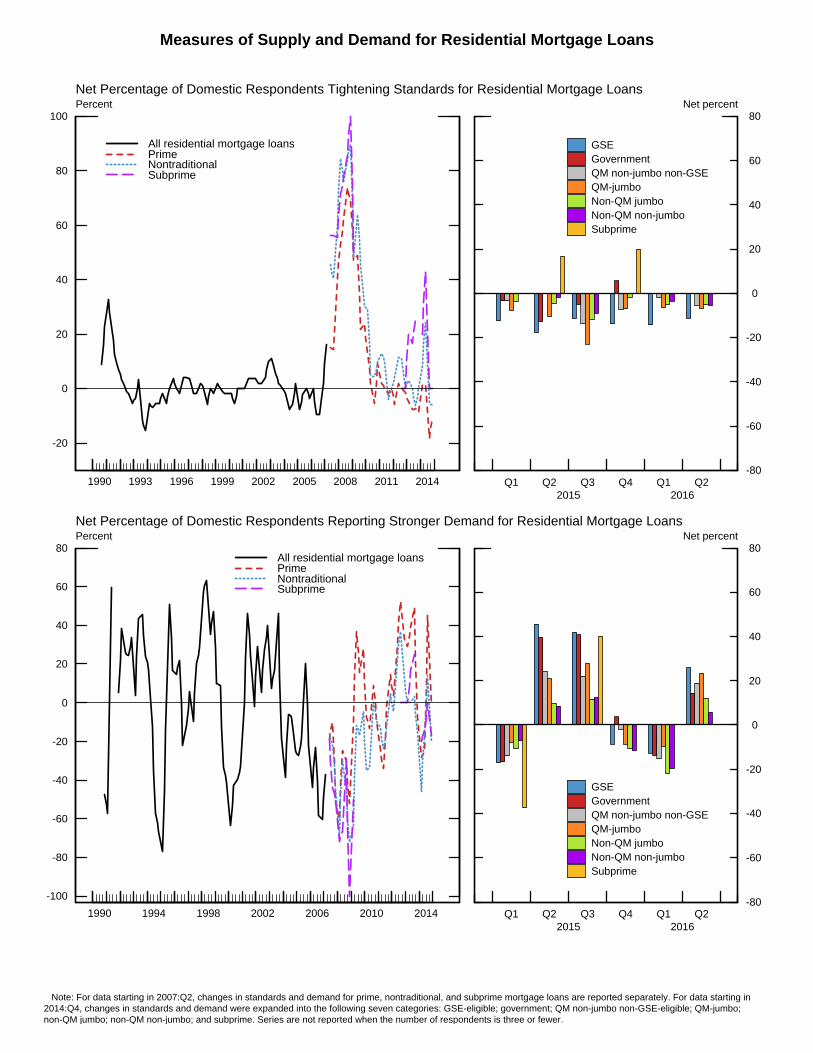
Lending to Households (Table 1, questions 24–37) Questions on residential real estate lending. During the first quarter, a moderate net fraction of banks reported having eased standards on GSE-eligible loans, while a modest net fraction of banks reported having eased standards on QM and non-QM jumbo residential mortgage loans as well as on QM non-jumbo non-GSE-eligible and non-QM non-jumbo residential mortgage loans.6 Meanwhile, banks left lending standards basically unchanged for all other categories of RRE loans on net.
6 The seven categories of residential home-purchase loans that banks are asked to consider are GSE-
eligible, government, QM non-jumbo non-GSE-eligible, QM jumbo, non-QM jumbo, non-QM non-jumbo, and subprime. See the survey results tables that follow this summary for a description of each of these loan categories. The definition of a qualified mortgage (QM) was introduced in the 2013 Mortgage Rules under the Truth in Lending Act (12 CFR Part 1026.32, Regulation Z). The standard for a QM excludes mortgages with loan characteristics such as negative amortization, balloon and interest-only payment schedules, terms exceeding 30 years, alt-A or no
5
Over the first quarter of 2016, banks reported stronger demand for most categories of RRE mortgage loans. In particular, a significant net fraction of banks reported stronger demand for GSE-eligible and QM jumbo residential mortgages. At the same time, a moderate net fraction of banks reported stronger demand for government, QM non-jumbo non-GSE-eligible, and non-QM jumbo residential mortgages, and a modest fraction of banks reported stronger demand for non-QM non-jumbo residential mortgages. Credit standards were reportedly little changed for approving applications for revolving home equity lines of credit, and a moderate fraction of banks reported that demand for revolving home equity lines of credit had strengthened on net.
Questions on consumer lending. A moderate net fraction of banks indicated that they were more willing to make consumer installment loans during the first quarter compared with three months prior. Over the first quarter, a modest net fraction of banks reported easing lending standards on credit cards and other consumer loans, whereas lending standards for auto loans remained basically unchanged. On balance, banks reported that terms across all categories of consumer loans remained basically unchanged over the first quarter. Banks generally reported that demand for consumer loans had strengthened in the first quarter: Moderate net fractions of banks reported stronger demand for auto loans and consumer loans other than credit card and auto loans, whereas a modest net fraction reported that demand for credit card loans strengthened during the first quarter.
This document was prepared by Maya Shaton, with the assistance of William Hayes and Blake Taylor, Division of Monetary Affairs, Board of Governors of the Federal Reserve System.
documentation, and total points and fees that exceed 3 percent of the loan amount. In addition, a QM requires that the monthly debt-to-income ratio of borrowers not exceed 43 percent. For more on the ability to repay and QM standards under Regulation Z, see the Consumer Financial Protection Bureau’s website at www.consumerfinance.gov/regulations/ability-to-repay-and-qualified-mortgage-standards-under-the-truth-in-lending-act-regulation-z.

Measures of Supply and Demand for Commercial and Industrial Loans,by Size of Firm Seeking Loan
-40
-20
0
20
40
60
80
100Percent
Loans to large and middle-market firmsLoans to small firms
Net Percentage of Domestic Respondents Tightening Standards for Commercial and Industrial Loans
Jan.survey
1990 1992 1994 1996 1998 2000 2002 2004 2006 2008 2010 2012 2014 2016
-80
-60
-40
-20
0
20
40
60
80
100Percent
Net Percentage of Domestic Respondents Increasing Spreads of Loan Rates over Bank’s Cost of Funds
Jan.survey
1990 1992 1994 1996 1998 2000 2002 2004 2006 2008 2010 2012 2014 2016
-80
-60
-40
-20
0
20
40
60Percent
Net Percentage of Domestic Respondents Reporting Stronger Demand for Commercial and Industrial Loans
Jan.survey
1990 1992 1994 1996 1998 2000 2002 2004 2006 2008 2010 2012 2014 2016
Measures of Supply and Demand for Commercial Real Estate Loans
-20
0
20
40
60
80
100
1993 1997 2001 2005 2009 2013
Percent
All commercial real estate loans
Q4 Q2 Q4 Q2 Q4 Q22013 2014 2015 2016
-20
0
20
40
60
80
100Percent
Construction and land developmentNonfarm nonresidentialMultifamily
Net Percentage of Domestic Respondents Tightening Standards for Commercial Real Estate Loans
-80
-60
-40
-20
0
20
40
60
1993 1997 2001 2005 2009 2013
Percent
All commercial real estate loans
Q4 Q2 Q4 Q2 Q4 Q22013 2014 2015 2016
-80
-60
-40
-20
0
20
40
60Percent
Construction and land developmentNonfarm nonresidentialMultifamily
Net Percentage of Domestic Respondents Reporting Stronger Demand for Commercial Real Estate Loans
Note: For data starting in 2013:Q4, changes in demand for construction and land development, nonfarm nonresidential, and multifamily loans are reported separately.
Measures of Supply and Demand for Residential Mortgage Loans
-20
0
20
40
60
80
100
1990 1993 1996 1999 2002 2005 2008 2011 2014
Percent
All residential mortgage loansPrimeNontraditionalSubprime
-80
-60
-40
-20
0
20
40
60
80Net percent
Q1 Q2 Q3 Q4 Q1 Q22015 2016
GSE Government QM non-jumbo non-GSE QM-jumbo Non-QM jumbo Non-QM non-jumbo Subprime
Net Percentage of Domestic Respondents Tightening Standards for Residential Mortgage Loans
-100
-80
-60
-40
-20
0
20
40
60
80
1990 1994 1998 2002 2006 2010 2014
Percent
All residential mortgage loansPrimeNontraditionalSubprime
-80
-60
-40
-20
0
20
40
60
80Net percent
Q1 Q2 Q3 Q4 Q1 Q22015 2016
GSE Government QM non-jumbo non-GSE QM-jumbo Non-QM jumbo Non-QM non-jumbo Subprime
Net Percentage of Domestic Respondents Reporting Stronger Demand for Residential Mortgage Loans
Note: For data starting in 2007:Q2, changes in standards and demand for prime, nontraditional, and subprime mortgage loans are reported separately. For data starting in 2014:Q4, changes in standards and demand were expanded into the following seven categories: GSE-eligible; government; QM non-jumbo non-GSE-eligible; QM-jumbo; non-QM jumbo; non-QM non-jumbo; and subprime. Series are not reported when the number of respondents is three or fewer.

Measures of Supply and Demand for Consumer Loans
-40
-20
0
20
40
60
80
100Percent
Credit card loansOther consumer loans
1991 1993 1995 1997 1999 2001 2003 2005 2007 2009 2011 2011 2013 2015 -40
-20
0
20
40
60
80
100Percent
Credit card loansAuto loansOther consumer loans
Net Percentage of Domestic Respondents Tightening Standards for Consumer Loans
Note: For data starting in 2011:Q2, changes in standards for auto loans and consumer loans excluding credit card and auto loans are reported separately. In2011:Q2 only, new and used auto loans are reported separately and equally weighted to calculate the auto loans series.
-60
-40
-20
0
20
40
60Percent
Net Percentage of Domestic Respondents Reporting Increased Willingness to Make Consumer Installment Loans
Jan.survey
1982 1984 1986 1988 1990 1992 1994 1996 1998 2000 2002 2004 2006 2008 2010 2012 2014 2016
-60
-40
-20
0
20
40
60
80
100Percent
All consumer loans
1991 1993 1995 1997 1999 2001 2003 2005 2007 2009 2011 2011 2013 2015-60
-40
-20
0
20
40
60
80
100Percent
Credit card loansAuto loansOther consumer loans
Net Percentage of Domestic Respondents Reporting Stronger Demand for Consumer Loans
Note: For data starting in 2011:Q2, changes in demand for credit card loans, auto loans, and consumer loans excluding credit card and auto loans are reportedseparately.
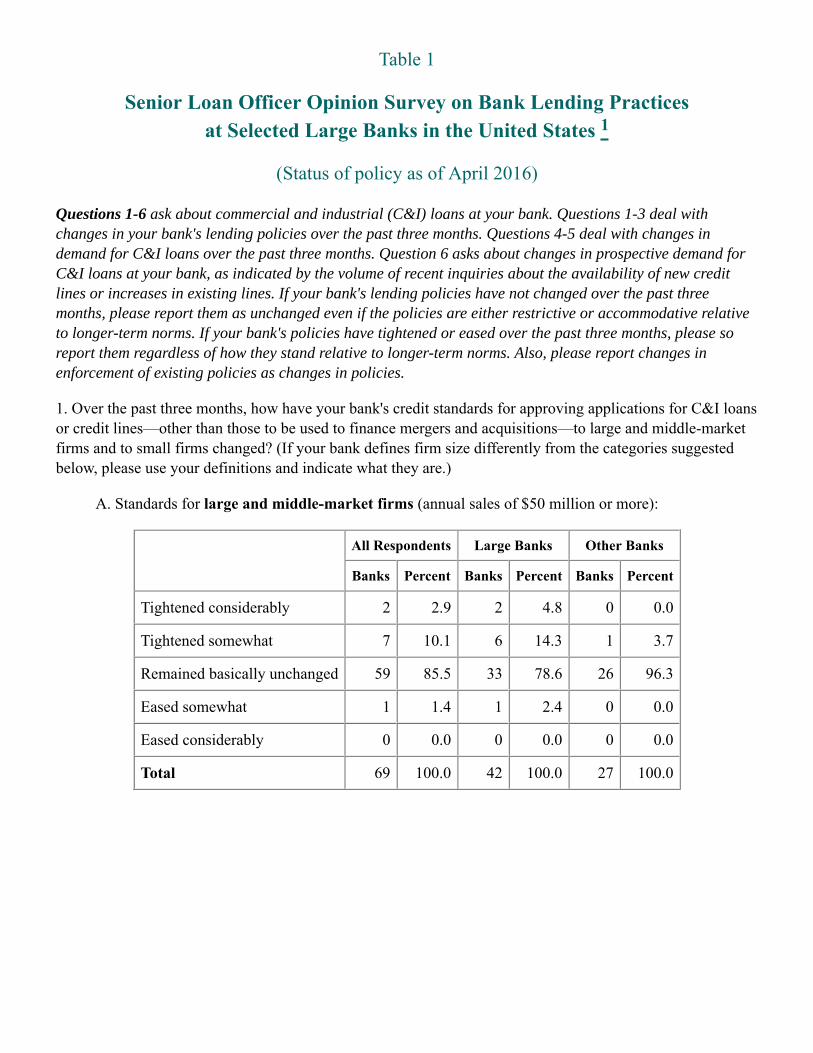
Table 1
1
(Status of policy as of April 2016)
Questions 1-6 ask about commercial and industrial (C&I) loans at your bank. Questions 1-3 deal withchanges in your bank's lending policies over the past three months. Questions 4-5 deal with changes indemand for C&I loans over the past three months. Question 6 asks about changes in prospective demand forC&I loans at your bank, as indicated by the volume of recent inquiries about the availability of new creditlines or increases in existing lines. If your bank's lending policies have not changed over the past threemonths, please report them as unchanged even if the policies are either restrictive or accommodative relativeto longer-term norms. If your bank's policies have tightened or eased over the past three months, please soreport them regardless of how they stand relative to longer-term norms. Also, please report changes inenforcement of existing policies as changes in policies.
1. Over the past three months, how have your bank's credit standards for approving applications for C&I loansor credit lines—other than those to be used to finance mergers and acquisitions—to large and middle-marketfirms and to small firms changed? (If your bank defines firm size differently from the categories suggestedbelow, please use your definitions and indicate what they are.)
A. Standards for large and middle-market firms (annual sales of $50 million or more):
All Respondents Large Banks Other Banks
Banks Percent Banks Percent Banks Percent
Tightened considerably 2 2.9 2 4.8 0 0.0
Tightened somewhat 7 10.1 6 14.3 1 3.7
Remained basically unchanged 59 85.5 33 78.6 26 96.3
Eased somewhat 1 1.4 1 2.4 0 0.0
Eased considerably 0 0.0 0 0.0 0 0.0
Total 69 100.0 42 100.0 27 100.0
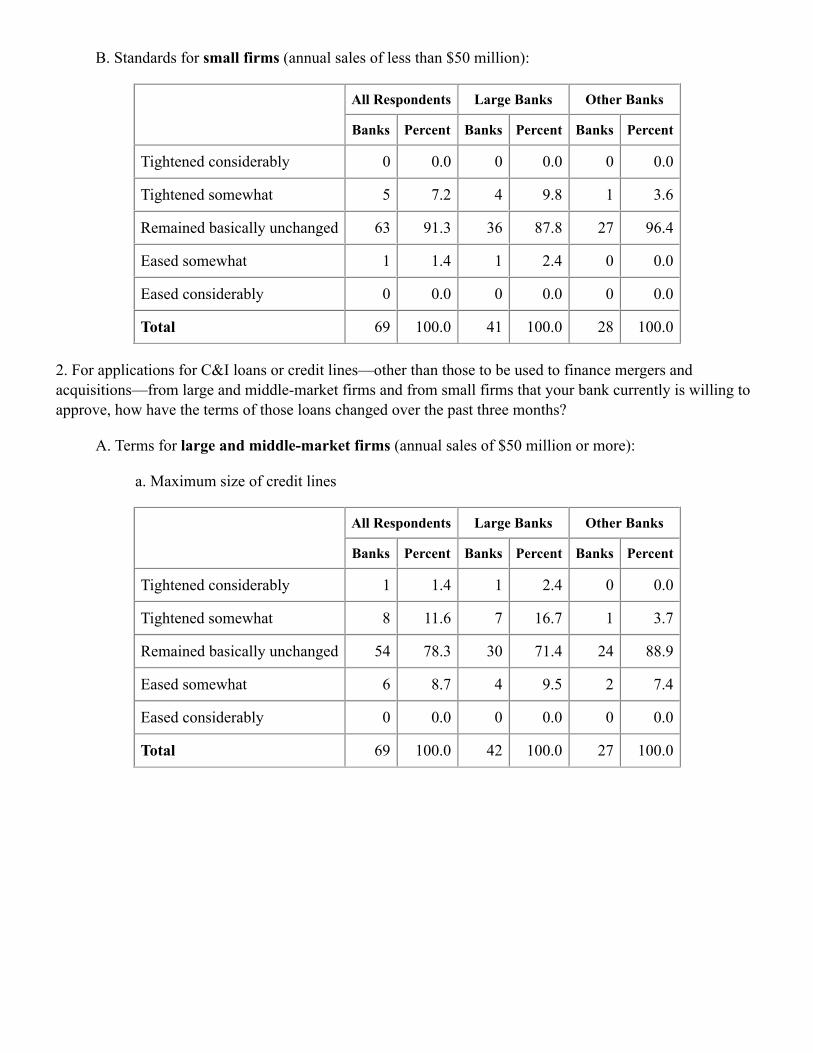
B. Standards for small firms (annual sales of less than $50 million):
All Respondents Large Banks Other Banks
Banks Percent Banks Percent Banks Percent
Tightened considerably 0 0.0 0 0.0 0 0.0
Tightened somewhat 5 7.2 4 9.8 1 3.6
Remained basically unchanged 63 91.3 36 87.8 27 96.4
Eased somewhat 1 1.4 1 2.4 0 0.0
Eased considerably 0 0.0 0 0.0 0 0.0
Total 69 100.0 41 100.0 28 100.0
2. For applications for C&I loans or credit lines—other than those to be used to finance mergers andacquisitions—from large and middle-market firms and from small firms that your bank currently is willing toapprove, how have the terms of those loans changed over the past three months?
A. Terms for large and middle-market firms (annual sales of $50 million or more):
a. Maximum size of credit lines
All Respondents Large Banks Other Banks
Banks Percent Banks Percent Banks Percent
Tightened considerably 1 1.4 1 2.4 0 0.0
Tightened somewhat 8 11.6 7 16.7 1 3.7
Remained basically unchanged 54 78.3 30 71.4 24 88.9
Eased somewhat 6 8.7 4 9.5 2 7.4
Eased considerably 0 0.0 0 0.0 0 0.0
Total 69 100.0 42 100.0 27 100.0
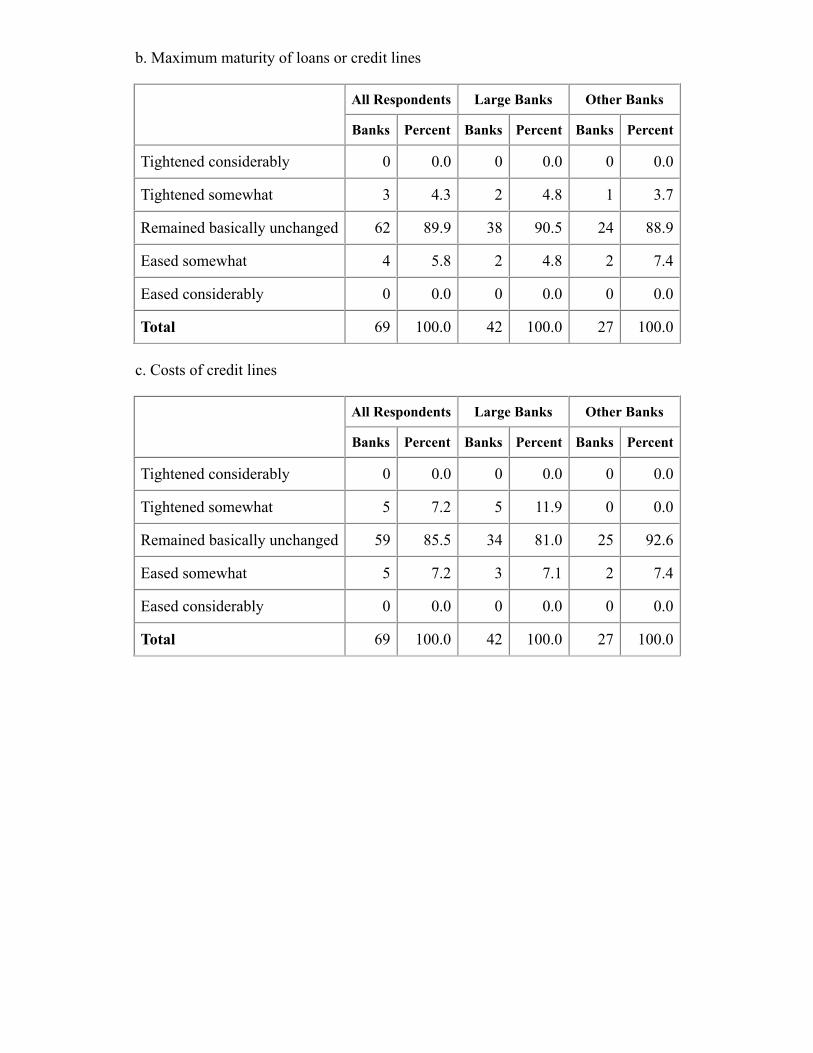
b. Maximum maturity of loans or credit lines
All Respondents Large Banks Other Banks
Banks Percent Banks Percent Banks Percent
Tightened considerably 0 0.0 0 0.0 0 0.0
Tightened somewhat 3 4.3 2 4.8 1 3.7
Remained basically unchanged 62 89.9 38 90.5 24 88.9
Eased somewhat 4 5.8 2 4.8 2 7.4
Eased considerably 0 0.0 0 0.0 0 0.0
Total 69 100.0 42 100.0 27 100.0
c. Costs of credit lines
All Respondents Large Banks Other Banks
Banks Percent Banks Percent Banks Percent
Tightened considerably 0 0.0 0 0.0 0 0.0
Tightened somewhat 5 7.2 5 11.9 0 0.0
Remained basically unchanged 59 85.5 34 81.0 25 92.6
Eased somewhat 5 7.2 3 7.1 2 7.4
Eased considerably 0 0.0 0 0.0 0 0.0
Total 69 100.0 42 100.0 27 100.0
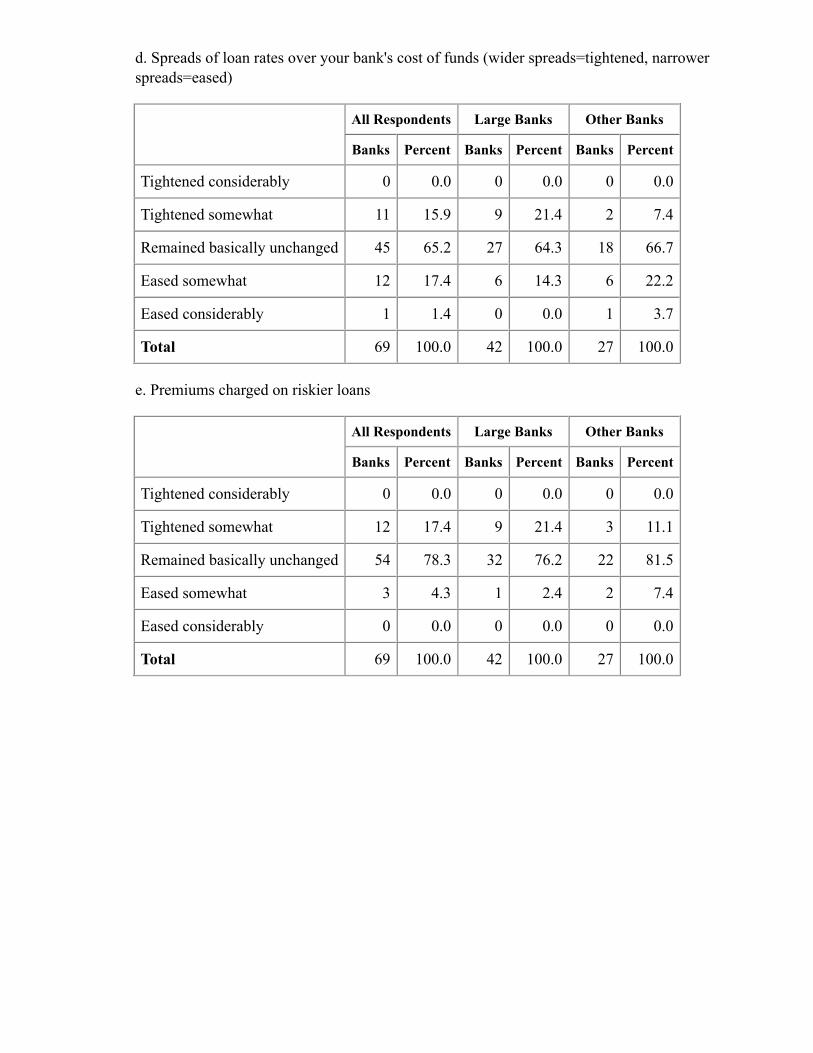
d. Spreads of loan rates over your bank's cost of funds (wider spreads=tightened, narrowerspreads=eased)
All Respondents Large Banks Other Banks
Banks Percent Banks Percent Banks Percent
Tightened considerably 0 0.0 0 0.0 0 0.0
Tightened somewhat 11 15.9 9 21.4 2 7.4
Remained basically unchanged 45 65.2 27 64.3 18 66.7
Eased somewhat 12 17.4 6 14.3 6 22.2
Eased considerably 1 1.4 0 0.0 1 3.7
Total 69 100.0 42 100.0 27 100.0
e. Premiums charged on riskier loans
All Respondents Large Banks Other Banks
Banks Percent Banks Percent Banks Percent
Tightened considerably 0 0.0 0 0.0 0 0.0
Tightened somewhat 12 17.4 9 21.4 3 11.1
Remained basically unchanged 54 78.3 32 76.2 22 81.5
Eased somewhat 3 4.3 1 2.4 2 7.4
Eased considerably 0 0.0 0 0.0 0 0.0
Total 69 100.0 42 100.0 27 100.0
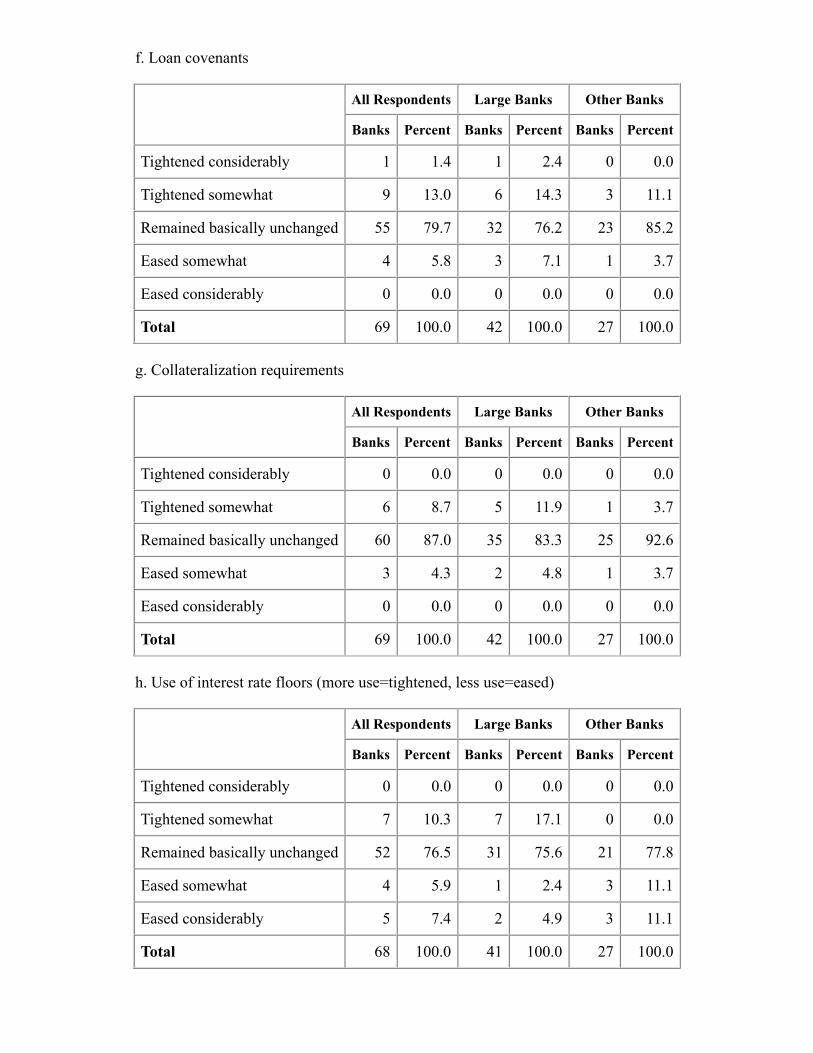
f. Loan covenants
All Respondents Large Banks Other Banks
Banks Percent Banks Percent Banks Percent
Tightened considerably 1 1.4 1 2.4 0 0.0
Tightened somewhat 9 13.0 6 14.3 3 11.1
Remained basically unchanged 55 79.7 32 76.2 23 85.2
Eased somewhat 4 5.8 3 7.1 1 3.7
Eased considerably 0 0.0 0 0.0 0 0.0
Total 69 100.0 42 100.0 27 100.0
g. Collateralization requirements
All Respondents Large Banks Other Banks
Banks Percent Banks Percent Banks Percent
Tightened considerably 0 0.0 0 0.0 0 0.0
Tightened somewhat 6 8.7 5 11.9 1 3.7
Remained basically unchanged 60 87.0 35 83.3 25 92.6
Eased somewhat 3 4.3 2 4.8 1 3.7
Eased considerably 0 0.0 0 0.0 0 0.0
Total 69 100.0 42 100.0 27 100.0
h. Use of interest rate floors (more use=tightened, less use=eased)
All Respondents Large Banks Other Banks
Banks Percent Banks Percent Banks Percent
Tightened considerably 0 0.0 0 0.0 0 0.0
Tightened somewhat 7 10.3 7 17.1 0 0.0
Remained basically unchanged 52 76.5 31 75.6 21 77.8
Eased somewhat 4 5.9 1 2.4 3 11.1
Eased considerably 5 7.4 2 4.9 3 11.1
Total 68 100.0 41 100.0 27 100.0
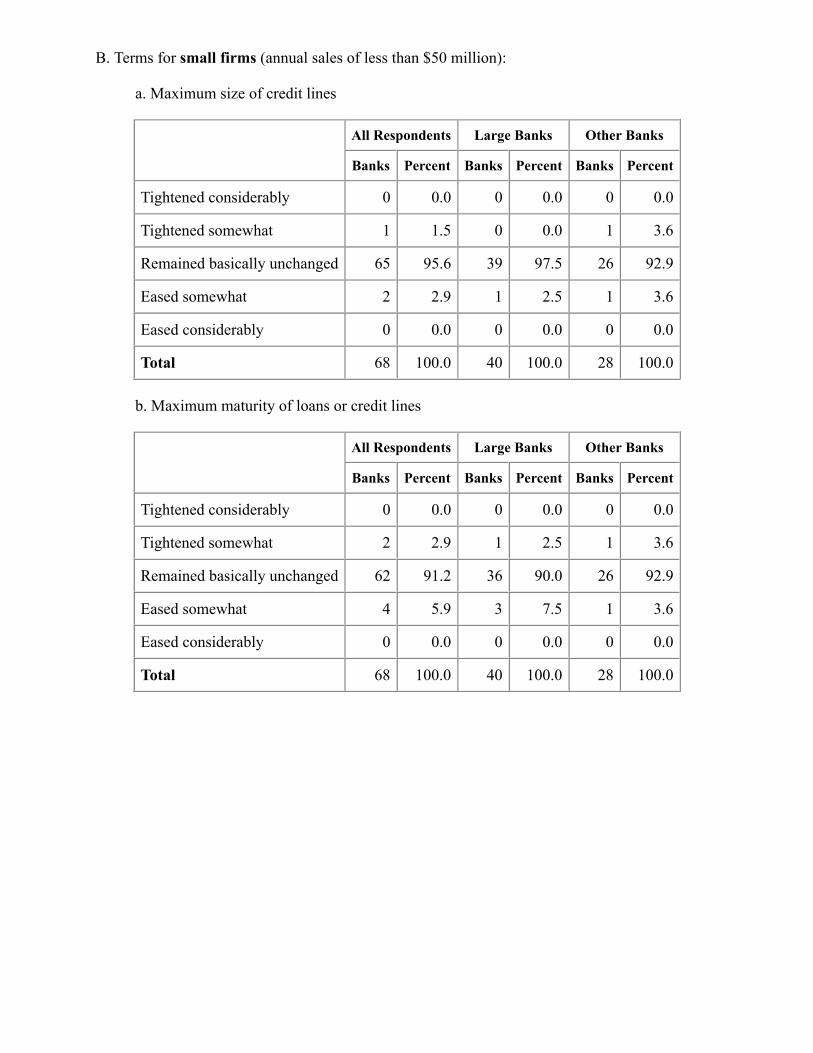
B. Terms for small firms (annual sales of less than $50 million):
a. Maximum size of credit lines
All Respondents Large Banks Other Banks
Banks Percent Banks Percent Banks Percent
Tightened considerably 0 0.0 0 0.0 0 0.0
Tightened somewhat 1 1.5 0 0.0 1 3.6
Remained basically unchanged 65 95.6 39 97.5 26 92.9
Eased somewhat 2 2.9 1 2.5 1 3.6
Eased considerably 0 0.0 0 0.0 0 0.0
Total 68 100.0 40 100.0 28 100.0
b. Maximum maturity of loans or credit lines
All Respondents Large Banks Other Banks
Banks Percent Banks Percent Banks Percent
Tightened considerably 0 0.0 0 0.0 0 0.0
Tightened somewhat 2 2.9 1 2.5 1 3.6
Remained basically unchanged 62 91.2 36 90.0 26 92.9
Eased somewhat 4 5.9 3 7.5 1 3.6
Eased considerably 0 0.0 0 0.0 0 0.0
Total 68 100.0 40 100.0 28 100.0
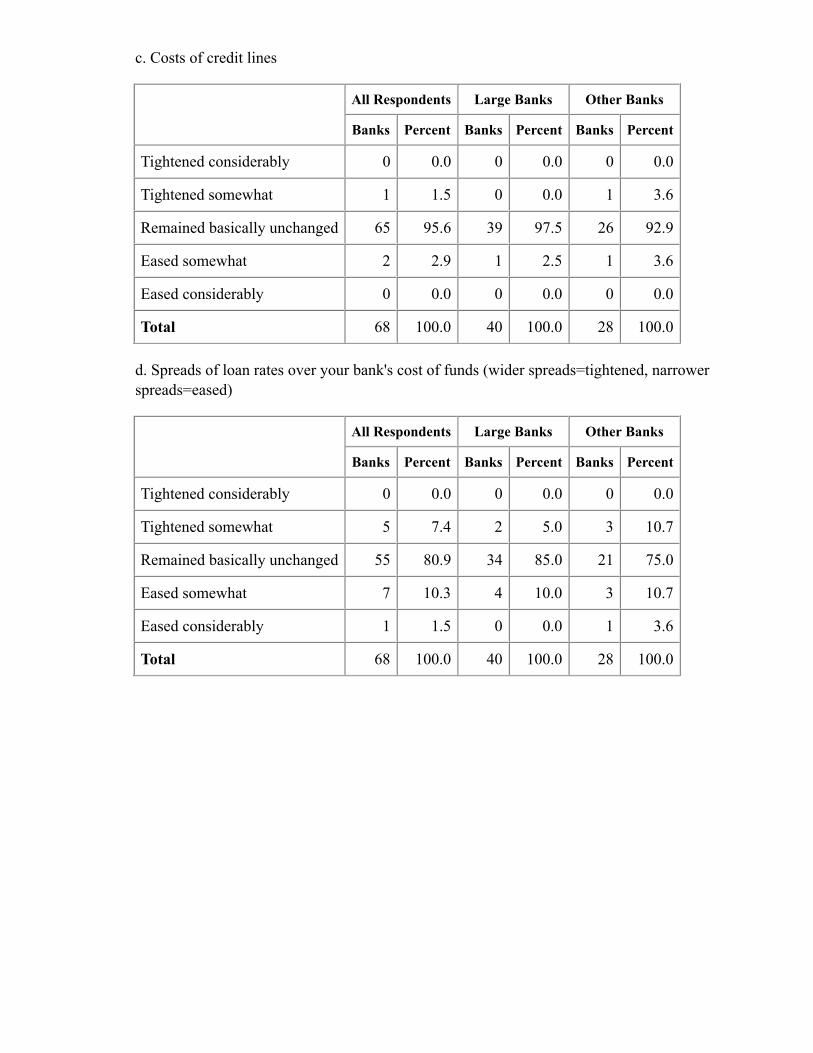
c. Costs of credit lines
All Respondents Large Banks Other Banks
Banks Percent Banks Percent Banks Percent
Tightened considerably 0 0.0 0 0.0 0 0.0
Tightened somewhat 1 1.5 0 0.0 1 3.6
Remained basically unchanged 65 95.6 39 97.5 26 92.9
Eased somewhat 2 2.9 1 2.5 1 3.6
Eased considerably 0 0.0 0 0.0 0 0.0
Total 68 100.0 40 100.0 28 100.0
d. Spreads of loan rates over your bank's cost of funds (wider spreads=tightened, narrowerspreads=eased)
All Respondents Large Banks Other Banks
Banks Percent Banks Percent Banks Percent
Tightened considerably 0 0.0 0 0.0 0 0.0
Tightened somewhat 5 7.4 2 5.0 3 10.7
Remained basically unchanged 55 80.9 34 85.0 21 75.0
Eased somewhat 7 10.3 4 10.0 3 10.7
Eased considerably 1 1.5 0 0.0 1 3.6
Total 68 100.0 40 100.0 28 100.0
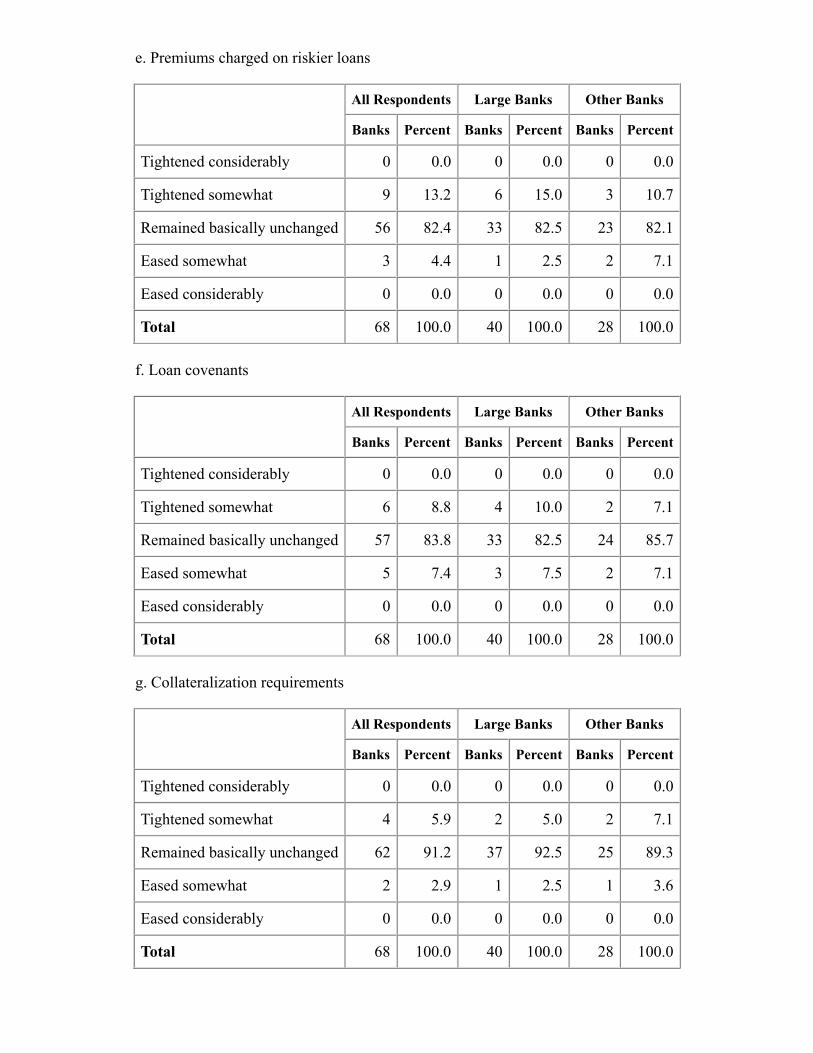
e. Premiums charged on riskier loans
All Respondents Large Banks Other Banks
Banks Percent Banks Percent Banks Percent
Tightened considerably 0 0.0 0 0.0 0 0.0
Tightened somewhat 9 13.2 6 15.0 3 10.7
Remained basically unchanged 56 82.4 33 82.5 23 82.1
Eased somewhat 3 4.4 1 2.5 2 7.1
Eased considerably 0 0.0 0 0.0 0 0.0
Total 68 100.0 40 100.0 28 100.0
f. Loan covenants
All Respondents Large Banks Other Banks
Banks Percent Banks Percent Banks Percent
Tightened considerably 0 0.0 0 0.0 0 0.0
Tightened somewhat 6 8.8 4 10.0 2 7.1
Remained basically unchanged 57 83.8 33 82.5 24 85.7
Eased somewhat 5 7.4 3 7.5 2 7.1
Eased considerably 0 0.0 0 0.0 0 0.0
Total 68 100.0 40 100.0 28 100.0
g. Collateralization requirements
All Respondents Large Banks Other Banks
Banks Percent Banks Percent Banks Percent
Tightened considerably 0 0.0 0 0.0 0 0.0
Tightened somewhat 4 5.9 2 5.0 2 7.1
Remained basically unchanged 62 91.2 37 92.5 25 89.3
Eased somewhat 2 2.9 1 2.5 1 3.6
Eased considerably 0 0.0 0 0.0 0 0.0
Total 68 100.0 40 100.0 28 100.0
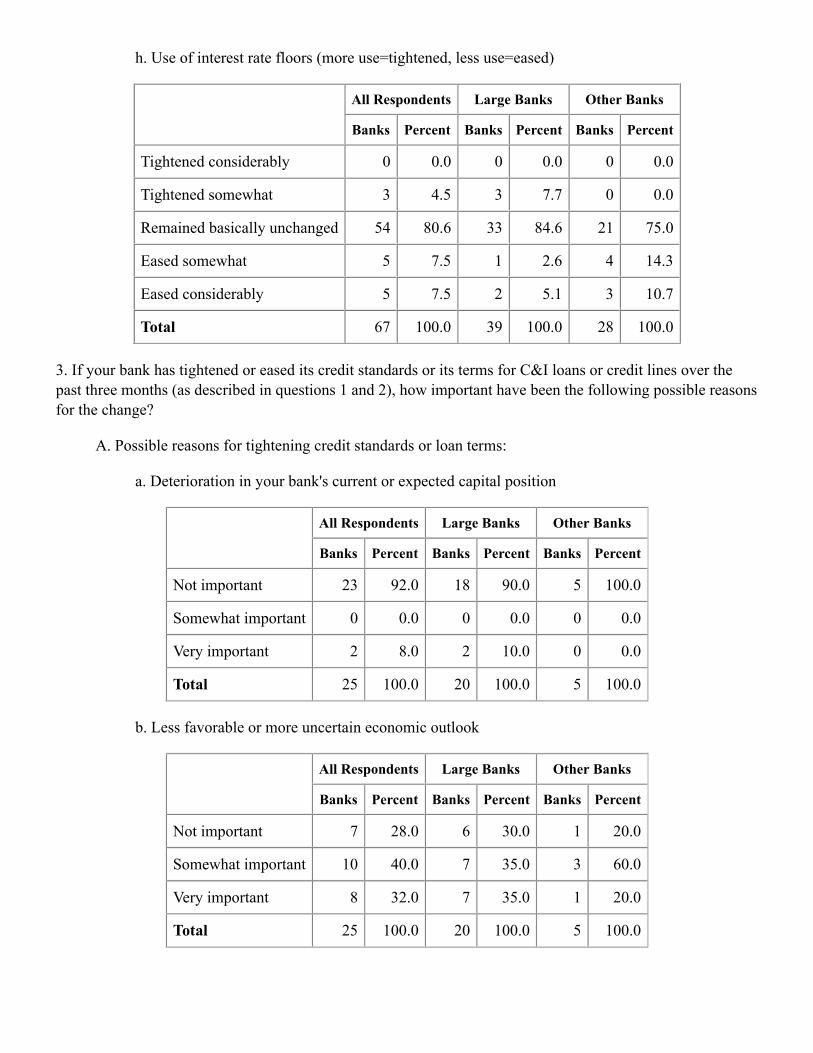
h. Use of interest rate floors (more use=tightened, less use=eased)
All Respondents Large Banks Other Banks
Banks Percent Banks Percent Banks Percent
Tightened considerably 0 0.0 0 0.0 0 0.0
Tightened somewhat 3 4.5 3 7.7 0 0.0
Remained basically unchanged 54 80.6 33 84.6 21 75.0
Eased somewhat 5 7.5 1 2.6 4 14.3
Eased considerably 5 7.5 2 5.1 3 10.7
Total 67 100.0 39 100.0 28 100.0
3. If your bank has tightened or eased its credit standards or its terms for C&I loans or credit lines over thepast three months (as described in questions 1 and 2), how important have been the following possible reasonsfor the change?
A. Possible reasons for tightening credit standards or loan terms:
a. Deterioration in your bank's current or expected capital position
All Respondents Large Banks Other Banks
Banks Percent Banks Percent Banks Percent
Not important 23 92.0 18 90.0 5 100.0
Somewhat important 0 0.0 0 0.0 0 0.0
Very important 2 8.0 2 10.0 0 0.0
Total 25 100.0 20 100.0 5 100.0
b. Less favorable or more uncertain economic outlook
All Respondents Large Banks Other Banks
Banks Percent Banks Percent Banks Percent
Not important 7 28.0 6 30.0 1 20.0
Somewhat important 10 40.0 7 35.0 3 60.0
Very important 8 32.0 7 35.0 1 20.0
Total 25 100.0 20 100.0 5 100.0
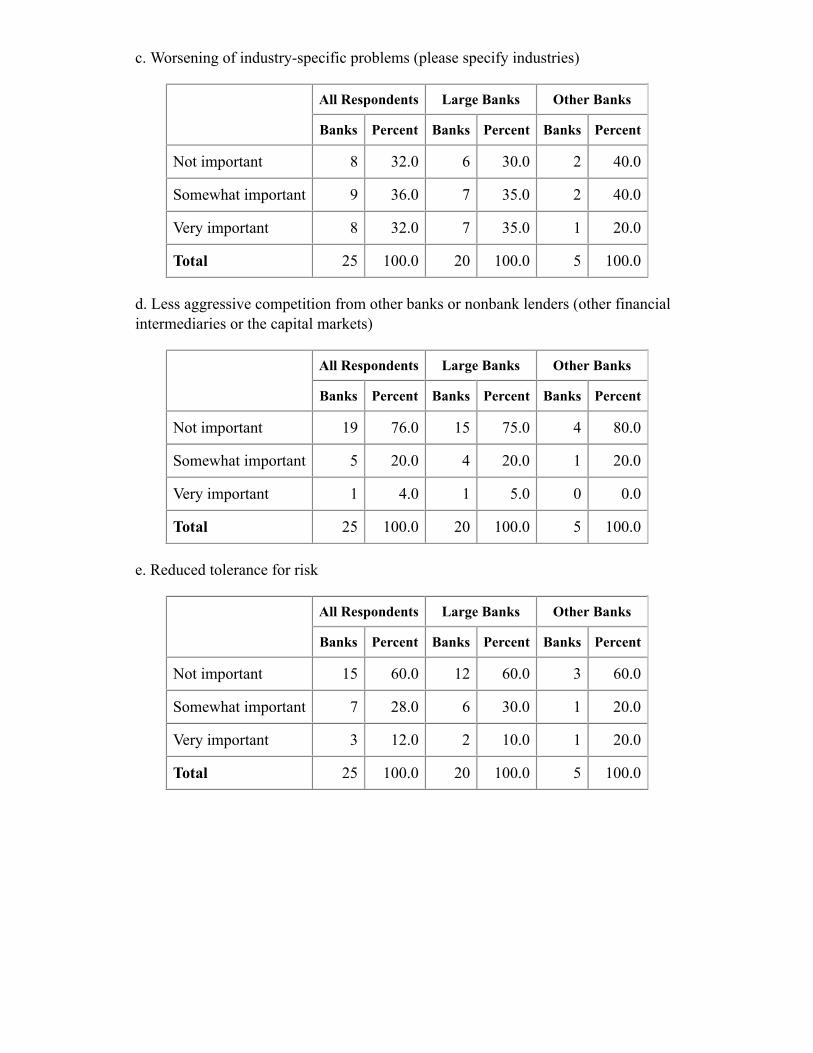
c. Worsening of industry-specific problems (please specify industries)
All Respondents Large Banks Other Banks
Banks Percent Banks Percent Banks Percent
Not important 8 32.0 6 30.0 2 40.0
Somewhat important 9 36.0 7 35.0 2 40.0
Very important 8 32.0 7 35.0 1 20.0
Total 25 100.0 20 100.0 5 100.0
d. Less aggressive competition from other banks or nonbank lenders (other financialintermediaries or the capital markets)
All Respondents Large Banks Other Banks
Banks Percent Banks Percent Banks Percent
Not important 19 76.0 15 75.0 4 80.0
Somewhat important 5 20.0 4 20.0 1 20.0
Very important 1 4.0 1 5.0 0 0.0
Total 25 100.0 20 100.0 5 100.0
e. Reduced tolerance for risk
All Respondents Large Banks Other Banks
Banks Percent Banks Percent Banks Percent
Not important 15 60.0 12 60.0 3 60.0
Somewhat important 7 28.0 6 30.0 1 20.0
Very important 3 12.0 2 10.0 1 20.0
Total 25 100.0 20 100.0 5 100.0
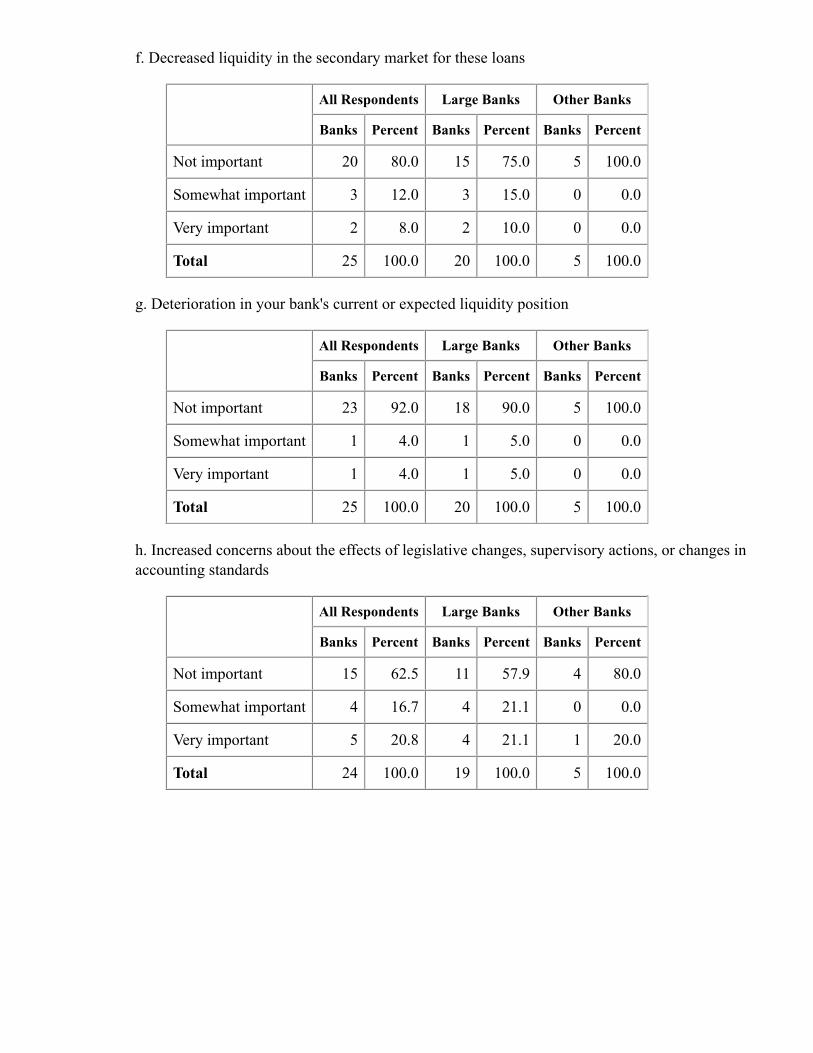
f. Decreased liquidity in the secondary market for these loans
All Respondents Large Banks Other Banks
Banks Percent Banks Percent Banks Percent
Not important 20 80.0 15 75.0 5 100.0
Somewhat important 3 12.0 3 15.0 0 0.0
Very important 2 8.0 2 10.0 0 0.0
Total 25 100.0 20 100.0 5 100.0
g. Deterioration in your bank's current or expected liquidity position
All Respondents Large Banks Other Banks
Banks Percent Banks Percent Banks Percent
Not important 23 92.0 18 90.0 5 100.0
Somewhat important 1 4.0 1 5.0 0 0.0
Very important 1 4.0 1 5.0 0 0.0
Total 25 100.0 20 100.0 5 100.0
h. Increased concerns about the effects of legislative changes, supervisory actions, or changes inaccounting standards
All Respondents Large Banks Other Banks
Banks Percent Banks Percent Banks Percent
Not important 15 62.5 11 57.9 4 80.0
Somewhat important 4 16.7 4 21.1 0 0.0
Very important 5 20.8 4 21.1 1 20.0
Total 24 100.0 19 100.0 5 100.0
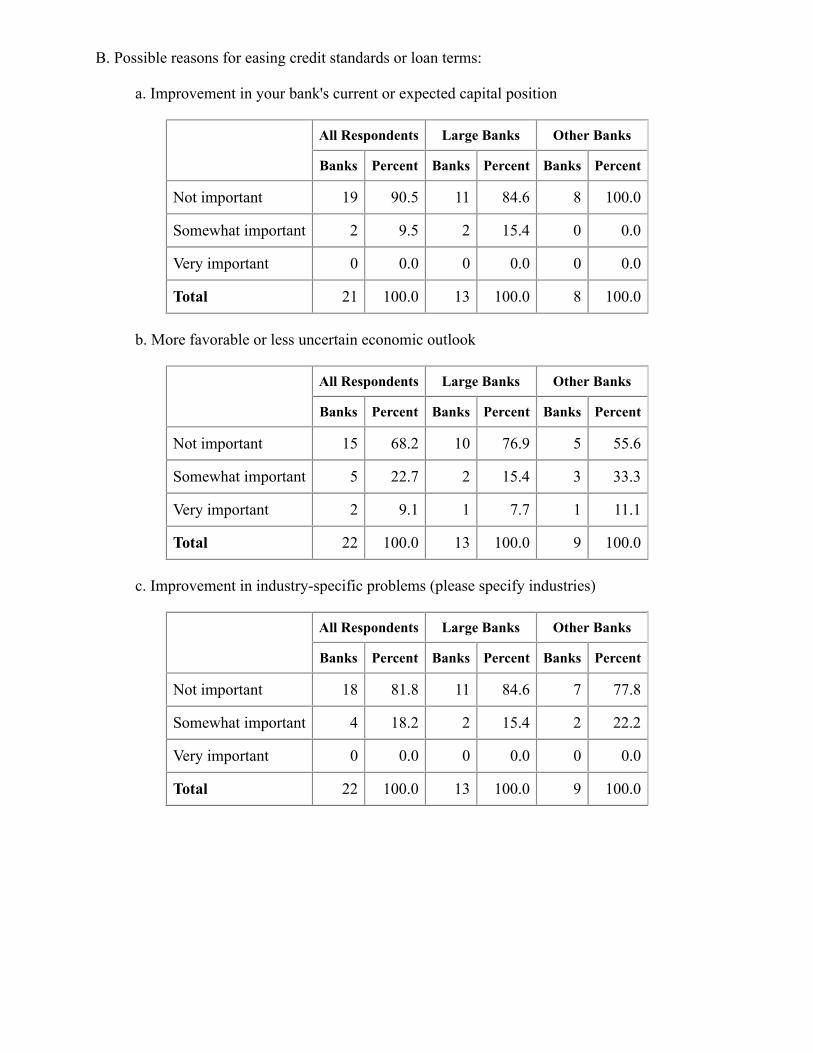
B. Possible reasons for easing credit standards or loan terms:
a. Improvement in your bank's current or expected capital position
All Respondents Large Banks Other Banks
Banks Percent Banks Percent Banks Percent
Not important 19 90.5 11 84.6 8 100.0
Somewhat important 2 9.5 2 15.4 0 0.0
Very important 0 0.0 0 0.0 0 0.0
Total 21 100.0 13 100.0 8 100.0
b. More favorable or less uncertain economic outlook
All Respondents Large Banks Other Banks
Banks Percent Banks Percent Banks Percent
Not important 15 68.2 10 76.9 5 55.6
Somewhat important 5 22.7 2 15.4 3 33.3
Very important 2 9.1 1 7.7 1 11.1
Total 22 100.0 13 100.0 9 100.0
c. Improvement in industry-specific problems (please specify industries)
All Respondents Large Banks Other Banks
Banks Percent Banks Percent Banks Percent
Not important 18 81.8 11 84.6 7 77.8
Somewhat important 4 18.2 2 15.4 2 22.2
Very important 0 0.0 0 0.0 0 0.0
Total 22 100.0 13 100.0 9 100.0
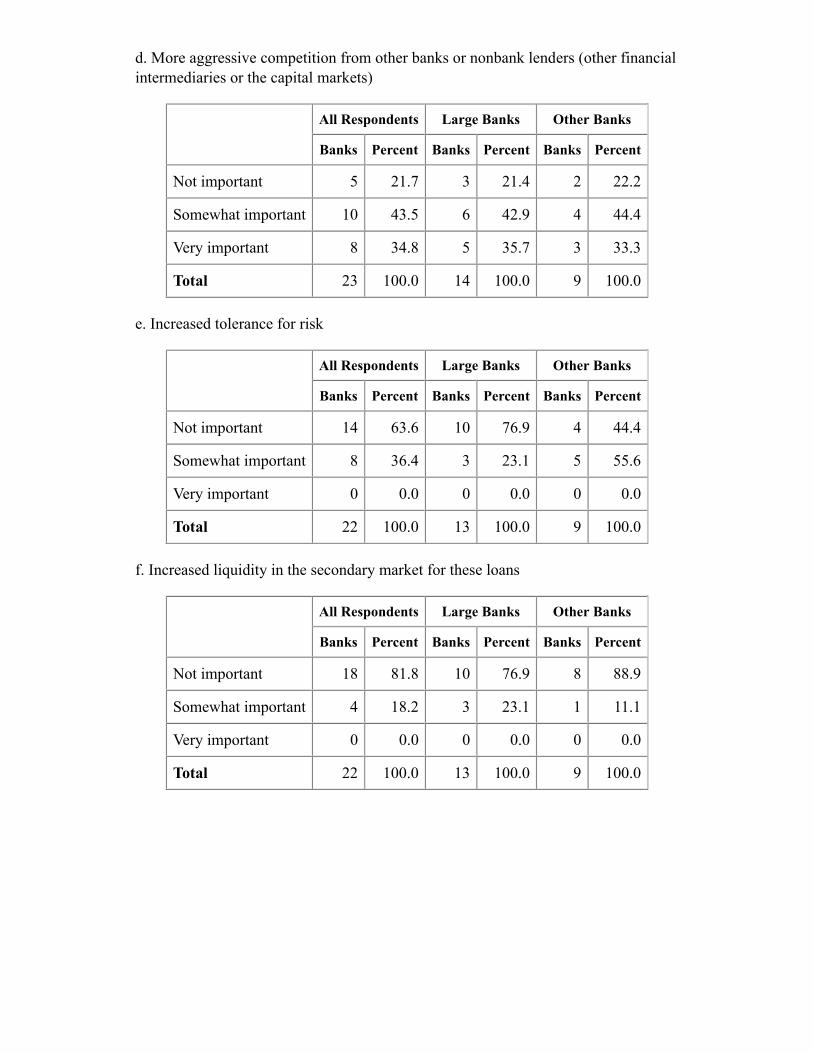
d. More aggressive competition from other banks or nonbank lenders (other financialintermediaries or the capital markets)
All Respondents Large Banks Other Banks
Banks Percent Banks Percent Banks Percent
Not important 5 21.7 3 21.4 2 22.2
Somewhat important 10 43.5 6 42.9 4 44.4
Very important 8 34.8 5 35.7 3 33.3
Total 23 100.0 14 100.0 9 100.0
e. Increased tolerance for risk
All Respondents Large Banks Other Banks
Banks Percent Banks Percent Banks Percent
Not important 14 63.6 10 76.9 4 44.4
Somewhat important 8 36.4 3 23.1 5 55.6
Very important 0 0.0 0 0.0 0 0.0
Total 22 100.0 13 100.0 9 100.0
f. Increased liquidity in the secondary market for these loans
All Respondents Large Banks Other Banks
Banks Percent Banks Percent Banks Percent
Not important 18 81.8 10 76.9 8 88.9
Somewhat important 4 18.2 3 23.1 1 11.1
Very important 0 0.0 0 0.0 0 0.0
Total 22 100.0 13 100.0 9 100.0
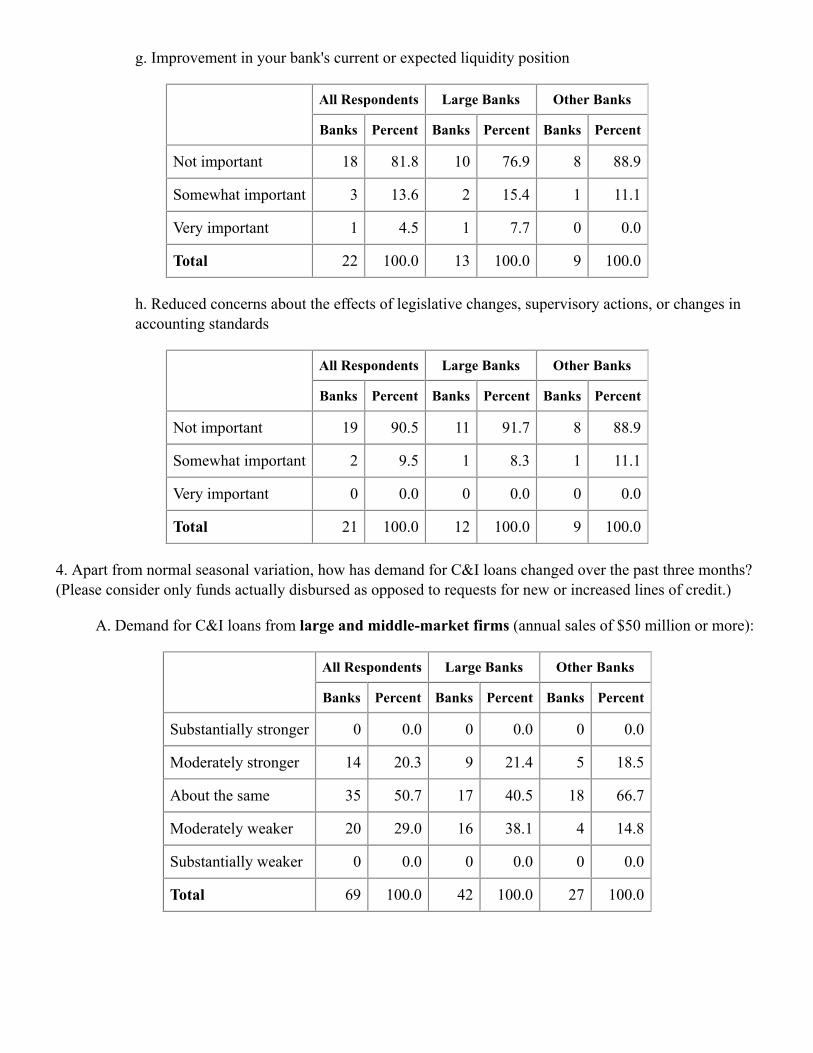
g. Improvement in your bank's current or expected liquidity position
All Respondents Large Banks Other Banks
Banks Percent Banks Percent Banks Percent
Not important 18 81.8 10 76.9 8 88.9
Somewhat important 3 13.6 2 15.4 1 11.1
Very important 1 4.5 1 7.7 0 0.0
Total 22 100.0 13 100.0 9 100.0
h. Reduced concerns about the effects of legislative changes, supervisory actions, or changes inaccounting standards
All Respondents Large Banks Other Banks
Banks Percent Banks Percent Banks Percent
Not important 19 90.5 11 91.7 8 88.9
Somewhat important 2 9.5 1 8.3 1 11.1
Very important 0 0.0 0 0.0 0 0.0
Total 21 100.0 12 100.0 9 100.0
4. Apart from normal seasonal variation, how has demand for C&I loans changed over the past three months?(Please consider only funds actually disbursed as opposed to requests for new or increased lines of credit.)
A. Demand for C&I loans from large and middle-market firms (annual sales of $50 million or more):
All Respondents Large Banks Other Banks
Banks Percent Banks Percent Banks Percent
Substantially stronger 0 0.0 0 0.0 0 0.0
Moderately stronger 14 20.3 9 21.4 5 18.5
About the same 35 50.7 17 40.5 18 66.7
Moderately weaker 20 29.0 16 38.1 4 14.8
Substantially weaker 0 0.0 0 0.0 0 0.0
Total 69 100.0 42 100.0 27 100.0
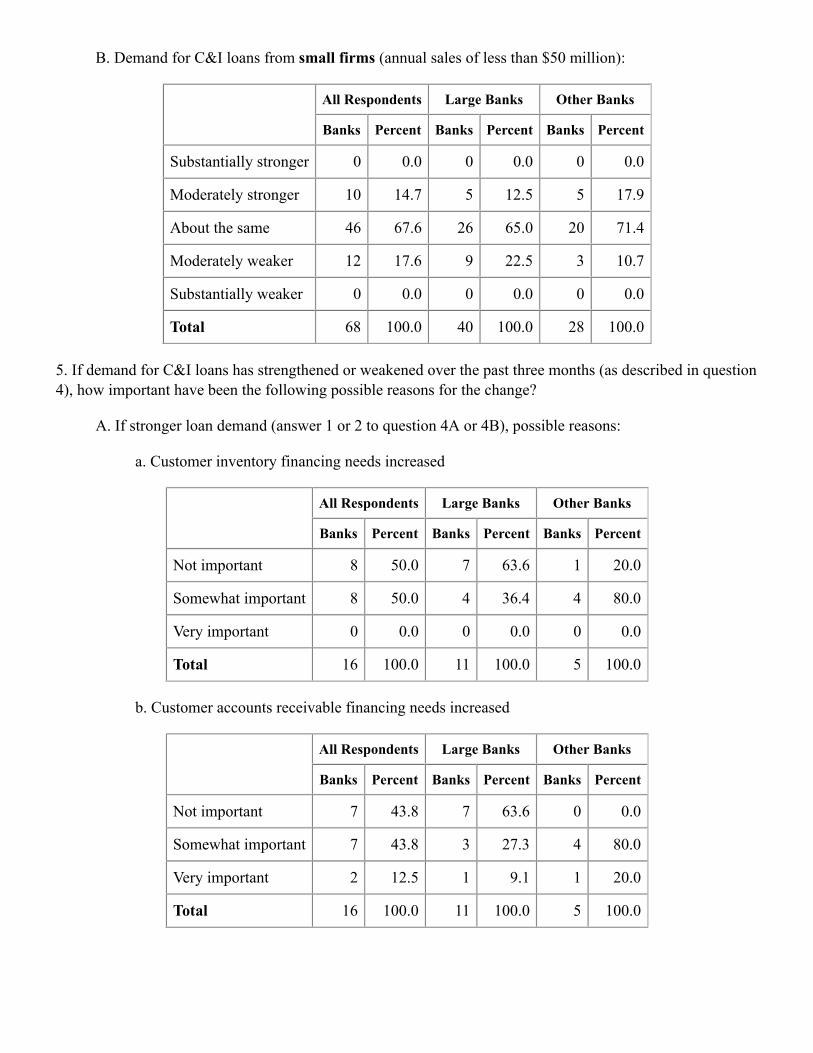
B. Demand for C&I loans from small firms (annual sales of less than $50 million):
All Respondents Large Banks Other Banks
Banks Percent Banks Percent Banks Percent
Substantially stronger 0 0.0 0 0.0 0 0.0
Moderately stronger 10 14.7 5 12.5 5 17.9
About the same 46 67.6 26 65.0 20 71.4
Moderately weaker 12 17.6 9 22.5 3 10.7
Substantially weaker 0 0.0 0 0.0 0 0.0
Total 68 100.0 40 100.0 28 100.0
5. If demand for C&I loans has strengthened or weakened over the past three months (as described in question4), how important have been the following possible reasons for the change?
A. If stronger loan demand (answer 1 or 2 to question 4A or 4B), possible reasons:
a. Customer inventory financing needs increased
All Respondents Large Banks Other Banks
Banks Percent Banks Percent Banks Percent
Not important 8 50.0 7 63.6 1 20.0
Somewhat important 8 50.0 4 36.4 4 80.0
Very important 0 0.0 0 0.0 0 0.0
Total 16 100.0 11 100.0 5 100.0
b. Customer accounts receivable financing needs increased
All Respondents Large Banks Other Banks
Banks Percent Banks Percent Banks Percent
Not important 7 43.8 7 63.6 0 0.0
Somewhat important 7 43.8 3 27.3 4 80.0
Very important 2 12.5 1 9.1 1 20.0
Total 16 100.0 11 100.0 5 100.0
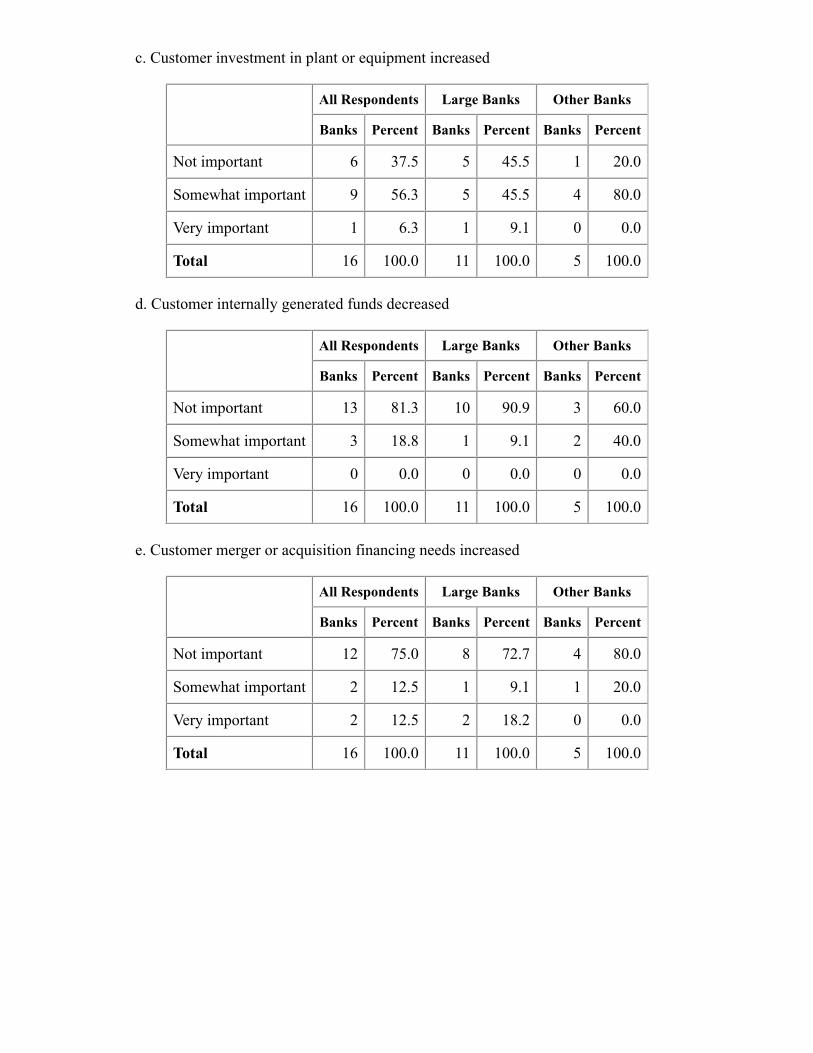
c. Customer investment in plant or equipment increased
All Respondents Large Banks Other Banks
Banks Percent Banks Percent Banks Percent
Not important 6 37.5 5 45.5 1 20.0
Somewhat important 9 56.3 5 45.5 4 80.0
Very important 1 6.3 1 9.1 0 0.0
Total 16 100.0 11 100.0 5 100.0
d. Customer internally generated funds decreased
All Respondents Large Banks Other Banks
Banks Percent Banks Percent Banks Percent
Not important 13 81.3 10 90.9 3 60.0
Somewhat important 3 18.8 1 9.1 2 40.0
Very important 0 0.0 0 0.0 0 0.0
Total 16 100.0 11 100.0 5 100.0
e. Customer merger or acquisition financing needs increased
All Respondents Large Banks Other Banks
Banks Percent Banks Percent Banks Percent
Not important 12 75.0 8 72.7 4 80.0
Somewhat important 2 12.5 1 9.1 1 20.0
Very important 2 12.5 2 18.2 0 0.0
Total 16 100.0 11 100.0 5 100.0
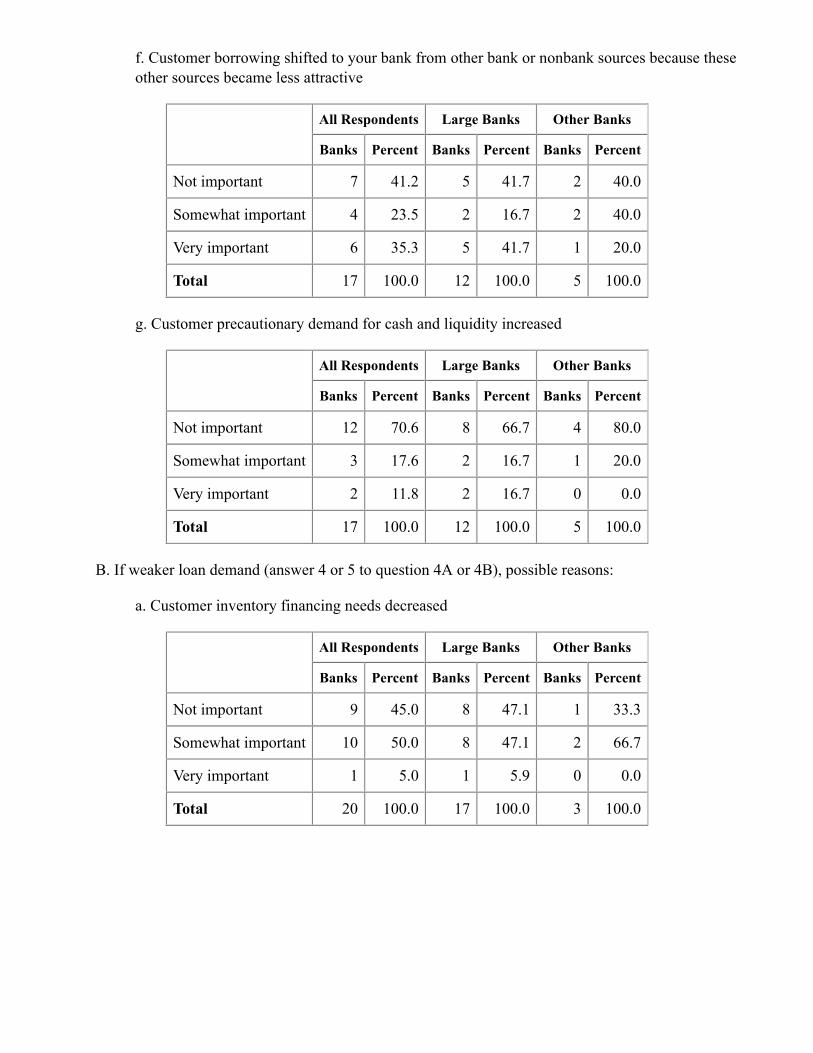
f. Customer borrowing shifted to your bank from other bank or nonbank sources because theseother sources became less attractive
All Respondents Large Banks Other Banks
Banks Percent Banks Percent Banks Percent
Not important 7 41.2 5 41.7 2 40.0
Somewhat important 4 23.5 2 16.7 2 40.0
Very important 6 35.3 5 41.7 1 20.0
Total 17 100.0 12 100.0 5 100.0
g. Customer precautionary demand for cash and liquidity increased
All Respondents Large Banks Other Banks
Banks Percent Banks Percent Banks Percent
Not important 12 70.6 8 66.7 4 80.0
Somewhat important 3 17.6 2 16.7 1 20.0
Very important 2 11.8 2 16.7 0 0.0
Total 17 100.0 12 100.0 5 100.0
B. If weaker loan demand (answer 4 or 5 to question 4A or 4B), possible reasons:
a. Customer inventory financing needs decreased
All Respondents Large Banks Other Banks
Banks Percent Banks Percent Banks Percent
Not important 9 45.0 8 47.1 1 33.3
Somewhat important 10 50.0 8 47.1 2 66.7
Very important 1 5.0 1 5.9 0 0.0
Total 20 100.0 17 100.0 3 100.0
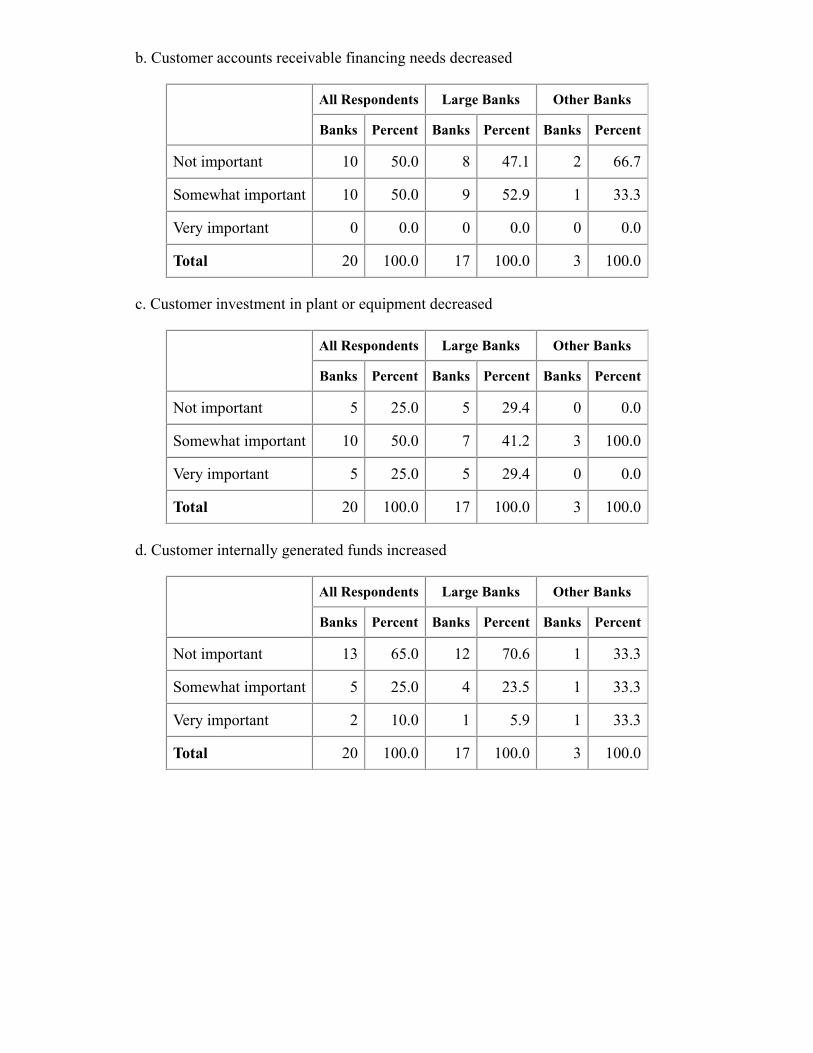
b. Customer accounts receivable financing needs decreased
All Respondents Large Banks Other Banks
Banks Percent Banks Percent Banks Percent
Not important 10 50.0 8 47.1 2 66.7
Somewhat important 10 50.0 9 52.9 1 33.3
Very important 0 0.0 0 0.0 0 0.0
Total 20 100.0 17 100.0 3 100.0
c. Customer investment in plant or equipment decreased
All Respondents Large Banks Other Banks
Banks Percent Banks Percent Banks Percent
Not important 5 25.0 5 29.4 0 0.0
Somewhat important 10 50.0 7 41.2 3 100.0
Very important 5 25.0 5 29.4 0 0.0
Total 20 100.0 17 100.0 3 100.0
d. Customer internally generated funds increased
All Respondents Large Banks Other Banks
Banks Percent Banks Percent Banks Percent
Not important 13 65.0 12 70.6 1 33.3
Somewhat important 5 25.0 4 23.5 1 33.3
Very important 2 10.0 1 5.9 1 33.3
Total 20 100.0 17 100.0 3 100.0
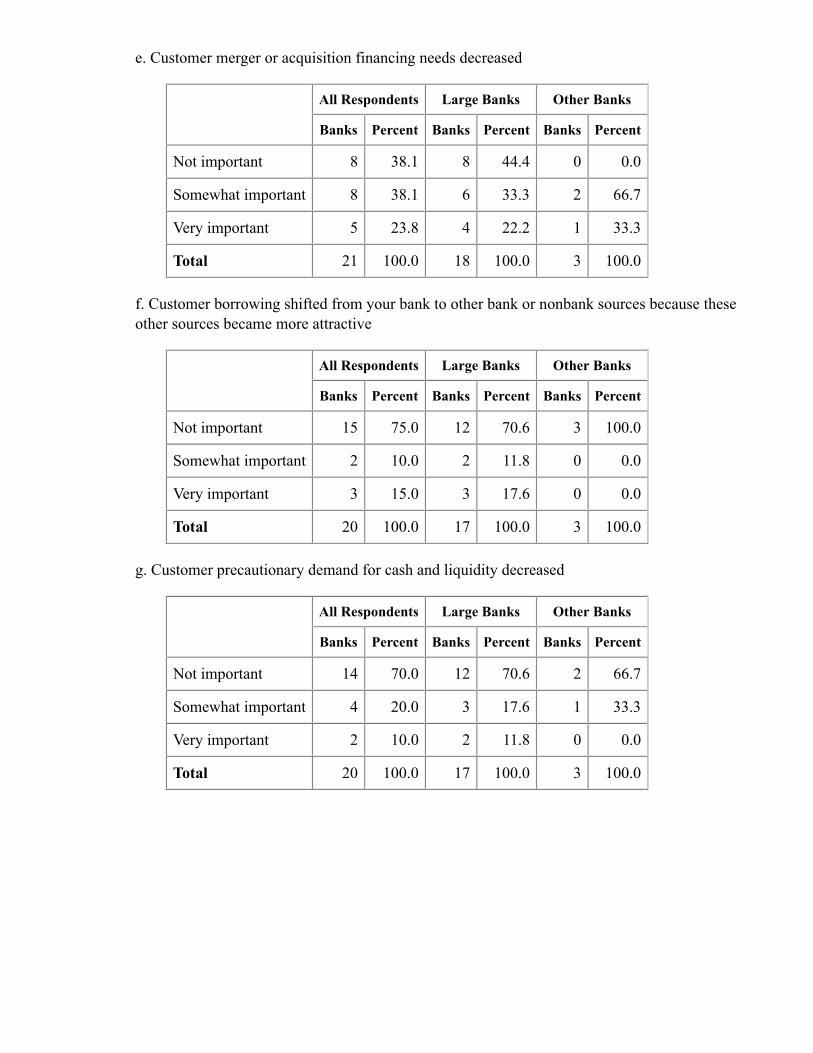
e. Customer merger or acquisition financing needs decreased
All Respondents Large Banks Other Banks
Banks Percent Banks Percent Banks Percent
Not important 8 38.1 8 44.4 0 0.0
Somewhat important 8 38.1 6 33.3 2 66.7
Very important 5 23.8 4 22.2 1 33.3
Total 21 100.0 18 100.0 3 100.0
f. Customer borrowing shifted from your bank to other bank or nonbank sources because theseother sources became more attractive
All Respondents Large Banks Other Banks
Banks Percent Banks Percent Banks Percent
Not important 15 75.0 12 70.6 3 100.0
Somewhat important 2 10.0 2 11.8 0 0.0
Very important 3 15.0 3 17.6 0 0.0
Total 20 100.0 17 100.0 3 100.0
g. Customer precautionary demand for cash and liquidity decreased
All Respondents Large Banks Other Banks
Banks Percent Banks Percent Banks Percent
Not important 14 70.0 12 70.6 2 66.7
Somewhat important 4 20.0 3 17.6 1 33.3
Very important 2 10.0 2 11.8 0 0.0
Total 20 100.0 17 100.0 3 100.0
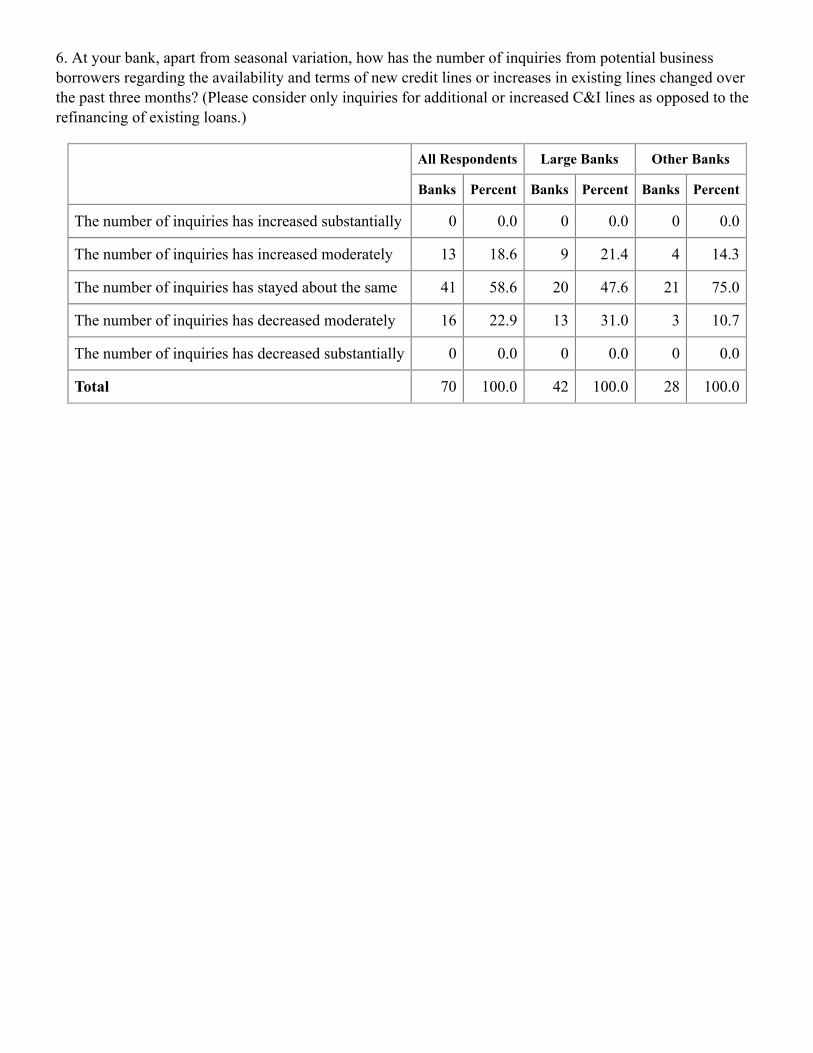
6. At your bank, apart from seasonal variation, how has the number of inquiries from potential businessborrowers regarding the availability and terms of new credit lines or increases in existing lines changed overthe past three months? (Please consider only inquiries for additional or increased C&I lines as opposed to therefinancing of existing loans.)
All Respondents Large Banks Other Banks
Banks Percent Banks Percent Banks Percent
The number of inquiries has increased substantially 0 0.0 0 0.0 0 0.0
The number of inquiries has increased moderately 13 18.6 9 21.4 4 14.3
The number of inquiries has stayed about the same 41 58.6 20 47.6 21 75.0
The number of inquiries has decreased moderately 16 22.9 13 31.0 3 10.7
The number of inquiries has decreased substantially 0 0.0 0 0.0 0 0.0
Total 70 100.0 42 100.0 28 100.0
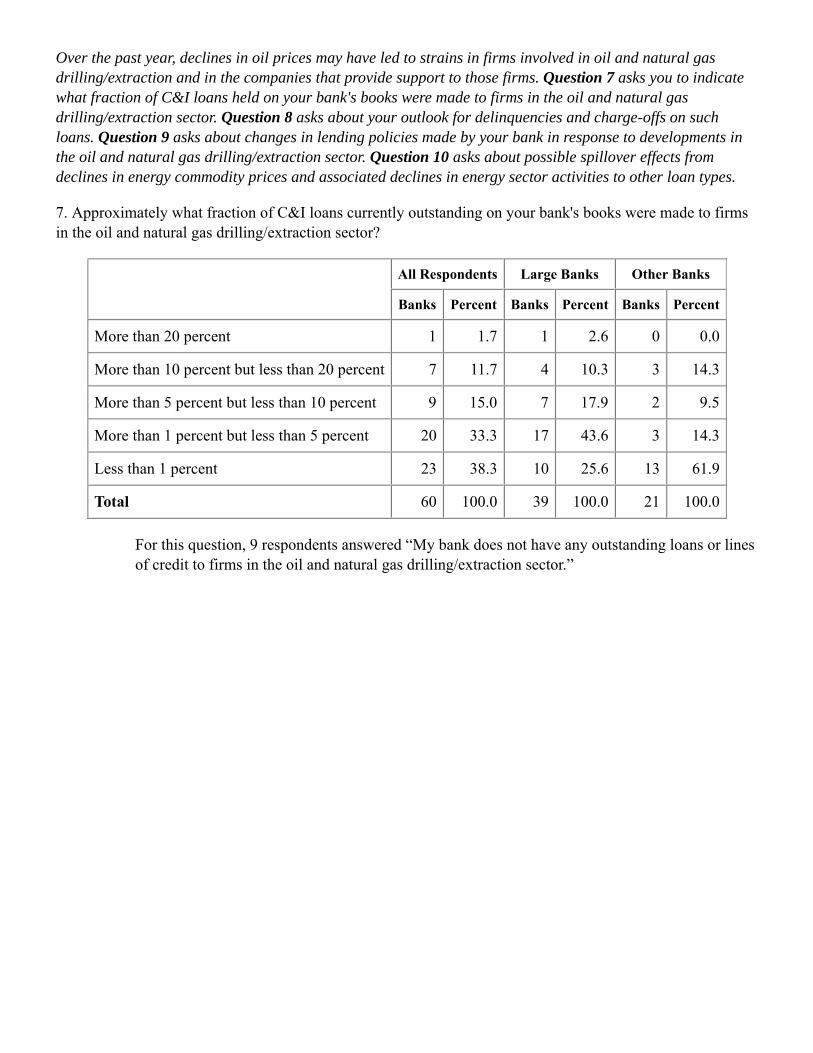
Over the past year, declines in oil prices may have led to strains in firms involved in oil and natural gasdrilling/extraction and in the companies that provide support to those firms. Question 7 asks you to indicatewhat fraction of C&I loans held on your bank's books were made to firms in the oil and natural gasdrilling/extraction sector. Question 8 asks about your outlook for delinquencies and charge-offs on suchloans. Question 9 asks about changes in lending policies made by your bank in response to developments inthe oil and natural gas drilling/extraction sector. Question 10 asks about possible spillover effects fromdeclines in energy commodity prices and associated declines in energy sector activities to other loan types.
7. Approximately what fraction of C&I loans currently outstanding on your bank's books were made to firmsin the oil and natural gas drilling/extraction sector?
All Respondents Large Banks Other Banks
Banks Percent Banks Percent Banks Percent
More than 20 percent 1 1.7 1 2.6 0 0.0
More than 10 percent but less than 20 percent 7 11.7 4 10.3 3 14.3
More than 5 percent but less than 10 percent 9 15.0 7 17.9 2 9.5
More than 1 percent but less than 5 percent 20 33.3 17 43.6 3 14.3
Less than 1 percent 23 38.3 10 25.6 13 61.9
Total 60 100.0 39 100.0 21 100.0
For this question, 9 respondents answered “My bank does not have any outstanding loans or linesof credit to firms in the oil and natural gas drilling/extraction sector.”
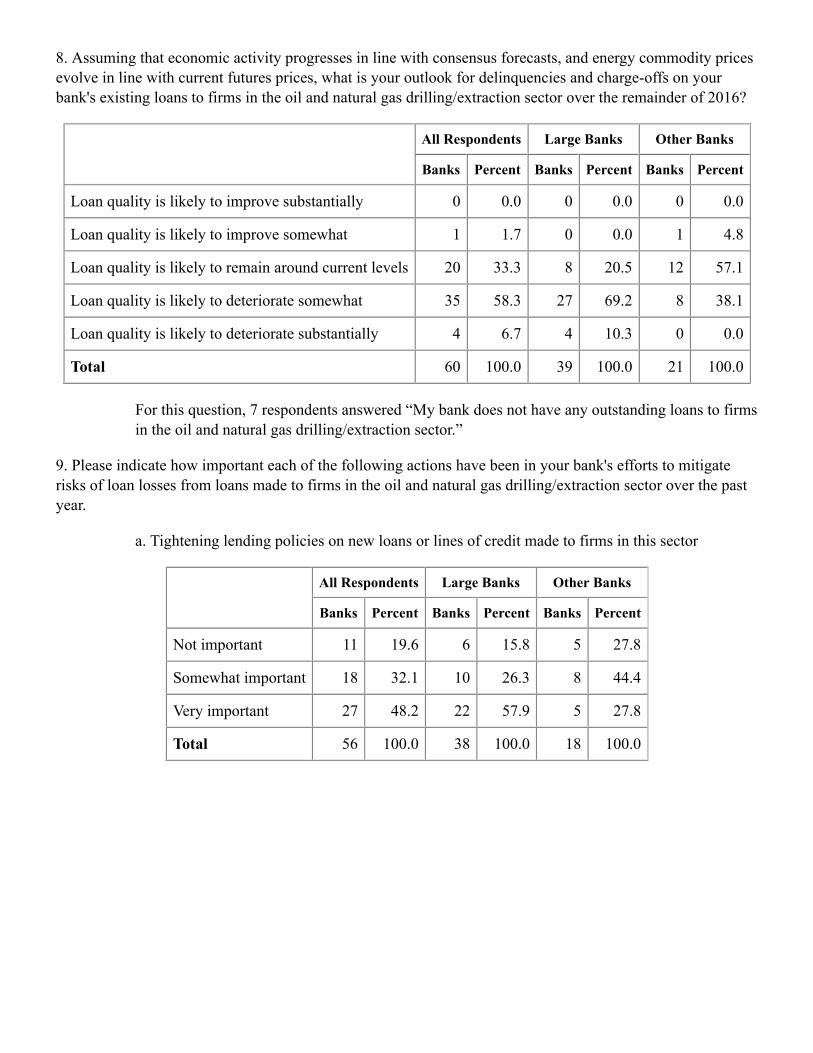
8. Assuming that economic activity progresses in line with consensus forecasts, and energy commodity pricesevolve in line with current futures prices, what is your outlook for delinquencies and charge-offs on yourbank's existing loans to firms in the oil and natural gas drilling/extraction sector over the remainder of 2016?
All Respondents Large Banks Other Banks
Banks Percent Banks Percent Banks Percent
Loan quality is likely to improve substantially 0 0.0 0 0.0 0 0.0
Loan quality is likely to improve somewhat 1 1.7 0 0.0 1 4.8
Loan quality is likely to remain around current levels 20 33.3 8 20.5 12 57.1
Loan quality is likely to deteriorate somewhat 35 58.3 27 69.2 8 38.1
Loan quality is likely to deteriorate substantially 4 6.7 4 10.3 0 0.0
Total 60 100.0 39 100.0 21 100.0
For this question, 7 respondents answered “My bank does not have any outstanding loans to firmsin the oil and natural gas drilling/extraction sector.”
9. Please indicate how important each of the following actions have been in your bank's efforts to mitigaterisks of loan losses from loans made to firms in the oil and natural gas drilling/extraction sector over the pastyear.
a. Tightening lending policies on new loans or lines of credit made to firms in this sector
All Respondents Large Banks Other Banks
Banks Percent Banks Percent Banks Percent
Not important 11 19.6 6 15.8 5 27.8
Somewhat important 18 32.1 10 26.3 8 44.4
Very important 27 48.2 22 57.9 5 27.8
Total 56 100.0 38 100.0 18 100.0
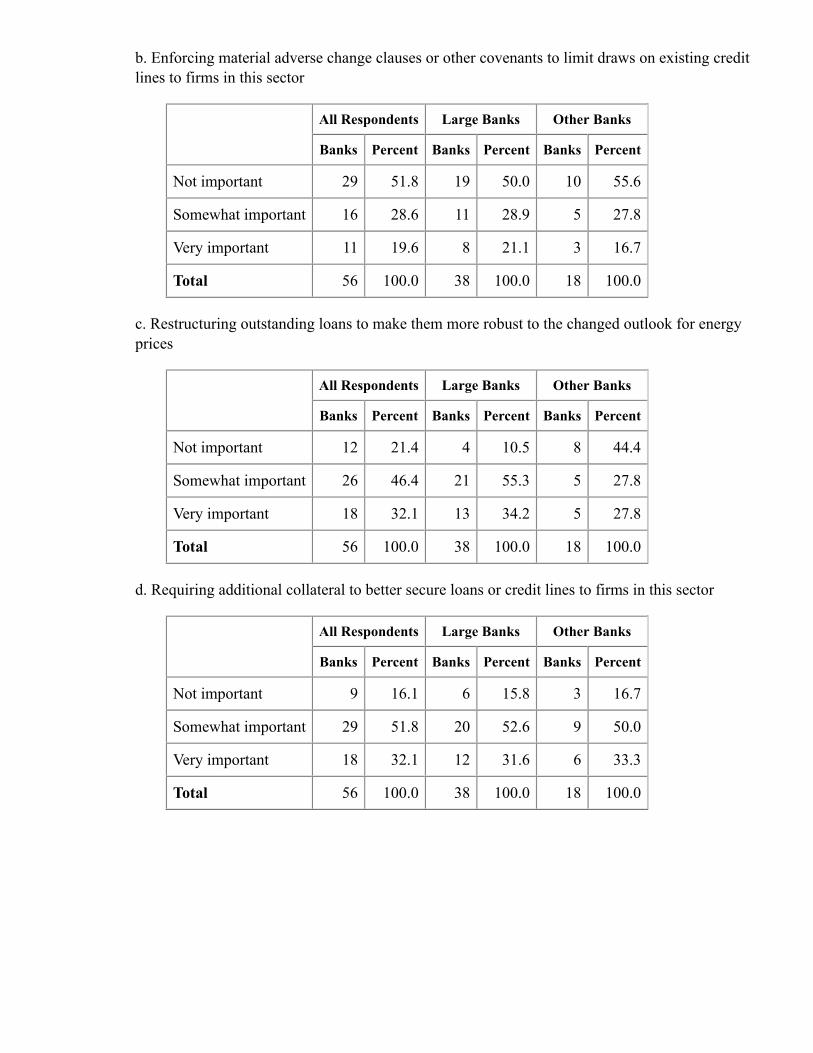
b. Enforcing material adverse change clauses or other covenants to limit draws on existing creditlines to firms in this sector
All Respondents Large Banks Other Banks
Banks Percent Banks Percent Banks Percent
Not important 29 51.8 19 50.0 10 55.6
Somewhat important 16 28.6 11 28.9 5 27.8
Very important 11 19.6 8 21.1 3 16.7
Total 56 100.0 38 100.0 18 100.0
c. Restructuring outstanding loans to make them more robust to the changed outlook for energyprices
All Respondents Large Banks Other Banks
Banks Percent Banks Percent Banks Percent
Not important 12 21.4 4 10.5 8 44.4
Somewhat important 26 46.4 21 55.3 5 27.8
Very important 18 32.1 13 34.2 5 27.8
Total 56 100.0 38 100.0 18 100.0
d. Requiring additional collateral to better secure loans or credit lines to firms in this sector
All Respondents Large Banks Other Banks
Banks Percent Banks Percent Banks Percent
Not important 9 16.1 6 15.8 3 16.7
Somewhat important 29 51.8 20 52.6 9 50.0
Very important 18 32.1 12 31.6 6 33.3
Total 56 100.0 38 100.0 18 100.0
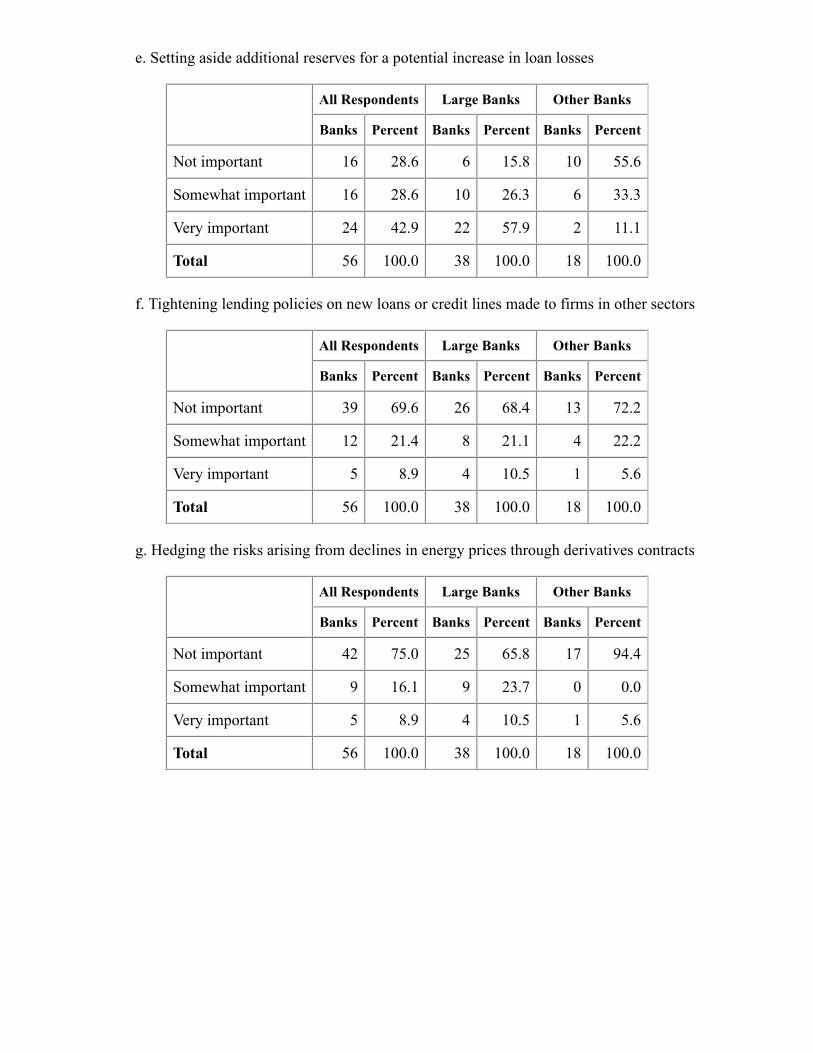
e. Setting aside additional reserves for a potential increase in loan losses
All Respondents Large Banks Other Banks
Banks Percent Banks Percent Banks Percent
Not important 16 28.6 6 15.8 10 55.6
Somewhat important 16 28.6 10 26.3 6 33.3
Very important 24 42.9 22 57.9 2 11.1
Total 56 100.0 38 100.0 18 100.0
f. Tightening lending policies on new loans or credit lines made to firms in other sectors
All Respondents Large Banks Other Banks
Banks Percent Banks Percent Banks Percent
Not important 39 69.6 26 68.4 13 72.2
Somewhat important 12 21.4 8 21.1 4 22.2
Very important 5 8.9 4 10.5 1 5.6
Total 56 100.0 38 100.0 18 100.0
g. Hedging the risks arising from declines in energy prices through derivatives contracts
All Respondents Large Banks Other Banks
Banks Percent Banks Percent Banks Percent
Not important 42 75.0 25 65.8 17 94.4
Somewhat important 9 16.1 9 23.7 0 0.0
Very important 5 8.9 4 10.5 1 5.6
Total 56 100.0 38 100.0 18 100.0
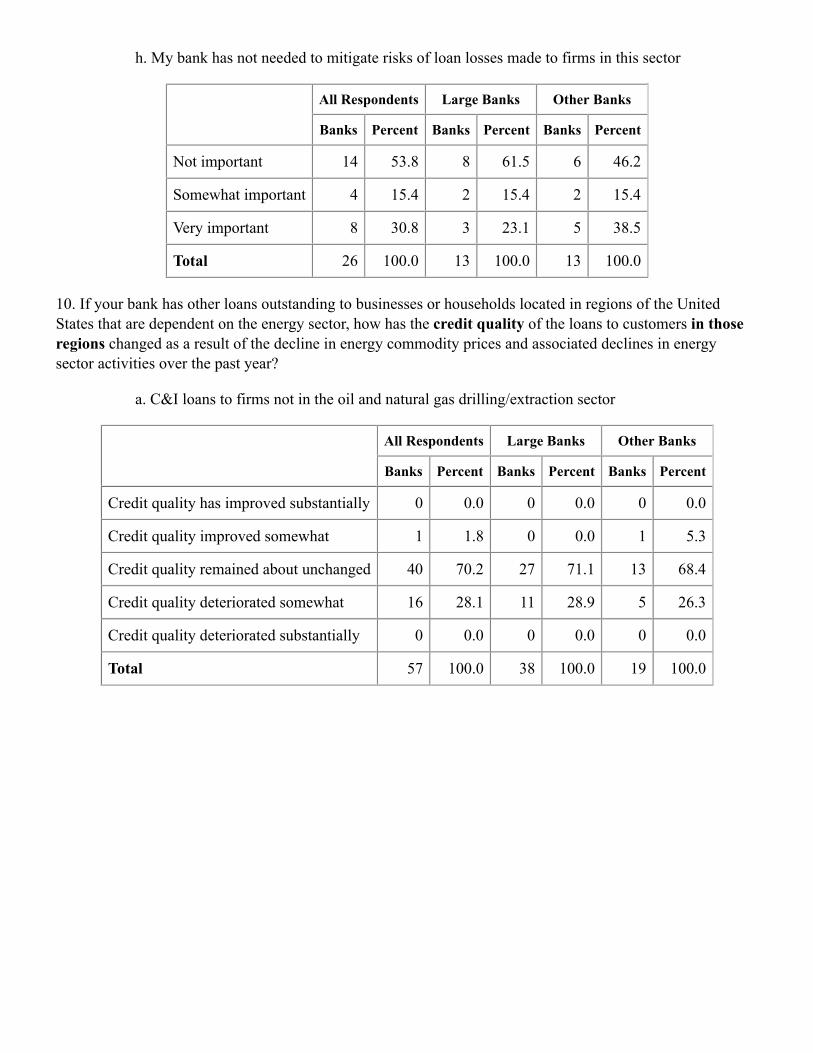
h. My bank has not needed to mitigate risks of loan losses made to firms in this sector
All Respondents Large Banks Other Banks
Banks Percent Banks Percent Banks Percent
Not important 14 53.8 8 61.5 6 46.2
Somewhat important 4 15.4 2 15.4 2 15.4
Very important 8 30.8 3 23.1 5 38.5
Total 26 100.0 13 100.0 13 100.0
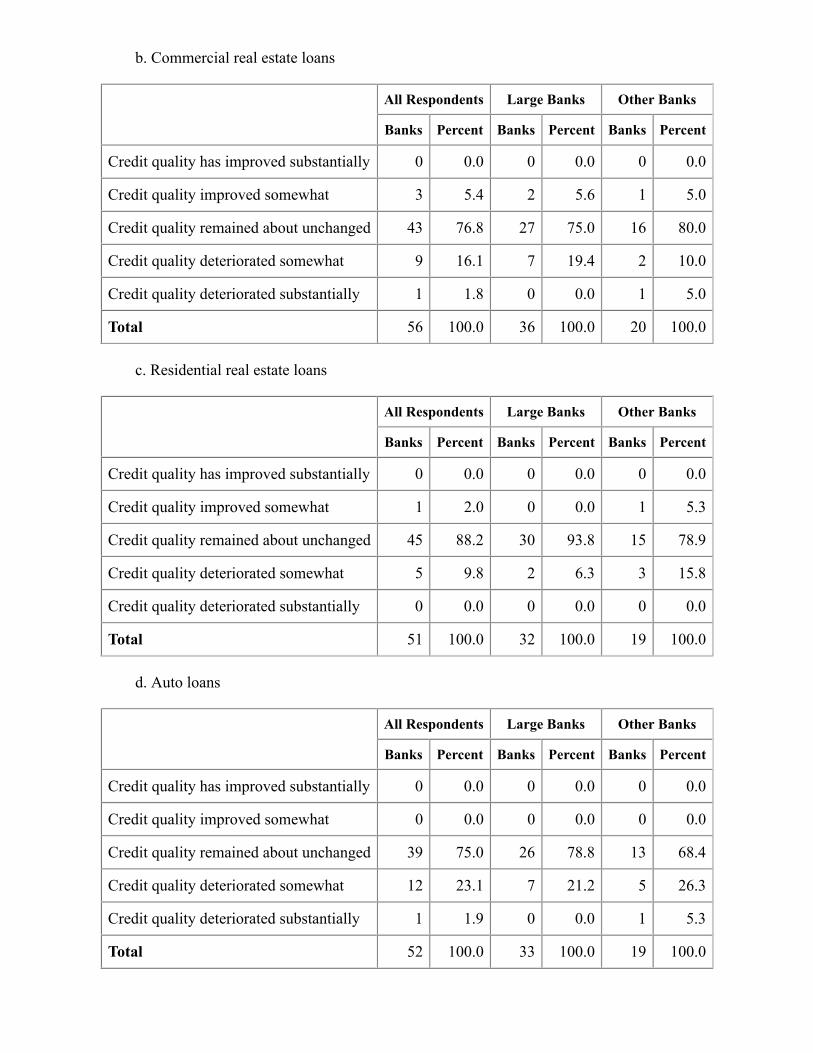
10. If your bank has other loans outstanding to businesses or households located in regions of the UnitedStates that are dependent on the energy sector, how has the credit quality of the loans to customers in thoseregions changed as a result of the decline in energy commodity prices and associated declines in energysector activities over the past year?
a. C&I loans to firms not in the oil and natural gas drilling/extraction sector
All Respondents Large Banks Other Banks
Banks Percent Banks Percent Banks Percent
Credit quality has improved substantially 0 0.0 0 0.0 0 0.0
Credit quality improved somewhat 1 1.8 0 0.0 1 5.3
Credit quality remained about unchanged 40 70.2 27 71.1 13 68.4
Credit quality deteriorated somewhat 16 28.1 11 28.9 5 26.3
Credit quality deteriorated substantially 0 0.0 0 0.0 0 0.0
Total 57 100.0 38 100.0 19 100.0
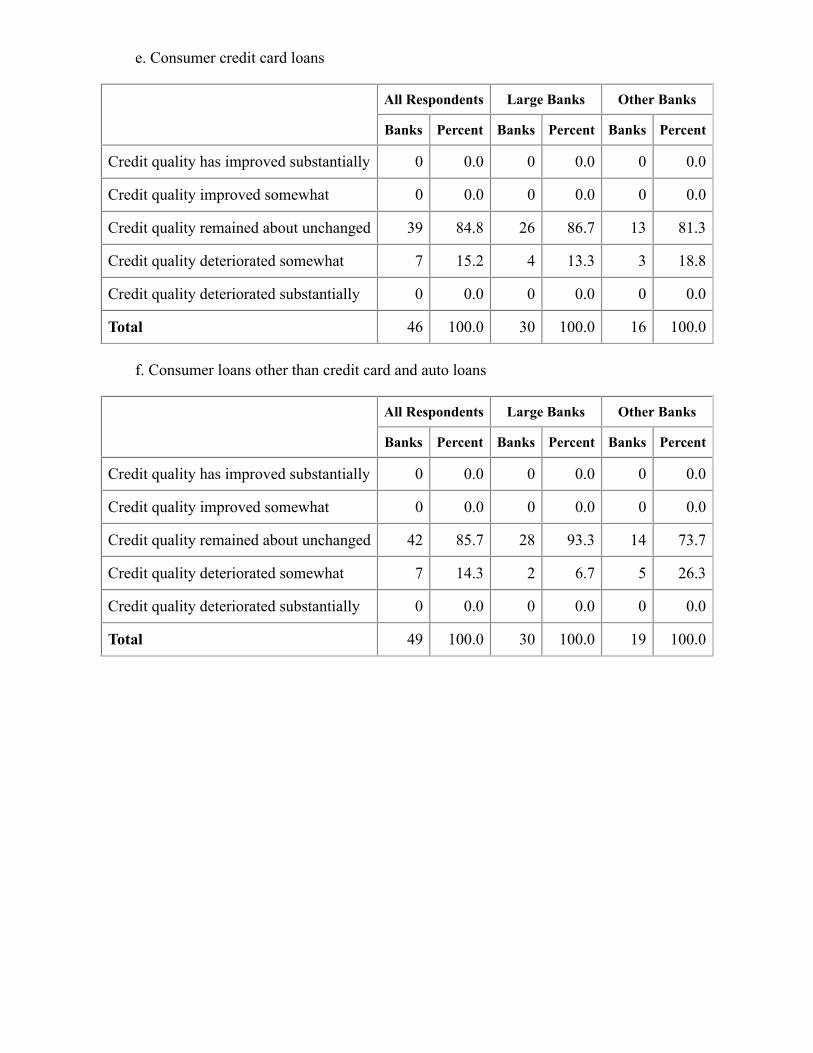
b. Commercial real estate loans
All Respondents Large Banks Other Banks
Banks Percent Banks Percent Banks Percent
Credit quality has improved substantially 0 0.0 0 0.0 0 0.0
Credit quality improved somewhat 3 5.4 2 5.6 1 5.0
Credit quality remained about unchanged 43 76.8 27 75.0 16 80.0
Credit quality deteriorated somewhat 9 16.1 7 19.4 2 10.0
Credit quality deteriorated substantially 1 1.8 0 0.0 1 5.0
Total 56 100.0 36 100.0 20 100.0
c. Residential real estate loans
All Respondents Large Banks Other Banks
Banks Percent Banks Percent Banks Percent
Credit quality has improved substantially 0 0.0 0 0.0 0 0.0
Credit quality improved somewhat 1 2.0 0 0.0 1 5.3
Credit quality remained about unchanged 45 88.2 30 93.8 15 78.9
Credit quality deteriorated somewhat 5 9.8 2 6.3 3 15.8
Credit quality deteriorated substantially 0 0.0 0 0.0 0 0.0
Total 51 100.0 32 100.0 19 100.0
d. Auto loans
All Respondents Large Banks Other Banks
Banks Percent Banks Percent Banks Percent
Credit quality has improved substantially 0 0.0 0 0.0 0 0.0
Credit quality improved somewhat 0 0.0 0 0.0 0 0.0
Credit quality remained about unchanged 39 75.0 26 78.8 13 68.4
Credit quality deteriorated somewhat 12 23.1 7 21.2 5 26.3
Credit quality deteriorated substantially 1 1.9 0 0.0 1 5.3
Total 52 100.0 33 100.0 19 100.0
e. Consumer credit card loans
All Respondents Large Banks Other Banks
Banks Percent Banks Percent Banks Percent
Credit quality has improved substantially 0 0.0 0 0.0 0 0.0
Credit quality improved somewhat 0 0.0 0 0.0 0 0.0
Credit quality remained about unchanged 39 84.8 26 86.7 13 81.3
Credit quality deteriorated somewhat 7 15.2 4 13.3 3 18.8
Credit quality deteriorated substantially 0 0.0 0 0.0 0 0.0
Total 46 100.0 30 100.0 16 100.0
f. Consumer loans other than credit card and auto loans
All Respondents Large Banks Other Banks
Banks Percent Banks Percent Banks Percent
Credit quality has improved substantially 0 0.0 0 0.0 0 0.0
Credit quality improved somewhat 0 0.0 0 0.0 0 0.0
Credit quality remained about unchanged 42 85.7 28 93.3 14 73.7
Credit quality deteriorated somewhat 7 14.3 2 6.7 5 26.3
Credit quality deteriorated substantially 0 0.0 0 0.0 0 0.0
Total 49 100.0 30 100.0 19 100.0
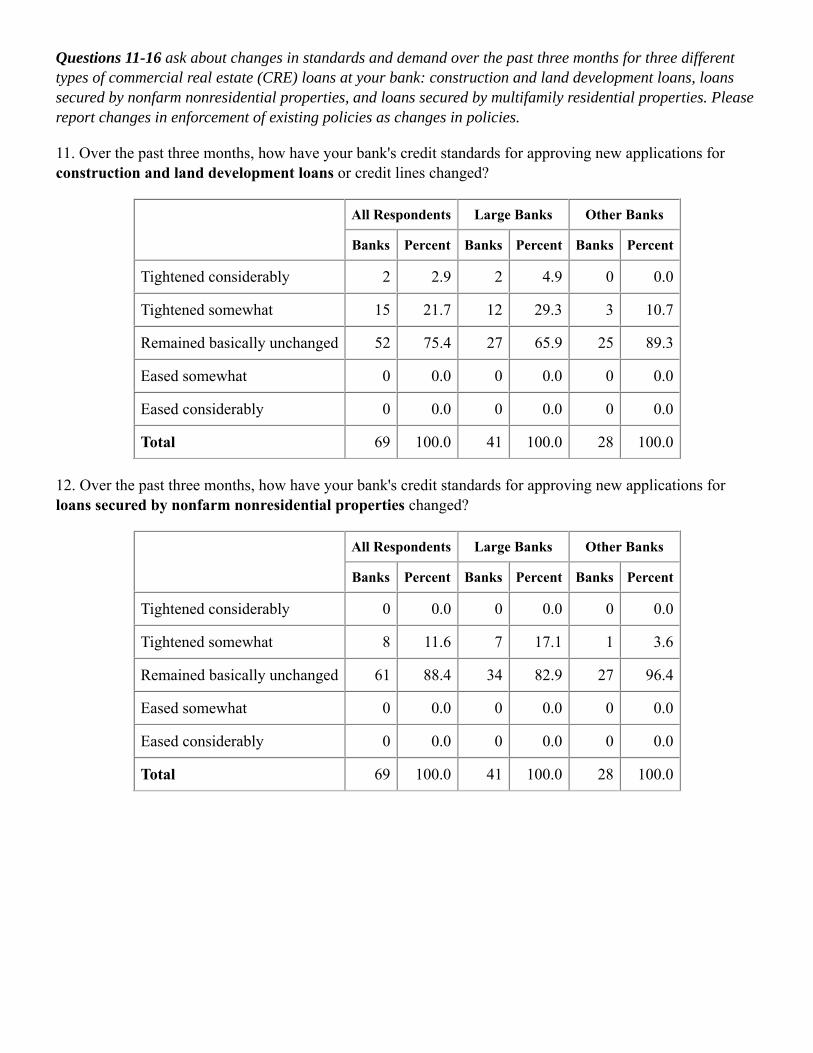
Questions 11-16 ask about changes in standards and demand over the past three months for three differenttypes of commercial real estate (CRE) loans at your bank: construction and land development loans, loanssecured by nonfarm nonresidential properties, and loans secured by multifamily residential properties. Pleasereport changes in enforcement of existing policies as changes in policies.
11. Over the past three months, how have your bank's credit standards for approving new applications forconstruction and land development loans or credit lines changed?
All Respondents Large Banks Other Banks
Banks Percent Banks Percent Banks Percent
Tightened considerably 2 2.9 2 4.9 0 0.0
Tightened somewhat 15 21.7 12 29.3 3 10.7
Remained basically unchanged 52 75.4 27 65.9 25 89.3
Eased somewhat 0 0.0 0 0.0 0 0.0
Eased considerably 0 0.0 0 0.0 0 0.0
Total 69 100.0 41 100.0 28 100.0
12. Over the past three months, how have your bank's credit standards for approving new applications forloans secured by nonfarm nonresidential properties changed?
All Respondents Large Banks Other Banks
Banks Percent Banks Percent Banks Percent
Tightened considerably 0 0.0 0 0.0 0 0.0
Tightened somewhat 8 11.6 7 17.1 1 3.6
Remained basically unchanged 61 88.4 34 82.9 27 96.4
Eased somewhat 0 0.0 0 0.0 0 0.0
Eased considerably 0 0.0 0 0.0 0 0.0
Total 69 100.0 41 100.0 28 100.0
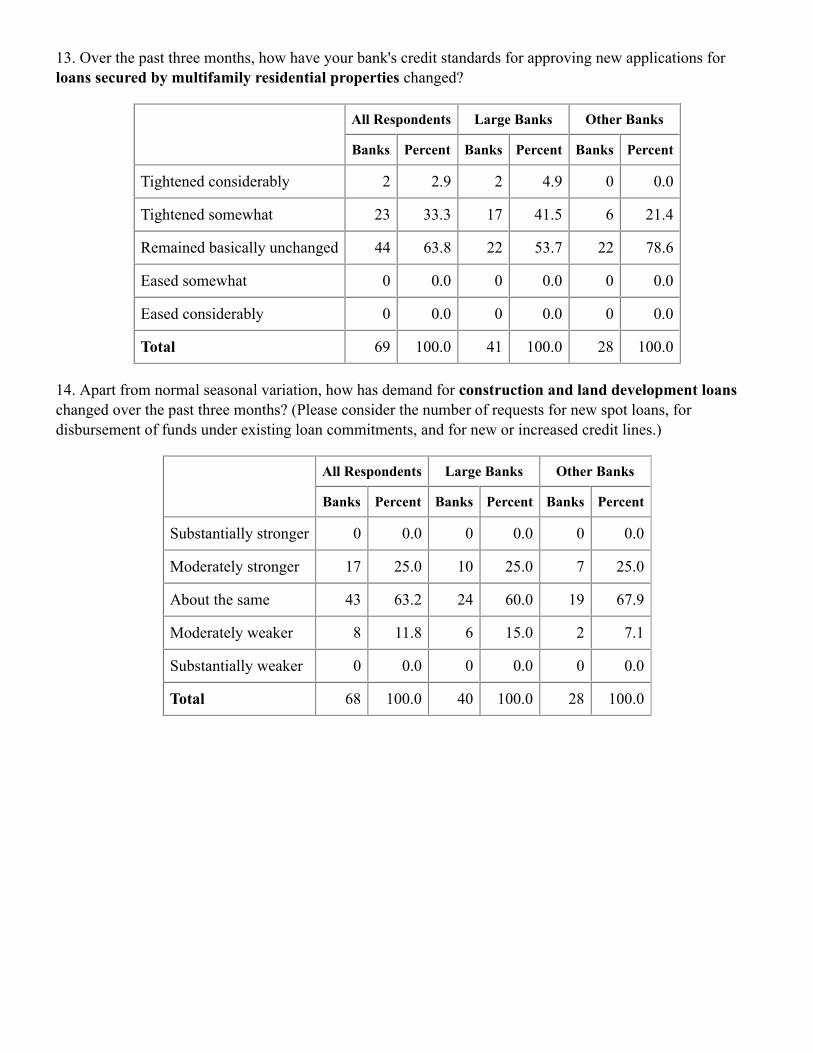
13. Over the past three months, how have your bank's credit standards for approving new applications forloans secured by multifamily residential properties changed?
All Respondents Large Banks Other Banks
Banks Percent Banks Percent Banks Percent
Tightened considerably 2 2.9 2 4.9 0 0.0
Tightened somewhat 23 33.3 17 41.5 6 21.4
Remained basically unchanged 44 63.8 22 53.7 22 78.6
Eased somewhat 0 0.0 0 0.0 0 0.0
Eased considerably 0 0.0 0 0.0 0 0.0
Total 69 100.0 41 100.0 28 100.0
14. Apart from normal seasonal variation, how has demand for construction and land development loanschanged over the past three months? (Please consider the number of requests for new spot loans, fordisbursement of funds under existing loan commitments, and for new or increased credit lines.)
All Respondents Large Banks Other Banks
Banks Percent Banks Percent Banks Percent
Substantially stronger 0 0.0 0 0.0 0 0.0
Moderately stronger 17 25.0 10 25.0 7 25.0
About the same 43 63.2 24 60.0 19 67.9
Moderately weaker 8 11.8 6 15.0 2 7.1
Substantially weaker 0 0.0 0 0.0 0 0.0
Total 68 100.0 40 100.0 28 100.0
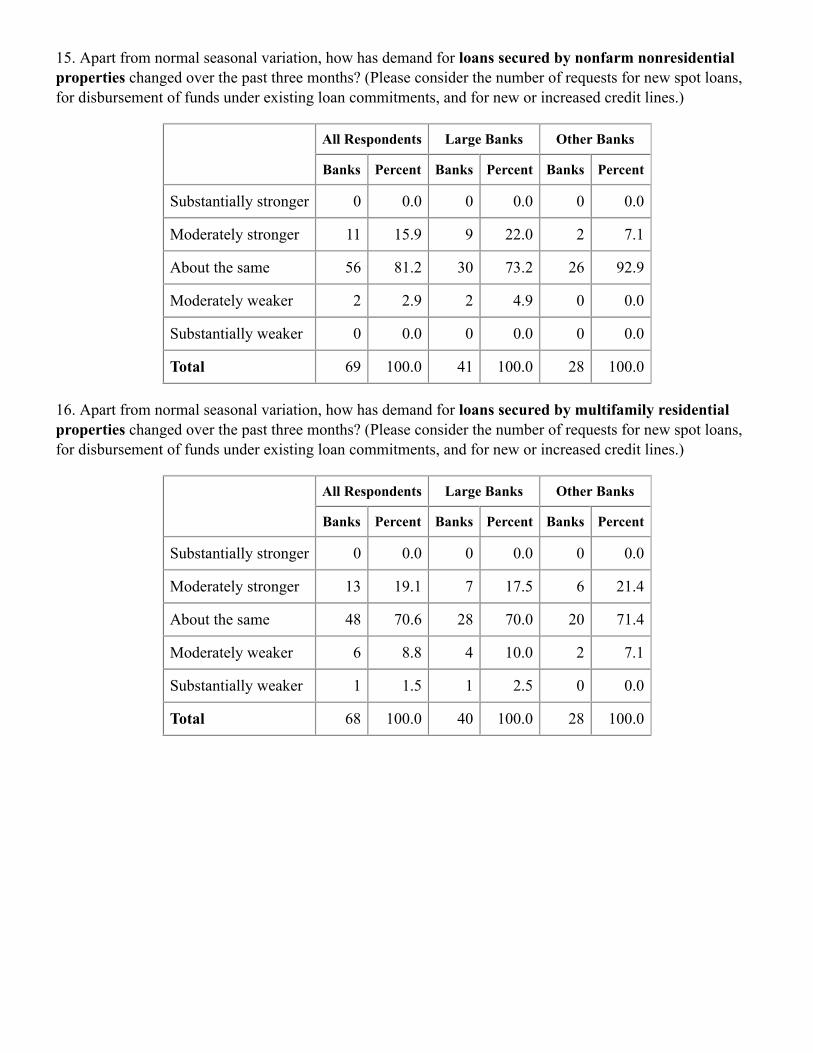
15. Apart from normal seasonal variation, how has demand for loans secured by nonfarm nonresidentialproperties changed over the past three months? (Please consider the number of requests for new spot loans,for disbursement of funds under existing loan commitments, and for new or increased credit lines.)
All Respondents Large Banks Other Banks
Banks Percent Banks Percent Banks Percent
Substantially stronger 0 0.0 0 0.0 0 0.0
Moderately stronger 11 15.9 9 22.0 2 7.1
About the same 56 81.2 30 73.2 26 92.9
Moderately weaker 2 2.9 2 4.9 0 0.0
Substantially weaker 0 0.0 0 0.0 0 0.0
Total 69 100.0 41 100.0 28 100.0
16. Apart from normal seasonal variation, how has demand for loans secured by multifamily residentialproperties changed over the past three months? (Please consider the number of requests for new spot loans,for disbursement of funds under existing loan commitments, and for new or increased credit lines.)
All Respondents Large Banks Other Banks
Banks Percent Banks Percent Banks Percent
Substantially stronger 0 0.0 0 0.0 0 0.0
Moderately stronger 13 19.1 7 17.5 6 21.4
About the same 48 70.6 28 70.0 20 71.4
Moderately weaker 6 8.8 4 10.0 2 7.1
Substantially weaker 1 1.5 1 2.5 0 0.0
Total 68 100.0 40 100.0 28 100.0
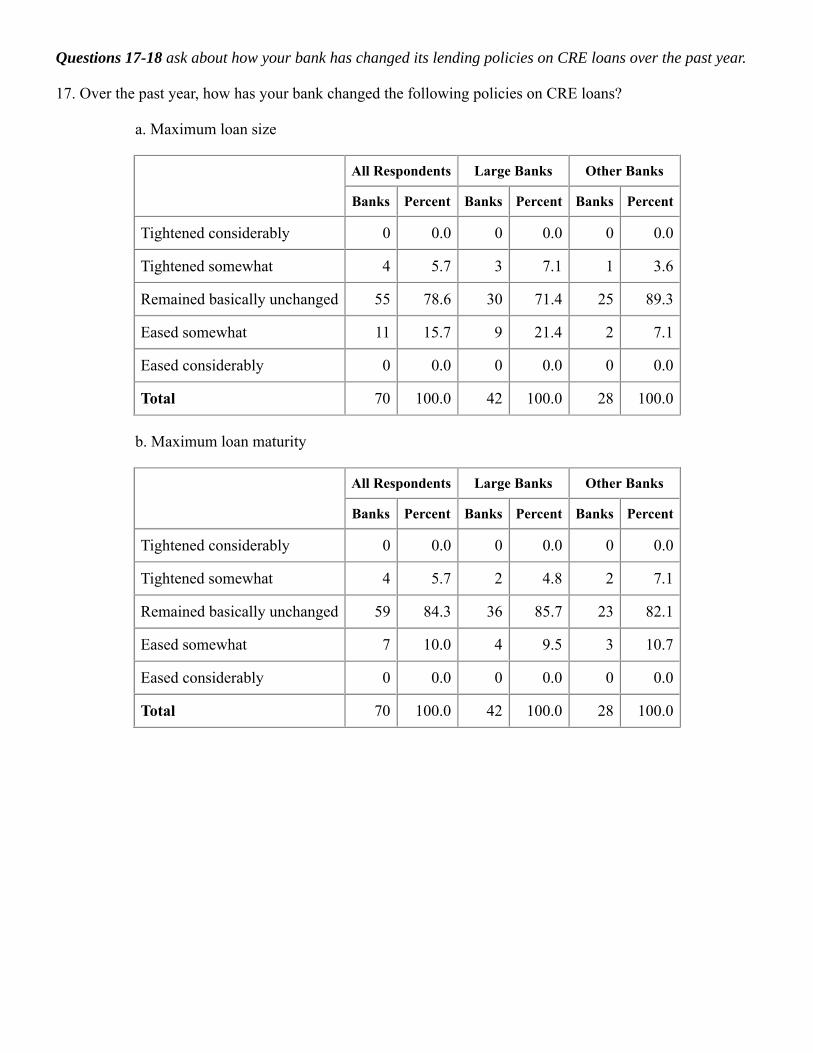
Questions 17-18 ask about how your bank has changed its lending policies on CRE loans over the past year.
17. Over the past year, how has your bank changed the following policies on CRE loans?
a. Maximum loan size
All Respondents Large Banks Other Banks
Banks Percent Banks Percent Banks Percent
Tightened considerably 0 0.0 0 0.0 0 0.0
Tightened somewhat 4 5.7 3 7.1 1 3.6
Remained basically unchanged 55 78.6 30 71.4 25 89.3
Eased somewhat 11 15.7 9 21.4 2 7.1
Eased considerably 0 0.0 0 0.0 0 0.0
Total 70 100.0 42 100.0 28 100.0
b. Maximum loan maturity
All Respondents Large Banks Other Banks
Banks Percent Banks Percent Banks Percent
Tightened considerably 0 0.0 0 0.0 0 0.0
Tightened somewhat 4 5.7 2 4.8 2 7.1
Remained basically unchanged 59 84.3 36 85.7 23 82.1
Eased somewhat 7 10.0 4 9.5 3 10.7
Eased considerably 0 0.0 0 0.0 0 0.0
Total 70 100.0 42 100.0 28 100.0
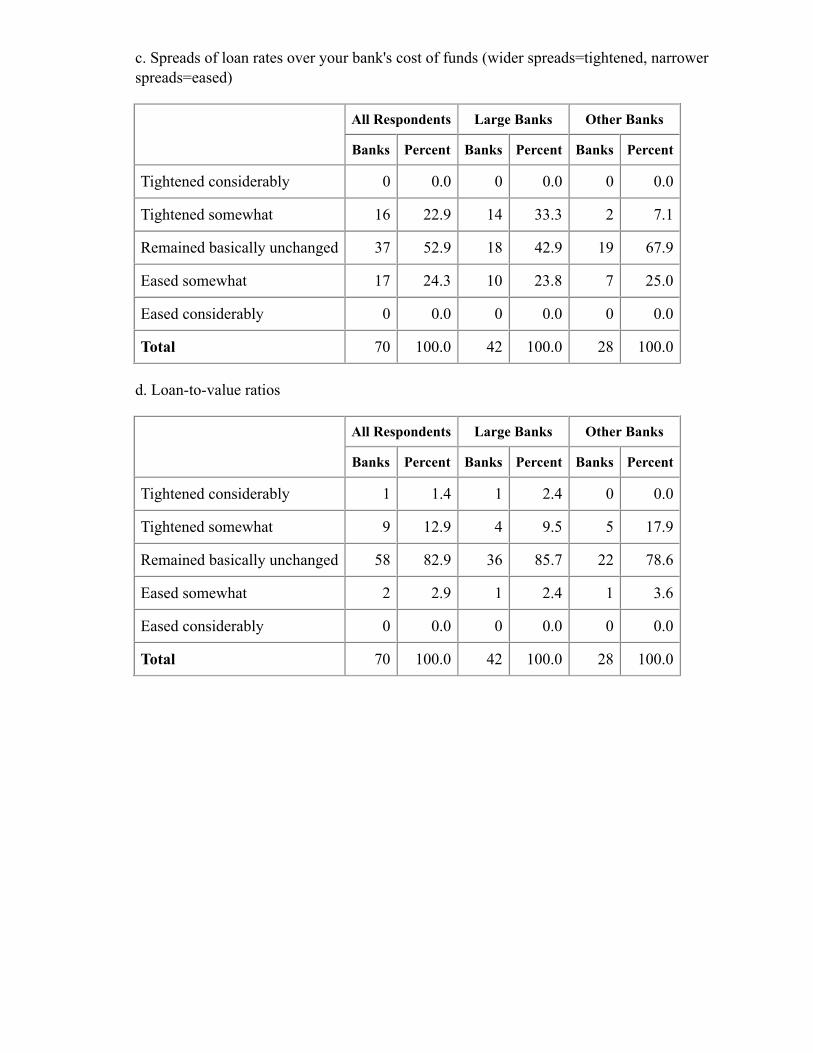
c. Spreads of loan rates over your bank's cost of funds (wider spreads=tightened, narrowerspreads=eased)
All Respondents Large Banks Other Banks
Banks Percent Banks Percent Banks Percent
Tightened considerably 0 0.0 0 0.0 0 0.0
Tightened somewhat 16 22.9 14 33.3 2 7.1
Remained basically unchanged 37 52.9 18 42.9 19 67.9
Eased somewhat 17 24.3 10 23.8 7 25.0
Eased considerably 0 0.0 0 0.0 0 0.0
Total 70 100.0 42 100.0 28 100.0
d. Loan-to-value ratios
All Respondents Large Banks Other Banks
Banks Percent Banks Percent Banks Percent
Tightened considerably 1 1.4 1 2.4 0 0.0
Tightened somewhat 9 12.9 4 9.5 5 17.9
Remained basically unchanged 58 82.9 36 85.7 22 78.6
Eased somewhat 2 2.9 1 2.4 1 3.6
Eased considerably 0 0.0 0 0.0 0 0.0
Total 70 100.0 42 100.0 28 100.0
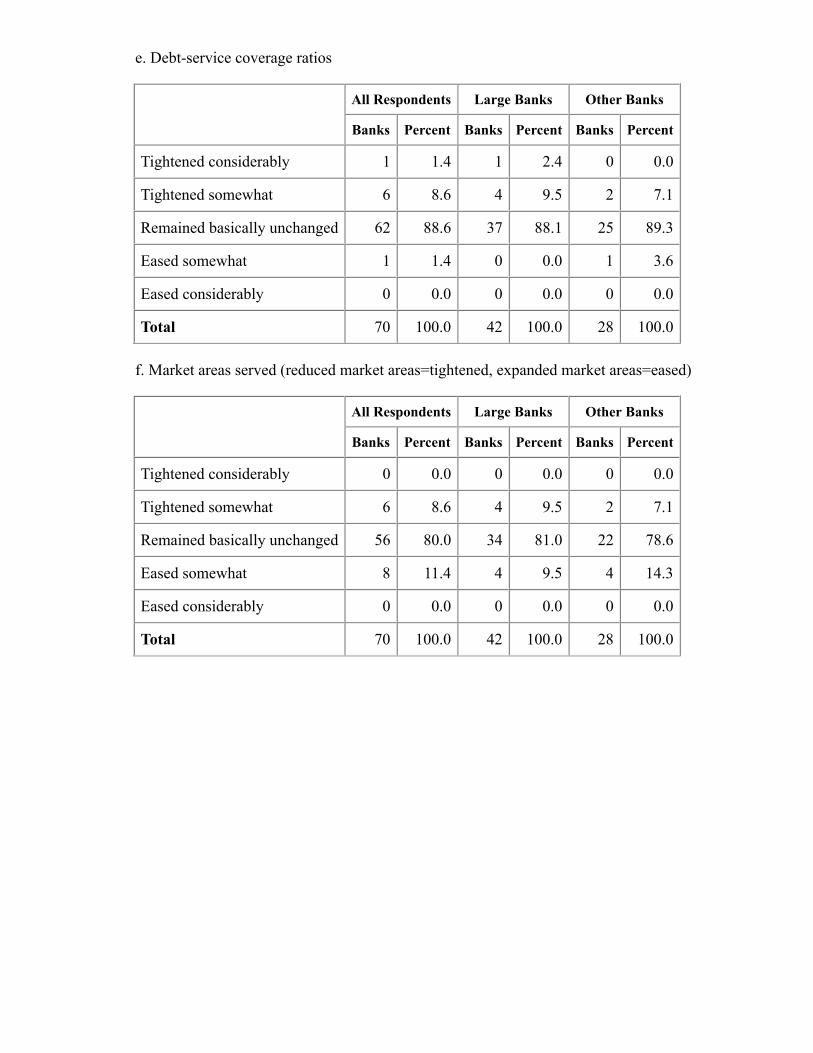
e. Debt-service coverage ratios
All Respondents Large Banks Other Banks
Banks Percent Banks Percent Banks Percent
Tightened considerably 1 1.4 1 2.4 0 0.0
Tightened somewhat 6 8.6 4 9.5 2 7.1
Remained basically unchanged 62 88.6 37 88.1 25 89.3
Eased somewhat 1 1.4 0 0.0 1 3.6
Eased considerably 0 0.0 0 0.0 0 0.0
Total 70 100.0 42 100.0 28 100.0
f. Market areas served (reduced market areas=tightened, expanded market areas=eased)
All Respondents Large Banks Other Banks
Banks Percent Banks Percent Banks Percent
Tightened considerably 0 0.0 0 0.0 0 0.0
Tightened somewhat 6 8.6 4 9.5 2 7.1
Remained basically unchanged 56 80.0 34 81.0 22 78.6
Eased somewhat 8 11.4 4 9.5 4 14.3
Eased considerably 0 0.0 0 0.0 0 0.0
Total 70 100.0 42 100.0 28 100.0
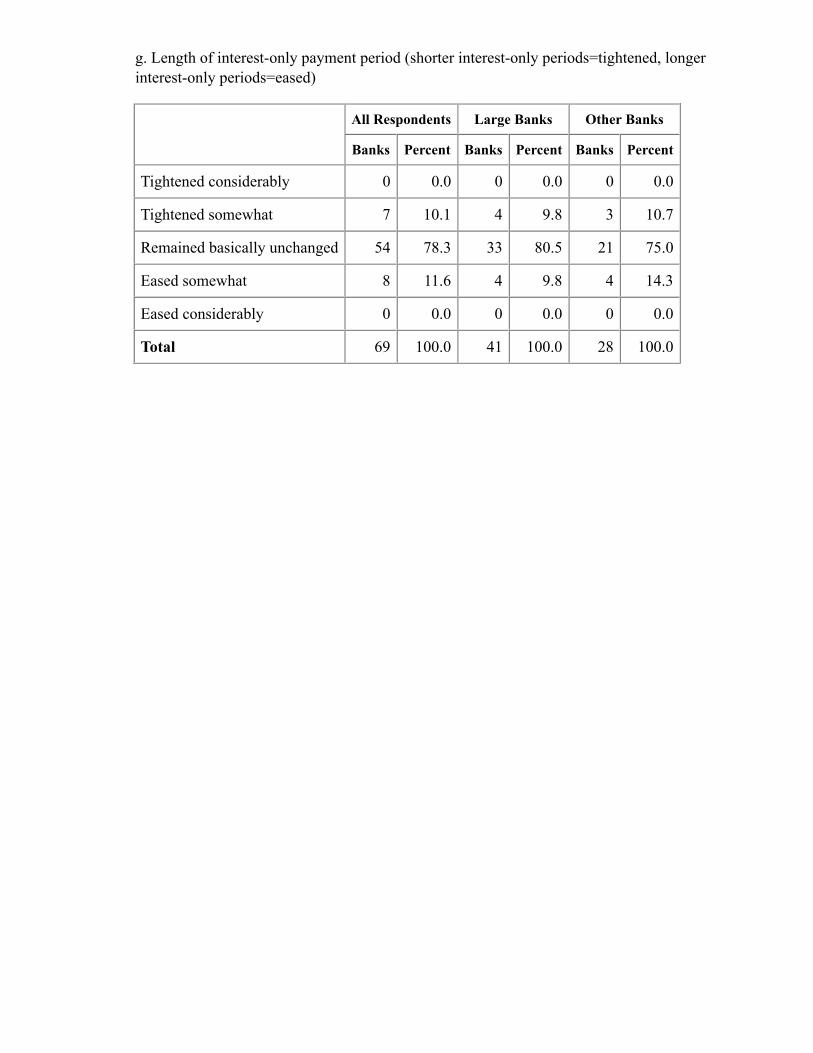
g. Length of interest-only payment period (shorter interest-only periods=tightened, longerinterest-only periods=eased)
All Respondents Large Banks Other Banks
Banks Percent Banks Percent Banks Percent
Tightened considerably 0 0.0 0 0.0 0 0.0
Tightened somewhat 7 10.1 4 9.8 3 10.7
Remained basically unchanged 54 78.3 33 80.5 21 75.0
Eased somewhat 8 11.6 4 9.8 4 14.3
Eased considerably 0 0.0 0 0.0 0 0.0
Total 69 100.0 41 100.0 28 100.0
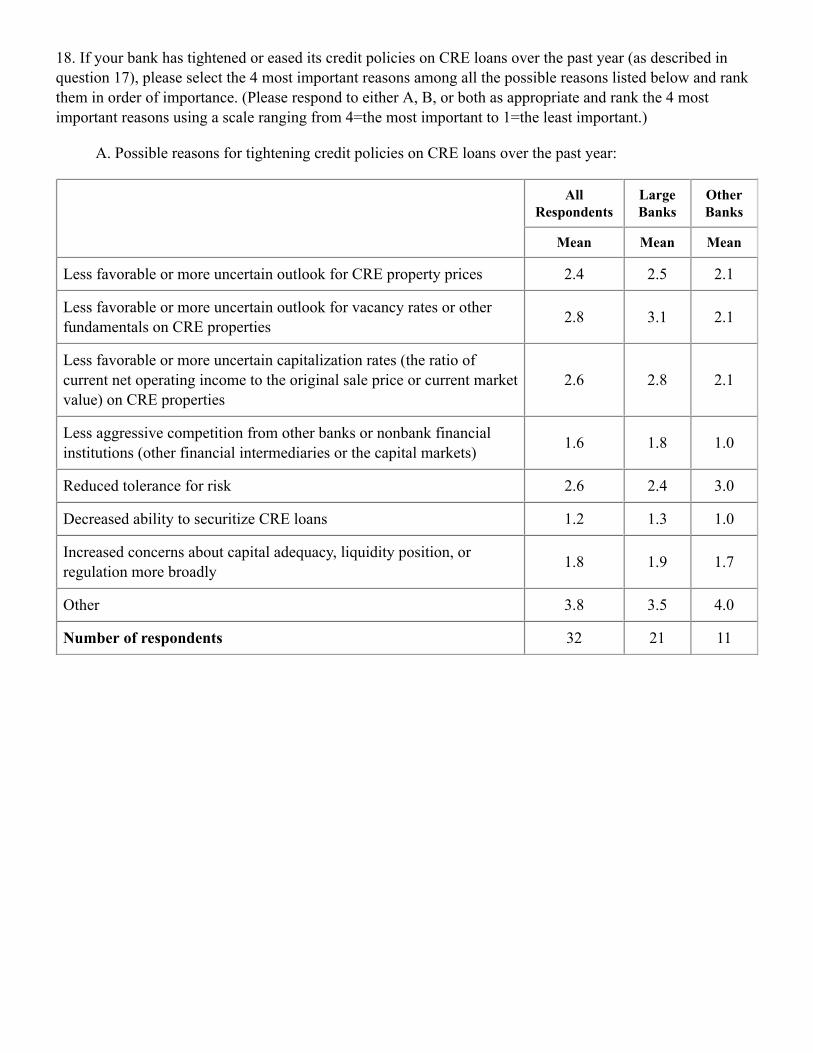
18. If your bank has tightened or eased its credit policies on CRE loans over the past year (as described inquestion 17), please select the 4 most important reasons among all the possible reasons listed below and rankthem in order of importance. (Please respond to either A, B, or both as appropriate and rank the 4 mostimportant reasons using a scale ranging from 4=the most important to 1=the least important.)
A. Possible reasons for tightening credit policies on CRE loans over the past year:
AllRespondents
LargeBanks
OtherBanks
Mean Mean Mean
Less favorable or more uncertain outlook for CRE property prices 2.4 2.5 2.1
Less favorable or more uncertain outlook for vacancy rates or otherfundamentals on CRE properties
2.8 3.1 2.1
Less favorable or more uncertain capitalization rates (the ratio ofcurrent net operating income to the original sale price or current marketvalue) on CRE properties
2.6 2.8 2.1
Less aggressive competition from other banks or nonbank financialinstitutions (other financial intermediaries or the capital markets)
1.6 1.8 1.0
Reduced tolerance for risk 2.6 2.4 3.0
Decreased ability to securitize CRE loans 1.2 1.3 1.0
Increased concerns about capital adequacy, liquidity position, orregulation more broadly
1.8 1.9 1.7
Other 3.8 3.5 4.0
Number of respondents 32 21 11
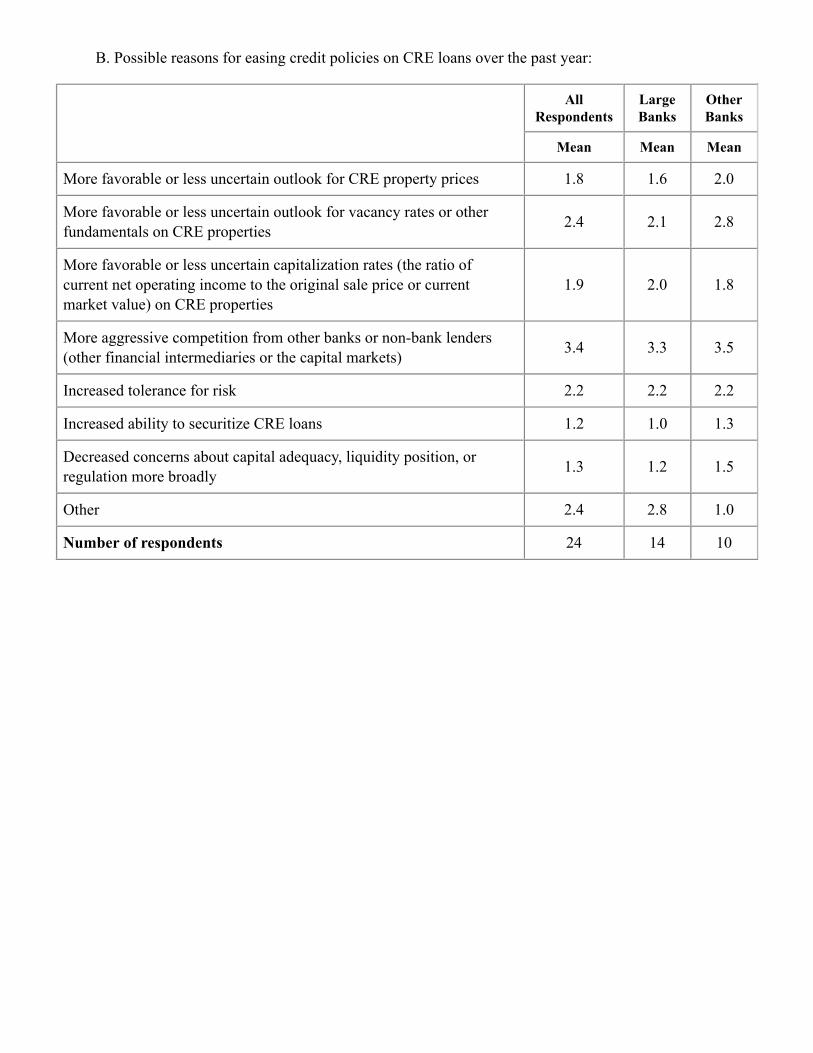
B. Possible reasons for easing credit policies on CRE loans over the past year:
AllRespondents
LargeBanks
OtherBanks
Mean Mean Mean
More favorable or less uncertain outlook for CRE property prices 1.8 1.6 2.0
More favorable or less uncertain outlook for vacancy rates or otherfundamentals on CRE properties
2.4 2.1 2.8
More favorable or less uncertain capitalization rates (the ratio ofcurrent net operating income to the original sale price or currentmarket value) on CRE properties
1.9 2.0 1.8
More aggressive competition from other banks or non-bank lenders(other financial intermediaries or the capital markets)
3.4 3.3 3.5
Increased tolerance for risk 2.2 2.2 2.2
Increased ability to securitize CRE loans 1.2 1.0 1.3
Decreased concerns about capital adequacy, liquidity position, orregulation more broadly
1.3 1.2 1.5
Other 2.4 2.8 1.0
Number of respondents 24 14 10
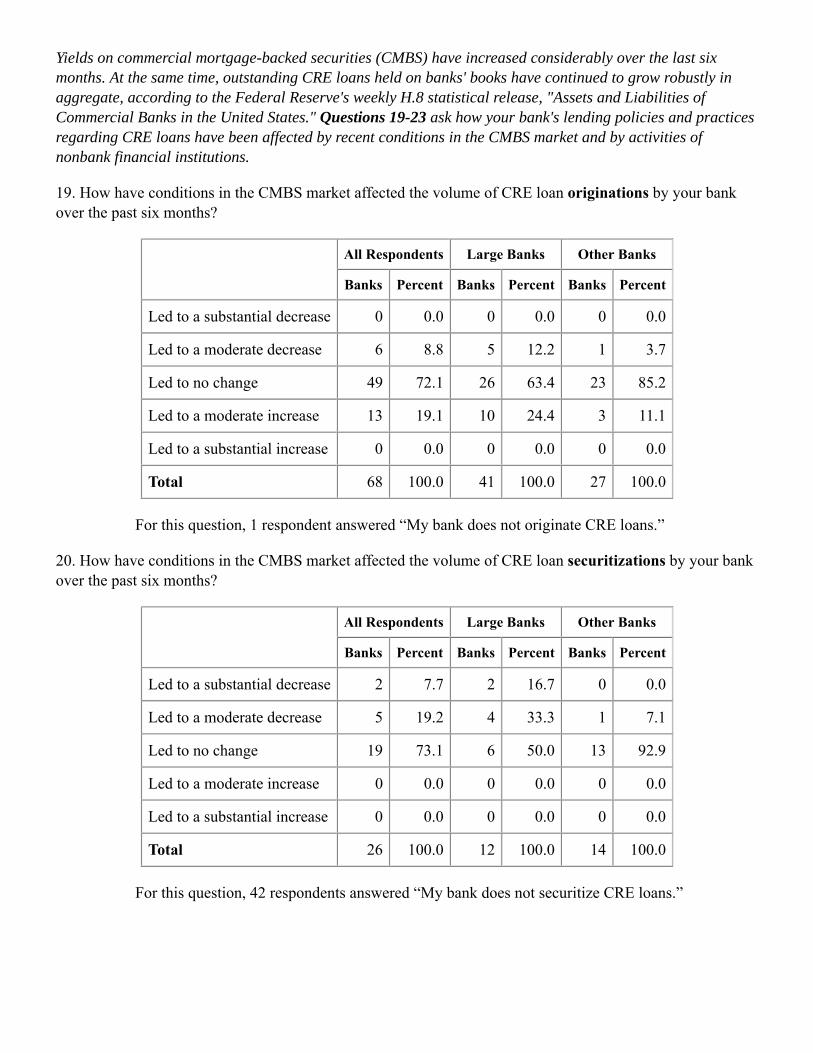
Yields on commercial mortgage-backed securities (CMBS) have increased considerably over the last sixmonths. At the same time, outstanding CRE loans held on banks' books have continued to grow robustly inaggregate, according to the Federal Reserve's weekly H.8 statistical release, "Assets and Liabilities ofCommercial Banks in the United States." Questions 19-23 ask how your bank's lending policies and practicesregarding CRE loans have been affected by recent conditions in the CMBS market and by activities ofnonbank financial institutions.
19. How have conditions in the CMBS market affected the volume of CRE loan originations by your bankover the past six months?
All Respondents Large Banks Other Banks
Banks Percent Banks Percent Banks Percent
Led to a substantial decrease 0 0.0 0 0.0 0 0.0
Led to a moderate decrease 6 8.8 5 12.2 1 3.7
Led to no change 49 72.1 26 63.4 23 85.2
Led to a moderate increase 13 19.1 10 24.4 3 11.1
Led to a substantial increase 0 0.0 0 0.0 0 0.0
Total 68 100.0 41 100.0 27 100.0
For this question, 1 respondent answered “My bank does not originate CRE loans.”
20. How have conditions in the CMBS market affected the volume of CRE loan securitizations by your bankover the past six months?
All Respondents Large Banks Other Banks
Banks Percent Banks Percent Banks Percent
Led to a substantial decrease 2 7.7 2 16.7 0 0.0
Led to a moderate decrease 5 19.2 4 33.3 1 7.1
Led to no change 19 73.1 6 50.0 13 92.9
Led to a moderate increase 0 0.0 0 0.0 0 0.0
Led to a substantial increase 0 0.0 0 0.0 0 0.0
Total 26 100.0 12 100.0 14 100.0
For this question, 42 respondents answered “My bank does not securitize CRE loans.”
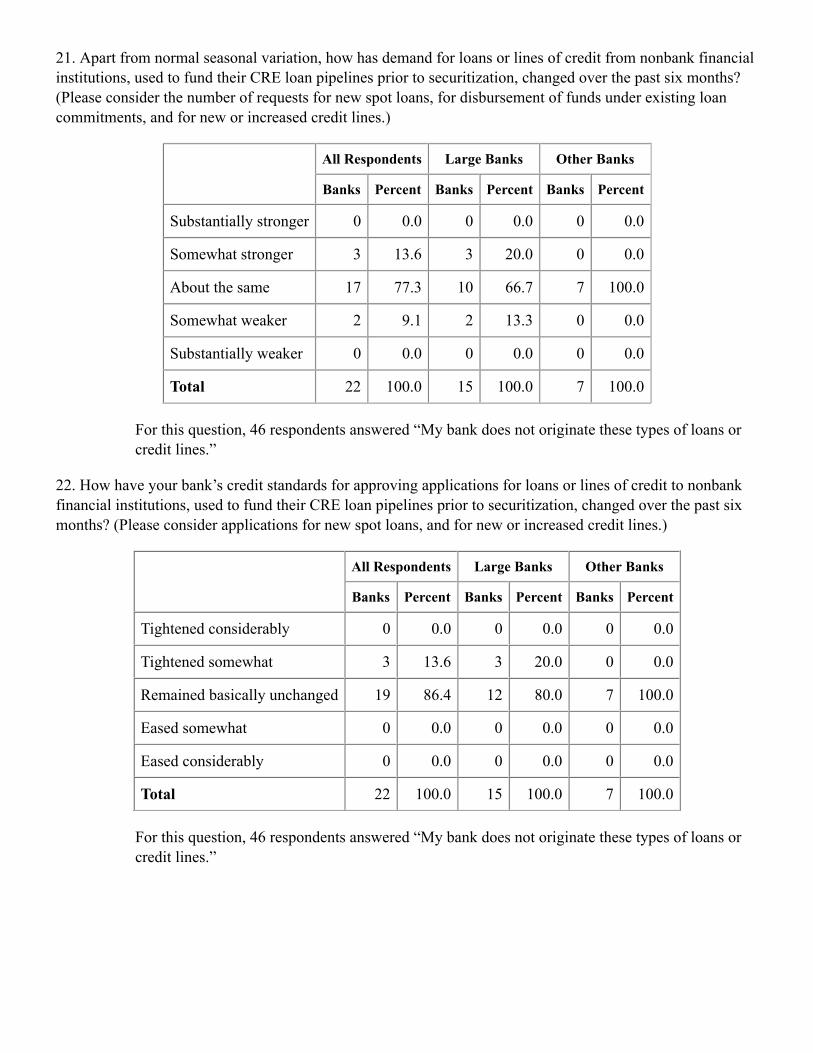
21. Apart from normal seasonal variation, how has demand for loans or lines of credit from nonbank financialinstitutions, used to fund their CRE loan pipelines prior to securitization, changed over the past six months?(Please consider the number of requests for new spot loans, for disbursement of funds under existing loancommitments, and for new or increased credit lines.)
All Respondents Large Banks Other Banks
Banks Percent Banks Percent Banks Percent
Substantially stronger 0 0.0 0 0.0 0 0.0
Somewhat stronger 3 13.6 3 20.0 0 0.0
About the same 17 77.3 10 66.7 7 100.0
Somewhat weaker 2 9.1 2 13.3 0 0.0
Substantially weaker 0 0.0 0 0.0 0 0.0
Total 22 100.0 15 100.0 7 100.0
For this question, 46 respondents answered “My bank does not originate these types of loans orcredit lines.”
22. How have your bank’s credit standards for approving applications for loans or lines of credit to nonbankfinancial institutions, used to fund their CRE loan pipelines prior to securitization, changed over the past sixmonths? (Please consider applications for new spot loans, and for new or increased credit lines.)
All Respondents Large Banks Other Banks
Banks Percent Banks Percent Banks Percent
Tightened considerably 0 0.0 0 0.0 0 0.0
Tightened somewhat 3 13.6 3 20.0 0 0.0
Remained basically unchanged 19 86.4 12 80.0 7 100.0
Eased somewhat 0 0.0 0 0.0 0 0.0
Eased considerably 0 0.0 0 0.0 0 0.0
Total 22 100.0 15 100.0 7 100.0
For this question, 46 respondents answered “My bank does not originate these types of loans orcredit lines.”
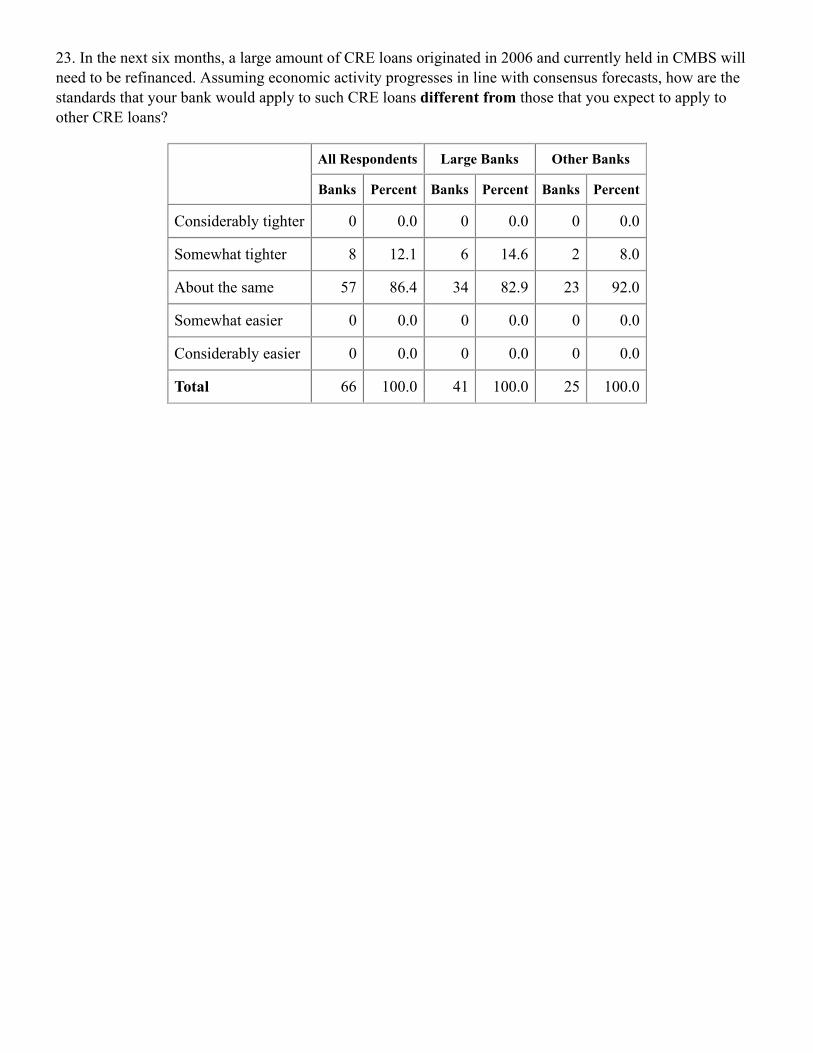
23. In the next six months, a large amount of CRE loans originated in 2006 and currently held in CMBS willneed to be refinanced. Assuming economic activity progresses in line with consensus forecasts, how are thestandards that your bank would apply to such CRE loans different from those that you expect to apply toother CRE loans?
All Respondents Large Banks Other Banks
Banks Percent Banks Percent Banks Percent
Considerably tighter 0 0.0 0 0.0 0 0.0
Somewhat tighter 8 12.1 6 14.6 2 8.0
About the same 57 86.4 34 82.9 23 92.0
Somewhat easier 0 0.0 0 0.0 0 0.0
Considerably easier 0 0.0 0 0.0 0 0.0
Total 66 100.0 41 100.0 25 100.0
Note: Beginning with the January 2015 survey, the loan categories referred to in the questions regardingchanges in credit standards and demand for residential mortgage loans have been revised to reflect theConsumer Financial Protection Bureau’s qualified mortgage rules.
Questions 24-25 ask about seven categories of residential mortgage loans at your bank: Government-Sponsored Enterprise eligible (GSE-eligible) residential mortgages, government residential mortgages,Qualified Mortgage non-jumbo non-GSE-eligible (QM non-jumbo, non-GSE-eligible) residential mortgages,QM jumbo residential mortgages, non-QM jumbo residential mortgages, non-QM non-jumbo residentialmortgages, and subprime residential mortgages.
For the purposes of this survey, please use the following definitions of these loan categories and includefirst-lien closed-end loans to purchase homes only. The loan categories have been defined so that everyfirst-lien closed-end residential mortgage loan used for home purchase fits into one of the following sevencategories:
The GSE-eligible category of residential mortgages includes loans that meet the underwritingguidelines, including loan limit amounts, of the GSEs - Fannie Mae and Freddie Mac.
The government category of residential mortgages includes loans that are insured by the FederalHousing Administration, guaranteed by the Department of Veterans Affairs, or originated undergovernment programs, including the U.S. Department of Agriculture home loan programs.
The QM non-jumbo, non-GSE-eligible category of residential mortgages includes loans that satisfy thestandards for a qualified mortgage and have loan balances that are below the loan limit amounts set bythe GSEs but otherwise do not meet the GSE underwriting guidelines.
The QM jumbo category of residential mortgages includes loans that satisfy the standards for aqualified mortgage but have loan balances that are above the loan limit amount set by the GSEs.
The non-QM jumbo category of residential mortgages includes loans that do not satisfy the standardsfor a qualified mortgage and have loan balances that are above the loan limit amount set by the GSEs.
The non-QM non-jumbo category of residential mortgages includes loans that do not satisfy thestandards for a qualified mortgage and have loan balances that are below the loan limit amount set bythe GSEs.(Please exclude loans classified by your bank as subprime in this category.)
The subprime category of residential mortgages includes loans classified by your bank as subprime.This category typically includes loans made to borrowers with weakened credit histories that includepayment delinquencies, charge-offs, judgements, and/or bankruptcies; reduced repayment capacity asmeasured by credit scores or debt-to-income ratios; or incomplete credit histories.
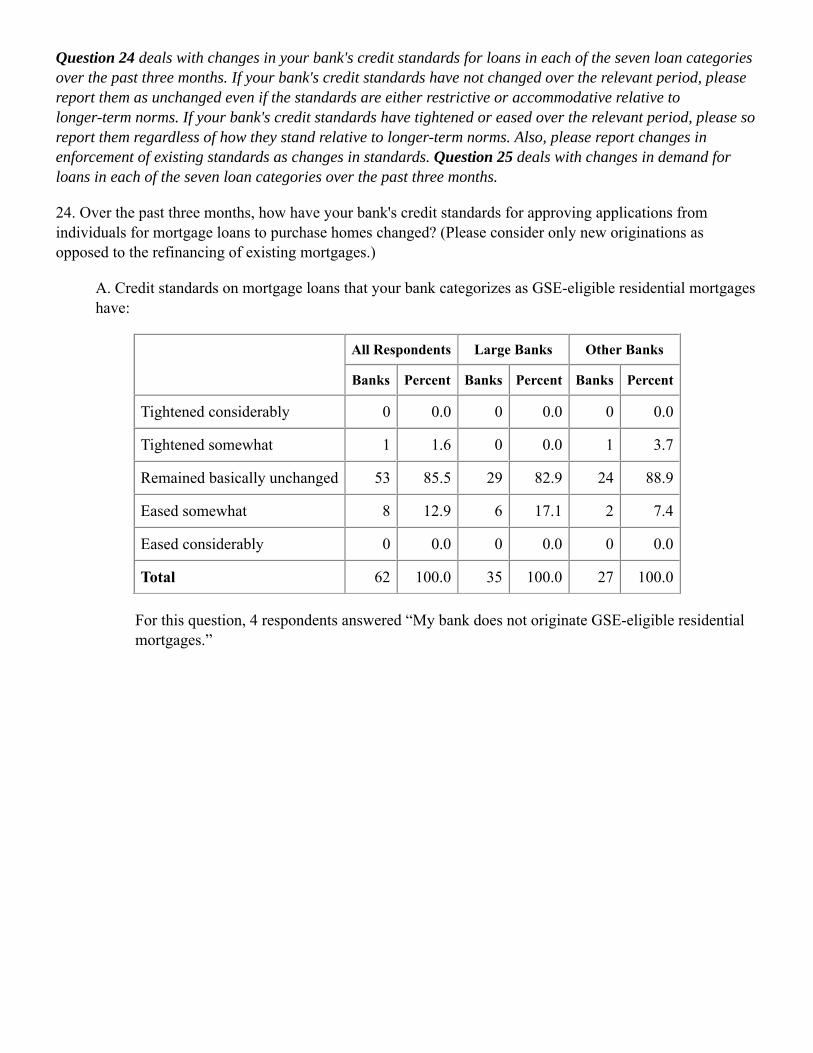
Question 24 deals with changes in your bank's credit standards for loans in each of the seven loan categoriesover the past three months. If your bank's credit standards have not changed over the relevant period, pleasereport them as unchanged even if the standards are either restrictive or accommodative relative tolonger-term norms. If your bank's credit standards have tightened or eased over the relevant period, please soreport them regardless of how they stand relative to longer-term norms. Also, please report changes inenforcement of existing standards as changes in standards. Question 25 deals with changes in demand forloans in each of the seven loan categories over the past three months.
24. Over the past three months, how have your bank's credit standards for approving applications fromindividuals for mortgage loans to purchase homes changed? (Please consider only new originations asopposed to the refinancing of existing mortgages.)
A. Credit standards on mortgage loans that your bank categorizes as GSE-eligible residential mortgageshave:
All Respondents Large Banks Other Banks
Banks Percent Banks Percent Banks Percent
Tightened considerably 0 0.0 0 0.0 0 0.0
Tightened somewhat 1 1.6 0 0.0 1 3.7
Remained basically unchanged 53 85.5 29 82.9 24 88.9
Eased somewhat 8 12.9 6 17.1 2 7.4
Eased considerably 0 0.0 0 0.0 0 0.0
Total 62 100.0 35 100.0 27 100.0
For this question, 4 respondents answered “My bank does not originate GSE-eligible residentialmortgages.”

B. Credit standards on mortgage loans that your bank categorizes as government residential mortgageshave:
All Respondents Large Banks Other Banks
Banks Percent Banks Percent Banks Percent
Tightened considerably 0 0.0 0 0.0 0 0.0
Tightened somewhat 2 3.6 0 0.0 2 8.0
Remained basically unchanged 51 92.7 29 96.7 22 88.0
Eased somewhat 2 3.6 1 3.3 1 4.0
Eased considerably 0 0.0 0 0.0 0 0.0
Total 55 100.0 30 100.0 25 100.0
For this question, 11 respondents answered “My bank does not originate government residentialmortgages.”
C. Credit standards on mortgage loans that your bank categorizes as QM non-jumbo, non-GSE-eligibleresidential mortgages have:
All Respondents Large Banks Other Banks
Banks Percent Banks Percent Banks Percent
Tightened considerably 0 0.0 0 0.0 0 0.0
Tightened somewhat 0 0.0 0 0.0 0 0.0
Remained basically unchanged 54 94.7 29 90.6 25 100.0
Eased somewhat 3 5.3 3 9.4 0 0.0
Eased considerably 0 0.0 0 0.0 0 0.0
Total 57 100.0 32 100.0 25 100.0
For this question, 9 respondents answered “My bank does not originate QM non-jumbo,non-GSE-eligible residential mortgages.”
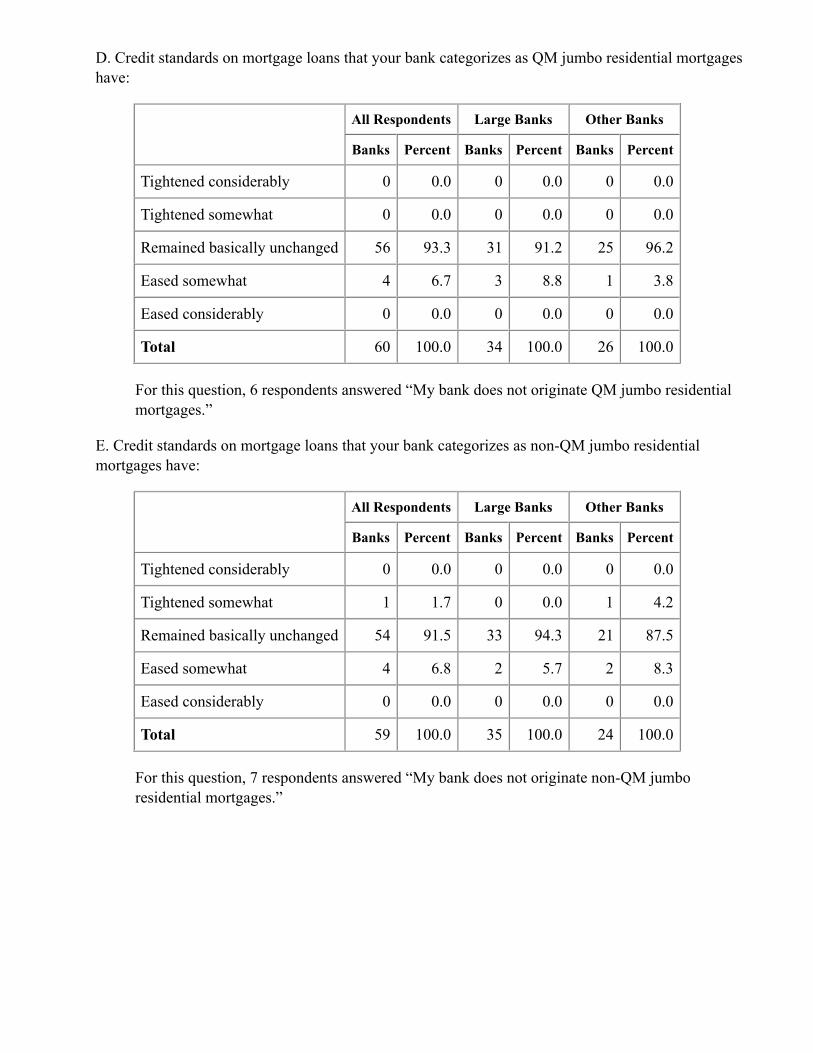
D. Credit standards on mortgage loans that your bank categorizes as QM jumbo residential mortgageshave:
All Respondents Large Banks Other Banks
Banks Percent Banks Percent Banks Percent
Tightened considerably 0 0.0 0 0.0 0 0.0
Tightened somewhat 0 0.0 0 0.0 0 0.0
Remained basically unchanged 56 93.3 31 91.2 25 96.2
Eased somewhat 4 6.7 3 8.8 1 3.8
Eased considerably 0 0.0 0 0.0 0 0.0
Total 60 100.0 34 100.0 26 100.0
For this question, 6 respondents answered “My bank does not originate QM jumbo residentialmortgages.”
E. Credit standards on mortgage loans that your bank categorizes as non-QM jumbo residentialmortgages have:
All Respondents Large Banks Other Banks
Banks Percent Banks Percent Banks Percent
Tightened considerably 0 0.0 0 0.0 0 0.0
Tightened somewhat 1 1.7 0 0.0 1 4.2
Remained basically unchanged 54 91.5 33 94.3 21 87.5
Eased somewhat 4 6.8 2 5.7 2 8.3
Eased considerably 0 0.0 0 0.0 0 0.0
Total 59 100.0 35 100.0 24 100.0
For this question, 7 respondents answered “My bank does not originate non-QM jumboresidential mortgages.”
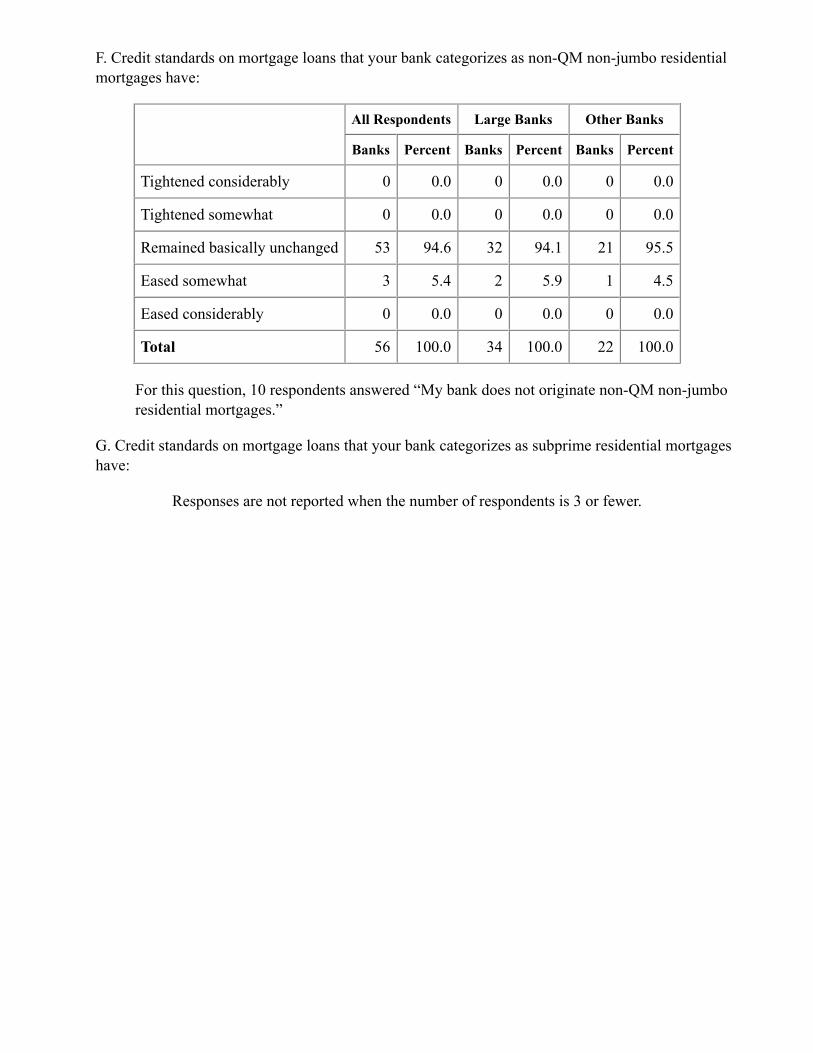
F. Credit standards on mortgage loans that your bank categorizes as non-QM non-jumbo residentialmortgages have:
All Respondents Large Banks Other Banks
Banks Percent Banks Percent Banks Percent
Tightened considerably 0 0.0 0 0.0 0 0.0
Tightened somewhat 0 0.0 0 0.0 0 0.0
Remained basically unchanged 53 94.6 32 94.1 21 95.5
Eased somewhat 3 5.4 2 5.9 1 4.5
Eased considerably 0 0.0 0 0.0 0 0.0
Total 56 100.0 34 100.0 22 100.0
For this question, 10 respondents answered “My bank does not originate non-QM non-jumboresidential mortgages.”
G. Credit standards on mortgage loans that your bank categorizes as subprime residential mortgageshave:
Responses are not reported when the number of respondents is 3 or fewer.
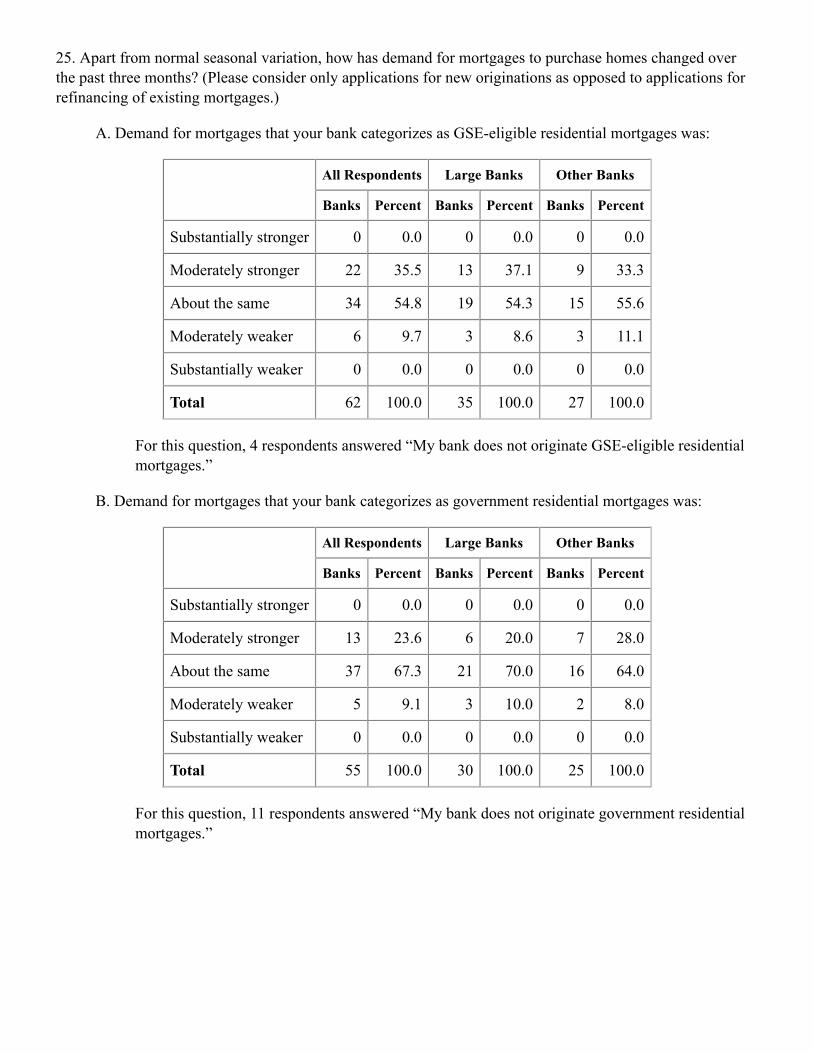
25. Apart from normal seasonal variation, how has demand for mortgages to purchase homes changed overthe past three months? (Please consider only applications for new originations as opposed to applications forrefinancing of existing mortgages.)
A. Demand for mortgages that your bank categorizes as GSE-eligible residential mortgages was:
All Respondents Large Banks Other Banks
Banks Percent Banks Percent Banks Percent
Substantially stronger 0 0.0 0 0.0 0 0.0
Moderately stronger 22 35.5 13 37.1 9 33.3
About the same 34 54.8 19 54.3 15 55.6
Moderately weaker 6 9.7 3 8.6 3 11.1
Substantially weaker 0 0.0 0 0.0 0 0.0
Total 62 100.0 35 100.0 27 100.0
For this question, 4 respondents answered “My bank does not originate GSE-eligible residentialmortgages.”
B. Demand for mortgages that your bank categorizes as government residential mortgages was:
All Respondents Large Banks Other Banks
Banks Percent Banks Percent Banks Percent
Substantially stronger 0 0.0 0 0.0 0 0.0
Moderately stronger 13 23.6 6 20.0 7 28.0
About the same 37 67.3 21 70.0 16 64.0
Moderately weaker 5 9.1 3 10.0 2 8.0
Substantially weaker 0 0.0 0 0.0 0 0.0
Total 55 100.0 30 100.0 25 100.0
For this question, 11 respondents answered “My bank does not originate government residentialmortgages.”
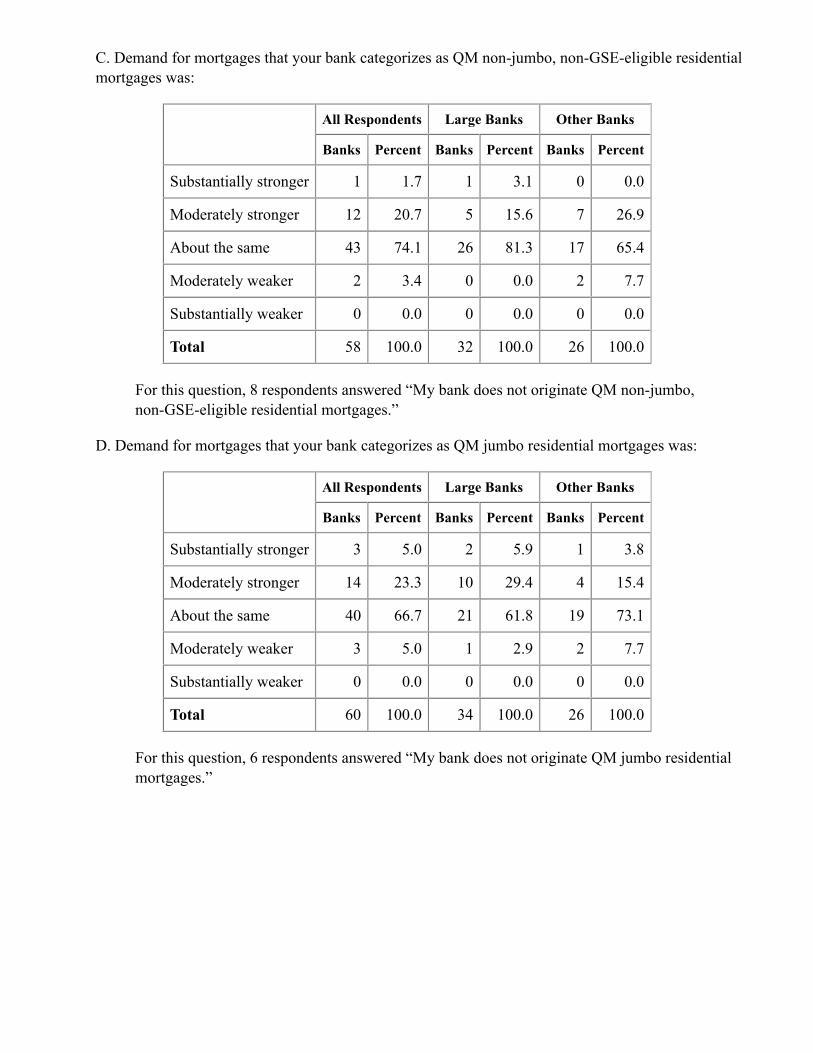
C. Demand for mortgages that your bank categorizes as QM non-jumbo, non-GSE-eligible residentialmortgages was:
All Respondents Large Banks Other Banks
Banks Percent Banks Percent Banks Percent
Substantially stronger 1 1.7 1 3.1 0 0.0
Moderately stronger 12 20.7 5 15.6 7 26.9
About the same 43 74.1 26 81.3 17 65.4
Moderately weaker 2 3.4 0 0.0 2 7.7
Substantially weaker 0 0.0 0 0.0 0 0.0
Total 58 100.0 32 100.0 26 100.0
For this question, 8 respondents answered “My bank does not originate QM non-jumbo,non-GSE-eligible residential mortgages.”
D. Demand for mortgages that your bank categorizes as QM jumbo residential mortgages was:
All Respondents Large Banks Other Banks
Banks Percent Banks Percent Banks Percent
Substantially stronger 3 5.0 2 5.9 1 3.8
Moderately stronger 14 23.3 10 29.4 4 15.4
About the same 40 66.7 21 61.8 19 73.1
Moderately weaker 3 5.0 1 2.9 2 7.7
Substantially weaker 0 0.0 0 0.0 0 0.0
Total 60 100.0 34 100.0 26 100.0
For this question, 6 respondents answered “My bank does not originate QM jumbo residentialmortgages.”
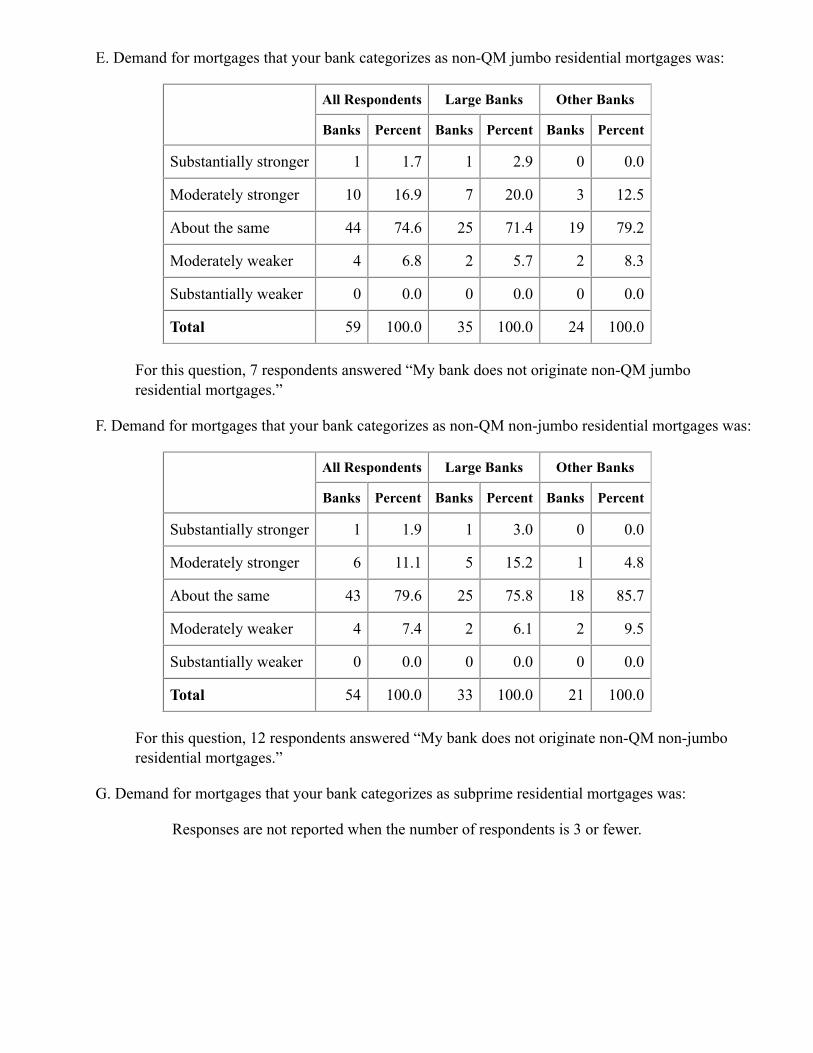
E. Demand for mortgages that your bank categorizes as non-QM jumbo residential mortgages was:
All Respondents Large Banks Other Banks
Banks Percent Banks Percent Banks Percent
Substantially stronger 1 1.7 1 2.9 0 0.0
Moderately stronger 10 16.9 7 20.0 3 12.5
About the same 44 74.6 25 71.4 19 79.2
Moderately weaker 4 6.8 2 5.7 2 8.3
Substantially weaker 0 0.0 0 0.0 0 0.0
Total 59 100.0 35 100.0 24 100.0
For this question, 7 respondents answered “My bank does not originate non-QM jumboresidential mortgages.”
F. Demand for mortgages that your bank categorizes as non-QM non-jumbo residential mortgages was:
All Respondents Large Banks Other Banks
Banks Percent Banks Percent Banks Percent
Substantially stronger 1 1.9 1 3.0 0 0.0
Moderately stronger 6 11.1 5 15.2 1 4.8
About the same 43 79.6 25 75.8 18 85.7
Moderately weaker 4 7.4 2 6.1 2 9.5
Substantially weaker 0 0.0 0 0.0 0 0.0
Total 54 100.0 33 100.0 21 100.0
For this question, 12 respondents answered “My bank does not originate non-QM non-jumboresidential mortgages.”
G. Demand for mortgages that your bank categorizes as subprime residential mortgages was:
Responses are not reported when the number of respondents is 3 or fewer.
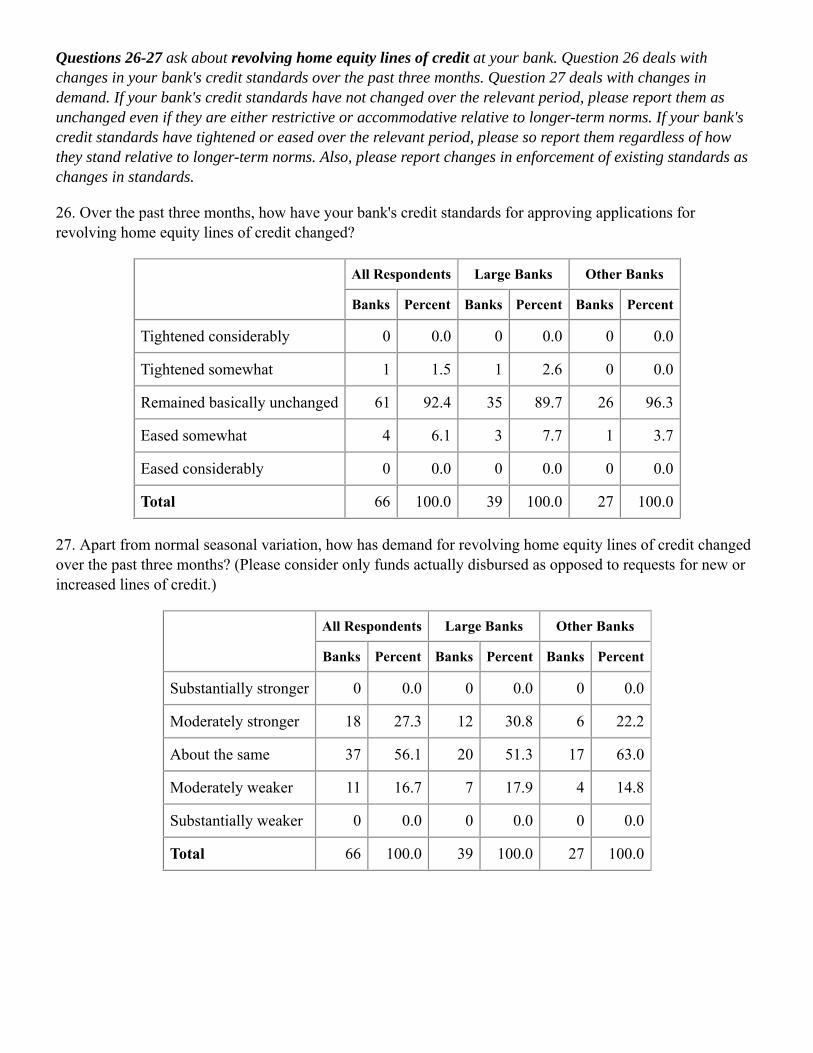
Questions 26-27 ask about revolving home equity lines of credit at your bank. Question 26 deals withchanges in your bank's credit standards over the past three months. Question 27 deals with changes indemand. If your bank's credit standards have not changed over the relevant period, please report them asunchanged even if they are either restrictive or accommodative relative to longer-term norms. If your bank'scredit standards have tightened or eased over the relevant period, please so report them regardless of howthey stand relative to longer-term norms. Also, please report changes in enforcement of existing standards aschanges in standards.
26. Over the past three months, how have your bank's credit standards for approving applications forrevolving home equity lines of credit changed?
All Respondents Large Banks Other Banks
Banks Percent Banks Percent Banks Percent
Tightened considerably 0 0.0 0 0.0 0 0.0
Tightened somewhat 1 1.5 1 2.6 0 0.0
Remained basically unchanged 61 92.4 35 89.7 26 96.3
Eased somewhat 4 6.1 3 7.7 1 3.7
Eased considerably 0 0.0 0 0.0 0 0.0
Total 66 100.0 39 100.0 27 100.0
27. Apart from normal seasonal variation, how has demand for revolving home equity lines of credit changedover the past three months? (Please consider only funds actually disbursed as opposed to requests for new orincreased lines of credit.)
All Respondents Large Banks Other Banks
Banks Percent Banks Percent Banks Percent
Substantially stronger 0 0.0 0 0.0 0 0.0
Moderately stronger 18 27.3 12 30.8 6 22.2
About the same 37 56.1 20 51.3 17 63.0
Moderately weaker 11 16.7 7 17.9 4 14.8
Substantially weaker 0 0.0 0 0.0 0 0.0
Total 66 100.0 39 100.0 27 100.0
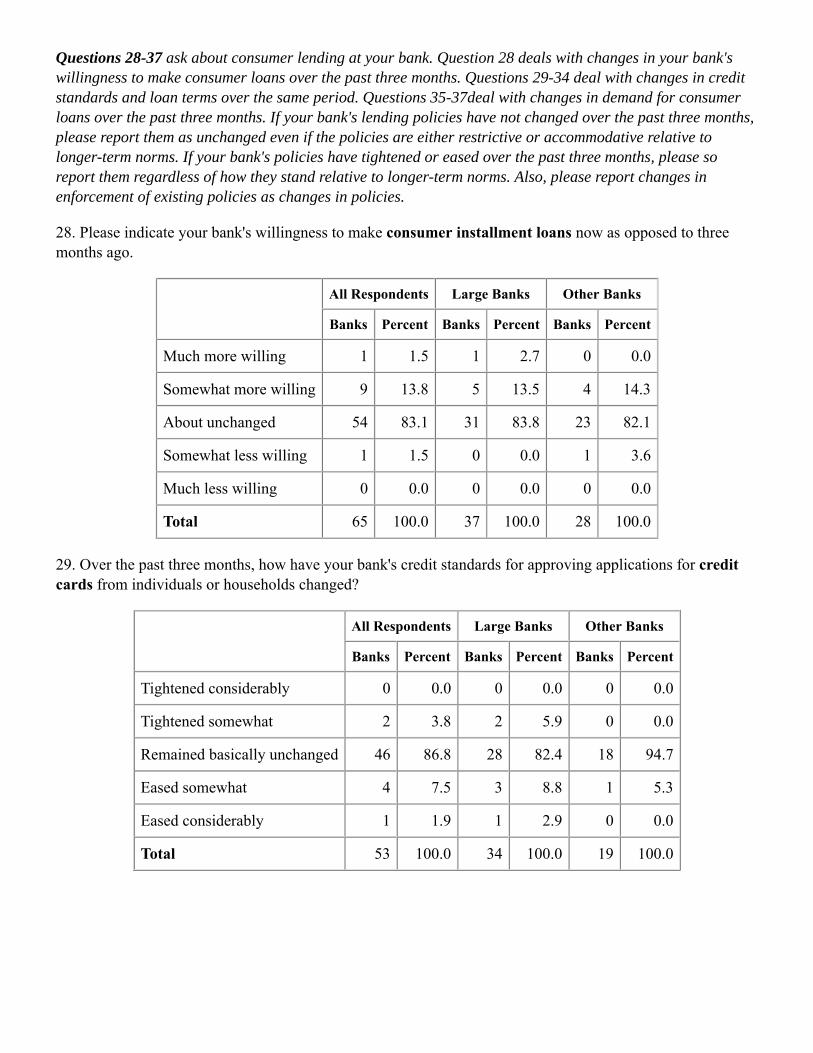
Questions 28-37 ask about consumer lending at your bank. Question 28 deals with changes in your bank'swillingness to make consumer loans over the past three months. Questions 29-34 deal with changes in creditstandards and loan terms over the same period. Questions 35-37deal with changes in demand for consumerloans over the past three months. If your bank's lending policies have not changed over the past three months,please report them as unchanged even if the policies are either restrictive or accommodative relative tolonger-term norms. If your bank's policies have tightened or eased over the past three months, please soreport them regardless of how they stand relative to longer-term norms. Also, please report changes inenforcement of existing policies as changes in policies.
28. Please indicate your bank's willingness to make consumer installment loans now as opposed to threemonths ago.
All Respondents Large Banks Other Banks
Banks Percent Banks Percent Banks Percent
Much more willing 1 1.5 1 2.7 0 0.0
Somewhat more willing 9 13.8 5 13.5 4 14.3
About unchanged 54 83.1 31 83.8 23 82.1
Somewhat less willing 1 1.5 0 0.0 1 3.6
Much less willing 0 0.0 0 0.0 0 0.0
Total 65 100.0 37 100.0 28 100.0
29. Over the past three months, how have your bank's credit standards for approving applications for creditcards from individuals or households changed?
All Respondents Large Banks Other Banks
Banks Percent Banks Percent Banks Percent
Tightened considerably 0 0.0 0 0.0 0 0.0
Tightened somewhat 2 3.8 2 5.9 0 0.0
Remained basically unchanged 46 86.8 28 82.4 18 94.7
Eased somewhat 4 7.5 3 8.8 1 5.3
Eased considerably 1 1.9 1 2.9 0 0.0
Total 53 100.0 34 100.0 19 100.0
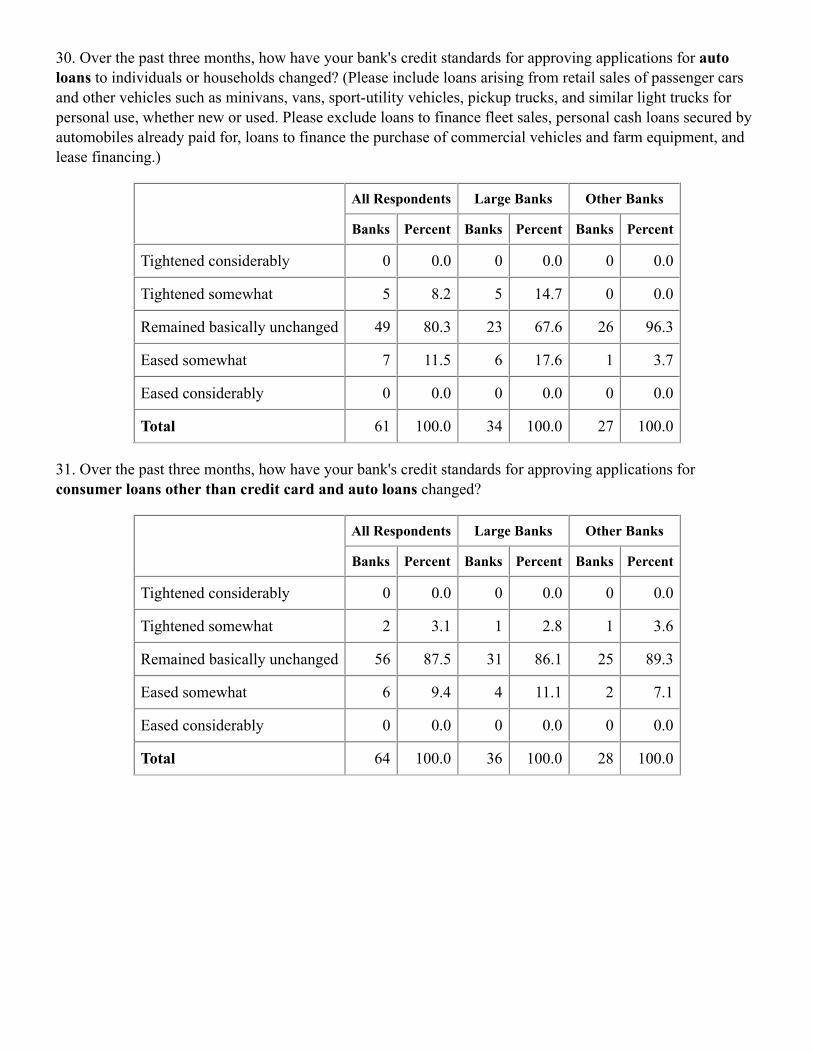
30. Over the past three months, how have your bank's credit standards for approving applications for autoloans to individuals or households changed? (Please include loans arising from retail sales of passenger carsand other vehicles such as minivans, vans, sport-utility vehicles, pickup trucks, and similar light trucks forpersonal use, whether new or used. Please exclude loans to finance fleet sales, personal cash loans secured byautomobiles already paid for, loans to finance the purchase of commercial vehicles and farm equipment, andlease financing.)
All Respondents Large Banks Other Banks
Banks Percent Banks Percent Banks Percent
Tightened considerably 0 0.0 0 0.0 0 0.0
Tightened somewhat 5 8.2 5 14.7 0 0.0
Remained basically unchanged 49 80.3 23 67.6 26 96.3
Eased somewhat 7 11.5 6 17.6 1 3.7
Eased considerably 0 0.0 0 0.0 0 0.0
Total 61 100.0 34 100.0 27 100.0
31. Over the past three months, how have your bank's credit standards for approving applications forconsumer loans other than credit card and auto loans changed?
All Respondents Large Banks Other Banks
Banks Percent Banks Percent Banks Percent
Tightened considerably 0 0.0 0 0.0 0 0.0
Tightened somewhat 2 3.1 1 2.8 1 3.6
Remained basically unchanged 56 87.5 31 86.1 25 89.3
Eased somewhat 6 9.4 4 11.1 2 7.1
Eased considerably 0 0.0 0 0.0 0 0.0
Total 64 100.0 36 100.0 28 100.0
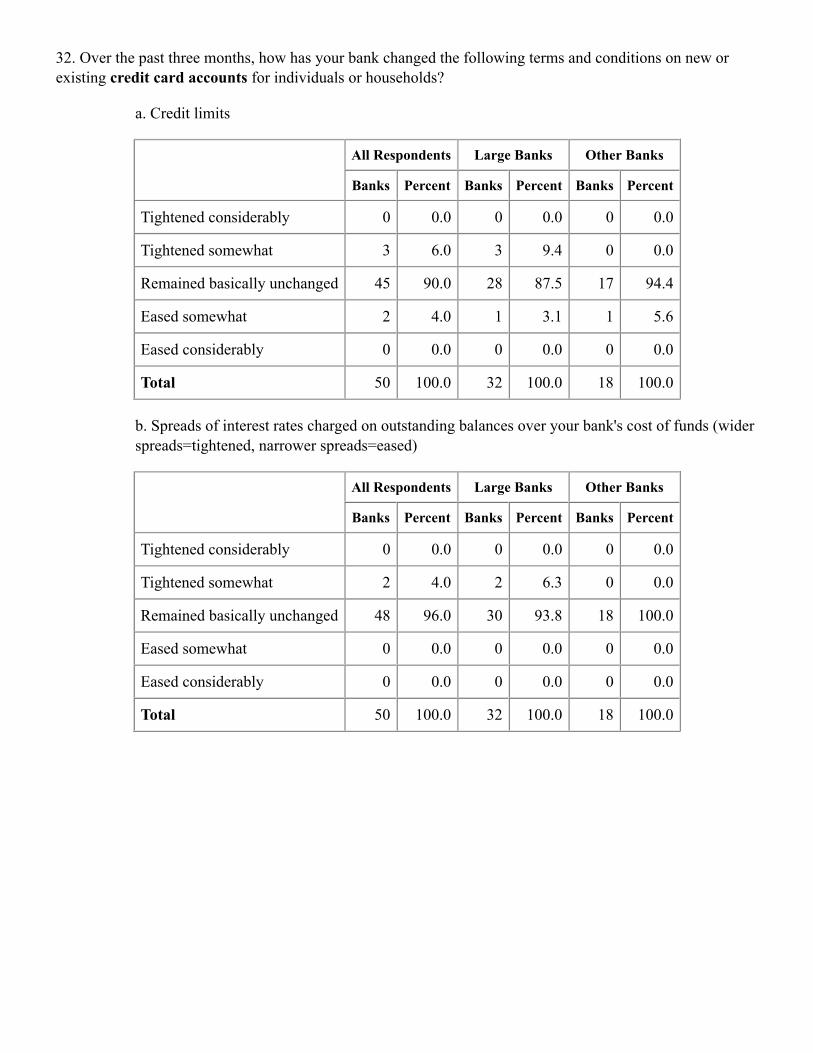
32. Over the past three months, how has your bank changed the following terms and conditions on new orexisting credit card accounts for individuals or households?
a. Credit limits
All Respondents Large Banks Other Banks
Banks Percent Banks Percent Banks Percent
Tightened considerably 0 0.0 0 0.0 0 0.0
Tightened somewhat 3 6.0 3 9.4 0 0.0
Remained basically unchanged 45 90.0 28 87.5 17 94.4
Eased somewhat 2 4.0 1 3.1 1 5.6
Eased considerably 0 0.0 0 0.0 0 0.0
Total 50 100.0 32 100.0 18 100.0
b. Spreads of interest rates charged on outstanding balances over your bank's cost of funds (widerspreads=tightened, narrower spreads=eased)
All Respondents Large Banks Other Banks
Banks Percent Banks Percent Banks Percent
Tightened considerably 0 0.0 0 0.0 0 0.0
Tightened somewhat 2 4.0 2 6.3 0 0.0
Remained basically unchanged 48 96.0 30 93.8 18 100.0
Eased somewhat 0 0.0 0 0.0 0 0.0
Eased considerably 0 0.0 0 0.0 0 0.0
Total 50 100.0 32 100.0 18 100.0
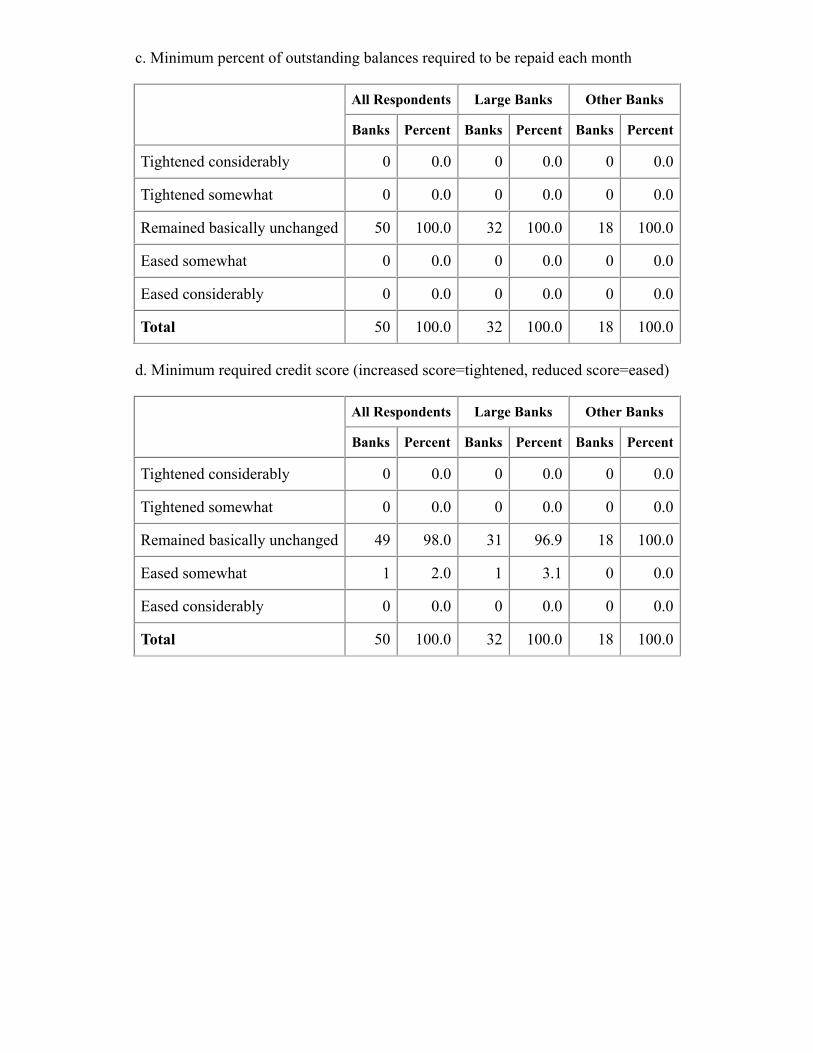
c. Minimum percent of outstanding balances required to be repaid each month
All Respondents Large Banks Other Banks
Banks Percent Banks Percent Banks Percent
Tightened considerably 0 0.0 0 0.0 0 0.0
Tightened somewhat 0 0.0 0 0.0 0 0.0
Remained basically unchanged 50 100.0 32 100.0 18 100.0
Eased somewhat 0 0.0 0 0.0 0 0.0
Eased considerably 0 0.0 0 0.0 0 0.0
Total 50 100.0 32 100.0 18 100.0
d. Minimum required credit score (increased score=tightened, reduced score=eased)
All Respondents Large Banks Other Banks
Banks Percent Banks Percent Banks Percent
Tightened considerably 0 0.0 0 0.0 0 0.0
Tightened somewhat 0 0.0 0 0.0 0 0.0
Remained basically unchanged 49 98.0 31 96.9 18 100.0
Eased somewhat 1 2.0 1 3.1 0 0.0
Eased considerably 0 0.0 0 0.0 0 0.0
Total 50 100.0 32 100.0 18 100.0
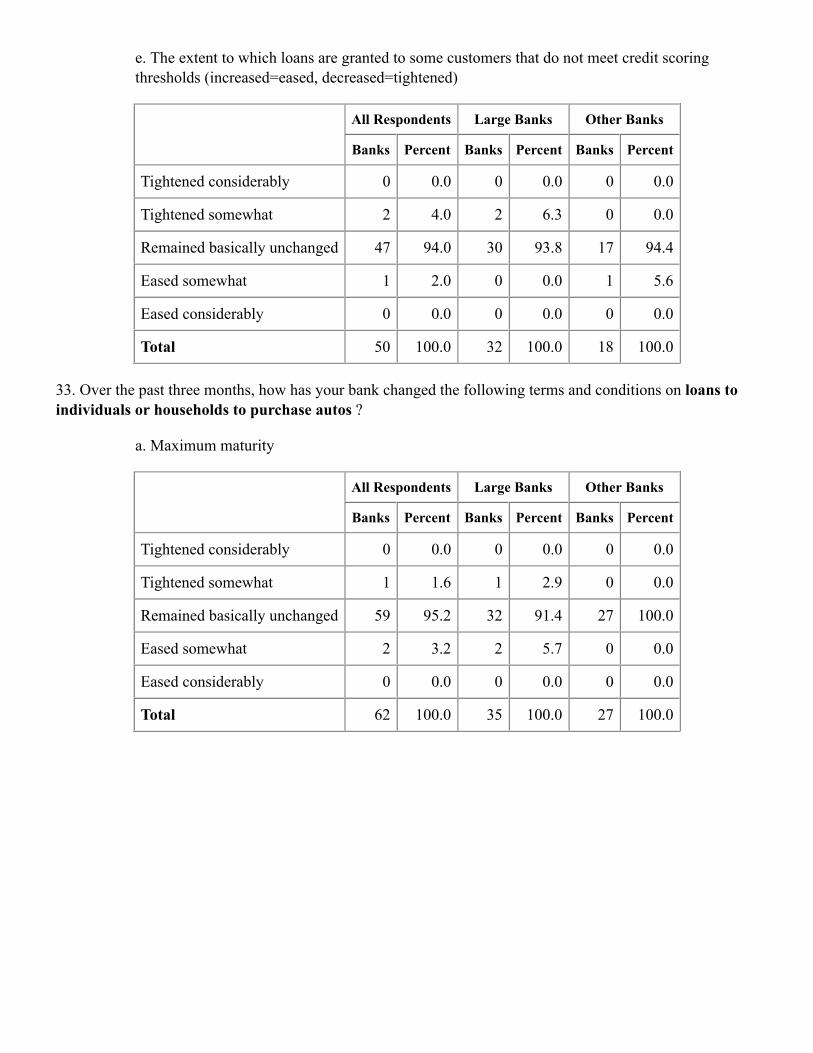
e. The extent to which loans are granted to some customers that do not meet credit scoringthresholds (increased=eased, decreased=tightened)
All Respondents Large Banks Other Banks
Banks Percent Banks Percent Banks Percent
Tightened considerably 0 0.0 0 0.0 0 0.0
Tightened somewhat 2 4.0 2 6.3 0 0.0
Remained basically unchanged 47 94.0 30 93.8 17 94.4
Eased somewhat 1 2.0 0 0.0 1 5.6
Eased considerably 0 0.0 0 0.0 0 0.0
Total 50 100.0 32 100.0 18 100.0
33. Over the past three months, how has your bank changed the following terms and conditions on loans toindividuals or households to purchase autos ?
a. Maximum maturity
All Respondents Large Banks Other Banks
Banks Percent Banks Percent Banks Percent
Tightened considerably 0 0.0 0 0.0 0 0.0
Tightened somewhat 1 1.6 1 2.9 0 0.0
Remained basically unchanged 59 95.2 32 91.4 27 100.0
Eased somewhat 2 3.2 2 5.7 0 0.0
Eased considerably 0 0.0 0 0.0 0 0.0
Total 62 100.0 35 100.0 27 100.0
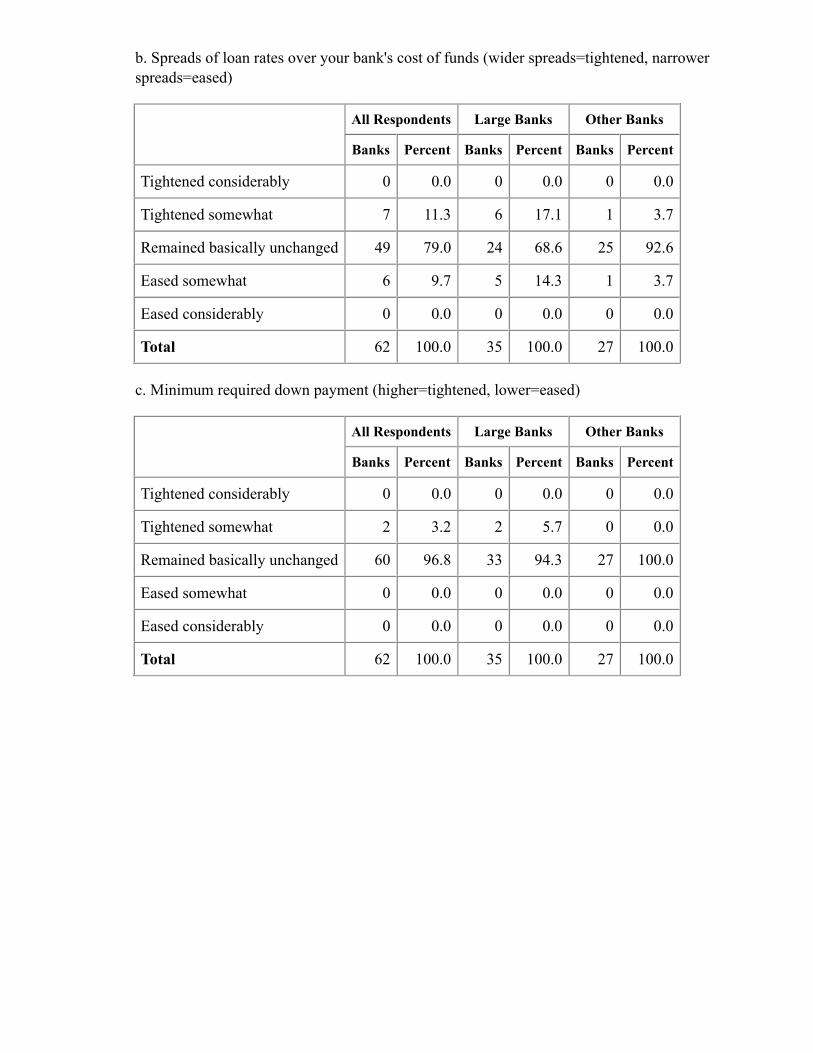
b. Spreads of loan rates over your bank's cost of funds (wider spreads=tightened, narrowerspreads=eased)
All Respondents Large Banks Other Banks
Banks Percent Banks Percent Banks Percent
Tightened considerably 0 0.0 0 0.0 0 0.0
Tightened somewhat 7 11.3 6 17.1 1 3.7
Remained basically unchanged 49 79.0 24 68.6 25 92.6
Eased somewhat 6 9.7 5 14.3 1 3.7
Eased considerably 0 0.0 0 0.0 0 0.0
Total 62 100.0 35 100.0 27 100.0
c. Minimum required down payment (higher=tightened, lower=eased)
All Respondents Large Banks Other Banks
Banks Percent Banks Percent Banks Percent
Tightened considerably 0 0.0 0 0.0 0 0.0
Tightened somewhat 2 3.2 2 5.7 0 0.0
Remained basically unchanged 60 96.8 33 94.3 27 100.0
Eased somewhat 0 0.0 0 0.0 0 0.0
Eased considerably 0 0.0 0 0.0 0 0.0
Total 62 100.0 35 100.0 27 100.0
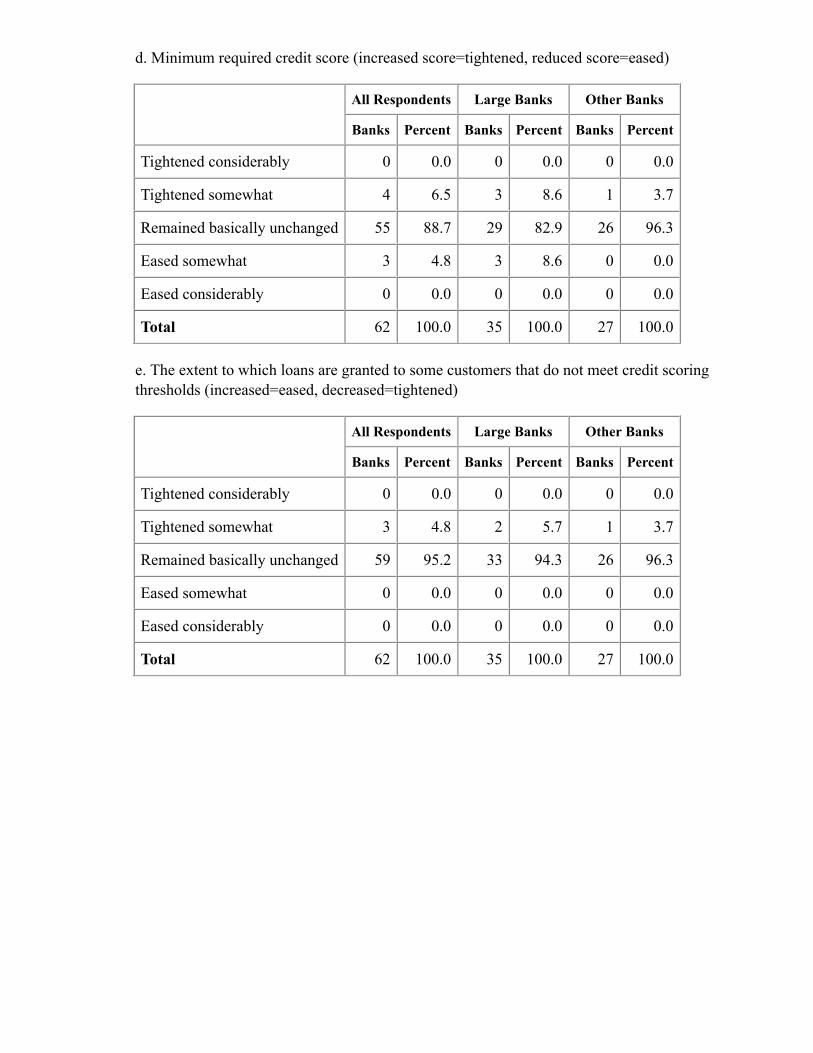
d. Minimum required credit score (increased score=tightened, reduced score=eased)
All Respondents Large Banks Other Banks
Banks Percent Banks Percent Banks Percent
Tightened considerably 0 0.0 0 0.0 0 0.0
Tightened somewhat 4 6.5 3 8.6 1 3.7
Remained basically unchanged 55 88.7 29 82.9 26 96.3
Eased somewhat 3 4.8 3 8.6 0 0.0
Eased considerably 0 0.0 0 0.0 0 0.0
Total 62 100.0 35 100.0 27 100.0
e. The extent to which loans are granted to some customers that do not meet credit scoringthresholds (increased=eased, decreased=tightened)
All Respondents Large Banks Other Banks
Banks Percent Banks Percent Banks Percent
Tightened considerably 0 0.0 0 0.0 0 0.0
Tightened somewhat 3 4.8 2 5.7 1 3.7
Remained basically unchanged 59 95.2 33 94.3 26 96.3
Eased somewhat 0 0.0 0 0.0 0 0.0
Eased considerably 0 0.0 0 0.0 0 0.0
Total 62 100.0 35 100.0 27 100.0
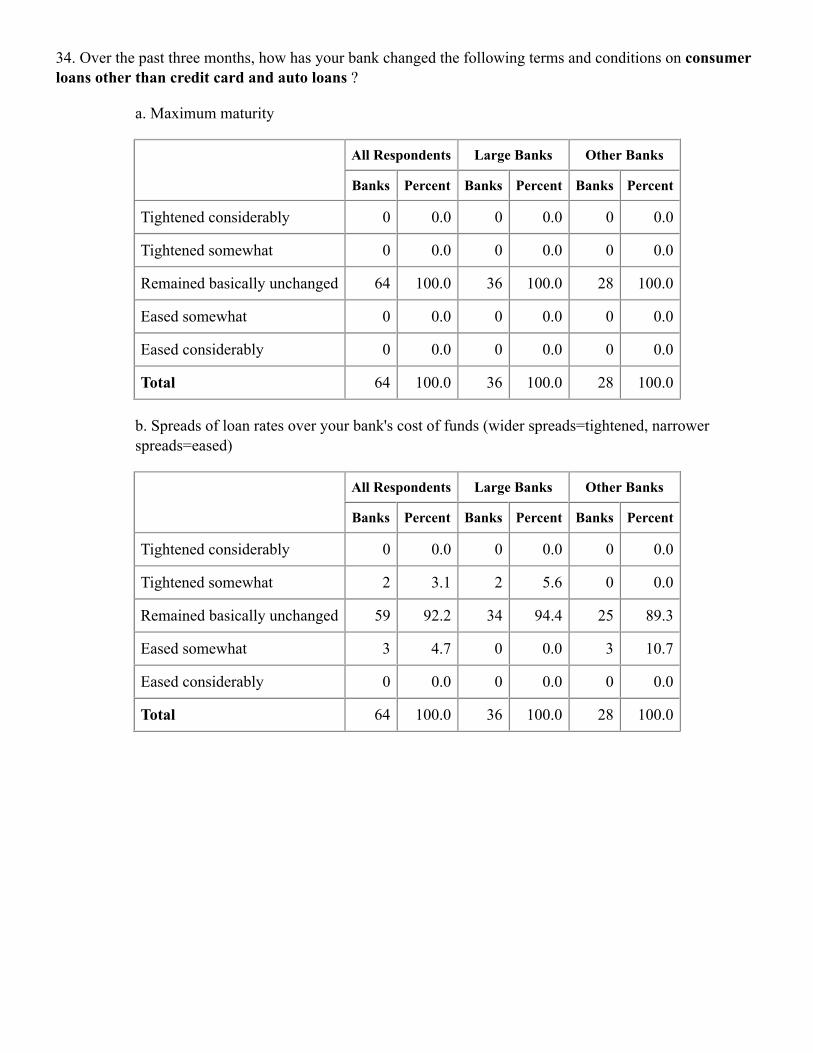
34. Over the past three months, how has your bank changed the following terms and conditions on consumerloans other than credit card and auto loans ?
a. Maximum maturity
All Respondents Large Banks Other Banks
Banks Percent Banks Percent Banks Percent
Tightened considerably 0 0.0 0 0.0 0 0.0
Tightened somewhat 0 0.0 0 0.0 0 0.0
Remained basically unchanged 64 100.0 36 100.0 28 100.0
Eased somewhat 0 0.0 0 0.0 0 0.0
Eased considerably 0 0.0 0 0.0 0 0.0
Total 64 100.0 36 100.0 28 100.0
b. Spreads of loan rates over your bank's cost of funds (wider spreads=tightened, narrowerspreads=eased)
All Respondents Large Banks Other Banks
Banks Percent Banks Percent Banks Percent
Tightened considerably 0 0.0 0 0.0 0 0.0
Tightened somewhat 2 3.1 2 5.6 0 0.0
Remained basically unchanged 59 92.2 34 94.4 25 89.3
Eased somewhat 3 4.7 0 0.0 3 10.7
Eased considerably 0 0.0 0 0.0 0 0.0
Total 64 100.0 36 100.0 28 100.0
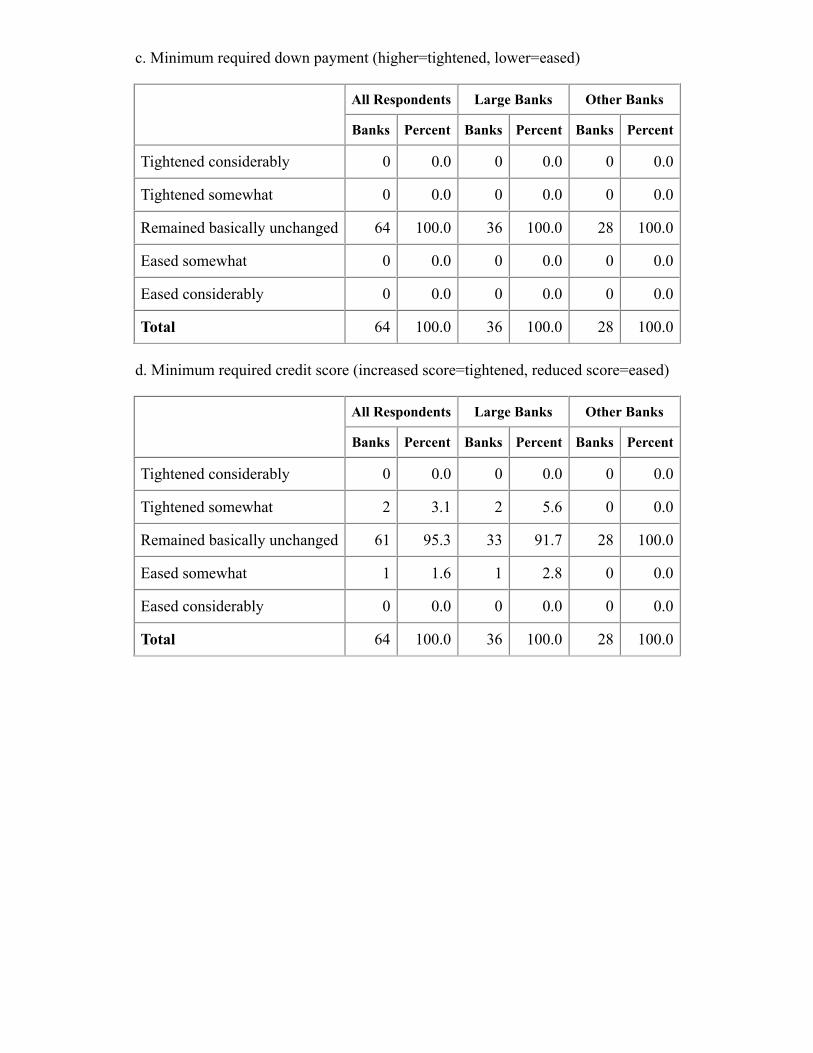
c. Minimum required down payment (higher=tightened, lower=eased)
All Respondents Large Banks Other Banks
Banks Percent Banks Percent Banks Percent
Tightened considerably 0 0.0 0 0.0 0 0.0
Tightened somewhat 0 0.0 0 0.0 0 0.0
Remained basically unchanged 64 100.0 36 100.0 28 100.0
Eased somewhat 0 0.0 0 0.0 0 0.0
Eased considerably 0 0.0 0 0.0 0 0.0
Total 64 100.0 36 100.0 28 100.0
d. Minimum required credit score (increased score=tightened, reduced score=eased)
All Respondents Large Banks Other Banks
Banks Percent Banks Percent Banks Percent
Tightened considerably 0 0.0 0 0.0 0 0.0
Tightened somewhat 2 3.1 2 5.6 0 0.0
Remained basically unchanged 61 95.3 33 91.7 28 100.0
Eased somewhat 1 1.6 1 2.8 0 0.0
Eased considerably 0 0.0 0 0.0 0 0.0
Total 64 100.0 36 100.0 28 100.0
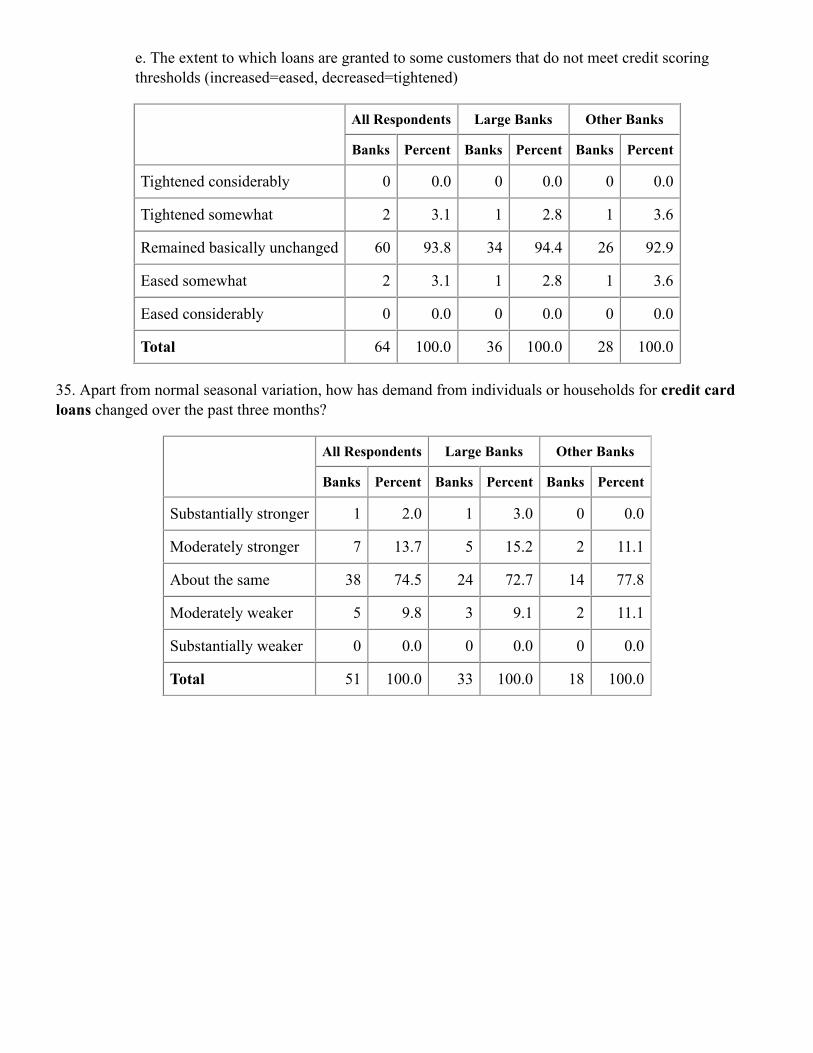
e. The extent to which loans are granted to some customers that do not meet credit scoringthresholds (increased=eased, decreased=tightened)
All Respondents Large Banks Other Banks
Banks Percent Banks Percent Banks Percent
Tightened considerably 0 0.0 0 0.0 0 0.0
Tightened somewhat 2 3.1 1 2.8 1 3.6
Remained basically unchanged 60 93.8 34 94.4 26 92.9
Eased somewhat 2 3.1 1 2.8 1 3.6
Eased considerably 0 0.0 0 0.0 0 0.0
Total 64 100.0 36 100.0 28 100.0
35. Apart from normal seasonal variation, how has demand from individuals or households for credit cardloans changed over the past three months?
All Respondents Large Banks Other Banks
Banks Percent Banks Percent Banks Percent
Substantially stronger 1 2.0 1 3.0 0 0.0
Moderately stronger 7 13.7 5 15.2 2 11.1
About the same 38 74.5 24 72.7 14 77.8
Moderately weaker 5 9.8 3 9.1 2 11.1
Substantially weaker 0 0.0 0 0.0 0 0.0
Total 51 100.0 33 100.0 18 100.0

36. Apart from normal seasonal variation, how has demand from individuals or households for auto loanschanged over the past three months?
All Respondents Large Banks Other Banks
Banks Percent Banks Percent Banks Percent
Substantially stronger 1 1.6 1 2.9 0 0.0
Moderately stronger 14 23.0 7 20.6 7 25.9
About the same 42 68.9 22 64.7 20 74.1
Moderately weaker 4 6.6 4 11.8 0 0.0
Substantially weaker 0 0.0 0 0.0 0 0.0
Total 61 100.0 34 100.0 27 100.0
37. Apart from normal seasonal variation, how has demand from individuals or households for consumerloans other than credit card and auto loans changed over the past three months?
All Respondents Large Banks Other Banks
Banks Percent Banks Percent Banks Percent
Substantially stronger 0 0.0 0 0.0 0 0.0
Moderately stronger 10 15.6 4 11.1 6 21.4
About the same 52 81.3 30 83.3 22 78.6
Moderately weaker 2 3.1 2 5.6 0 0.0
Substantially weaker 0 0.0 0 0.0 0 0.0
Total 64 100.0 36 100.0 28 100.0
1. The sample is selected from among the largest banks in each Federal Reserve District. In the table, largebanks are defined as those with total domestic assets of $20 billion or more as of December 31, 2015. Thecombined assets of the 42 large banks totaled $9.4 trillion, compared to $9.7 trillion for the entire panel of 70banks, and $13.5 trillion for all domestically chartered, federally insured commercial banks.
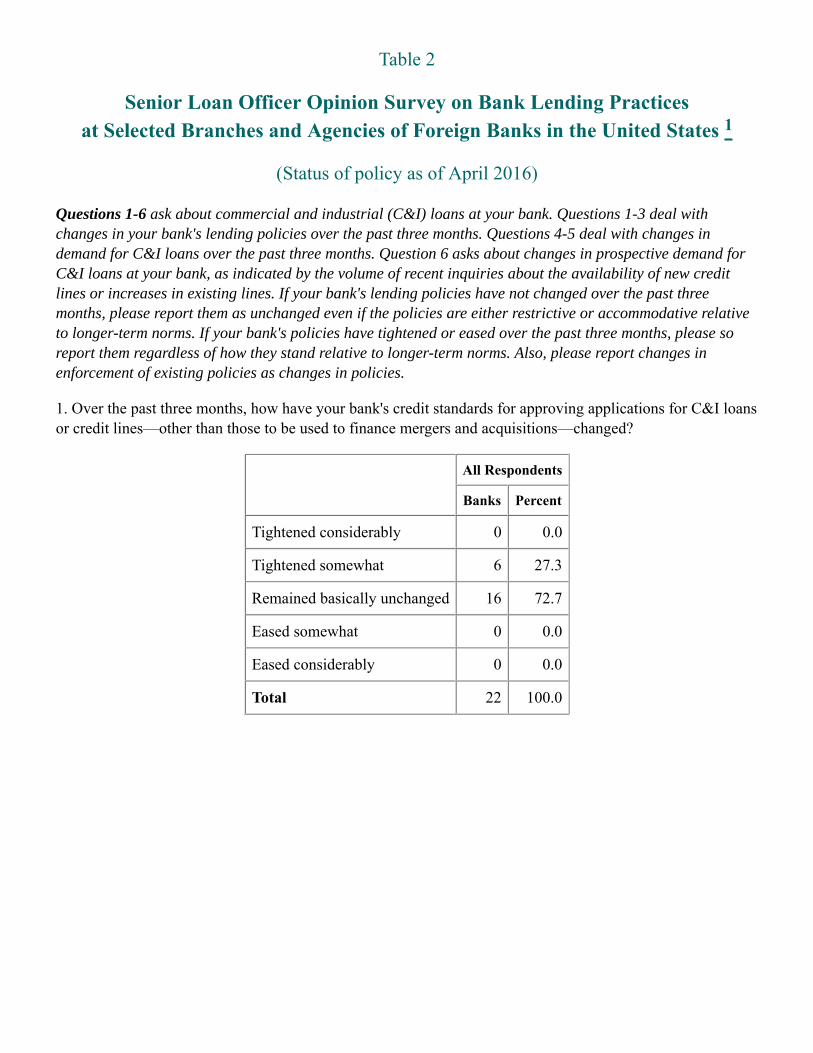
Table 2
1
(Status of policy as of April 2016)
Questions 1-6 ask about commercial and industrial (C&I) loans at your bank. Questions 1-3 deal withchanges in your bank's lending policies over the past three months. Questions 4-5 deal with changes indemand for C&I loans over the past three months. Question 6 asks about changes in prospective demand forC&I loans at your bank, as indicated by the volume of recent inquiries about the availability of new creditlines or increases in existing lines. If your bank's lending policies have not changed over the past threemonths, please report them as unchanged even if the policies are either restrictive or accommodative relativeto longer-term norms. If your bank's policies have tightened or eased over the past three months, please soreport them regardless of how they stand relative to longer-term norms. Also, please report changes inenforcement of existing policies as changes in policies.
1. Over the past three months, how have your bank's credit standards for approving applications for C&I loansor credit lines—other than those to be used to finance mergers and acquisitions—changed?
All Respondents
Banks Percent
Tightened considerably 0 0.0
Tightened somewhat 6 27.3
Remained basically unchanged 16 72.7
Eased somewhat 0 0.0
Eased considerably 0 0.0
Total 22 100.0
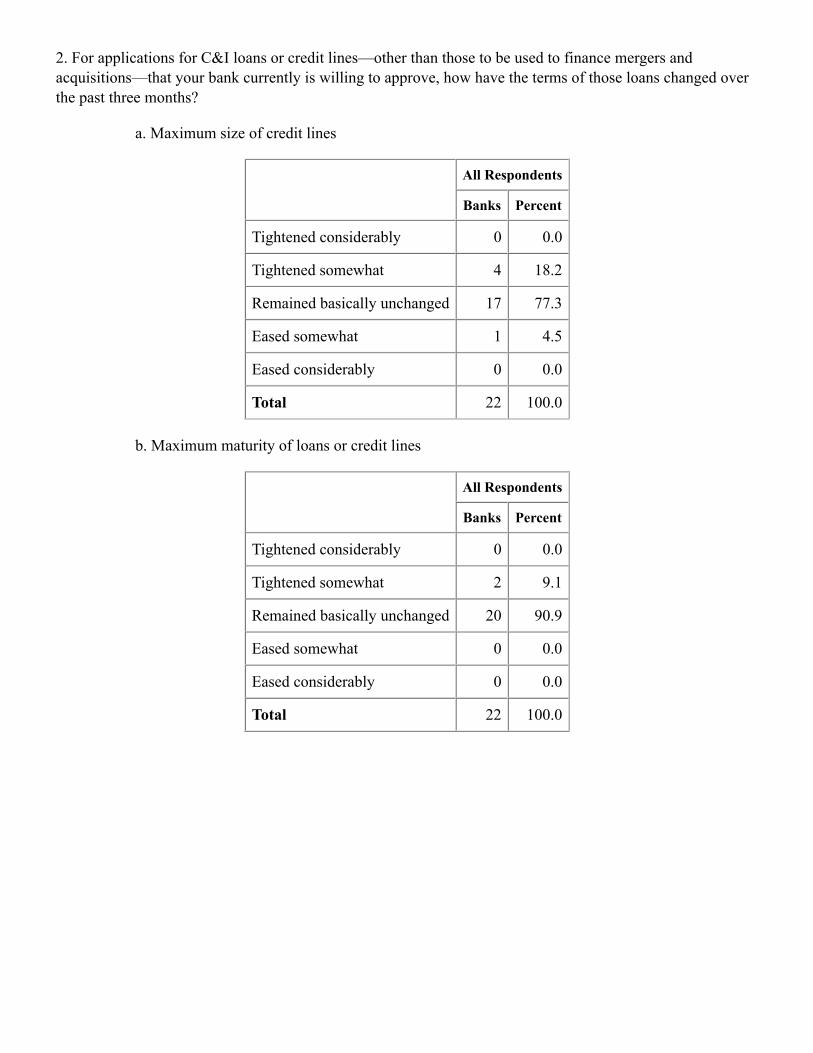
2. For applications for C&I loans or credit lines—other than those to be used to finance mergers andacquisitions—that your bank currently is willing to approve, how have the terms of those loans changed overthe past three months?
a. Maximum size of credit lines
All Respondents
Banks Percent
Tightened considerably 0 0.0
Tightened somewhat 4 18.2
Remained basically unchanged 17 77.3
Eased somewhat 1 4.5
Eased considerably 0 0.0
Total 22 100.0
b. Maximum maturity of loans or credit lines
All Respondents
Banks Percent
Tightened considerably 0 0.0
Tightened somewhat 2 9.1
Remained basically unchanged 20 90.9
Eased somewhat 0 0.0
Eased considerably 0 0.0
Total 22 100.0
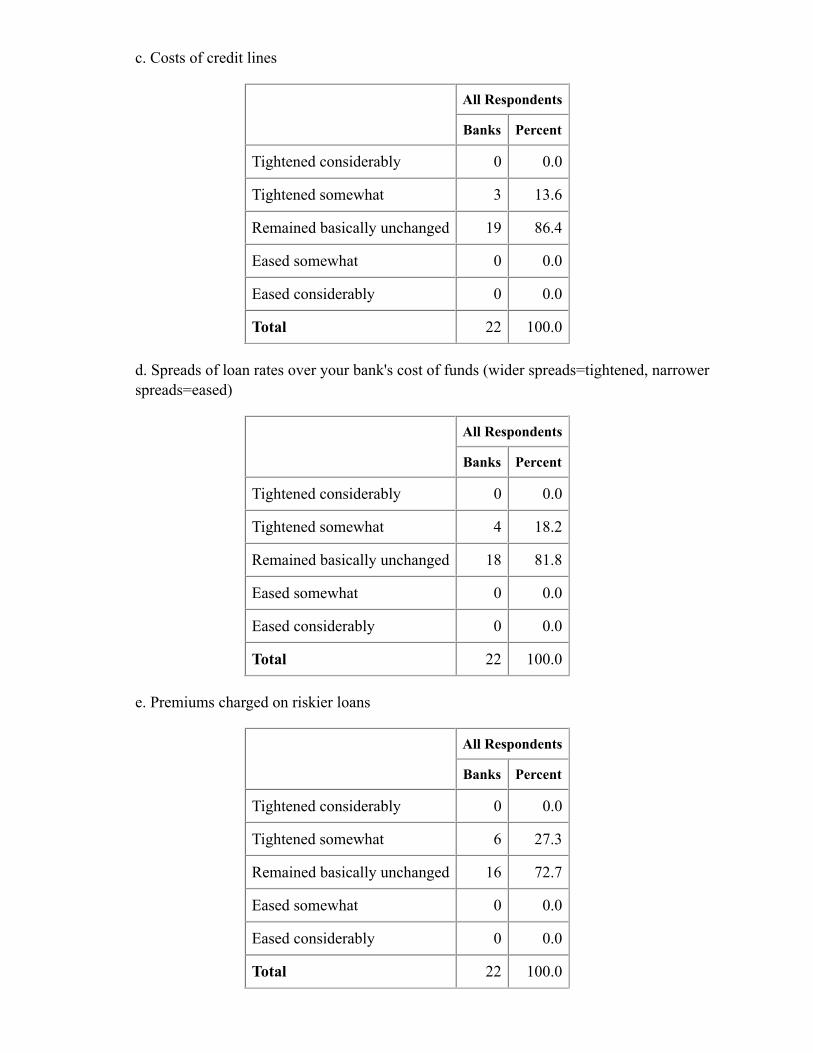
c. Costs of credit lines
All Respondents
Banks Percent
Tightened considerably 0 0.0
Tightened somewhat 3 13.6
Remained basically unchanged 19 86.4
Eased somewhat 0 0.0
Eased considerably 0 0.0
Total 22 100.0
d. Spreads of loan rates over your bank's cost of funds (wider spreads=tightened, narrowerspreads=eased)
All Respondents
Banks Percent
Tightened considerably 0 0.0
Tightened somewhat 4 18.2
Remained basically unchanged 18 81.8
Eased somewhat 0 0.0
Eased considerably 0 0.0
Total 22 100.0
e. Premiums charged on riskier loans
All Respondents
Banks Percent
Tightened considerably 0 0.0
Tightened somewhat 6 27.3
Remained basically unchanged 16 72.7
Eased somewhat 0 0.0
Eased considerably 0 0.0
Total 22 100.0
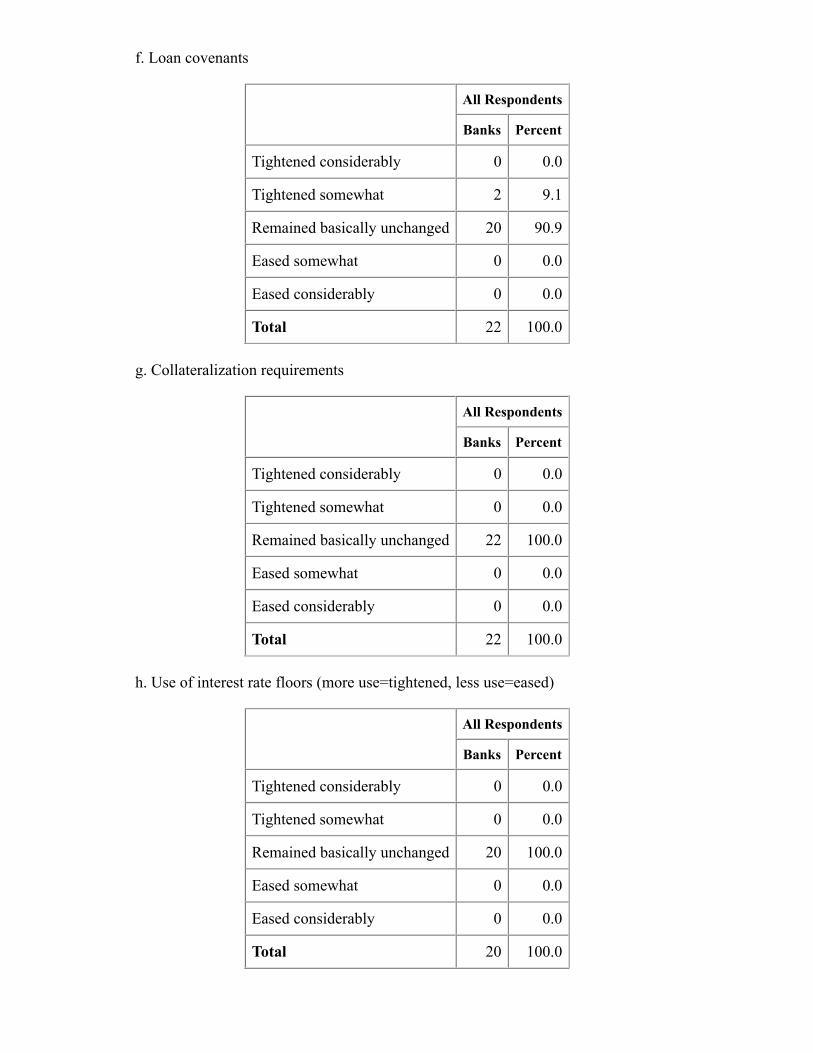
f. Loan covenants
All Respondents
Banks Percent
Tightened considerably 0 0.0
Tightened somewhat 2 9.1
Remained basically unchanged 20 90.9
Eased somewhat 0 0.0
Eased considerably 0 0.0
Total 22 100.0
g. Collateralization requirements
All Respondents
Banks Percent
Tightened considerably 0 0.0
Tightened somewhat 0 0.0
Remained basically unchanged 22 100.0
Eased somewhat 0 0.0
Eased considerably 0 0.0
Total 22 100.0
h. Use of interest rate floors (more use=tightened, less use=eased)
All Respondents
Banks Percent
Tightened considerably 0 0.0
Tightened somewhat 0 0.0
Remained basically unchanged 20 100.0
Eased somewhat 0 0.0
Eased considerably 0 0.0
Total 20 100.0
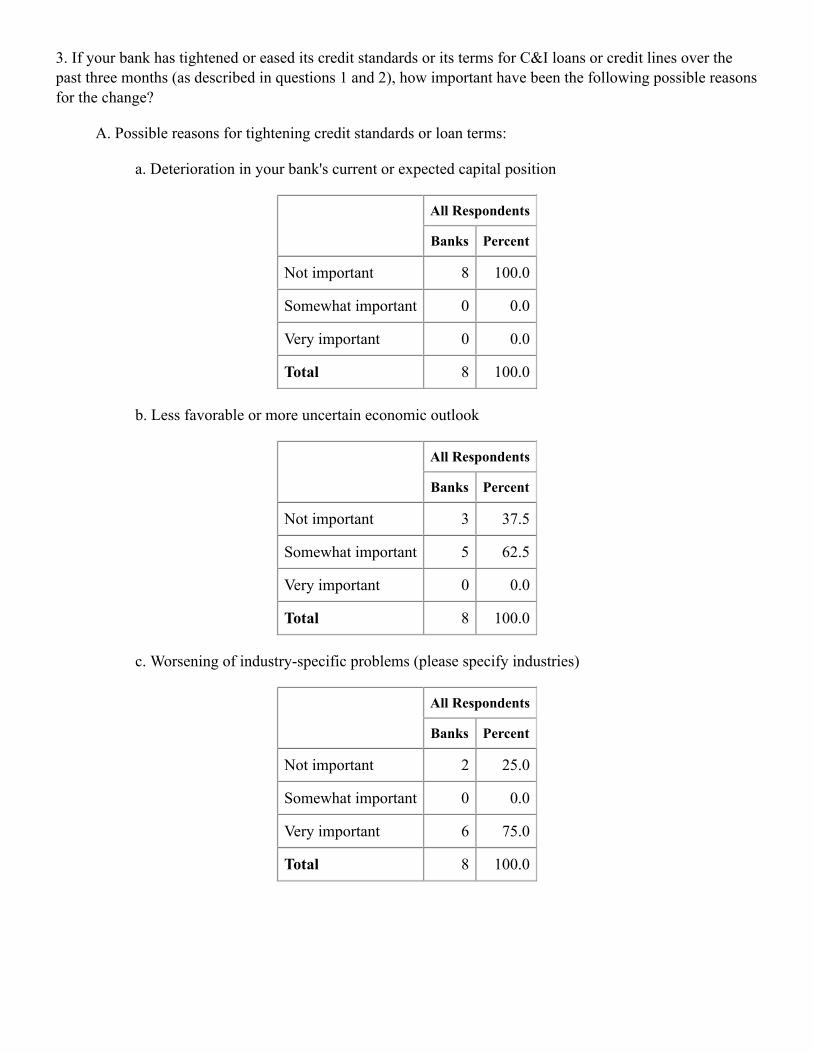
3. If your bank has tightened or eased its credit standards or its terms for C&I loans or credit lines over thepast three months (as described in questions 1 and 2), how important have been the following possible reasonsfor the change?
A. Possible reasons for tightening credit standards or loan terms:
a. Deterioration in your bank's current or expected capital position
All Respondents
Banks Percent
Not important 8 100.0
Somewhat important 0 0.0
Very important 0 0.0
Total 8 100.0
b. Less favorable or more uncertain economic outlook
All Respondents
Banks Percent
Not important 3 37.5
Somewhat important 5 62.5
Very important 0 0.0
Total 8 100.0
c. Worsening of industry-specific problems (please specify industries)
All Respondents
Banks Percent
Not important 2 25.0
Somewhat important 0 0.0
Very important 6 75.0
Total 8 100.0
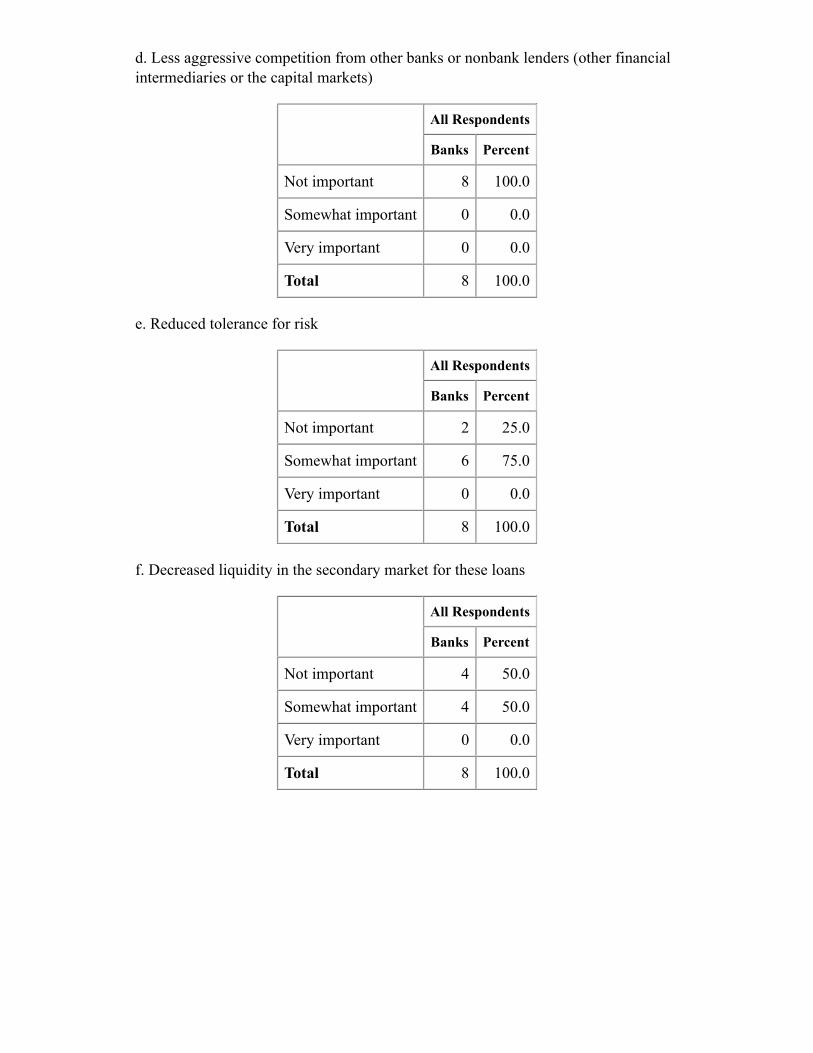
d. Less aggressive competition from other banks or nonbank lenders (other financialintermediaries or the capital markets)
All Respondents
Banks Percent
Not important 8 100.0
Somewhat important 0 0.0
Very important 0 0.0
Total 8 100.0
e. Reduced tolerance for risk
All Respondents
Banks Percent
Not important 2 25.0
Somewhat important 6 75.0
Very important 0 0.0
Total 8 100.0
f. Decreased liquidity in the secondary market for these loans
All Respondents
Banks Percent
Not important 4 50.0
Somewhat important 4 50.0
Very important 0 0.0
Total 8 100.0
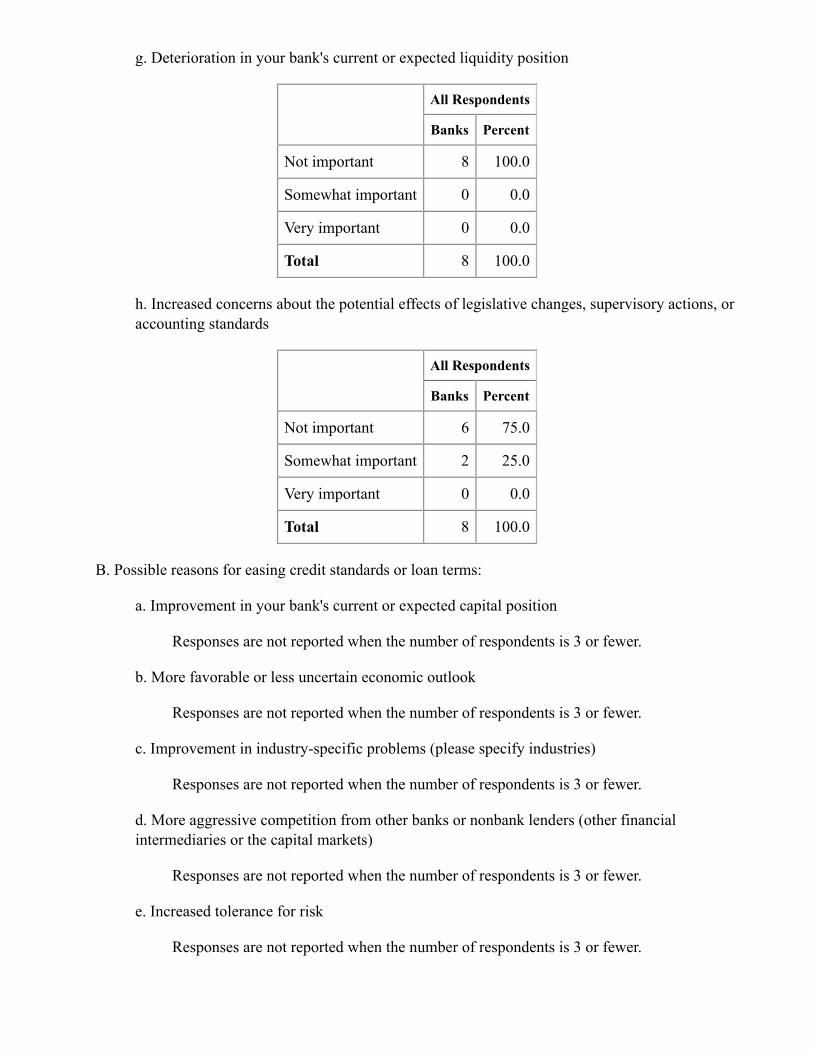
g. Deterioration in your bank's current or expected liquidity position
All Respondents
Banks Percent
Not important 8 100.0
Somewhat important 0 0.0
Very important 0 0.0
Total 8 100.0
h. Increased concerns about the potential effects of legislative changes, supervisory actions, oraccounting standards
All Respondents
Banks Percent
Not important 6 75.0
Somewhat important 2 25.0
Very important 0 0.0
Total 8 100.0
B. Possible reasons for easing credit standards or loan terms:
a. Improvement in your bank's current or expected capital position
Responses are not reported when the number of respondents is 3 or fewer.
b. More favorable or less uncertain economic outlook
Responses are not reported when the number of respondents is 3 or fewer.
c. Improvement in industry-specific problems (please specify industries)
Responses are not reported when the number of respondents is 3 or fewer.
d. More aggressive competition from other banks or nonbank lenders (other financialintermediaries or the capital markets)
Responses are not reported when the number of respondents is 3 or fewer.
e. Increased tolerance for risk
Responses are not reported when the number of respondents is 3 or fewer.
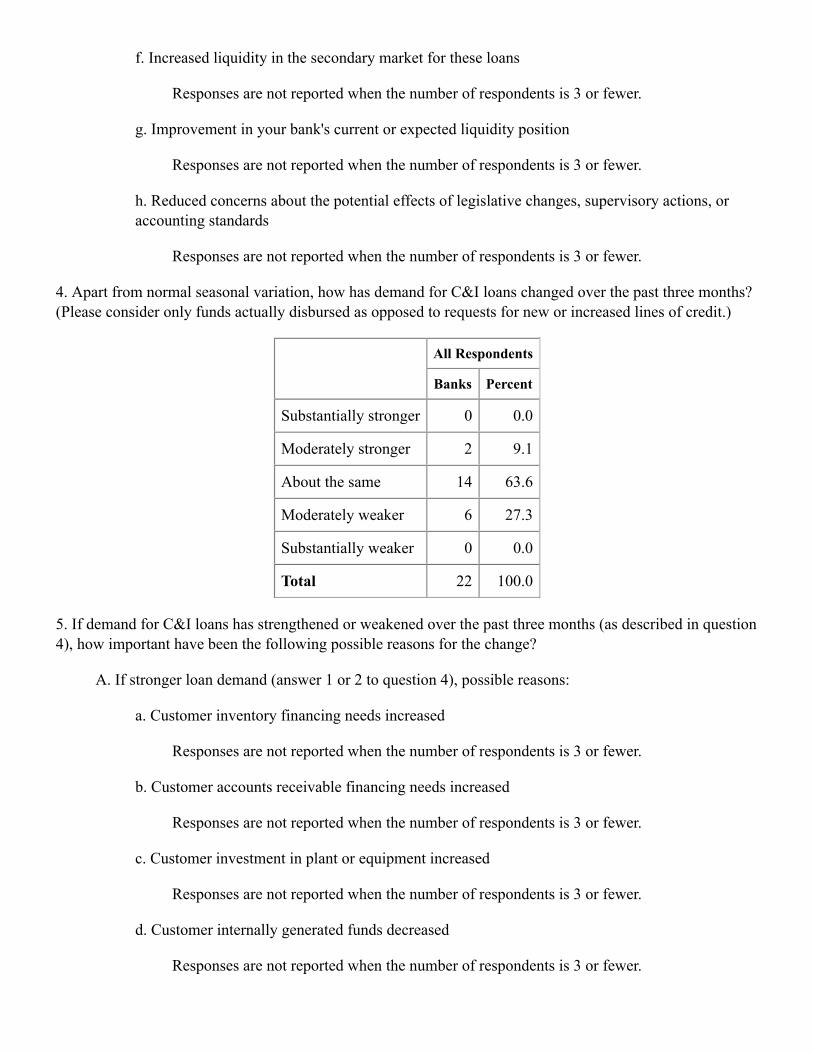
f. Increased liquidity in the secondary market for these loans
Responses are not reported when the number of respondents is 3 or fewer.
g. Improvement in your bank's current or expected liquidity position
Responses are not reported when the number of respondents is 3 or fewer.
h. Reduced concerns about the potential effects of legislative changes, supervisory actions, oraccounting standards
Responses are not reported when the number of respondents is 3 or fewer.
4. Apart from normal seasonal variation, how has demand for C&I loans changed over the past three months?(Please consider only funds actually disbursed as opposed to requests for new or increased lines of credit.)
All Respondents
Banks Percent
Substantially stronger 0 0.0
Moderately stronger 2 9.1
About the same 14 63.6
Moderately weaker 6 27.3
Substantially weaker 0 0.0
Total 22 100.0
5. If demand for C&I loans has strengthened or weakened over the past three months (as described in question4), how important have been the following possible reasons for the change?
A. If stronger loan demand (answer 1 or 2 to question 4), possible reasons:
a. Customer inventory financing needs increased
Responses are not reported when the number of respondents is 3 or fewer.
b. Customer accounts receivable financing needs increased
Responses are not reported when the number of respondents is 3 or fewer.
c. Customer investment in plant or equipment increased
Responses are not reported when the number of respondents is 3 or fewer.
d. Customer internally generated funds decreased
Responses are not reported when the number of respondents is 3 or fewer.
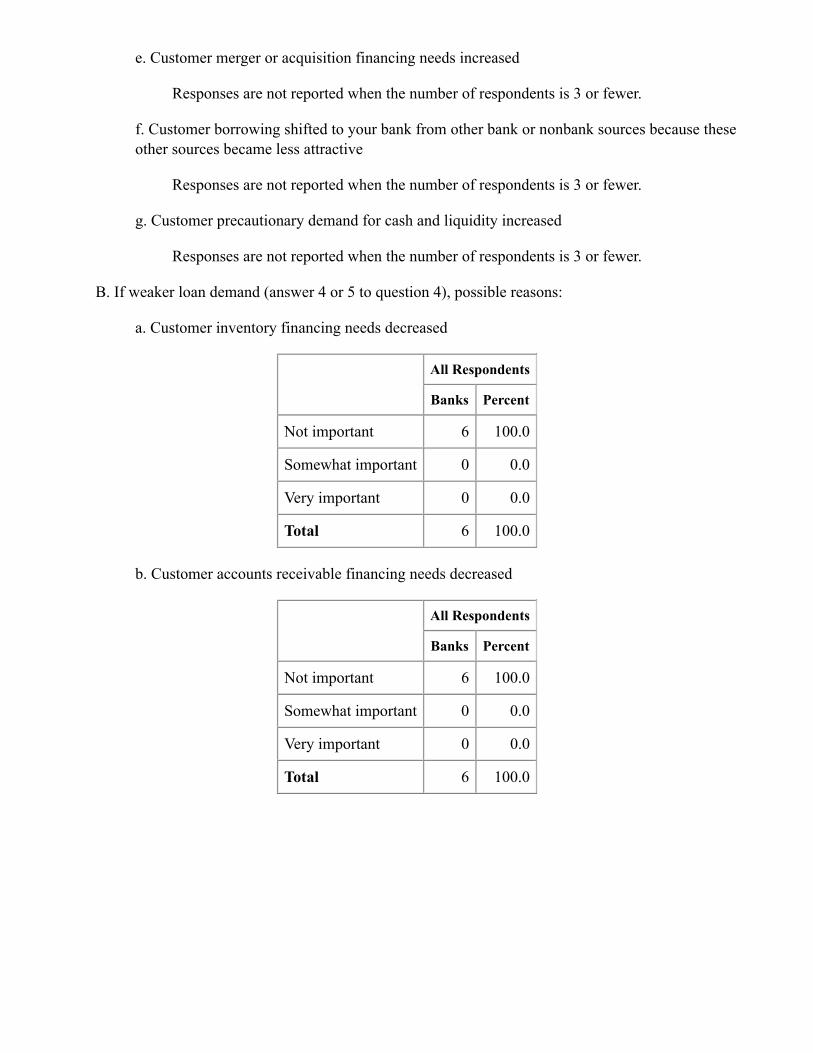
e. Customer merger or acquisition financing needs increased
Responses are not reported when the number of respondents is 3 or fewer.
f. Customer borrowing shifted to your bank from other bank or nonbank sources because theseother sources became less attractive
Responses are not reported when the number of respondents is 3 or fewer.
g. Customer precautionary demand for cash and liquidity increased
Responses are not reported when the number of respondents is 3 or fewer.
B. If weaker loan demand (answer 4 or 5 to question 4), possible reasons:
a. Customer inventory financing needs decreased
All Respondents
Banks Percent
Not important 6 100.0
Somewhat important 0 0.0
Very important 0 0.0
Total 6 100.0
b. Customer accounts receivable financing needs decreased
All Respondents
Banks Percent
Not important 6 100.0
Somewhat important 0 0.0
Very important 0 0.0
Total 6 100.0
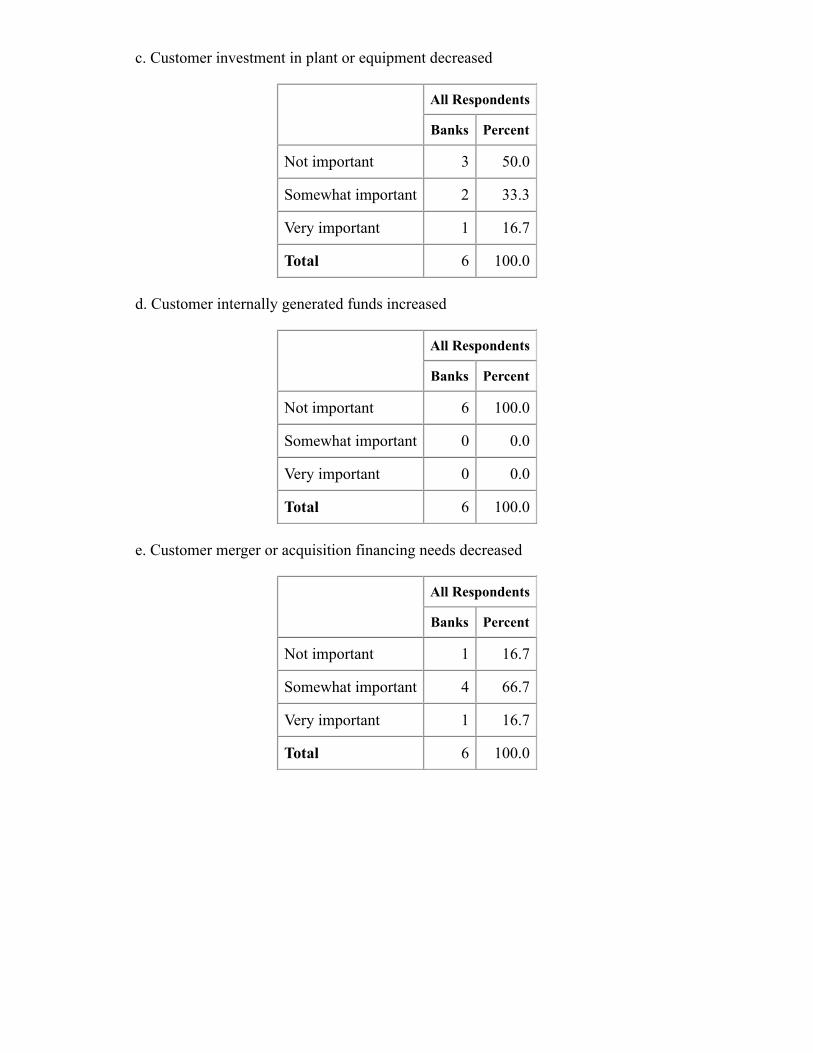
c. Customer investment in plant or equipment decreased
All Respondents
Banks Percent
Not important 3 50.0
Somewhat important 2 33.3
Very important 1 16.7
Total 6 100.0
d. Customer internally generated funds increased
All Respondents
Banks Percent
Not important 6 100.0
Somewhat important 0 0.0
Very important 0 0.0
Total 6 100.0
e. Customer merger or acquisition financing needs decreased
All Respondents
Banks Percent
Not important 1 16.7
Somewhat important 4 66.7
Very important 1 16.7
Total 6 100.0
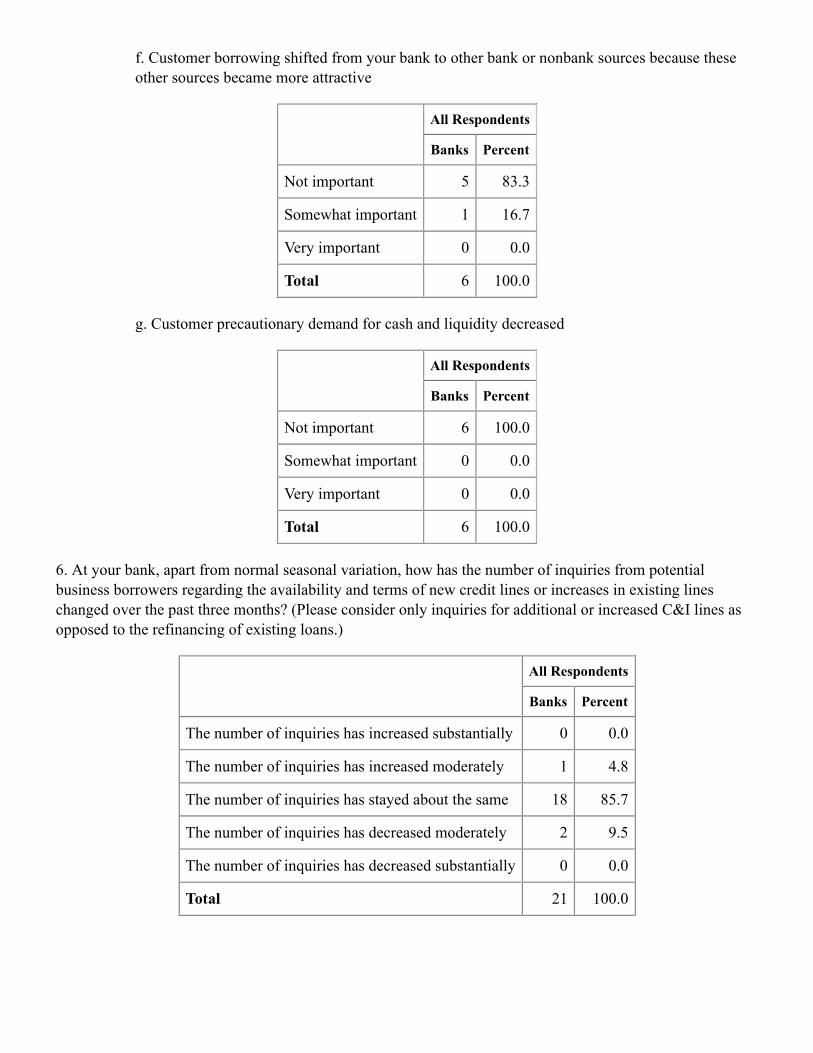
f. Customer borrowing shifted from your bank to other bank or nonbank sources because theseother sources became more attractive
All Respondents
Banks Percent
Not important 5 83.3
Somewhat important 1 16.7
Very important 0 0.0
Total 6 100.0
g. Customer precautionary demand for cash and liquidity decreased
All Respondents
Banks Percent
Not important 6 100.0
Somewhat important 0 0.0
Very important 0 0.0
Total 6 100.0
6. At your bank, apart from normal seasonal variation, how has the number of inquiries from potentialbusiness borrowers regarding the availability and terms of new credit lines or increases in existing lineschanged over the past three months? (Please consider only inquiries for additional or increased C&I lines asopposed to the refinancing of existing loans.)
All Respondents
Banks Percent
The number of inquiries has increased substantially 0 0.0
The number of inquiries has increased moderately 1 4.8
The number of inquiries has stayed about the same 18 85.7
The number of inquiries has decreased moderately 2 9.5
The number of inquiries has decreased substantially 0 0.0
Total 21 100.0
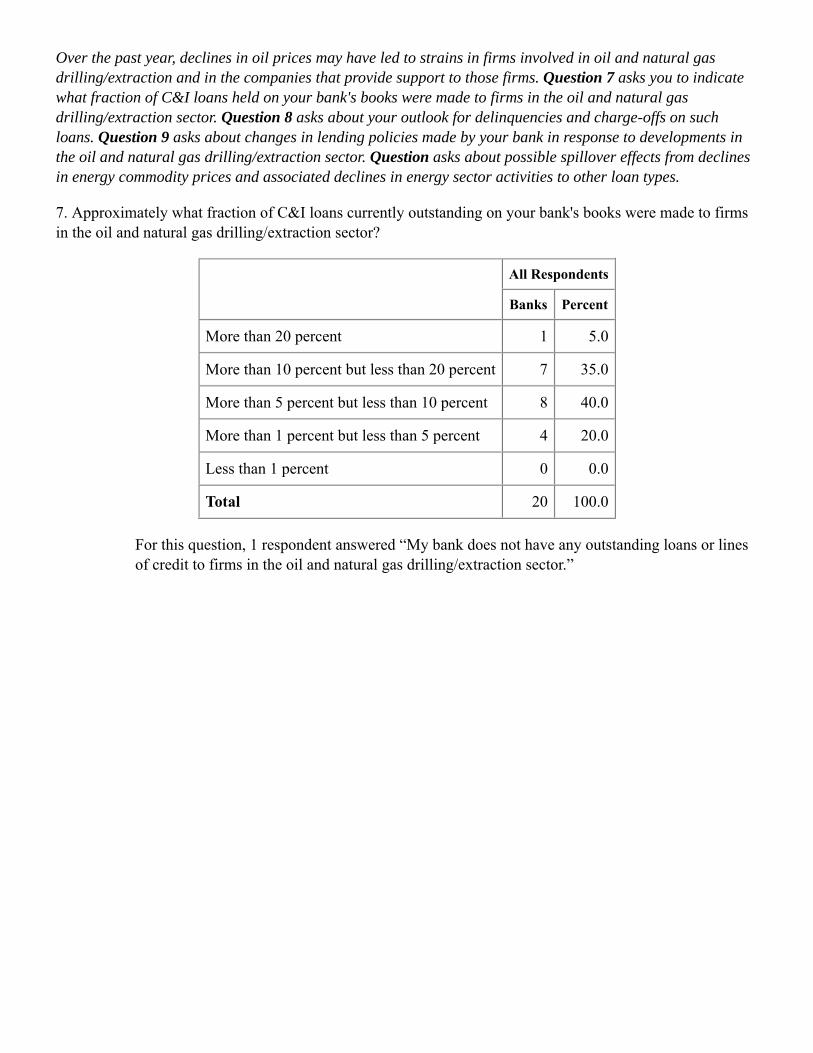
Over the past year, declines in oil prices may have led to strains in firms involved in oil and natural gasdrilling/extraction and in the companies that provide support to those firms. Question 7 asks you to indicatewhat fraction of C&I loans held on your bank's books were made to firms in the oil and natural gasdrilling/extraction sector. Question 8 asks about your outlook for delinquencies and charge-offs on suchloans. Question 9 asks about changes in lending policies made by your bank in response to developments inthe oil and natural gas drilling/extraction sector. Question asks about possible spillover effects from declinesin energy commodity prices and associated declines in energy sector activities to other loan types.
7. Approximately what fraction of C&I loans currently outstanding on your bank's books were made to firmsin the oil and natural gas drilling/extraction sector?
All Respondents
Banks Percent
More than 20 percent 1 5.0
More than 10 percent but less than 20 percent 7 35.0
More than 5 percent but less than 10 percent 8 40.0
More than 1 percent but less than 5 percent 4 20.0
Less than 1 percent 0 0.0
Total 20 100.0
For this question, 1 respondent answered “My bank does not have any outstanding loans or linesof credit to firms in the oil and natural gas drilling/extraction sector.”
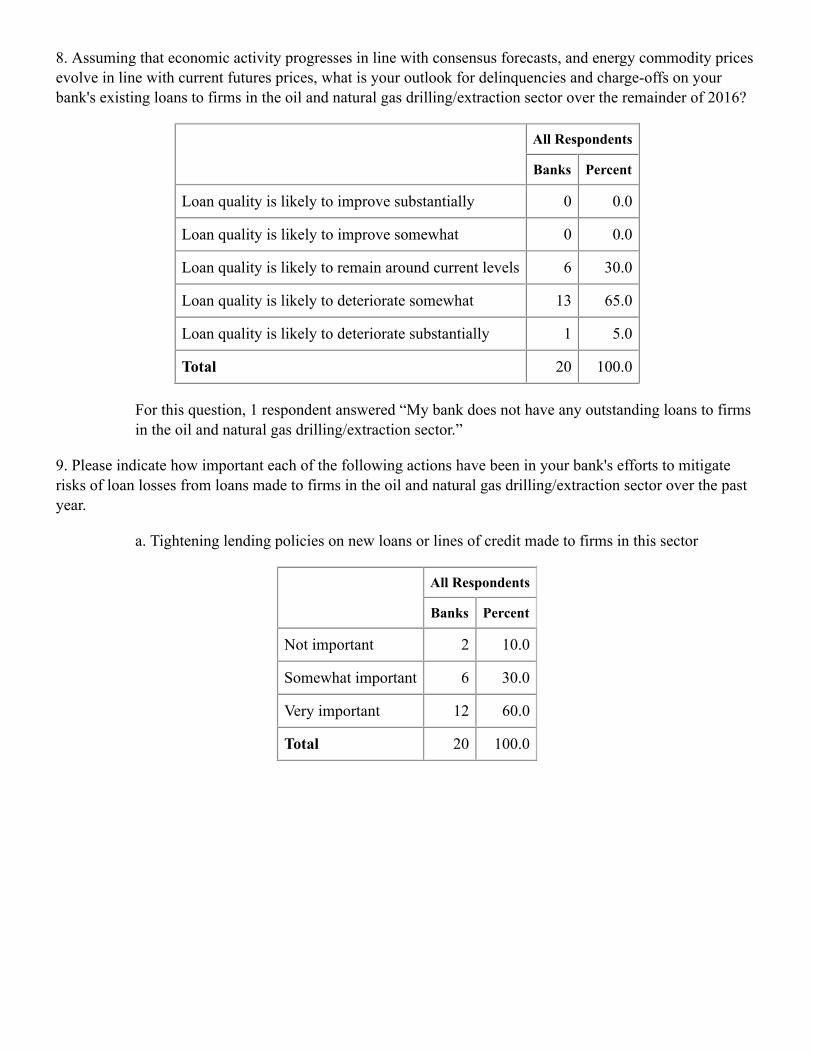
8. Assuming that economic activity progresses in line with consensus forecasts, and energy commodity pricesevolve in line with current futures prices, what is your outlook for delinquencies and charge-offs on yourbank's existing loans to firms in the oil and natural gas drilling/extraction sector over the remainder of 2016?
All Respondents
Banks Percent
Loan quality is likely to improve substantially 0 0.0
Loan quality is likely to improve somewhat 0 0.0
Loan quality is likely to remain around current levels 6 30.0
Loan quality is likely to deteriorate somewhat 13 65.0
Loan quality is likely to deteriorate substantially 1 5.0
Total 20 100.0
For this question, 1 respondent answered “My bank does not have any outstanding loans to firmsin the oil and natural gas drilling/extraction sector.”
9. Please indicate how important each of the following actions have been in your bank's efforts to mitigaterisks of loan losses from loans made to firms in the oil and natural gas drilling/extraction sector over the pastyear.
a. Tightening lending policies on new loans or lines of credit made to firms in this sector
All Respondents
Banks Percent
Not important 2 10.0
Somewhat important 6 30.0
Very important 12 60.0
Total 20 100.0
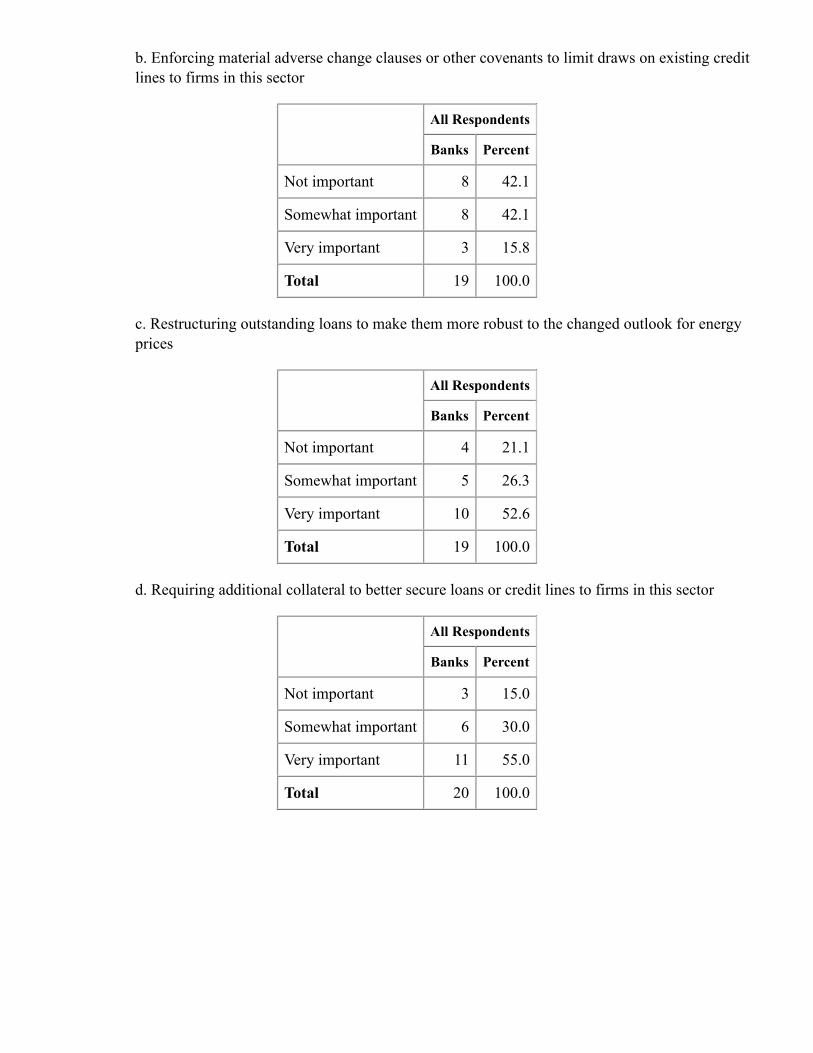
b. Enforcing material adverse change clauses or other covenants to limit draws on existing creditlines to firms in this sector
All Respondents
Banks Percent
Not important 8 42.1
Somewhat important 8 42.1
Very important 3 15.8
Total 19 100.0
c. Restructuring outstanding loans to make them more robust to the changed outlook for energyprices
All Respondents
Banks Percent
Not important 4 21.1
Somewhat important 5 26.3
Very important 10 52.6
Total 19 100.0
d. Requiring additional collateral to better secure loans or credit lines to firms in this sector
All Respondents
Banks Percent
Not important 3 15.0
Somewhat important 6 30.0
Very important 11 55.0
Total 20 100.0
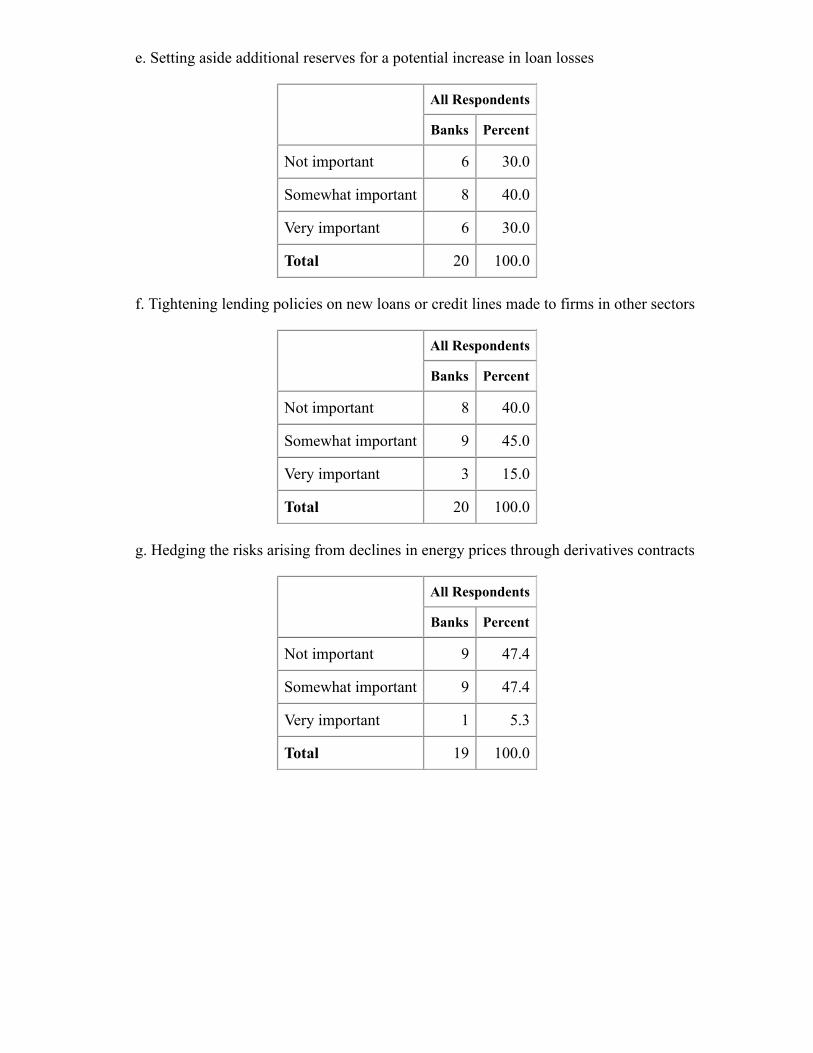
e. Setting aside additional reserves for a potential increase in loan losses
All Respondents
Banks Percent
Not important 6 30.0
Somewhat important 8 40.0
Very important 6 30.0
Total 20 100.0
f. Tightening lending policies on new loans or credit lines made to firms in other sectors
All Respondents
Banks Percent
Not important 8 40.0
Somewhat important 9 45.0
Very important 3 15.0
Total 20 100.0
g. Hedging the risks arising from declines in energy prices through derivatives contracts
All Respondents
Banks Percent
Not important 9 47.4
Somewhat important 9 47.4
Very important 1 5.3
Total 19 100.0
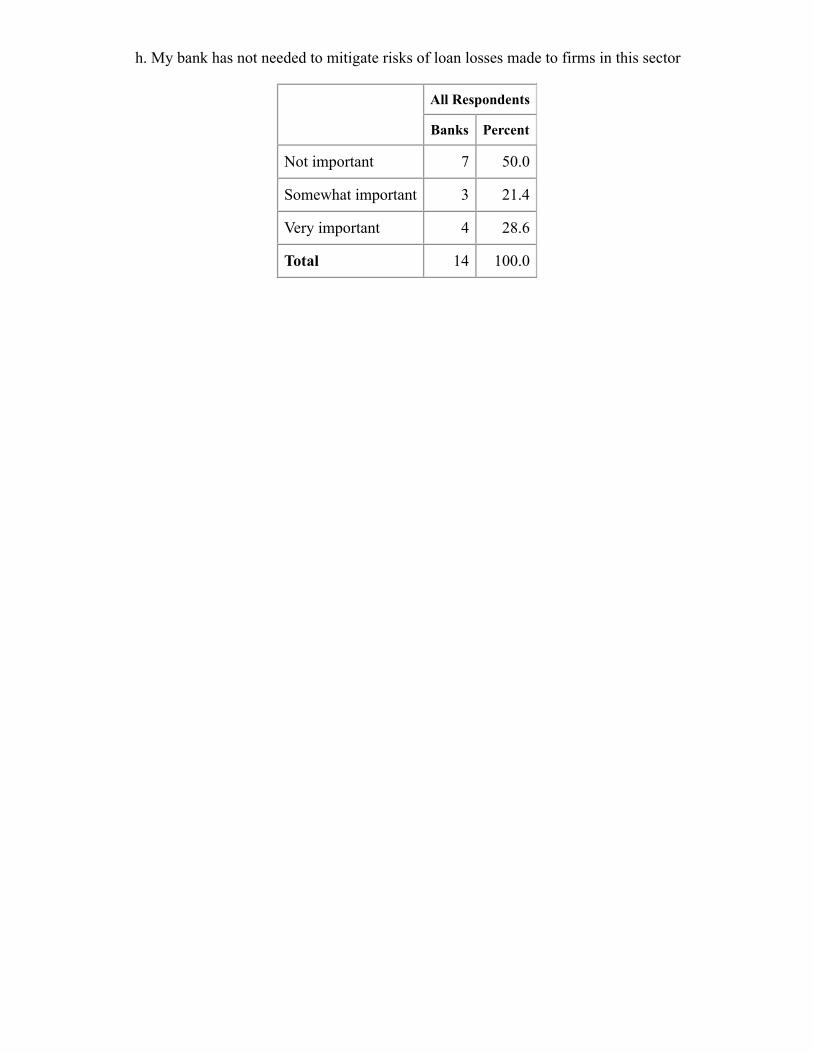
h. My bank has not needed to mitigate risks of loan losses made to firms in this sector
All Respondents
Banks Percent
Not important 7 50.0
Somewhat important 3 21.4
Very important 4 28.6
Total 14 100.0
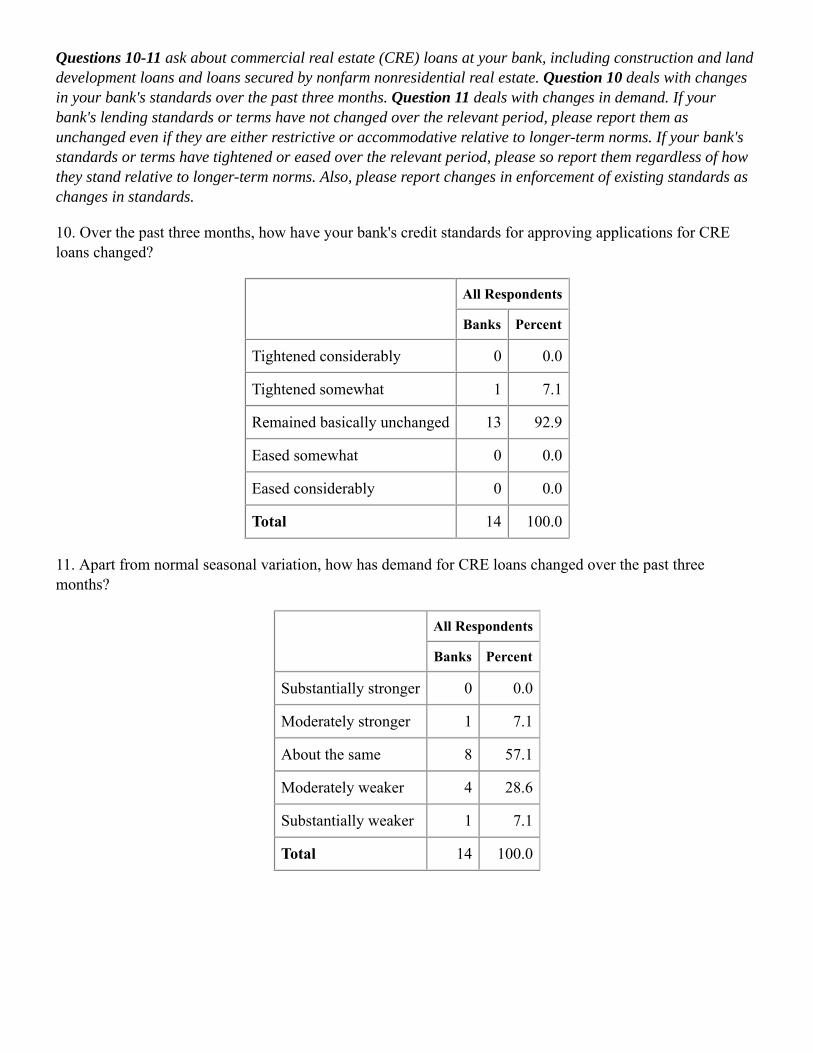
Questions 10-11 ask about commercial real estate (CRE) loans at your bank, including construction and landdevelopment loans and loans secured by nonfarm nonresidential real estate. Question 10 deals with changesin your bank's standards over the past three months. Question 11 deals with changes in demand. If yourbank's lending standards or terms have not changed over the relevant period, please report them asunchanged even if they are either restrictive or accommodative relative to longer-term norms. If your bank'sstandards or terms have tightened or eased over the relevant period, please so report them regardless of howthey stand relative to longer-term norms. Also, please report changes in enforcement of existing standards aschanges in standards.
10. Over the past three months, how have your bank's credit standards for approving applications for CREloans changed?
All Respondents
Banks Percent
Tightened considerably 0 0.0
Tightened somewhat 1 7.1
Remained basically unchanged 13 92.9
Eased somewhat 0 0.0
Eased considerably 0 0.0
Total 14 100.0
11. Apart from normal seasonal variation, how has demand for CRE loans changed over the past threemonths?
All Respondents
Banks Percent
Substantially stronger 0 0.0
Moderately stronger 1 7.1
About the same 8 57.1
Moderately weaker 4 28.6
Substantially weaker 1 7.1
Total 14 100.0
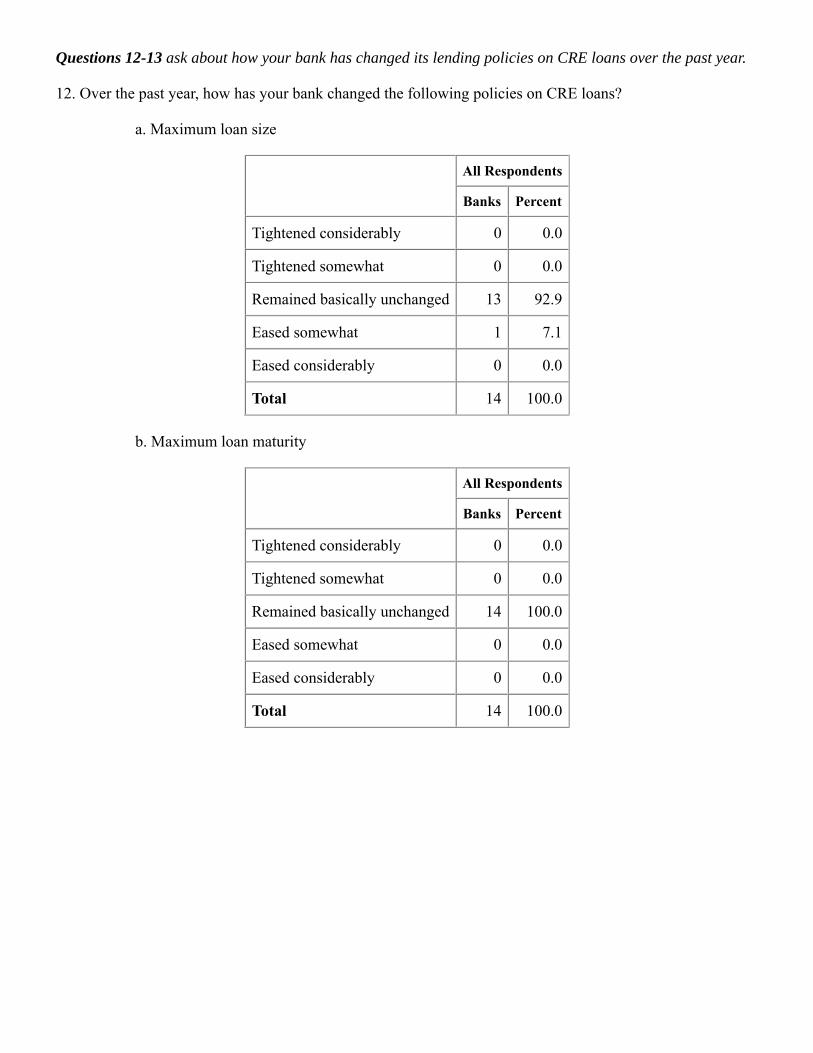
Questions 12-13 ask about how your bank has changed its lending policies on CRE loans over the past year.
12. Over the past year, how has your bank changed the following policies on CRE loans?
a. Maximum loan size
All Respondents
Banks Percent
Tightened considerably 0 0.0
Tightened somewhat 0 0.0
Remained basically unchanged 13 92.9
Eased somewhat 1 7.1
Eased considerably 0 0.0
Total 14 100.0
b. Maximum loan maturity
All Respondents
Banks Percent
Tightened considerably 0 0.0
Tightened somewhat 0 0.0
Remained basically unchanged 14 100.0
Eased somewhat 0 0.0
Eased considerably 0 0.0
Total 14 100.0
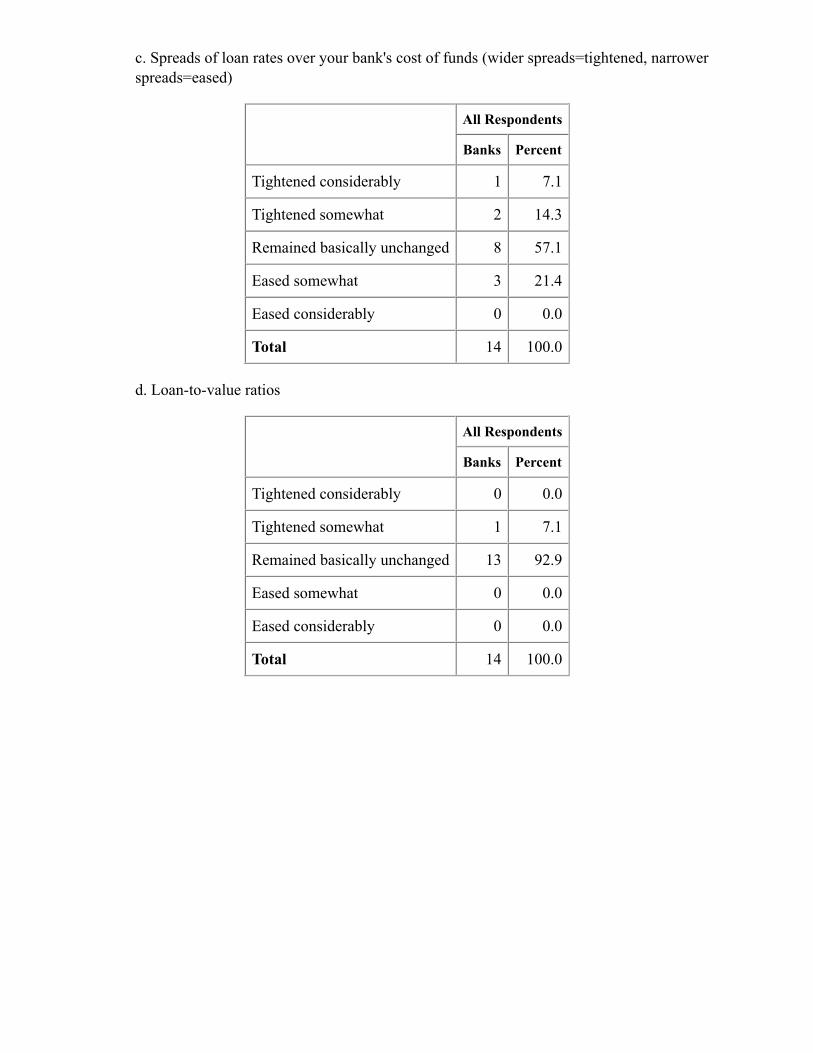
c. Spreads of loan rates over your bank's cost of funds (wider spreads=tightened, narrowerspreads=eased)
All Respondents
Banks Percent
Tightened considerably 1 7.1
Tightened somewhat 2 14.3
Remained basically unchanged 8 57.1
Eased somewhat 3 21.4
Eased considerably 0 0.0
Total 14 100.0
d. Loan-to-value ratios
All Respondents
Banks Percent
Tightened considerably 0 0.0
Tightened somewhat 1 7.1
Remained basically unchanged 13 92.9
Eased somewhat 0 0.0
Eased considerably 0 0.0
Total 14 100.0
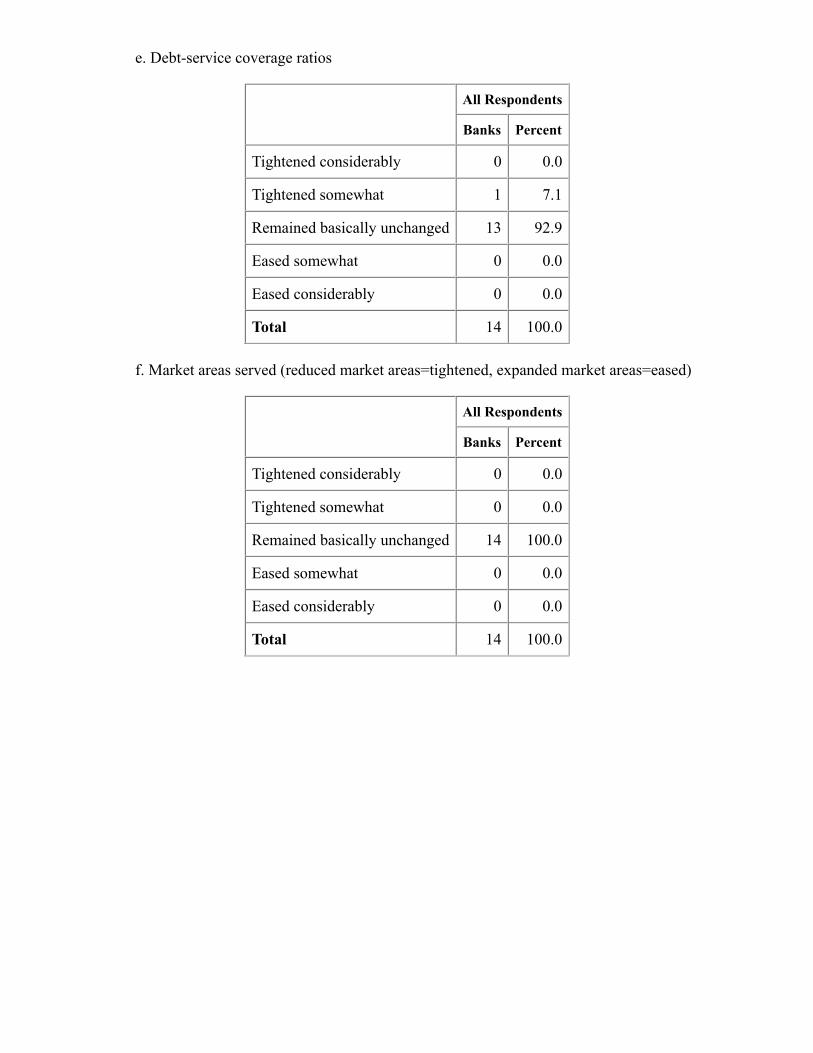
e. Debt-service coverage ratios
All Respondents
Banks Percent
Tightened considerably 0 0.0
Tightened somewhat 1 7.1
Remained basically unchanged 13 92.9
Eased somewhat 0 0.0
Eased considerably 0 0.0
Total 14 100.0
f. Market areas served (reduced market areas=tightened, expanded market areas=eased)
All Respondents
Banks Percent
Tightened considerably 0 0.0
Tightened somewhat 0 0.0
Remained basically unchanged 14 100.0
Eased somewhat 0 0.0
Eased considerably 0 0.0
Total 14 100.0

g. Length of interest-only payment period (shorter interest-only periods=tightened, longerinterest-only periods=eased)
All Respondents
Banks Percent
Tightened considerably 0 0.0
Tightened somewhat 1 7.1
Remained basically unchanged 13 92.9
Eased somewhat 0 0.0
Eased considerably 0 0.0
Total 14 100.0
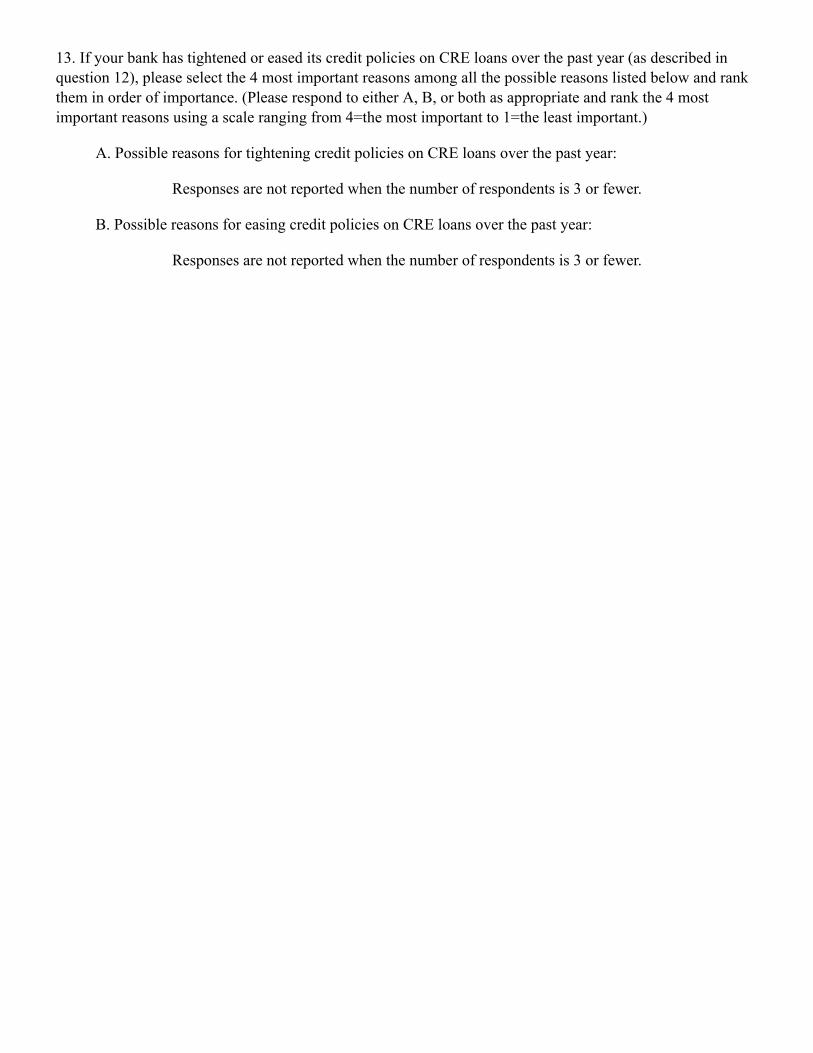
13. If your bank has tightened or eased its credit policies on CRE loans over the past year (as described inquestion 12), please select the 4 most important reasons among all the possible reasons listed below and rankthem in order of importance. (Please respond to either A, B, or both as appropriate and rank the 4 mostimportant reasons using a scale ranging from 4=the most important to 1=the least important.)
A. Possible reasons for tightening credit policies on CRE loans over the past year:
Responses are not reported when the number of respondents is 3 or fewer.
B. Possible reasons for easing credit policies on CRE loans over the past year:
Responses are not reported when the number of respondents is 3 or fewer.
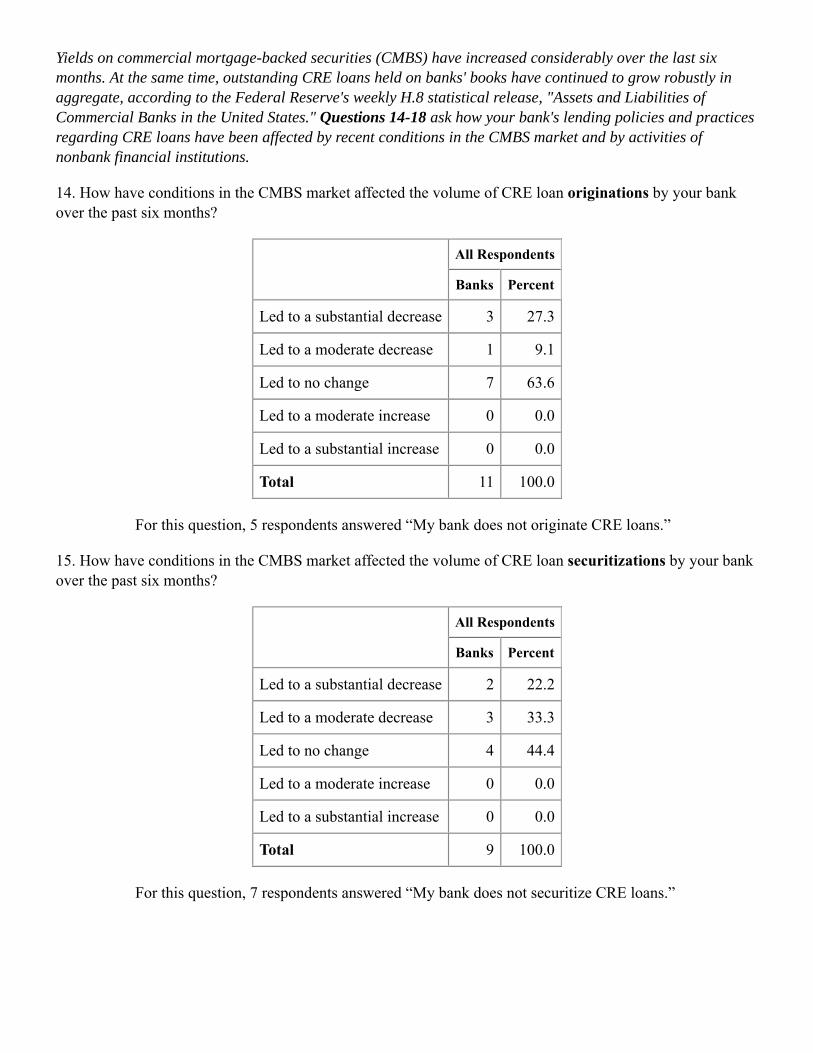
Yields on commercial mortgage-backed securities (CMBS) have increased considerably over the last sixmonths. At the same time, outstanding CRE loans held on banks' books have continued to grow robustly inaggregate, according to the Federal Reserve's weekly H.8 statistical release, "Assets and Liabilities ofCommercial Banks in the United States." Questions 14-18 ask how your bank's lending policies and practicesregarding CRE loans have been affected by recent conditions in the CMBS market and by activities ofnonbank financial institutions.
14. How have conditions in the CMBS market affected the volume of CRE loan originations by your bankover the past six months?
All Respondents
Banks Percent
Led to a substantial decrease 3 27.3
Led to a moderate decrease 1 9.1
Led to no change 7 63.6
Led to a moderate increase 0 0.0
Led to a substantial increase 0 0.0
Total 11 100.0
For this question, 5 respondents answered “My bank does not originate CRE loans.”
15. How have conditions in the CMBS market affected the volume of CRE loan securitizations by your bankover the past six months?
All Respondents
Banks Percent
Led to a substantial decrease 2 22.2
Led to a moderate decrease 3 33.3
Led to no change 4 44.4
Led to a moderate increase 0 0.0
Led to a substantial increase 0 0.0
Total 9 100.0
For this question, 7 respondents answered “My bank does not securitize CRE loans.”
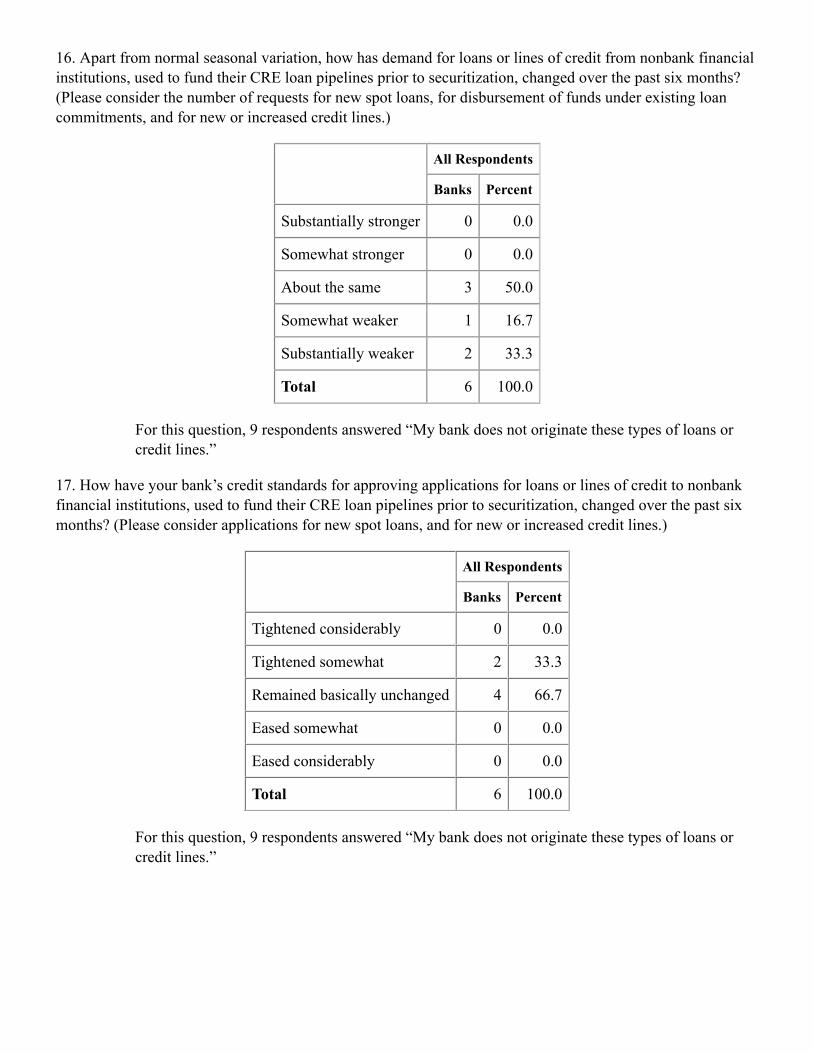
16. Apart from normal seasonal variation, how has demand for loans or lines of credit from nonbank financialinstitutions, used to fund their CRE loan pipelines prior to securitization, changed over the past six months?(Please consider the number of requests for new spot loans, for disbursement of funds under existing loancommitments, and for new or increased credit lines.)
All Respondents
Banks Percent
Substantially stronger 0 0.0
Somewhat stronger 0 0.0
About the same 3 50.0
Somewhat weaker 1 16.7
Substantially weaker 2 33.3
Total 6 100.0
For this question, 9 respondents answered “My bank does not originate these types of loans orcredit lines.”
17. How have your bank’s credit standards for approving applications for loans or lines of credit to nonbankfinancial institutions, used to fund their CRE loan pipelines prior to securitization, changed over the past sixmonths? (Please consider applications for new spot loans, and for new or increased credit lines.)
All Respondents
Banks Percent
Tightened considerably 0 0.0
Tightened somewhat 2 33.3
Remained basically unchanged 4 66.7
Eased somewhat 0 0.0
Eased considerably 0 0.0
Total 6 100.0
For this question, 9 respondents answered “My bank does not originate these types of loans orcredit lines.”
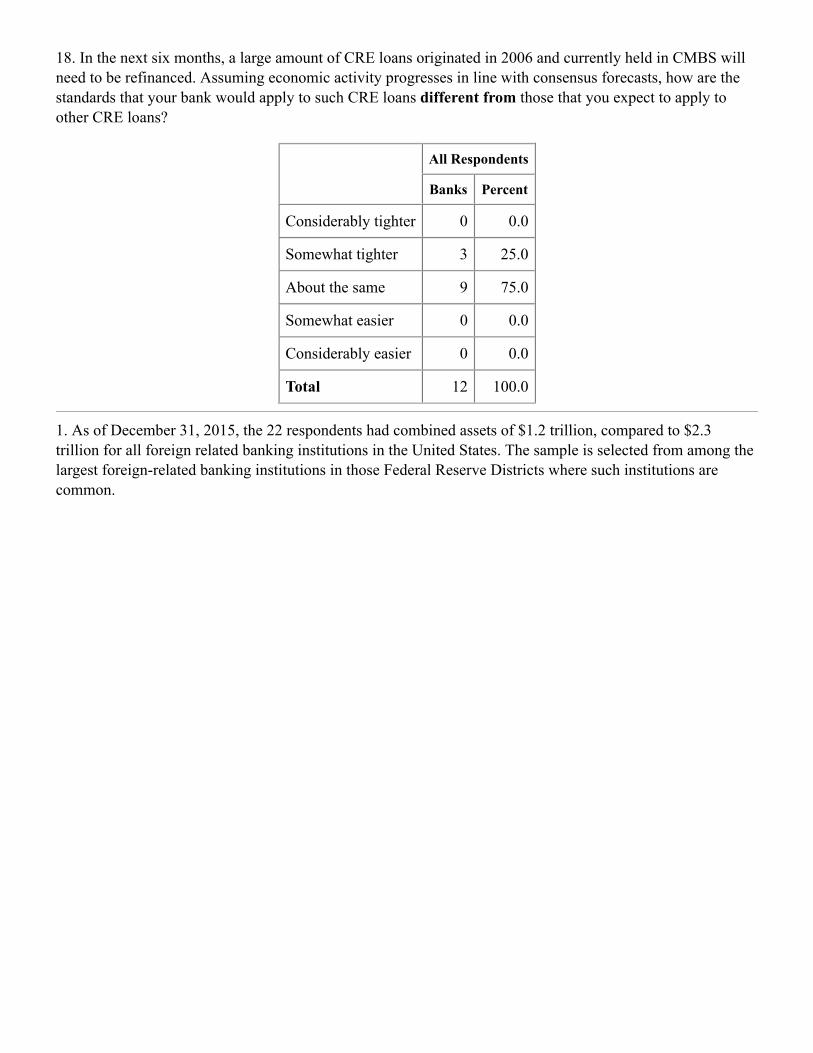
18. In the next six months, a large amount of CRE loans originated in 2006 and currently held in CMBS willneed to be refinanced. Assuming economic activity progresses in line with consensus forecasts, how are thestandards that your bank would apply to such CRE loans different from those that you expect to apply toother CRE loans?
All Respondents
Banks Percent
Considerably tighter 0 0.0
Somewhat tighter 3 25.0
About the same 9 75.0
Somewhat easier 0 0.0
Considerably easier 0 0.0
Total 12 100.0
1. As of December 31, 2015, the 22 respondents had combined assets of $1.2 trillion, compared to $2.3trillion for all foreign related banking institutions in the United States. The sample is selected from among thelargest foreign-related banking institutions in those Federal Reserve Districts where such institutions arecommon.