Embed Size (px)
Citation preview

MinQuest Adds the High Grade Cu-Zn-Pb-Au-Ag “Marg” VMS Deposit To its Copper Project Portfolio
• MinQuest has acquired the rights to earn up to a 75% interest in the Marg Project, a Cu-Zn-Pb-Au-Ag VMS Deposit located in the Yukon Territory of Canada;
• Project hosts the high-grade Marg VMS Deposit containing a total Mineral Resource of 11.74Mt at 1.27% Cu, 3.23% Zn, 1.55% Pb, 0.61g/t Au and 39.78g/t Ag (3.6% Cu Equivalent)*;
• MinQuest’s initial work on the project will be to undertake a limited drill program to collect samples for metallurgical test work, the results from which will allow the accuracy of economic model for the project to be enhanced, which is a Key Decision Point for the commencement of a Feasibility Study;
• The Marg Deposit is open along strike and at depth.
MinQuest will look to expand the current Mineral Resource through extensional drilling, upon commencement of a Feasibility Study;
• The stratigraphic horizon containing the Marg VMS Deposit continues for over 15km within the tenements defining the project area and several highly prospective targets have been identified that are yet to be properly drill tested;
• Good infrastructure exists within the central part of the Yukon, where the Marg VMS Project is located, with a paved main road and an approved upgrade to a 138kV power transmission line within 40km of the project area. The project is accessible via a winter road that extends from the main paved road into the project area and a 380m air strip;
• With the acquisition of the Marg project and its existing Fyre
Lake Copper Project, MinQuest’s project portfolio now contains 700,000t (approx.) of contained Cu Equivalent metal at a grade of 3% CuEq. Copper is currently trading at US$5,858/t.
Highlights 17 March 2015
DIRECTORS David Deloub Chairman Jeremy Read Managing Director Paul Niardone Non-Executive Director Adam Davey Non-Executive Director Kim Clark Company Secretary
SHARE INFORMATION ASX Code: MNQ Issued Capital: 83,458,341 Fully Paid Shares 14,923,097 Unlisted Options
CONTACT INFORMATION Registered Office: 96 Stephens Road South Brisbane, QLD 4101 T: +61 7 3844 0372 F: +61 7 3844 0154 www.minquest.com.au
MinQuest Limited ACN: 146 035 127
For
per
sona
l use
onl
y

INTRODUCTION
MinQuest Limited (“MinQuest” or “The Company”) (ASX:MNQ) is pleased to announce that it has entered into a farm-in joint venture agreement with Golden Predator Corp. (Golden Predator) of Hayden, Idaho. Under this agreement MinQuest has acquired the right to earn up to a 75% interest in the Marg VMS Project (Marg), located in the central part of the Yukon Territory, Canada. The details of the farm-in joint venture agreement (Marg Agreement) and the consideration payable to Golden Predator, for the acquisition of various interests in the Marg Project, are outlined below.
MinQuest’s Managing Director Mr Jeremy Read said, “The Marg is a high grade, high quality, Mineral Resource and the ability to earn up to a 75% interest in the Project is extremely positive for MinQuest.”
“The Project is well serviced by local infrastructure and has an existing work program approval, which means drilling on the project can commence quickly in the northern hemisphere summer.”
“Our plan for the Marg is to collect samples for metallurgical test work this summer field season, allowing us to upgrade our Scoping Study financial model for the project and following that, make a decision regarding the commencement of a Feasibly Study in 2016, along with exploration to define additional mineral resources”
“MinQuest stands apart from other pre-production ASX listed copper companies, due to the overall combined grade of our Mineral Resources on the Marg and Fyre Lake Projects, which at 3% CuEq is significantly above 0.8% CuEq which is the average grade of ASX listed pre-production copper projects, as well as the contained metal within our projects being 700,000t of copper equivalent metal”, said Mr Read.
MinQuest’s joint venture partner on the Marg Project, Golden Predator is focussed on developing its portfolio of gold projects, particularly the Brewery Creek project in the Yukon, which is a past producing heap leach gold mine with a preliminary economic assessment delivered in 2014. Golden Predator also holds the 3 Aces gold project in the Yukon, which it continues to delineate and the Castle West project in Nevada.
THE MARG PROJECT
The Marg project is located in the central Yukon, approximately 40km east of Keno City (Figure 1). The property consists of 402 quartz mining claims covering over 8400 hectares adjacent to the Category A land of the Na-cho Nyak Dun First Nation (Figure 2).
Property Geology
The Marg project consists of the main Marg deposit, a volcanogenic hosted massive sulphide (VHMS) deposit hosted in the metasedimentary and metavolcanic rocks of the Devono-Mississipian Earn Group. The project also contains an additional 15km
For
per
sona
l use
onl
y

long belt of the same felsic metavolcanic and metasedimentary rocks that host the Marg Deposit. Within this belt, soil geochemical sampling has outlined several very promising anomalies that have yet to be properly drill tested.
The Marg deposit consists of three continuous units that contain the majority of the total defined Mineral Resource. The deposit is strongly attenuated and contains an additional eight smaller stacked sulphide lenses. The deposit can be traced in the sub-surface for over 1400m along strike (Figure 3). The deposit is open in both directions along strike and at depth (Figure 4). The main economic mineral species are chalcopyrite, sphalerite and galena associated with pyrite occurring as massive to semi-massive lenses up to 20m thick (averaging 3m to 4m).
A simple evaluation of the deposit in terms of the mining potential shows that the higher grade resource is associated with the thicker zones and tends to be clustered in the central area of the deposit, plunging to the east. Of the 11.7Mt (at a 0.5% Cu cut-off), approximately 8.0Mt are thicker than 3.5m true thickness at grades greater than 2.0% CuEq. The deposit also dips from 45 degree to 70 degrees. These factors present a very positive scenario for the development of mining activities in the future.
Infrastructure
The central region of the Yukon Territory, where the Marg is located, has fairly well developed infrastructure. The Bellekeno Silver Mine, held by Alexco Resources, is located 40km to the west and was operational until late 2013. Currently, their processing plant is on care and maintenance while the company develops further resources and waits for a recovery in the silver price. Recently, the Yukon government has approved the upgrade of the existing transmission line to Keno City from 68kV to a 138kV line. This upgrade is expected to be completed by the end of 2018. From Keno City and the Bellekeno Mine, the Marg project can be accessed by a 40km winter road. The exploration camp is still in place on the project and the majority of the infrastructure is ready for the re-commencement of exploration. A small landing strip for light planes exists on the project and several larger pieces of construction equipment are also on site.
Exploration History
The Marg project area was first staked in 1965 by a joint venture between United Keno Hill Mines Ltd. and Canadian Superior Exploration Ltd. The project changed owners several times while exploration focused on finding a silver deposit similar to Bellekeno Silver Mine. In 1988, the first drill program commenced based on ground geophysics and geochemical soil sampling. A total of 33 diamond drill holes were completed and defined extensive VMS sulphide mineralisation.
The Marg deposit has been explored by nine diamond drill exploration programs from 1988 to 2008. A total of 33,876 metres of diamond drilling in 117 holes has been completed on the project. This drilling has defined mineralisation over 1400 metres strike distance, a down-dip distrance of 700 metres and across a stratigraphic thickness of approximately 100 metres.
For
per
sona
l use
onl
y

The drilling has defined a total Mineral Resource at the Marg Deposit of 11.74Mt at 1.27% Cu, 3.23% Zn, 1.55% Pb, 0.61g/t Au and 39.78g/t Ag utilising a 0.5% Cu cut-off, which has been classified under the JORC Code (2012) as set out below.
Classification Tonnes
(Mt) Cu % Pb (%) Zn (%) Ag (g/t) Au (g/t)
CuEq* (%)
Indicated 3.96 1.57 1.92 3.90 49.40 0.79 4.45 Inferred 7.78 1.12 1.36 2.89 34.88 0.52 3.18
Total 11.74 1.27 1.55 3.23 39.78 0.61 3.61 *The basis of the CuEq calculation is defined in Table 3
The Marg Mineral Resource is reported in accordance with the guidelines of the 2012 edition of the Australia Code for reporting Exploration Results, Mineral Resources and Ore Reserves (the JORC Code). Full details on the resource can be found in the attached JORC Code – Table 1 and Appendices A and B.
The mineralisation at the Marg Deposit remains open down-dip at depth, to the west along strike and to the east along strike at depth. The last drill program was completed in 2008 and further drilling has not yet been conducted to define the extents of mineralisation.
The Marg Mineral Resource is estimated to contain a total of 423,814t of copper equivalent metal. MinQuest’s Fyre Lake project, situated in the south-east Yukon contains the Kona Mineral Resource of 12.57Mt @ 1.56% Cu, 0.09% Co and 0.63g/t Au, which is 2.22% CuEq (see announcement to the ASX on 23 January, 2015). The Kona Mineral Resource is estimated to contain a total of 279,054t of copper equivalent metal. Therefore, MinQuest’s combined metal inventory for the Marg and Fyre Lake projects is 702,868t of copper equivalent metal at a overall grade of 3% CuEq.
Exploration Plan
MinQuest aims to explore the Marg project by drilling at depth and along strike with the intention to increase the size of the JORC compliant Mineral Resources at the Marg deposit. Significant exploration potential remains along the 15km strike length of favourable stratigraphy held within the extent of the projects tenements. The Jane Zone in particular represents a very attractive geochemical anomaly with mapping indicating the Marg VMS bearing horizons exists in the area (Figure 5). MinQuest will test the Jane target, and other targets with the aim to add significantly to the currently defined Mineral Resource within a short distance from the main project site (<20km).
For
per
sona
l use
onl
y
MinQuest also plans to initiate studies for the purpose of updating a Scoping Study. The metallurgical information on the project is limited and work is required to confirm the potential recovery of the various economic elements. MinQuest will select a reputable metallurgical testing company and complete this work from drilling conducted over the northern hemisphere summer months. With this information, MinQuest will be able to update the Scoping Study and determine if a full Feasibility Study on the project is warranted.
Community
The Marg Property lies within a 4739 square kilometre area of Class ‘A’ settlement lands owned by the Na-Cho Nyak Dun (NND) First Nation – The Big River People, most of whose members reside in Mayo, Yukon. MinQuest is committed to developing positive relationships with the local communities in which our projects are located. Negotiations have already begun on the formation of a Memorandum of Understanding for Exploration Agreement with the NND. MinQuest will continue to pursue mutually beneficial agreements with the local community to that will allow for local knowledge and participation in and potential development of the Marg Project.
Commercial Terms of the Marg Project Agreement
The key terms of the Marg Project Agreement are set out below.
First Option
To acquire an initial 25% right, title and interest in the Marg Project, MinQuest will be required to:
(i) following execution of the Marg Agreement (“Effective Date”), pay to Golden Predator CDN$50,000 prior to March 20, 2015.
(ii) no later than 30 November, 2015 issue and deliver to Golden Predator, MinQuest Shares to a Value of CDN$50,000;
(iii) on the first anniversary of the Effective Date, pay CDN$50,000 and issue and deliver to Golden Predator MinQuest Shares to a Value of CDN$50,000;
(v) prior to the second anniversary of the Effective Date, MinQuest must incur not less than an additiional CDN$1,900,000 (or aggregate CDN$2,400,000) in exploration expenditures on the Property.
(iv) prior to the first anniversary of the Effective Date, MinQuest must incur not less than an aggregate CDN$500,000 in exploration expenditures on the Property; F
or p
erso
nal u
se o
nly

Second Option
(i) on the second anniversary of the Effective Date, pay CDN$100,000 and issue and deliver of MinQuest Shares to a Value of CDN$100,000 to Golden Predator;
Third Option
Upon MinQuest earning an aggregate 75% interest in the Property, Golden Predator has the right and option, at its sole discretion (and will notify within 7 days) to either:
or
(ii) convert Golden Predator’s remaining 25% interest to a 3% Net Smelter Return Royalty with MinQuest acquiring 100% interest in the Property. MinQuest, by mutual agreement, will be able to buyout 1% of the Net Smelter Return Royalty for a total of $1,100,000, reducing Golden Predator’s Net Smelter Royalty to 2%.
(ii) prior to the third anniversary of the Effective Date, MinQuest must incur not less than an addition CDN$1,700,000 (or aggregate CDN$4,100,000) in exploration expenditures on the Property.
Upon earning a 25% interest in the Property, MinQuest can, within 30 days of earning the 25% interest, elect to proceed with the second option to earn an additional 26% interest in the Property, for an aggregate 51% interest, by:
(i) enter into a Joint Venture agreement on industry standard terms and conditions. Both parties will develop the Property on a Joint Venture basis and will negotiate and execute an agreement (the “75/25 Joint Venture Agreement”);
Upon earning a 51% interest in the Property, MinQuest can, within 30 days of earning the 51% interest, elect to proceed with the third option to earn an additional 24% interest in the Property, for an aggregate 75% interest in the Property, by:
(i) prior to the forth anniversary of the Effective Date, MinQuest must incur not less than an addition CDN$4,000,000 (or aggregate CDN$8,100,000) in exploration expenditures on the Property;
For
per
sona
l use
onl
y

Table 2: Tenements Comprising the Marg Project
For
per
sona
l use
onl
y

Competent Person Statement - Mineral Resource
This Mineral Resource estimate and technical information related to the estimate in this news release on the Marg Mineral Resources is based on information compiled by Mr. A.A. Burgoyne (P.Eng), who is a member of the Association of Professional Engineers and Geoscientists of British Columbia (APEGBC) and Mr. G.H. Giroux (P.Eng), who is a member of the Association of Professional Engineers and Geoscientists of British Columbia (APEGBC). Mr. Burgoyne and Mr. Giroux provided information to MinQuest Ltd. as paid consulting work in their capacity as Competent Persons and the results or conclusions reported were not contingent on payments. They are professionally and financially independent of MinQuest and of the Marg Project. They have sufficient experience, which is relevant to the style of mineralisation and type of deposit under consideration and to the activity being undertaken, to qualify as Competent Persons as defined in the 2012 Edition of the “Australasian Code for Reporting of Exploration Results, Mineral Resources and Ore Reserves” (the JORC Code) and “Qualified Person” as this term is defined in Canadian National Instrument 43-101 (“NI 43-101”). Mr. Burgoyne and Mr. Giroux consent to the inclusion in this news release the information in the form and context in which it appears. The technical report can be found under Redtail Metals Corp. on SEDAR (www.sedar.com).
The information in this report that relates to exploration results is based upon information reviewed by Mr Chris Doornbos BSc (Hons) who is a Member of the Australasian Institute of Mining and Metallurgy and a Professional Member of the Association of Professional Engineers and Geoscientists of Alberta. Mr Doornbos is a full time employee of MinQuest Limited and has sufficient experience which is relevant to the style of mineralisation and type of deposit under consideration and to the activity which he is undertaking to qualify as a Competent Person as defined in the 2012 Edition of the ‘Australasian Code for Reporting of Exploration Results, Mineral Resources and Ore Reserves‘. Mr Doornbos consents to the inclusion in the report of the matters based on his information in the form and context in which it appears. Mr Doornbos is the Exploration Manager of MinQuest and currently owns 1,278,788 Fully Paid Ordinary Shares and has the entitlement to a further 606,060 deferred consideration shares subject to relevant milestone events being achieved.
Forward Looking Statements
This announcement contains “forward-looking statements”. Such forward-looking statements include, without limitation: estimates of future earnings, the sensitivity of earnings to commodity prices and foreign exchange rate movements; estimates of future production and sales; estimates of future cash flows, the sensitivity of cash flows to commodity prices and foreign exchange rate movements; statements regarding future debt repayments; estimates of future capital expenditures; estimates of resources and statements regarding future exploration results; and where the Company expresses or implies an expectation or belief as to future events or results, such expectation or belief is expressed in good faith and believed to have a reasonable basis. However, forward looking statements are subject to risks, uncertainties and other factors, which could cause actual results to differ materially from future results expressed, projected or implied by such forward-looking statements. Such risks include, but are not limited to commodity price volatility, currency fluctuations, increased production costs and variances in resource or reserve rates from those assumed in the company’s plans, as well as political and operational risks in the countries and states in which we operate or sell product to, and governmental regulation and judicial outcomes. For a more detailed discussion of such risks and other factors, see the Company’s Annual Reports, as well as the Company’s other filings. The Company does not undertake any obligation to release publicly any revisions to any “forward looking statement” to reflect events or circumstances after the date of this release, or to reflect the occurrence of unanticipated events, except as may be required under applicable securities laws.
For
per
sona
l use
onl
y

Copper Equivalence Notes
The Copper Equivalent (CuEq) values are calculated based on the metrics in Table 3, such that CuEq = Cu Grade + ((Zn Grade x Zn Recovery x Zn Price) + (Pb Grade x Pb Recovery x Pb Price) + (Ag Grade x Ag Recovery x Ag Price) + (Au Grade x Au Recovery x Au Price)) / (Cu Recovery x Cu Price)
Table 3 – Values used to calculate copper equivalence (USD)
Type Value Unit Cu price $2.60 $/lb Zn price $0.93 $/lb Pb price $0.81 $/lb Au price $1200 $/troy oz Ag price 16.30 $/troy oz Cu recovery 70 % Zn recovery 75 % Pb recovery 50 % Au recovery 70 % Ag recovery 70 %
It is the company’s opinion that the metals used to calculate the copper equivalent grade have a reasonable chance of being recovered and sold.
For
per
sona
l use
onl
y

0 5 10 15 20 km
UTM Projection. Zone 8. NAD83 Datum.
5.165 Mt @ 302 g/t Ag, 1.4% Pb,3.8% Zn, 50.213 Moz Ag (indicated)0.836 Mt @ 350 g/t Ag, 2.0% Pb,4.9% Zn, 9.403 Moz Ag (inferred)
MARG
Janet Lake
Mayo Lake
Tiny Island Lake
Dawson City 225 km
Whitehorse 400 km
11.74 Mt @ 1.27% Cu, 3.23% Zn,1.55% Pb, 0.61 g/t Au, 39.78 g/t Ag
McQuestenLake
McQuesten
South
Riv
er
WilliamsonLake
Elsa Keno
Mayo
SILV
ER
TRAIL
EdwardsLake
STEWART
RIVER
Keno
Ladue
River
Beaver
River
L A
DU
E R
AN
GE
G U S T A V U S R A N G E
N E L S O N R I D G E
P A T T E R S O N
R A N G E
D A V I D S O N
R A N G E
BellekenoSilver Mine
460000
460000
480000
480000
500000
500000
520000
520000
540000
540000
7060000 7060000
7080000 7080000
7100000 7100000
Drawn: RRM
Checked: C. Doornbos
Date: 24.02.2015 Revision:
Drawing No.: MARG-001.mxdFigure 1
MARG PROJECT - YUKON, CANADAREGIONAL LOCATION MAP
YUKON
U.S.A.(Alaska)
C A N A D A
MARGPROJECT
Inuvuk
Nome
Calgary
Edmonton
Fairbanks
Anchorage
Vancouver
Whitehorse
Prince Rupert
160�W 140�W 120�W50�N
60�N
70�N
1,000 km
LOCALITY MAP
Town or settlement
River or creek
Lake
Highway
Minor road
Winter road
For
per
sona
l use
onl
y

0 5 10 km
UTM Projection. Zone 8. NAD83 Datum.
Mayo Lake
Tiny Island Lake
McQuestenLake
Elsa Keno
TRAIL
Keno
Ladue
River
Beaver
River
LA
DU
E R
AN
GE
G U S T A V U S R A N G E
P A T T E R S O N
R A N G E
D A V I D S O N
R A N G E
BellekenoSilver Mine
Dun
can
Creek
SILVER
RoopLakes
Roop
Creek
JANE ZONE
LEYLA SHOWING
MARG VMS DEPOSIT
MOUNT PATTERSONMOUNT CAMERON
MOUNT WESTMAN
MOUNT ALBERT
Camp & Airstrip
480000
480000
500000
500000
520000
520000
540000
540000
7080000 7080000
7100000 7100000
Drawn: RRM
Checked: C. Doornbos
Date: 25.02.2015 Revision:
Drawing No.: MARG-002.mxdFigure 2
MARG PROJECT - YUKON, CANADAACCESS MAP
Town or settlement
River or creek
Lake
Category A/B Land - NND
Quartz Claim
Highway
Minor road
Winter roadTopographic form lines are shown
at 500’ intervals.
For
per
sona
l use
onl
y

0 100 200 m
UTM Projection. Zone 8. NAD83 Datum.
FOOTWALL
FA ULT
HANGING W ALL
FAULT
DMv
DMps
DMv
DMps
DMps
Td
Mq
Mq
MqMq
CROS
S-SE
CTIO
N52
5900
E
OPEN
OPEN(at depth)
525000
525000
525500
525500
526000
526000
7098000 7098000
7098500 7098500
Drawn: RRMChecked: C. Doornbos
Date: 25.02.2015 Revision: Drawing No.: MARG-003.mxd Figure 3
MARG VMS DEPOSIT - YUKON, CANADAGEOLOGY MAP
Massive sulphide horizon (at surface)Massive sulphide horizon (at depth)Diamond drill hole and trace
Geological contact, accurateGeological contact, inferredFault, accurateFault, inferred
Td
Mq
DMpsDMv Earn Group
Felsic metavolcanic rocks
Earn GroupArgillaceous metasedimentary rocks
Keno Hill QuartziteQuartzite and graphitic phyllite
Gabbro, dolerite
DEVONIAN TO MISSISSIPPIAN
MISSISSIPPIAN
TRIASSIC
from Redtail Metals Corp., 2013
For
per
sona
l use
onl
y

0 100 200 300 m
DMv
DMpsMq
HANGINGWALL
FAULT
FOOTW
ALLFA
ULT
Mq
DMps
Mq
Mq
88-14
88-2888-21
96-49
96-50
96-48
89-3596-51
89-34
88-30A
D1
C B4
A2 A1
B3
B5
7098000N 7098200N 7098400N
1500m
1400m
1300m
1200m
1100m
1000m
900m
NORTHSOUTH
OPEN
Drawn: RRM
Checked: C. Doornbos
Date: 25.02.2015 Revision:
Drawing No.: MARG-004.mxdFigure 4
MARG VMS DEPOSIT - YUKON, CANADACROSS-SECTION 525900E
Massive sulphide horizonDiamond drill hole and traceGeological contact, inferredFault, inferred
Mq
DMps
DMv Earn GroupFelsic metavolcanic rocks
Earn GroupArgillaceous metasedimentary rocks
Keno Hill QuartziteQuartzite and graphitic phyllite
DEVONIAN TO MISSISSIPPIAN
MISSISSIPPIAN
from Carne & Giroux, 2007
HoleWidth
mCu%
Zn%
Agg/t
Aug/t
Horizon
88-28 1.90 2.26 5.62 83.0 0.85 D188-21 1.59 1.16 2.70 44.2 0.44 D1b
3.35 2.56 5.25 156.2 1.17 D1a2.50 1.46 4.10 61.0 0.75 C5.05 1.50 4.84 67.5 1.06 B53.60 0.75 2.02 32.9 0.21 B3
88-30A 3.55 1.05 5.21 58.3 0.92 D11.70 0.89 2.74 40.8 0.58 B54.91 0.57 1.84 27.4 0.34 B41.85 1.25 3.91 47.3 0.72 B3
89-34 3.36 1.34 3.99 47.3 0.58 D196-48 8.60 1.96 5.53 76.2 1.02 D1
1.22 0.62 2.10 39.5 0.27 C4.30 1.10 3.54 68.8 1.22 A2
96-49 4.83 1.88 3.90 46.5 0.69 D15.71 1.51 4.87 70.1 0.75 C0.55 1.65 4.82 63.1 0.62 B51.29 1.63 4.32 56.7 0.79 B3
96-50 3.43 2.33 3.22 43.0 0.83 D16.96 0.79 2.27 40.1 0.58 B51.86 0.87 2.23 43.5 0.34 B33.73 1.17 3.88 63.3 0.55 A21.75 0.73 3.08 54.5 0.69 A1
96-51 5.80 1.58 4.58 49.0 0.31 D1
For
per
sona
l use
onl
y

Jane Zone
Leyla Showing
Marg VMS Deposit
515,000 520,000 525,000 530,000
7,09
5,00
0
7,09
5,00
0
7,10
0,00
0
7,10
0,00
0
¹Quartz Claims
ActiveFirst Nation Land
A LandB Land
MARG Winter Road0 1 2
Kilometers
Marg Property Geology and Prospect Map
Projection: NAD 1983 UTM Zone 8N Location: 85 km NE of Mayo, Yukon
Faro
Whitehorse
RossRiver
WatsonLake
Ala
s ka
NorthwestTerritories
British Columbia
YukonTerritory
MARG_PropertyGeology_20140401
!(̂_ VMS Deposit, Showing
(( (( Thrust Fault
GeologyDiorite, Gabbro and Pyroxenite
Earn Group Argillaceous
Earn Group Metavolcanic
Hyland Group
Keno Hill Quartzite
Marg
1:40,000
^̂
Figure 5For
per
sona
l use
onl
y

Criteria DetailsThe buried VMS mineralization of the Marg deposit was sampled by surface diamond drilling. Three companies, Marg JV, NDU Resources and Yukon Gold Corp. Ltd. Completed 119 holes over 33, 876.3 m of continuous NQ and HQ diamond drilling in 1988 to 1997 (5 seasons) and 2005 to 2008 (4 seasons). Drill holes varied from 54m to 499m in length.
Diamond drill core zones of volcanic massive sulfide mineralization were cut in half by manual or diamond saw. The sampling lengths were 0.3 to3.1m of mineralized core. The 1.5 m to3.1 m intervals were largely during the 1988 program. Sampling of mineralization was mostly in the 0.3 to 1.5minterval range. Sample breaks were made at change of lithology and VMS horizons.A split sample of 0.5 m or longer was taken from underlying and overlying wall rock units of each mineralized zone of visible mineralizationDrilling was completed over 1400m of strike length and about 700 m of down dip on drill lines perpendicular to strike and dip of VMS horizons.
Drilling from 1988 to 2007 was carried out by Caron Diamond Drilling using a Longyear 38 drill. Drill core was not oriented. Drilling in 2008 was by Orofino Drilling using a JKS 300 hydraulic-‐helicopter-‐portable drill.
Core recovery is generally very good with mineralized intersections average more than 90%.All recovered drill core was thoroughly measured and the recoveries and rock quality data (RQD) were recorded first as hand writtenlogs and later this data were entered daily into a spreadsheet-‐style database on site.
Drill core over the years was logged for mineralization, lithology and alteration and geotechnical by experienced geologist using drill log forms developed by Archer Cathro & Associates. The mineralized intercepts were marked and sampled and logged in detail by qualified geologists.Nomenclature used was based on observed metamorphic assemblages. Correlated lithologies from drill hole are based on the best mechanical fit.Care was taken to sample the same side of the core, identify situations where mineralization is not evenly distributed throughout the coreand recognize potential bias that could occur due to incomplete core recovery.The drill core was geologically and geotechnically logged in detail and this level of detail was and is appropriate for mineral resource estimation.
The diamond drill core was split in half length-‐wise using a manual core splitter or diamond saw. One-‐ half of the mineralized core was sent for assay. Certain sections of drill core (one-‐half of the remaining core ) were sent for metallurgical studies. In 2008 one-‐quarter of the mineralized core was sent for metallurgical testing.Quality control procedures was appropriate for the industry standard at the time. During the 2005 through 2008 drilling seasons extensive QA/QCwas done in accordance with Canadian NI 43-‐101 standards..The sample preparation was appropriate. The samples were split, double bagged and securely stored prior to direct shipping to ALS ChemexLabs of North Vancouver, BC. The samples were weighed, dryed and crushed to 70% minus 2 mm, before a 250 g split was taken and pulverizedto better than 85% minus 75 microns.Duplicate samples were prepared and analysed at Acme laboratories using methods similar to ALS Pulps and coarse rejects were sentsent as check samples to Acme laboratories.There was a continuous chain of command for the drill core samples.
A 50 g split of the pulverized fraction was dissolved in aqua regia and analysed for 50 elements by a combination of ICPMS and ICPAES techniques.Atomic absorption was also used. A 30 gram split was analysed for gold with a fire assay preparation and AAS finish. Over limit copper, lead, zinc, and silver values were determined using atomic absorption spectroscopy (AAS) methods.Both ALS Chemex and Acme Laboratories were ISO 9001:2000 certified. In 2008 ALS Chemex completed multi-‐element analysis by the ME-‐MS41method. The elements of economic interest are copper, lead, zinc, silver and gold. All analyses over 1% Cu, Pb, Zn were reanalysed.In 2008 Cu, Zn, Pb, and Ag were analysed by ICP-‐MS and gold by using fire assay and ICP-‐MS.The 2005 to 2008 duplicate, blank and standard analyses does not revel any discrepancies beyond normally expected analytical variability. The2005 to 2008 sample preparation and analysis for the drilling programs were similar.
The four drilling programs of 2005, 2006, 2007, and 2008 undertook quality assurance and quality control programs.All of the exploration work conducted on the Marg Property from 1988 through 2008 was performed by competent, professionally qualified personsDue diligence studies by the Competent Persons include those completed during the site visit in April 2011 and review of the data on this Property during April and May 2011 and November 2013 include: Property site visit by Competent Person in April 2011.
Marg Deposit Mineral Resource 2013 -‐ JORC CODE -‐ Table 1
Section 1: Sampling Techniques and Data
Quality of assay data and laboratory tests
Sub-‐sampling and sample preparation
Logging
Sampling Techniques
Verification of sampling and assaying
Drill Sample Recovery
Drilling Techniques
For
per
sona
l use
onl
y

A detailed review of a large database of technical reports and geologic model with respect to controls on mineralization. . Auditing and checking of calculations leading to mineral Resource estimate Review of QA/Qc procedures. Duplicate sample interval analyses by Competent person in 2011 from 5 drill holes completed in 2007 and 2008; this gave good repeatability for all metals.
Hole collar locations were surveyed in 1988 by Underhill Engineering Ltd. of WhitehorseIn 1996 a new baseline and a number of cross lines were established in by Yukon Engineering Services Ltd. from which they tied in the previous drillholes completed in 1988, 1989, 1990, and 1996.The 1997, 2000, 2005 and 2006, 2007 and 2008 drill hole collars were referenced with chain and compass to the 1996 grid which was resurveyed for location by Underhill Engineering Ltd with differential GPS. In 2007 and 2008 Underhill resurveyed the drill holes using differential GPS. The drill holes are surveyed in UTM NAD 83 coordinates.Down hole surveys included acid tests (1988), and later a Pajari down hole magnetic survey tool to measure horizontal and vertical deviations.The 2005, 2006, 2007 and 2008 drilling programs used Icefield digital and Pajari down the hole surveys.
In the early drilling years the drilling of mineralization was in the order of 80 to 100m spacing. Infill drilling for most of the now defined east half of the Marg Deposit was completed at 40 to 50m spacing.It is the Qualified Persons opinion that the drill spacing and distribution is sufficient to establish the geometry and continuity of the strataboundVMS mineralization within its drill tested strike length. During resource estimation drill holes were "passed through" geologic solids with the intervals within each solid capped. Uniform 1.5 m compositeswere formed from capped assays to honour the boundaries of each solid. Note Section 3.
It is the opinion of the Competent person that there is no obvious bias between the sampling and the orientation of drilling along the trend andplunge of the 9 massive sulfide lenses. Each mineralized zone or lens was pierced and sampled multiple times by several drill holes.The mineralized massive sulfide lenses are sub parallel, trend from 060 degrees to 090 degrees and dip from 30 to 50 degrees south. Drilling was done mostly perpendicular to stike and dip.
There was a continuous chain of command for the drill core samples. Samples were normally transported to Mayo, YT to the ALS Chemex preparation lab in Whitehorse, Y.T. For 2008 the core samples were delivered to G&T Metallurgical Services in Kamloops, BC.Pre 2005 drilling programs(1988 to 1997) site security at the Marg Deposit followed normal mining company security standards of the time. Drillcore and bagged core samples were kept in a secure room or place.
The Competent Person completed a duplicate sampling program in 2011 of five drill holes.In 2008 Yukon Gold Corporation completed an audit of the survey and drill hole data including down-‐hole surveys.In 2011 Redtail Metals Corp., at the request of the Competent Persons, completed a full and detailed audit of the assay database.
The Competent Persons that have worked on the Marge Deposit have not identified any significant issues with respect to geologicalunderstanding or exploration data integrity.
Criteria DetailsAs of November 30, 2013 the Property comprised 402 Yukon Quartz mineral claims in the Mayo Mining District and owned and operated by Golden Predator Mining Corp. (formerly Redtail Metals Corp.) The Property lies within settlement lands owned by Na-‐Cho Nyak Dun First Nations. The mineral sub-‐surface rights to the Property existed prior to the settlement with Na-‐C Nyak Dun First Nations.The holder of existing mineral rights on settlement land has a right of access to exercise mineral rights , without consent of the First Nations.The Competent person has not reviewed the mineral title or status of the mineral claims since November 30, 2013. The mineral claims were correctly staked and recorded at the time of this report. There is no known impediments to exploration, regulatory or environmental at the time.
The property was first staked by a joint venture between United Keno Hill Mines Ltd. and Canadian Superior Exploration Ltd. This staking was basedon results from a Geological survey of Canada stream sediment survey. Prospecting, soil and stream sediment surveys were carried out in the searchfor silver mineralization and, as none was found, the claims were allowed to lapse. In 1982 the area was re-‐staked by ZX Joint Venture between SMD Mining Co. Ltd., Chevron Minerals Ltd. And Enterprise Exploration Ltd. Exploration
Section 2: Reporting of Exploration Results
Mineral tenement and land tenure status
Audits or reviews
Sample security
Orientation of data in relation to geological structure
Data spacing and distribution
Location of Data points
Verification of sampling and assaying
Exploration done by other parties.
For
per
sona
l use
onl
y

included hand trenching in geochemically anomalous areas in the search for SEDEX lead-‐zinc mineralization. Enterprise abandoned their interest andthe Property was optioned to All-‐North Resources who earned an interest through geochemical and geophysical surveys.In 1987 NDU Resources Ltd. Purchased All-‐North's interest and Chevron converted to a 5% net profits interest. This resulted in NDU controlling 66 2/3% interest of the joint venture with Cameco with 33 1/3 %. The 1988 program consisted of claim staking, geological, geochemical and geophysicalsurveys (VLF and Pulse EM) plus 6,038 m of diamond drilling in 33 holes, which defined extensive volcanogenic massive sulfide mineralization. A 380m airstrip was completed and water environmental monitoring studies commenced. The 1989 program consisted of 1819 m of drilling in 5holes. Work in 1990 with 10 drill holes totaling 4120 m. Further hand trenching and environmental monitoring continued. The project was re-‐activated in 1996 with 8518 m of diamond drilling in 29 holes; environmental water sampling was completed.In 1997 United Keno Hill Mines Ltd. Acquired the NDU interest and completed 2540 m of diamond drilling in 7 holes.. In 2000 Atna Resources Ltd. purchased the United Keno interest in the Property and formed a joint venture with Cameco. Exploration consisted of geological mapping, soilsampling, and prospecting and completion of 1:5000 scale orthophoto base map at 10 m contours. In 2005 Atna sold the Property to Yukon Gold Corporation Inc. In 2005 1185m of diamond drilling over 4 holes. In 2006 2986 m of diamond drilling over 9 holes program was completed.A resource estimate was completed by Gary Giroux in 2006.
In 2007 a further 2395 m of diamond drilling over 7 holes was completed on the marge VMS lenses and a further 603 m of drilling over 4 holes on outlying targets. In 2008 Yukon Gold completed a further 3674m of drilling over 6 holes; also, a resource estimate was completed.In 2007 a further 2395 m of diamond drilling over 7 holes was completed on the marge VMS lenses and a further 603 m of drilling over 4 holes on In 2009 Yukon gold acquired a 100% beneficial interest to the Property.In 2010 Yukon Gold went into bankruptcy and in 2011 Lance Capital Ltd. Acquired the Property. In early 2011 Redtails Metals Corp. (now GoldenPredator Mining Corp.) completed an agreement with Lance Capital and acquired a 100% interest in the Property in October 2012.
The Marg Property contains a 15 km long belt of favourable Devono-‐Missippian felsic metavolcanics and metasedimentary rocks that host the Marg Deposit. The Marg Deposit, a volcanic massive sulphide (VMS) deposit is hosted within a long belt of geology favourable for the occurrence of VMS mineralization. The massive sulphide mineralization is recessive in nature and does not outcrop. Eleven stacked but internally continuous disconnected sulphide layers are present although the bulk of the resource occurs within three layers, D1, B3 and B4. The massive sulphide layers are up to 23m in thickness and average 3-‐4 m. This drilling has defined mineralization over a 1.4 km trend distance, a down dip distance of 700 metres and across a stratigraphic thickness of approximately 100 metres.The mineralized sheets or horizons are sub parallel, trend from 060 degrees to 090 degrees and dip from 30 to 50 degrees south. The horizons are up to 23m thick and average 3-‐4m.Sulphide minerals consist of pyrite, sphalerite, chalcopyrite, galena, tetrahedrite and arsenopyrite. In a gangue of ferro carbonate, muscovite and magnetite.Sulphide horizons vary from thin bands of massive sulphide at the centimetre scale with wall rock composed of semi-‐massive sulphide to mineralogically banded or texture less massive sulphide and contact with footwall or hangingwall lithologies can be abrupt or gradational.
All drilling to date has been by wire line diamond core drilling. Drilling on the Marg Deposit in 1988, 1989, 1990, 1996, 1997, and 2005 through2008 involved a total of 33,876.3 metres over 117 core drill holes. Diamond drill hole data including hole number, depth, northing, easting, elevation, azimuth and dip are given in Appendix A. Figure 3 should bereferred to for drill hole locations on Marg Deposit. The listing of significant diamond drill hole intersections are given in Appendix B. The reported intersections are from drill holes that intersected the massive sulfide lenses approximately perpendicular to dip and trend. The estimated true thickness of the intercepts is not reported.The drilling was completed over approximately 1400 metres of strike length and about 700 metres down dip on drill lines perpendicular to the dip and trend.
Reported mineralized intercepts were weight averaged from the original, uncut assay results. The intercept lengths were determined firstly based upon distinct visual contacts, given the stratiform nature of the mineralization and second largely on values that exceeded 0.5% copper. Metal equivalents were not used for geomodelling, resource interpolation and estimates, and reporting.No cut-‐off grades were applied prior to geomodelling.
All mineralized intercepts were reported based on drill core lengths, not true widths. The reasoning being that the stratiform VMS mineralization is slightly crenulated locally leading to differences in true widths. Most intercepts report mineralization perpendicular to dip and trend of the rocksand the VMS stratiform mineralization.The resource method uses all intercepts to produce a grid of blocks in which the geomodelling for resource estimation is given in Section 3.The mineralized sheets or horizons are sub parallel, trend from 060 degrees to 090 degrees and dip from 30 to 50 degrees south. The horizons are up to 23m thick and average 3-‐4m.Figure 3 gives the diamond drill hole locations for the Marg VMS deposit.Diagrams
Relationship between mineralisation widths and intercept lengths
Data aggregation methods
Drill hole information
Geology
Exploration done by other parties.
For
per
sona
l use
onl
y
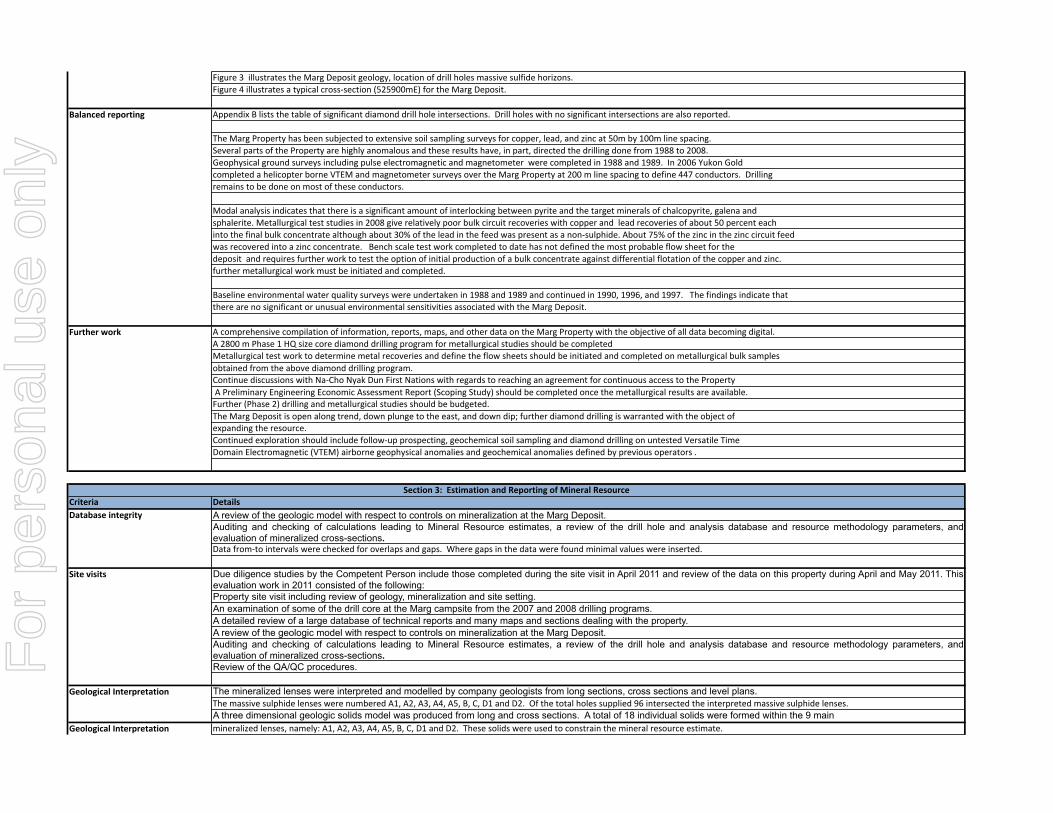
Figure 3 illustrates the Marg Deposit geology, location of drill holes massive sulfide horizons.Figure 4 illustrates a typical cross-‐section (525900mE) for the Marg Deposit.
Appendix B lists the table of significant diamond drill hole intersections. Drill holes with no significant intersections are also reported.
The Marg Property has been subjected to extensive soil sampling surveys for copper, lead, and zinc at 50m by 100m line spacing. Several parts of the Property are highly anomalous and these results have, in part, directed the drilling done from 1988 to 2008.Geophysical ground surveys including pulse electromagnetic and magnetometer were completed in 1988 and 1989. In 2006 Yukon Goldcompleted a helicopter borne VTEM and magnetometer surveys over the Marg Property at 200 m line spacing to define 447 conductors. Drilling remains to be done on most of these conductors.
Modal analysis indicates that there is a significant amount of interlocking between pyrite and the target minerals of chalcopyrite, galena and sphalerite. Metallurgical test studies in 2008 give relatively poor bulk circuit recoveries with copper and lead recoveries of about 50 percent each into the final bulk concentrate although about 30% of the lead in the feed was present as a non-‐sulphide. About 75% of the zinc in the zinc circuit feed was recovered into a zinc concentrate. Bench scale test work completed to date has not defined the most probable flow sheet for the deposit and requires further work to test the option of initial production of a bulk concentrate against differential flotation of the copper and zinc.further metallurgical work must be initiated and completed.
Baseline environmental water quality surveys were undertaken in 1988 and 1989 and continued in 1990, 1996, and 1997. The findings indicate thatthere are no significant or unusual environmental sensitivities associated with the Marg Deposit.
A comprehensive compilation of information, reports, maps, and other data on the Marg Property with the objective of all data becoming digital.A 2800 m Phase 1 HQ size core diamond drilling program for metallurgical studies should be completed Metallurgical test work to determine metal recoveries and define the flow sheets should be initiated and completed on metallurgical bulk samples obtained from the above diamond drilling program.Continue discussions with Na-‐Cho Nyak Dun First Nations with regards to reaching an agreement for continuous access to the Property A Preliminary Engineering Economic Assessment Report (Scoping Study) should be completed once the metallurgical results are available.Further (Phase 2) drilling and metallurgical studies should be budgeted.The Marg Deposit is open along trend, down plunge to the east, and down dip; further diamond drilling is warranted with the object of expanding the resource.Continued exploration should include follow-‐up prospecting, geochemical soil sampling and diamond drilling on untested Versatile Time Domain Electromagnetic (VTEM) airborne geophysical anomalies and geochemical anomalies defined by previous operators .
Criteria DetailsA review of the geologic model with respect to controls on mineralization at the Marg Deposit.Auditing and checking of calculations leading to Mineral Resource estimates, a review of the drill hole and analysis database and resource methodology parameters, andevaluation of mineralized cross-sections.Data from-‐to intervals were checked for overlaps and gaps. Where gaps in the data were found minimal values were inserted.
Due diligence studies by the Competent Person include those completed during the site visit in April 2011 and review of the data on this property during April and May 2011. Thisevaluation work in 2011 consisted of the following:Property site visit including review of geology, mineralization and site setting.An examination of some of the drill core at the Marg campsite from the 2007 and 2008 drilling programs.A detailed review of a large database of technical reports and many maps and sections dealing with the property.A review of the geologic model with respect to controls on mineralization at the Marg Deposit.Auditing and checking of calculations leading to Mineral Resource estimates, a review of the drill hole and analysis database and resource methodology parameters, andevaluation of mineralized cross-sections.Review of the QA/QC procedures.
The mineralized lenses were interpreted and modelled by company geologists from long sections, cross sections and level plans. The massive sulphide lenses were numbered A1, A2, A3, A4, A5, B, C, D1 and D2. Of the total holes supplied 96 intersected the interpreted massive sulphide lenses.A three dimensional geologic solids model was produced from long and cross sections. A total of 18 individual solids were formed within the 9 main mineralized lenses, namely: A1, A2, A3, A4, A5, B, C, D1 and D2. These solids were used to constrain the mineral resource estimate.
Section 3: Estimation and Reporting of Mineral Resource
Site visits
Database integrity
Further work
Balanced reporting
Geological Interpretation
Diagrams
Geological Interpretation
For
per
sona
l use
onl
y

The drilling has defined mineralization over a 1.4 km trend distance, a down dip distance of 700 metres and across a stratigraphic thickness of approximately 100 metres.
Assays within the mineralized lenses were capped at 5.1% Cu, 6.4% Pb, 11 % Zn, 20o g/t Ag and 5 g/t Au. Uniform 1.5 m down hole composites were produced to honour the boundaries of the mineralized solids. Composites were made from capped assays.Pairwise relative semivariograms were used for each variable within the largest D1 Lens. This model was used for all other lenses. The semivariogram parameterswere used to orient and dimension the search ellipses for each lens. Ordinary kriging was used to interpolate grades into blocks 10 m (E-‐W), 5 m (N-‐S) and 2.5 m(vertical). The block model was generated in GemCom software and the kriging was completed using Techbase Software.The estimated blocks were compared to drill hole composites on sections and level plans and found to be reasonable.
A total of 117 specific gravity measurements have been made on the Marg project using the Archimedes methodology on drill core. The results were compared to acombined Cu+Zn+Pb grade on a scatter plot. The regression equation was used to estimate a bulk density for a block based on the estimated grades for Cu+Zn+Pb.
The results are presented using a Cu cut-‐off and then a Zn cut-‐off for the material within the mineralized lenses. At this time metal recoveries are still uncertain andas a result a NSR cut-‐off could not be determined. A 0.5 % Cu cut-‐off was highlighted as a base case for the resource estimation.
While the deposit would most likely be mined using underground methods no assumptions on mining have been made at this time. Whole block grades are showntabulated at various cut-‐offs using estimated waste grades from material outside the mineralized solids. While it is unlikely that the dilution of a 10 x 5 x 2..5 m block wouldbe used these values have been estimated.
Metallurgical test studies in 2008 give relatively poor bulk circuit recoveries with copper and lead recoveries of about 50 percent each into the final bulk concentrate although about 30% of the lead in the feed was present as a non-‐sulphide. About 75% of the zinc in the zinc circuit feed was recovered into a zinc concentrate. Bench scale test work completed to date has not defined the most probable flow sheet for the deposit and requires further work to test the option of initial production of a bulk concentrate against differential flotation of the copper and zinc.further metallurgical work must be initiated and completed.
Baseline environmental water quality surveys were undertaken in 1988 and 1989 and continued in 1990, 1996, and 1997. The findings indicate thatthere are no significant or unusual environmental sensitivities associated with the Marg Deposit.
Geologic continuity has been established through diamond drilling over a number of drill campaigns with the mineralized lenses interpreted from reasonably spaced drill fences.Grade continuity can be quantified by semivariogram analysis for each variable. The estimation process was completed in a series of 4 passes with the search ellipse dimensions tied to the semivariogram ranges. The first pass used dimensions equal to 1/4 of the semivariogram range. A minimum of 3 composites were required within the search ellipsoid to estimate a block. For blocks not estimated in pass 1 a second pass using 1/2 the semivariogram range was completed. A third pass using the full range and a fourth pass using twice the range completed the kriging exercise. For this resource estimate the density of drilling, number of intersections within each lens and the small number of blocks estimated in the first pass using ¼ of the semivariogram range has precluded classifying any of the resource as measured. Blocks estimated in Passes 1 and 2 were classed indicated with all other blocks classed inferred.
Classification
Environmental factors or assumptions
Metallurgical factors or assumptions
Mining factors or assumptions
Moisture and Bulk Density
Estimation and modelling techniques
Dimensions
Geological Interpretation
For
per
sona
l use
onl
y

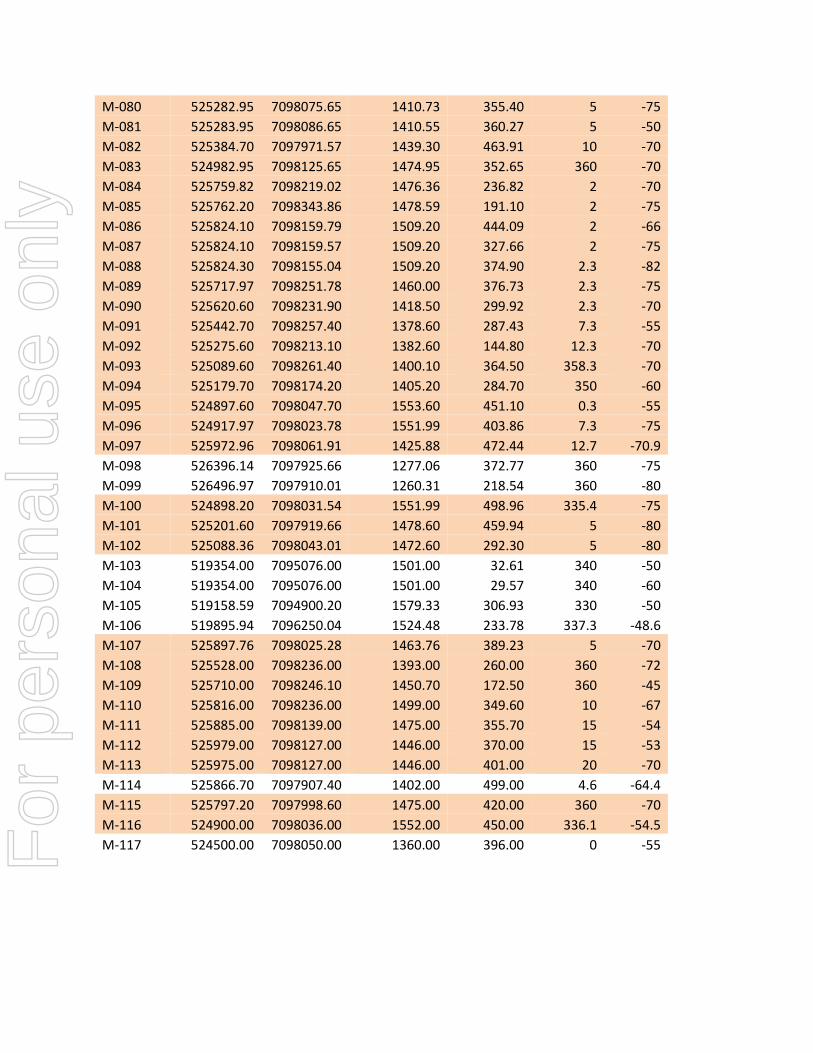
APPENDIX A – LISTING OF DRILL HOLES ON MARG Holes which intersected the massive sulphide lenses are highlighted
HOLE EASTING NORTHING ELEVATION HLENGTH AZIMUTH DIP
M-001 524974.65 7098389.35 1373.34 181.97 343 -50
M-002 525766.05 7098463.25 1435.10 113.08 359 -50
M-003 525766.05 7098463.25 1435.14 81.38 359 -80
M-004 525673.05 7098369.15 1436.42 91.14 3 -50
M-005 525673.05 7098369.15 1436.42 87.48 3 -70
M-006 525603.65 7098264.85 1413.86 145.39 2 -50
M-007 524584.85 7098261.05 1324.90 139.29 343 -50
M-008 525080.15 7098498.65 1357.40 124.05 340 -50
M-009 525610.75 7098359.95 1409.81 163.68 354 -50
M-010 525767.55 7098400.05 1461.29 156.05 358 -70
M-011 525767.55 7098400.05 1461.28 172.82 358 -85
M-012 525826.15 7098441.65 1458.70 134.72 358 -50
M-013 525826.15 7098441.65 1458.77 124.05 358 -70
M-014 525876.85 7098446.65 1467.56 153.92 358 -50
M-015 525690.85 7098423.25 1429.87 96.92 0 -50
M-016 525683.15 7098302.55 1443.28 213.66 358 -50
M-017 525683.15 7098302.55 1443.28 160.02 0 -65
M-018 525683.15 7098302.55 1443.28 130.76 0 -80
M-019 525760.55 7098217.85 1476.29 288.34 0 -50
M-020 525823.75 7098299.65 1505.47 259.69 0 -60
M-021 525892.25 7098358.95 1493.20 306.32 0 -67
M-022 525495.75 7098345.75 1377.85 203.30 0 -50
M-023 525823.75 7098299.65 1505.47 294.74 0 -75
M-024 525364.38 7098407.83 1353.59 54.90 358 -50
M-025 525823.90 7098299.14 1505.45 248.72 0 -48
M-026 524956.70 7098314.83 1396.42 215.50 0 -50
M-027 524770.72 7098325.13 1352.70 188.98 0 -50
M-028 525892.25 7098358.95 1493.02 213.66 0 -50
M-029 524626.95 7098315.15 1323.38 214.44 0 -50
M-030 525892.25 7098358.95 1493.18 126.80 0 -88
M-030A 525892.25 7098358.95 1493.18 281.94 0 -88
M-031 525172.05 7098396.15 1361.11 160.96 0 -50
M-032 525368.65 7098360.75 1359.36 204.83 0 -50
M-033 525760.55 7098217.85 1476.23 305.41 0 -80
M-034 525885.61 7098124.31 1474.84 444.09 358 -71
M-035 525972.24 7098119.66 1446.48 400.51 354 -60
M-036 525501.21 7098182.89 1392.72 304.50 358 -52
M-037 525175.79 7098230.92 1388.71 247.80 360 -57
For
per
sona
l use
onl
y

M-038 525504.09 7098040.00 1415.93 422.15 360 -58
M-039 526242.95 7098025.65 1329.47 111.30 360 -60
M-039A 526242.95 7098035.65 1329.47 434.04 355 -60
M-040 526099.95 7098000.65 1349.44 445.31 5 -60
M-041 526088.95 7097905.65 1327.00 523.95 357 -70
M-042 526258.95 7097935.65 1276.63 497.43 8 -70
M-043 525708.95 7097965.65 1481.62 582.78 1 -70
M-044 525617.95 7098140.65 1424.35 378.56 359 -65
M-045 525385.22 7098169.14 1389.52 411.18 360 -55
M-046 525192.95 7098065.65 1427.00 431.29 360 -60
M-047 524612.95 7098005.65 1365.00 303.58 360 -60
M-048 525901.85 7098123.25 1474.77 413.61 358 -54
M-049 525881.44 7098264.69 1523.26 306.62 2 -57
M-050 525881.46 7098265.33 1523.18 354.78 2 -73
M-051 525901.95 7098122.45 1474.71 417.57 358 -65
M-052 525980.55 7098273.95 1515.48 293.22 3 -60
M-053 525970.95 7098120.65 1447.79 389.22 10 -51
M-054 525980.65 7098273.35 1515.54 346.56 3 -80
M-055 525970.85 7098120.05 1446.39 406.76 6 -66
M-056 525980.65 7098273.55 1515.51 313.63 4 -70
M-057 525980.49 7098274.35 1515.46 288.04 3 -52
M-058 526082.95 7098160.65 1435.64 80.16 3 -64
M-059 526083.45 7098275.45 1486.78 321.26 3 -76
M-060 526082.15 7098158.05 1435.64 367.89 0 -71
M-061 526083.45 7098275.15 1486.67 363.93 2 -82
M-062 525583.65 7098467.05 1389.25 191.41 0 -50
M-063 526182.85 7098149.65 1414.95 374.29 6 -71
M-064 525582.45 7098336.75 1398.19 230.73 4 -61
M-065 525582.85 7098335.95 1398.20 215.49 4 -75
M-066 525581.45 7098277.05 1405.07 261.21 6 -67
M-067 525581.45 7098276.55 1404.95 288.04 6 -80
M-068 526182.65 7098149.15 1414.95 418.80 6 -77
M-069 525583.85 7098196.75 1410.05 336.80 4 -78
M-070 525483.65 7098398.05 1380.84 157.58 360 -55
M-071 525482.76 7098296.09 1378.24 180.44 360 -50
M-072 525499.56 7098241.82 1387.47 166.72 360 -51
M-073 525483.23 7098183.04 1391.03 228.90 360 -65
M-074 525093.85 7098147.05 1434.28 316.08 360 -69
M-075 525204.15 7098072.15 1427.67 395.33 360 -87
M-076 525383.05 7098256.95 1373.01 93.57 360 -53
M-077 525383.15 7098168.25 1389.72 242.93 5 -65
M-078 525382.85 7098078.75 1403.85 404.47 0 -70
M-079 525382.75 7098078.05 1403.67 359.97 0 -85
For
per
sona
l use
onl
y
M-080 525282.95 7098075.65 1410.73 355.40 5 -75
M-081 525283.95 7098086.65 1410.55 360.27 5 -50
M-082 525384.70 7097971.57 1439.30 463.91 10 -70
M-083 524982.95 7098125.65 1474.95 352.65 360 -70
M-084 525759.82 7098219.02 1476.36 236.82 2 -70
M-085 525762.20 7098343.86 1478.59 191.10 2 -75
M-086 525824.10 7098159.79 1509.20 444.09 2 -66
M-087 525824.10 7098159.57 1509.20 327.66 2 -75
M-088 525824.30 7098155.04 1509.20 374.90 2.3 -82
M-089 525717.97 7098251.78 1460.00 376.73 2.3 -75
M-090 525620.60 7098231.90 1418.50 299.92 2.3 -70
M-091 525442.70 7098257.40 1378.60 287.43 7.3 -55
M-092 525275.60 7098213.10 1382.60 144.80 12.3 -70
M-093 525089.60 7098261.40 1400.10 364.50 358.3 -70
M-094 525179.70 7098174.20 1405.20 284.70 350 -60
M-095 524897.60 7098047.70 1553.60 451.10 0.3 -55
M-096 524917.97 7098023.78 1551.99 403.86 7.3 -75
M-097 525972.96 7098061.91 1425.88 472.44 12.7 -70.9
M-098 526396.14 7097925.66 1277.06 372.77 360 -75
M-099 526496.97 7097910.01 1260.31 218.54 360 -80
M-100 524898.20 7098031.54 1551.99 498.96 335.4 -75
M-101 525201.60 7097919.66 1478.60 459.94 5 -80
M-102 525088.36 7098043.01 1472.60 292.30 5 -80
M-103 519354.00 7095076.00 1501.00 32.61 340 -50
M-104 519354.00 7095076.00 1501.00 29.57 340 -60
M-105 519158.59 7094900.20 1579.33 306.93 330 -50
M-106 519895.94 7096250.04 1524.48 233.78 337.3 -48.6
M-107 525897.76 7098025.28 1463.76 389.23 5 -70
M-108 525528.00 7098236.00 1393.00 260.00 360 -72
M-109 525710.00 7098246.10 1450.70 172.50 360 -45
M-110 525816.00 7098236.00 1499.00 349.60 10 -67
M-111 525885.00 7098139.00 1475.00 355.70 15 -54
M-112 525979.00 7098127.00 1446.00 370.00 15 -53
M-113 525975.00 7098127.00 1446.00 401.00 20 -70
M-114 525866.70 7097907.40 1402.00 499.00 4.6 -64.4
M-115 525797.20 7097998.60 1475.00 420.00 360 -70
M-116 524900.00 7098036.00 1552.00 450.00 336.1 -54.5
M-117 524500.00 7098050.00 1360.00 396.00 0 -55
For
per
sona
l use
onl
y

APPENDIX B
LISTING OF SIGNIFICANT DIAMOND DRILL INTERSECTIONS
For
per
sona
l use
onl
y

APPENDIX BTABLE OF SIGNIFICANT DIAMOND DRILL INTERSECTIONS
Hole Interval Cu Pb Zn Ag Au Horizon Cu+Pb+Zn
from (m) to (m) width (m) (%) (%) (%) (g/t) (g/t) (%)
88-01 29.00 34.18 5.18 0.71 0.47 1.47 11.7 <0.10 B4 2.65
88-02 18.39 32.61 14.22 1.38 3.20 1.09 174.5 1.13 B5 5.67
37.19 38.71 1.52 3.48 1.22 1.37 17.5 0.34 B4 6.07
88-03 28.35 29.41 1.06 5.41 3.05 6.72 101.8 0.34 B5 15.18
40.23 46.78 6.55 0.55 0.64 1.38 18.5 0.29 B4 2.57
88-04 65.23 68.28 3.05 0.14 6.18 0.02 96.3 0.93 D1 6.34
88-05 64.10 74.77 10.67 3.32 3.68 6.59 71.3 1.03 D1 13.59
88-06 120.61 121.24 0.63 0.16 0.92 1.28 23.7 0.27 C 2.36
88-07 No significant intersections
88-08 No significant intersections
88-09 32.61 35.61 3.00 2.31 4.55 2.93 81.7 0.97 D1 9.79
88-10 62.65 68.58 5.93 2.92 3.33 5.93 62.1 1.10 D1 12.18
110.70 133.55 22.85 0.94 1.79 3.19 47.3 1.06 B4/B5 5.92
88-11 82.20 87.75 5.55 2.24 3.04 5.87 39.8 0.93 D1 11.15
150.00 152.90 2.90 1.52 3.17 5.57 84.7 1.71 B4 10.26
88-12 64.95 68.65 3.70 3.14 4.84 9.21 109.0 1.82 D1 17.19
73.85 79.80 5.95 2.03 3.31 5.85 105.9 1.44 B3 11.19
88-13 65.90 68.45 2.55 1.33 0.98 1.93 30.2 0.13 D1 4.24
82.30 94.00 11.70 1.41 2.52 4.45 77.1 1.06 B3 8.38
88-14 No significant intersections
88-15 39.50 41.20 1.70 3.35 2.52 4.64 80.9 1.13 B5 10.51
58.75 61.15 2.40 1.65 2.66 5.20 76.1 1.10 B1 9.51
88-16 104.00 114.85 10.85 2.54 2.48 5.31 61.7 0.70 D1 10.33
88-17 108.00 111.90 3.90 2.15 2.98 6.14 61.7 0.85 D1b 11.27
116.85 118.30 1.45 2.28 1.35 3.72 31.1 0.55 D1a 7.35
88-18 114.30 120.70 6.40 1.20 1.21 2.79 24.7 0.34 D1/D1b 5.20
88-19 203.70 214.90 11.20 2.55 2.71 6.31 63.8 0.75 D1 11.57
261.98 262.40 0.42 1.56 2.00 6.26 71.7 0.41 B4 9.82
88-20 187.15 189.25 2.10 1.74 1.87 3.97 65.5 1.17 D1 7.58
221.25 223.45 2.20 1.26 2.10 4.04 53.1 0.62 B5 7.40
226.70 229.15 2.45 0.93 1.77 3.23 48.3 0.49 B4 5.93
231.70 233.35 1.65 1.12 1.75 3.36 54.9 0.75 B3 6.23
88-21 156.60 158.19 1.59 1.16 1.46 2.70 44.2 0.45 D1b 5.32
161.45 164.80 3.35 2.56 2.48 5.25 152.6 1.17 D1a 10.29
156.60 164.80 8.20 1.32 1.34 2.73 39.1 0.55 D1 5.39
171.70 174.20 2.50 1.46 2.10 4.10 61.0 0.75 C 7.66
182.40 187.45 5.05 1.50 2.32 4.84 67.5 1.06 B5 8.66For
per
sona
l use
onl
y

Hole Interval Cu Pb Zn Ag Au Horizon Cu+Pb+Zn
from (m) to (m) width (m) (%) (%) (%) (g/t) (g/t) (%)
88-22 107.70 111.25 3.55 1.97 2.87 5.64 68.6 0.89 B3 10.48
88-23 209.20 215.10 5.90 1.91 3.07 6.49 75.4 0.96 D1 11.47
263.80 269.15 5.35 1.24 2.07 3.95 66.5 1.34 B5 7.26
88-24 No significant intersections
88-25 181.47 187.45 5.98 1.98 1.22 3.40 50.4 0.79 D1 6.60
208.90 209.70 0.80 0.94 1.75 3.36 42.5 0.48 B5 6.05
221.00 222.00 1.00 1.45 1.90 4.11 56.6 0.71 B3 7.46
88-26 63.02 63.26 0.42 1.12 2.68 6.41 57.9 0.48 B5 10.21
88-27 No significant intersections
88-28 156.90 158.80 1.90 2.26 2.95 5.62 83.0 0.85 D1 10.83
88-29 No significant intersections
88-30 Abandoned
88-30A 188.61 192.16 3.55 1.05 2.85 5.21 58.3 0.92 D1 9.11
229.70 231.40 1.70 0.89 1.45 2.74 40.8 0.58 B5 5.08
234.66 239.57 4.91 0.57 1.06 1.84 27.8 0.34 B4 3.47
243.26 245.11 1.85 1.25 2.04 3.91 47.3 0.72 B3 7.20
88-31 61.80 64.62 2.82 0.05 0.26 0.50 2.1 0.10 B4 0.81
74.64 76.23 1.59 0.58 2.77 5.30 51.1 1.58 B3 8.65
88-32 No significant intersections
88-33 222.51 227.17 4.66 1.57 2.19 4.29 46.6 0.55 D1 8.05
89-34 320.23 323.59 3.36 1.33 2.16 3.99 47.3 0.58 D1 7.48
89-35 292.50 297.15 4.65 1.46 2.78 5.12 45.9 1.20 D1 9.36
334.92 336.00 1.08 2.15 1.51 3.15 43.9 0.48 B4 6.81
362.22 365.00 2.78 0.73 1.26 2.45 32.2 0.48 A1 4.44
89-36 139.47 141.43 1.96 1.45 3.65 4.65 89.1 1.92 D2 9.75
148.49 149.40 0.91 2.21 5.29 9.63 126.8 2.47 D1 17.13
170.13 177.24 7.11 1.15 2.43 4.36 64.4 2.06 C 7.94
188.89 200.33 11.44 1.47 2.27 4.15 66.9 1.37 B5 7.89
259.52 260.33 0.81 0.87 0.72 1.63 25.3 0.14 B3 3.22
89-37 48.57 49.29 0.72 0.58 0.35 0.85 8.9 0.17 D1 1.78
174.00 176.09 2.09 0.73 1.06 2.47 25.0 0.20 B4 4.26
186.23 188.18 1.95 1.31 1.79 4.30 59.7 0.23 B3 7.40
203.10 205.66 2.56 0.27 0.82 2.37 18.9 0.34 B1 3.46
89-38 362.19 362.84 0.65 0.41 1.57 3.15 25.7 0.07 B3 5.13
90-39 Abandoned
90-39A 345.65 346.37 0.72 0.73 1.08 3.69 21.3 0.62 D1 5.50
349.90 354.10 4.20 0.99 1.49 2.64 37.0 0.45 C 5.12
366.84 370.56 3.72 1.25 1.24 2.34 39.2 0.53 B4 4.83
402.96 407.21 4.25 0.95 1.36 2.47 39.1 0.34 A1 4.78
90-40 327.54 330.02 2.48 2.13 2.27 3.61 53.8 1.41 D1 8.01
359.43 360.88 1.45 0.22 0.44 0.84 12.3 0.14 B4 1.50
375.11 376.56 1.45 1.80 1.84 3.55 51.8 0.34 B3 7.19
For
per
sona
l use
onl
y

Hole Interval Cu Pb Zn Ag Au Horizon Cu+Pb+Zn
from (m) to (m) width (m) (%) (%) (%) (g/t) (g/t) (%)
90-41 407.21 408.72 1.51 0.35 0.30 0.61 5.1 0.14 D1 1.26
90-42 397.85 398.75 0.90 1.72 1.48 2.94 3.5 0.99 D1 6.14
453.39 455.50 2.11 0.49 0.78 1.45 21.6 0.24 A3 2.72
90-43 389.80 391.70 1.90 0.85 0.79 1.58 25.0 0.34 D1a 3.22
516.05 517.80 1.75 1.42 2.86 4.71 70.6 1.13 B4 8.99
543.95 544.45 0.50 2.19 2.62 5.32 61.3 0.54 B3 10.13
90-44 234.10 236.07 1.97 0.30 1.79 2.57 76.5 2.30 D1 4.66
312.00 314.15 2.15 0.22 0.81 1.23 17.2 0.49 B5 2.26
329.50 332.84 3.34 1.61 2.52 4.85 53.2 0.89 B4 8.98
90-45 111.10 114.60 3.50 2.14 0.30 1.13 9.3 0.14 D1 3.57
301.55 304.50 2.95 0.73 2.83 5.49 50.4 0.34 A2 9.05
308.80 309.68 0.88 0.19 2.69 6.14 65.1 0.89 A1 9.02
90-46 154.91 156.51 1.60 3.00 2.78 7.19 70.3 0.75 D2 12.97
177.40 178.40 1.00 3.20 2.77 7.52 53.1 0.55 D1 13.49
288.75 291.75 3.00 0.66 0.82 1.89 19.5 0.10 B3 3.37
311.05 311.75 0.70 0.79 1.84 3.86 38.1 0.55 B1 6.49
90-47 No significant intersections
96-48 301.45 310.05 8.60 1.96 2.84 5.53 76.2 1.02 D1 10.33
324.30 325.52 1.22 0.62 1.20 2.10 39.5 0.27 C 3.92
361.37 365.67 4.30 1.10 1.92 3.54 68.9 1.22 A2 6.56
96-49 236.43 241.26 4.83 1.88 1.99 3.90 46.5 0.69 D1 7.77
253.67 259.38 5.71 1.51 2.74 4.87 70.1 0.75 C 9.12
268.48 269.03 0.55 1.65 2.35 4.82 63.1 0.62 B5 8.82
276.71 278.00 1.29 1.63 2.14 4.32 56.7 0.79 B3 8.09
96-50 251.76 255.19 3.43 2.33 1.14 3.22 43.0 0.83 D1 6.69
286.75 293.71 6.96 0.79 1.18 2.27 40.1 0.58 B5 4.24
298.31 300.17 1.86 0.87 1.19 2.23 43.5 0.34 B3 4.29
316.41 320.14 3.73 1.17 2.13 3.88 63.3 0.55 A2 7.18
325.75 327.50 1.75 0.73 1.76 3.08 54.5 0.69 A1 5.57
96-51 301.86 307.66 5.80 1.58 2.35 4.58 49.0 0.31 D1 8.51
96-52 248.41 249.06 0.65 2.31 5.07 7.91 127.0 0.62 D1 15.29
255.34 256.64 1.30 1.21 2.86 5.22 76.2 0.76 B5 9.29
96-53 290.58 296.20 5.62 0.98 1.90 3.65 37.9 0.75 D1 6.53
305.80 309.24 3.44 1.09 2.00 3.93 54.9 0.67 C 7.02
324.31 327.36 3.05 0.96 1.37 2.85 43.0 0.45 B4 5.18
96-54 267.54 270.26 2.72 1.65 5.78 9.59 122.0 1.82 D1 17.02
281.30 286.75 5.45 1.05 1.66 3.23 44.6 0.60 C 5.94
296.91 297.70 0.79 1.14 1.30 2.78 44.0 0.44 B5 5.22
301.52 303.15 1.63 2.39 2.58 5.12 71.2 0.62 B4 10.09
96-55 306.51 310.76 4.25 1.49 2.76 6.02 57.0 0.63 D1 10.27
345.11 346.46 1.35 1.16 1.79 3.22 42.2 0.39 B4 6.17For
per
sona
l use
onl
y

Hole Interval Cu Pb Zn Ag Au Horizon Cu+Pb+Zn
from (m) to (m) width (m) (%) (%) (%) (g/t) (g/t) (%)
376.66 382.22 5.56 0.67 0.88 2.02 37.1 0.45 A 3.57
96-56 254.98 259.56 4.58 2.03 2.67 5.13 71.1 0.84 D1 9.83
264.96 271.85 6.89 1.87 2.64 5.15 67.1 0.75 C 9.66
282.55 286.11 3.56 1.60 2.28 4.84 68.2 0.78 B5 8.72
96-57 No significant intersections
96-58 No significant intersections
96-59 No significant intersections
96-60 291.18 291.82 0.64 2.57 5.65 9.80 127.0 1.59 D1 18.02
299.29 300.38 1.09 2.30 3.37 6.20 112.0 1.54 C 11.87
313.10 313.83 0.73 1.19 2.80 5.02 65.4 0.92 B5 9.01
318.21 321.26 3.05 1.70 2.34 4.44 61.2 1.06 B4 8.48
96-61 299.90 303.56 3.66 1.51 2.76 4.67 68.8 0.70 D1 8.94
313.50 316.63 3.13 1.18 1.88 3.43 64.8 0.75 B4 6.49
96-62 No significant intersections
96-63 319.18 322.40 3.22 0.77 1.33 2.84 33.9 0.35 D1 4.94
329.79 336.35 6.56 1.34 1.94 3.74 65.2 0.74 C 7.02
339.55 341.82 2.27 1.30 2.59 4.72 80.8 1.06 B5 8.61
347.81 348.60 0.79 1.32 2.06 3.87 75.0 0.49 B4 7.25
96-64 32.82 34.24 1.42 1.63 1.21 1.60 47.8 0.54 D2 4.44
96-65 162.00 163.00 1.00 1.34 2.10 4.38 47.0 0.51 B4 7.82
96-66 80.05 81.58 1.53 1.94 4.01 7.06 80.8 1.79 D1 13.01
206.50 207.87 1.37 0.98 1.68 3.12 44.8 0.48 B4 5.78
96-67 144.56 148.28 3.72 0.99 1.80 4.54 60.1 0.58 C 7.33
246.29 249.36 3.07 2.70 3.71 4.48 89.6 0.96 B4 10.89
96-68 337.59 337.89 0.30 4.52 4.00 7.85 99.0 0.81 D1 16.37
344.27 347.74 3.47 1.36 4.29 7.14 45.3 0.59 C 12.79
356.10 357.36 1.26 1.52 2.21 4.15 60.3 0.80 B5b 7.88
359.51 360.63 1.12 0.92 1.99 3.56 36.7 0.46 B5a 6.47
96-69 224.64 227.69 3.05 0.56 1.67 2.47 43.3 0.81 C 4.70
253.71 255.85 2.14 0.36 1.62 2.64 42.0 1.10 B5 4.62
316.98 317.83 0.85 0.66 2.18 4.18 53.3 0.42 B4 7.02
96-70 39.04 42.04 3.00 2.59 1.66 3.21 73.6 0.60 B4 7.46
74.19 74.75 0.56 2.15 2.82 5.45 67.8 0.78 B1 10.42
96-71 41.20 44.81 3.61 1.77 3.35 5.80 90.3 2.81 D1 10.92
76.28 79.78 3.50 0.84 1.25 2.22 41.8 1.95 C 4.31
156.79 161.11 4.32 1.07 1.77 3.36 52.4 1.01 B3 6.20
96-72 84.05 84.70 0.65 3.47 4.44 6.50 94.6 1.71 D2 14.41
152.95 153.72 0.77 0.86 3.07 4.88 58.1 1.07 B5 8.81
96-73 184.20 200.44 16.24 2.82 2.92 5.55 82.5 1.84 B5 11.29
96-74 129.10 131.87 2.77 1.20 1.48 3.73 35.2 0.42 D1 6.41
230.19 232.21 2.02 0.56 1.47 3.62 30.1 0.32 B4 5.65
269.45 270.36 0.91 1.01 1.25 2.88 52.5 0.29 B3 5.14
96-75 237.83 238.33 0.50 4.95 3.58 10.90 73.2 0.76 C 19.43
97-76 No significant intersections
For
per
sona
l use
onl
y

Hole Interval Cu Pb Zn Ag Au Horizon Cu+Pb+Zn
from (m) to (m) width (m) (%) (%) (%) (g/t) (g/t) (%)
97-77 122.53 128.02 5.49 0.97 1.10 2.50 23.6 0.20 D1 4.57
97-78 196.38 205.43 9.05 1.98 0.31 1.43 10.6 0.15 D1 3.72
218.92 219.98 1.06 0.81 1.71 3.48 37.0 0.32 C 6.00
305.85 307.90 2.05 0.51 0.69 1.40 20.4 0.15 B3 2.60
97-79 No significant intersections
97-80 335.17 339.82 4.65 0.68 1.18 2.64 21.7 0.20 A2 4.50
97-81 153.77 163.07 9.30 1.37 2.21 4.11 63.9 3.70 D2 7.69
97-82 283.25 284.64 1.39 0.81 1.00 2.16 41.2 2.81 D1 3.97
365.90 366.52 0.62 0.30 19.10 6.07 367.0 0.36 B3 25.47
97-83 143.70 145.30 1.60 2.11 0.61 1.70 20.6 0.15 D1 4.42
240.42 241.32 0.90 3.17 2.22 5.65 72.8 0.71 B7 11.04
250.61 251.75 1.14 1.26 2.65 5.63 57.5 1.64 B6 9.54
266.17 266.70 0.53 3.85 5.14 10.60 99.6 0.51 B5 19.59
05-84 215.07 218.24 3.17 2.09 2.02 4.17 51.0 0.59 D1 8.28
05-85 131.17 137.29 6.12 2.84 2.38 5.48 48.0 0.55 D1 10.70
05-86 293.41 297.00 3.59 2.19 2.89 5.81 69.0 0.84 D1 10.89
05-87 298.49 300.86 2.37 2.20 2.84 5.36 56.0 1.18 D1 10.40
306.43 309.13 2.70 2.08 1.93 4.02 48.0 0.71 D1 8.03
06-88 314.21 324.85 10.64 1.12 1.34 2.13 31.3 0.61 D1 4.59
06-89 175.26 178.12 2.86 0.93 0.97 1.94 17.8 0.24 D1 3.84
329.28 330.52 1.24 1.77 3.09 6.12 62.3 0.92 B3 10.98
06-90 258.88 261.07 2.19 0.56 1.26 2.50 29.8 0.38 B4 4.32
06-91 104.23 109.27 5.04 1.72 3.77 6.21 113.7 2.73 B5 11.70
127.49 128.70 1.21 0.48 0.21 0.41 5.1 0.08 B3 1.10
201.63 202.85 1.22 1.62 2.15 4.39 57.5 0.46 A2 8.16
06-92 68.86 70.66 1.80 1.31 1.20 2.15 36.4 0.39 D1 4.66
06-93 166.57 169.79 3.22 0.76 0.66 1.96 15.1 0.19 B5 3.38
174.47 176.85 2.38 3.45 4.54 11.29 102.1 1.41 B4 19.28
196.90 197.29 0.39 1.69 1.12 2.88 30.0 0.09 B3 5.69
06-94 207.83 209.18 1.35 1.58 2.48 4.74 69.2 0.29 B4 8.80
218.52 220.46 1.94 2.85 3.94 9.21 98.0 0.74 B3 16.00
241.97 243.88 1.91 2.02 3.08 6.19 97.9 0.73 B2 11.29
06-95 322.90 323.05 0.15 5.20 1.72 9.20 48.0 0.49 B5 16.12
325.83 329.18 3.35 0.63 1.03 2.54 20.6 0.19 B4 4.20
06-96 359.00 361.00 2.00 1.45 1.36 3.80 31.3 0.27 B5 6.61
371.36 372.10 0.74 0.29 1.41 2.49 24.0 0.61 B4 4.19
For
per
sona
l use
onl
y

Hole Interval Cu Pb Zn Ag Au Horizon Cu+Pb+Zn
from (m) to (m) width (m) (%) (%) (%) (g/t) (g/t) (%)
07-97 349.20 356.50 7.30 2.70 2.10 4.40 60.3 0.88 D1 9.20
07-100 355.90 359.10 3.20 1.20 1.10 2.90 30.4 0.36 B5 5.20
07-101 338.70 339.40 0.70 3.00 1.70 5.70 44.2 0.39 D1 10.40
07-107 345.40 346.10 0.70 2.70 3.80 7.90 63.8 0.72 D2 14.40
347.90 348.50 0.60 0.60 0.50 0.70 23.4 0.52 D2 1.80
M-108 111.42 111.85 0.43 1.49 2.20 3.84 53.9 1.33 D 7.53
158.29 162.80 4.51 0.60 1.26 2.19 44.3 2.04 C 4.05
181.60 185.80 4.20 1.67 3.40 5.53 82.8 1.81 B 10.60
195.80 196.43 0.63 0.17 1.37 1.75 26.7 0.36 3.29
M-109 145.80 157.35 11.55 1.72 1.72 3.64 42.4 0.63 D 7.08
M-110 246.10 255.90 9.80 2.15 3.50 7.37 79.3 1.25 D 13.02
290.80 291.30 0.50 1.69 1.97 3.86 93.5 1.34 B 7.52
295.50 306.00 10.50 1.03 1.69 3.23 46.7 0.90 B 5.95
M-111 294.20 299.90 5.70 1.52 2.06 4.71 44.2 0.93 D 8.29
332.77 337.60 4.83 0.87 1.63 3.10 39.0 0.52 A 5.60
M-112 294.65 295.20 0.55 1.78 3.49 6.92 75.7 1.69 D 12.19
298.20 301.90 3.70 1.89 2.26 6.53 69.1 1.05 D 10.68
314.30 315.70 1.40 0.97 1.55 3.05 44.1 0.47 C 5.57
332.90 336.00 3.10 0.64 0.73 1.43 20.4 0.23 B 2.80
M-113 229.70 335.70 106.00 2.24 1.01 2.25 15.0 0.01 D 5.50
379.60 380.40 0.80 1.60 2.40 4.65 59.0 0.55 A 8.65
M-114 418.60 420.10 1.50 0.38 0.48 0.86 10.7 0.13 D 1.72
M-115 275.80 276.30 0.50 0.17 1.94 3.37 67.2 0.03 5.48
M-116 333.10 335.15 2.05 0.17 0.60 1.71 10.6 0.08 2.48
361.35 362.50 1.15 1.60 0.86 2.61 24.2 0.44 5.07
For
per
sona
l use
onl
y