Embed Size (px)
Citation preview

Interim Results17 August 2012
Brett Chenoweth, Chief Executive Officer
Peter Myers, Chief Financial Officer
For
per
sona
l use
onl
y
2
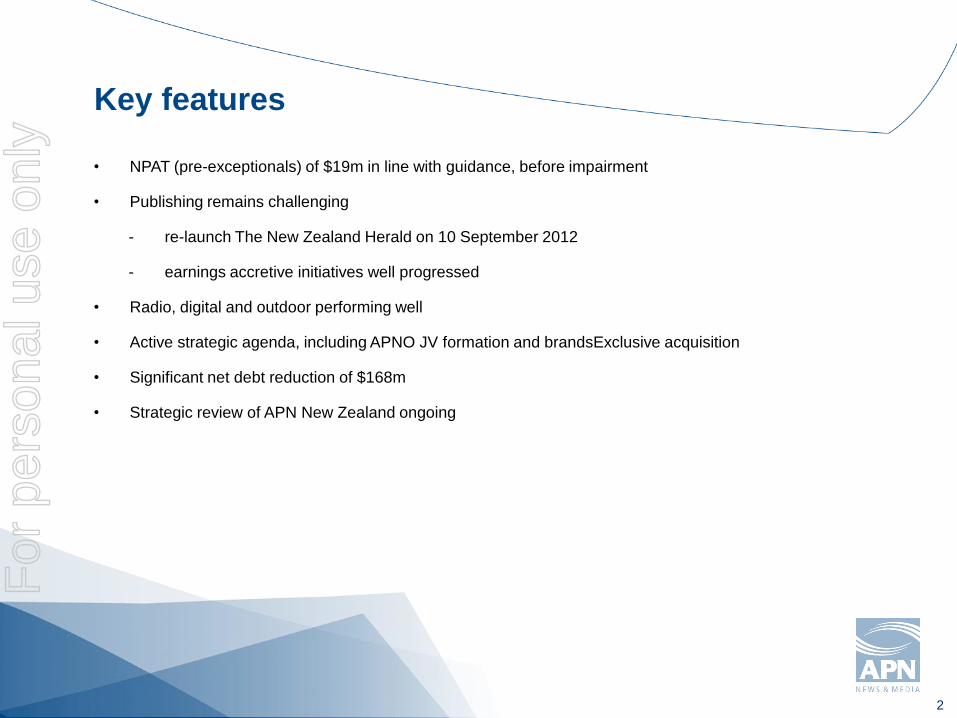
Key features
• NPAT (pre-exceptionals) of $19m in line with guidance, before impairment
• Publishing remains challenging
re-launch The New Zealand Herald on 10 September 2012
earnings accretive initiatives well progressed
• Radio, digital and outdoor performing well
• Active strategic agenda, including APNO JV formation and brandsExclusive acquisition
• Significant net debt reduction of $168m
• Strategic review of APN New Zealand ongoing
For
per
sona
l use
onl
y
3
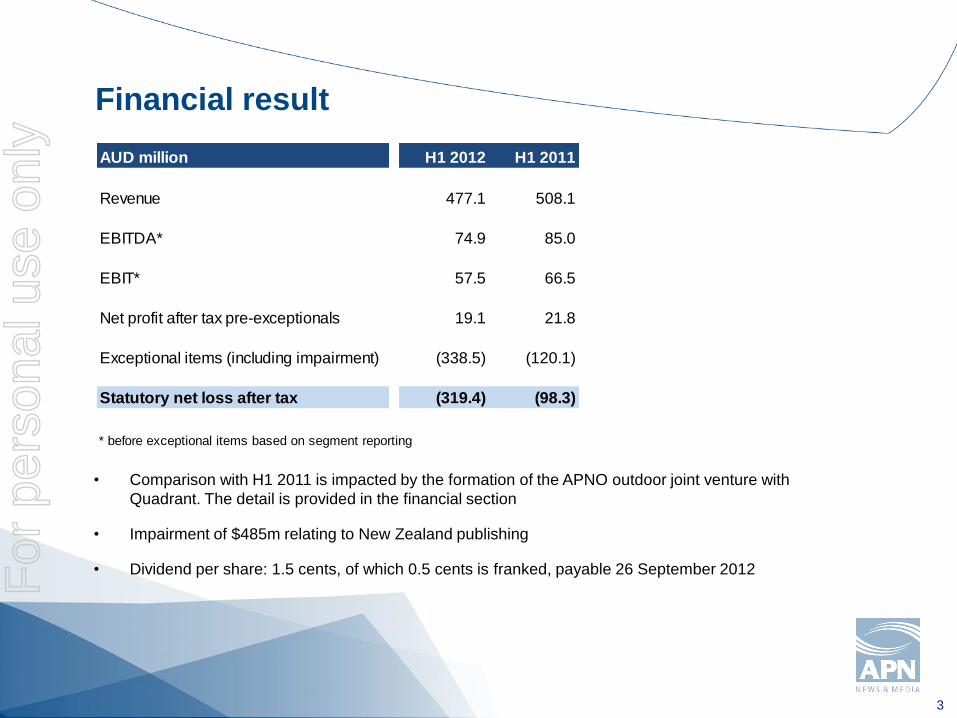
Financial result
• Comparison with H1 2011 is impacted by the formation of the APNO outdoor joint venture with
Quadrant. The detail is provided in the financial section
• Impairment of $485m relating to New Zealand publishing
• Dividend per share: 1.5 cents, of which 0.5 cents is franked, payable 26 September 2012
AUD million H1 2012 H1 2011
Revenue 477.1 508.1
EBITDA* 74.9 85.0
EBIT* 57.5 66.5
Net profit after tax pre-exceptionals 19.1 21.8
Exceptional items (including impairment) (338.5) (120.1)
Statutory net loss after tax (319.4) (98.3)
* before exceptional items based on segment reporting
For
per
sona
l use
onl
y
4
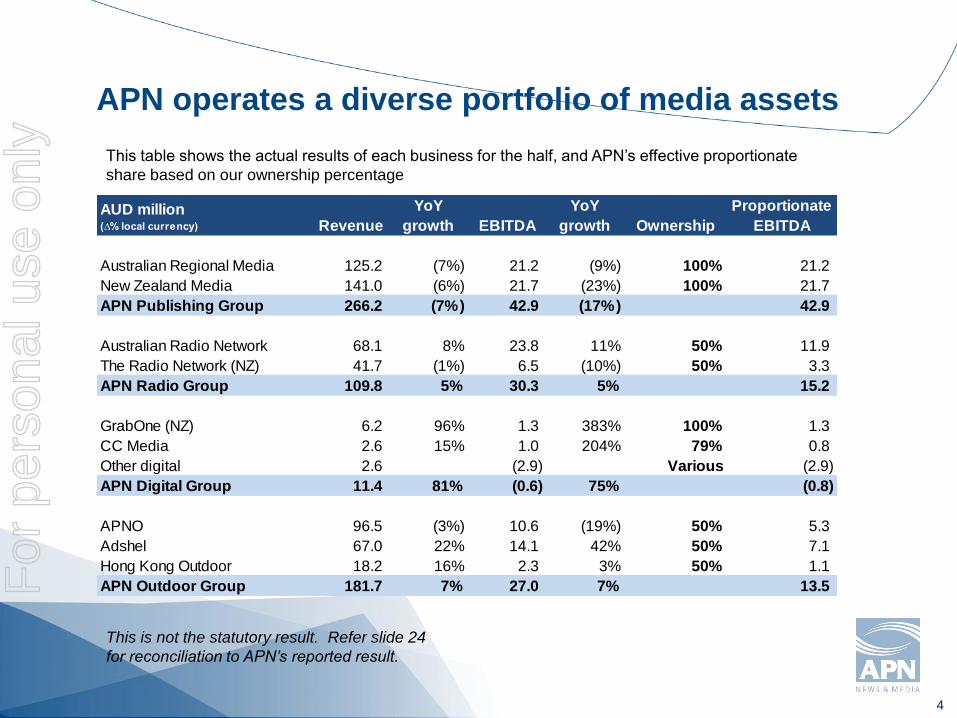
APN operates a diverse portfolio of media assets
This table shows the actual results of each business for the half, and APN’s effective proportionate
share based on our ownership percentage
This is not the statutory result. Refer slide 24
for reconciliation to APN’s reported result.
AUD million(∆% local currency) Revenue
YoY
growth EBITDA
YoY
growth Ownership
Proportionate
EBITDA
Australian Regional Media 125.2 (7%) 21.2 (9%) 100% 21.2
New Zealand Media 141.0 (6%) 21.7 (23%) 100% 21.7
APN Publishing Group 266.2 (7%) 42.9 (17%) 42.9
Australian Radio Network 68.1 8% 23.8 11% 50% 11.9
The Radio Network (NZ) 41.7 (1%) 6.5 (10%) 50% 3.3
APN Radio Group 109.8 5% 30.3 5% 15.2
GrabOne (NZ) 6.2 96% 1.3 383% 100% 1.3
CC Media 2.6 15% 1.0 204% 79% 0.8
Other digital 2.6 (2.9) Various (2.9)
APN Digital Group 11.4 81% (0.6) 75% (0.8)
APNO 96.5 (3%) 10.6 (19%) 50% 5.3
Adshel 67.0 22% 14.1 42% 50% 7.1
Hong Kong Outdoor 18.2 16% 2.3 3% 50% 1.1
APN Outdoor Group 181.7 7% 27.0 7% 13.5 For
per
sona
l use
onl
y

australian regional
media
For
per
sona
l use
onl
y
6
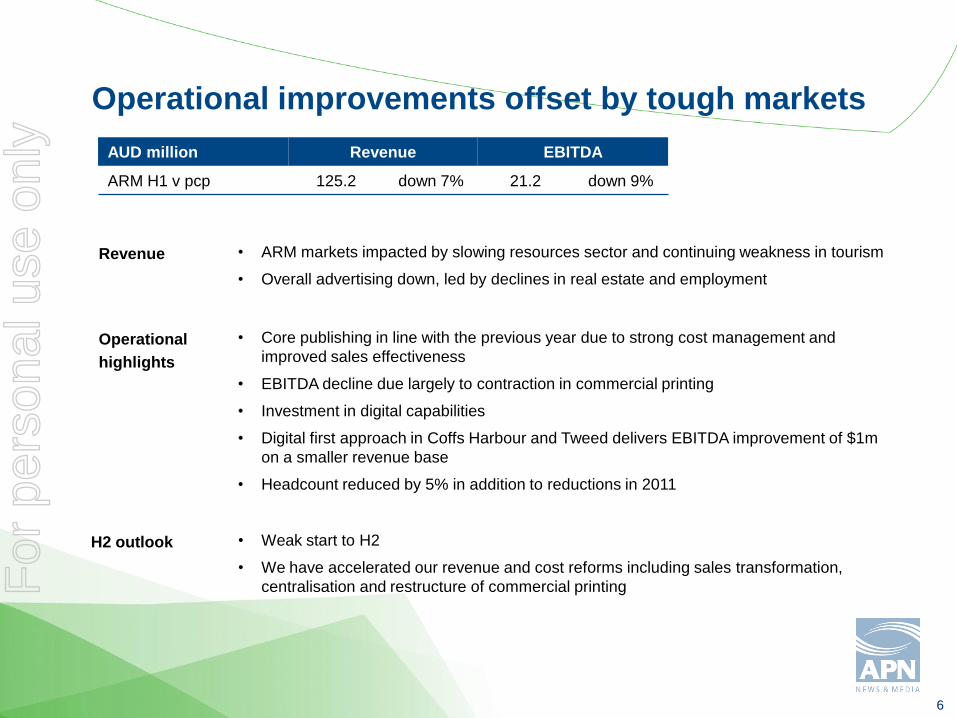
Operational improvements offset by tough markets
AUD million Revenue EBITDA
ARM H1 v pcp 125.2 down 7% 21.2 down 9%
Operational
highlights
Revenue • ARM markets impacted by slowing resources sector and continuing weakness in tourism
• Overall advertising down, led by declines in real estate and employment
• Core publishing in line with the previous year due to strong cost management and
improved sales effectiveness
• EBITDA decline due largely to contraction in commercial printing
• Investment in digital capabilities
• Digital first approach in Coffs Harbour and Tweed delivers EBITDA improvement of $1m
on a smaller revenue base
• Headcount reduced by 5% in addition to reductions in 2011
• Weak start to H2
• We have accelerated our revenue and cost reforms including sales transformation,
centralisation and restructure of commercial printing
H2 outlook
For
per
sona
l use
onl
y
7
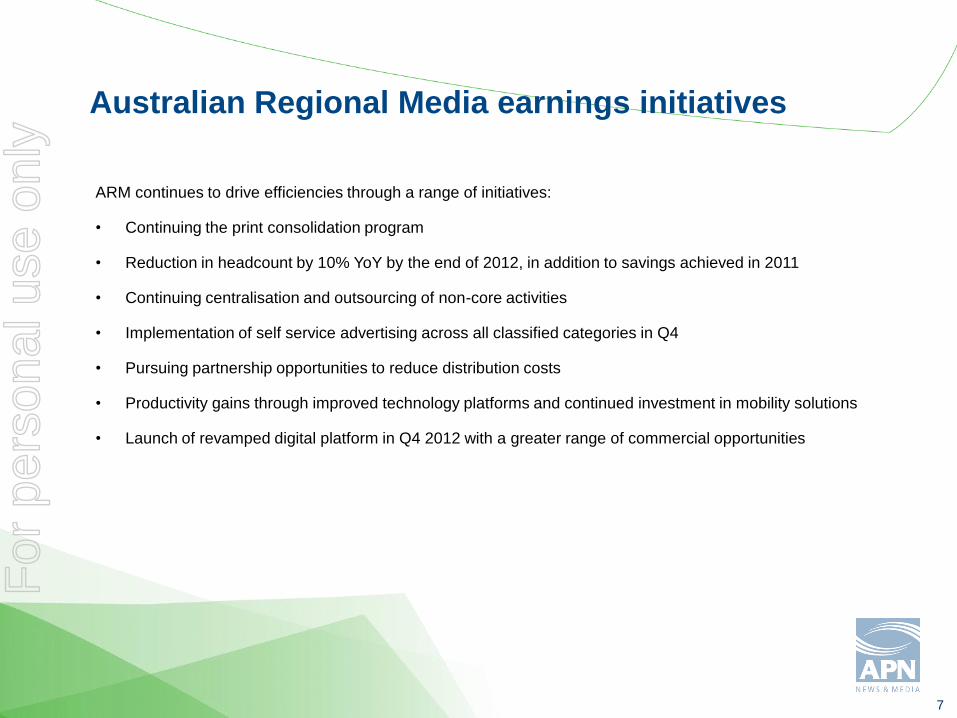
Australian Regional Media earnings initiatives
ARM continues to drive efficiencies through a range of initiatives:
• Continuing the print consolidation program
• Reduction in headcount by 10% YoY by the end of 2012, in addition to savings achieved in 2011
• Continuing centralisation and outsourcing of non-core activities
• Implementation of self service advertising across all classified categories in Q4
• Pursuing partnership opportunities to reduce distribution costs
• Productivity gains through improved technology platforms and continued investment in mobility solutions
• Launch of revamped digital platform in Q4 2012 with a greater range of commercial opportunities
For
per
sona
l use
onl
y

new zealand mediaFor
per
sona
l use
onl
y
9
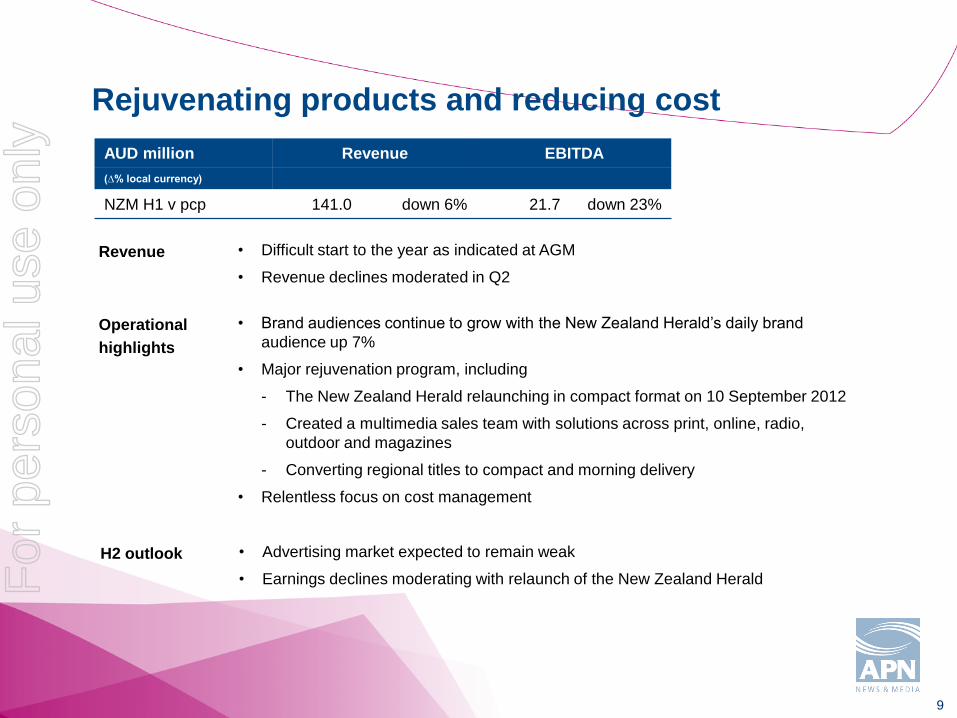
Rejuvenating products and reducing cost
Operational
highlights
Revenue • Difficult start to the year as indicated at AGM
• Revenue declines moderated in Q2
• Brand audiences continue to grow with the New Zealand Herald’s daily brand
audience up 7%
• Major rejuvenation program, including
The New Zealand Herald relaunching in compact format on 10 September 2012
Created a multimedia sales team with solutions across print, online, radio,
outdoor and magazines
Converting regional titles to compact and morning delivery
• Relentless focus on cost management
H2 outlook • Advertising market expected to remain weak
• Earnings declines moderating with relaunch of the New Zealand Herald
AUD million Revenue EBITDA
(∆% local currency)
NZM H1 v pcp 141.0 down 6% 21.7 down 23%
For
per
sona
l use
onl
y
10
New Zealand Media earnings initiatives
Two-pronged strategy to stabilize earnings:
• Improved market approach by reorganizing sales force to deliver multimedia sales solutions across its
portfolio of print, online, magazine, radio and outdoor assets
• Further efficiencies and cost reduction in publishing
Continuing cost reduction program in 2012:
• Following the closure of NZPA, we established a central APNZ news service with a digital first approach to
share news content across websites and daily titles, enabling an editorial headcount reduction
• Integrating the Herald on Sunday and the daily New Zealand Herald content teams
• Moving to a single circulation system and management approach for all newspaper and magazine titles
improving efficiency
• Investing in advertising self-service technology to improve classified service and efficiency
• Examining all non-core areas and the potential to extend the outsourced model, already adopted for editorial
production, circulation logistics and some printing
A review of the regional product portfolio in H2 is also likely to result in the reduction in the number of publishing
days of some titles and the adoption of a digital first approach.
For
per
sona
l use
onl
y

radioFor
per
sona
l use
onl
y
12
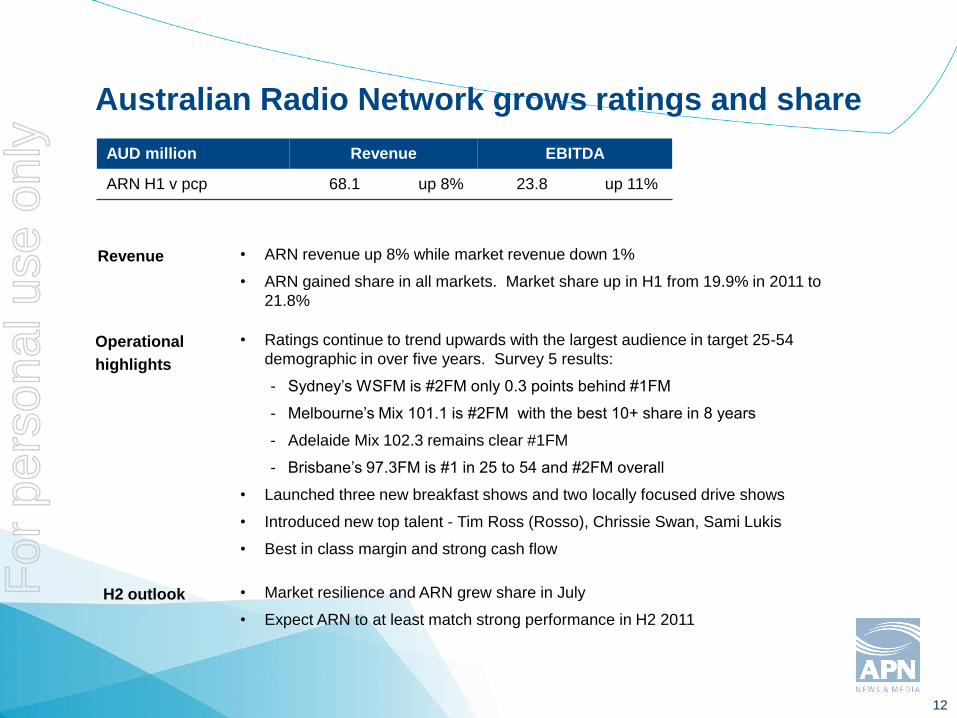
• Ratings continue to trend upwards with the largest audience in target 25-54
demographic in over five years. Survey 5 results:
Sydney’s WSFM is #2FM only 0.3 points behind #1FM
Melbourne’s Mix 101.1 is #2FM with the best 10+ share in 8 years
Adelaide Mix 102.3 remains clear #1FM
Brisbane’s 97.3FM is #1 in 25 to 54 and #2FM overall
• Launched three new breakfast shows and two locally focused drive shows
• Introduced new top talent - Tim Ross (Rosso), Chrissie Swan, Sami Lukis
• Best in class margin and strong cash flow
AUD million Revenue EBITDA
ARN H1 v pcp 68.1 up 8% 23.8 up 11%
Operational
highlights
H2 outlook • Market resilience and ARN grew share in July
• Expect ARN to at least match strong performance in H2 2011
Revenue • ARN revenue up 8% while market revenue down 1%
• ARN gained share in all markets. Market share up in H1 from 19.9% in 2011 to
21.8%
Australian Radio Network grows ratings and share
For
per
sona
l use
onl
y
13
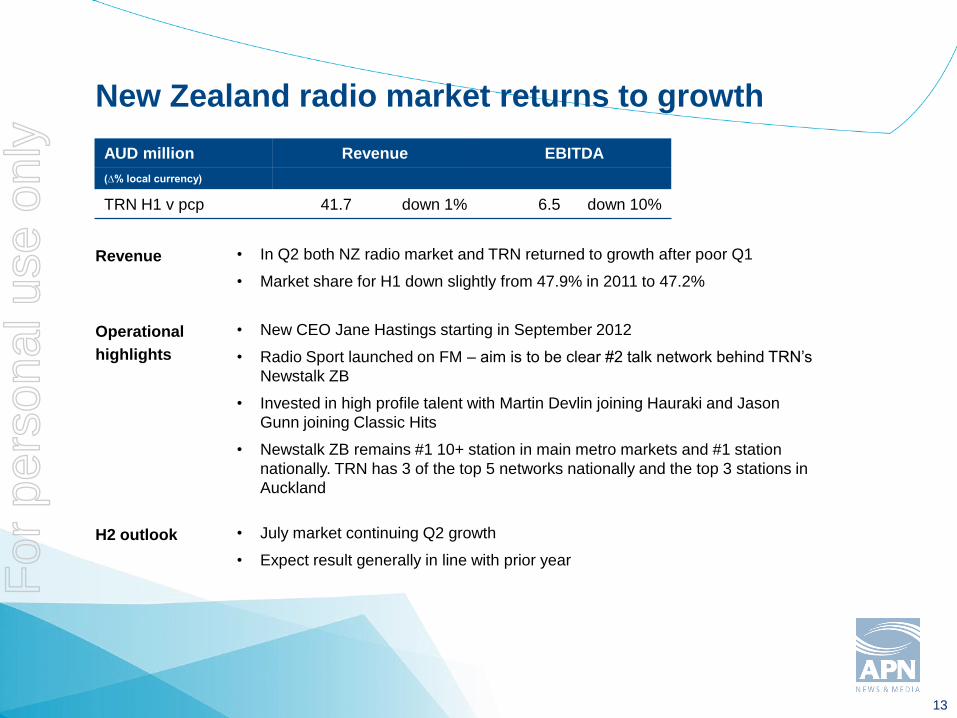
New Zealand radio market returns to growth
• In Q2 both NZ radio market and TRN returned to growth after poor Q1
• Market share for H1 down slightly from 47.9% in 2011 to 47.2%
AUD million Revenue EBITDA
(∆% local currency)
TRN H1 v pcp 41.7 down 1% 6.5 down 10%
Revenue
Operational
highlights
H2 outlook
• New CEO Jane Hastings starting in September 2012
• Radio Sport launched on FM – aim is to be clear #2 talk network behind TRN’s
Newstalk ZB
• Invested in high profile talent with Martin Devlin joining Hauraki and Jason
Gunn joining Classic Hits
• Newstalk ZB remains #1 10+ station in main metro markets and #1 station
nationally. TRN has 3 of the top 5 networks nationally and the top 3 stations in
Auckland
• July market continuing Q2 growth
• Expect result generally in line with prior year
For
per
sona
l use
onl
y

outdoorFor
per
sona
l use
onl
y
15
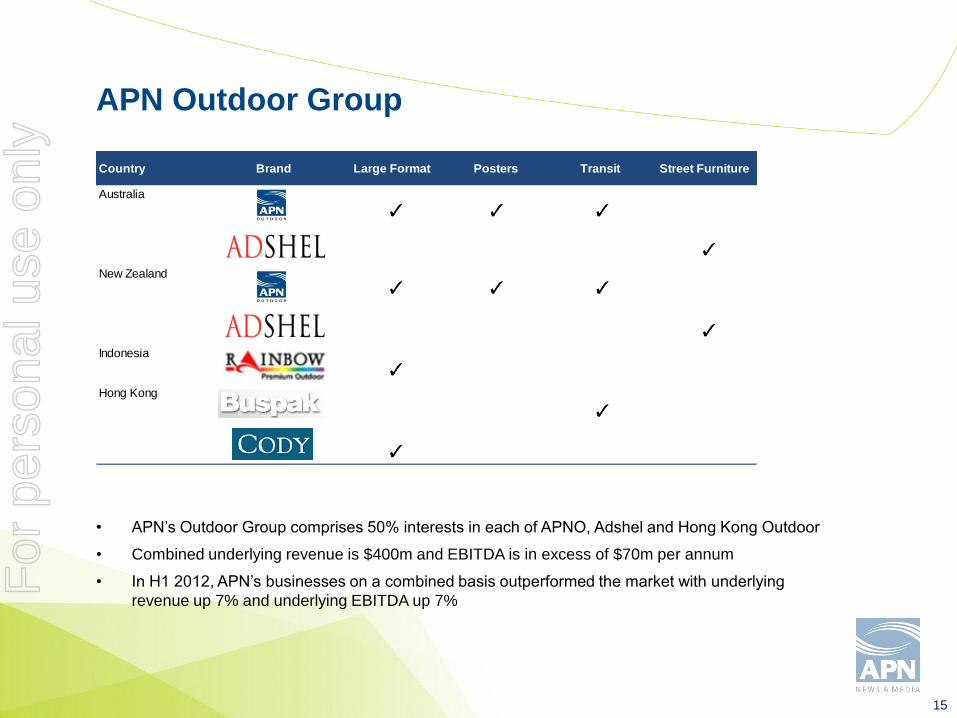
APN Outdoor Group
• APN’s Outdoor Group comprises 50% interests in each of APNO, Adshel and Hong Kong Outdoor
• Combined underlying revenue is $400m and EBITDA is in excess of $70m per annum
• In H1 2012, APN’s businesses on a combined basis outperformed the market with underlying
revenue up 7% and underlying EBITDA up 7%
Country Brand Large Format Posters Transit Street Furniture
Indonesia
Australia
New Zealand
Hong Kong
For
per
sona
l use
onl
y
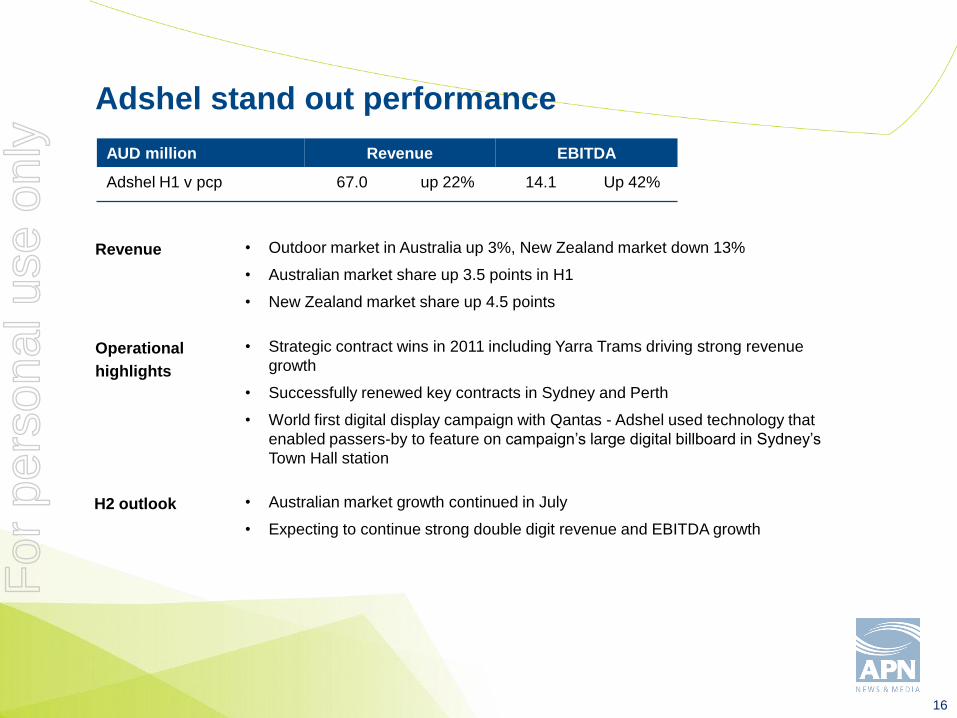
16
Adshel stand out performance
• Outdoor market in Australia up 3%, New Zealand market down 13%
• Australian market share up 3.5 points in H1
• New Zealand market share up 4.5 points
• Strategic contract wins in 2011 including Yarra Trams driving strong revenue
growth
• Successfully renewed key contracts in Sydney and Perth
• World first digital display campaign with Qantas - Adshel used technology that
enabled passers-by to feature on campaign’s large digital billboard in Sydney’s
Town Hall station
Operational
highlights
H2 outlook
Revenue
AUD million Revenue EBITDA
Adshel H1 v pcp 67.0 up 22% 14.1 Up 42%
• Australian market growth continued in July
• Expecting to continue strong double digit revenue and EBITDA growth
For
per
sona
l use
onl
y
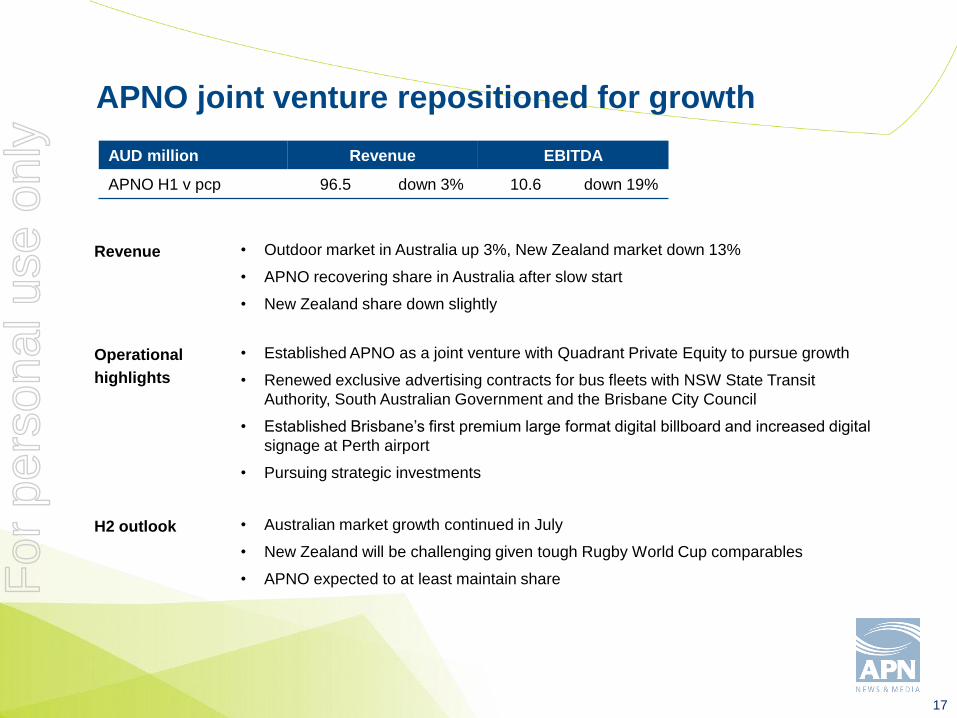
17
APNO joint venture repositioned for growth
• Established APNO as a joint venture with Quadrant Private Equity to pursue growth
• Renewed exclusive advertising contracts for bus fleets with NSW State Transit
Authority, South Australian Government and the Brisbane City Council
• Established Brisbane’s first premium large format digital billboard and increased digital
signage at Perth airport
• Pursuing strategic investments
AUD million Revenue EBITDA
APNO H1 v pcp 96.5 down 3% 10.6 down 19%
Operational
highlights
H2 outlook
Revenue • Outdoor market in Australia up 3%, New Zealand market down 13%
• APNO recovering share in Australia after slow start
• New Zealand share down slightly
• Australian market growth continued in July
• New Zealand will be challenging given tough Rugby World Cup comparables
• APNO expected to at least maintain shareFor
per
sona
l use
onl
y
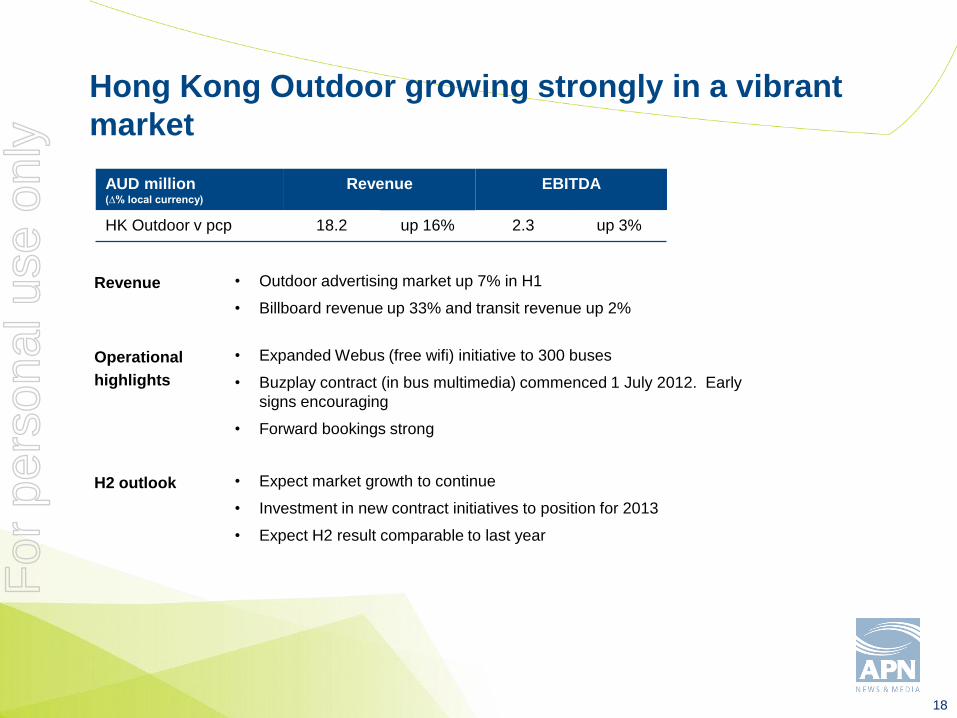
18
Hong Kong Outdoor growing strongly in a vibrant
market
Operational
highlights
H2 outlook
Revenue
AUD million(∆% local currency)
Revenue EBITDA
HK Outdoor v pcp 18.2 up 16% 2.3 up 3%
• Outdoor advertising market up 7% in H1
• Billboard revenue up 33% and transit revenue up 2%
• Expanded Webus (free wifi) initiative to 300 buses
• Buzplay contract (in bus multimedia) commenced 1 July 2012. Early
signs encouraging
• Forward bookings strong
• Expect market growth to continue
• Investment in new contract initiatives to position for 2013
• Expect H2 result comparable to last year
For
per
sona
l use
onl
y

digital
For
per
sona
l use
onl
y

20
Connecting audiences and advertisers in
innovative ways
• Our digital portfolio positions APN for the shifts occurring by advertisers who are increasingly looking for
more accountable advertising as well as data rich advertising and marketing solutions
• We now have a portfolio with significant digital audiences across Australia and New Zealand with
growing profits which augment our traditional broadcast media properties
• This will strengthen our existing brands, build powerful new digital brands and drive new revenue
• We are investing in:
Digital transaction platforms focused on key advertiser segments, eg GrabOne (SMB), CC Media
(retail), and brandsExclusive (brands)
Building audiences, eg nzherald.co.nz, ARN and TRN web and mobile sites, and GrabOne and
brandsExclusive membership bases
Enabling capabilities, eg mobile and data analytics
For
per
sona
l use
onl
y
21
Focused execution and value creation through our
digital strategy
APN digital portfolio
• Increased equity in GrabOne from 75% to 100%
• Acquired 82% of brandsExclusive
We do not anticipate any significant additional investments in the next 12 months
Building digital capabilities across APN:
• Mobile – 143% increase in The New Zealand Herald mobile advertising revenue. 20% of GrabOne
transactions are via mobile
• Social – APN Facebook audience up 25% and Twitter audience up 29%. APN social media audience is
over 1m, driving engagement and ultimately enabling advertising
• Data – Data trials underway to cross-sell NZM and GrabOne audiences. Additional GrabOne data trial
produced 23% increase in email open rate increasing likelihood of purchase
• Video – 742% increase in ARM daily video streams from unique content. All APN video now includes
pre-roll advertising. Radio and publishing sharing video contentFor
per
sona
l use
onl
y
22
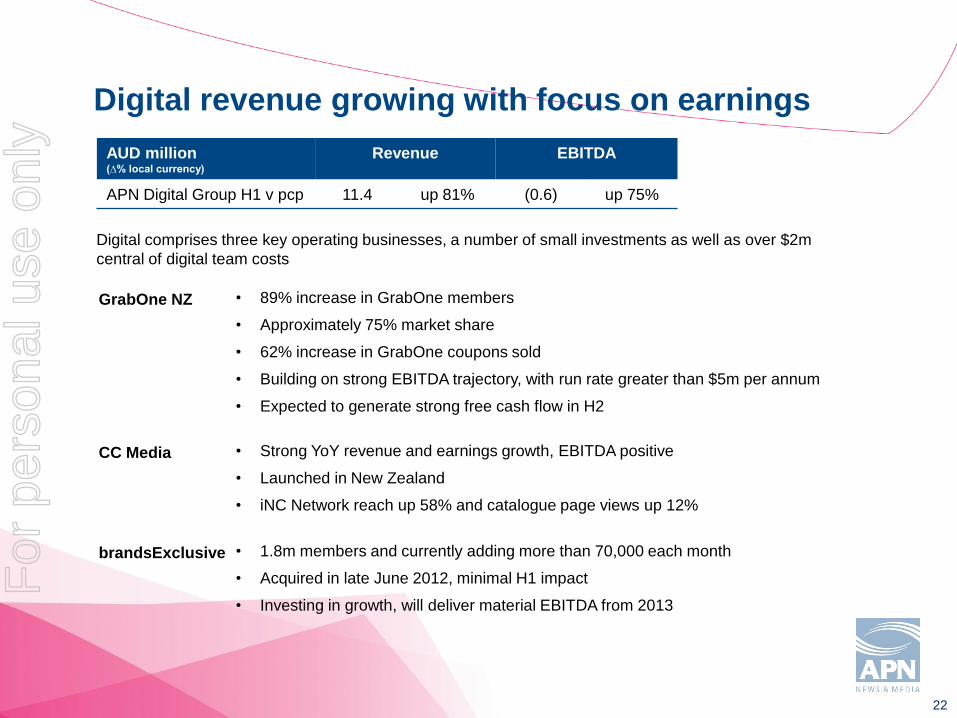
Digital revenue growing with focus on earnings
AUD million(∆% local currency)
Revenue EBITDA
APN Digital Group H1 v pcp 11.4 up 81% (0.6) up 75%
GrabOne NZ • 89% increase in GrabOne members
• Approximately 75% market share
• 62% increase in GrabOne coupons sold
• Building on strong EBITDA trajectory, with run rate greater than $5m per annum
• Expected to generate strong free cash flow in H2
CC Media • Strong YoY revenue and earnings growth, EBITDA positive
• Launched in New Zealand
• iNC Network reach up 58% and catalogue page views up 12%
brandsExclusive • 1.8m members and currently adding more than 70,000 each month
• Acquired in late June 2012, minimal H1 impact
• Investing in growth, will deliver material EBITDA from 2013
Digital comprises three key operating businesses, a number of small investments as well as over $2m
central of digital team costs
For
per
sona
l use
onl
y

H1 2012 Financials
For
per
sona
l use
onl
y
24
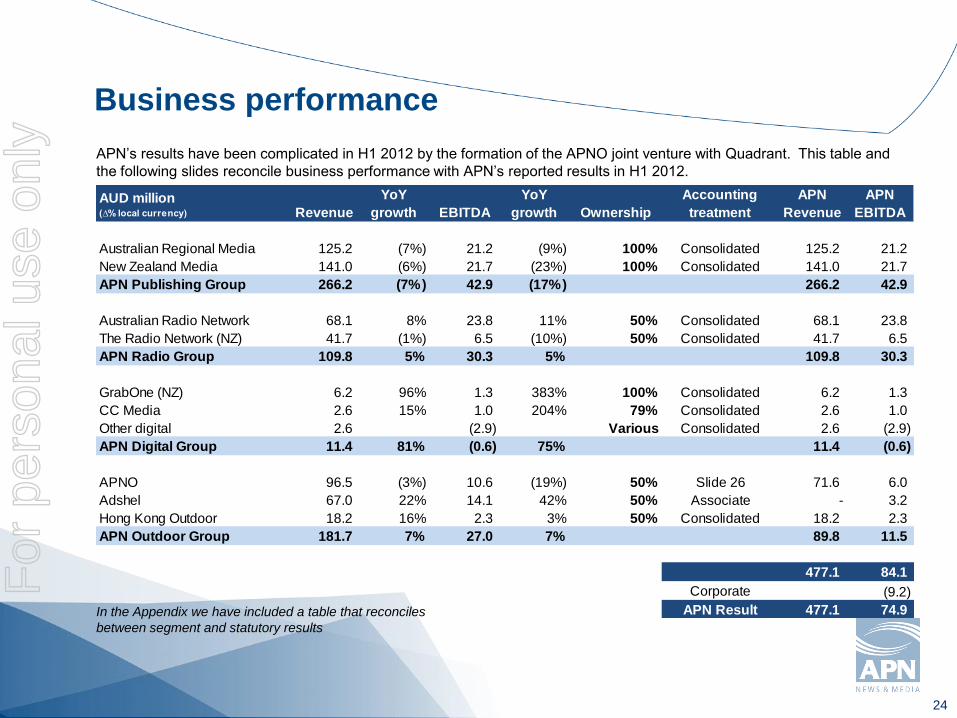
Business performance
APN’s results have been complicated in H1 2012 by the formation of the APNO joint venture with Quadrant. This table and
the following slides reconcile business performance with APN’s reported results in H1 2012.
In the Appendix we have included a table that reconciles
between segment and statutory results
AUD million(∆% local currency) Revenue
YoY
growth EBITDA
YoY
growth Ownership
Accounting
treatment
APN
Revenue
APN
EBITDA
Australian Regional Media 125.2 (7%) 21.2 (9%) 100% Consolidated 125.2 21.2
New Zealand Media 141.0 (6%) 21.7 (23%) 100% Consolidated 141.0 21.7
APN Publishing Group 266.2 (7%) 42.9 (17%) 266.2 42.9
Australian Radio Network 68.1 8% 23.8 11% 50% Consolidated 68.1 23.8
The Radio Network (NZ) 41.7 (1%) 6.5 (10%) 50% Consolidated 41.7 6.5
APN Radio Group 109.8 5% 30.3 5% 109.8 30.3
GrabOne (NZ) 6.2 96% 1.3 383% 100% Consolidated 6.2 1.3
CC Media 2.6 15% 1.0 204% 79% Consolidated 2.6 1.0
Other digital 2.6 (2.9) Various Consolidated 2.6 (2.9)
APN Digital Group 11.4 81% (0.6) 75% 11.4 (0.6)
APNO 96.5 (3%) 10.6 (19%) 50% Slide 26 71.6 6.0
Adshel 67.0 22% 14.1 42% 50% Associate - 3.2
Hong Kong Outdoor 18.2 16% 2.3 3% 50% Consolidated 18.2 2.3
APN Outdoor Group 181.7 7% 27.0 7% 89.8 11.5
477.1 84.1
Corporate (9.2)
APN Result 477.1 74.9
For
per
sona
l use
onl
y
25
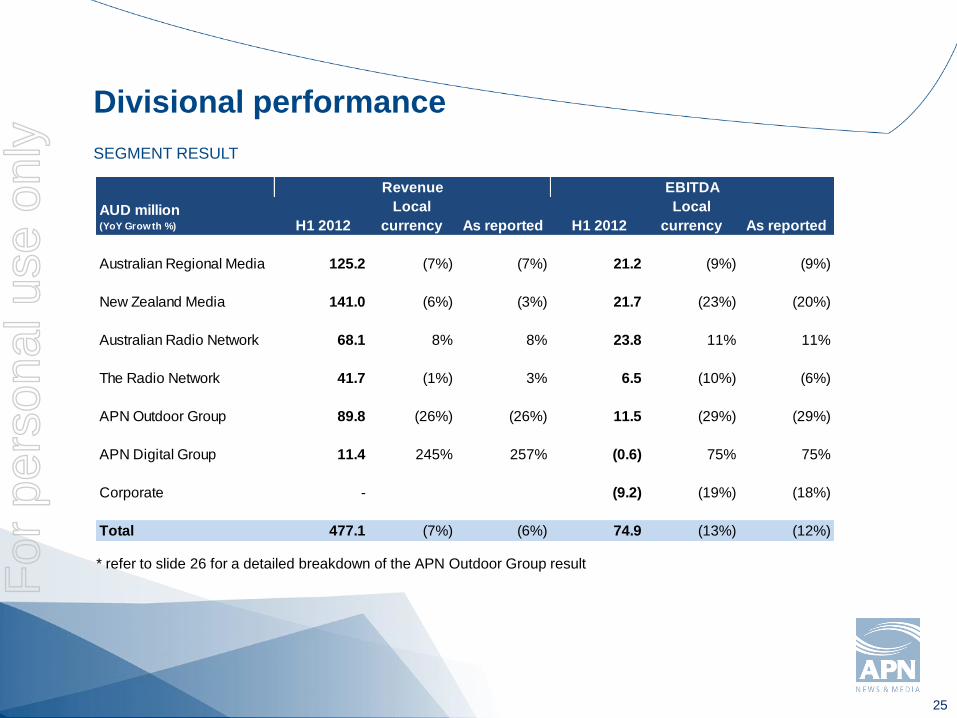
Divisional performance
SEGMENT RESULT
* refer to slide 26 for a detailed breakdown of the APN Outdoor Group result
AUD million(YoY Growth %) H1 2012
Local
currency As reported H1 2012
Local
currency As reported
Australian Regional Media 125.2 (7%) (7%) 21.2 (9%) (9%)
New Zealand Media 141.0 (6%) (3%) 21.7 (23%) (20%)
Australian Radio Network 68.1 8% 8% 23.8 11% 11%
The Radio Network 41.7 (1%) 3% 6.5 (10%) (6%)
APN Outdoor Group 89.8 (26%) (26%) 11.5 (29%) (29%)
APN Digital Group 11.4 245% 257% (0.6) 75% 75%
Corporate - (9.2) (19%) (18%)
Total 477.1 (7%) (6%) 74.9 (13%) (12%)
Revenue EBITDA
For
per
sona
l use
onl
y
26
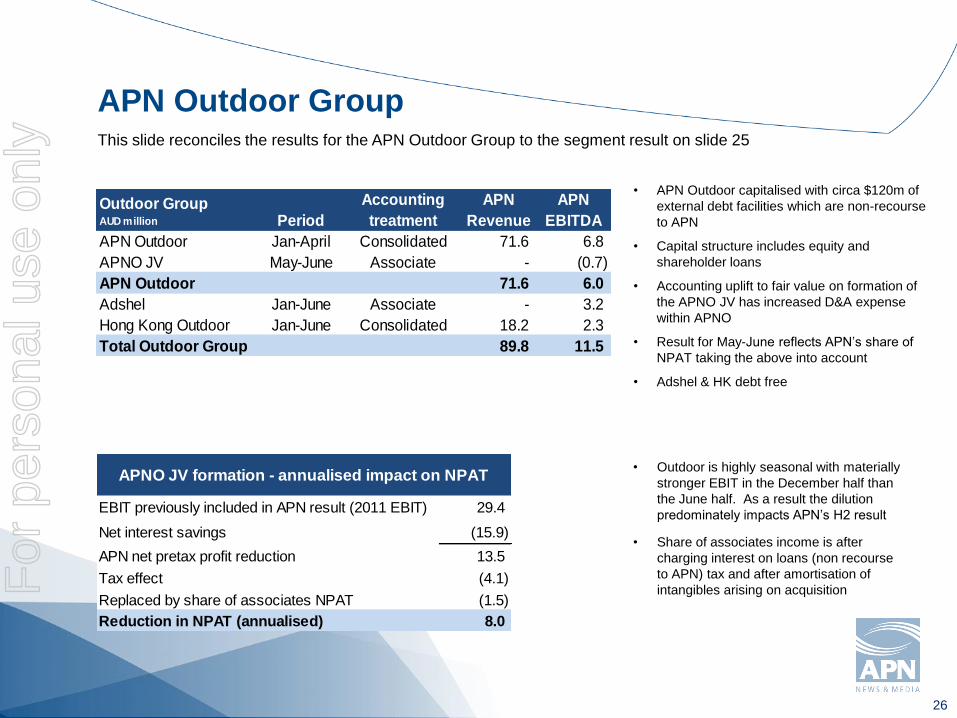
APN Outdoor Group
• APN Outdoor capitalised with circa $120m of
external debt facilities which are non-recourse
to APN
• Capital structure includes equity and
shareholder loans
• Accounting uplift to fair value on formation of
the APNO JV has increased D&A expense
within APNO
• Result for May-June reflects APN’s share of
NPAT taking the above into account
• Adshel & HK debt free
This slide reconciles the results for the APN Outdoor Group to the segment result on slide 25
• Outdoor is highly seasonal with materially
stronger EBIT in the December half than
the June half. As a result the dilution
predominately impacts APN’s H2 result
• Share of associates income is after
charging interest on loans (non recourse
to APN) tax and after amortisation of
intangibles arising on acquisition
Outdoor GroupAUD million Period
Accounting
treatment
APN
Revenue
APN
EBITDA
APN Outdoor Jan-April Consolidated 71.6 6.8
APNO JV May-June Associate - (0.7)
APN Outdoor 71.6 6.0
Adshel Jan-June Associate - 3.2
Hong Kong Outdoor Jan-June Consolidated 18.2 2.3
Total Outdoor Group 89.8 11.5
EBIT previously included in APN result (2011 EBIT) 29.4
Net interest savings (15.9)
APN net pretax profit reduction 13.5
Tax effect (4.1)
Replaced by share of associates NPAT (1.5)
Reduction in NPAT (annualised) 8.0
APNO JV formation - annualised impact on NPAT
For
per
sona
l use
onl
y
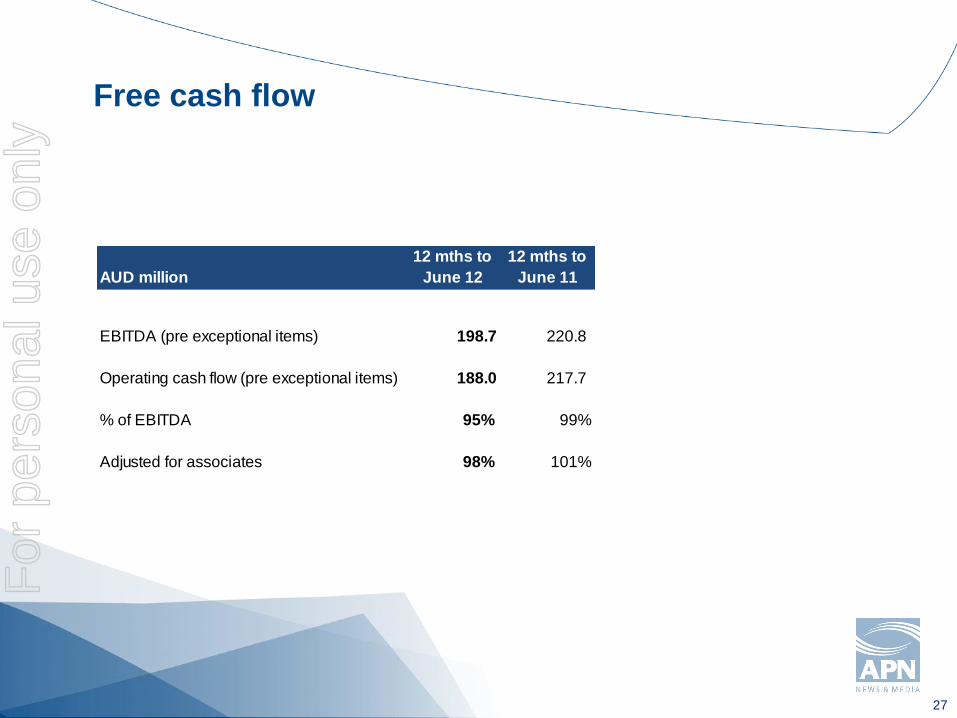
27
Free cash flow
AUD million
12 mths to
June 12
12 mths to
June 11
EBITDA (pre exceptional items) 198.7 220.8
Operating cash flow (pre exceptional items) 188.0 217.7
% of EBITDA 95% 99%
Adjusted for associates 98% 101%
For
per
sona
l use
onl
y
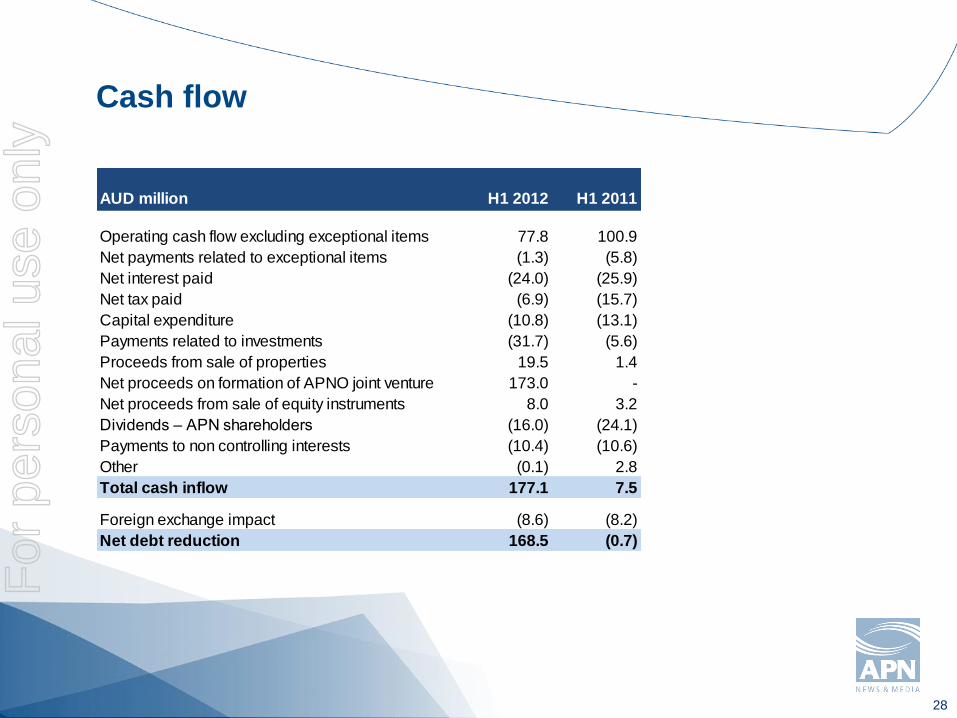
28
Cash flow
AUD million H1 2012 H1 2011
Operating cash flow excluding exceptional items 77.8 100.9
Net payments related to exceptional items (1.3) (5.8)
Net interest paid (24.0) (25.9)
Net tax paid (6.9) (15.7)
Capital expenditure (10.8) (13.1)
Payments related to investments (31.7) (5.6)
Proceeds from sale of properties 19.5 1.4
Net proceeds on formation of APNO joint venture 173.0 -
Net proceeds from sale of equity instruments 8.0 3.2
Dividends – APN shareholders (16.0) (24.1)
Payments to non controlling interests (10.4) (10.6)
Other (0.1) 2.8
Total cash inflow 177.1 7.5
Foreign exchange impact (8.6) (8.2)
Net debt reduction 168.5 (0.7)
For
per
sona
l use
onl
y
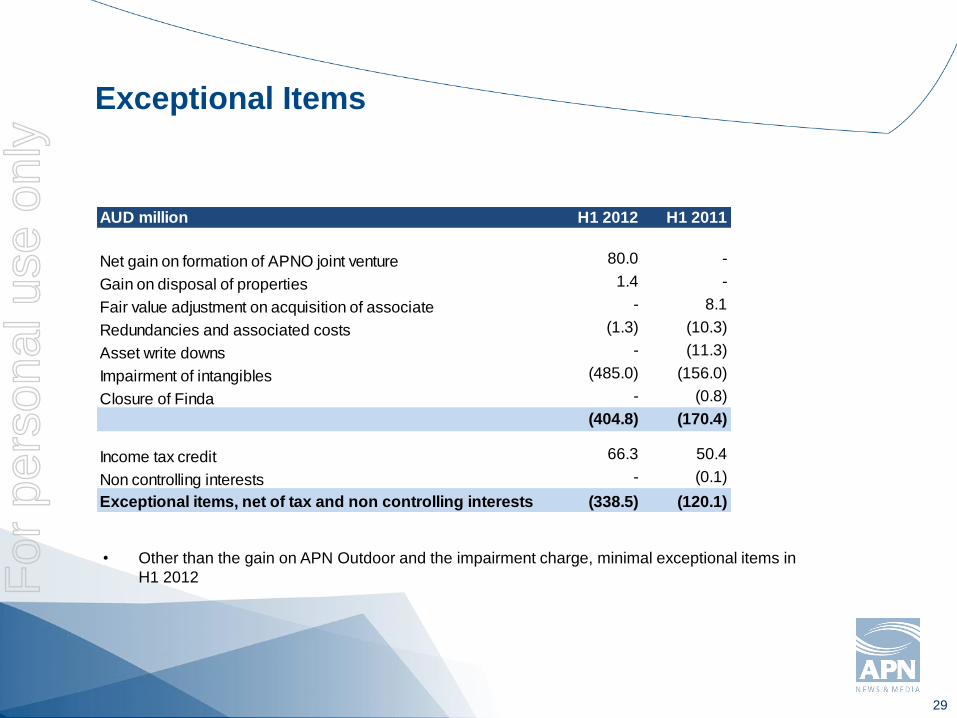
29
Exceptional Items
• Other than the gain on APN Outdoor and the impairment charge, minimal exceptional items in
H1 2012
AUD million H1 2012 H1 2011
Net gain on formation of APNO joint venture 80.0 -
Gain on disposal of properties 1.4 -
Fair value adjustment on acquisition of associate - 8.1
Redundancies and associated costs (1.3) (10.3)
Asset write downs - (11.3)
Impairment of intangibles (485.0) (156.0)
Closure of Finda - (0.8)
(404.8) (170.4)
Income tax credit 66.3 50.4
Non controlling interests - (0.1)
Exceptional items, net of tax and non controlling interests (338.5) (120.1)
For
per
sona
l use
onl
y
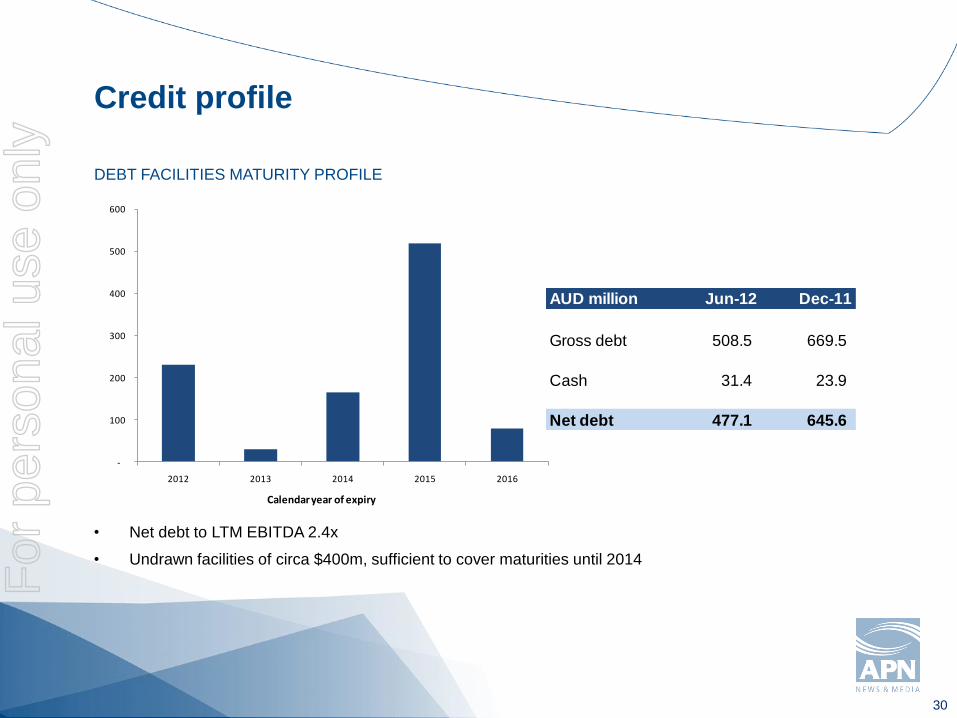
30
Credit profile
DEBT FACILITIES MATURITY PROFILE
• Net debt to LTM EBITDA 2.4x
• Undrawn facilities of circa $400m, sufficient to cover maturities until 2014
-
100
200
300
400
500
600
2012 2013 2014 2015 2016
Calendar year of expiry
AUD million Jun-12 Dec-11
Gross debt 508.5 669.5
Cash 31.4 23.9
Net debt 477.1 645.6
For
per
sona
l use
onl
y
31
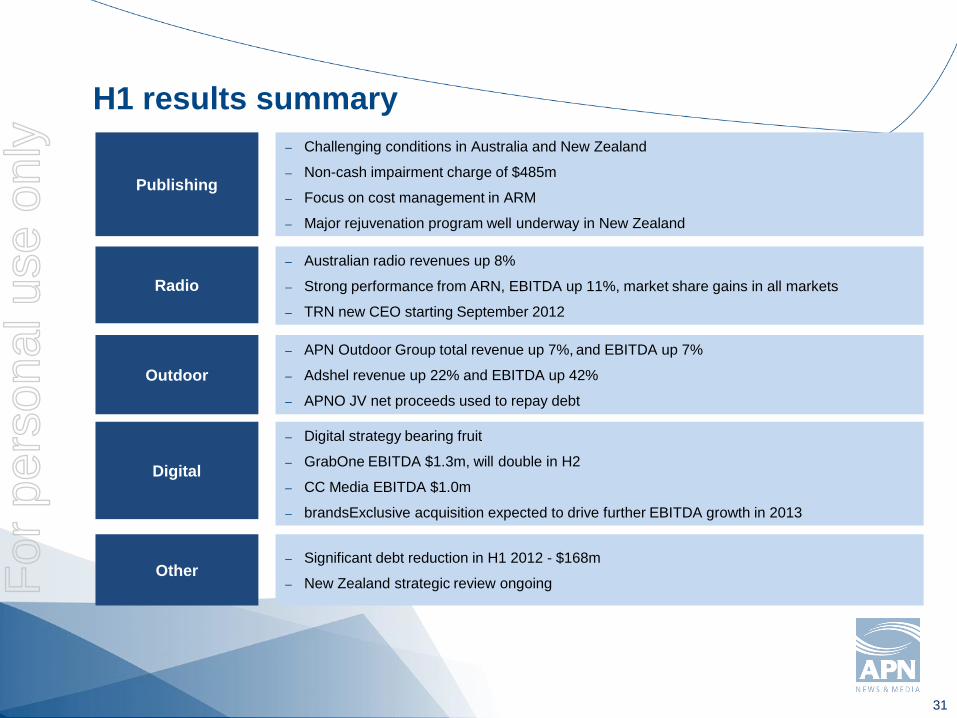
H1 results summary
Radio
– Australian radio revenues up 8%
– Strong performance from ARN, EBITDA up 11%, market share gains in all markets
– TRN new CEO starting September 2012
Outdoor
– APN Outdoor Group total revenue up 7%, and EBITDA up 7%
– Adshel revenue up 22% and EBITDA up 42%
– APNO JV net proceeds used to repay debt
Publishing
– Challenging conditions in Australia and New Zealand
– Non-cash impairment charge of $485m
– Focus on cost management in ARM
– Major rejuvenation program well underway in New Zealand
Digital
– Digital strategy bearing fruit
– GrabOne EBITDA $1.3m, will double in H2
– CC Media EBITDA $1.0m
– brandsExclusive acquisition expected to drive further EBITDA growth in 2013
Other– Significant debt reduction in H1 2012 - $168m
– New Zealand strategic review ongoingFor
per
sona
l use
onl
y
32
Outlook statement
Net Profit After Tax (NPAT) in H2 is expected to be affected by:
• the impact of the recent deterioration in our July and August publishing revenues in Australia. If these
conditions were to continue, we would expect our combined publishing EBITDA result (Australia and
New Zealand) to report declines over the prior corresponding period broadly similar to the 17% fall
experienced in H1; and
• the NPAT dilution arising from formation of the APNO joint venture with Quadrant Private Equity. The
annualised impact is estimated to be negative $8m, virtually all of which impacts H2 due to the
seasonality of outdoor earnings.
Our other divisions continue to perform well and results from these divisions are expected to be ahead of
or in line with the same period last year.
For
per
sona
l use
onl
y

Appendices
For
per
sona
l use
onl
y
34
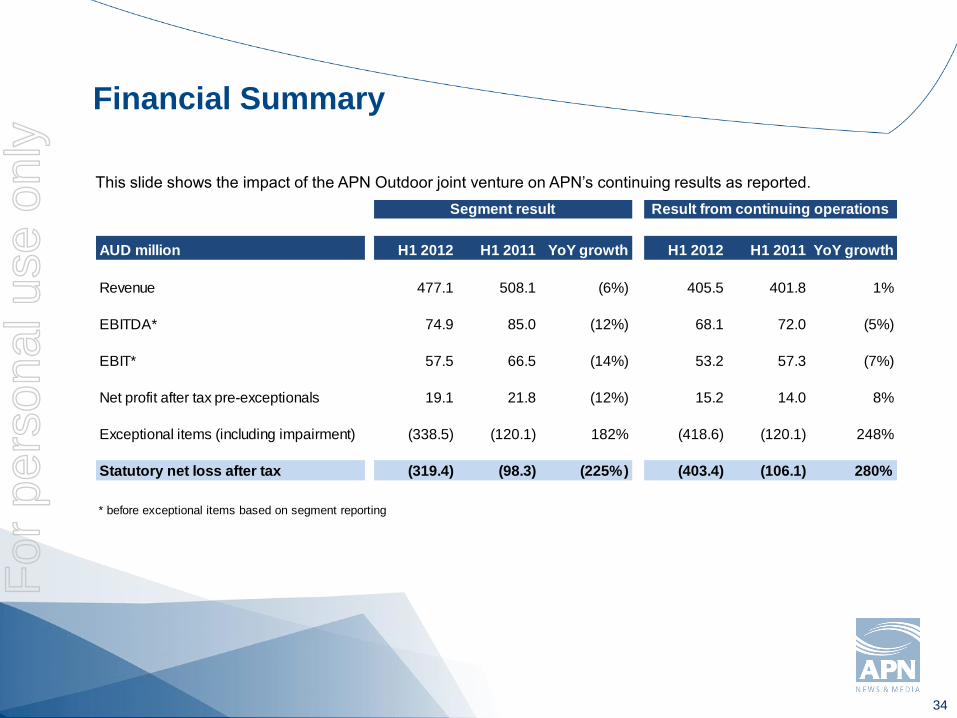
Financial Summary
This slide shows the impact of the APN Outdoor joint venture on APN’s continuing results as reported.
AUD million H1 2012 H1 2011 YoY growth H1 2012 H1 2011 YoY growth
Revenue 477.1 508.1 (6%) 405.5 401.8 1%
EBITDA* 74.9 85.0 (12%) 68.1 72.0 (5%)
EBIT* 57.5 66.5 (14%) 53.2 57.3 (7%)
Net profit after tax pre-exceptionals 19.1 21.8 (12%) 15.2 14.0 8%
Exceptional items (including impairment) (338.5) (120.1) 182% (418.6) (120.1) 248%
Statutory net loss after tax (319.4) (98.3) (225%) (403.4) (106.1) 280%
* before exceptional items based on segment reporting
Segment result Result from continuing operations
For
per
sona
l use
onl
y
35
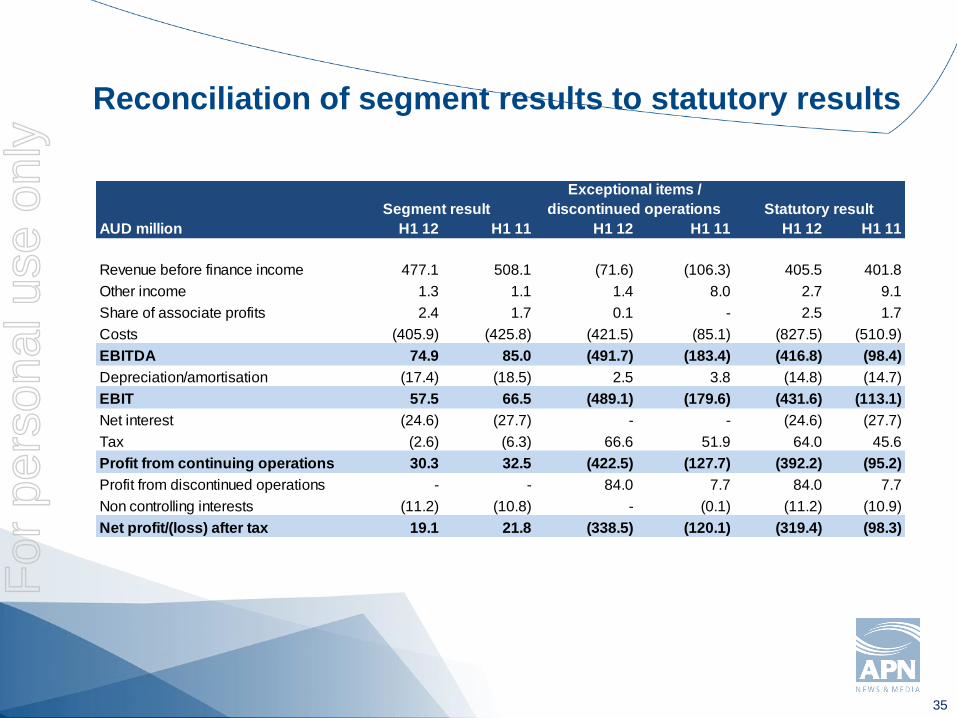
Reconciliation of segment results to statutory results
AUD million H1 12 H1 11 H1 12 H1 11 H1 12 H1 11
Revenue before finance income 477.1 508.1 (71.6) (106.3) 405.5 401.8
Other income 1.3 1.1 1.4 8.0 2.7 9.1
Share of associate profits 2.4 1.7 0.1 - 2.5 1.7
Costs (405.9) (425.8) (421.5) (85.1) (827.5) (510.9)
EBITDA 74.9 85.0 (491.7) (183.4) (416.8) (98.4)
Depreciation/amortisation (17.4) (18.5) 2.5 3.8 (14.8) (14.7)
EBIT 57.5 66.5 (489.1) (179.6) (431.6) (113.1)
Net interest (24.6) (27.7) - - (24.6) (27.7)
Tax (2.6) (6.3) 66.6 51.9 64.0 45.6
Profit from continuing operations 30.3 32.5 (422.5) (127.7) (392.2) (95.2)
Profit from discontinued operations - - 84.0 7.7 84.0 7.7
Non controlling interests (11.2) (10.8) - (0.1) (11.2) (10.9)
Net profit/(loss) after tax 19.1 21.8 (338.5) (120.1) (319.4) (98.3)
Segment result
Exceptional items /
discontinued operations Statutory result
For
per
sona
l use
onl
y
36
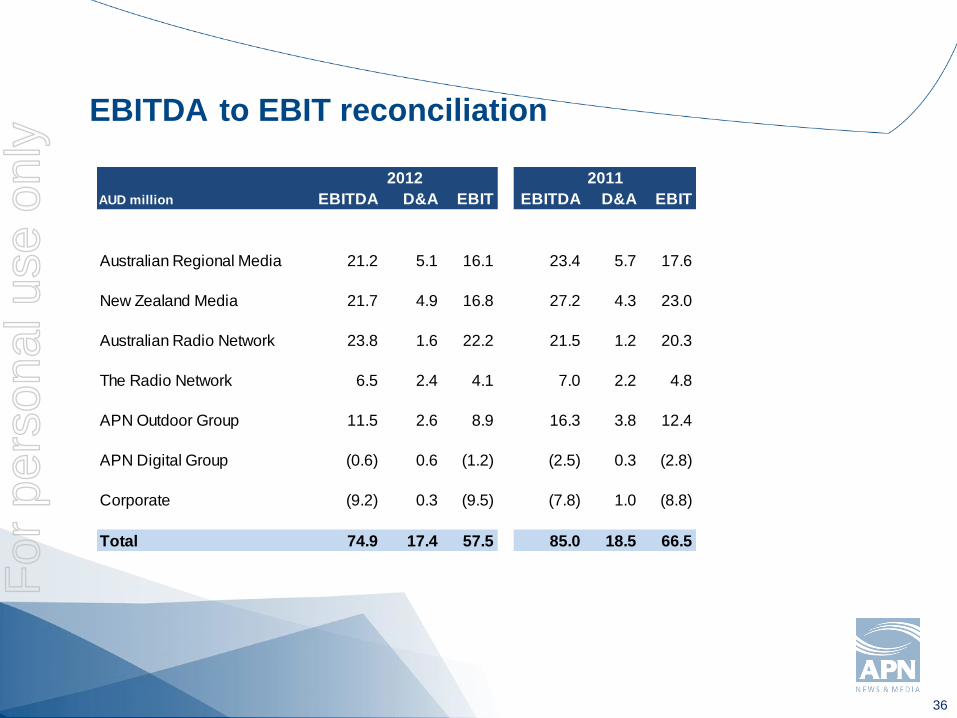
EBITDA to EBIT reconciliation
AUD million EBITDA D&A EBIT EBITDA D&A EBIT
Australian Regional Media 21.2 5.1 16.1 23.4 5.7 17.6
New Zealand Media 21.7 4.9 16.8 27.2 4.3 23.0
Australian Radio Network 23.8 1.6 22.2 21.5 1.2 20.3
The Radio Network 6.5 2.4 4.1 7.0 2.2 4.8
APN Outdoor Group 11.5 2.6 8.9 16.3 3.8 12.4
APN Digital Group (0.6) 0.6 (1.2) (2.5) 0.3 (2.8)
Corporate (9.2) 0.3 (9.5) (7.8) 1.0 (8.8)
Total 74.9 17.4 57.5 85.0 18.5 66.5
2012 2011
For
per
sona
l use
onl
y
37
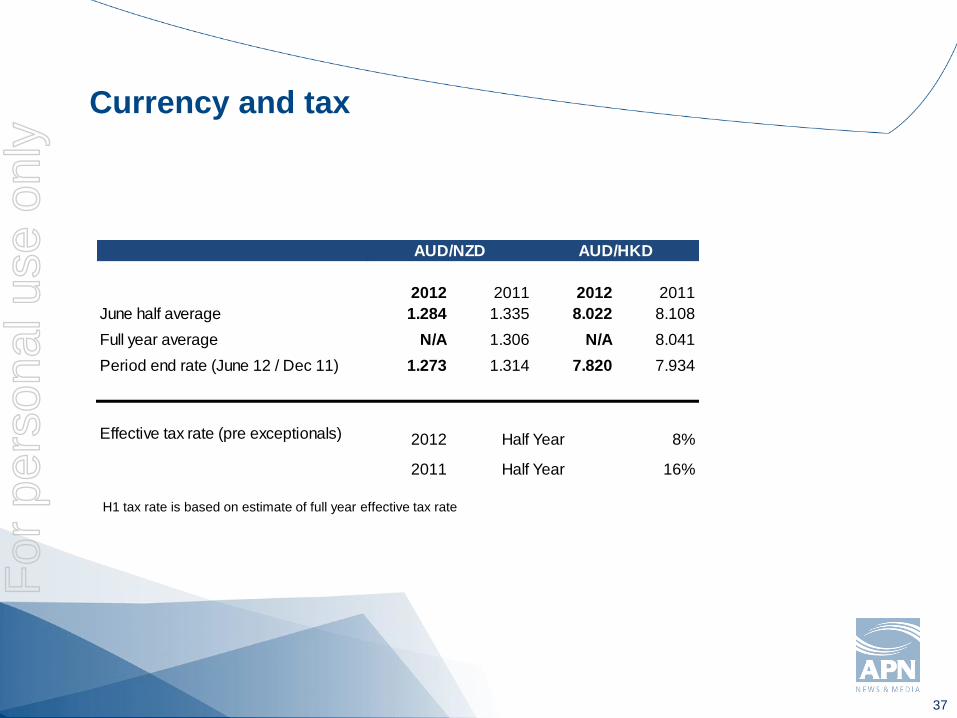
Currency and tax
H1 tax rate is based on estimate of full year effective tax rate
2012 2011 2012 2011
June half average 1.284 1.335 8.022 8.108
Full year average N/A 1.306 N/A 8.041
Period end rate (June 12 / Dec 11) 1.273 1.314 7.820 7.934
Effective tax rate (pre exceptionals) 2012 8%
2011 16%
Half Year
Half Year
AUD/NZD AUD/HKD
For
per
sona
l use
onl
y

Interim Results17 August 2012
Brett Chenoweth, Chief Executive Officer
Peter Myers, Chief Financial Officer
For
per
sona
l use
onl
y
39
Disclaimer
APN News & Media Limited (APN) does not accept any liability to any person, organisation
or company for any loss or damage suffered as a result of reliance on this document. All
statements other than statements of historical fact are, or may be deemed to be, forward-
looking statements, and are subject to variation. All forward-looking statements in this
document reflect the current expectations of APN concerning future results and events.
Any forward-looking statements contained or implied, either within this document or verbally,
involve known and unknown risks, uncertainties and other factors (including economic and
market conditions, changes in operating conditions, currency fluctuations, political events,
labour relations, availability and cost of labour, material and equipment) that may cause
APN’s actual results, performance or achievements to differ materially from the anticipated
results, performance or achievements, expressed, projected or implied by any forward-
looking statements.
For
per
sona
l use
onl
y