Embed Size (px)
Citation preview
Level 32, 1 O’Connell Street
Sydney NSW 2000
W www.eclipx.com
Eclipx Group Limited | ABN: 85 131 557 901
Market Announcements Office Australian Securities Exchange
20 Bridge Street Sydney NSW 2000
Dear Sir / Madam
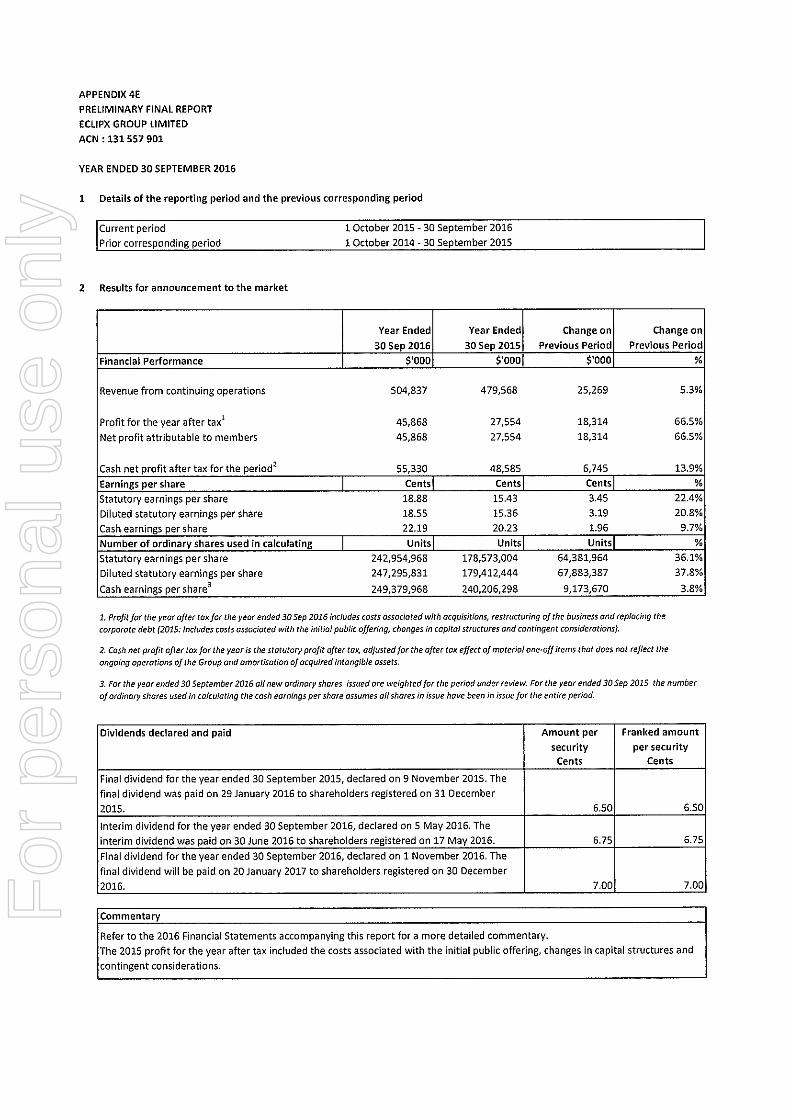
2016 Financial Results - Appendix 4E and 2016 Financial Report for the year ended 30 September 2016
Please find attached for release to the market the following documents for the year ended 30 September 2016:
• Appendix 4E – Preliminary Final Report, as required by ASX Listing Rule 4.3A; and
• Eclipx Group Limited Financial Report for the year ended 30 September 2016.
Yours faithfully
Matt Sinnamon
Company Secretary General Counsel
For
per
sona
l use
onl
y
For
per
sona
l use
onl
y
For
per
sona
l use
onl
y

Eclipx Group LimitedACN 131 557 901
Financial reportfor the year ended 30 September 2016
For
per
sona
l use
onl
y
Eclipx Group LimitedACN 131 557 901
Financial report for the year ended 30 September 2016
CONTENTSPage
Directors' Report 3Lead Auditor's Independence Declaration 17Letter from Remuneration and Nomination Committee (unaudited) 18Remuneration Report (audited) 19Financial Statements
Statement of Profit or Loss and Other Comprehensive Income 34Statement of Financial Position 35Statement of Changes in Equity 36Statement of Cash Flows 37
Notes to the Financial Statements1.0 INTRODUCTION TO THE REPORT2.0 BUSINESS RESULT FOR THE YEAR
2.1 Segment information 402.2 Revenue 412.3 Expenses 422.4 Earnings per share 442.5 Business combinations 452.6 Taxation 48
3.0 OPERATING ASSETS AND LIABILITIES3.1 Property, plant and equipment 543.2 Finance leases 563.3 Trade receivables and other assets 563.4 Trade and other liabilities 573.5 Intangibles 58
4.0 CAPITAL MANAGEMENT4.1 Borrowings 614.2 Financial risk management 624.3 Cash and cash equivalents 674.4 Derivative financial instruments 674.5 Contributed equity 684.6 Commitments 694.7 Dividends 71
5.0 EMPLOYEE REMUNERATION AND BENEFITS5.1 Share based payments 725.2 Key management personnel disclosure 79
6.0 OTHER6.1 Reserves 796.2 Parent entity information 806.3 Related party transactions 806.4 Remuneration of auditors 826.5 Deed of cross guarantee 826.6 Reconciliation of cash flow from operating activities 856.7 Events occurring after the reporting period 85
Directors' Declaration 86Independent Auditor's Report 87
2
For
per
sona
l use
onl
y
Eclipx Group LimitedDirectors' Report30 September 2016
Directors' ReportThe Directors present their report on the consolidated entity (referred to hereafter as Group or Eclipx) consisting of EclipxGroup Limited (Company) and the entities it controlled at the end of, or during, the year ended 30 September 2016.
1. Directors
The following persons were Directors of the Company during the financial year and up to the date of this report:
KERRY ROXBURGH BCOM, MBA, MESAA
Chairman since 26 March 2015, Independent Non-Executive Director since 26 March 2015
Mr Kerry Roxburgh has more than 50 years’ experience in the financial services industry. He is Chairman of Tyro PaymentsLtd. Until 31 December 2015, he was Chairman of Tasman Cargo Airlines Pty Ltd, and Deputy Chairman of MarshallInvestments Pty Ltd. He is the Lead Independent Non-Executive Director of Ramsay Health Care Ltd, a Non-Executive Directorof the Medical Indemnity Protection Society and of MIPS Insurance Ltd. Until 30 September 2016, he was also a member of theAdvisory Board of AON Risk Solutions in Australia.
He was previously CEO of E*TRADE Australia and was subsequently Non-Executive Chairman until June 2007, when it wasacquired by ANZ Bank. Prior to his time at E*TRADE, Kerry was an Executive Director of HSBC Bank Australia where, for 10years, he held various positions including Head of Corporate Finance and Executive Chairman of HSBC James CapelAustralia.
Prior to HSBC, he spent more than 20 years as a Chartered Accountant with HLB Mann Judd and previously at ArthurAndersen.
He is a Practitioner Member of the Stockbrokers Association of Australia.
In addition to Eclipx Group Ltd, during the last three years Kerry also served as a Director for the following listed companies:Ramsay Health Care Ltd (appointed July 1997) and Charter Hall Ltd (retired November 2014).
GAIL PEMBERTON MA (UTS), FAICD
Independent Non-Executive Director since 26 March 2015
Ms Gail Pemberton has more than 30 years’ experience in banking and wealth management and is a specialist in technologyand operations.
Prior to taking up a Non-Executive Director career, Gail was Chief Operating Officer, UK at BNP Paribas Securities Servicesand CEO and Managing Director, BNP Paribas Securities Services, Australia and New Zealand. She was previously GroupCIO, and subsequently Financial Services Group COO at Macquarie Bank.
Her current board roles include Chairman of OneVue Ltd and SIRCA Technology Pty Ltd and Non-Executive Director of QICLtd, PayPal Australia Pty Ltd and Melbourne IT Ltd.
She previously was Chairman of Onthehouse, and served on the board of Alleron Funds Management, Air Services Australia,the Sydney Opera House Trust, Harvey World Travel and UXC Ltd. She has also provided independent consulting services tothe NSW Government Department of Premier and Cabinet on their Corporate and Shared Services reform program.
In addition to Eclipx Group Ltd, during the last three years Gail also served as a Director for the following listed companies:OneVue Ltd (appointed 2007) and Melbourne IT Ltd (appointed May 2016).
3
For
per
sona
l use
onl
y
Eclipx Group LimitedDirectors' Report30 September 2016(continued)
1. Directors (continued)
TREVOR ALLEN BCOM (HONS), CA, FF, MAICD
Independent Non-Executive Director since 26 March 2015
Mr Trevor Allen has 38 years of corporate and commercial experience, primarily as a corporate and financial adviser toAustralian and international corporates.
He is a Non-Executive Director of Peet Ltd, Freedom Foods Group Ltd and Yowie Group Ltd. He is a Non-Executive AlternateDirector, Company Secretary and Public Officer of Australian Fresh Milk Holdings Pty Ltd and Fresh Dairy One Pty Ltd. Trevoris the Chairman of Brighte Capital Pty Ltd. Until August 2016 he was a board member of Aon Superannuation Pty Ltd, thetrustee of the Aon Master Trust. He was a member of FINSIA’s Corporate Finance Advisory Committee for 10 years up untilDecember 2013.
Prior to undertaking non-executive roles, he had senior executive positions as an Executive Director - Corporate Finance atSBC Warburg and its predecessors for eight years and as a Corporate Finance Partner at KPMG for nearly 12 years. At thetime of his retirement from KPMG in 2011, he was the Lead Partner in its National Mergers and Acquisitions group.
He was Director - Business Development for Cellarmaster Wines from 1997 to 2000, having responsibility for the acquisition,integration and performance of a number of acquisitions made outside Australia in that period.
In addition to Eclipx Group Ltd, during the last three years Trevor also served as a Director for the following listed companies:Peet Ltd (appointed April 2012), Freedom Food Group Ltd (appointed July 2013) and Yowie Group Ltd (appointed March 2015).
RUSSELL SHIELDS FAICD, SA Fin
Independent Non-Executive Director since 26 March 2015
Mr Russell Shields has more than 35 years’ experience in financial services including six years as Chairman Queensland andNorthern Territory for ANZ Bank.
He is a Non-Executive Director of Aquis Entertainment Ltd and Retail Food Group Ltd. Previously Russell was the Chairman ofOnyx Property Group Pty Ltd.
Prior to joining ANZ, he held senior executive roles with HSBC including Managing Director Asia Pacific - Transport,Construction and Infrastructure and State Manager Queensland, HSBC Bank Australia.
In addition to Eclipx Group Ltd, during the last three years Russell also served as a Director for the following listed companies:Aquis Entertainment Ltd (appointed August 2015) and Retail Food Group Ltd (appointed December 2015).
GREG RUDDOCK BCOM (UWA)
Non-Executive Director since 26 March 2015, Chairman to 26 March 2015
Mr Greg Ruddock is the Joint Chief Executive Officer of Ironbridge and co-leads investment and portfolio managementactivities. He has 14 years of private equity experience with Gresham Private Equity and Ironbridge.
Prior to joining Ironbridge, he spent seven years with Wesfarmers in mergers and acquisitions, five years with Kalamazoo Ltd invarious senior roles, and four years as Director of Gresham Private Equity.
Greg has represented the Ironbridge Funds on the boards of Stardex, Super Amart, BBQs Galore, Easternwell, ISGM andAOS.
IRWIN ('DOC') KLOTZ
Chief Executive Officer and Managing Director since 27 March 2014
Mr Doc Klotz has over 25 years’ experience in senior executive roles in the financial services and travel industries in Australia,New Zealand and the United States.
Prior to joining Eclipx in 2014, he was Head of Operations at FlexiGroup, an ASX 200 company (ASX: FXL).
He has senior executive experience with Travel Services International, Hotels.com and Expedia, Inc. in the United States.
4
For
per
sona
l use
onl
y
Eclipx Group LimitedDirectors' Report30 September 2016(continued)
1. Directors (continued)
GARRY McLENNAN BBUS (UTS), FCPA, FAICD
Deputy Chief Executive Officer and Chief Financial Officer since 27 March 2014
Mr Garry McLennan has over 35 years’ of experience in financial services including five years as Chief Financial Officer atFlexiGroup, an ASX 200 company (ASX: FXL).
Prior to his time at FlexiGroup, he spent 23 years at HSBC Bank Australia where he was Chief Financial Officer andsubsequently Chief Operating Officer. He has previously served on the board of HSBC Bank Australia and The AustralianBanking Industry Ombudsman Ltd.
Garry currently serves on the Board Audit Committee of Intersect, a full-service eResearch support agency.
2. Company Secretary
Mr Matt Sinnamon was appointed Company Secretary and Group General Counsel on 27 October 2014. He is admitted to theSupreme Court of New South Wales and the High Court of Australia. He is a member of the Governance Institute of Australia, aChartered Secretary and is entered on the Roll of Public Notaries.
The Company Secretary function is responsible for ensuring the Company complies with its statutory duties and maintainsproper documentation, registers and records. The role provides advice to the Directors and officers about corporate governanceand legal matters.
3. Directors' Meetings
The table below sets out the numbers of meetings held during the 2016 financial year and the number of meetings attended byeach Director. During the year nine Board meetings, four Audit and Risk Committee meetings and two Remuneration andNomination Committee meetings were held.
Board Audit and Risk Committee Remuneration andNomination Committee
Director Held Attended Held Attended Held AttendedKerry Roxburgh 9 9 4 4 2 2Gail Pemberton 9 9 - - 2 2Trevor Allen 9 9 4 4 2 2Russell Shields 9 8 4 3 - -Gregory Ruddock 9 9 4 4 - -Garry McLennan 9 9 - - - -Doc Klotz 9 9 - - - -
5
For
per
sona
l use
onl
y
Eclipx Group LimitedDirectors' Report30 September 2016(continued)
4. Review of operations
Business acquisitions
On 31 March 2016 the Group acquired the business and assets of FleetSmart, a division of Cardlink Systems Ltd (FleetSmart).The principal activity of the business acquired is the provision of vehicle fleet management. The business was acquired tosupport the business' growth strategy in vehicle fleet management in the New Zealand market. FleetSmart recorded a profitbefore tax of $1.1m for the period under review.
On 19 May 2016 Eclipx acquired Right2Drive Pty Ltd (Right2Drive). The principal activity of the business acquired is theprovision of rental replacement vehicles to “not at fault” drivers that have accident damaged cars requiring repair. The businesswas acquired to provide a platform to expand into the medium term vehicle rental market. Right2Drive recorded a profit beforetax of $3.4m for the period under review.
Principal activities
Eclipx is a diversified financial services organisation that provides complete fleet management services, corporate andconsumer asset backed finance and medium term vehicle rentals to the Australian and New Zealand market. As at 30September 2016 Eclipx managed or financed in excess of 99,000 vehicles across Australia and New Zealand.
In Australia the Group operates under six primary brands: FleetPartners, FleetPlus, FleetChoice, CarLoans.com.au,Right2Drive and Eclipx Commercial.
In New Zealand the Group operates under five primary brands: FleetPartners, FleetPlus, CarLoans.co.nz, Right2Drive andAutoSelect.
Business model
Eclipx generates revenue in different ways across its brands that can broadly be split as below:
• Eclipx-funded model (used primarily by FleetPartners and Eclipx Commercial) is where Eclipx purchases vehicles to leaseto customers and earns a spread, or net interest income, being the difference between the interest income it receives fromcustomers and its cost of funds. Eclipx recognises net interest income over the life of the lease;
• Third-party-funded model (used primarily by FleetPlus, FleetChoice and CarLoans) is where Eclipx acts as a broker oragent that arranges vehicle financing for the customer from third party banks and financial institutions. Under this model, ascompensation for originating new business, Eclipx earns part of its revenue from upfront brokerage commissions paid bythe third-party funders;
• Eclipx earns management and maintenance fees, ancillary revenue from related products and services and end of leaseincome; and
• Vehicle rental (Right2Drive) is where Eclipx rents motor vehicles to “not at fault” drivers that have accident damagedvehicles. Eclipx recognises rental income for the period that the vehicle has been rented and costs directly associated withthe rental will be disclosed under cost of revenue.
Eclipx believes Net Operating Income is a key measure of financial and operating performance for its businesses as it takesinto account the direct costs incurred in generating gross revenue.
The origination of new business is a key driver of profitability and the group targets growth through business-to-businessrelationships and online and word of mouth business-to-consumer. The Group drives profitability by managing revenue, incomegenerating assets, credit quality and operating expenses.
6
For
per
sona
l use
onl
y
Eclipx Group LimitedDirectors' Report30 September 2016(continued)
4. Review of operations (continued)
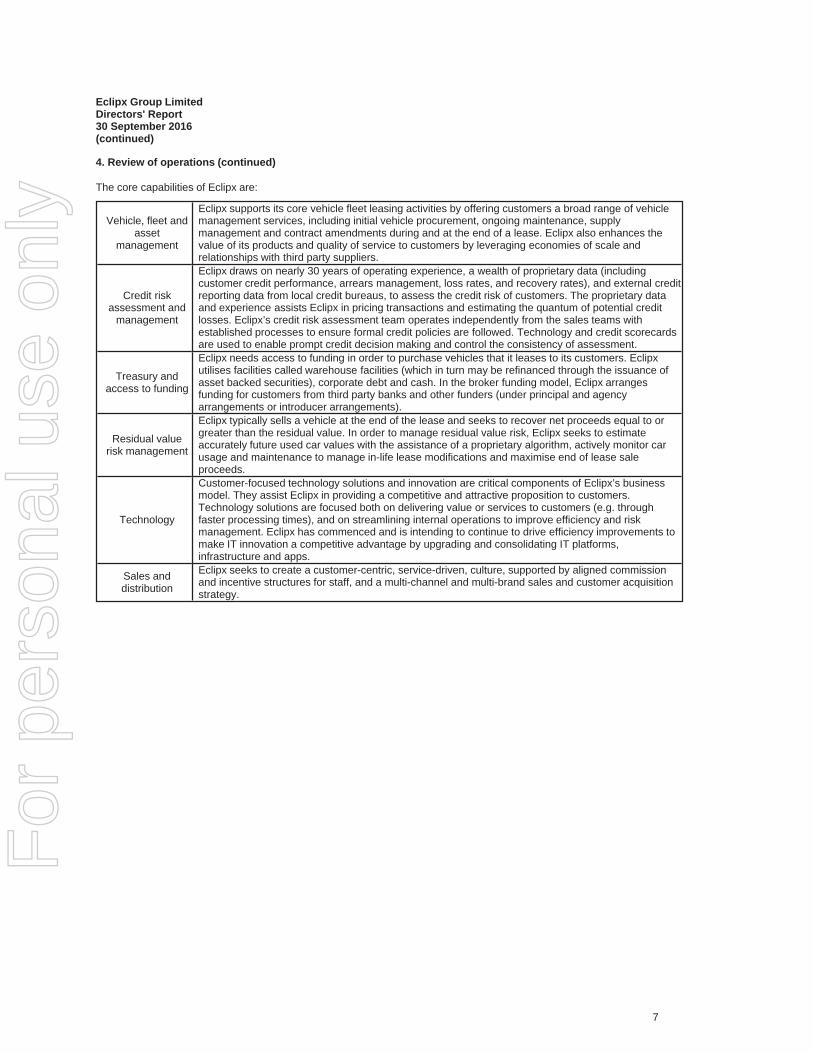
The core capabilities of Eclipx are:
Vehicle, fleet andasset
management
Eclipx supports its core vehicle fleet leasing activities by offering customers a broad range of vehiclemanagement services, including initial vehicle procurement, ongoing maintenance, supplymanagement and contract amendments during and at the end of a lease. Eclipx also enhances thevalue of its products and quality of service to customers by leveraging economies of scale andrelationships with third party suppliers.
Credit riskassessment and
management
Eclipx draws on nearly 30 years of operating experience, a wealth of proprietary data (includingcustomer credit performance, arrears management, loss rates, and recovery rates), and external creditreporting data from local credit bureaus, to assess the credit risk of customers. The proprietary dataand experience assists Eclipx in pricing transactions and estimating the quantum of potential creditlosses. Eclipx’s credit risk assessment team operates independently from the sales teams withestablished processes to ensure formal credit policies are followed. Technology and credit scorecardsare used to enable prompt credit decision making and control the consistency of assessment.
Treasury andaccess to funding
Eclipx needs access to funding in order to purchase vehicles that it leases to its customers. Eclipxutilises facilities called warehouse facilities (which in turn may be refinanced through the issuance ofasset backed securities), corporate debt and cash. In the broker funding model, Eclipx arrangesfunding for customers from third party banks and other funders (under principal and agencyarrangements or introducer arrangements).
Residual valuerisk management
Eclipx typically sells a vehicle at the end of the lease and seeks to recover net proceeds equal to orgreater than the residual value. In order to manage residual value risk, Eclipx seeks to estimateaccurately future used car values with the assistance of a proprietary algorithm, actively monitor carusage and maintenance to manage in-life lease modifications and maximise end of lease saleproceeds.
Technology
Customer-focused technology solutions and innovation are critical components of Eclipx’s businessmodel. They assist Eclipx in providing a competitive and attractive proposition to customers.Technology solutions are focused both on delivering value or services to customers (e.g. throughfaster processing times), and on streamlining internal operations to improve efficiency and riskmanagement. Eclipx has commenced and is intending to continue to drive efficiency improvements tomake IT innovation a competitive advantage by upgrading and consolidating IT platforms,infrastructure and apps.
Sales anddistribution
Eclipx seeks to create a customer-centric, service-driven, culture, supported by aligned commissionand incentive structures for staff, and a multi-channel and multi-brand sales and customer acquisitionstrategy.
7
For
per
sona
l use
onl
y
Eclipx Group LimitedDirectors' Report30 September 2016(continued)
4. Review of operations (continued)
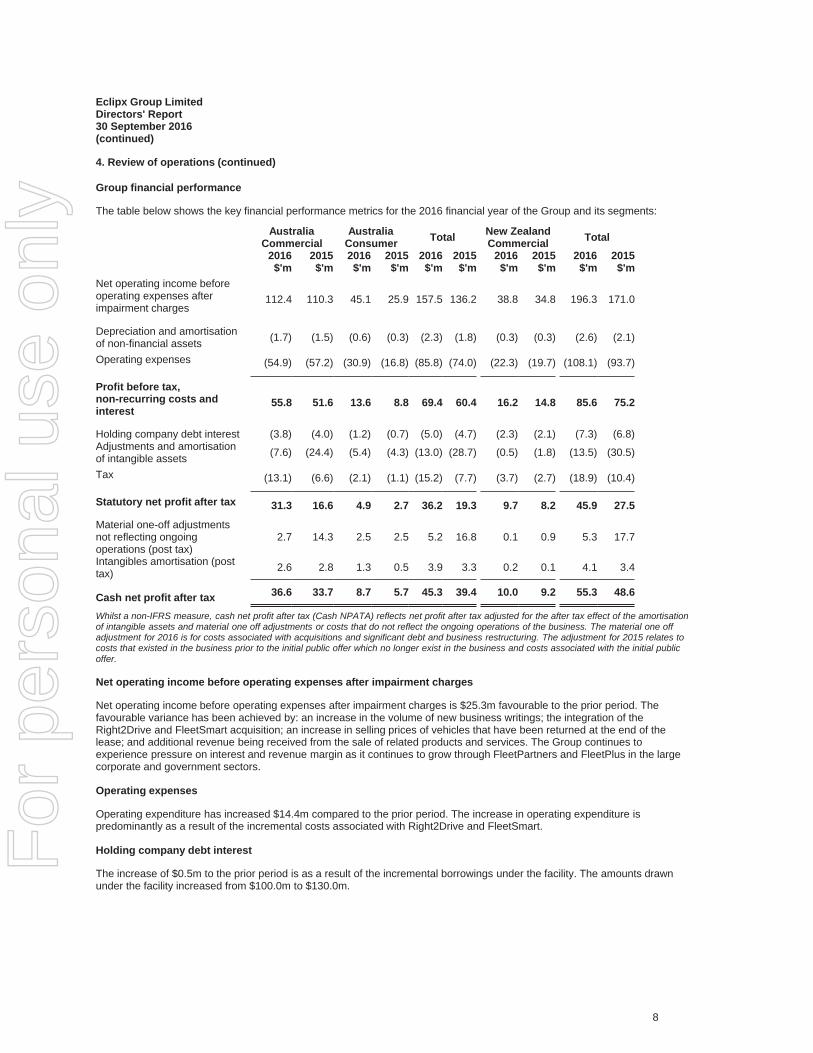
Group financial performance
The table below shows the key financial performance metrics for the 2016 financial year of the Group and its segments:
AustraliaCommercial
AustraliaConsumer Total New Zealand
Commercial Total2016 2015 2016 2015 2016 2015 2016 2015 2016 2015$'m $'m $'m $'m $'m $'m $'m $'m $'m $'m
Net operating income beforeoperating expenses afterimpairment charges
112.4 110.3 45.1 25.9 157.5 136.2 38.8 34.8 196.3 171.0
Depreciation and amortisationof non-financial assets (1.7) (1.5) (0.6) (0.3) (2.3) (1.8) (0.3) (0.3) (2.6) (2.1)
Operating expenses (54.9) (57.2) (30.9) (16.8) (85.8) (74.0) (22.3) (19.7) (108.1) (93.7)
Profit before tax,non-recurring costs andinterest
55.8 51.6 13.6 8.8 69.4 60.4 16.2 14.8 85.6 75.2
Holding company debt interest (3.8) (4.0) (1.2) (0.7) (5.0) (4.7) (2.3) (2.1) (7.3) (6.8)Adjustments and amortisationof intangible assets (7.6) (24.4) (5.4) (4.3) (13.0) (28.7) (0.5) (1.8) (13.5) (30.5)
Tax (13.1) (6.6) (2.1) (1.1) (15.2) (7.7) (3.7) (2.7) (18.9) (10.4)
Statutory net profit after tax 31.3 16.6 4.9 2.7 36.2 19.3 9.7 8.2 45.9 27.5
Material one-off adjustmentsnot reflecting ongoingoperations (post tax)
2.7 14.3 2.5 2.5 5.2 16.8 0.1 0.9 5.3 17.7
Intangibles amortisation (posttax) 2.6 2.8 1.3 0.5 3.9 3.3 0.2 0.1 4.1 3.4
Cash net profit after tax 36.6 33.7 8.7 5.7 45.3 39.4 10.0 9.2 55.3 48.6
Whilst a non-IFRS measure, cash net profit after tax (Cash NPATA) reflects net profit after tax adjusted for the after tax effect of the amortisationof intangible assets and material one off adjustments or costs that do not reflect the ongoing operations of the business. The material one offadjustment for 2016 is for costs associated with acquisitions and significant debt and business restructuring. The adjustment for 2015 relates tocosts that existed in the business prior to the initial public offer which no longer exist in the business and costs associated with the initial publicoffer.
Net operating income before operating expenses after impairment charges
Net operating income before operating expenses after impairment charges is $25.3m favourable to the prior period. Thefavourable variance has been achieved by: an increase in the volume of new business writings; the integration of theRight2Drive and FleetSmart acquisition; an increase in selling prices of vehicles that have been returned at the end of thelease; and additional revenue being received from the sale of related products and services. The Group continues toexperience pressure on interest and revenue margin as it continues to grow through FleetPartners and FleetPlus in the largecorporate and government sectors.
Operating expenses
Operating expenditure has increased $14.4m compared to the prior period. The increase in operating expenditure ispredominantly as a result of the incremental costs associated with Right2Drive and FleetSmart.
Holding company debt interest
The increase of $0.5m to the prior period is as a result of the incremental borrowings under the facility. The amounts drawnunder the facility increased from $100.0m to $130.0m.
8
For
per
sona
l use
onl
y
Eclipx Group LimitedDirectors' Report30 September 2016(continued)
4. Review of operations (continued)
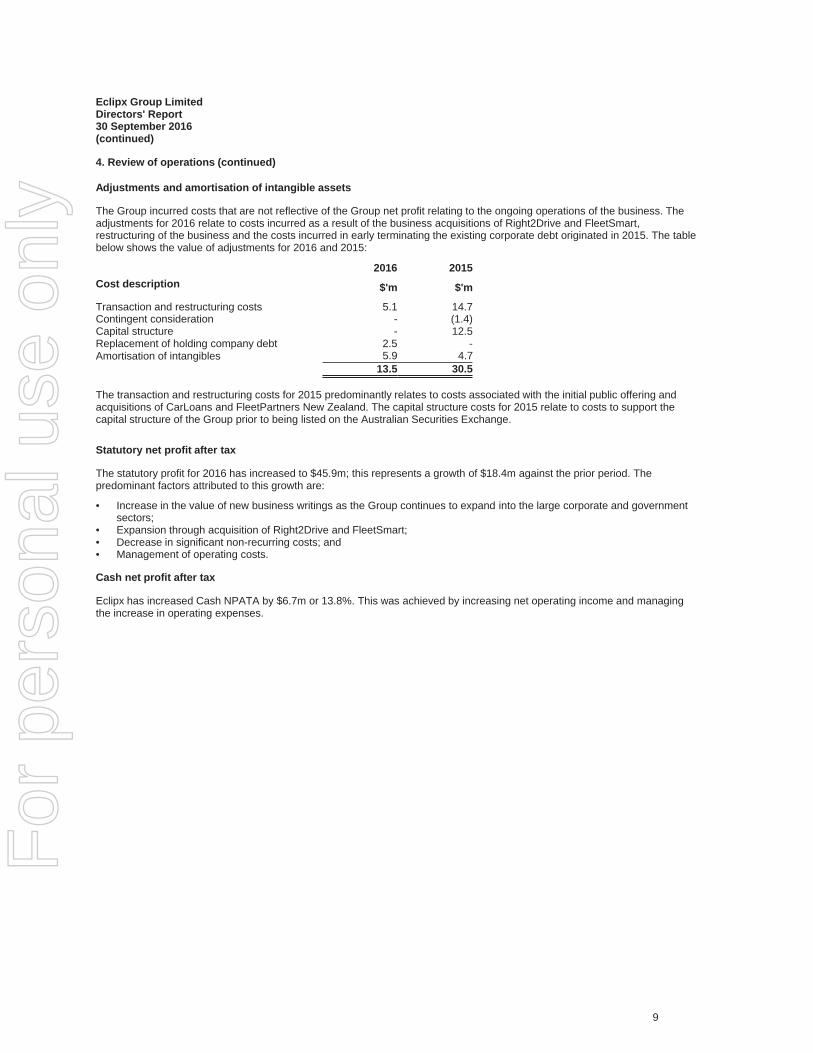
Adjustments and amortisation of intangible assets
The Group incurred costs that are not reflective of the Group net profit relating to the ongoing operations of the business. Theadjustments for 2016 relate to costs incurred as a result of the business acquisitions of Right2Drive and FleetSmart,restructuring of the business and the costs incurred in early terminating the existing corporate debt originated in 2015. The tablebelow shows the value of adjustments for 2016 and 2015:
2016 2015Cost description $'m $'m
Transaction and restructuring costs 5.1 14.7Contingent consideration - (1.4)Capital structure - 12.5Replacement of holding company debt 2.5 -Amortisation of intangibles 5.9 4.7
13.5 30.5
The transaction and restructuring costs for 2015 predominantly relates to costs associated with the initial public offering andacquisitions of CarLoans and FleetPartners New Zealand. The capital structure costs for 2015 relate to costs to support thecapital structure of the Group prior to being listed on the Australian Securities Exchange.
Statutory net profit after tax
The statutory profit for 2016 has increased to $45.9m; this represents a growth of $18.4m against the prior period. Thepredominant factors attributed to this growth are:
• Increase in the value of new business writings as the Group continues to expand into the large corporate and governmentsectors;
• Expansion through acquisition of Right2Drive and FleetSmart;• Decrease in significant non-recurring costs; and• Management of operating costs.
Cash net profit after tax
Eclipx has increased Cash NPATA by $6.7m or 13.8%. This was achieved by increasing net operating income and managingthe increase in operating expenses.
9
For
per
sona
l use
onl
y
Eclipx Group LimitedDirectors' Report30 September 2016(continued)
4. Review of operations (continued)
Segment results
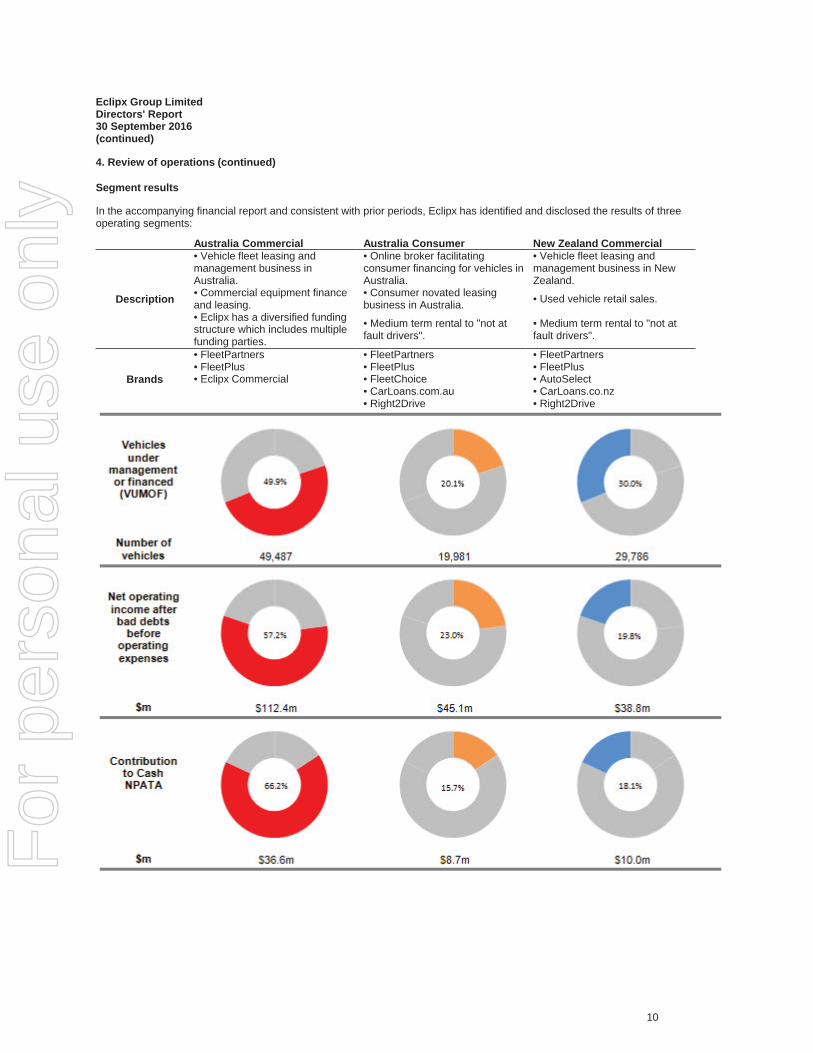
In the accompanying financial report and consistent with prior periods, Eclipx has identified and disclosed the results of threeoperating segments:
Australia Commercial Australia Consumer New Zealand Commercial
Description
• Vehicle fleet leasing andmanagement business inAustralia.
• Online broker facilitatingconsumer financing for vehicles inAustralia.
• Vehicle fleet leasing andmanagement business in NewZealand.
• Commercial equipment financeand leasing.
• Consumer novated leasingbusiness in Australia. • Used vehicle retail sales.
• Eclipx has a diversified fundingstructure which includes multiplefunding parties.
• Medium term rental to "not atfault drivers".
• Medium term rental to "not atfault drivers".
Brands
• FleetPartners • FleetPartners • FleetPartners• FleetPlus • FleetPlus • FleetPlus• Eclipx Commercial • FleetChoice • AutoSelect
• CarLoans.com.au • CarLoans.co.nz• Right2Drive • Right2Drive
10
For
per
sona
l use
onl
y
Eclipx Group LimitedDirectors' Report30 September 2016(continued)
4. Review of operations (continued)
Australia Commercial
The Australia Commercial segment has contributed 66.2% (2015: 69.1%) to the Cash NPATA of the Group. The segment hasseen growth in new business writings of 15.0%. The segment has reported a net operating income of $112.4m which is $2.1mfavourable to the amount reported for 2015.
Continued focus on the customer, building on our customer relationships and competitive pricing has allowed the business toexperience growth in new business writings. The segment has been successful in increasing its market share with largecorporates and has been successful in joining the panel for NSW state fleets.
Technology and operational improvements initiatives have allowed the segment to decrease its operational expenses by $2.3m,which combined with the increase in net operating income has allowed the segment to grow Cash NPATA by 8.6%.
Eclipx Commercial has achieved a 37.8% growth in new business writings. Eclipx Commercial has allowed the Group toexpand the product offering on financing to include non-vehicle assets; this continues to provide opportunities for cross sellingfinance and introducing new clients to the Group.
Australia Consumer
This segment has contributed 15.7% (2015: 11.8%) to the Cash NPATA of the Group. The net operating income of $45.1m(2015: $25.9m) which represents a growth of $19.2m against the prior period was predominantly as a result of the Right2Driveacquisition and the growth in CarLoans.com.au.
The segment was able to achieve a growth of 16.0% in new business writings, this was achieved through:
• Amending of the work hours of the CarLoans.com.au workforce;• Restructuring the sales team to maximise on existing relationships and the skills of people in the organisation; and• Widening the delivery channel to our customers.
New Zealand Commercial
The New Zealand Commercial segment has contributed 18.1% (2015: 19.1%) to the Cash NPATA of the Group. The vehiclesunder management or financed for New Zealand has increased by 10,742 as a result of the acquisition of FleetSmart andgrowth in the historical FleetPartners and FleetPlus businesses. New Zealand continues to grow its strategic relationships so asto provide co-branded operating lease products to new vehicle sales outlets.
AutoSelect, the retail sales channel continues to outperform the wholesale disposal options.
11
For
per
sona
l use
onl
y
Eclipx Group LimitedDirectors' Report30 September 2016(continued)
5. Financial position
The Group financial position as at 30 September 2016 is summarised below:
2016 2015Summary of financial position $'m $'m
Cash and cash equivalents 60.9 58.1
Restricted cash and cash equivalents 117.4 106.4Receivables and inventory 115.9 83.3Leases 1,348.4 1,153.9Intangibles 597.4 504.8Other 20.5 22.9Total assets 2,260.5 1,929.4
Borrowings 1,415.0 1,231.2Trade and other liabilities 128.7 96.4Other 58.0 49.7Total liabilities 1,601.7 1,377.3Net assets 658.8 552.1
Receivables and inventory
Receivables have predominantly increased as a result of the acquisition of Right2Drive and FleetSmart, coupled with anincrease in the amounts being invoiced on a monthly basis to fleet customers that are payable within their contract terms.
Leases
Leases have increased against the prior period by $194.5m or 16.9%. This increase is attributable to the increased businesswritings that have been experienced across the entire Group. The increased business writings and increased incomegenerating assets have created a base for profit in the coming years as the business derives annuity income on these assetsover the remaining contractual term. The lower bad debt provisions and portfolio impairments are an indication of the quality ofassets included in these numbers. The provision for impairment held against operating leases for 2016 is $5.1m (2015:$10.1m).
Borrowings
Borrowings for 2016 include an amount of $130.0m relating to corporate debt. The remaining amount of $1,285.0m relates tofunding directly associated with leases and inventory. The value of borrowings has increased in line with the increase in leases.
12
For
per
sona
l use
onl
y
Eclipx Group LimitedDirectors' Report30 September 2016(continued)
5. Financial position (continued)
Cash flows
For the financial year ended 30 September 2016, the Group increased the total cash holdings including restricted cash by$13.7m.
The significant items impacting cash flow this year were:
• An increase in finance and operating leases and inventory which were partially funded through cash;• The payment of dividends; and• Additional investment in software, plant and equipment and fixture and fittings.
Funding
Eclipx looks to optimise the funding facilities that it has in place. Eclipx maintains committed funding facilities to cater for theforecasted business growth and as at 30 September 2016, Eclipx had undrawn debt facilities of $405.0m.
For leasing finance facilities where Eclipx acts as the funder, funding will be provided by a combination of warehouse and assetbacked securitisation funding structures. Funders (major trading banks and institutional investors) provide financing to a specialpurpose vehicle established by Eclipx which is used to fund the purchase of assets that are to be leased to customers. Thesefacilities are also known as revolving warehouse facilities because they can be drawn and repaid on an ongoing basis up to anagreed limit subject to conditions. A group of assets funded via a warehouse facility can be pooled together and refinanced byissuing securities (backed by those assets) to investors in public wholesale capital markets (such as domestic and internationalbanks and institutional funds).
During the 2016 financial year Eclipx:
• Replaced the corporate debt facility;• Rolled over all warehouse facilities; and• Established an additional warehouse facility for the financing of state government leases.
13
For
per
sona
l use
onl
y
Eclipx Group LimitedDirectors' Report30 September 2016(continued)
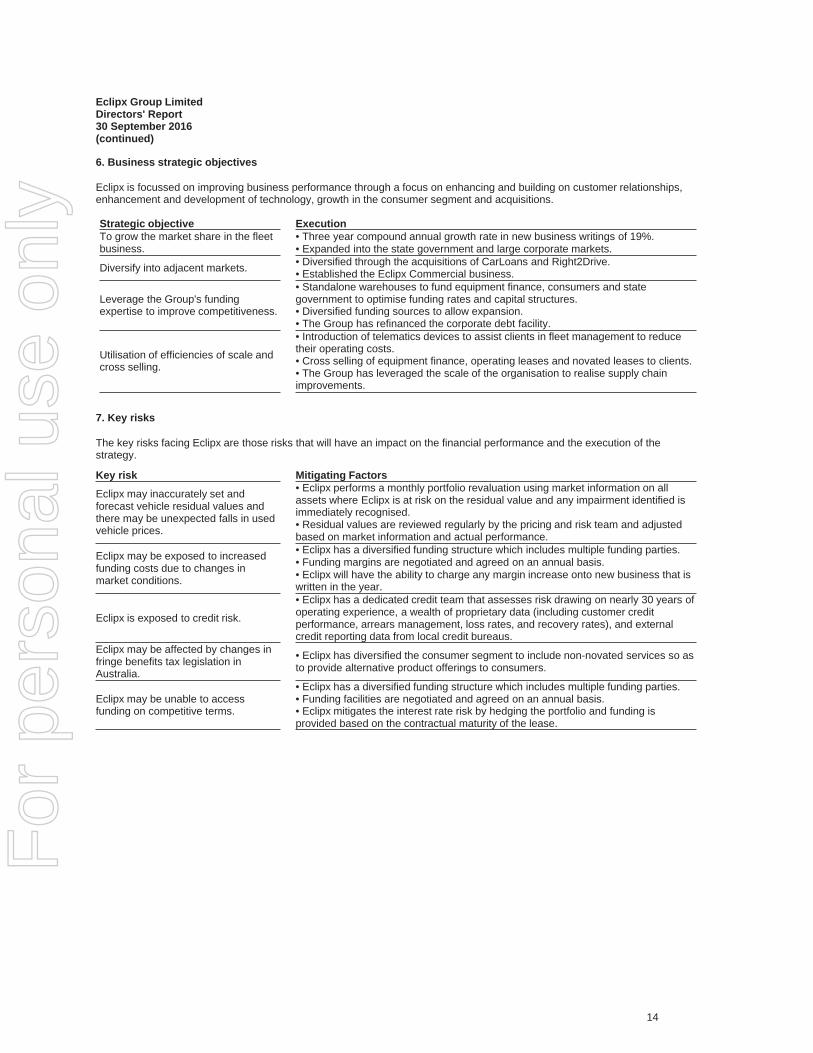
6. Business strategic objectives
Eclipx is focussed on improving business performance through a focus on enhancing and building on customer relationships,enhancement and development of technology, growth in the consumer segment and acquisitions.
Strategic objective ExecutionTo grow the market share in the fleetbusiness.
• Three year compound annual growth rate in new business writings of 19%.• Expanded into the state government and large corporate markets.
Diversify into adjacent markets. • Diversified through the acquisitions of CarLoans and Right2Drive.• Established the Eclipx Commercial business.
Leverage the Group's fundingexpertise to improve competitiveness.
• Standalone warehouses to fund equipment finance, consumers and stategovernment to optimise funding rates and capital structures.• Diversified funding sources to allow expansion.• The Group has refinanced the corporate debt facility.
Utilisation of efficiencies of scale andcross selling.
• Introduction of telematics devices to assist clients in fleet management to reducetheir operating costs.• Cross selling of equipment finance, operating leases and novated leases to clients.• The Group has leveraged the scale of the organisation to realise supply chainimprovements.
7. Key risks
The key risks facing Eclipx are those risks that will have an impact on the financial performance and the execution of thestrategy.
Key risk Mitigating Factors
Eclipx may inaccurately set andforecast vehicle residual values andthere may be unexpected falls in usedvehicle prices.
• Eclipx performs a monthly portfolio revaluation using market information on allassets where Eclipx is at risk on the residual value and any impairment identified isimmediately recognised.• Residual values are reviewed regularly by the pricing and risk team and adjustedbased on market information and actual performance.
Eclipx may be exposed to increasedfunding costs due to changes inmarket conditions.
• Eclipx has a diversified funding structure which includes multiple funding parties.• Funding margins are negotiated and agreed on an annual basis.• Eclipx will have the ability to charge any margin increase onto new business that iswritten in the year.
Eclipx is exposed to credit risk.
• Eclipx has a dedicated credit team that assesses risk drawing on nearly 30 years ofoperating experience, a wealth of proprietary data (including customer creditperformance, arrears management, loss rates, and recovery rates), and externalcredit reporting data from local credit bureaus.
Eclipx may be affected by changes infringe benefits tax legislation inAustralia.
• Eclipx has diversified the consumer segment to include non-novated services so asto provide alternative product offerings to consumers.
Eclipx may be unable to accessfunding on competitive terms.
• Eclipx has a diversified funding structure which includes multiple funding parties.• Funding facilities are negotiated and agreed on an annual basis.• Eclipx mitigates the interest rate risk by hedging the portfolio and funding isprovided based on the contractual maturity of the lease.
14
For
per
sona
l use
onl
y
Eclipx Group LimitedDirectors' Report30 September 2016(continued)
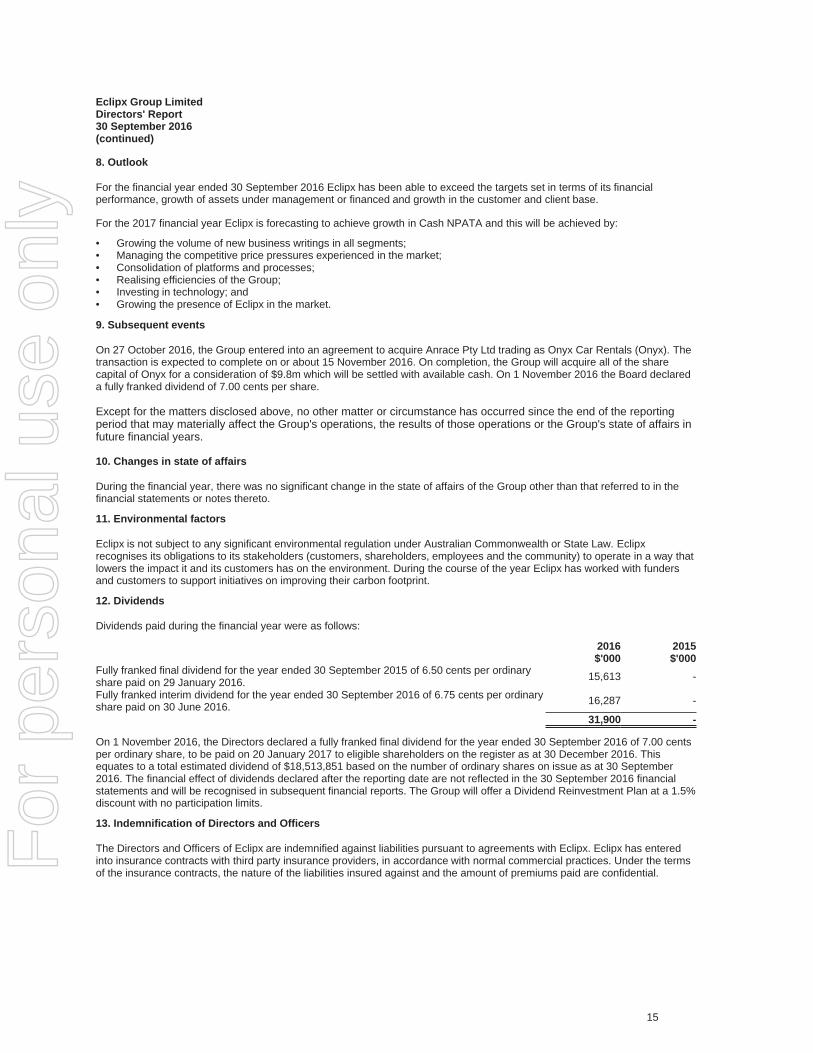
8. Outlook
For the financial year ended 30 September 2016 Eclipx has been able to exceed the targets set in terms of its financialperformance, growth of assets under management or financed and growth in the customer and client base.
For the 2017 financial year Eclipx is forecasting to achieve growth in Cash NPATA and this will be achieved by:
• Growing the volume of new business writings in all segments;• Managing the competitive price pressures experienced in the market;• Consolidation of platforms and processes;• Realising efficiencies of the Group;• Investing in technology; and• Growing the presence of Eclipx in the market.
9. Subsequent events
On 27 October 2016, the Group entered into an agreement to acquire Anrace Pty Ltd trading as Onyx Car Rentals (Onyx). Thetransaction is expected to complete on or about 15 November 2016. On completion, the Group will acquire all of the sharecapital of Onyx for a consideration of $9.8m which will be settled with available cash. On 1 November 2016 the Board declareda fully franked dividend of 7.00 cents per share.
Except for the matters disclosed above, no other matter or circumstance has occurred since the end of the reportingperiod that may materially affect the Group's operations, the results of those operations or the Group's state of affairs infuture financial years.
10. Changes in state of affairs
During the financial year, there was no significant change in the state of affairs of the Group other than that referred to in thefinancial statements or notes thereto.
11. Environmental factors
Eclipx is not subject to any significant environmental regulation under Australian Commonwealth or State Law. Eclipxrecognises its obligations to its stakeholders (customers, shareholders, employees and the community) to operate in a way thatlowers the impact it and its customers has on the environment. During the course of the year Eclipx has worked with fundersand customers to support initiatives on improving their carbon footprint.
12. Dividends
Dividends paid during the financial year were as follows:
2016 2015$'000 $'000
Fully franked final dividend for the year ended 30 September 2015 of 6.50 cents per ordinaryshare paid on 29 January 2016. 15,613 -
Fully franked interim dividend for the year ended 30 September 2016 of 6.75 cents per ordinaryshare paid on 30 June 2016. 16,287 -
31,900 -
On 1 November 2016, the Directors declared a fully franked final dividend for the year ended 30 September 2016 of 7.00 centsper ordinary share, to be paid on 20 January 2017 to eligible shareholders on the register as at 30 December 2016. Thisequates to a total estimated dividend of $18,513,851 based on the number of ordinary shares on issue as at 30 September2016. The financial effect of dividends declared after the reporting date are not reflected in the 30 September 2016 financialstatements and will be recognised in subsequent financial reports. The Group will offer a Dividend Reinvestment Plan at a 1.5%discount with no participation limits.
13. Indemnification of Directors and Officers
The Directors and Officers of Eclipx are indemnified against liabilities pursuant to agreements with Eclipx. Eclipx has enteredinto insurance contracts with third party insurance providers, in accordance with normal commercial practices. Under the termsof the insurance contracts, the nature of the liabilities insured against and the amount of premiums paid are confidential.
15
For
per
sona
l use
onl
y
For
per
sona
l use
onl
y
17
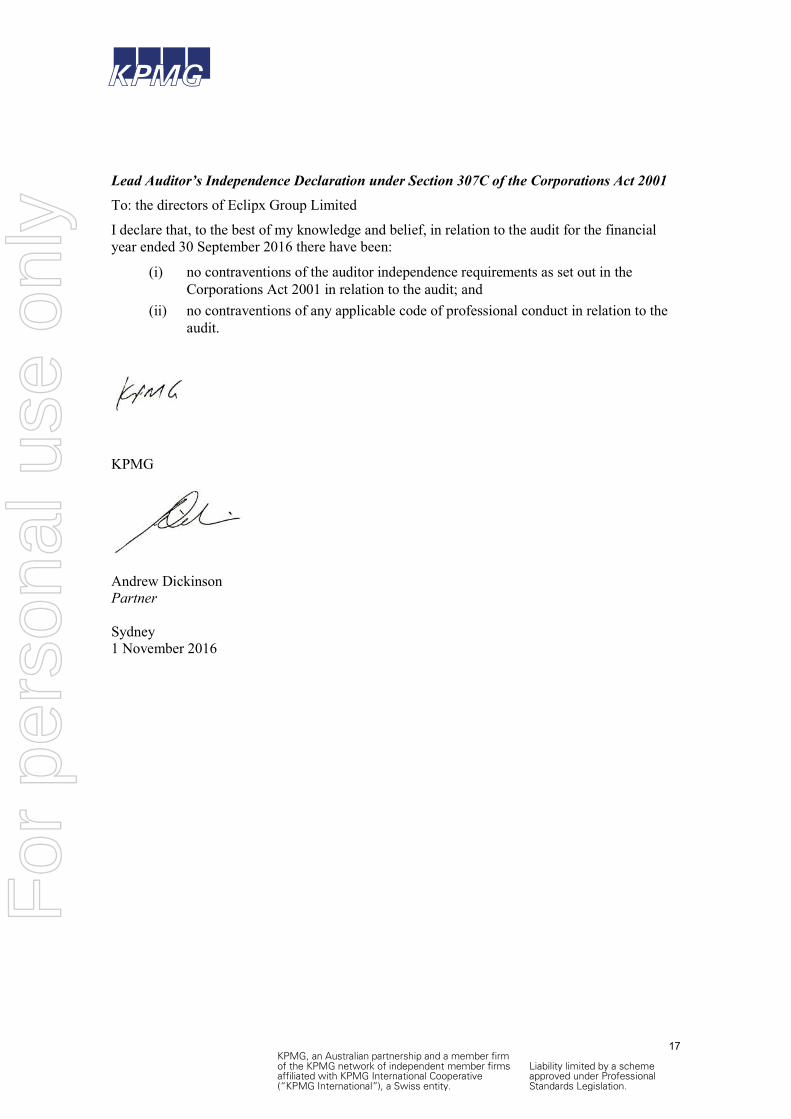
Lead Auditor’s Independence Declaration under Section 307C of the Corporations Act 2001
To: the directors of Eclipx Group Limited
I declare that, to the best of my knowledge and belief, in relation to the audit for the financial year ended 30 September 2016 there have been:
(i) no contraventions of the auditor independence requirements as set out in the Corporations Act 2001 in relation to the audit; and
(ii) no contraventions of any applicable code of professional conduct in relation to the audit.
KPMG
Andrew DickinsonPartner
Sydney1 November 2016
ABCD
KPMG, an Australian partnership and a member firm of the KPMG network of independent member firms affiliated with KPMG International Cooperative (�KPMG International�), a Swiss entity.
Liability limited by a scheme approved under Professional Standards Legislation.
For
per
sona
l use
onl
y
For
per
sona
l use
onl
y
Eclipx Group LimitedRemuneration Report (audited)30 September 2016
Remuneration Report (audited)The Remuneration and Nomination Committee (Committee) of the Board presents the Eclipx Group Limited RemunerationReport (Report) for the year ended 30 September 2016 (FY2016).
The Report has been audited as required by section 308(3C) of the Corporations Act 2001 and is presented in the followingsections:
1. Introduction2. Remuneration governance3. Link to strategy4. Remuneration framework5. Performance against key metrics6. Non-executive directors fees7. Service agreements8. Executive KMP remuneration disclosures9. Equity instruments10. Loans11. Other transactions
1. Introduction
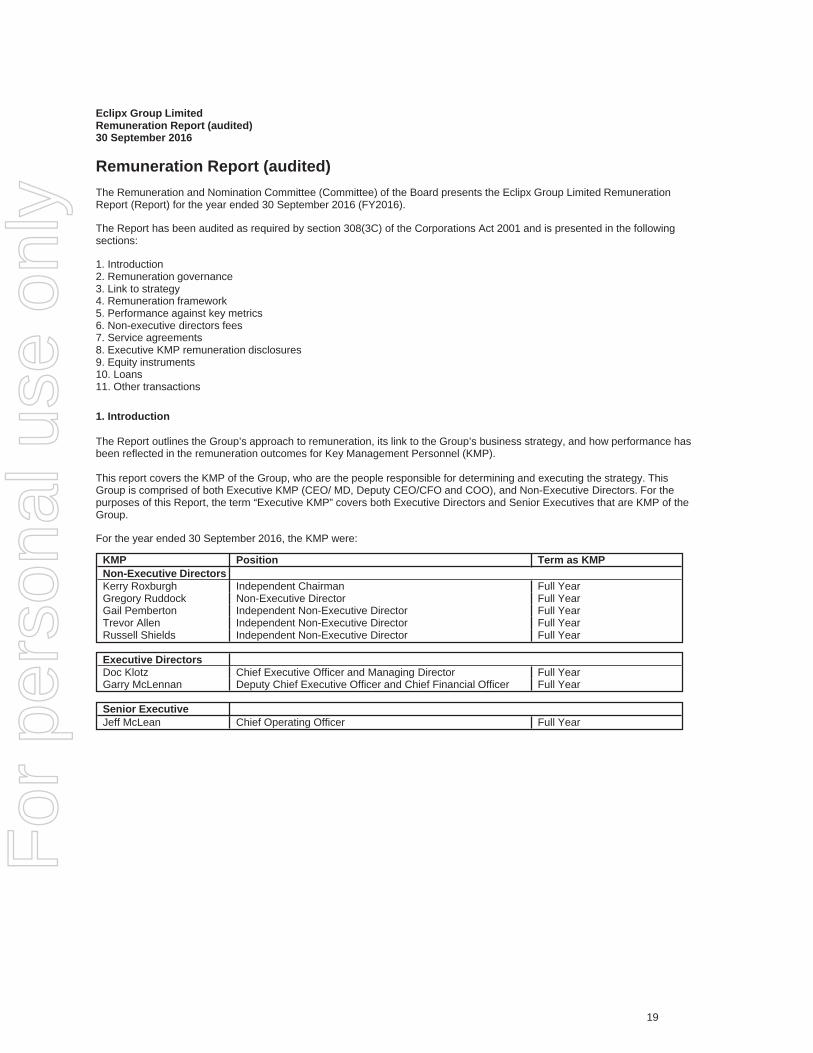
The Report outlines the Group’s approach to remuneration, its link to the Group’s business strategy, and how performance hasbeen reflected in the remuneration outcomes for Key Management Personnel (KMP).
This report covers the KMP of the Group, who are the people responsible for determining and executing the strategy. ThisGroup is comprised of both Executive KMP (CEO/ MD, Deputy CEO/CFO and COO), and Non-Executive Directors. For thepurposes of this Report, the term “Executive KMP” covers both Executive Directors and Senior Executives that are KMP of theGroup.
For the year ended 30 September 2016, the KMP were:
KMP Position Term as KMPNon-Executive DirectorsKerry Roxburgh Independent Chairman Full YearGregory Ruddock Non-Executive Director Full YearGail Pemberton Independent Non-Executive Director Full YearTrevor Allen Independent Non-Executive Director Full YearRussell Shields Independent Non-Executive Director Full Year
Executive DirectorsDoc Klotz Chief Executive Officer and Managing Director Full YearGarry McLennan Deputy Chief Executive Officer and Chief Financial Officer Full Year
Senior ExecutiveJeff McLean Chief Operating Officer Full Year
19
For
per
sona
l use
onl
y
Eclipx Group LimitedRemuneration Report (audited)30 September 2016(continued)
2. Remuneration governance
The committee consists of three Independent Non-Executive Directors:
• Ms Gail Pemberton (Committee Chair);• Mr Kerry Roxburgh; and• Mr Trevor Allen.
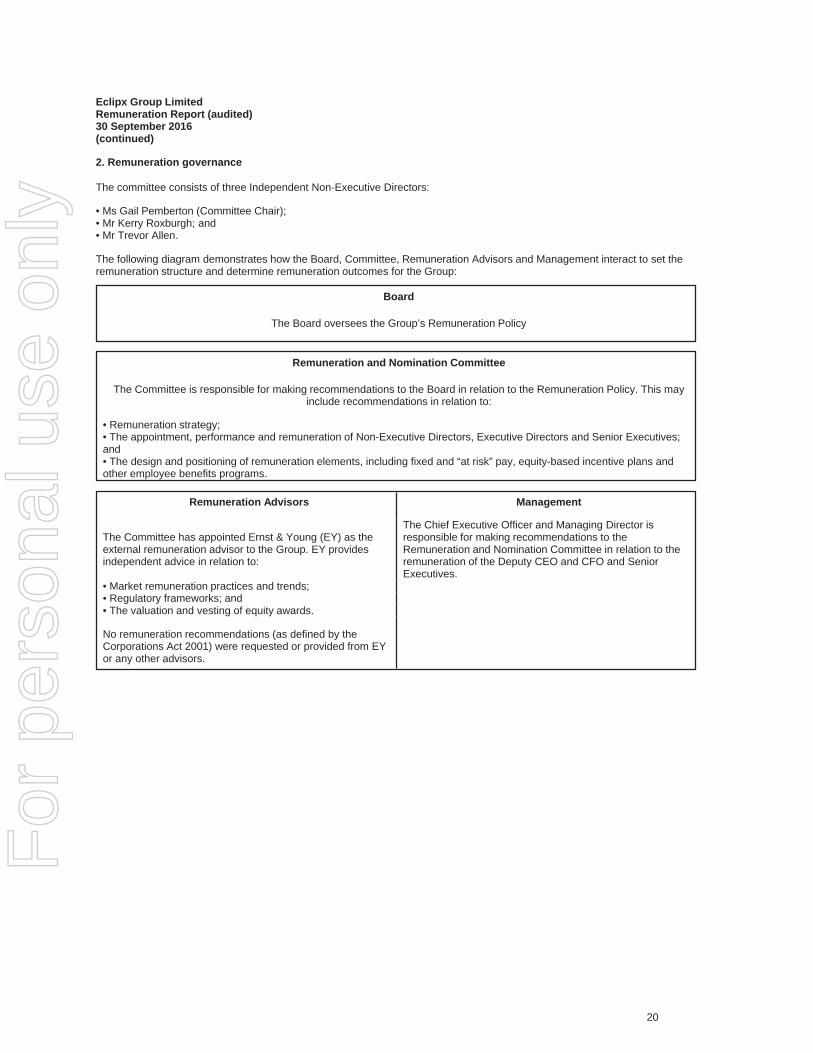
The following diagram demonstrates how the Board, Committee, Remuneration Advisors and Management interact to set theremuneration structure and determine remuneration outcomes for the Group:
Board
The Board oversees the Group’s Remuneration Policy
Remuneration and Nomination Committee
The Committee is responsible for making recommendations to the Board in relation to the Remuneration Policy. This mayinclude recommendations in relation to:
• Remuneration strategy;• The appointment, performance and remuneration of Non-Executive Directors, Executive Directors and Senior Executives;and• The design and positioning of remuneration elements, including fixed and “at risk” pay, equity-based incentive plans andother employee benefits programs.
Remuneration Advisors Management
The Committee has appointed Ernst & Young (EY) as theexternal remuneration advisor to the Group. EY providesindependent advice in relation to:
The Chief Executive Officer and Managing Director isresponsible for making recommendations to theRemuneration and Nomination Committee in relation to theremuneration of the Deputy CEO and CFO and SeniorExecutives.
• Market remuneration practices and trends;• Regulatory frameworks; and• The valuation and vesting of equity awards.
No remuneration recommendations (as defined by theCorporations Act 2001) were requested or provided from EYor any other advisors.
20
For
per
sona
l use
onl
y
Eclipx Group LimitedRemuneration Report (audited)30 September 2016(continued)
3. Link to strategy
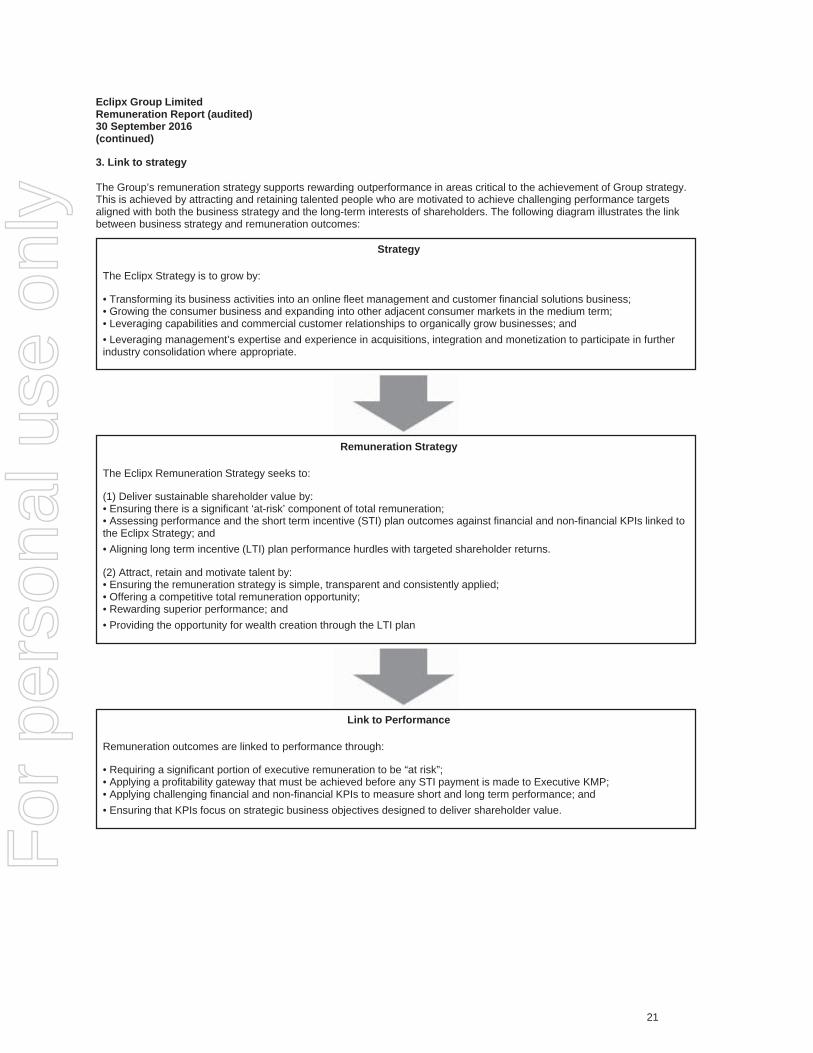
The Group’s remuneration strategy supports rewarding outperformance in areas critical to the achievement of Group strategy.This is achieved by attracting and retaining talented people who are motivated to achieve challenging performance targetsaligned with both the business strategy and the long-term interests of shareholders. The following diagram illustrates the linkbetween business strategy and remuneration outcomes:
Strategy
The Eclipx Strategy is to grow by:
• Transforming its business activities into an online fleet management and customer financial solutions business;• Growing the consumer business and expanding into other adjacent consumer markets in the medium term;• Leveraging capabilities and commercial customer relationships to organically grow businesses; and• Leveraging management’s expertise and experience in acquisitions, integration and monetization to participate in furtherindustry consolidation where appropriate.
Remuneration Strategy
The Eclipx Remuneration Strategy seeks to:
(1) Deliver sustainable shareholder value by:• Ensuring there is a significant ‘at-risk’ component of total remuneration;• Assessing performance and the short term incentive (STI) plan outcomes against financial and non-financial KPIs linked tothe Eclipx Strategy; and• Aligning long term incentive (LTI) plan performance hurdles with targeted shareholder returns.
(2) Attract, retain and motivate talent by:• Ensuring the remuneration strategy is simple, transparent and consistently applied;• Offering a competitive total remuneration opportunity;• Rewarding superior performance; and• Providing the opportunity for wealth creation through the LTI plan
Link to Performance
Remuneration outcomes are linked to performance through:
• Requiring a significant portion of executive remuneration to be “at risk”;• Applying a profitability gateway that must be achieved before any STI payment is made to Executive KMP;• Applying challenging financial and non-financial KPIs to measure short and long term performance; and• Ensuring that KPIs focus on strategic business objectives designed to deliver shareholder value.
21
For
per
sona
l use
onl
y
Eclipx Group LimitedRemuneration Report (audited)30 September 2016(continued)
4. Remuneration framework
Remuneration components and outcome
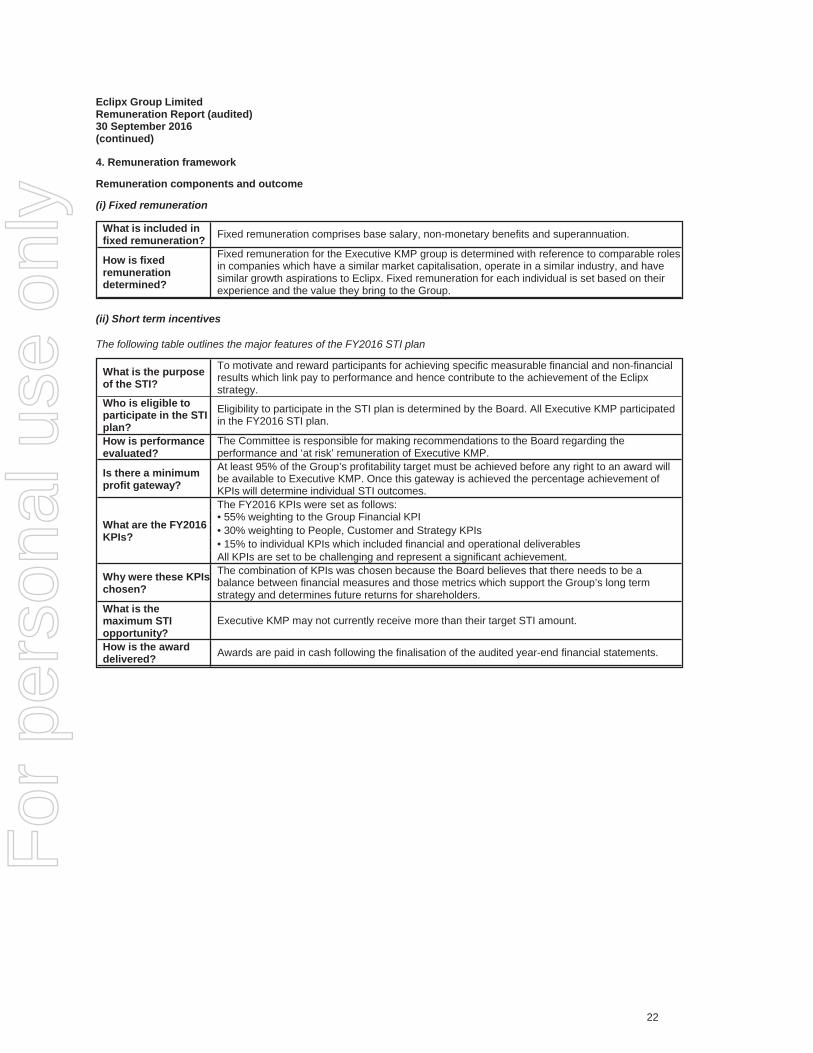
(i) Fixed remuneration
What is included infixed remuneration? Fixed remuneration comprises base salary, non-monetary benefits and superannuation.
How is fixedremunerationdetermined?
Fixed remuneration for the Executive KMP group is determined with reference to comparable rolesin companies which have a similar market capitalisation, operate in a similar industry, and havesimilar growth aspirations to Eclipx. Fixed remuneration for each individual is set based on theirexperience and the value they bring to the Group.
(ii) Short term incentives
The following table outlines the major features of the FY2016 STI plan
What is the purposeof the STI?
To motivate and reward participants for achieving specific measurable financial and non-financialresults which link pay to performance and hence contribute to the achievement of the Eclipxstrategy.
Who is eligible toparticipate in the STIplan?
Eligibility to participate in the STI plan is determined by the Board. All Executive KMP participatedin the FY2016 STI plan.
How is performanceevaluated?
The Committee is responsible for making recommendations to the Board regarding theperformance and ‘at risk’ remuneration of Executive KMP.
Is there a minimumprofit gateway?
At least 95% of the Group’s profitability target must be achieved before any right to an award willbe available to Executive KMP. Once this gateway is achieved the percentage achievement ofKPIs will determine individual STI outcomes.
What are the FY2016KPIs?
The FY2016 KPIs were set as follows:• 55% weighting to the Group Financial KPI• 30% weighting to People, Customer and Strategy KPIs• 15% to individual KPIs which included financial and operational deliverablesAll KPIs are set to be challenging and represent a significant achievement.
Why were these KPIschosen?
The combination of KPIs was chosen because the Board believes that there needs to be abalance between financial measures and those metrics which support the Group’s long termstrategy and determines future returns for shareholders.
What is themaximum STIopportunity?
Executive KMP may not currently receive more than their target STI amount.
How is the awarddelivered? Awards are paid in cash following the finalisation of the audited year-end financial statements.
22
For
per
sona
l use
onl
y
Eclipx Group LimitedRemuneration Report (audited)30 September 2016(continued)
4. Remuneration framework (continued)
Remuneration components and outcome (continued)
(ii) Short term incentives (continued)
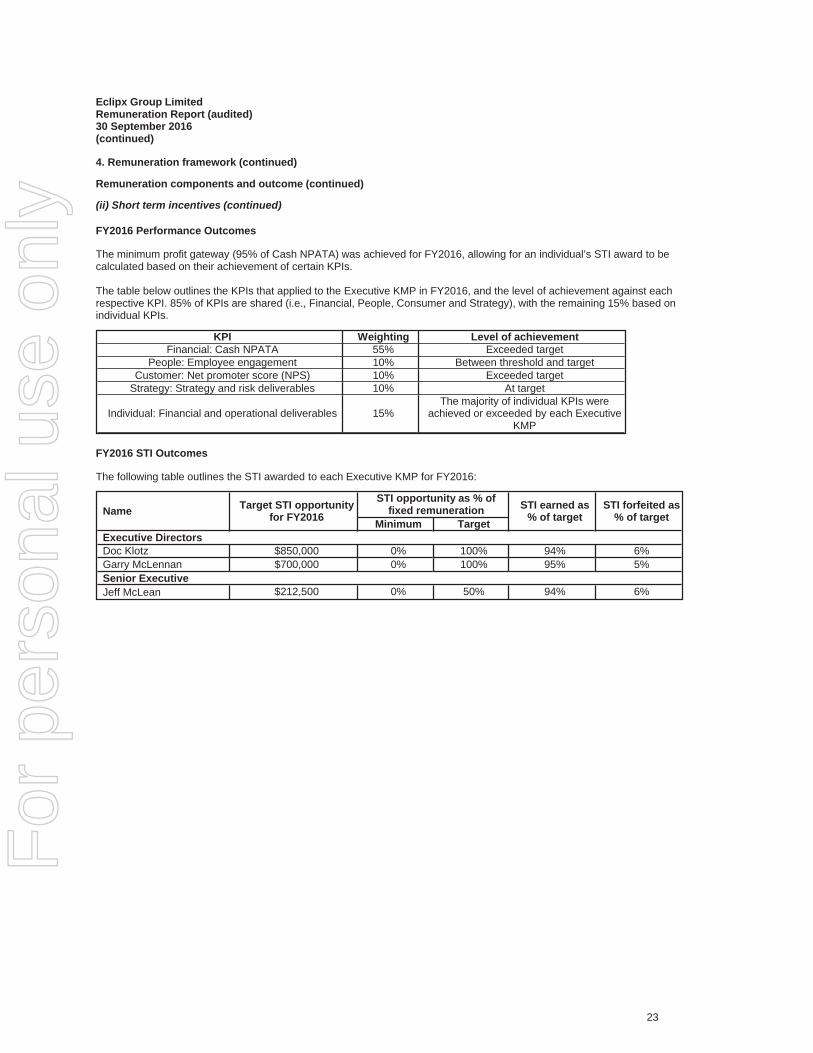
FY2016 Performance Outcomes
The minimum profit gateway (95% of Cash NPATA) was achieved for FY2016, allowing for an individual’s STI award to becalculated based on their achievement of certain KPIs.
The table below outlines the KPIs that applied to the Executive KMP in FY2016, and the level of achievement against eachrespective KPI. 85% of KPIs are shared (i.e., Financial, People, Consumer and Strategy), with the remaining 15% based onindividual KPIs.
KPI Weighting Level of achievementFinancial: Cash NPATA 55% Exceeded target
People: Employee engagement 10% Between threshold and targetCustomer: Net promoter score (NPS) 10% Exceeded target
Strategy: Strategy and risk deliverables 10% At target
Individual: Financial and operational deliverables 15%The majority of individual KPIs were
achieved or exceeded by each ExecutiveKMP
FY2016 STI Outcomes
The following table outlines the STI awarded to each Executive KMP for FY2016:
Name Target STI opportunityfor FY2016
STI opportunity as % offixed remuneration STI earned as
% of targetSTI forfeited as
% of targetMinimum TargetExecutive DirectorsDoc Klotz $850,000 0% 100% 94% 6%Garry McLennan $700,000 0% 100% 95% 5%Senior ExecutiveJeff McLean $212,500 0% 50% 94% 6%
23
For
per
sona
l use
onl
y
Eclipx Group LimitedRemuneration Report (audited)30 September 2016(continued)
4. Remuneration framework (continued)
Remuneration components and outcome (continued)
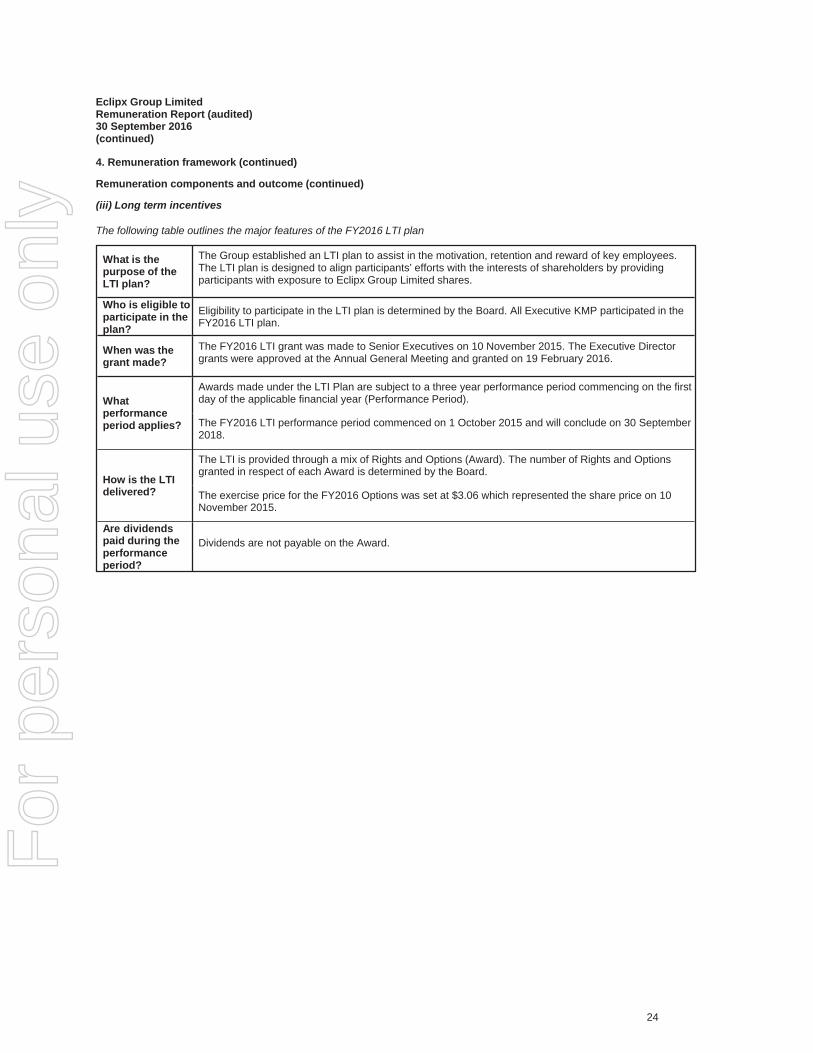
(iii) Long term incentives
The following table outlines the major features of the FY2016 LTI plan
What is thepurpose of theLTI plan?
The Group established an LTI plan to assist in the motivation, retention and reward of key employees.The LTI plan is designed to align participants’ efforts with the interests of shareholders by providingparticipants with exposure to Eclipx Group Limited shares.
Who is eligible toparticipate in theplan?
Eligibility to participate in the LTI plan is determined by the Board. All Executive KMP participated in theFY2016 LTI plan.
When was thegrant made?
The FY2016 LTI grant was made to Senior Executives on 10 November 2015. The Executive Directorgrants were approved at the Annual General Meeting and granted on 19 February 2016.
Whatperformanceperiod applies?
Awards made under the LTI Plan are subject to a three year performance period commencing on the firstday of the applicable financial year (Performance Period).
The FY2016 LTI performance period commenced on 1 October 2015 and will conclude on 30 September2018.
How is the LTIdelivered?
The LTI is provided through a mix of Rights and Options (Award). The number of Rights and Optionsgranted in respect of each Award is determined by the Board.
The exercise price for the FY2016 Options was set at $3.06 which represented the share price on 10November 2015.
Are dividendspaid during theperformanceperiod?
Dividends are not payable on the Award.
24
For
per
sona
l use
onl
y
Eclipx Group LimitedRemuneration Report (audited)30 September 2016(continued)
4. Remuneration framework (continued)
Remuneration components and outcome (continued)
(iii) Long term incentives (continued)
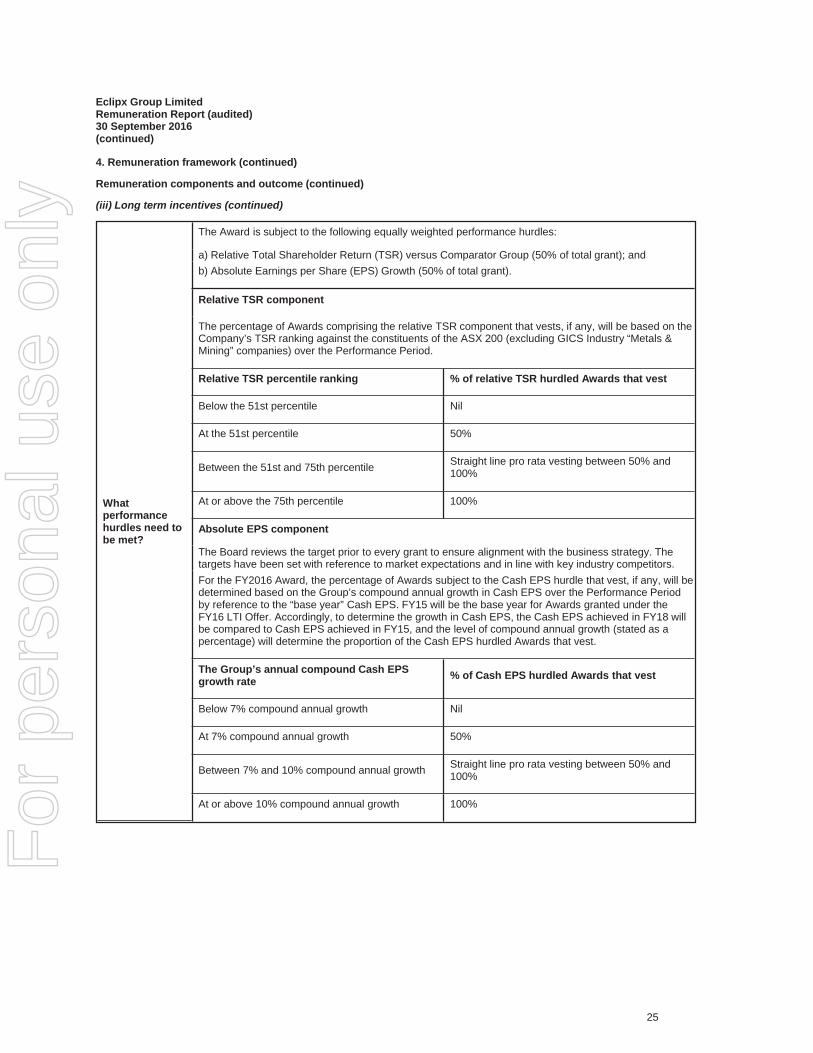
Whatperformancehurdles need tobe met?
The Award is subject to the following equally weighted performance hurdles:
a) Relative Total Shareholder Return (TSR) versus Comparator Group (50% of total grant); andb) Absolute Earnings per Share (EPS) Growth (50% of total grant).
Relative TSR component
The percentage of Awards comprising the relative TSR component that vests, if any, will be based on theCompany’s TSR ranking against the constituents of the ASX 200 (excluding GICS Industry “Metals &Mining” companies) over the Performance Period.
Relative TSR percentile ranking % of relative TSR hurdled Awards that vest
Below the 51st percentile Nil
At the 51st percentile 50%
Between the 51st and 75th percentile Straight line pro rata vesting between 50% and100%
At or above the 75th percentile 100%
Absolute EPS component
The Board reviews the target prior to every grant to ensure alignment with the business strategy. Thetargets have been set with reference to market expectations and in line with key industry competitors.For the FY2016 Award, the percentage of Awards subject to the Cash EPS hurdle that vest, if any, will bedetermined based on the Group’s compound annual growth in Cash EPS over the Performance Periodby reference to the “base year” Cash EPS. FY15 will be the base year for Awards granted under theFY16 LTI Offer. Accordingly, to determine the growth in Cash EPS, the Cash EPS achieved in FY18 willbe compared to Cash EPS achieved in FY15, and the level of compound annual growth (stated as apercentage) will determine the proportion of the Cash EPS hurdled Awards that vest.
The Group’s annual compound Cash EPSgrowth rate % of Cash EPS hurdled Awards that vest
Below 7% compound annual growth Nil
At 7% compound annual growth 50%
Between 7% and 10% compound annual growth Straight line pro rata vesting between 50% and100%
At or above 10% compound annual growth 100%
25
For
per
sona
l use
onl
y
Eclipx Group LimitedRemuneration Report (audited)30 September 2016(continued)
4. Remuneration framework (continued)
Remuneration components and outcome (continued)
(iii) Long term incentives (continued)
How are theperformanceawards valued?
The TSR hurdled Awards are valued via the Monte-Carlo simulation method. TSR has been chosen as aperformance hurdle because it provides a direct link between executive reward and shareholder return(relative to the Group’s peers). Testing will be completed by an independent expert at the end of eachvesting period.
The Cash EPS hurdle is valued via the Binominal tree method and has been chosen as it providesevidence of the Group’s growth in earnings and is directly linked to shareholder returns and the Group’soverall strategic objectives. Testing will be completed against the audited financial accounts at the end ofeach vesting period.
Is retestingavailable for anyof theperformancehurdles?
If, as a result of exceptional circumstances, Awards subject to the 50% TSR component only do not vestin full during the first Performance Period, they have the opportunity for a single retest over an extendedperformance period ending 12 months after the completion of the first Performance Period.
Retesting was introduced upon listing in 2015 due to the volatility of the share price and the market. TheBoard determined that retesting continued to be appropriate for the FY2016.
What happens ifan ExecutiveKMP ceasesemployment?
Where an Executive KMP ceases employment defined by the Group as resignation or termination forcause, any unvested LTI Awards (or vested and unexercised Awards) are forfeited, unless otherwisedetermined by the Board.
Where an Executive KMP ceases employment for any other reason, unvested Awards will continue“on-foot” and will be tested at the end of the original vesting period. Note that the Plan Rules provide theBoard with discretion to determine that a different treatment should apply at the time of cessation, ifapplicable.
What happens ifthere is a changeof control?
A change of control occurs where, as a result of any event or transaction, a new person or entitybecomes entitled to a significant percentage of shares in the Group.
In the event of a change of control of the Group the following treatment will apply:
• Upon a 50% change of control, all unvested Awards will vest in full;• Upon a 30% change of control, all unvested Awards will vest in full, unless, prior to the 30% change ofcontrol occurring, the Board determines otherwise.
FY2016 LTI Outcomes
No LTI Awards vested during the FY2016 business year.
26
For
per
sona
l use
onl
y
Eclipx Group LimitedRemuneration Report (audited)30 September 2016(continued)
4. Remuneration framework (continued)
Remuneration components and outcome (continued)
(iii) Long term incentives (continued)
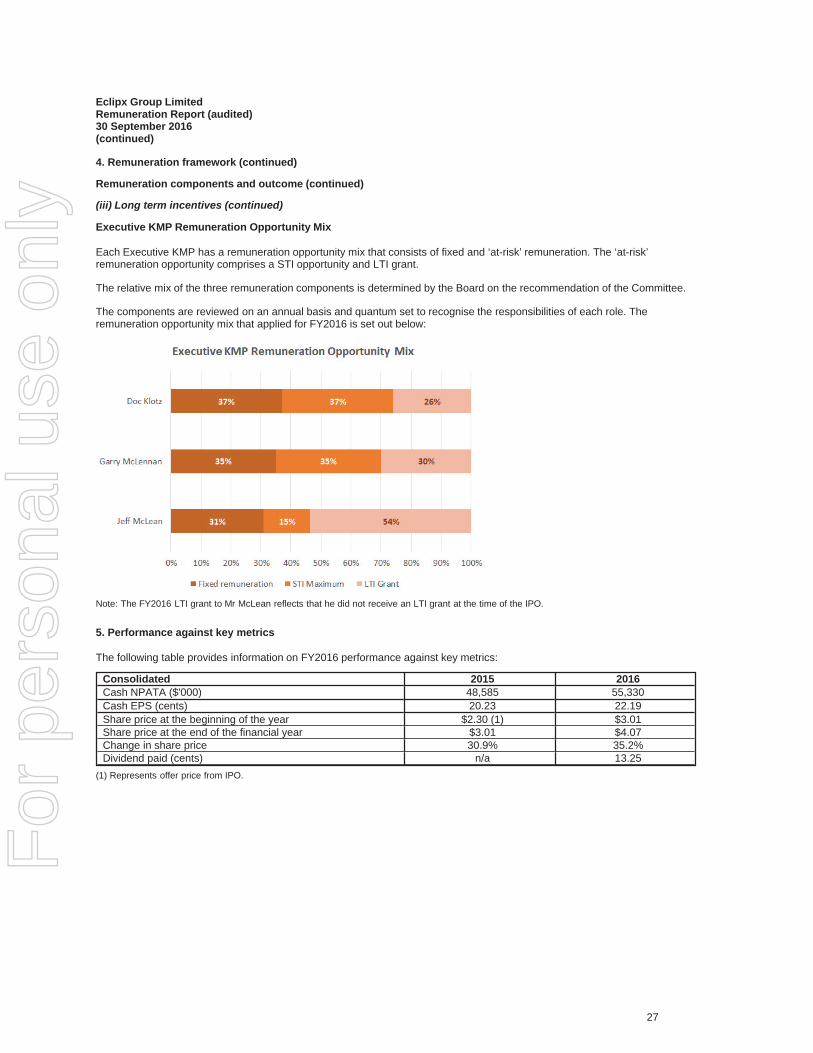
Executive KMP Remuneration Opportunity Mix
Each Executive KMP has a remuneration opportunity mix that consists of fixed and ‘at-risk’ remuneration. The ‘at-risk’remuneration opportunity comprises a STI opportunity and LTI grant.
The relative mix of the three remuneration components is determined by the Board on the recommendation of the Committee.
The components are reviewed on an annual basis and quantum set to recognise the responsibilities of each role. Theremuneration opportunity mix that applied for FY2016 is set out below:
Note: The FY2016 LTI grant to Mr McLean reflects that he did not receive an LTI grant at the time of the IPO.
5. Performance against key metrics
The following table provides information on FY2016 performance against key metrics:
Consolidated 2015 2016Cash NPATA ($'000) 48,585 55,330Cash EPS (cents) 20.23 22.19Share price at the beginning of the year $2.30 (1) $3.01Share price at the end of the financial year $3.01 $4.07Change in share price 30.9% 35.2%Dividend paid (cents) n/a 13.25
(1) Represents offer price from IPO.
27
For
per
sona
l use
onl
y
Eclipx Group LimitedRemuneration Report (audited)30 September 2016(continued)
6. Non-executive director fees
Fees paid to Non-Executive Directors reflect the demands and responsibilities of each position. Fees are benchmarked againstan appropriate group of comparator companies and determined within the approved aggregate Directors’ fee pool limit of $1.4million per annum. Non-Executive Directors do not receive variable remuneration and base fees are inclusive of mandatorysuperannuation contributions.
There were no changes to Non-Executive Director fees during FY2016 and the following fee structure was applicable for the fullyear:
Base fees (per annum)Chairman (K Roxburgh) $250,000Other Non-Executive Directors $125,000'Additional fees (per annum)Audit and Risk Committee – Chair (T Allen) $25,000Audit and Risk Committee – Member (K Roxburgh, R Shields, G Ruddock) $12,500Remuneration and Nomination Committee – Chair (G Pemberton) $20,000Remuneration and Nomination Committee – Member (K Roxburgh, T Allen) $10,000Non-Executive Director fees for Mr Greg Ruddock are paid to Ironbridge Capital Management Pty Ltd and not to Mr Ruddockdirectly.
Share Rights Contribution PlanThe Share Rights Contribution Plan was established to facilitate Non-Executive Director shareholdings in the Company andimprove the alignment of Non-Executive Director interests with those of shareholders.
Under the plan, Non-Executive Directors may elect to sacrifice, on a pre-tax basis, up to 50% of base Director fees (excludingCommittee fees) to acquire share rights. The share rights will not be subject to performance conditions. However, if aparticipant ceases to hold office before their share rights convert to shares, all share rights will lapse and the fee amountsacrificed under the Share Rights Contribution Plan will be returned to the participant.
During FY2016, all Non-Executive Directors elected to sacrifice the maximum of 50% of base Director fees to acquire sharerights. Subject to the Company's Securities Trade Policy, the salary sacrifice contributions are scheduled to be converted intoShare Rights in November 2016.
Non-Executive Directors (Cash and Share based payments)The following table shows details of fees received by the Non-Executive Directors:
Short term benefits Post-employmentbenefits
Share basedpayments
Total $Salary andfees - cash $
Salary andfees - value
of sharerights $ (1)
Non-monetary$
Superannuation $(1)
Equity settled$ (4)
Kerry Roxburgh (Chairman)FY2016 135,787 125,000 - 11,713 - 272,500FY2015 (2) 130,919 - - 9,523 249,999 390,441Russell ShieldsFY2016 68,493 62,500 - 6,507 - 137,500FY2015 (2) 64,717 - - 6,148 124,998 195,863Trevor AllenFY2016 89,470 62,500 - 8,030 - 160,000FY2015 (2) 75,307 - - 7,154 124,998 207,459Gail PembertonFY2016 75,342 62,500 - 7,158 - 145,000FY2015 (2) 68,247 - - 6,483 124,998 199,728Nick Johnson (3)FY2015 44,308 - - 4,515 - 48,823
(1) Salary sacrifice contributions made in respect of the Share Rights Contributions Plan are included as salary and fees. Superannuationcontributions do not apply to the salary sacrifice component.(2) Mr Roxburgh, Mr Shields, Mr Allen and Ms Pemberton commenced as Non-Executive Directors on 26 March 2015.(3) Mr Johnson was a Non-Executive Director until 26 March 2015(4) Mr Roxburgh, Mr Shields, Mr Allen and Ms Pemberton received a one-off offer of shares, to the value of one year’s base fees, ascompensation for their services and increased workload during the period leading up to the IPO.
28
For
per
sona
l use
onl
y
Eclipx Group LimitedRemuneration Report (audited)30 September 2016(continued)
7. Service agreements
The Group’s Executives are employed under ongoing common law contracts. The table below outlines the employment and termination terms for each Executive.
Service agreement Employing Entity Notice period Seriousmisconduct Termination entitlement Restraint of Trade
Chief Executive Officer and ManagingDirector Fleet Holdings
(Australia) Pty Ltd Six months byeither party
Immediatetermination
When termination is initiated by the Company,up to six month’s fixed remuneration may bepaid in lieu of notice. Payments are capped at12 months’ remuneration per relevantlegislative requirements
12 months followingexpiry of notice periodDeputy Chief Executive Officer and
Chief Financial Officer
Chief Operating Officer FleetPartners Pty Ltd Six months followingexpiry of notice period
8. Executive remuneration disclosures
Statutory Remuneration for Executive KMP
The following table shows details of the remuneration received by Executives during FY2016:
Short term benefits Long term benefits
Total $Salary and fees $ Non-monetary $(1)
Movement inannual leave
provision $ (2)
Cash bonuspayable inrespect of
current year $
Non-monetary $(3)
Superannuation$
Share basedpayments equity
settled $
Executive DirectorsDoc KlotzFY2016 830,236 137,036 14,400 799,000 2,301 19,764 517,546 2,320,283FY2015 834,571 20,060 69,773 850,000 3,238 18,698 176,667 1,973,007Garry McLennanFY2016 680,236 5,628 (36,631) 665,000 1,872 19,764 517,546 1,853,415FY2015 642,841 1,686 82,047 700,000 2,666 18,698 176,667 1,624,605Senior ExecutiveJeff McLeanFY2016 405,236 8,463 22,612 199,750 1,136 19,764 121,059 778,020FY2015 382,840 2,522 (6,077) 200,000 1,146 18,770 - 599,201
(1) Amount represents car parking, medical insurance, flights home and fringe benefits tax. FY2015 non-monetary values have been revised to separate the non-monetary amounts from the annual leave provision.(2) Amount represents annual leave provisions. Negative movement indicates leave taken during the year exceeded leave accrued during the current year. This is to be read in conjunction with Salary and Fees column.(3) Amount represents long service leave provisions.
29
For
per
sona
l use
onl
y
Eclipx Group LimitedRemuneration Report (audited)30 September 2016(continued)
8. Executive remuneration disclosures (continued)
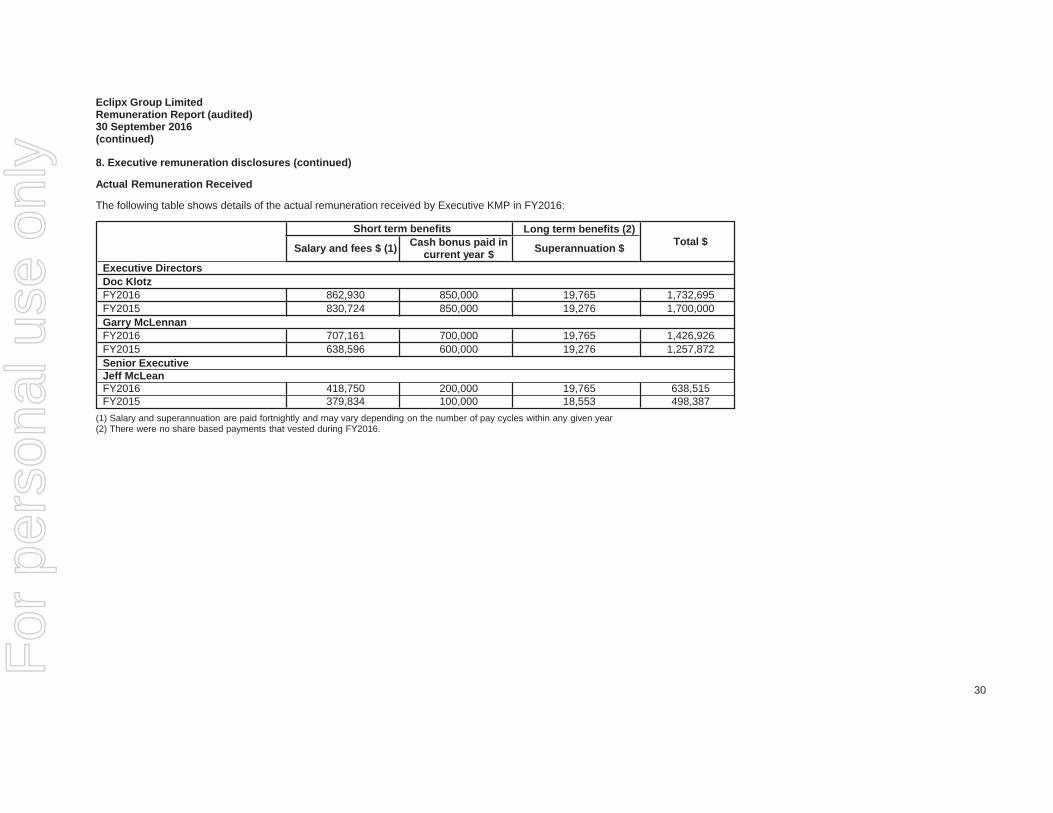
Actual Remuneration Received
The following table shows details of the actual remuneration received by Executive KMP in FY2016:
Short term benefits Long term benefits (2)Total $Salary and fees $ (1) Cash bonus paid in
current year $ Superannuation $
Executive DirectorsDoc KlotzFY2016 862,930 850,000 19,765 1,732,695FY2015 830,724 850,000 19,276 1,700,000Garry McLennanFY2016 707,161 700,000 19,765 1,426,926FY2015 638,596 600,000 19,276 1,257,872Senior ExecutiveJeff McLeanFY2016 418,750 200,000 19,765 638,515FY2015 379,834 100,000 18,553 498,387
(1) Salary and superannuation are paid fortnightly and may vary depending on the number of pay cycles within any given year(2) There were no share based payments that vested during FY2016.
30
For
per
sona
l use
onl
y
Eclipx Group LimitedRemuneration Report (audited)30 September 2016(continued)
8. Executive remuneration disclosures (continued)
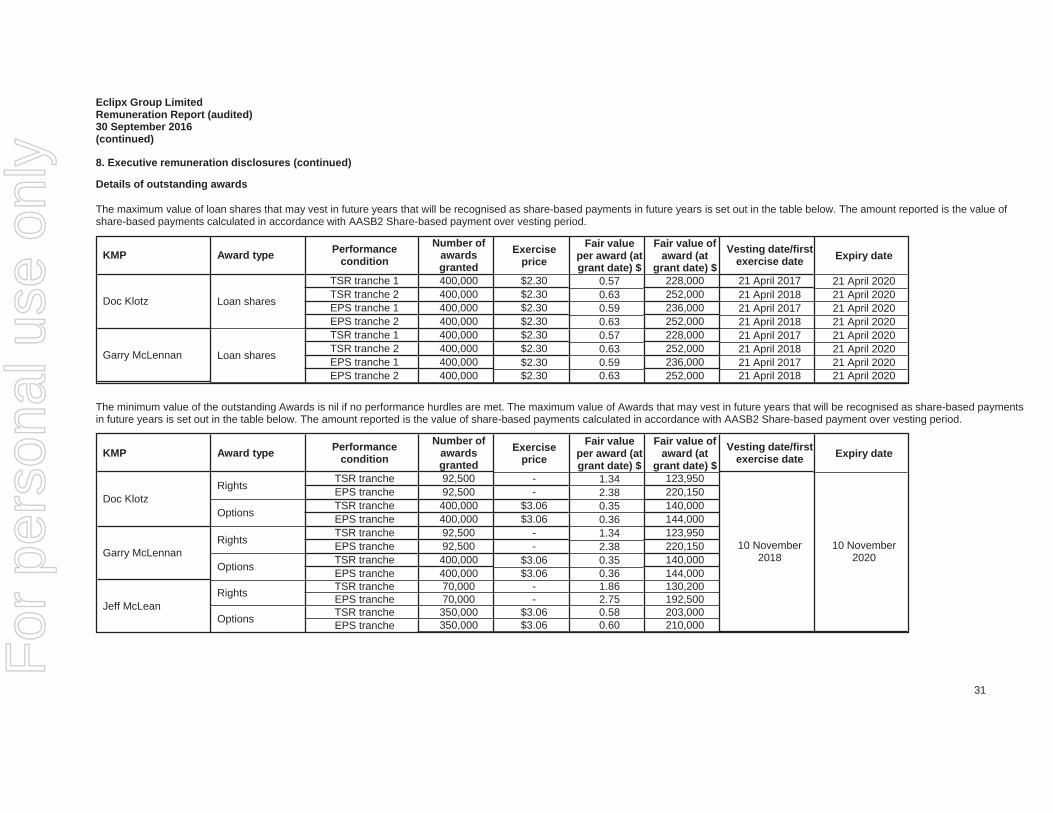
Details of outstanding awards
The maximum value of loan shares that may vest in future years that will be recognised as share-based payments in future years is set out in the table below. The amount reported is the value ofshare-based payments calculated in accordance with AASB2 Share-based payment over vesting period.
KMP Award type Performancecondition
Number ofawardsgranted
Exerciseprice
Fair valueper award (atgrant date) $
Fair value ofaward (at
grant date) $
Vesting date/firstexercise date Expiry date
Doc Klotz Loan shares
TSR tranche 1 400,000 $2.30 0.57 228,000 21 April 2017 21 April 2020TSR tranche 2 400,000 $2.30 0.63 252,000 21 April 2018 21 April 2020EPS tranche 1 400,000 $2.30 0.59 236,000 21 April 2017 21 April 2020EPS tranche 2 400,000 $2.30 0.63 252,000 21 April 2018 21 April 2020
Garry McLennan Loan shares
TSR tranche 1 400,000 $2.30 0.57 228,000 21 April 2017 21 April 2020TSR tranche 2 400,000 $2.30 0.63 252,000 21 April 2018 21 April 2020EPS tranche 1 400,000 $2.30 0.59 236,000 21 April 2017 21 April 2020EPS tranche 2 400,000 $2.30 0.63 252,000 21 April 2018 21 April 2020
The minimum value of the outstanding Awards is nil if no performance hurdles are met. The maximum value of Awards that may vest in future years that will be recognised as share-based paymentsin future years is set out in the table below. The amount reported is the value of share-based payments calculated in accordance with AASB2 Share-based payment over vesting period.
KMP Award type Performancecondition
Number ofawardsgranted
Exerciseprice
Fair valueper award (atgrant date) $
Fair value ofaward (at
grant date) $
Vesting date/firstexercise date Expiry date
Doc KlotzRights
TSR tranche 92,500 - 1.34 123,950
10 November2018
10 November2020
EPS tranche 92,500 - 2.38 220,150
OptionsTSR tranche 400,000 $3.06 0.35 140,000EPS tranche 400,000 $3.06 0.36 144,000
Garry McLennanRights
TSR tranche 92,500 - 1.34 123,950EPS tranche 92,500 - 2.38 220,150
Options TSR tranche 400,000 $3.06 0.35 140,000EPS tranche 400,000 $3.06 0.36 144,000
Jeff McLeanRights TSR tranche 70,000 - 1.86 130,200
EPS tranche 70,000 - 2.75 192,500
Options TSR tranche 350,000 $3.06 0.58 203,000EPS tranche 350,000 $3.06 0.60 210,000
31
For
per
sona
l use
onl
y
Eclipx Group LimitedRemuneration Report (audited)30 September 2016(continued)
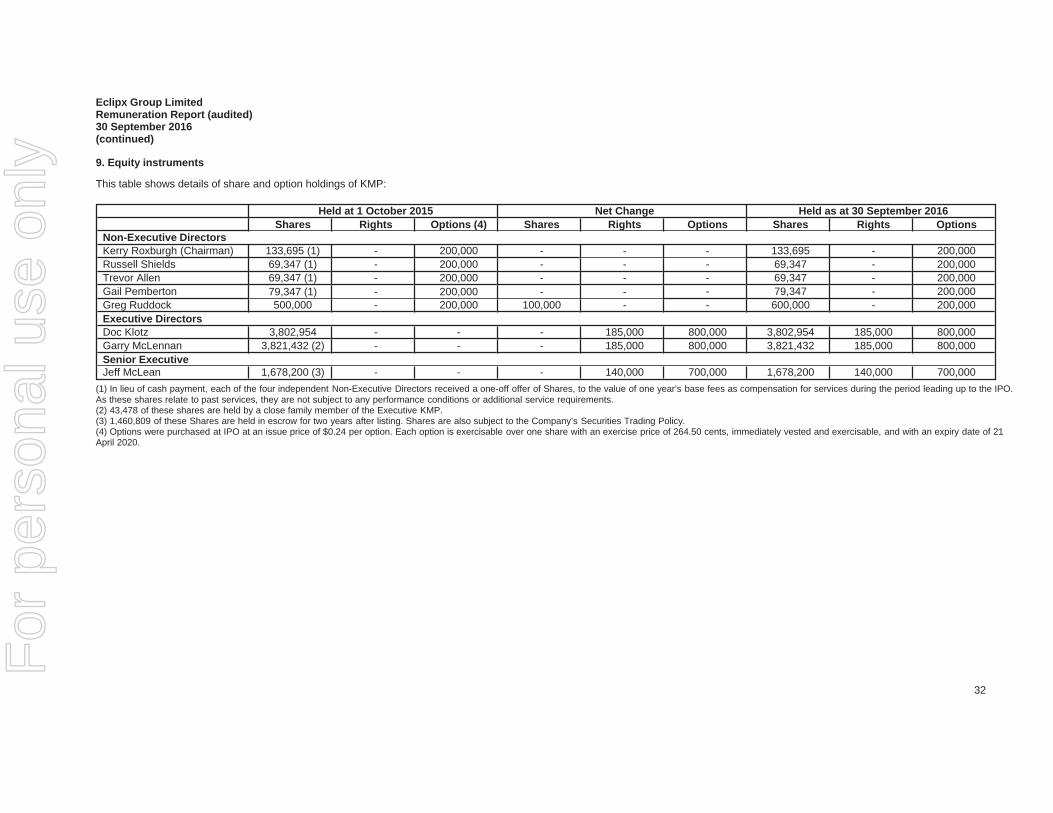
9. Equity instruments
This table shows details of share and option holdings of KMP:
Held at 1 October 2015 Net Change Held as at 30 September 2016Shares Rights Options (4) Shares Rights Options Shares Rights Options
Non-Executive DirectorsKerry Roxburgh (Chairman) 133,695 (1) - 200,000 - - - 133,695 - 200,000Russell Shields 69,347 (1) - 200,000 - - - 69,347 - 200,000Trevor Allen 69,347 (1) - 200,000 - - - 69,347 - 200,000Gail Pemberton 79,347 (1) - 200,000 - - - 79,347 - 200,000Greg Ruddock 500,000 - 200,000 100,000 - - 600,000 - 200,000Executive DirectorsDoc Klotz 3,802,954 - - - 185,000 800,000 3,802,954 185,000 800,000Garry McLennan 3,821,432 (2) - - - 185,000 800,000 3,821,432 185,000 800,000Senior ExecutiveJeff McLean 1,678,200 (3) - - - 140,000 700,000 1,678,200 140,000 700,000
(1) In lieu of cash payment, each of the four independent Non-Executive Directors received a one-off offer of Shares, to the value of one year’s base fees as compensation for services during the period leading up to the IPO.As these shares relate to past services, they are not subject to any performance conditions or additional service requirements.(2) 43,478 of these shares are held by a close family member of the Executive KMP.(3) 1,460,809 of these Shares are held in escrow for two years after listing. Shares are also subject to the Company’s Securities Trading Policy.(4) Options were purchased at IPO at an issue price of $0.24 per option. Each option is exercisable over one share with an exercise price of 264.50 cents, immediately vested and exercisable, and with an expiry date of 21April 2020.
32
For
per
sona
l use
onl
y
Eclipx Group LimitedRemuneration Report (audited)30 September 2016(continued)
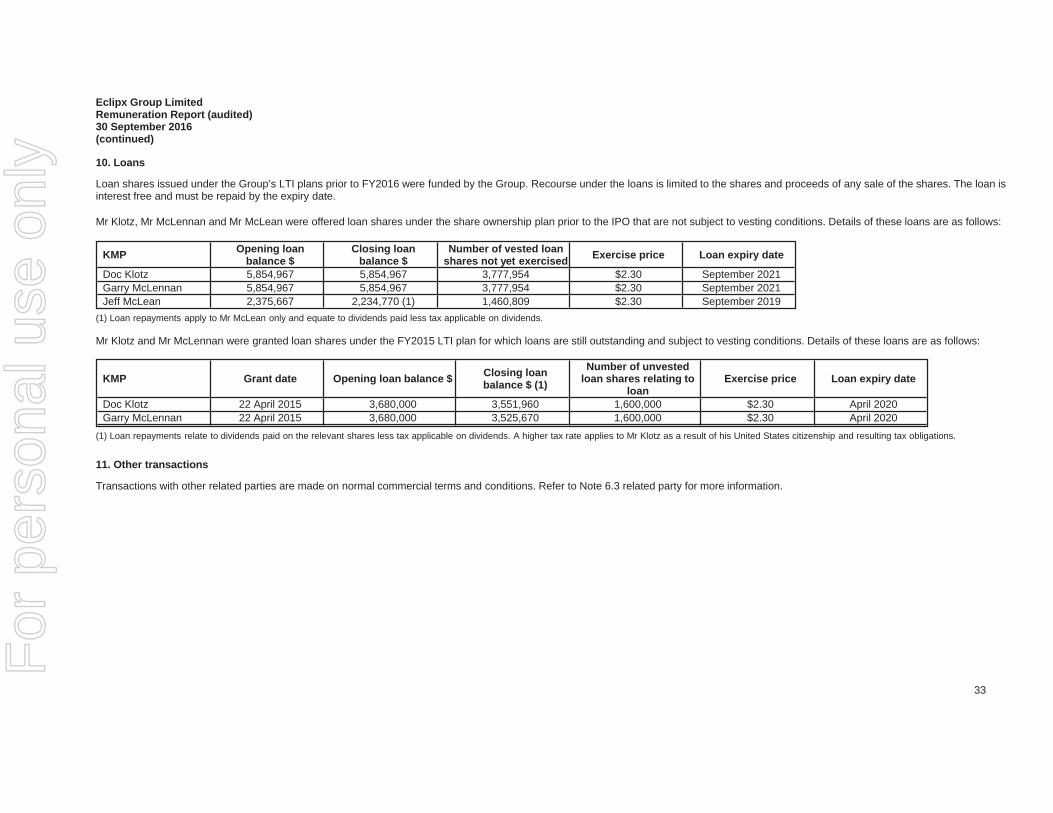
10. Loans
Loan shares issued under the Group’s LTI plans prior to FY2016 were funded by the Group. Recourse under the loans is limited to the shares and proceeds of any sale of the shares. The loan isinterest free and must be repaid by the expiry date.
Mr Klotz, Mr McLennan and Mr McLean were offered loan shares under the share ownership plan prior to the IPO that are not subject to vesting conditions. Details of these loans are as follows:
KMP Opening loanbalance $
Closing loanbalance $
Number of vested loanshares not yet exercised Exercise price Loan expiry date
Doc Klotz 5,854,967 5,854,967 3,777,954 $2.30 September 2021Garry McLennan 5,854,967 5,854,967 3,777,954 $2.30 September 2021Jeff McLean 2,375,667 2,234,770 (1) 1,460,809 $2.30 September 2019
(1) Loan repayments apply to Mr McLean only and equate to dividends paid less tax applicable on dividends.
Mr Klotz and Mr McLennan were granted loan shares under the FY2015 LTI plan for which loans are still outstanding and subject to vesting conditions. Details of these loans are as follows:
KMP Grant date Opening loan balance $ Closing loanbalance $ (1)
Number of unvestedloan shares relating to
loanExercise price Loan expiry date
Doc Klotz 22 April 2015 3,680,000 3,551,960 1,600,000 $2.30 April 2020Garry McLennan 22 April 2015 3,680,000 3,525,670 1,600,000 $2.30 April 2020
(1) Loan repayments relate to dividends paid on the relevant shares less tax applicable on dividends. A higher tax rate applies to Mr Klotz as a result of his United States citizenship and resulting tax obligations.
11. Other transactions
Transactions with other related parties are made on normal commercial terms and conditions. Refer to Note 6.3 related party for more information.
33
For
per
sona
l use
onl
y
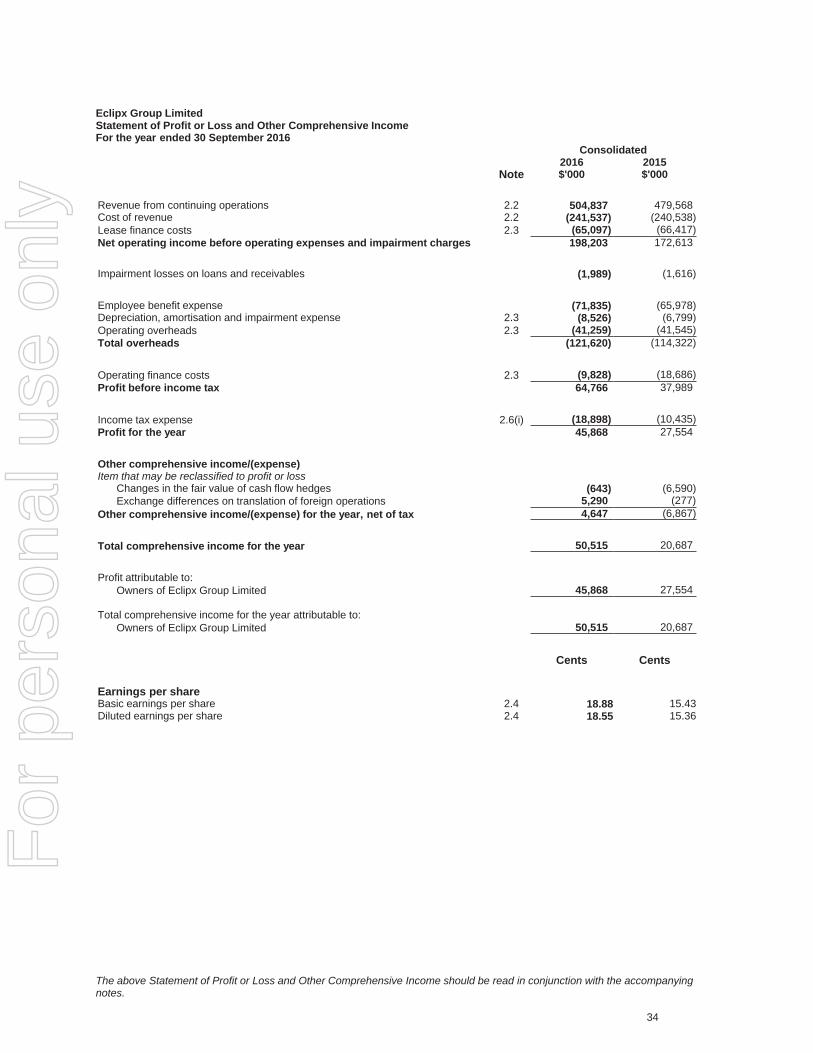
Eclipx Group LimitedStatement of Profit or Loss and Other Comprehensive IncomeFor the year ended 30 September 2016
Consolidated
Note2016$'000
2015$'000
Revenue from continuing operations 2.2 504,837 479,568Cost of revenue 2.2 (241,537) (240,538)Lease finance costs 2.3 (65,097) (66,417)Net operating income before operating expenses and impairment charges 198,203 172,613
Impairment losses on loans and receivables (1,989) (1,616)
Employee benefit expense (71,835) (65,978)Depreciation, amortisation and impairment expense 2.3 (8,526) (6,799)Operating overheads 2.3 (41,259) (41,545)Total overheads (121,620) (114,322)
Operating finance costs 2.3 (9,828) (18,686)Profit before income tax 64,766 37,989
Income tax expense 2.6(i) (18,898) (10,435)Profit for the year 45,868 27,554
Other comprehensive income/(expense)Item that may be reclassified to profit or loss
Changes in the fair value of cash flow hedges (643) (6,590)Exchange differences on translation of foreign operations 5,290 (277)
Other comprehensive income/(expense) for the year, net of tax 4,647 (6,867)
Total comprehensive income for the year 50,515 20,687
Profit attributable to:Owners of Eclipx Group Limited 45,868 27,554
- -Total comprehensive income for the year attributable to:
Owners of Eclipx Group Limited 50,515 20,687
Cents Cents
Earnings per shareBasic earnings per share 2.4 18.88 15.43Diluted earnings per share 2.4 18.55 15.36
The above Statement of Profit or Loss and Other Comprehensive Income should be read in conjunction with the accompanyingnotes.
34
For
per
sona
l use
onl
y
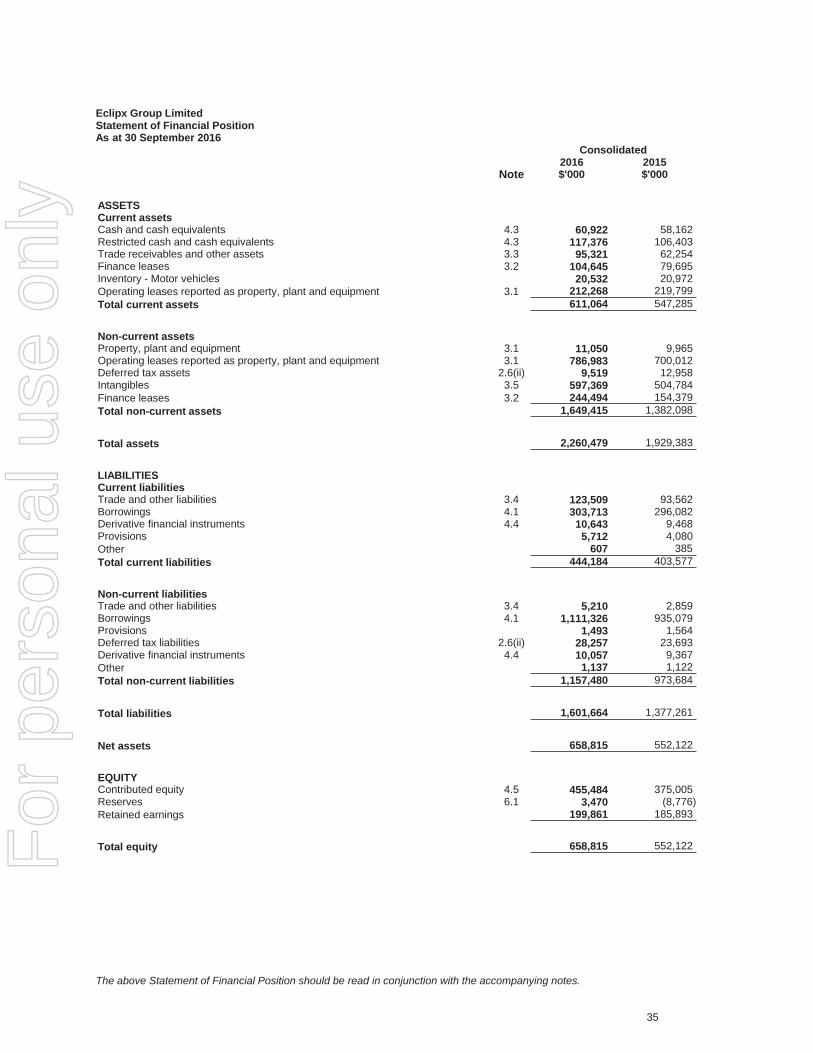
Eclipx Group LimitedStatement of Financial PositionAs at 30 September 2016
Consolidated
Note2016$'000
2015$'000
ASSETSCurrent assetsCash and cash equivalents 4.3 60,922 58,162Restricted cash and cash equivalents 4.3 117,376 106,403Trade receivables and other assets 3.3 95,321 62,254Finance leases 3.2 104,645 79,695Inventory - Motor vehicles 20,532 20,972Operating leases reported as property, plant and equipment 3.1 212,268 219,799Total current assets 611,064 547,285
Non-current assetsProperty, plant and equipment 3.1 11,050 9,965Operating leases reported as property, plant and equipment 3.1 786,983 700,012Deferred tax assets 2.6(ii) 9,519 12,958Intangibles 3.5 597,369 504,784Finance leases 3.2 244,494 154,379Total non-current assets 1,649,415 1,382,098
Total assets 2,260,479 1,929,383
LIABILITIESCurrent liabilitiesTrade and other liabilities 3.4 123,509 93,562Borrowings 4.1 303,713 296,082Derivative financial instruments 4.4 10,643 9,468Provisions 5,712 4,080Other 607 385Total current liabilities 444,184 403,577
Non-current liabilitiesTrade and other liabilities 3.4 5,210 2,859Borrowings 4.1 1,111,326 935,079Provisions 1,493 1,564Deferred tax liabilities 2.6(ii) 28,257 23,693Derivative financial instruments 4.4 10,057 9,367Other 1,137 1,122Total non-current liabilities 1,157,480 973,684
Total liabilities 1,601,664 1,377,261
Net assets 658,815 552,122
EQUITYContributed equity 4.5 455,484 375,005Reserves 6.1 3,470 (8,776)Retained earnings 199,861 185,893
Total equity 658,815 552,122
The above Statement of Financial Position should be read in conjunction with the accompanying notes.
35
For
per
sona
l use
onl
y
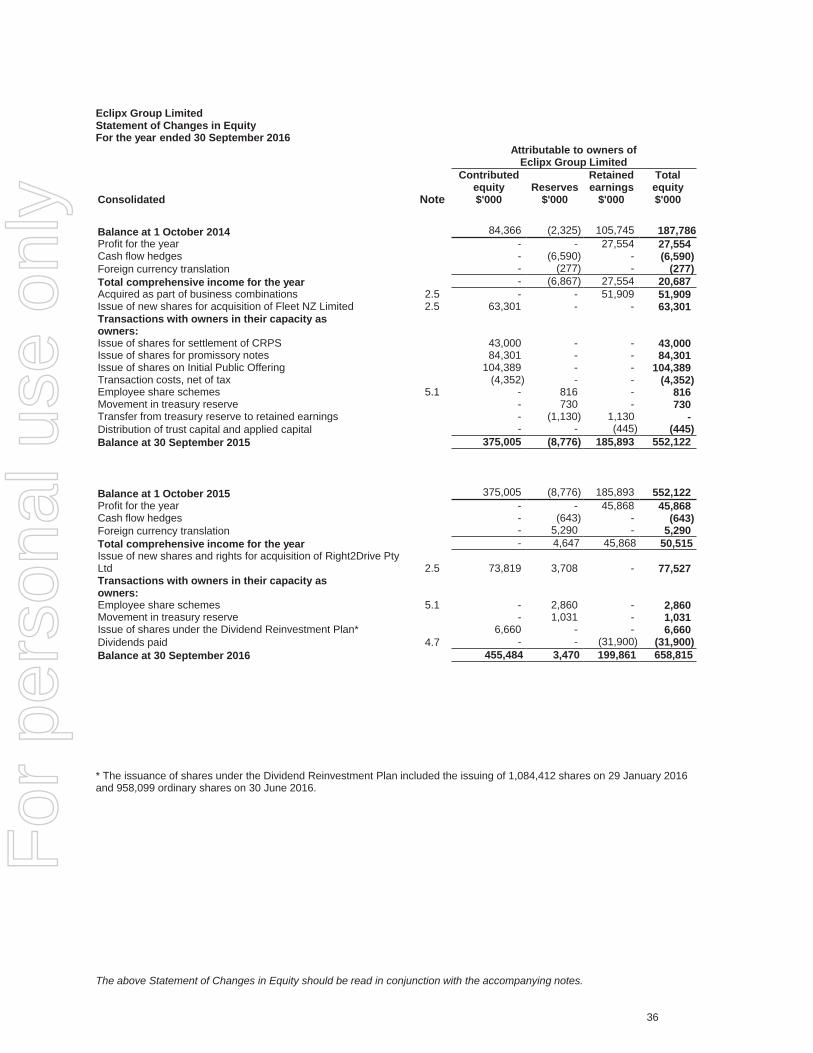
Eclipx Group LimitedStatement of Changes in EquityFor the year ended 30 September 2016
Attributable to owners ofEclipx Group Limited
Consolidated Note
Contributedequity$'000
Reserves$'000
Retainedearnings
$'000
Totalequity$'000
Balance at 1 October 2014 84,366 (2,325) 105,745 187,786Profit for the year - - 27,554 27,554Cash flow hedges - (6,590) - (6,590)Foreign currency translation - (277) - (277)Total comprehensive income for the year - (6,867) 27,554 20,687Acquired as part of business combinations 2.5 - - 51,909 51,909Issue of new shares for acquisition of Fleet NZ Limited 2.5 63,301 - - 63,301Transactions with owners in their capacity asowners:Issue of shares for settlement of CRPS 43,000 - - 43,000Issue of shares for promissory notes 84,301 - - 84,301Issue of shares on Initial Public Offering 104,389 - - 104,389Transaction costs, net of tax (4,352) - - (4,352)Employee share schemes 5.1 - 816 - 816Movement in treasury reserve - 730 - 730Transfer from treasury reserve to retained earnings - (1,130) 1,130 -Distribution of trust capital and applied capital - - (445) (445)Balance at 30 September 2015 375,005 (8,776) 185,893 552,122
Balance at 1 October 2015 375,005 (8,776) 185,893 552,122Profit for the year - - 45,868 45,868Cash flow hedges - (643) - (643)Foreign currency translation - 5,290 - 5,290Total comprehensive income for the year - 4,647 45,868 50,515Issue of new shares and rights for acquisition of Right2Drive PtyLtd 2.5 73,819 3,708 - 77,527Transactions with owners in their capacity asowners:Employee share schemes 5.1 - 2,860 - 2,860Movement in treasury reserve - 1,031 - 1,031Issue of shares under the Dividend Reinvestment Plan* 6,660 - - 6,660Dividends paid 4.7 - - (31,900) (31,900)Balance at 30 September 2016 455,484 3,470 199,861 658,815
* The issuance of shares under the Dividend Reinvestment Plan included the issuing of 1,084,412 shares on 29 January 2016and 958,099 ordinary shares on 30 June 2016.
The above Statement of Changes in Equity should be read in conjunction with the accompanying notes.
36
For
per
sona
l use
onl
y
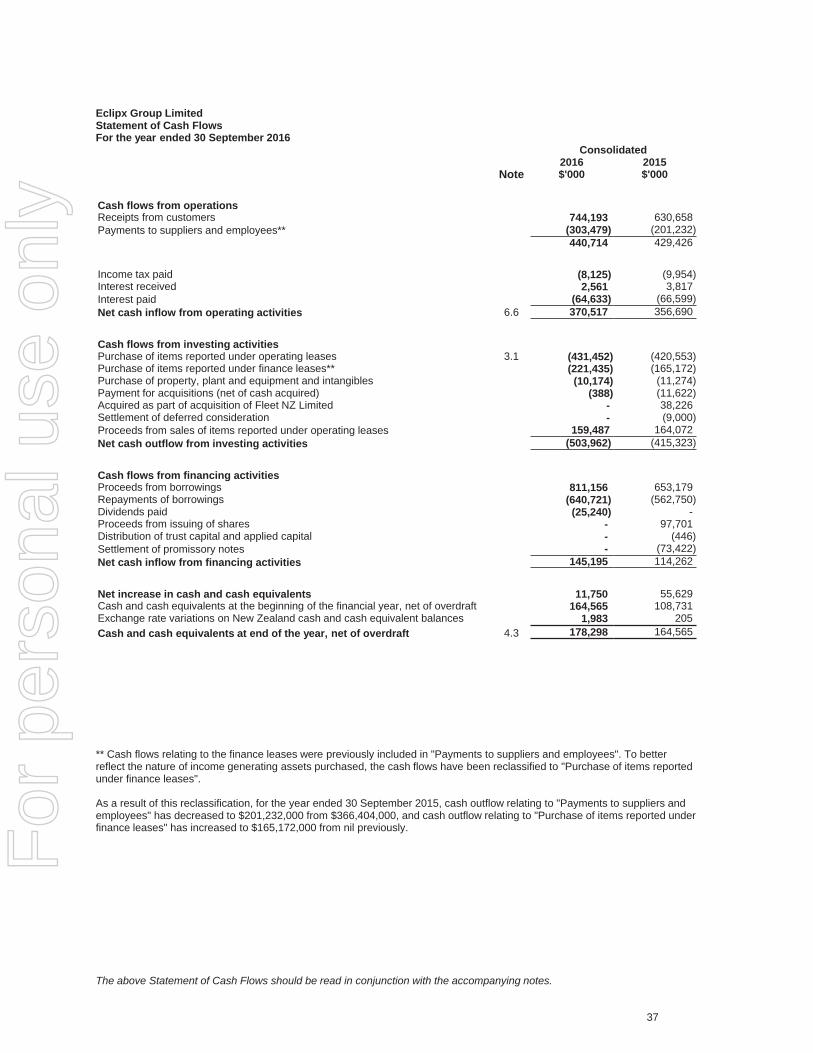
Eclipx Group LimitedStatement of Cash FlowsFor the year ended 30 September 2016
Consolidated
Note2016$'000
2015$'000
Cash flows from operationsReceipts from customers 744,193 630,658Payments to suppliers and employees** (303,479) (201,232)
440,714 429,426
Income tax paid (8,125) (9,954)Interest received 2,561 3,817Interest paid (64,633) (66,599)Net cash inflow from operating activities 6.6 370,517 356,690
Cash flows from investing activitiesPurchase of items reported under operating leases 3.1 (431,452) (420,553)Purchase of items reported under finance leases** (221,435) (165,172)Purchase of property, plant and equipment and intangibles (10,174) (11,274)Payment for acquisitions (net of cash acquired) (388) (11,622)Acquired as part of acquisition of Fleet NZ Limited - 38,226Settlement of deferred consideration - (9,000)Proceeds from sales of items reported under operating leases 159,487 164,072Net cash outflow from investing activities (503,962) (415,323)
Cash flows from financing activitiesProceeds from borrowings 811,156 653,179Repayments of borrowings (640,721) (562,750)Dividends paid (25,240) -Proceeds from issuing of shares - 97,701Distribution of trust capital and applied capital - (446)Settlement of promissory notes - (73,422)Net cash inflow from financing activities 145,195 114,262
Net increase in cash and cash equivalents 11,750 55,629Cash and cash equivalents at the beginning of the financial year, net of overdraft 164,565 108,731Exchange rate variations on New Zealand cash and cash equivalent balances 1,983 205Cash and cash equivalents at end of the year, net of overdraft 4.3 178,298 164,565
** Cash flows relating to the finance leases were previously included in "Payments to suppliers and employees". To betterreflect the nature of income generating assets purchased, the cash flows have been reclassified to "Purchase of items reportedunder finance leases".
As a result of this reclassification, for the year ended 30 September 2015, cash outflow relating to "Payments to suppliers andemployees" has decreased to $201,232,000 from $366,404,000, and cash outflow relating to "Purchase of items reported underfinance leases" has increased to $165,172,000 from nil previously.
The above Statement of Cash Flows should be read in conjunction with the accompanying notes.
37
For
per
sona
l use
onl
y
Eclipx Group LimitedNotes to the Financial StatementsFor the year ended 30 September 2016
1.0 INTRODUCTION TO THE REPORTStatement of compliance
These general purpose Financial Statements of the consolidated results of Eclipx Group Limited (ACN 131 557 901) have beenprepared in accordance with the Accounting Standards and Interpretations issued by the Australian Accounting StandardsBoard and the Corporations Act 2001. The consolidated financial statements comply with International Financial ReportingStandards (IFRS) adopted by the International Accounting Standards Board (IASB).
The financial report was authorised for issue by the Board of Directors on 1 November 2016.
Basis of preparation
These Financial Statements have been prepared under the historical cost convention, except for the financial assets andliabilities (including derivative instruments) at fair value through profit or loss and certain classes of property, plant andequipment.
Rounding of amounts
The Company is of a kind referred to in ASIC Corporations (Rounding in Financial/Directors' Reports) Instrument 2016/191,issued by the Australian Securities and Investments Commission, relating to the 'rounding off' of amounts in the FinancialStatements. Amounts in the Financial Statements have been rounded off in accordance with that Instrument to the nearestthousand dollars, or in certain cases, the nearest dollar.
Critical accounting estimates and assumptions
The preparation of Financial Statements requires the use of certain critical accounting estimates. It also requires managementto exercise its judgement in the process of applying the Group's accounting policies.
Accounting estimates and judgements Note PageImpairment of goodwill 3.5 58Income taxes 2.6 48Residual value and fair value adjustment 3.1 54
Significant accounting policies
The significant accounting policies adopted in the preparation of the financial report are set out below. Other significantaccounting policies are contained in the notes to the financial report to which they relate to. The financial statements are for theGroup consisting of Eclipx Group Limited (Company) and its controlled entities.
(i) Principles of consolidation
The consolidated financial statements incorporate the assets and liabilities of all controlled entities of Eclipx Group Limited as at30 September 2016 and the results of all controlled entities for the year ended. Eclipx Group Limited and its controlled entitiestogether are referred to in this financial report as the Group or the consolidated entity.
The Company controls an entity if it is exposed, or has rights, to variable returns from its involvement with the controlled entityand has the ability to affect those returns through its power over the controlled entity. All controlled entities have a reportingdate of 30 September.
Profit or loss and other comprehensive income of controlled entities acquired or disposed of during the year are recognisedfrom the effective date of acquisition, or up to the effective date of disposal, as applicable. In preparing the financial report, allintercompany balances, transactions and unrealised profits arising within the consolidated entity are eliminated in full.
(ii) Foreign currency translationFunctional and presentation currency
The consolidated financial statements are presented in Australian dollars (AUD), which is also the functional currency of theCompany.
Foreign currency transactions and balances
Foreign currency transactions are translated into the functional currency of the respective Group entity, using the exchangerates prevailing at the dates of the transactions (spot exchange rate). Foreign exchange gains and losses resulting from thesettlement of such transactions and from remeasurement of monetary items at year end exchange rates are recognised in profitor loss.
38
For
per
sona
l use
onl
y
Eclipx Group LimitedNotes to the Financial StatementsFor the year ended 30 September 2016(continued)
1.0 INTRODUCTION TO THE REPORT (continued)Significant accounting policies (continued)
Non-monetary items are not retranslated at year-end and are measured at historical cost (translated using the exchange ratesat the date of transaction), except for non-monetary items measured at fair value which are translated using the exchange ratesat the date when fair value was determined.
Foreign operations
In the Group’s financial statements, all assets, liabilities and transactions of Group entities with a functional currency other thanAUD are translated into AUD upon consolidation. The functional currency of the entities in the Group has remained unchangedduring the reporting period.
On consolidation, assets and liabilities have been translated into AUD at the closing rate at the reporting date. Goodwill and fairvalue adjustments arising on the acquisition of a foreign entity have been treated as assets and liabilities of the foreign entityand translated into AUD at the closing rate. Income and expenses have been translated into AUD at the average rate over thereporting period. Exchange differences are charged or credited to other comprehensive income and recognised in the currencytranslation reserve in equity. On disposal of a foreign operation, the cumulative translation differences recognised in equity arereclassified to profit or loss and recognised as part of the gain or loss on disposal.
New and revised standards and interpretations adopted by the Group
The Group has adopted, for the first time, certain standards that made changes to a number of existing Australian AccountingStandards and they have not had any material effect on the Group’s financial position or performance. These standards havebeen set out below.
AASB 2015-3: Amendments to Australian Accounting Standards arising from the Withdrawal of AASB 1031 Materiality.
New and revised standards and interpretations not yet adopted by the Group
Australian Accounting Standards and Interpretations that have recently been issued or amended but are not yet mandatory,have not been early adopted by the Group for the annual reporting period ended 30 September 2016 and are set out below.The impact of these new or revised Accounting Standards and Interpretations has not yet been determined.
Reference Description Application ofStandard
Application byGroup
AASB 9 FinancialInstruments
The AASB has issued the complete AASB 9. The newstandard includes revised guidance on the classification andmeasurement of financial assets, including a new expectedcredit loss model for calculating impairment, and supplementsthe new general hedge accounting requirements previouslypublished.
1 January 2018 1 October 2018
AASB 15Revenue fromContracts withCustomers
The standard contains a single model that applies to contractswith customer and two approaches to recognising revenue: ata point in time or over time. The model features acontract-based five-step analysis of transactions to determinewhether, how much and when revenue is recognised.
1 January 2018 1 October 2018
AASB 16 Leases
AASB 16 removes the classification of leases as eitheroperating leases or finance leases – for the lessee –effectively treating all leases as finance leases. Short-termleases (less than 12 months) and leases of low-value assets(such as personal computers) are exempt from the leaseaccounting requirements. There are also changes inaccounting over the life of the lease. In particular, companieswill now recognise a front-loaded pattern of expense for mostleases, even when they pay constant annual rentals. Lessoraccounting remains similar to current practice – i.e. lessorscontinue to classify leases as finance and operating leases.
1 January 2019 1 October 2019
39
For
per
sona
l use
onl
y
Eclipx Group LimitedNotes to the Financial StatementsFor the year ended 30 September 2016(continued)
2.0 BUSINESS RESULT FOR THE YEAR
This section provides the information that is most relevant to understanding the financial performance of the Group during thefinancial year and, where relevant, the accounting policies applied and the critical judgements and estimates made.
2.1 Segment information2.2 Revenue2.3 Expenses2.4 Earnings per share2.5 Business combinations2.6 Taxation
2.1 Segment information
Identification of reportable segments
An operating segment is a component of an entity that engages in business activities from which it may earn revenue and incurexpenses, whose operating results are regularly reviewed by the Group's Chief Operating Decision Maker in order to effectivelyallocate Group resources and assess performance.
The Group has identified its operating segments based on the internal reports that are reviewed and used by the ChiefOperating Decision Makers to make strategic decisions. The Chief Operating Decision Makers are the Chief Executive Officerand the Deputy Chief Executive Officer.
Three reportable segments have been identified: Australia Commercial, Australia Consumer and New Zealand Commercial.The segments are based on the class of customer to which services are provided. Services in all segments include theprovision of lease finance and fleet management to customers.
In addition to statutory profit after tax, the business is assessed on a Cash Net Profit After Tax (Cash NPATA) basis. Whilst anon-IFRS measure, Cash NPATA is defined as statutory profit after tax, adjusted for the after tax effect of material one-off itemsthat do not reflect the ongoing operations of the Group and amortisation of acquired intangible assets. Each of these operatingsegments is managed separately as each of these service lines requires different resources as well as marketing approaches.
2016
AustraliaCommercial
$'000
AustraliaConsumer
$'000
AustraliaTotal$'000
NewZealand
Commercial$'000
Total$'000
Net operating income before operating expenses andimpairment charges 113,885 45,052 158,937 39,266 198,203Depreciation and amortisation of non-financial assets (1,663) (568) (2,231) (336) (2,567)Bad and doubtful debts (1,531) - (1,531) (458) (1,989)Operating expenses (54,870) (30,874) (85,744) (22,289) (108,033)Profit before tax, non-recurring costs and interest 55,821 13,610 69,431 16,183 85,614
Holding company debt interest (3,828) (1,216) (5,044) (2,295) (7,339)Adjustments* (7,606) (5,450) (13,056) (453) (13,509)Tax (13,099) (2,083) (15,182) (3,716) (18,898)Statutory net profit after tax 31,288 4,861 36,149 9,719 45,868
Intangibles amortisation including tax impact 2,651 1,313 3,964 214 4,178Restructure and acquisition costs including tax impact 2,669 2,502 5,171 113 5,284Cash net profit after tax 36,608 8,676 45,284 10,046 55,330
* Adjustments relate to acquisition related costs, corporate debt restructuring costs, amortisation of intangibles and otherrestructuring costs.
40
For
per
sona
l use
onl
y
Eclipx Group LimitedNotes to the Financial StatementsFor the year ended 30 September 2016(continued)
2.0 BUSINESS RESULT FOR THE YEAR (continued)2.1 Segment information (continued)
2015
AustraliaCommercial
$'000
AustraliaConsumer
$'000
AustraliaTotal$'000
NewZealand
Commercial$'000
Total$'000
Net operating income before operating expenses andimpairment charges 112,191 25,914 138,105 34,508 172,613Depreciation and amortisation of non-financial assets (1,514) (267) (1,781) (274) (2,055)Bad and doubtful debts (1,884) - (1,884) 268 (1,616)Operating expenses (57,207) (16,759) (73,966) (19,708) (93,674)Profit before tax, non-recurring costs and interest 51,586 8,888 60,474 14,794 75,268
Holding company debt interest (3,942) (742) (4,684) (2,116) (6,800)Adjustments* (24,392) (4,305) (28,697) (1,782) (30,479)Tax (6,612) (1,152) (7,764) (2,671) (10,435)Statutory net profit after tax 16,640 2,689 19,329 8,225 27,554
IPO and acquisition costs and capital proforma adjustmentsincluding tax impact 14,288 2,521 16,809 900 17,709Intangibles amortisation including tax impact 2,779 490 3,269 53 3,322Cash net profit after tax 33,707 5,700 39,407 9,178 48,585
* Adjustments relate to IPO and acquisition costs, amortisation of intangibles and interest expense relating to the previouscapital and debt structure prior to IPO.
2.2 Revenue
Recognition and measurement
The Group recognises revenue when the amount of revenue can be reliably measured, it is probable that future economicbenefits will flow to the entity and specific criteria have been met for each of the Group's activities as described below. TheGroup bases its estimates on historical results, taking into consideration the type of customer, the type of transaction and thespecifics of each arrangement.
Revenue is measured at the fair value of the consideration received or receivable. Amounts disclosed as revenue are net ofreturns, trade allowances, rebates and amounts collected on behalf of third parties.
Finance income
Interest revenue is recognised as interest accrues using the effective interest method. This is a method of calculating theamortised cost of a financial asset and allocating the interest income over the relevant period using the effective interest rate,which is the rate that exactly discounts estimated future cash receipts through the expected life of the financial asset to the netcarrying amount of the financial asset.
Operating lease rentals
Rental revenue arising from operating lease contracts is brought to account in the period it is earned. The operating leaserentals are recognised on a straight line basis over the lease term. The instalments are classified and presented in financeincome and operating lease rentals.
Maintenance and management income
Maintenance income is recognised over the life of the contract with reference to the stage of completion. Management incomeand management fees are recognised on a straight line basis over the term of the contract.
Brokerage, commissions and advice services income
Income is recognised when the relevant services have been provided and a reliable estimate of the income can be made.
41
For
per
sona
l use
onl
y
Eclipx Group LimitedNotes to the Financial StatementsFor the year ended 30 September 2016(continued)
2.0 BUSINESS RESULT FOR THE YEAR (continued)2.2 Revenue (continued)
End of lease income
End of lease income includes profits on the sale of vehicles from terminated lease contracts and other revenue generated at theend of a lease.
Rental hire income
Rental hire income is brought to account in the period it is earned.
Cost of revenue
Cost of revenue comprises the cost associated with providing the service components of the lease instalments and rental hireincome. Cost of revenue is recognised for each reporting period by reference to the stage of completion when the outcome ofthe services contracts can be estimated reliably. The stage of completion of services contracts is based on the proportion thatcosts incurred to date bear to total estimated costs. Rental hire expense includes amounts paid to third parties for vehiclesunder operating leases.
Consolidated2016$'000
2015$'000
From continuing operations:Finance income 101,642 103,520Maintenance and management income 97,484 97,525Related products and services income 30,011 27,452Operating lease rentals 200,461 202,467Brokerage income 16,695 14,722Sundry income 7,672 6,065End of lease income 31,876 27,817Rental hire income 18,996 -Total revenue from continuing operations 504,837 479,568
Cost of revenue:Maintenance and management expense 41,629 43,645Related products and services expense 4,797 4,172Impairment on operating leased assets (118) 1,851Depreciation on operating leased assets 189,413 190,870Rental hire expense 5,816 -Total cost of revenue 241,537 240,538
2.3 Expenses
Recognition and measurementDepreciation
Depreciation on assets is calculated using the straight line method to allocate their cost, net of their residual values, over theirestimated useful lives, as follows:
• Motor vehicles 2-10 years;• Furniture and fittings 3-10 years; and• Plant and equipment 3-10 years.
Interest expense
Interest expense is recognised in the statement of comprehensive income using the effective interest method.
42
For
per
sona
l use
onl
y
Eclipx Group LimitedNotes to the Financial StatementsFor the year ended 30 September 2016(continued)
2.0 BUSINESS RESULT FOR THE YEAR (continued)2.3 Expenses (continued)
Amortisation
Costs incurred in developing products or systems and costs incurred in acquiring software and licenses that will contribute tofuture period financial benefits through revenue generation and/or cost reduction are capitalised to software and systems. Costscapitalised include external direct costs of materials and service and direct payroll and payroll related costs of employees' timespent on the project. Amortisation is calculated on a straight line basis over periods generally ranging from three to five yearsfor non-core costs, and seven to 10 years for core system software costs.
Consolidated2016$'000
2015$'000
Profit before income tax includes the following specific expenses:aaaDepreciation and amortisationPlant and equipment - fixture and fittings 2,567 2,055Amortisation - Intangible assets 3,711 3,203Software 2,248 1,541Total depreciation and amortisation expense 8,526 6,799
Lease finance costsInterest and finance charges - Third parties 64,633 66,599Hedge loss/(gain) 464 (182)Total lease finance costs 65,097 66,417
Operating finance costsInterest expense promissory notes - Related parties - 8,421Interest expense convertible redeemable preference shares - 1,253Facility finance costs 9,828 9,012Total operating finance costs 9,828 18,686
Operating overheadsRental of premises 6,668 6,308Technology costs 7,301 8,830Restructuring costs 1,760 -Acquisition related costs 3,301 1,672IPO costs - 13,376Other overheads 22,229 11,359Total operating overheads 41,259 41,545
43
For
per
sona
l use
onl
y
Eclipx Group LimitedNotes to the Financial StatementsFor the year ended 30 September 2016(continued)
2.0 BUSINESS RESULT FOR THE YEAR (continued)2.4 Earnings per share
Basic earnings per share
Basic earnings per share is calculated by dividing the profit attributable to equity holders of the Company, excluding any costsof servicing equity other than ordinary shares, by the weighted average number of fully paid ordinary shares outstanding duringthe financial year and excluding treasury shares.
Consolidated2016Cents
2015Cents
From continuing operations attributable to the ordinary equity holders of the company 18.88 15.43Total basic earnings per share attributable to the ordinary equity holders of thecompany 18.88 15.43
Diluted earnings per share
Diluted earnings per share adjusts the figures used in the determination of basic earnings per share to take into account theafter income tax effect of interest and other financing costs associated with dilutive potential ordinary shares and the weightedaverage number of additional ordinary shares that would have been outstanding assuming the conversion of all dilutivepotential ordinary shares.
Consolidated2016Cents
2015Cents
From continuing operations attributable to the ordinary equity holders of the company 18.55 15.36Total diluted earnings per share attributable to the ordinary equity holders of thecompany 18.55 15.36
Reconciliation of earnings used in calculating earnings per shareConsolidated
2016$'000
2015$'000
Basic earnings per shareProfit attributable to the ordinary equity holders of the company used in calculating basicearnings per share: 45,868 27,554From continuing operations 45,868 27,554
Diluted earnings per shareProfit attributable to the ordinary equity holders of the company used in calculating dilutedearnings per share 45,868 27,554From continuing operations 45,868 27,554
Weighted average number of shares used as the denominatorConsolidated
2016Number
2015Number
Weighted average number of ordinary shares used as the denominator in calculating basicearnings per share 242,954,968 178,573,004
Weighted average number of ordinary shares used as the denominator in calculatingdiluted earnings per share 247,295,831 179,412,444
44
For
per
sona
l use
onl
y
Eclipx Group LimitedNotes to the Financial StatementsFor the year ended 30 September 2016(continued)
2.0 BUSINESS RESULT FOR THE YEAR (continued)2.5 Business combinations
Recognition and measurement
The acquisition method of accounting is used to account for all business combinations, regardless of whether equityinstruments or other assets are acquired. The consideration transferred for the acquisition of a controlled entity comprises thefair values of the assets transferred, the liabilities incurred and the equity interests issued by the Group. The considerationtransferred also includes the fair value of any asset or liability resulting from a contingent consideration arrangement and thefair value of any pre-existing equity interest in the controlled entity. Acquisition-related costs are expensed as incurred.Identifiable assets acquired and liabilities and contingent liabilities assumed in a business combination are, with limitedexceptions, measured initially at their fair values at the acquisition date. On an acquisition-by-acquisition basis, the Grouprecognises any non-controlling interests in the acquiree either at fair value or at the non-controlling interests' proportionateshare of the acquiree’s net identifiable assets.
The excess of the consideration transferred and the amount of any non-controlling interests in the acquiree over the fair valueof the net identifiable assets acquired is recorded as goodwill. If those amounts are less than the fair value of the net identifiableassets of the controlled entity acquired and the measurement of all amounts has been reviewed, the difference is recogniseddirectly in profit or loss as a bargain purchase.
Where settlement of any part of cash consideration is deferred, the amounts payable in the future are discounted to theirpresent value as at the date of exchange. The discount rate used is the entity's incremental borrowing rate, being the rate atwhich a similar borrowing could be obtained from an independent financier under comparable terms and conditions.
Contingent and deferred consideration is classified either as equity or a financial liability. Amounts classified as a financialliability are subsequently remeasured to fair value with changes in fair value recognised in profit or loss.
Summary of acquisition - Right2Drive
On 19 May 2016, the Group acquired the Right2Drive Group (Right2Drive) that consisted of the following entities: Right2DrivePty Ltd and Right2Drive (New Zealand) Ltd. Right2Drive's principal activity is the provision of rental replacement vehicles to"not at fault" drivers that have accident damaged cars requiring repair. Right2Drive was acquired to provide a platform toexpand into the medium term vehicle rental segment.
Provisional goodwill of $59,904,000 is primarily related to growth expectations, expected future profitability, the substantial skilland expertise of Right2Drive’s workforce and expected cost synergies. The goodwill that arose from this business combinationis not expected to be deductible for tax purposes.
The purchase price allocation is provisional and may be revised within 12 months of acquisition date.
Right2Drive recorded revenue of $18,996,000 and a profit before tax of $3,430,000 for the period from 19 May 2016 to 30September 2016. If Right2Drive had been acquired on 1 October 2015, revenue of the Group for the year would have increasedby $22,138,000, and profit before tax for the year would have increased by $1,828,000.
Summary of acquisition - FleetSmart
On 31 March 2016 the Group acquired the business and assets of FleetSmart, a division of Cardlink Systems Limited(FleetSmart). The principal activity of the business acquired is the provision of vehicle fleet management. The business wasacquired to support the business' growth strategy in vehicle fleet management in the New Zealand market.
Provisional goodwill of $2,924,000 is primarily related to expected cost synergies and future profitability. None of the goodwillrecognised is expected to be deductible for income tax purposes.
Contingent consideration of $5,678,000 is payable by the Group if certain performance criteria are achieved, this is payableover a period of up to eight years.
Deferred consideration amounted to $924,000 and is payable over a period of five years.
The purchase price allocation is provisional and may be revised within 12 months of acquisition date.
FleetSmart recorded revenue of $2,064,000 and profit before tax of $1,067,000 for the period from 31 March 2016 to 30September 2016. If FleetSmart had been acquired on 1 October 2015, revenue of the Group for the year would have increasedby $1,427,000 and profit before tax for the year would have increased by $814,000.
45
For
per
sona
l use
onl
y
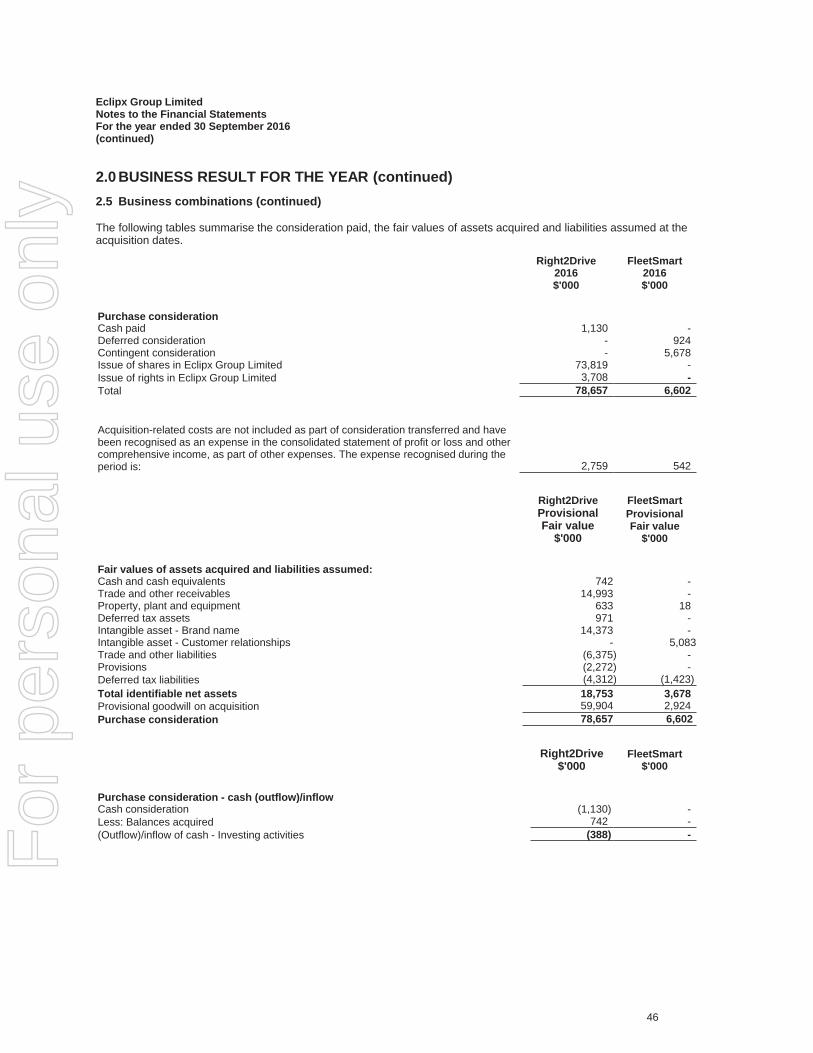
Eclipx Group LimitedNotes to the Financial StatementsFor the year ended 30 September 2016(continued)
2.0 BUSINESS RESULT FOR THE YEAR (continued)2.5 Business combinations (continued)
The following tables summarise the consideration paid, the fair values of assets acquired and liabilities assumed at theacquisition dates.
Right2Drive2016$'000
FleetSmart2016$'000
Purchase considerationCash paid 1,130 -Deferred consideration - 924Contingent consideration - 5,678Issue of shares in Eclipx Group Limited 73,819 -Issue of rights in Eclipx Group Limited 3,708 -Total 78,657 6,602
Acquisition-related costs are not included as part of consideration transferred and havebeen recognised as an expense in the consolidated statement of profit or loss and othercomprehensive income, as part of other expenses. The expense recognised during theperiod is: 2,759 542
Right2Drive FleetSmartProvisionalFair value
$'000
ProvisionalFair value
$'000
Fair values of assets acquired and liabilities assumed:Cash and cash equivalents 742 -Trade and other receivables 14,993 -Property, plant and equipment 633 18Deferred tax assets 971 -Intangible asset - Brand name 14,373 -Intangible asset - Customer relationships - 5,083Trade and other liabilities (6,375) -Provisions (2,272) -Deferred tax liabilities (4,312) (1,423)Total identifiable net assets 18,753 3,678Provisional goodwill on acquisition 59,904 2,924Purchase consideration 78,657 6,602
Right2Drive$'000
FleetSmart$'000
Purchase consideration - cash (outflow)/inflowCash consideration (1,130) -Less: Balances acquired 742 -(Outflow)/inflow of cash - Investing activities (388) -
46
For
per
sona
l use
onl
y
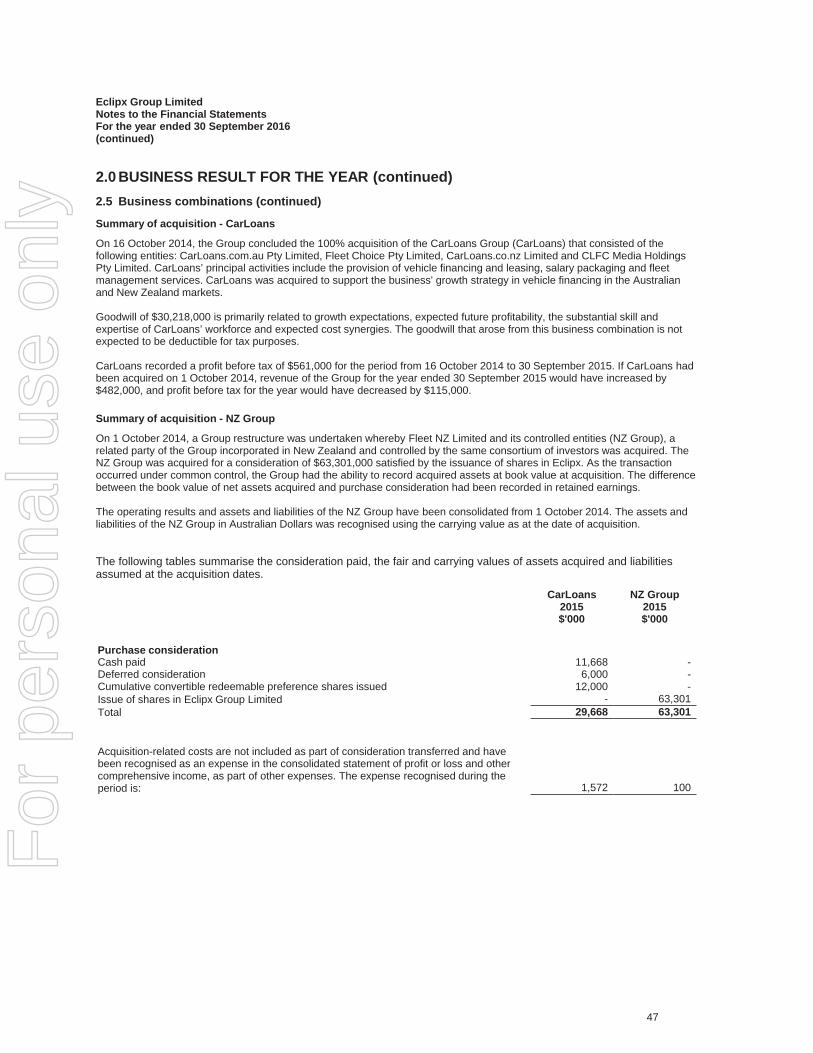
Eclipx Group LimitedNotes to the Financial StatementsFor the year ended 30 September 2016(continued)
2.0 BUSINESS RESULT FOR THE YEAR (continued)2.5 Business combinations (continued)
Summary of acquisition - CarLoans
On 16 October 2014, the Group concluded the 100% acquisition of the CarLoans Group (CarLoans) that consisted of thefollowing entities: CarLoans.com.au Pty Limited, Fleet Choice Pty Limited, CarLoans.co.nz Limited and CLFC Media HoldingsPty Limited. CarLoans’ principal activities include the provision of vehicle financing and leasing, salary packaging and fleetmanagement services. CarLoans was acquired to support the business' growth strategy in vehicle financing in the Australianand New Zealand markets.
Goodwill of $30,218,000 is primarily related to growth expectations, expected future profitability, the substantial skill andexpertise of CarLoans’ workforce and expected cost synergies. The goodwill that arose from this business combination is notexpected to be deductible for tax purposes.
CarLoans recorded a profit before tax of $561,000 for the period from 16 October 2014 to 30 September 2015. If CarLoans hadbeen acquired on 1 October 2014, revenue of the Group for the year ended 30 September 2015 would have increased by$482,000, and profit before tax for the year would have decreased by $115,000.
Summary of acquisition - NZ Group
On 1 October 2014, a Group restructure was undertaken whereby Fleet NZ Limited and its controlled entities (NZ Group), arelated party of the Group incorporated in New Zealand and controlled by the same consortium of investors was acquired. TheNZ Group was acquired for a consideration of $63,301,000 satisfied by the issuance of shares in Eclipx. As the transactionoccurred under common control, the Group had the ability to record acquired assets at book value at acquisition. The differencebetween the book value of net assets acquired and purchase consideration had been recorded in retained earnings.
The operating results and assets and liabilities of the NZ Group have been consolidated from 1 October 2014. The assets andliabilities of the NZ Group in Australian Dollars was recognised using the carrying value as at the date of acquisition.
The following tables summarise the consideration paid, the fair and carrying values of assets acquired and liabilitiesassumed at the acquisition dates.
CarLoans2015$'000
NZ Group2015$'000
Purchase considerationCash paid 11,668 -Deferred consideration 6,000 -Cumulative convertible redeemable preference shares issued 12,000 -Issue of shares in Eclipx Group Limited - 63,301Total 29,668 63,301
Acquisition-related costs are not included as part of consideration transferred and havebeen recognised as an expense in the consolidated statement of profit or loss and othercomprehensive income, as part of other expenses. The expense recognised during theperiod is: 1,572 100
47
For
per
sona
l use
onl
y
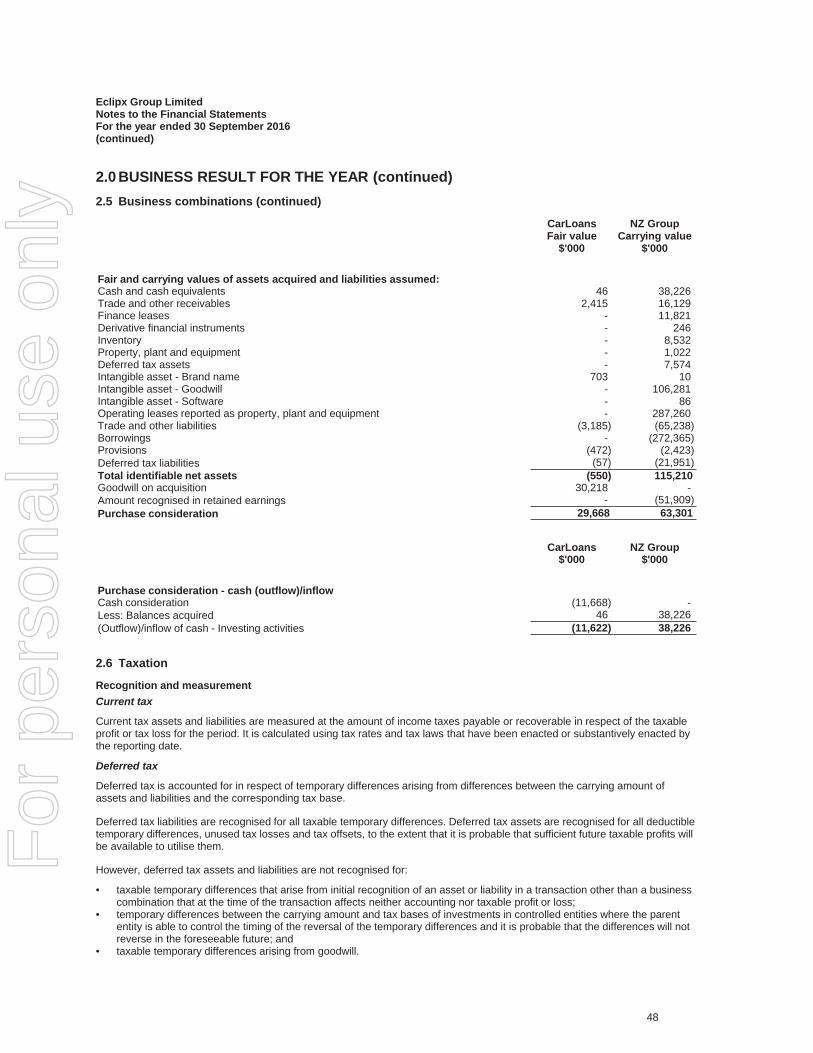
Eclipx Group LimitedNotes to the Financial StatementsFor the year ended 30 September 2016(continued)
2.0 BUSINESS RESULT FOR THE YEAR (continued)2.5 Business combinations (continued)
CarLoans NZ GroupFair value
$'000Carrying value
$'000
Fair and carrying values of assets acquired and liabilities assumed:Cash and cash equivalents 46 38,226Trade and other receivables 2,415 16,129Finance leases - 11,821Derivative financial instruments - 246Inventory - 8,532Property, plant and equipment - 1,022Deferred tax assets - 7,574Intangible asset - Brand name 703 10Intangible asset - Goodwill - 106,281Intangible asset - Software - 86Operating leases reported as property, plant and equipment - 287,260Trade and other liabilities (3,185) (65,238)Borrowings - (272,365)Provisions (472) (2,423)Deferred tax liabilities (57) (21,951)Total identifiable net assets (550) 115,210Goodwill on acquisition 30,218 -Amount recognised in retained earnings - (51,909)Purchase consideration 29,668 63,301
CarLoans$'000
NZ Group$'000
Purchase consideration - cash (outflow)/inflowCash consideration (11,668) -Less: Balances acquired 46 38,226(Outflow)/inflow of cash - Investing activities (11,622) 38,226
2.6 Taxation
Recognition and measurementCurrent tax
Current tax assets and liabilities are measured at the amount of income taxes payable or recoverable in respect of the taxableprofit or tax loss for the period. It is calculated using tax rates and tax laws that have been enacted or substantively enacted bythe reporting date.
Deferred tax
Deferred tax is accounted for in respect of temporary differences arising from differences between the carrying amount ofassets and liabilities and the corresponding tax base.
Deferred tax liabilities are recognised for all taxable temporary differences. Deferred tax assets are recognised for all deductibletemporary differences, unused tax losses and tax offsets, to the extent that it is probable that sufficient future taxable profits willbe available to utilise them.
However, deferred tax assets and liabilities are not recognised for:
• taxable temporary differences that arise from initial recognition of an asset or liability in a transaction other than a businesscombination that at the time of the transaction affects neither accounting nor taxable profit or loss;
• temporary differences between the carrying amount and tax bases of investments in controlled entities where the parententity is able to control the timing of the reversal of the temporary differences and it is probable that the differences will notreverse in the foreseeable future; and
• taxable temporary differences arising from goodwill.
48
For
per
sona
l use
onl
y
Eclipx Group LimitedNotes to the Financial StatementsFor the year ended 30 September 2016(continued)
2.0 BUSINESS RESULT FOR THE YEAR (continued)2.6 Taxation (continued)
Deferred tax assets and liabilities are measured at the tax rates and tax laws that are expected to apply the year when theasset is utilised or liability is settled, based on tax rates and tax laws that have been enacted or substantively enacted at thereporting date.
Income taxes relating to items recognised directly in equity are recognised directly in equity and not in the statement of profit orloss and other comprehensive income.
Offsetting deferred tax balances
Deferred tax assets and liabilities are offset when they relate to income taxes levied by the same taxation authority and theGroup intends to settle its current tax assets and liabilities on a net basis.
Tax consolidation legislation
Eclipx Group Limited and its wholly owned Australian controlled entities are part of a tax-consolidated group under Australiantaxation law. Eclipx Group Limited is the head entity in the tax-consolidated group. Entities within the tax-consolidated grouphave entered into a tax funding arrangement and a tax sharing agreement with the head entity. Under the terms of the taxfunding arrangement, Eclipx Group Limited and each of the entities in the tax-consolidated group have agreed to pay (orreceive) a tax equivalent payment to (or from) the head entity, based on the current tax liability or current tax asset of the entity.
49
For
per
sona
l use
onl
y
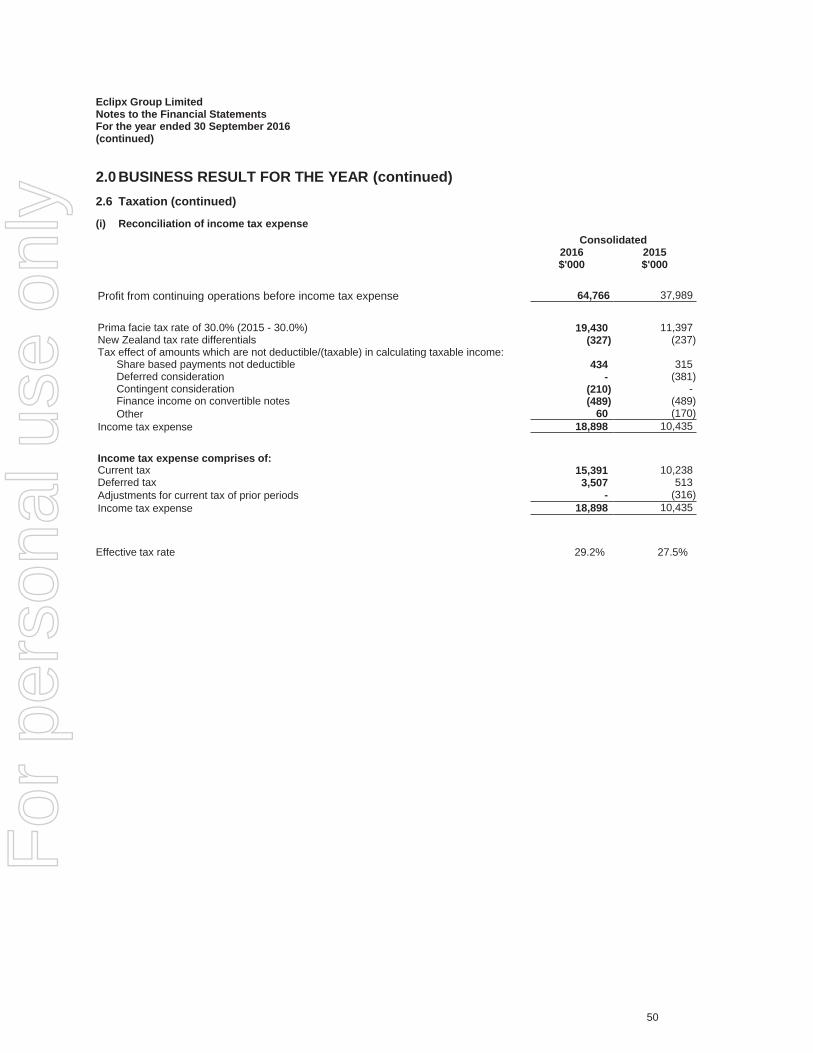
Eclipx Group LimitedNotes to the Financial StatementsFor the year ended 30 September 2016(continued)
2.0 BUSINESS RESULT FOR THE YEAR (continued)2.6 Taxation (continued)
(i) Reconciliation of income tax expenseConsolidated
2016$'000
2015$'000
Profit from continuing operations before income tax expense 64,766 37,989
Prima facie tax rate of 30.0% (2015 - 30.0%) 19,430 11,397New Zealand tax rate differentials (327) (237)Tax effect of amounts which are not deductible/(taxable) in calculating taxable income:
Share based payments not deductible 434 315Deferred consideration - (381)Contingent consideration (210) -Finance income on convertible notes (489) (489)Other 60 (170)
Income tax expense 18,898 10,435
Income tax expense comprises of:Current tax 15,391 10,238Deferred tax 3,507 513Adjustments for current tax of prior periods - (316)Income tax expense 18,898 10,435
45,868 27,554Effective tax rate 29.2% 27.5%
50
For
per
sona
l use
onl
y
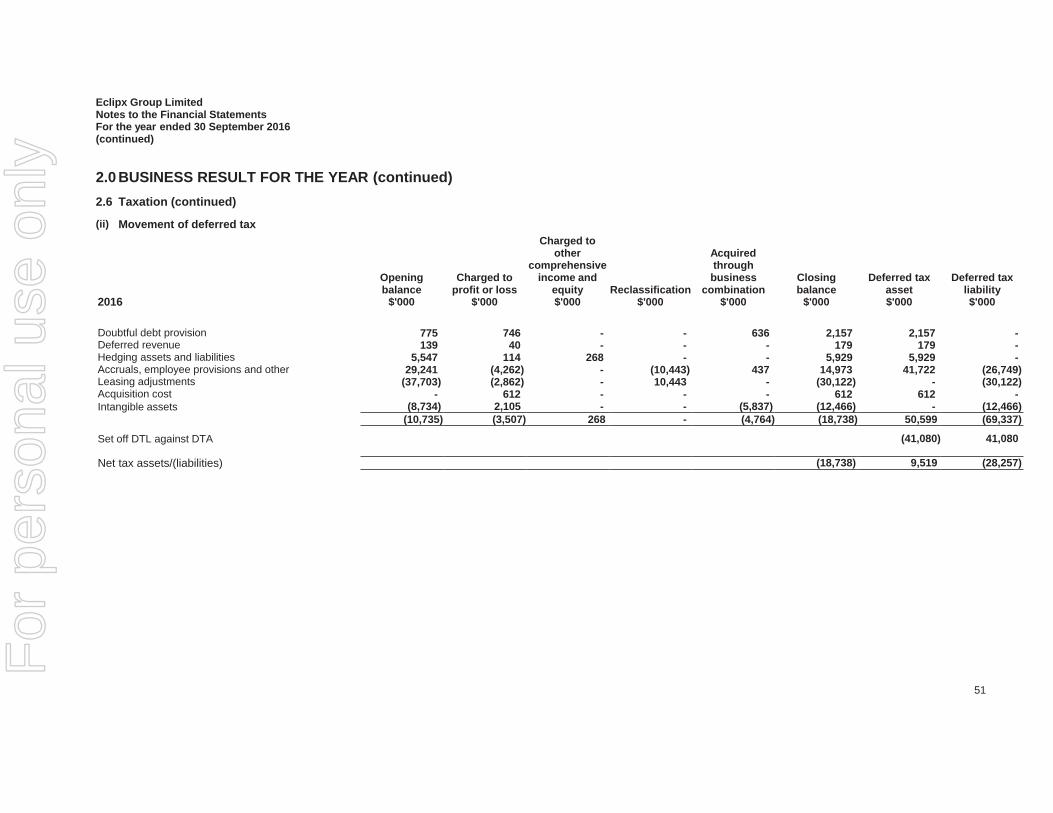
Eclipx Group LimitedNotes to the Financial StatementsFor the year ended 30 September 2016(continued)
2.0 BUSINESS RESULT FOR THE YEAR (continued)2.6 Taxation (continued)
(ii) Movement of deferred tax
2016
Openingbalance
$'000
Charged toprofit or loss
$'000
Charged toother
comprehensiveincome and
equity$'000
Reclassification$'000
Acquiredthroughbusiness
combination$'000
Closingbalance
$'000
Deferred taxasset$'000
Deferred taxliability$'000
Doubtful debt provision 775 746 - - 636 2,157 2,157 -Deferred revenue 139 40 - - - 179 179 -Hedging assets and liabilities 5,547 114 268 - - 5,929 5,929 -Accruals, employee provisions and other 29,241 (4,262) - (10,443) 437 14,973 41,722 (26,749)Leasing adjustments (37,703) (2,862) - 10,443 - (30,122) - (30,122)Acquisition cost - 612 - - - 612 612 -Intangible assets (8,734) 2,105 - - (5,837) (12,466) - (12,466)
(10,735) (3,507) 268 - (4,764) (18,738) 50,599 (69,337)
Set off DTL against DTA - - - - - - (41,080) 41,080
Net tax assets/(liabilities) (10,735) (3,507) 268 - (4,764) (18,738) 9,519 (28,257)
51
For
per
sona
l use
onl
y
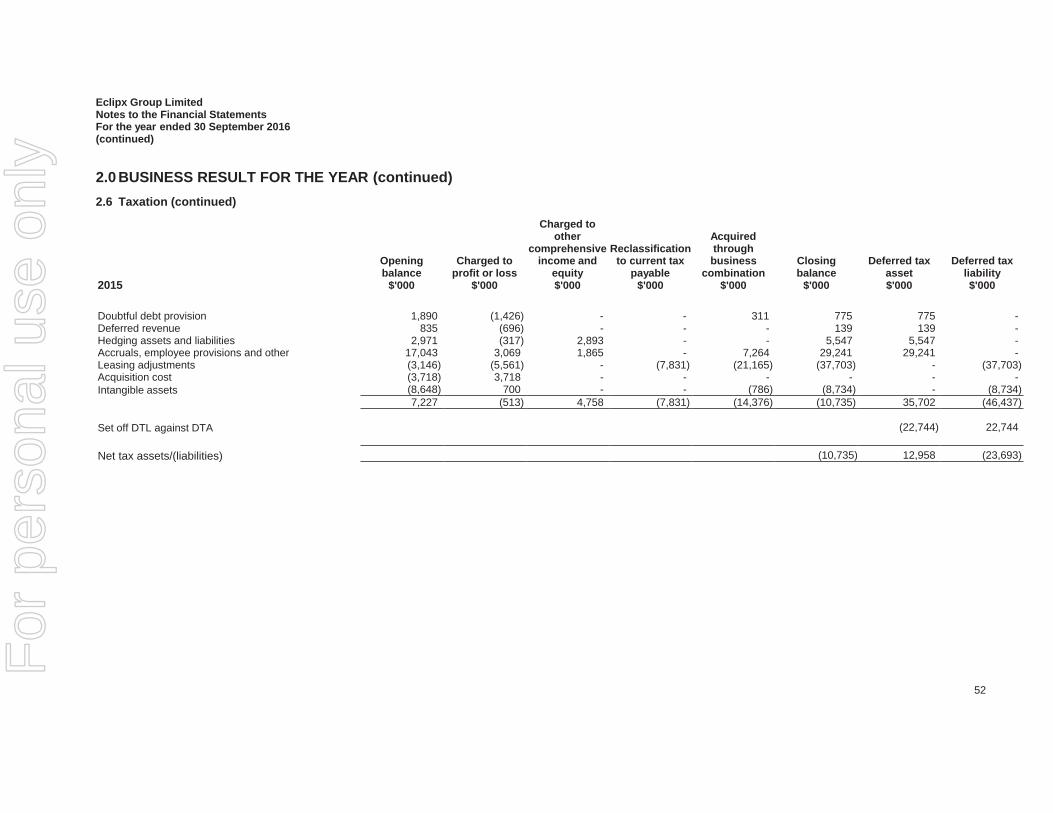
Eclipx Group LimitedNotes to the Financial StatementsFor the year ended 30 September 2016(continued)
2.0 BUSINESS RESULT FOR THE YEAR (continued)2.6 Taxation (continued)
2015
Openingbalance
$'000
Charged toprofit or loss
$'000
Charged toother
comprehensiveincome and
equity$'000
Reclassificationto current tax
payable$'000
Acquiredthroughbusiness
combination$'000
Closingbalance
$'000
Deferred taxasset$'000
Deferred taxliability$'000
Doubtful debt provision 1,890 (1,426) - - 311 775 775 -Deferred revenue 835 (696) - - - 139 139 -Hedging assets and liabilities 2,971 (317) 2,893 - - 5,547 5,547 -Accruals, employee provisions and other 17,043 3,069 1,865 - 7,264 29,241 29,241 -Leasing adjustments (3,146) (5,561) - (7,831) (21,165) (37,703) - (37,703)Acquisition cost (3,718) 3,718 - - - - - -Intangible assets (8,648) 700 - - (786) (8,734) - (8,734)
7,227 (513) 4,758 (7,831) (14,376) (10,735) 35,702 (46,437)
Set off DTL against DTA - - - - - - (22,744) 22,744
Net tax assets/(liabilities) 7,227 (513) 4,758 (7,831) (14,376) (10,735) 12,958 (23,693)
52
For
per
sona
l use
onl
y
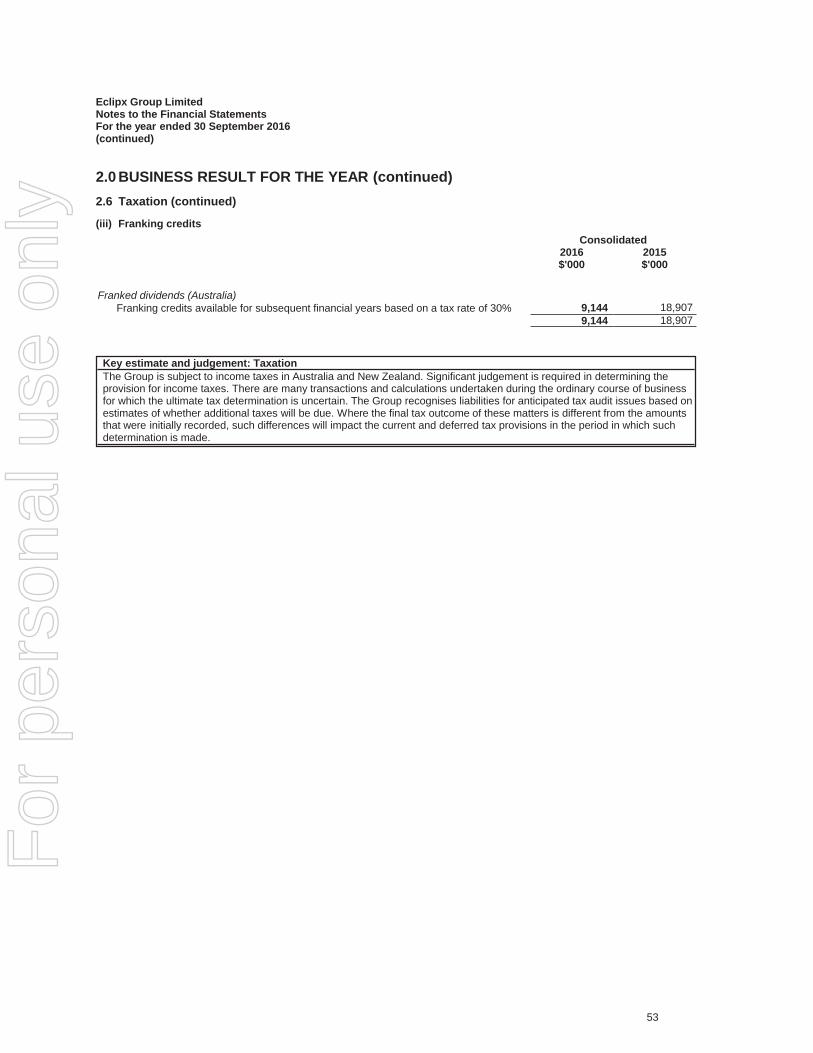
Eclipx Group LimitedNotes to the Financial StatementsFor the year ended 30 September 2016(continued)
2.0 BUSINESS RESULT FOR THE YEAR (continued)2.6 Taxation (continued)
(iii) Franking creditsConsolidated
2016$'000
2015$'000
Franked dividends (Australia)Franking credits available for subsequent financial years based on a tax rate of 30% 9,144 18,907
9,144 18,907
Key estimate and judgement: TaxationThe Group is subject to income taxes in Australia and New Zealand. Significant judgement is required in determining theprovision for income taxes. There are many transactions and calculations undertaken during the ordinary course of businessfor which the ultimate tax determination is uncertain. The Group recognises liabilities for anticipated tax audit issues based onestimates of whether additional taxes will be due. Where the final tax outcome of these matters is different from the amountsthat were initially recorded, such differences will impact the current and deferred tax provisions in the period in which suchdetermination is made.
53
For
per
sona
l use
onl
y
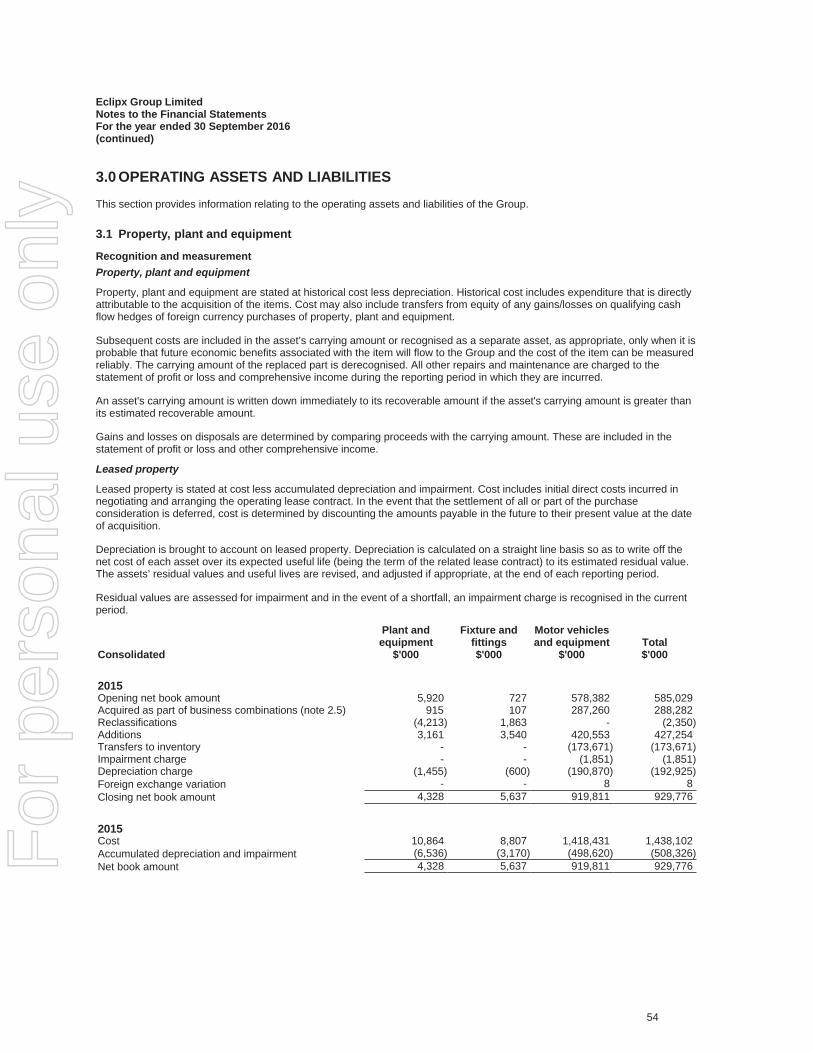
Eclipx Group LimitedNotes to the Financial StatementsFor the year ended 30 September 2016(continued)
3.0 OPERATING ASSETS AND LIABILITIES
This section provides information relating to the operating assets and liabilities of the Group.
3.1 Property, plant and equipment
Recognition and measurementProperty, plant and equipment
Property, plant and equipment are stated at historical cost less depreciation. Historical cost includes expenditure that is directlyattributable to the acquisition of the items. Cost may also include transfers from equity of any gains/losses on qualifying cashflow hedges of foreign currency purchases of property, plant and equipment.
Subsequent costs are included in the asset’s carrying amount or recognised as a separate asset, as appropriate, only when it isprobable that future economic benefits associated with the item will flow to the Group and the cost of the item can be measuredreliably. The carrying amount of the replaced part is derecognised. All other repairs and maintenance are charged to thestatement of profit or loss and comprehensive income during the reporting period in which they are incurred.
An asset's carrying amount is written down immediately to its recoverable amount if the asset's carrying amount is greater thanits estimated recoverable amount.
Gains and losses on disposals are determined by comparing proceeds with the carrying amount. These are included in thestatement of profit or loss and other comprehensive income.
Leased property
Leased property is stated at cost less accumulated depreciation and impairment. Cost includes initial direct costs incurred innegotiating and arranging the operating lease contract. In the event that the settlement of all or part of the purchaseconsideration is deferred, cost is determined by discounting the amounts payable in the future to their present value at the dateof acquisition.
Depreciation is brought to account on leased property. Depreciation is calculated on a straight line basis so as to write off thenet cost of each asset over its expected useful life (being the term of the related lease contract) to its estimated residual value.The assets’ residual values and useful lives are revised, and adjusted if appropriate, at the end of each reporting period.
Residual values are assessed for impairment and in the event of a shortfall, an impairment charge is recognised in the currentperiod.
Consolidated
Plant andequipment
$'000
Fixture andfittings$'000
Motor vehiclesand equipment
$'000Total$'000
2015Opening net book amount 5,920 727 578,382 585,029Acquired as part of business combinations (note 2.5) 915 107 287,260 288,282Reclassifications (4,213) 1,863 - (2,350)Additions 3,161 3,540 420,553 427,254Transfers to inventory - - (173,671) (173,671)Impairment charge - - (1,851) (1,851)Depreciation charge (1,455) (600) (190,870) (192,925)Foreign exchange variation - - 8 8Closing net book amount 4,328 5,637 919,811 929,776
2015Cost 10,864 8,807 1,418,431 1,438,102Accumulated depreciation and impairment (6,536) (3,170) (498,620) (508,326)Net book amount 4,328 5,637 919,811 929,776
54
For
per
sona
l use
onl
y
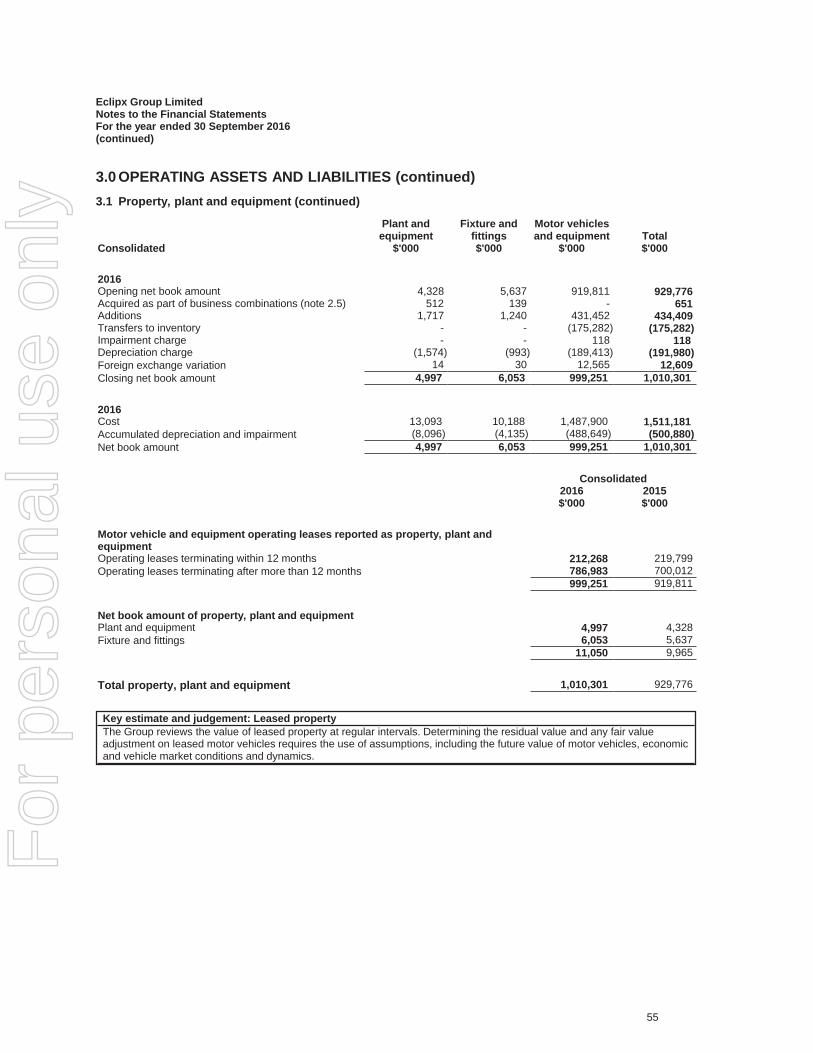
Eclipx Group LimitedNotes to the Financial StatementsFor the year ended 30 September 2016(continued)
3.0 OPERATING ASSETS AND LIABILITIES (continued)3.1 Property, plant and equipment (continued)
Consolidated
Plant andequipment
$'000
Fixture andfittings$'000
Motor vehiclesand equipment
$'000Total$'000
2016Opening net book amount 4,328 5,637 919,811 929,776Acquired as part of business combinations (note 2.5) 512 139 - 651Additions 1,717 1,240 431,452 434,409Transfers to inventory - - (175,282) (175,282)Impairment charge - - 118 118Depreciation charge (1,574) (993) (189,413) (191,980)Foreign exchange variation 14 30 12,565 12,609Closing net book amount 4,997 6,053 999,251 1,010,301
2016Cost 13,093 10,188 1,487,900 1,511,181Accumulated depreciation and impairment (8,096) (4,135) (488,649) (500,880)Net book amount 4,997 6,053 999,251 1,010,301
Consolidated2016$'000
2015$'000
Motor vehicle and equipment operating leases reported as property, plant andequipmentOperating leases terminating within 12 months 212,268 219,799Operating leases terminating after more than 12 months 786,983 700,012
999,251 919,811
Net book amount of property, plant and equipmentPlant and equipment 4,997 4,328Fixture and fittings 6,053 5,637
11,050 9,965
Total property, plant and equipment 1,010,301 929,776
Key estimate and judgement: Leased propertyThe Group reviews the value of leased property at regular intervals. Determining the residual value and any fair valueadjustment on leased motor vehicles requires the use of assumptions, including the future value of motor vehicles, economicand vehicle market conditions and dynamics.
55
For
per
sona
l use
onl
y
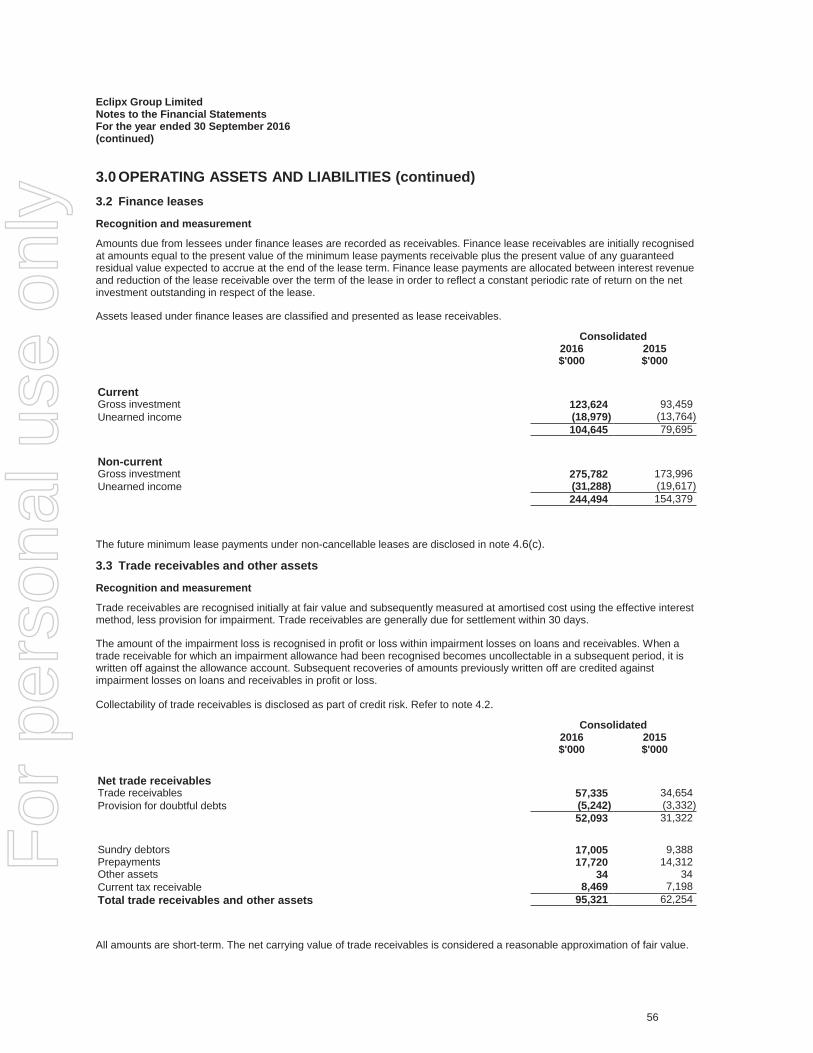
Eclipx Group LimitedNotes to the Financial StatementsFor the year ended 30 September 2016(continued)
3.0 OPERATING ASSETS AND LIABILITIES (continued)3.2 Finance leases
Recognition and measurement
Amounts due from lessees under finance leases are recorded as receivables. Finance lease receivables are initially recognisedat amounts equal to the present value of the minimum lease payments receivable plus the present value of any guaranteedresidual value expected to accrue at the end of the lease term. Finance lease payments are allocated between interest revenueand reduction of the lease receivable over the term of the lease in order to reflect a constant periodic rate of return on the netinvestment outstanding in respect of the lease.
Assets leased under finance leases are classified and presented as lease receivables.
Consolidated2016$'000
2015$'000
CurrentGross investment 123,624 93,459Unearned income (18,979) (13,764)
104,645 79,695
Non-currentGross investment 275,782 173,996Unearned income (31,288) (19,617)
244,494 154,379
The future minimum lease payments under non-cancellable leases are disclosed in note 4.6(c).
3.3 Trade receivables and other assets
Recognition and measurement
Trade receivables are recognised initially at fair value and subsequently measured at amortised cost using the effective interestmethod, less provision for impairment. Trade receivables are generally due for settlement within 30 days.
The amount of the impairment loss is recognised in profit or loss within impairment losses on loans and receivables. When atrade receivable for which an impairment allowance had been recognised becomes uncollectable in a subsequent period, it iswritten off against the allowance account. Subsequent recoveries of amounts previously written off are credited againstimpairment losses on loans and receivables in profit or loss.
Collectability of trade receivables is disclosed as part of credit risk. Refer to note 4.2.
Consolidated2016$'000
2015$'000
Net trade receivablesTrade receivables 57,335 34,654Provision for doubtful debts (5,242) (3,332)
52,093 31,322
Sundry debtors 17,005 9,388Prepayments 17,720 14,312Other assets 34 34Current tax receivable 8,469 7,198Total trade receivables and other assets 95,321 62,254
All amounts are short-term. The net carrying value of trade receivables is considered a reasonable approximation of fair value.
56
For
per
sona
l use
onl
y
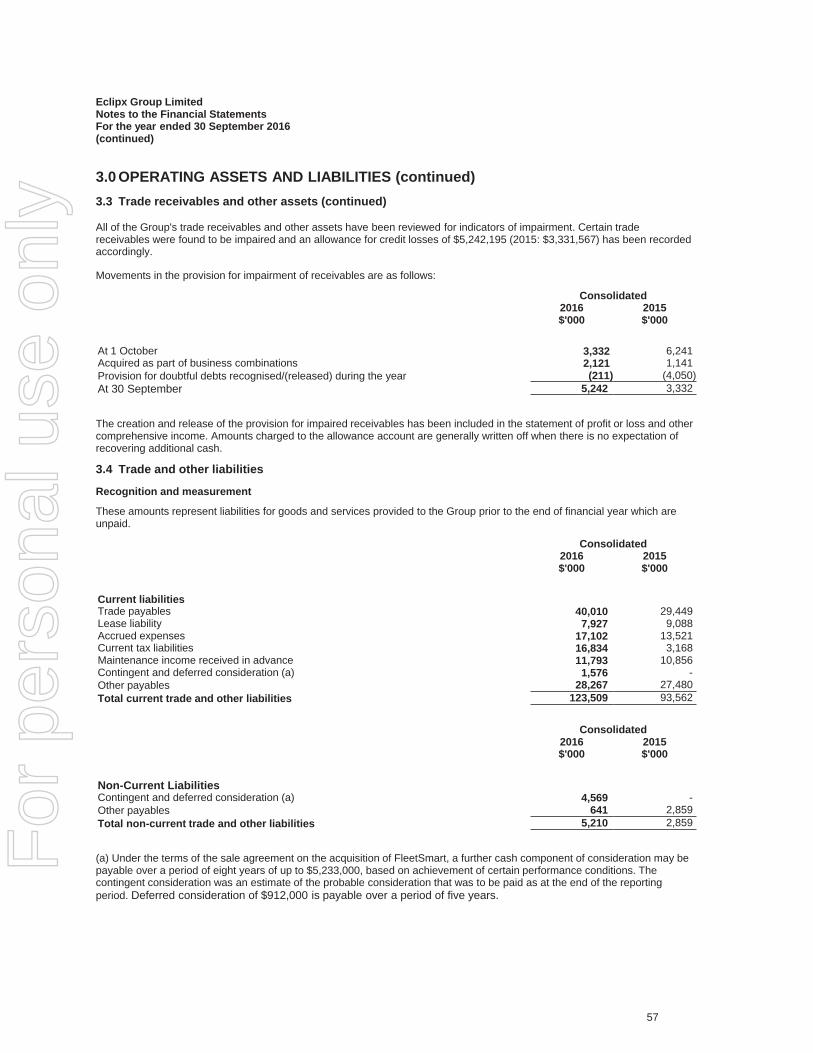
Eclipx Group LimitedNotes to the Financial StatementsFor the year ended 30 September 2016(continued)
3.0 OPERATING ASSETS AND LIABILITIES (continued)3.3 Trade receivables and other assets (continued)
All of the Group's trade receivables and other assets have been reviewed for indicators of impairment. Certain tradereceivables were found to be impaired and an allowance for credit losses of $5,242,195 (2015: $3,331,567) has been recordedaccordingly.
Movements in the provision for impairment of receivables are as follows:
Consolidated2016$'000
2015$'000
At 1 October 3,332 6,241Acquired as part of business combinations 2,121 1,141Provision for doubtful debts recognised/(released) during the year (211) (4,050)At 30 September 5,242 3,332
The creation and release of the provision for impaired receivables has been included in the statement of profit or loss and othercomprehensive income. Amounts charged to the allowance account are generally written off when there is no expectation ofrecovering additional cash.
3.4 Trade and other liabilities
Recognition and measurement
These amounts represent liabilities for goods and services provided to the Group prior to the end of financial year which areunpaid.
Consolidated2016$'000
2015$'000
Current liabilitiesTrade payables 40,010 29,449Lease liability 7,927 9,088Accrued expenses 17,102 13,521Current tax liabilities 16,834 3,168Maintenance income received in advance 11,793 10,856Contingent and deferred consideration (a) 1,576 -Other payables 28,267 27,480Total current trade and other liabilities 123,509 93,562
Consolidated2016$'000
2015$'000
Non-Current LiabilitiesContingent and deferred consideration (a) 4,569 -Other payables 641 2,859Total non-current trade and other liabilities 5,210 2,859
(a) Under the terms of the sale agreement on the acquisition of FleetSmart, a further cash component of consideration may bepayable over a period of eight years of up to $5,233,000, based on achievement of certain performance conditions. Thecontingent consideration was an estimate of the probable consideration that was to be paid as at the end of the reportingperiod. Deferred consideration of $912,000 is payable over a period of five years.
57
For
per
sona
l use
onl
y
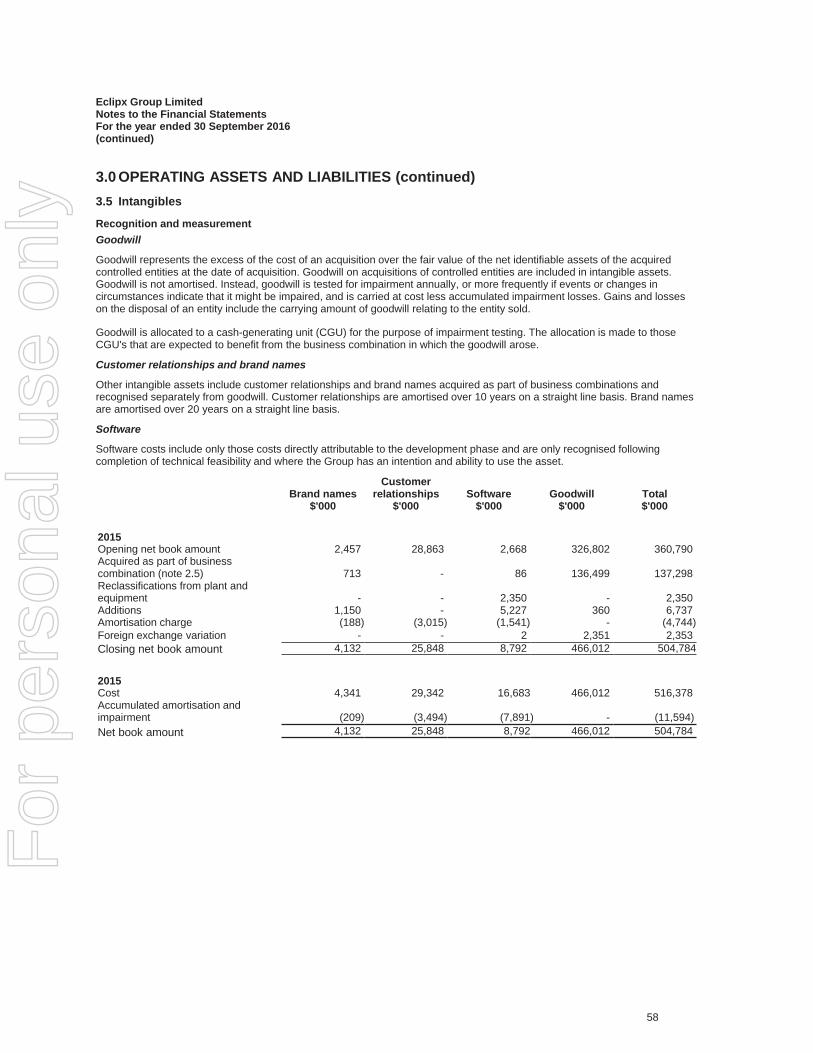
Eclipx Group LimitedNotes to the Financial StatementsFor the year ended 30 September 2016(continued)
3.0 OPERATING ASSETS AND LIABILITIES (continued)3.5 Intangibles
Recognition and measurementGoodwill
Goodwill represents the excess of the cost of an acquisition over the fair value of the net identifiable assets of the acquiredcontrolled entities at the date of acquisition. Goodwill on acquisitions of controlled entities are included in intangible assets.Goodwill is not amortised. Instead, goodwill is tested for impairment annually, or more frequently if events or changes incircumstances indicate that it might be impaired, and is carried at cost less accumulated impairment losses. Gains and losseson the disposal of an entity include the carrying amount of goodwill relating to the entity sold.
Goodwill is allocated to a cash-generating unit (CGU) for the purpose of impairment testing. The allocation is made to thoseCGU's that are expected to benefit from the business combination in which the goodwill arose.
Customer relationships and brand names
Other intangible assets include customer relationships and brand names acquired as part of business combinations andrecognised separately from goodwill. Customer relationships are amortised over 10 years on a straight line basis. Brand namesare amortised over 20 years on a straight line basis.
Software
Software costs include only those costs directly attributable to the development phase and are only recognised followingcompletion of technical feasibility and where the Group has an intention and ability to use the asset.
Brand names$'000
Customerrelationships
$'000Software
$'000Goodwill
$'000Total$'000
2015Opening net book amount 2,457 28,863 2,668 326,802 360,790Acquired as part of businesscombination (note 2.5) 713 - 86 136,499 137,298Reclassifications from plant andequipment - - 2,350 - 2,350Additions 1,150 - 5,227 360 6,737Amortisation charge (188) (3,015) (1,541) - (4,744)Foreign exchange variation - - 2 2,351 2,353Closing net book amount 4,132 25,848 8,792 466,012 504,784
2015Cost 4,341 29,342 16,683 466,012 516,378Accumulated amortisation andimpairment (209) (3,494) (7,891) - (11,594)Net book amount 4,132 25,848 8,792 466,012 504,784
58
For
per
sona
l use
onl
y
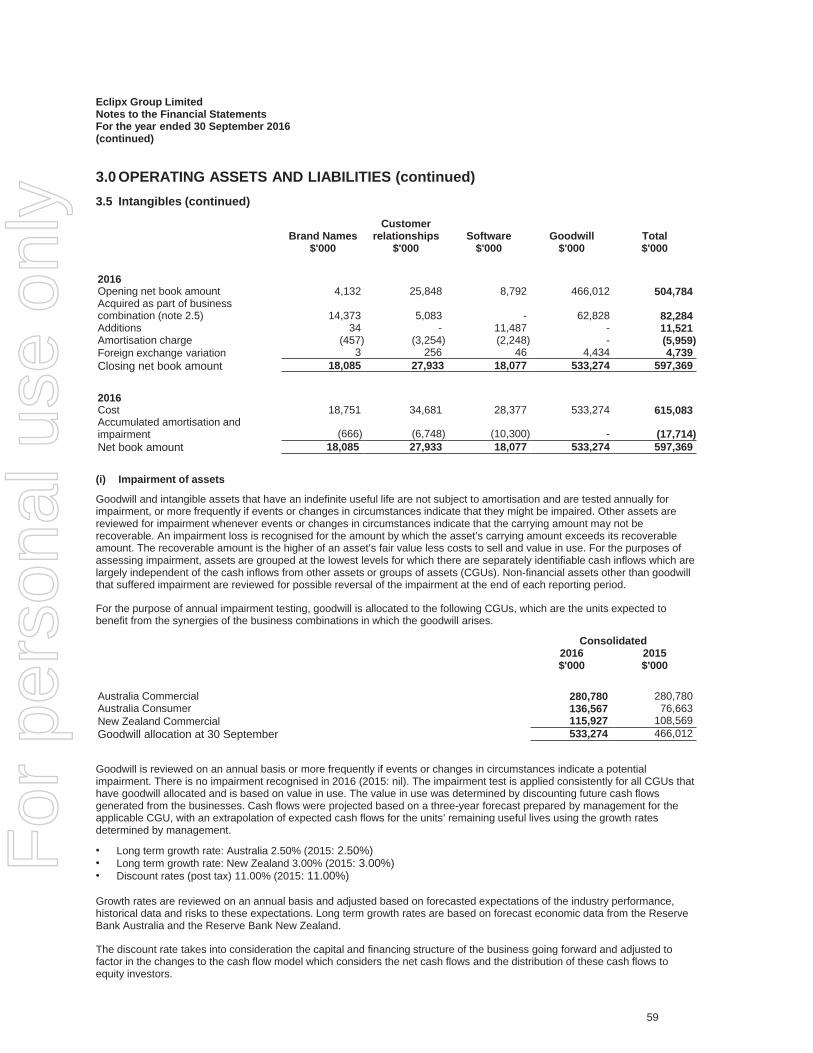
Eclipx Group LimitedNotes to the Financial StatementsFor the year ended 30 September 2016(continued)
3.0 OPERATING ASSETS AND LIABILITIES (continued)3.5 Intangibles (continued)
Brand Names$'000
Customerrelationships
$'000Software
$'000Goodwill
$'000Total$'000
2016Opening net book amount 4,132 25,848 8,792 466,012 504,784Acquired as part of businesscombination (note 2.5) 14,373 5,083 - 62,828 82,284Additions 34 - 11,487 - 11,521Amortisation charge (457) (3,254) (2,248) - (5,959)Foreign exchange variation 3 256 46 4,434 4,739Closing net book amount 18,085 27,933 18,077 533,274 597,369
2016Cost 18,751 34,681 28,377 533,274 615,083Accumulated amortisation andimpairment (666) (6,748) (10,300) - (17,714)Net book amount 18,085 27,933 18,077 533,274 597,369
(i) Impairment of assets
Goodwill and intangible assets that have an indefinite useful life are not subject to amortisation and are tested annually forimpairment, or more frequently if events or changes in circumstances indicate that they might be impaired. Other assets arereviewed for impairment whenever events or changes in circumstances indicate that the carrying amount may not berecoverable. An impairment loss is recognised for the amount by which the asset’s carrying amount exceeds its recoverableamount. The recoverable amount is the higher of an asset’s fair value less costs to sell and value in use. For the purposes ofassessing impairment, assets are grouped at the lowest levels for which there are separately identifiable cash inflows which arelargely independent of the cash inflows from other assets or groups of assets (CGUs). Non-financial assets other than goodwillthat suffered impairment are reviewed for possible reversal of the impairment at the end of each reporting period.
For the purpose of annual impairment testing, goodwill is allocated to the following CGUs, which are the units expected tobenefit from the synergies of the business combinations in which the goodwill arises.
Consolidated2016$'000
2015$'000
Australia Commercial 280,780 280,780Australia Consumer 136,567 76,663New Zealand Commercial 115,927 108,569Goodwill allocation at 30 September 533,274 466,012
Goodwill is reviewed on an annual basis or more frequently if events or changes in circumstances indicate a potentialimpairment. There is no impairment recognised in 2016 (2015: nil). The impairment test is applied consistently for all CGUs thathave goodwill allocated and is based on value in use. The value in use was determined by discounting future cash flowsgenerated from the businesses. Cash flows were projected based on a three-year forecast prepared by management for theapplicable CGU, with an extrapolation of expected cash flows for the units’ remaining useful lives using the growth ratesdetermined by management.
• Long term growth rate: Australia 2.50% (2015: 2.50%)• Long term growth rate: New Zealand 3.00% (2015: 3.00%)• Discount rates (post tax) 11.00% (2015: 11.00%)
Growth rates are reviewed on an annual basis and adjusted based on forecasted expectations of the industry performance,historical data and risks to these expectations. Long term growth rates are based on forecast economic data from the ReserveBank Australia and the Reserve Bank New Zealand.
The discount rate takes into consideration the capital and financing structure of the business going forward and adjusted tofactor in the changes to the cash flow model which considers the net cash flows and the distribution of these cash flows toequity investors.
59
For
per
sona
l use
onl
y
Eclipx Group LimitedNotes to the Financial StatementsFor the year ended 30 September 2016(continued)
3.0 OPERATING ASSETS AND LIABILITIES (continued)3.5 Intangibles (continued)
Key estimate and judgement: Impairment of assetsThe Group tests annually whether goodwill has suffered any impairment. The recoverable amounts of cash-generating unitshave been determined based on value-in-use calculations. These calculations require the use of assumptions.
60
For
per
sona
l use
onl
y
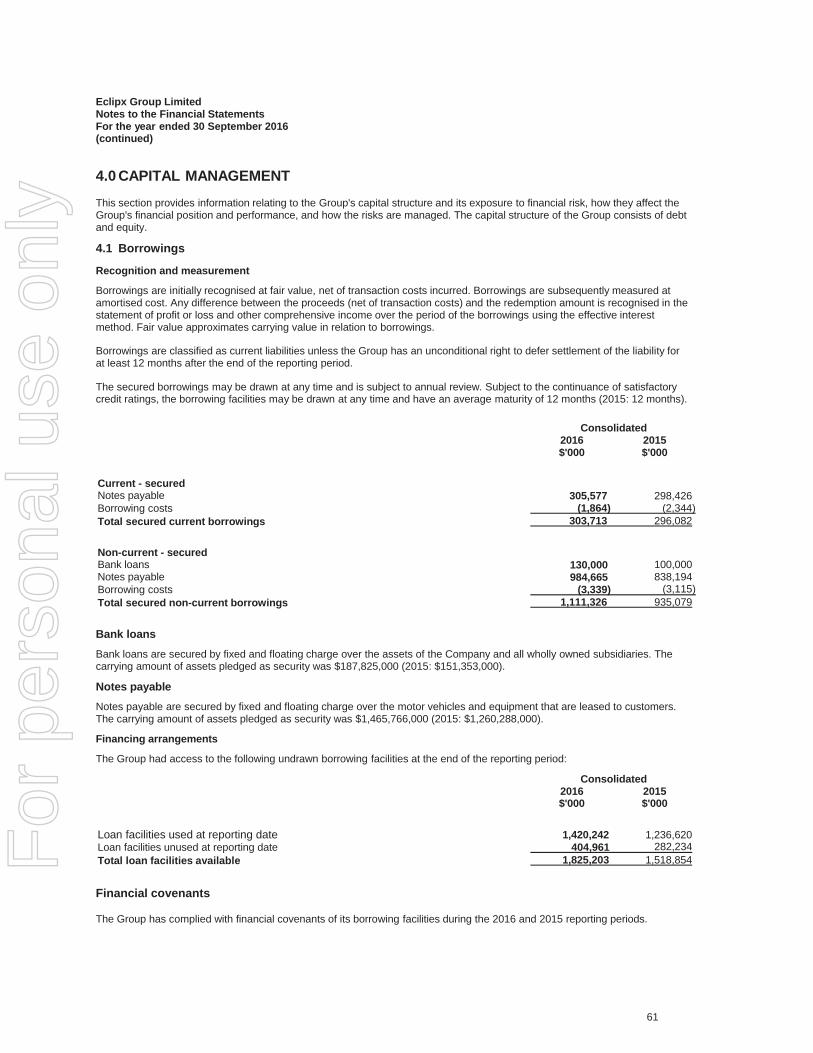
Eclipx Group LimitedNotes to the Financial StatementsFor the year ended 30 September 2016 (continued)
61
4.0 CAPITAL MANAGEMENT
This section provides information relating to the Group's capital structure and its exposure to financial risk, how they affect the Group's financial position and performance, and how the risks are managed. The capital structure of the Group consists of debt and equity.
4.1 Borrowings
Recognition and measurement
Borrowings are initially recognised at fair value, net of transaction costs incurred. Borrowings are subsequently measured at amortised cost. Any difference between the proceeds (net of transaction costs) and the redemption amount is recognised in the statement of profit or loss and other comprehensive income over the period of the borrowings using the effective interest method. Fair value approximates carrying value in relation to borrowings.
Borrowings are classified as current liabilities unless the Group has an unconditional right to defer settlement of the liability for at least 12 months after the end of the reporting period.
The secured borrowings may be drawn at any time and is subject to annual review. Subject to the continuance of satisfactory credit ratings, the borrowing facilities may be drawn at any time and have an average maturity of 12 months (2015: 12 months).
Consolidated2016$'000
2015$'000
Current - securedNotes payable 305,577 298,426 Borrowing costs (1,864) (2,344)Total secured current borrowings 303,713 296,082
Non-current - securedBank loans 130,000 100,000Notes payable 984,665 838,194Borrowing costs (3,339) (3,115)Total secured non-current borrowings 1,111,326 935,079
Bank loansBank loans are secured by fixed and floating charge over the assets of the Company and all wholly owned subsidiaries. The carrying amount of assets pledged as security was $187,825,000 (2015: $151,353,000).
Notes payableNotes payable are secured by fixed and floating charge over the motor vehicles and equipment that are leased to customers. The carrying amount of assets pledged as security was $1,465,766,000 (2015: $1,260,288,000).
Financing arrangements
The Group had access to the following undrawn borrowing facilities at the end of the reporting period:
Consolidated2016$'000
2015$'000
Loan facilities used at reporting date 1,420,242 1,236,620 Loan facilities unused at reporting date 404,961 282,234Total loan facilities available 1,825,203 1,518,854
Financial covenants
The Group has complied with financial covenants of its borrowing facilities during the 2016 and 2015 reporting periods.
For
per
sona
l use
onl
y
Eclipx Group LimitedNotes to the Financial StatementsFor the year ended 30 September 2016(continued)
4.0 CAPITAL MANAGEMENT (continued)4.2 Financial risk management
This note explains the Group’s exposure to financial risks and how these risks could affect the Group’s future financialperformance. Current year profit or loss information has been included where relevant to add further context.
Risk management
The Group's capital management objectives are to:
• ensure the Group's ability to continue as a going concern; and
• provide an adequate return to shareholders,
by pricing products and services commensurately with the level of risk.
The Group monitors capital on the basis of the carrying amount of equity plus its subordinated loan, less cash and cashequivalents as presented on the face of the statement of financial position and cash flow hedges recognised in othercomprehensive income.
Management assesses the Group’s capital requirements in order to maintain an efficient overall financing structure whilstavoiding excessive leverage. This takes into account the subordination levels of the Group’s various classes of debt. The Groupmanages the capital structure and makes adjustments to it in the light of changes in economic conditions and the riskcharacteristics of the underlying assets. In order to maintain or adjust the capital structure, the Group may adjust the amount ofdividends paid to shareholders, return capital to shareholders, issue new shares, or sell assets to reduce debt.
Consolidated2016$'000
2015$'000
aNet debt 1,236,741 1,066,596Total equity 658,815 552,122Capital-to-overall financing ratio 53% 52%
62
For
per
sona
l use
onl
y
Eclipx Group LimitedNotes to the Financial StatementsFor the year ended 30 September 2016(continued)
4.0 CAPITAL MANAGEMENT (continued)4.2 Financial risk management (continued)
Market risk(i) Foreign exchange risk
The Group operates internationally and is exposed to foreign exchange risk arising from various currency exposures, primarilywith respect to the New Zealand dollar.
Foreign exchange risk arises from future commercial transactions and recognised assets and liabilities denominated in acurrency that is not the entity’s functional currency and net investments in foreign operations. The Group manages itsexposures to the New Zealand dollar by ensuring that its assets and liabilities in New Zealand are predominantly in NewZealand dollars.
For sensitivity measurement purposes, a +/- 10% (2015:10%) sensitivity in foreign exchange rates to the Australian dollar hasbeen selected as this is considered realistic given the current levels of exchange rates, the recent levels of volatility and marketexpectations for future movements in exchange rates. Based on the financial instruments held at 30 September 2016, had theAustralian dollar weakened/strengthened by 10% (2015:10%) against the New Zealand dollar compared to year-end rates, withother variables held constant, the consolidated entity’s after-tax profits for the year and equity would have been $1,159,074(2015: $836,848) higher/lower, as a result of exposure to exchange rate fluctuations of foreign currency operations. All foreignexchange risk is due to the translation of the New Zealand entities on consolidation.
(ii) Interest rate risk2016 2015
Weightedaverage
interest rate%
Balance$'000
Weightedaverage
interest rate%
Balance$'000
Borrowings 4.011% 1,415,039 4.563% 1,231,160Interest rate swaps (notional principal amount) 2.900% (1,263,911) 3.108% (1,174,786)Unhedged variable debt 151,128 56,374
63
For
per
sona
l use
onl
y
Eclipx Group LimitedNotes to the Financial StatementsFor the year ended 30 September 2016(continued)
4.0 CAPITAL MANAGEMENT (continued)4.2 Financial risk management (continued)
Interest rate sensitivity analysis
The sensitivity analysis below has been determined based on the exposure to interest rates at the reporting date and assumingthat the rate change occurs at the beginning of the financial year and is then held constant throughout the reporting period.
The selected basis points (bps) increase or decrease represents the Group’s assessment of the possible change in interestrates. A positive number indicates a before-tax increase in profit and equity and a negative number indicates a before-taxdecrease in profit and equity.
Sensitivities have been based on an increase in interest rates by 100 bps (2015: 100 bps) and a decrease by 100 bps (2015:100 bps) across the yield curve.
2016 Interest rate riskCarryingamount
$'000
-100 bpsProfit/equity
$'000
+100 bpsProfit/equity
$'000
Financial assetsCash and cash equivalents 178,298 (1,783) 1,783Finance leases- Fixed interest rate 349,139 - -Total (decrease)/increase 527,437 (1,783) 1,783
Financial liabilitiesBorrowings- Floating rate 1,415,039 14,150 (14,150)Payables 128,719 - -Derivatives used for hedging 20,700 (11,596) 3,431Total increase/(decrease) 1,564,458 2,554 (10,719)
2015 Interest rate riskCarryingamount
$'000
-100 bpsProfit/ Equity
$'000
+100 bpsProfit/ Equity
$'000
Financial assetsCash and cash equivalents 164,565 (1,646) 1,646Finance leases- Fixed interest rate 234,074 - -Total (decrease)/increase 398,639 (1,646) 1,646
Financial liabilitiesBorrowings- Floating rate 1,231,160 12,312 (12,312)Payables 96,422 - -Derivatives used for hedging 18,835 (10,024) 9,069Total increase/(decrease) 1,346,417 2,288 (3,243)
Credit risk
Collectability of trade receivables is reviewed on an ongoing basis. Debts which are known to be uncollectible are written off byreducing the carrying amount directly. An allowance account (provision for impairment of trade receivables) is used when thereis objective evidence that the Group will not be able to collect all amounts due according to the original terms of the receivables.Significant financial difficulties of the debtor, probability that the debtor will enter bankruptcy or financial reorganisation, anddefault or delinquency in payments are considered indicators that the trade receivable is impaired. For amounts due underleases, delinquency would be for amounts more than 30 days overdue. Receivables due under credit hire have differentindicators for impairment due to the nature of the product. The amount of the impairment allowance is the difference betweenthe asset’s carrying amount and the present value of estimated future cash flows, discounted at the original effective interestrate.
64
For
per
sona
l use
onl
y
Eclipx Group LimitedNotes to the Financial StatementsFor the year ended 30 September 2016(continued)
4.0 CAPITAL MANAGEMENT (continued)4.2 Financial risk management (continued)
The credit quality of financial assets is managed by the Group using internal indicators based on their current probability ofdefault. These indicators are compared to market benchmarks to enable wider comparisons.
Finance leases are secured against individual assets. The carrying values of the assets held as security approximate thewritten down value of the finance leases.
Consolidated2016$'000
2015$'000
Unimpaired past due loans and receivablesPast due under 30 days 7,887 5,165Unimpaired past due loans and receivablesPast due 30 days to under 60 days 4,418 2,004Past due 60 days to under 90 days 2,852 92Past due 90 days and over 8,479 199Total unimpaired past due loans and receivables 23,636 7,460Total unimpaired loans and receivables 52,093 31,322Unimpaired past due as a percentage of total unimpaired loans and receivables 45% 24%Unimpaired past due 30 days and over as a percentage of total unimpaired loans andreceivables 30% 7%
2016 includes trade receivables associated with the newly acquired credit hire business, Right2Drive. The credit hire businesslooks to recover costs from the party at fault or their insurance company. The ageing of credit hire receivables would, by itsnature, be materially higher than non-credit hire receivables. The period of ageing is not the main characteristic that defines animpairment for credit hire.
Liquidity risk
Prudent liquidity risk management implies maintaining sufficient cash and marketable securities and the availability of fundingthrough an adequate amount of committed credit facilities to meet obligations when due and to close out market positions. Tomitigate against liquidity risk, the Group maintains cash reserves and committed undrawn credit facilities to meet anticipatedfunding requirements for new business. In addition, the Group can redraw against its committed credit limits if the principaloutstanding is reduced by the contractual amortisation payments. Details of unused available loan facilities are set out in note4.1.
Management monitors rolling forecasts of the Group’s liquidity reserve (comprising the undrawn borrowing facilities) and cashand cash equivalents on the basis of expected cash flows. In addition, the Group’s liquidity management policy involvesprojecting cash flows and considering the level of liquid assets necessary to meet these, monitoring balance sheet liquidityratios against internal and external regulatory requirements and maintaining debt financing plans.
Amounts due to funders are repaid directly by rental and repayments received from the Group’s customers.
The table below analyses the Group’s contractual financial liabilities into relevant maturity groupings. The amounts disclosedbelow are the contractual undiscounted cash flow. Balances due within 12 months equal their carrying balances as the impactof discounting is not significant. For interest rate swaps, the cash flows have been estimated using forward interest ratesapplicable at the end of the reporting period.
65
For
per
sona
l use
onl
y
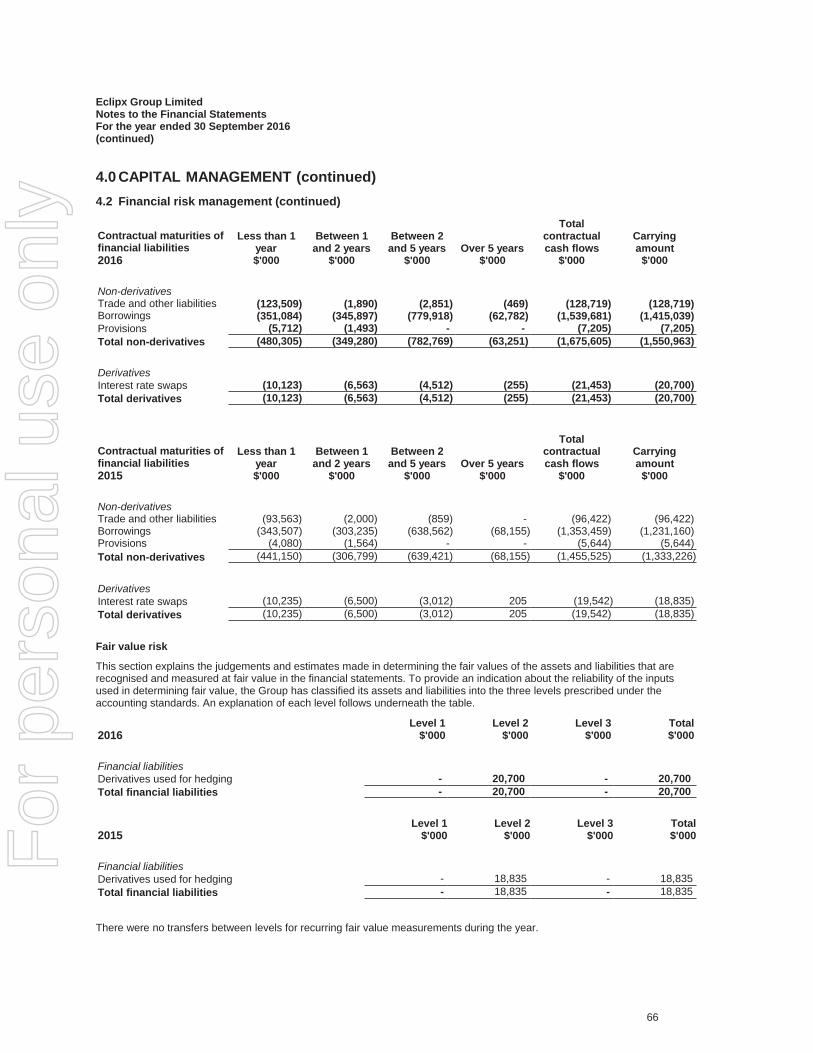
Eclipx Group LimitedNotes to the Financial StatementsFor the year ended 30 September 2016(continued)
4.0 CAPITAL MANAGEMENT (continued)4.2 Financial risk management (continued)
Contractual maturities offinancial liabilities2016
Less than 1year$'000
Between 1and 2 years
$'000
Between 2and 5 years
$'000Over 5 years
$'000
Totalcontractualcash flows
$'000
Carryingamount
$'000
Non-derivativesTrade and other liabilities (123,509) (1,890) (2,851) (469) (128,719) (128,719)Borrowings (351,084) (345,897) (779,918) (62,782) (1,539,681) (1,415,039)Provisions (5,712) (1,493) - - (7,205) (7,205)Total non-derivatives (480,305) (349,280) (782,769) (63,251) (1,675,605) (1,550,963)
DerivativesInterest rate swaps (10,123) (6,563) (4,512) (255) (21,453) (20,700)Total derivatives (10,123) (6,563) (4,512) (255) (21,453) (20,700)
Contractual maturities offinancial liabilities2015
Less than 1year$'000
Between 1and 2 years
$'000
Between 2and 5 years
$'000Over 5 years
$'000
Totalcontractualcash flows
$'000
Carryingamount
$'000
Non-derivativesTrade and other liabilities (93,563) (2,000) (859) - (96,422) (96,422)Borrowings (343,507) (303,235) (638,562) (68,155) (1,353,459) (1,231,160)Provisions (4,080) (1,564) - - (5,644) (5,644)Total non-derivatives (441,150) (306,799) (639,421) (68,155) (1,455,525) (1,333,226)
DerivativesInterest rate swaps (10,235) (6,500) (3,012) 205 (19,542) (18,835)Total derivatives (10,235) (6,500) (3,012) 205 (19,542) (18,835)
Fair value risk
This section explains the judgements and estimates made in determining the fair values of the assets and liabilities that arerecognised and measured at fair value in the financial statements. To provide an indication about the reliability of the inputsused in determining fair value, the Group has classified its assets and liabilities into the three levels prescribed under theaccounting standards. An explanation of each level follows underneath the table.
2016Level 1
$'000Level 2
$'000Level 3
$'000Total$'000
Financial liabilitiesDerivatives used for hedging - 20,700 - 20,700Total financial liabilities - 20,700 - 20,700
2015Level 1
$'000Level 2
$'000Level 3
$'000Total$'000
Financial liabilitiesDerivatives used for hedging - 18,835 - 18,835Total financial liabilities - 18,835 - 18,835
There were no transfers between levels for recurring fair value measurements during the year.
66
For
per
sona
l use
onl
y
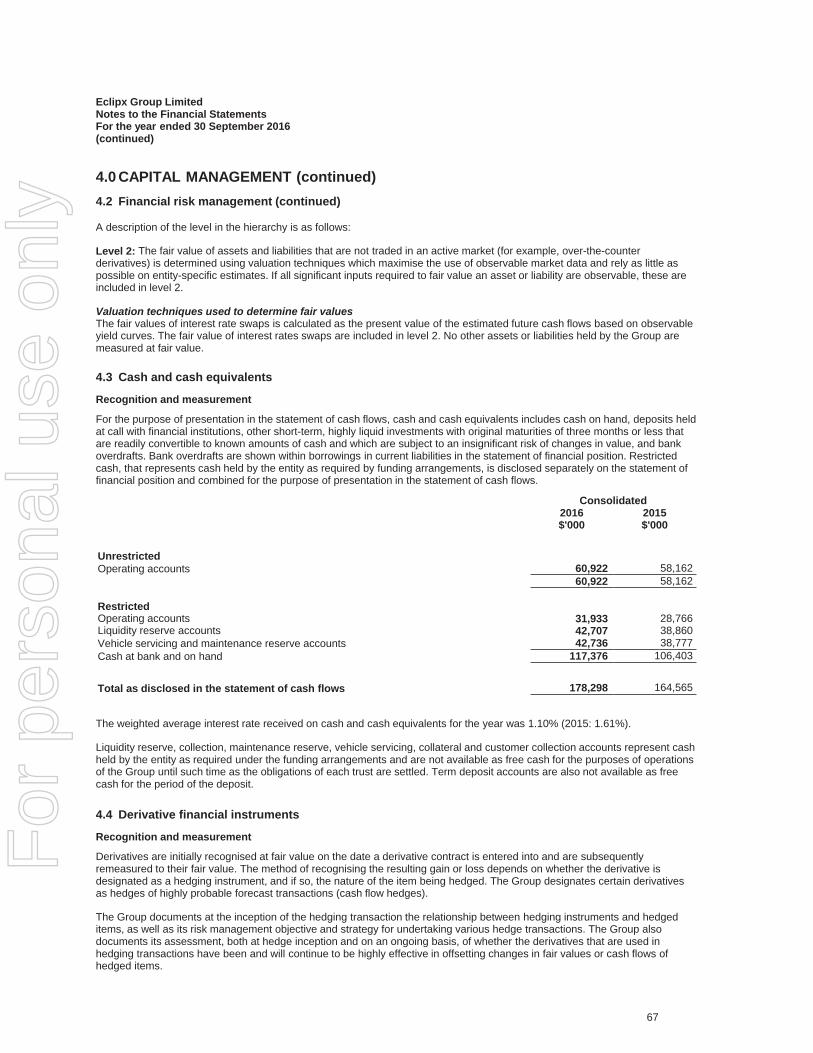
Eclipx Group LimitedNotes to the Financial StatementsFor the year ended 30 September 2016(continued)
4.0 CAPITAL MANAGEMENT (continued)4.2 Financial risk management (continued)
A description of the level in the hierarchy is as follows:
Level 2: The fair value of assets and liabilities that are not traded in an active market (for example, over-the-counterderivatives) is determined using valuation techniques which maximise the use of observable market data and rely as little aspossible on entity-specific estimates. If all significant inputs required to fair value an asset or liability are observable, these areincluded in level 2.
Valuation techniques used to determine fair valuesThe fair values of interest rate swaps is calculated as the present value of the estimated future cash flows based on observableyield curves. The fair value of interest rates swaps are included in level 2. No other assets or liabilities held by the Group aremeasured at fair value.
4.3 Cash and cash equivalents
Recognition and measurement
For the purpose of presentation in the statement of cash flows, cash and cash equivalents includes cash on hand, deposits heldat call with financial institutions, other short-term, highly liquid investments with original maturities of three months or less thatare readily convertible to known amounts of cash and which are subject to an insignificant risk of changes in value, and bankoverdrafts. Bank overdrafts are shown within borrowings in current liabilities in the statement of financial position. Restrictedcash, that represents cash held by the entity as required by funding arrangements, is disclosed separately on the statement offinancial position and combined for the purpose of presentation in the statement of cash flows.
Consolidated2016$'000
2015$'000
UnrestrictedOperating accounts 60,922 58,162
60,922 58,1621RestrictedOperating accounts 31,933 28,766Liquidity reserve accounts 42,707 38,860Vehicle servicing and maintenance reserve accounts 42,736 38,777Cash at bank and on hand 117,376 106,403
Total as disclosed in the statement of cash flows 178,298 164,565
The weighted average interest rate received on cash and cash equivalents for the year was 1.10% (2015: 1.61%).
Liquidity reserve, collection, maintenance reserve, vehicle servicing, collateral and customer collection accounts represent cashheld by the entity as required under the funding arrangements and are not available as free cash for the purposes of operationsof the Group until such time as the obligations of each trust are settled. Term deposit accounts are also not available as freecash for the period of the deposit.
4.4 Derivative financial instruments
Recognition and measurement
Derivatives are initially recognised at fair value on the date a derivative contract is entered into and are subsequentlyremeasured to their fair value. The method of recognising the resulting gain or loss depends on whether the derivative isdesignated as a hedging instrument, and if so, the nature of the item being hedged. The Group designates certain derivativesas hedges of highly probable forecast transactions (cash flow hedges).
The Group documents at the inception of the hedging transaction the relationship between hedging instruments and hedgeditems, as well as its risk management objective and strategy for undertaking various hedge transactions. The Group alsodocuments its assessment, both at hedge inception and on an ongoing basis, of whether the derivatives that are used inhedging transactions have been and will continue to be highly effective in offsetting changes in fair values or cash flows ofhedged items.
67
For
per
sona
l use
onl
y
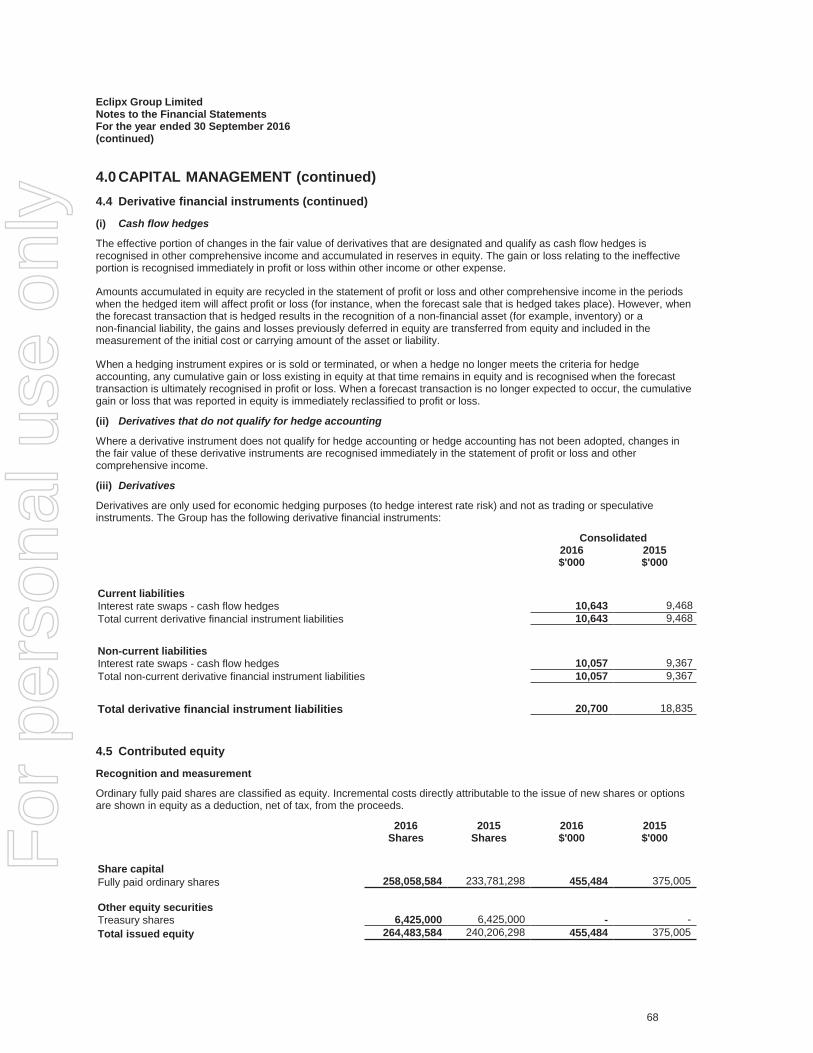
Eclipx Group LimitedNotes to the Financial StatementsFor the year ended 30 September 2016(continued)
4.0 CAPITAL MANAGEMENT (continued)4.4 Derivative financial instruments (continued)
(i) Cash flow hedges
The effective portion of changes in the fair value of derivatives that are designated and qualify as cash flow hedges isrecognised in other comprehensive income and accumulated in reserves in equity. The gain or loss relating to the ineffectiveportion is recognised immediately in profit or loss within other income or other expense.
Amounts accumulated in equity are recycled in the statement of profit or loss and other comprehensive income in the periodswhen the hedged item will affect profit or loss (for instance, when the forecast sale that is hedged takes place). However, whenthe forecast transaction that is hedged results in the recognition of a non-financial asset (for example, inventory) or anon-financial liability, the gains and losses previously deferred in equity are transferred from equity and included in themeasurement of the initial cost or carrying amount of the asset or liability.
When a hedging instrument expires or is sold or terminated, or when a hedge no longer meets the criteria for hedgeaccounting, any cumulative gain or loss existing in equity at that time remains in equity and is recognised when the forecasttransaction is ultimately recognised in profit or loss. When a forecast transaction is no longer expected to occur, the cumulativegain or loss that was reported in equity is immediately reclassified to profit or loss.
(ii) Derivatives that do not qualify for hedge accounting
Where a derivative instrument does not qualify for hedge accounting or hedge accounting has not been adopted, changes inthe fair value of these derivative instruments are recognised immediately in the statement of profit or loss and othercomprehensive income.
(iii) Derivatives
Derivatives are only used for economic hedging purposes (to hedge interest rate risk) and not as trading or speculativeinstruments. The Group has the following derivative financial instruments:
Consolidated2016$'000
2015$'000
Current liabilitiesInterest rate swaps - cash flow hedges 10,643 9,468Total current derivative financial instrument liabilities 10,643 9,468
Non-current liabilitiesInterest rate swaps - cash flow hedges 10,057 9,367Total non-current derivative financial instrument liabilities 10,057 9,367
Total derivative financial instrument liabilities 20,700 18,835
4.5 Contributed equity
Recognition and measurement
Ordinary fully paid shares are classified as equity. Incremental costs directly attributable to the issue of new shares or optionsare shown in equity as a deduction, net of tax, from the proceeds.
2016Shares
2015Shares
2016$'000
2015$'000
Share capitalFully paid ordinary shares 258,058,584 233,781,298 455,484 375,005spaceOther equity securitiesTreasury shares 6,425,000 6,425,000 - -Total issued equity 264,483,584 240,206,298 455,484 375,005
68
For
per
sona
l use
onl
y
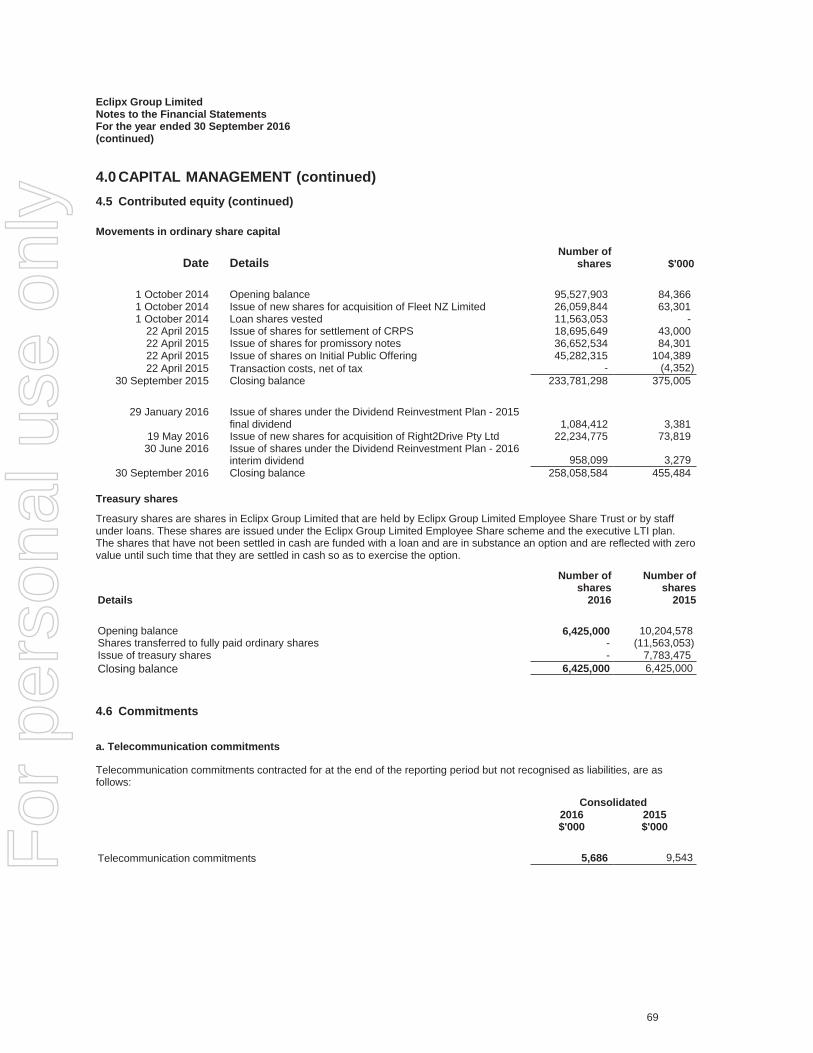
Eclipx Group LimitedNotes to the Financial StatementsFor the year ended 30 September 2016(continued)
4.0 CAPITAL MANAGEMENT (continued)4.5 Contributed equity (continued)
Movements in ordinary share capital
Date DetailsNumber of
shares $'000
1 October 2014 Opening balance 95,527,903 84,3661 October 2014 Issue of new shares for acquisition of Fleet NZ Limited 26,059,844 63,3011 October 2014 Loan shares vested 11,563,053 -
22 April 2015 Issue of shares for settlement of CRPS 18,695,649 43,00022 April 2015 Issue of shares for promissory notes 36,652,534 84,30122 April 2015 Issue of shares on Initial Public Offering 45,282,315 104,38922 April 2015 Transaction costs, net of tax - (4,352)
30 September 2015 Closing balance 233,781,298 375,005
29 January 2016 Issue of shares under the Dividend Reinvestment Plan - 2015final dividend 1,084,412 3,381
19 May 2016 Issue of new shares for acquisition of Right2Drive Pty Ltd 22,234,775 73,81930 June 2016 Issue of shares under the Dividend Reinvestment Plan - 2016
interim dividend 958,099 3,27930 September 2016 Closing balance 258,058,584 455,484
Treasury shares
Treasury shares are shares in Eclipx Group Limited that are held by Eclipx Group Limited Employee Share Trust or by staffunder loans. These shares are issued under the Eclipx Group Limited Employee Share scheme and the executive LTI plan.The shares that have not been settled in cash are funded with a loan and are in substance an option and are reflected with zerovalue until such time that they are settled in cash so as to exercise the option.
Details
Number ofshares
2016
Number ofshares
2015
Opening balance 6,425,000 10,204,578Shares transferred to fully paid ordinary shares - (11,563,053)Issue of treasury shares - 7,783,475Closing balance 6,425,000 6,425,000
4.6 Commitments
a. Telecommunication commitments
Telecommunication commitments contracted for at the end of the reporting period but not recognised as liabilities, are asfollows:
Consolidated2016$'000
2015$'000
Telecommunication commitments 5,686 9,543
69
For
per
sona
l use
onl
y
Eclipx Group LimitedNotes to the Financial StatementsFor the year ended 30 September 2016(continued)
4.0 CAPITAL MANAGEMENT (continued)4.6 Commitments (continued)
b. Lease commitments: Group as lessee
i. Operating leasesThe Group leases motor vehicles and commercial premises under non-cancellable operating leases expiring within the next fiveyears. The leases have varying terms, escalation clauses and renewal rights. On renewal, the terms of the leases arerenegotiated.
Commitments in relation to leases contracted for at the end of each reporting period but not recognised as liabilities, are asfollows:
Consolidated2016$'000
2015$'000
Within one year 12,000 5,653Later than one year but not later than five years 20,167 18,303
32,167 23,956
ii. Finance leasesThe Group leases fixed assets which lease expires within the next five years.
Commitments in relation to leases contracted for at the end of each reporting period and recognised as liabilities, are asfollows:
Consolidated2016$'000
2015$'000
Within one year 607 385Later than one year but not later than five years 1,137 1,122
1,744 1,507
c. Lease commitments: Group as lessor
i. Finance leasesFuture minimum lease payments due to the Group under non-cancellable leases, are as follows:
Consolidated2016$'000
2015$'000
Commitments in relation to finance leases are receivable as follows:Within one year 123,624 93,459Later than one year but not later than five years 275,660 173,801Later than five years 122 195
399,406 267,455
70
For
per
sona
l use
onl
y
Eclipx Group LimitedNotes to the Financial StatementsFor the year ended 30 September 2016(continued)
4.0 CAPITAL MANAGEMENT (continued)4.6 Commitments (continued)
c. Lease commitments: Group as lessor (continued)
ii. Operating leasesMinimum lease payments receivable on leases of motor vehicles are as follows:
Consolidated2016$'000
2015$'000
Minimum lease payments under non-cancellable operating leases of motor vehicles notrecognised in financial statements are receivable as follows:Within one year 314,676 277,179Later than one year but not later than five years 360,229 339,319Later than five years 25,080 16,999
699,985 633,497
d. Contractual commitments for the acquisition of property, plant or equipmentThe Group had contractual commitments for the acquisition of property, plant or equipment totalling $62,535,510 (2015:$47,686,119). These commitments are not recognised as liabilities as the relevant assets have not yet been received.
4.7 Dividends
Recognition and measurement
Provision is made for the amount of any dividend declared, being appropriately authorised and no longer at the discretion of theentity, before or at the end of the financial year but not distributed at balance date.
Details of dividends paid and proposed during the financial year are as follows:
Consolidated2016 2015$'000 $'000
Open rowFinal dividends paid2015 final dividend paid on 29 January 2016: 6.50 cents per ordinary share franked to 100% 15,613 -Interim dividends paid2016 interim dividend paid on 30 June 2016: 6.75 cents per ordinary share franked to 100% 16,287 -Total dividends paid 31,900 -Open rowFinal dividends proposed but not recognised at year end2016: 7.00 cents (2015: 6.50 cents) per ordinary share franked to 100% 18,514 15,613
On 1 November 2016, the Directors declared a fully franked final dividend for the year ended 30 September 2016 of 7.00 centsper ordinary share, to be paid on 20 January 2017 to eligible shareholders on the register as at 30 December 2016. Thisequates to a total estimated distribution of $18,513,851 based on the number of ordinary shares on issue as at 30 September2016. The final 2016 dividend has not been declared at the reporting date and therefore is not reflected in the financialstatements.
71
For
per
sona
l use
onl
y
Eclipx Group LimitedNotes to the Financial StatementsFor the year ended 30 September 2016(continued)
5.0 EMPLOYEE REMUNERATION AND BENEFITSRecognition and measurement
Long service leave
The liability for long service leave is recognised in the provision for employee benefits and measured as the present value ofexpected future payments to be made in respect of services provided by employees up to the end of the reporting period usingthe projected unit credit method. Consideration is given to expected future wage and salary levels, experience of employeedepartures and periods of service. Expected future payments are discounted using market yields at the end of the reportingperiod on national government bonds with terms to maturity and currency that match, as closely as possible, the estimatedfuture cash outflows.
Retirement benefit obligations
The Group makes payments to employees’ superannuation funds in line with the relevant superannuation legislation.Contributions made are recognised as expenses when they arise.
Termination benefits
Termination benefits are payable when employment is terminated before the normal retirement date, or when an employeeaccepts voluntary redundancy in exchange for these benefits. The Group recognises termination benefits when it isdemonstrably committed to either terminating the employment of current employees according to a detailed formal plan withoutpossibility of withdrawal or to providing termination benefits as a result of an offer made to encourage voluntary redundancy.Benefits falling due more than 12 months after the end of the reporting period are discounted to present value.
Bonus plans
The Group recognises a liability and an expense for bonuses on a formula that takes into consideration the profit attributable tothe Company's shareholders after certain adjustments. The Group recognises a provision where contractually obliged or wherethere is a past practice that has created a constructive obligation.
5.1 Share based payments
Share based payments
Share based compensation benefits are provided to employees via the Eclipx Group LTI plan.
The fair value of options granted under the Eclipx Group LTI plan is recognised as an expense by the employing entity thatreceives the employee's services. with a corresponding increase in equity. The fair value is measured at grant date andrecognised over the period during, which the employees become unconditionally entitled to the options (vesting period).
The fair value at grant date is independently determined using a Binomial tree option pricing model and Monte-Carlo simulationpricing model that takes into account the exercise price, the term of the option, the impact of dilution, the share price at grantdate and expected price volatility of the underlying share, the expected dividend yield and the risk free interest rate for the termof the option. The fair value of the options granted is then adjusted to reflect market vesting conditions, but excludes the impactof any non-market vesting conditions (for example, profitability and sales growth targets). Non-market vesting conditions areincluded in the assumptions about the number of options that are expected to become exercisable. At the end of each reportingperiod, the Group revises its estimate of the number of options that are expected to become exercisable.
The employee benefit expense recognised each period takes into account the most recent estimate. The impact of the revisionto original estimates, if any, is recognised in the statement of profit or loss and other comprehensive income, with acorresponding adjustment to equity.
In the event a share scheme is cancelled, the remaining unexpensed fair value of the original grant for those options stillvesting at the date of cancellation is taken as a charge to the statement of profit or loss and other comprehensive income.
Loan shares
Eclipx Group Limited issued shares to senior management employees of the Group with consideration satisfied by loans to theemployees granted by Eclipx Group Limited. These arrangements are considered to be “in substance options” and treated asshare-based payments. Whilst the above awards have been made by Eclipx Group Limited, the employees provide services toother entities within the Group, and therefore the associated expenses are borne by those entities that receive the relevantemployees’ services.
72
For
per
sona
l use
onl
y
Eclipx Group LimitedNotes to the Financial StatementsFor the year ended 30 September 2016(continued)
5.0 EMPLOYEE REMUNERATION AND BENEFITS (continued)5.1 Share based payments (continued)
Options
Eclipx Group Limited issued options to key employees of the Group. Whilst the above awards have been made by Eclipx GroupLimited, the employees provide services to other entities within the Group, and therefore the associated expenses are borne bythose entities that receive the relevant employees’ services. Options do not carry a right to receive any dividends. If optionsvest and are exercised to receive shares, these shares will be eligible to receive any dividends.
Rights
Eclipx Group Limited issued rights to key employees of the Group. Whilst the above awards have been made by Eclipx GroupLimited, the employees provide services to other entities within the Group, and therefore the associated expenses are borne bythose entities that receive the relevant employees’ services. Rights do not carry a right to receive any dividends. If rights vestand are exercised to receive shares, these shares will be eligible to receive any dividends.
The loan shares, options and rights are subject to the same performance hurdles. Refer to remuneration report for details ofthese performance hurdles.
(i) Long Term Incentive Plan
For the year ended 30 September 2016, the following awards were provided under the following employee share ownershipplans:
Options and rightsEach award is subject to testing against certain total shareholder return (TSR) and earnings per share (EPS) conditions on thethird year anniversary of the grant.
For the year ended 30 September 2015, the following awards were provided under the following employee share ownershipplans:
Loan shares and optionsEach award has two equal weighted tranches which are subject to testing against certain total shareholder return (TSR) andearnings per share (EPS) conditions on 21 April 2017 for tranche 1 and 21 April 2018 for tranche 2. Both tranche 1 and 2 aresubject to retest on 21 April 2018 and 21 April 2019 respectively, to the extent that awards subject to TSR conditions do notvest after the initial performance period.
73
For
per
sona
l use
onl
y
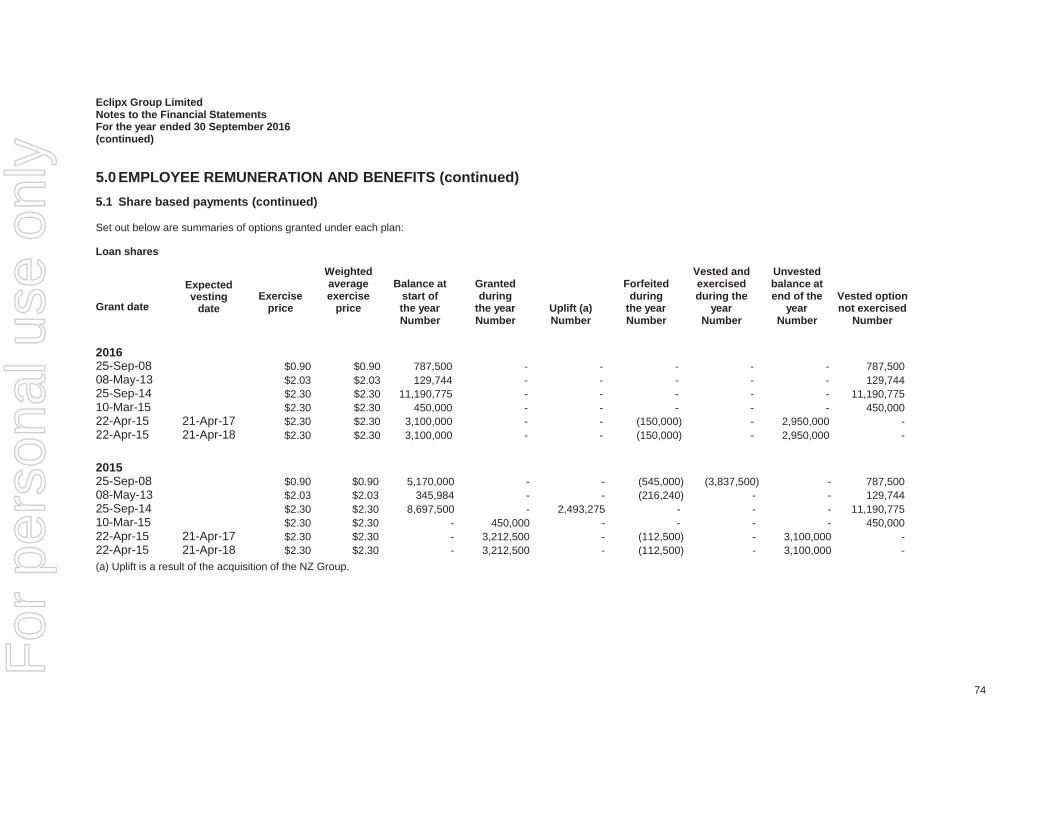
Eclipx Group LimitedNotes to the Financial StatementsFor the year ended 30 September 2016(continued)
5.0 EMPLOYEE REMUNERATION AND BENEFITS (continued)5.1 Share based payments (continued)
Set out below are summaries of options granted under each plan:
Loan shares
Grant date
Expectedvesting
dateExercise
price
Weightedaverageexercise
price
Balance atstart ofthe year
Grantedduring
the year Uplift (a)
Forfeitedduring
the year
Vested andexercisedduring the
year
Unvestedbalance atend of the
yearVested optionnot exercised
Number Number Number Number Number Number Number
201625-Sep-08 $0.90 $0.90 787,500 - - - - - 787,50008-May-13 $2.03 $2.03 129,744 - - - - - 129,74425-Sep-14 $2.30 $2.30 11,190,775 - - - - - 11,190,77510-Mar-15 $2.30 $2.30 450,000 - - - - - 450,00022-Apr-15 21-Apr-17 $2.30 $2.30 3,100,000 - - (150,000) - 2,950,000 -22-Apr-15 21-Apr-18 $2.30 $2.30 3,100,000 - - (150,000) - 2,950,000 -
201525-Sep-08 $0.90 $0.90 5,170,000 - - (545,000) (3,837,500) - 787,50008-May-13 $2.03 $2.03 345,984 - - (216,240) - - 129,74425-Sep-14 $2.30 $2.30 8,697,500 - 2,493,275 - - - 11,190,77510-Mar-15 $2.30 $2.30 - 450,000 - - - - 450,00022-Apr-15 21-Apr-17 $2.30 $2.30 - 3,212,500 - (112,500) - 3,100,000 -22-Apr-15 21-Apr-18 $2.30 $2.30 - 3,212,500 - (112,500) - 3,100,000 -(a) Uplift is a result of the acquisition of the NZ Group.
74
For
per
sona
l use
onl
y
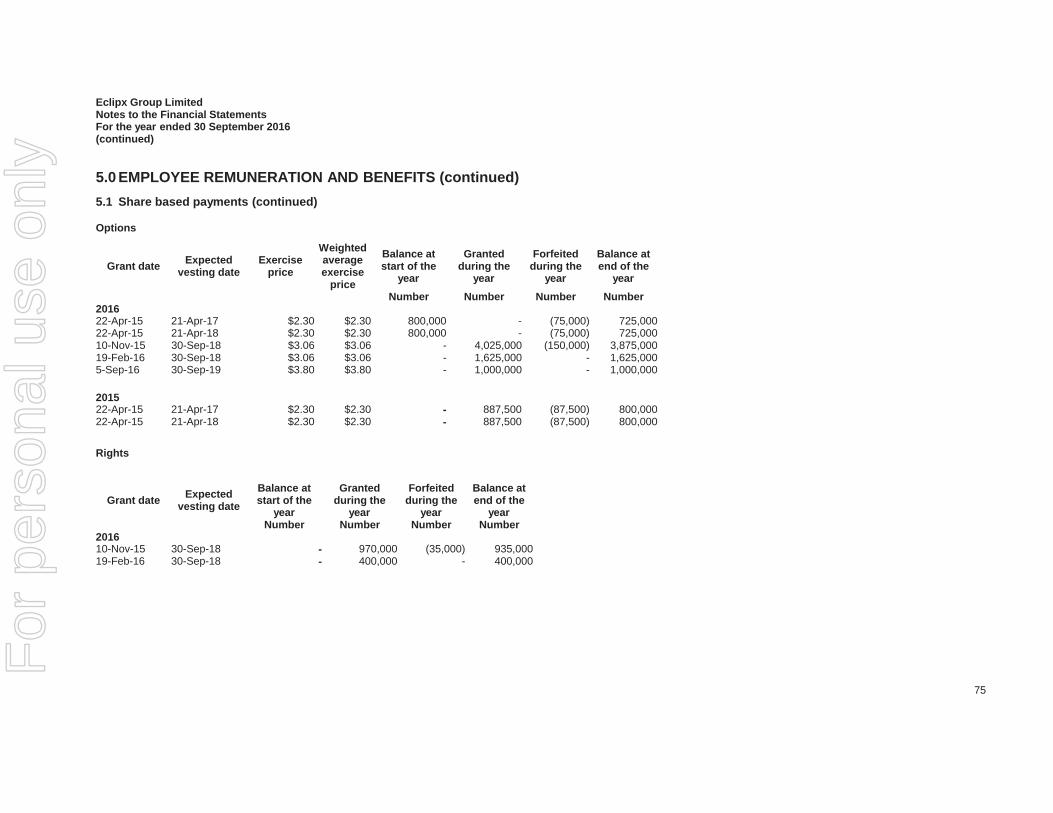
Eclipx Group LimitedNotes to the Financial StatementsFor the year ended 30 September 2016(continued)
5.0 EMPLOYEE REMUNERATION AND BENEFITS (continued)5.1 Share based payments (continued)
Options
Grant date Expectedvesting date
Exerciseprice
Weightedaverageexercise
price
Balance atstart of the
year
Grantedduring the
year
Forfeitedduring the
year
Balance atend of the
yearNumber Number Number Number
201622-Apr-15 21-Apr-17 $2.30 $2.30 800,000 - (75,000) 725,00022-Apr-15 21-Apr-18 $2.30 $2.30 800,000 - (75,000) 725,00010-Nov-15 30-Sep-18 $3.06 $3.06 - 4,025,000 (150,000) 3,875,00019-Feb-16 30-Sep-18 $3.06 $3.06 - 1,625,000 - 1,625,0005-Sep-16 30-Sep-19 $3.80 $3.80 - 1,000,000 - 1,000,000
201522-Apr-15 21-Apr-17 $2.30 $2.30 - 887,500 (87,500) 800,00022-Apr-15 21-Apr-18 $2.30 $2.30 - 887,500 (87,500) 800,000
Rights
Grant date Expectedvesting date
Balance atstart of the
year
Grantedduring the
year
Forfeitedduring the
year
Balance atend of the
yearNumber Number Number Number
201610-Nov-15 30-Sep-18 - 970,000 (35,000) 935,00019-Feb-16 30-Sep-18 - 400,000 - 400,000
75
For
per
sona
l use
onl
y
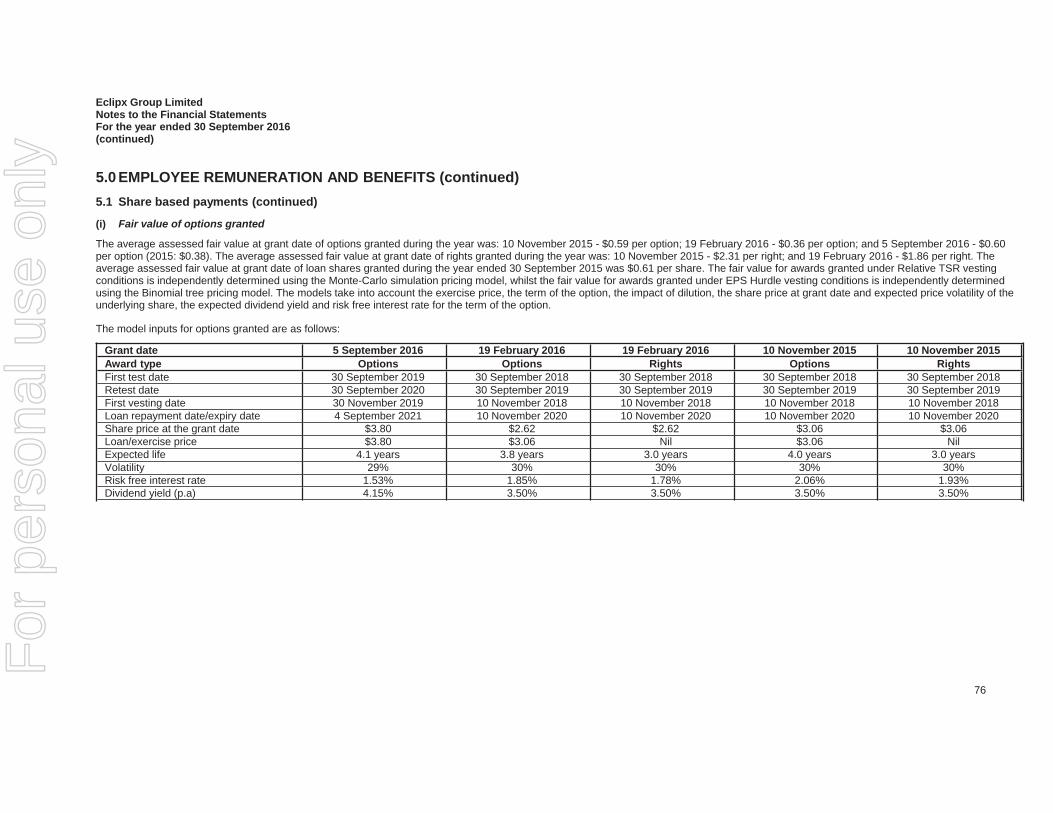
Eclipx Group LimitedNotes to the Financial StatementsFor the year ended 30 September 2016(continued)
5.0 EMPLOYEE REMUNERATION AND BENEFITS (continued)5.1 Share based payments (continued)
(i) Fair value of options granted
The average assessed fair value at grant date of options granted during the year was: 10 November 2015 - $0.59 per option; 19 February 2016 - $0.36 per option; and 5 September 2016 - $0.60per option (2015: $0.38). The average assessed fair value at grant date of rights granted during the year was: 10 November 2015 - $2.31 per right; and 19 February 2016 - $1.86 per right. Theaverage assessed fair value at grant date of loan shares granted during the year ended 30 September 2015 was $0.61 per share. The fair value for awards granted under Relative TSR vestingconditions is independently determined using the Monte-Carlo simulation pricing model, whilst the fair value for awards granted under EPS Hurdle vesting conditions is independently determinedusing the Binomial tree pricing model. The models take into account the exercise price, the term of the option, the impact of dilution, the share price at grant date and expected price volatility of theunderlying share, the expected dividend yield and risk free interest rate for the term of the option.
The model inputs for options granted are as follows:
Grant date 5 September 2016 19 February 2016 19 February 2016 10 November 2015 10 November 2015Award type Options Options Rights Options RightsFirst test date 30 September 2019 30 September 2018 30 September 2018 30 September 2018 30 September 2018Retest date 30 September 2020 30 September 2019 30 September 2019 30 September 2019 30 September 2019First vesting date 30 November 2019 10 November 2018 10 November 2018 10 November 2018 10 November 2018Loan repayment date/expiry date 4 September 2021 10 November 2020 10 November 2020 10 November 2020 10 November 2020Share price at the grant date $3.80 $2.62 $2.62 $3.06 $3.06Loan/exercise price $3.80 $3.06 Nil $3.06 NilExpected life 4.1 years 3.8 years 3.0 years 4.0 years 3.0 yearsVolatility 29% 30% 30% 30% 30%Risk free interest rate 1.53% 1.85% 1.78% 2.06% 1.93%Dividend yield (p.a) 4.15% 3.50% 3.50% 3.50% 3.50%
76
For
per
sona
l use
onl
y
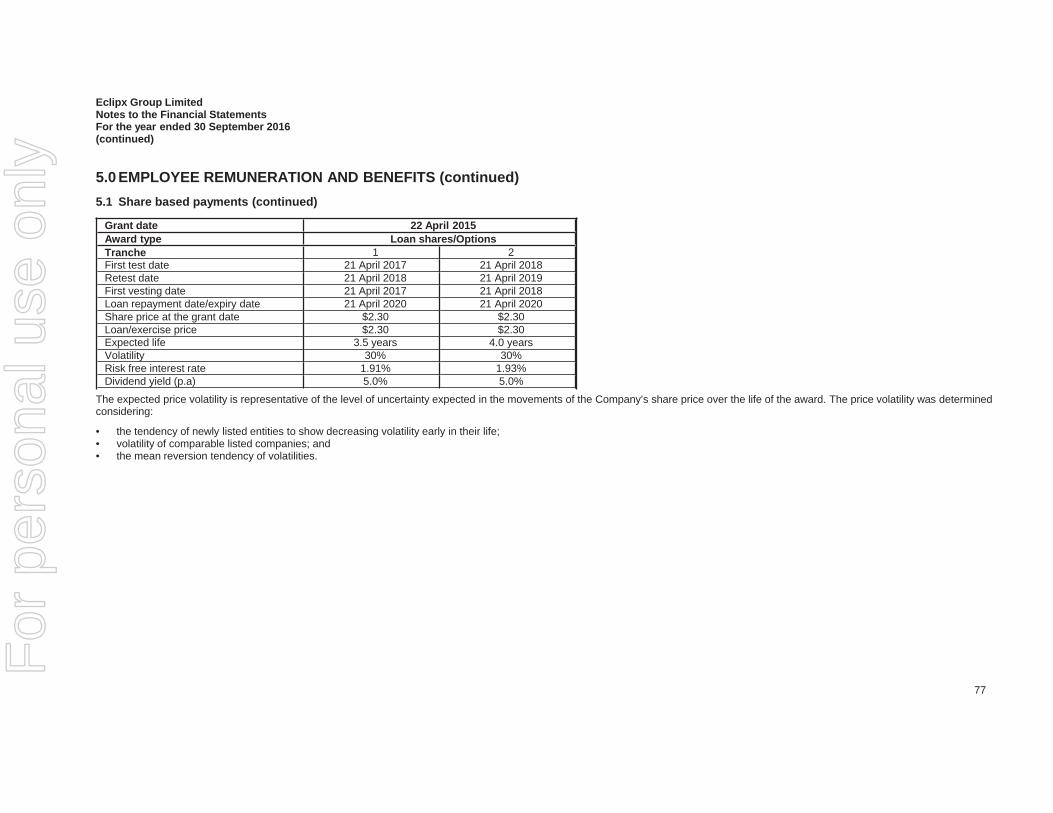
Eclipx Group LimitedNotes to the Financial StatementsFor the year ended 30 September 2016(continued)
5.0 EMPLOYEE REMUNERATION AND BENEFITS (continued)5.1 Share based payments (continued)
Grant date 22 April 2015Award type Loan shares/OptionsTranche 1 2First test date 21 April 2017 21 April 2018Retest date 21 April 2018 21 April 2019First vesting date 21 April 2017 21 April 2018Loan repayment date/expiry date 21 April 2020 21 April 2020Share price at the grant date $2.30 $2.30Loan/exercise price $2.30 $2.30Expected life 3.5 years 4.0 yearsVolatility 30% 30%Risk free interest rate 1.91% 1.93%Dividend yield (p.a) 5.0% 5.0%
The expected price volatility is representative of the level of uncertainty expected in the movements of the Company’s share price over the life of the award. The price volatility was determinedconsidering:
• the tendency of newly listed entities to show decreasing volatility early in their life;• volatility of comparable listed companies; and• the mean reversion tendency of volatilities.
77
For
per
sona
l use
onl
y
Eclipx Group LimitedNotes to the Financial StatementsFor the year ended 30 September 2016(continued)
5.0 EMPLOYEE REMUNERATION AND BENEFITS (continued)5.1 Share based payments (continued)
(ii) Expenses arising from share-based payment transactions
Total expenses arising from share-based payment transactions recognised during the period as part of employee benefitexpense were as follows:
Consolidated2016$'000
2015$'000
Awards issued to employees of controlled entities during the year 2,860 816
(iii) Terms and conditions of Share Schemes
The share based payments issued since the IPO are subject to vesting conditions. Refer to the remuneration report for detailsof these vesting conditions.
78
For
per
sona
l use
onl
y
Eclipx Group LimitedNotes to the Financial StatementsFor the year ended 30 September 2016(continued)
5.0 EMPLOYEE REMUNERATION AND BENEFITS (continued)5.2 Key management personnel disclosure
Consolidated2016$'000
2015$'000
Short-term employee benefits 4,505 4,164Post-employment benefits 93 89Long-term employee benefits 5 8Share-based payments 1,156 978
5,759 5,239
6.0 OTHER6.1 Reserves
Recognition and measurementShare-based payment reserve
The share based payment reserve is used to recognise:
• the fair value of options issued to Directors and employees but not exercised;• the fair value of shares issued to Directors and employees; and• other share-based payment transactions.
Cash flow hedge reserve
The hedging reserve is used to record gains or losses on a hedging instrument in a cash flow hedge that are recognised inother comprehensive income. Amounts are reclassified to profit or loss when the associated hedge transaction affects profit orloss.
Treasury reserve
Treasury shares are unpaid loan shares in Eclipx Group Limited that have been issued as part of the Eclipx Group Sharescheme and the executive LTI plan. See note 5.1 for further information.
Consolidated2016$'000
2015$'000
Reconciliation of reservesHedging reserve - cash flow hedges (13,335) (12,692)Treasury reserve (1,298) (2,329)Foreign currency translation reserve 4,965 (325)Share based payments reserve 13,138 6,570Total reserves 3,470 (8,776)
Movements in reservesHedging reserve - cash flow hedgesBalance 1 October (12,692) (6,102)Revaluation (911) (9,278)Deferred tax 268 2,688Balance 30 September (13,335) (12,692)
Share based payments reserveBalance 1 October 6,570 5,754Rights issued as part of the Right2Drive Pty Ltd acquisition 3,708 -Awards issued to employees of controlled entities during the year 2,860 816Balance at 30 September 13,138 6,570
79
For
per
sona
l use
onl
y
Eclipx Group LimitedNotes to the Financial StatementsFor the year ended 30 September 2016(continued)
6.0 OTHER (continued)6.2 Parent entity information
(i) Summary financial information
The individual financial statements for the parent entity show the following aggregate amounts:
Consolidated2016$'000
2015$'000
Statement of financial positionCurrent assets 1,232 5,175Non-current assets 778,612 699,841Total assets 779,844 705,016aCurrent liabilities (12,829) (9,853)Non-current liabilities (127,609) (112,508)Total liabilities (140,438) (122,361)aShareholders equityIssued share capital 455,484 375,005Reserves 5,144 (1,743)Retained earnings 178,778 209,393
639,406 582,655
Profit for the year 1,285 214,646
(ii) Guarantees entered into by the parent entity
There are cross guarantees given by Eclipx Group Limited, Pacific Leasing Solutions (Australia) Pty Limited, Leasing Finance(Australia) Pty Limited, Fleet Holding (Australia) Pty Limited, PLS Notes (Australia) Pty Limited, Fleet Partners Pty Limited,Fleet Aust Subco Pty Limited, Fleet Partners Franchising Pty Limited, CLFC Pty Limited, Car Insurance Pty Limited, FleetPlusHoldings Pty Limited, CarLoans.com.au Pty Ltd, Fleet Choice Pty Ltd, CLFC Media Holdings Pty Limited, FleetPlus Pty Limited,Eclipx Commercial Pty Ltd, FleetPlus Novated Pty Limited, PackagePlus Australia Pty Limited, Eclipx Insurance Pty Ltd,Right2Drive Pty Ltd and CarInsurance.com.au Pty Ltd.
No liability was recognised by the parent entity or the consolidated entity in relation to the above guarantee as the fair value ofthe guarantee is immaterial.
(iii) Contingent liabilities of the parent entity
The parent entity did not have any contingent liabilities as at 30 September 2016 or 2015. For information about guaranteesgiven by the parent entity, see above.
6.3 Related party transactions
(i) Transactions within the wholly owned Group
The following transactions occurred with related parties:
The related party payables among Australian entities are interest free and are not due for payment within the next 12 months.
(ii) Controlling entity
The parent entity of the Group is Eclipx Group Limited.
(iii) Interest in other entities
The controlled entities of the Group listed below were wholly owned during the current and prior year, unless otherwise stated:
80
For
per
sona
l use
onl
y
Eclipx Group LimitedNotes to the Financial StatementsFor the year ended 30 September 2016(continued)
6.0 OTHER (continued)6.3 Related party transactions (continued)
AustraliaFleet Aust Subco Pty Ltd FP Turbo Trust 2007-1 (Australia)Pacific Leasing Solutions (Australia) Pty Ltd FP Turbo Series 2014-1 TrustLeasing Finance (Australia) Pty Ltd FP Turbo Warehouse Trust 2014-1 (Australia)PLS Notes (Australia) Pty Ltd Fleet Partners Franchising Pty LtdFleet Holding (Australia) Pty Ltd Eclipx Insurance Pty LtdFleet Partners Pty Ltd CarInsurance.com.au Pty LtdFleetPlus Holdings Pty Limited Car Insurance Pty LtdFleetPlus Pty Ltd CLFC Pty Ltd (b)FleetPlus Novated Pty Ltd CarLoans.com.au Pty Ltd (b)PackagePlus Australia Pty Ltd Fleet Choice Pty Ltd (b)CLFC Media Holdings Pty Ltd (b) FP Turbo Series 2015-1 Equipment TrustEclipx Commercial Pty Ltd FleetPlus Asset Securisation Pty Ltd (d)Right2Drive Pty Ltd (a) FP Turbo Government Lease Trust 2016-1
New ZealandFleetPlus Ltd (NZ) Fleet Holding (NZ) Ltd (c)CarLoans.co.nz Ltd (b) Fleetpartners NZ Trustee Ltd (c)Fleet NZ Limited (c) Truck Leasing Ltd (c)Pacific Leasing Solutions (NZ) Limited (c) FP Ignition Trust 2011-1 New Zealand (c)Leasing Finance (NZ) Limited (c) FleetPartners NZ Trust (c)PLS Notes (NZ) Ltd (c) FPNZ Warehouse Trust 2015-1 (c)Right2Drive (New Zealand) Ltd (a)
(a) On 19 May 2016, the Group concluded the 100% acquisition of the Right2Drive Group.(b) On 16 October 2014, the Group concluded the 100% acquisition of the CarLoans Group.(c) On 1 October 2014, a Group restructure was undertaken whereby Fleet NZ Limited and its controlled entities (NZ Group), arelated party of the Group incorporated in New Zealand and controlled by the same consortium of investors was acquired bythe Group.(d) The Group does not have control of FleetPlus Asset Securisation Pty Ltd.
(iv) Transactions with other related parties
(a) Relationship with Ironbridge and Sing GlowDuring the year, Eclipx Group Limited has incurred $137,500 in fees from Ironbridge Capital Management PLC in relation toDirector Fees for G Ruddock. Refer to the remuneration report for further information.
Certain existing owners, including the Ironbridge Funds and Sing Glow, were parties to a shareholders deed in relation to EclipxGroup Limited which was entered on or about 29 July 2008 and amended from time to time since that date. Ironbridge (anominee of the Ironbridge Funds) and Sing Glow (or its nominee) were together paid in 2016 fees of $nil (2015: $581,914) forproviding advisory services to Eclipx Group Limited. The shareholders deed referred to above terminated on completion of theIPO and no further fees will be paid under it from that date.
(b) Logbook Me Pty LimitedEclipx Group Limited is party to a contract with Logbook Me Pty Limited (LogbookMe) which supplies a fringe benefits tax, fueltax credit, driver safety and fleet management tool to Group for distribution to its customers, including by means of GPStracking devices. LogbookMe has agreed not to distribute its product to other fleet management and vehicle finance providersfor the term of the contract, subject to minimum subscriber volumes. The term of the contract is 10 years from 15 October 2014.Eclipx paid a one-off fee to LogbookMe under the contract of $571,429 during FY2015 and is obliged to pay per device fees toLogbookMe based on usage. The device, freight and subscription fees paid to LogbookMe amounted in 2016 to $219,571(2015: $119,291).
The Chief Executive Officer and Deputy Chief Executive Officer have a direct equity interest in LogbookMe.
81
For
per
sona
l use
onl
y
Eclipx Group LimitedNotes to the Financial StatementsFor the year ended 30 September 2016(continued)
6.0 OTHER (continued)6.4 Remuneration of auditors
During the year the following fees were paid or payable for services provided by the auditor of the Group.
Consolidated2016
$2015
$
(a) Audit and assurance servicesAudit ServicesKPMG Australian firm:Audit and review of financial statements 686,254 629,832Under accrual of fees -(b) Non-audit services
KPMG Australian firm:Debt restructuring 540,000 -Transactional services including IPO 179,134 1,560,878Reporting and limited assurance engagements 60,000 -Tax services - 226,939Total remuneration for non-audit services for KPMG 779,134 1,787,817Total remuneration for KPMG 1,465,388 2,417,649
6.5 Deed of cross guarantee
Eclipx Group Limited, Pacific Leasing Solutions (Australia) Pty Limited, Leasing Finance (Australia) Pty Limited, Fleet Holding(Australia) Pty Limited, PLS Notes (Australia) Pty Limited, Fleet Partners Pty Limited, Fleet Aust Subco Pty Limited, FleetPartners Franchising Pty Limited, CLFC Pty Limited, Car Insurance Pty Limited, FleetPlus Holdings Pty Limited,CarLoans.com.au Pty Ltd, Fleet Choice Pty Ltd, CLFC Media Holdings Pty Limited, FleetPlus Pty Limited, Eclipx CommercialPty Ltd, FleetPlus Novated Pty Limited, PackagePlus Australia Pty Limited, Eclipx Insurance Pty Ltd, CarInsurance.com.au PtyLtd and Right2Drive Pty Ltd are parties to a deed of cross guarantee under which each company guarantees the debts of theothers. By entering into the deed, the wholly owned entities have been relieved from the requirement to prepare a financialreport and directors’ report under Class Order 98/1418 (as amended) issued by the Australian Securities and InvestmentsCommission.
The above companies represent a ‘Closed Group' for the purposes of the Class Order, and as there are no other parties to thedeed of cross guarantee that are controlled by Eclipx Group Limited, they also represent the ‘Extended Closed Group'.
82
For
per
sona
l use
onl
y
Eclipx Group LimitedNotes to the Financial StatementsFor the year ended 30 September 2016(continued)
6.0 OTHER (continued)6.5 Deed of cross guarantee (continued)
Set out below is a statement of profit or loss and other comprehensive income for the year of the Closed Group.
Consolidated2016$'000
2015$'000
Statement of profit or loss and other comprehensive incomeRevenue from continuing operations 412,201 347,629Cost of revenue (166,171) (166,860)Lease finance costs (41,861) (42,602)Net operating income before operating expenses and impairment charges 204,169 138,167
Impairment losses on loans and receivables (1,530) (1,884)Net operating income before operating expenses 202,639 136,283
Employee benefit expense (58,073) (52,978)Depreciation and amortisation expense (7,894) (6,451)Operating overheads (32,062) (40,497)Total overheads (98,029) (99,926)
Operating finance costs (6,515) (14,569)Profit before income tax 98,095 21,788
Income tax expense (13,812) (7,292)Profit for the year 84,283 14,496
Other comprehensive income/(loss), net of tax 4,647 (6,867)Total comprehensive income for the year 88,930 7,629
83
For
per
sona
l use
onl
y
Eclipx Group LimitedNotes to the Financial StatementsFor the year ended 30 September 2016(continued)
6.0 OTHER (continued)6.5 Deed of cross guarantee (continued)
Set out below is a consolidated statement of financial position as at reporting date of the Closed Group.
Consolidated2016$'000
2015$'000
ASSETSCurrent assetsCash and cash equivalents 49,326 49,860Restricted cash and cash equivalents 72,371 65,771Trade and other receivables 73,768 47,486Finance leases 98,906 74,712Inventory 10,673 11,818Operating leases reported as property, plant and equipment 132,580 145,351Total current assets 437,624 394,998
Non-current assetsProperty, plant and equipment 9,938 8,895Operating leases reported as property, plant and equipment 488,826 448,266Deferred tax assets 3,737 7,475Intangibles 471,182 394,985Finance leases 232,993 147,448Receivables - Advances to related parties 55,764 53,645Total non-current assets 1,262,440 1,060,714
Total assets 1,700,064 1,455,712
LIABILITIESCurrent liabilitiesTrade and other liabilities 23,784 57,255Borrowings 165,145 173,380Other 607 385Derivative financial instruments 6,534 7,076Provisions 4,919 3,500Payables - Advances from related parties 4,250 3,723Total current liabilities 205,239 245,319
Non-current liabilitiesTrade and other liabilities 5,236 2,667Borrowings 852,518 711,658Other 1,137 1,122Provisions 1,491 1,564Derivative financial instruments 7,628 6,584Total non-current liabilities 868,010 723,595
Total liabilities 1,073,249 968,914
Net assets 626,815 486,798
EQUITYContributed equity 455,484 375,005Reserves (1,282) (8,437)Retained earnings 172,613 120,230
Total equity 626,815 486,798
84
For
per
sona
l use
onl
y
Eclipx Group LimitedNotes to the Financial StatementsFor the year ended 30 September 2016(continued)
6.0 OTHER (continued)6.6 Reconciliation of cash flow from operating activities
Consolidated2016$'000
2015$'000
Profit after tax for the year 45,868 27,554Depreciation and amortisation 197,939 197,669Doubtful debts 1,989 1,616Share based payments expense 2,860 1,057Fleet and stock impairment (118) 1,851Interest on promissory notes - 8,452Corporate debt restructuring costs 1,615 -Unwind on contingent consideration (778) 1,447Net (gain)/loss on sale of non-current assets (16,234) (8,685)Hedging gain 464 (182)Exchange rate variations on New Zealand cash and cash equivalents (1,983) (205)Net cash inflow from operating activities before change in assets and liabilities 231,622 230,574
Change in operating assets and liabilities:Increase in trade and other receivables 7,975 (1,211)Increase in finance leases** 106,370 92,325Decrease/(increase) in deferred tax assets/liabilities 2,437 3,528Increase in trade and other liabilities 16,671 17,212Increase/(decrease) in current tax liabilities 6,515 7,608Decrease in current provisions (2,010) (4,370)Increase in other current liabilities 937 11,024
Net cash inflow from operating activities 370,517 356,690
**Cash flows relating to purchases of finance leases were previously included in cash flows from operating activities. Tobetter reflect the nature of income generating assets purchased, the cash flows have been reclassified as cash flowsfrom investing activities.
As a result of this reclassification, for the year ended 30 September 2015, movement in finance leases has increased to$92,325,000 from (2015: ($72,847,000)) reported previously.
6.7 Events occurring after the reporting period
On 27 October 2016, the Group entered into an agreement to acquire Anrace Pty Ltd trading as Onyx Car Rentals (Onyx). Thetransaction is expected to complete on or about 15 November 2016. On completion, the Group will acquire all of the sharecapital of Onyx for a consideration of $9.8m which will be settled with available cash. On 1 November 2016, the Board declareda fully franked dividend of 7.00 cents per share.
Except for the matters disclosed above, no other matter or circumstance has occurred since the end of the reporting period thatmay materially affect the Group's operations, the results of those operations or the Group's state of affairs in future financialyears.
85
For
per
sona
l use
onl
y
For
per
sona
l use
onl
y
87
Independent auditor’s report to the members of Eclipx Group Limited
Report on the financial reportWe have audited the accompanying financial report of Eclipx Group Limited (the Company), which comprises the consolidated statement of financial position as at 30 September 2016, and consolidated statement of profit or loss and other comprehensive income, consolidated statement of changes in equity and consolidated statement of cash flows for the year ended on that date, notes 1.0 to 6.7 comprising a summary of significant accounting policies and other explanatory information and the directors’ declaration of the Group comprising the Company and the entities it controlled at the year’s end or from time to time during the financial year.
Directors’ responsibility for the financial report
The directors of the Company are responsible for the preparation of the financial report that gives a true and fair view in accordance with Australian Accounting Standards and the Corporations Act 2001 and for such internal control as the directors determine is necessary to enable the preparation of the financial report that is free from material misstatement whether due to fraud or error. In note 1.0, the directors also state, in accordance with Australian Accounting Standard AASB 101 Presentation of Financial Statements, that the financial statements of the Group comply with International Financial Reporting Standards.
Auditor’s responsibility
Our responsibility is to express an opinion on the financial report based on our audit. We conducted our audit in accordance with Australian Auditing Standards. These Auditing Standards require that we comply with relevant ethical requirements relating to audit engagements and plan and perform the audit to obtain reasonable assurance whether the financial report is free from material misstatement.
An audit involves performing procedures to obtain audit evidence about the amounts and disclosures in the financial report. The procedures selected depend on the auditor’s judgement, including the assessment of the risks of material misstatement of the financial report, whether due to fraud or error. In making those risk assessments, the auditor considers internal control relevant to the entity’s preparation of the financial report that gives a true and fair view in order to design audit procedures that are appropriate in the circumstances, but not for the purpose of expressing an opinion on the effectiveness of the entity’s internal control. An audit also includes evaluating the appropriateness of accounting policies used and the reasonableness of accounting estimates made by the directors, as well as evaluating the overall presentation of the financial report.
We performed the procedures to assess whether in all material respects the financial report presents fairly, in accordance with the Corporations Act 2001 and Australian Accounting Standards, a true and fair view which is consistent with our understanding of the Group’s financial position and of its performance.
We believe that the audit evidence we have obtained is sufficient and appropriate to provide a basis for our audit opinion.
ABCD
KPMG, an Australian partnership and a member firm of the KPMG network of independent member firms affiliated with KPMG International Cooperative (�KPMG International�), a Swiss entity.
Liability limited by a scheme approved under Professional Standards Legislation.
For
per
sona
l use
onl
y
88
Independence
In conducting our audit, we have complied with the independence requirements of the Corporations Act 2001.
Auditor’s opinion
In our opinion:
(a) the financial report of the Group is in accordance with the Corporations Act 2001, including:
(i) giving a true and fair view of the Group’s financial position as at 30 September 2016 and of its performance for the year ended on that date; and
(ii) complying with Australian Accounting Standards and the Corporations Regulations 2001.
Report on the remuneration reportWe have audited the Remuneration Report included in pages 19 to 33 of the directors’ report for the year ended 30 September 2016. The directors of the company are responsible for the preparation and presentation of the remuneration report in accordance with Section 300A of the Corporations Act 2001. Our responsibility is to express an opinion on the remuneration report, based on our audit conducted in accordance with auditing standards.
Auditor’s opinion
In our opinion, the remuneration report of Eclipx Group Limited for the year ended 30September 2016, complies with Section 300A of the Corporations Act 2001.
KPMG
Andrew DickinsonPartner
Sydney1 November 2016
ABCDF
or p
erso
nal u
se o
nly