Embed Size (px)
Citation preview
WELCOME
Good afternoon ladies and gentlemen.
My name is Robert Millner and it is my pleasure to welcome you to the 78th Annual General Meeting of shareholders of Milton Corporation Limited.
As it is now 3pm I declare the meeting open.
1
For
per
sona
l use
onl
y

2
For
per
sona
l use
onl
y

Before we turn to the official business for the day I would like to introduce you to the non executive directors and senior executives of Milton.
Starting from the far end we have the non-executive directors: John Church, Graeme Crampton, Kevin Eley and Ian Pollard.
3
For
per
sona
l use
onl
y

In front of me is Nishantha Seneviratne, the company’s secretary and Frank Gooch, the managing director.
In addition, the company’s auditor, Melissa Alexander from Pitcher Partners is in attendance.
The notice of annual general meeting has been circulated to all shareholders. The holders of over 168 million shares or approximately 26 per cent of the company’s ordinary shares have either lodged their proxy or voted on-line.
Following my report Frank will provide an overview of the 2016 financial results of Milton and comment on the investment portfolio and the outlook for the 2017 financial year
You will then have the opportunity to ask questions regarding the business of the meeting.
4
For
per
sona
l use
onl
y

Milton was incorporated in 1938 as an investment company for just four shareholders. In 1958 it listed on the Sydney Stock Exchange and now it has total assets of approximately $2.7 billion and the number of shareholders is approaching 24,000.
Milton’s long held objective has three elements to it.
The first is to invest in a diversified portfolio of assets that are predominantly companies and trusts listed on the Australian Securities Exchange.
At the end of the 2016 financial year, Milton held investments in a little over 90 companies with a combined market value of $2.57 billion, liquid assets amounted to $154 million and other assets totalled $26 million.
5
For
per
sona
l use
onl
y
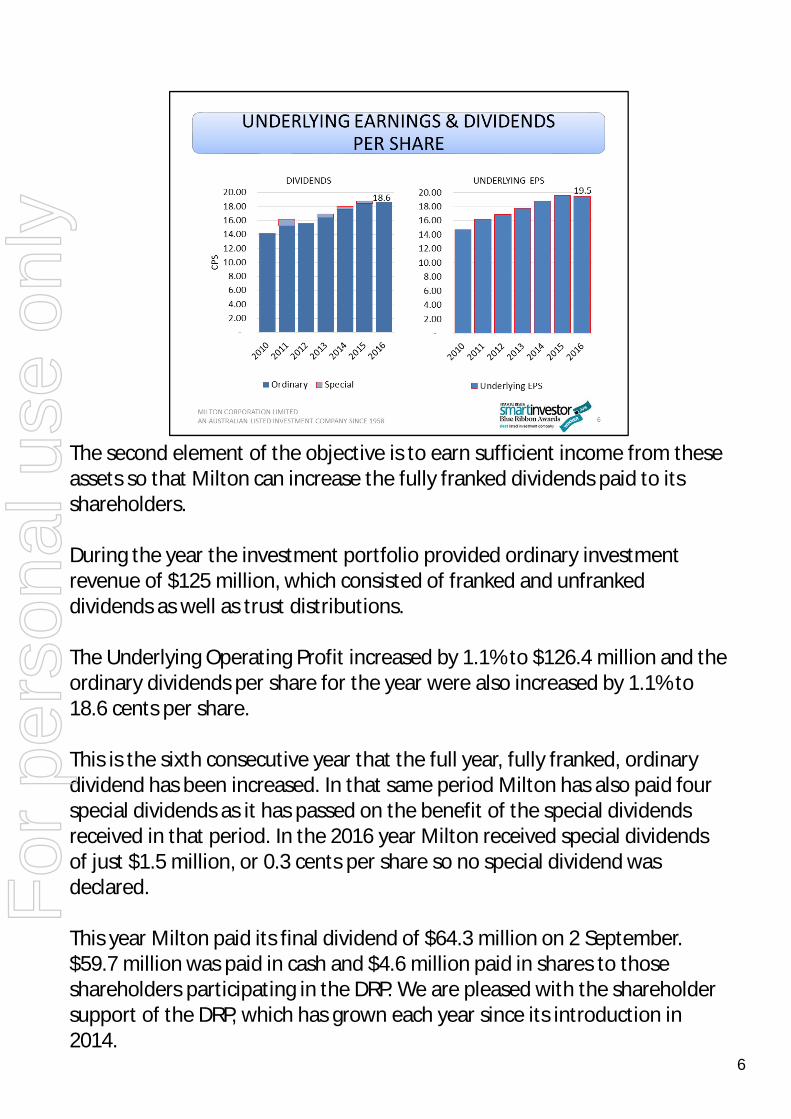
The second element of the objective is to earn sufficient income from these assets so that Milton can increase the fully franked dividends paid to its shareholders.
During the year the investment portfolio provided ordinary investment revenue of $125 million, which consisted of franked and unfranked dividends as well as trust distributions.
The Underlying Operating Profit increased by 1.1% to $126.4 million and the ordinary dividends per share for the year were also increased by 1.1% to 18.6 cents per share.
This is the sixth consecutive year that the full year, fully franked, ordinary dividend has been increased. In that same period Milton has also paid four special dividends as it has passed on the benefit of the special dividends received in that period. In the 2016 year Milton received special dividends of just $1.5 million, or 0.3 cents per share so no special dividend was declared.
This year Milton paid its final dividend of $64.3 million on 2 September. $59.7 million was paid in cash and $4.6 million paid in shares to those shareholders participating in the DRP. We are pleased with the shareholder support of the DRP, which has grown each year since its introduction in 2014.
6
For
per
sona
l use
onl
y
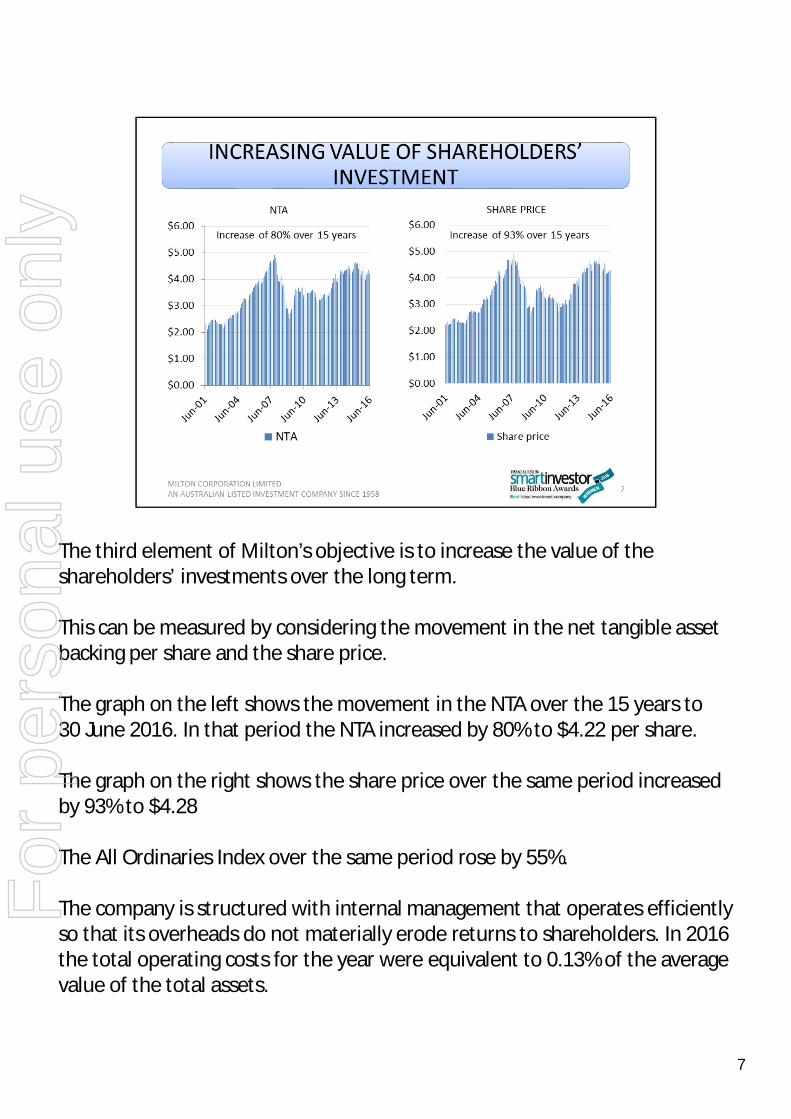
The third element of Milton’s objective is to increase the value of the shareholders’ investments over the long term.
This can be measured by considering the movement in the net tangible asset backing per share and the share price.
The graph on the left shows the movement in the NTA over the 15 years to 30 June 2016. In that period the NTA increased by 80% to $4.22 per share.
The graph on the right shows the share price over the same period increased by 93% to $4.28
The All Ordinaries Index over the same period rose by 55%.
The company is structured with internal management that operates efficiently so that its overheads do not materially erode returns to shareholders. In 2016 the total operating costs for the year were equivalent to 0.13% of the average value of the total assets.
7
For
per
sona
l use
onl
y
The LIC sector has grown significantly over the last few years with about 70 LICs trading on the ASX. This has lifted the profile of LICs and helped to build an awareness of the benefits of the LIC structure amongst investors. It has also encouraged increased research coverage of the sector with a number of brokers preparing in depth analysis of LICs and more ratings agencies are providing their recommendations.
Milton is now rated by Morningstar, Lonsec Research and Independent Investment Research.
In August this year Milton was awarded the Australian Financial Review’s “Smart Investor” Blue Ribbon Award for LIC of the year for 2016.
The judges noted that “the income focused, buy and hold philosophy has changed little over the years, is led by an experienced team and charges a fee that is lowest among its peers.”
Looking forward, we intend to continue with the long term investment philosophy that has delivered sound results and dividend growth over many years.
I will now ask Frank to provide his report to you. 8
For
per
sona
l use
onl
y
9
For
per
sona
l use
onl
y
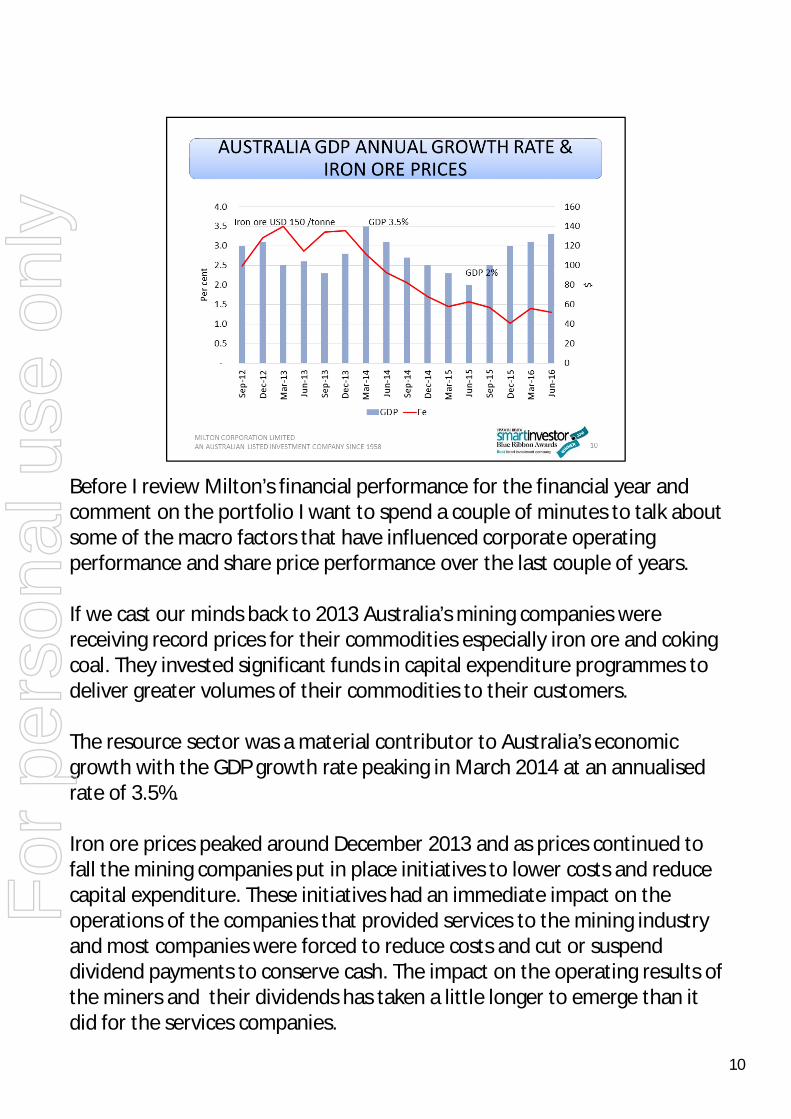
Before I review Milton’s financial performance for the financial year and comment on the portfolio I want to spend a couple of minutes to talk about some of the macro factors that have influenced corporate operating performance and share price performance over the last couple of years.
If we cast our minds back to 2013 Australia’s mining companies were receiving record prices for their commodities especially iron ore and coking coal. They invested significant funds in capital expenditure programmes to deliver greater volumes of their commodities to their customers.
The resource sector was a material contributor to Australia’s economic growth with the GDP growth rate peaking in March 2014 at an annualised rate of 3.5%.
Iron ore prices peaked around December 2013 and as prices continued to fall the mining companies put in place initiatives to lower costs and reduce capital expenditure. These initiatives had an immediate impact on the operations of the companies that provided services to the mining industry and most companies were forced to reduce costs and cut or suspend dividend payments to conserve cash. The impact on the operating results of the miners and their dividends has taken a little longer to emerge than it did for the services companies.
10
For
per
sona
l use
onl
y
Oil prices also commenced their descent in mid 2014 putting pressure on energy companies, particularly those with balance sheets that were heavily geared to fund the development of LNG plants in Gladstone. The capital expenditure on these plants, which also contributed to the growth in the economy, has reduced as construction of the plants is now largely complete.
As the resources and energy sectors lowered their spending the effect was felt across the economy and the GDP annual growth rate reduced to 2% in June 2015.
The economy had to transition away from its reliance on the resource and energy sectors and this transition continues today. Housing construction along the east coast has played a major role in this transition as has infrastructure and services. At the end of June 2016 the GDP rate was 3.3%.
10
For
per
sona
l use
onl
y

The annual growth rates of other developed nations for the period 2011 to 2015 have been lower than Australia’s as their economies are still recovering from the GFC. In these countries economic stimulus has largely been in the form of low interest rates. Long term bond rates are now at all time lows with negative bond yields in Europe and Japan.
11
For
per
sona
l use
onl
y
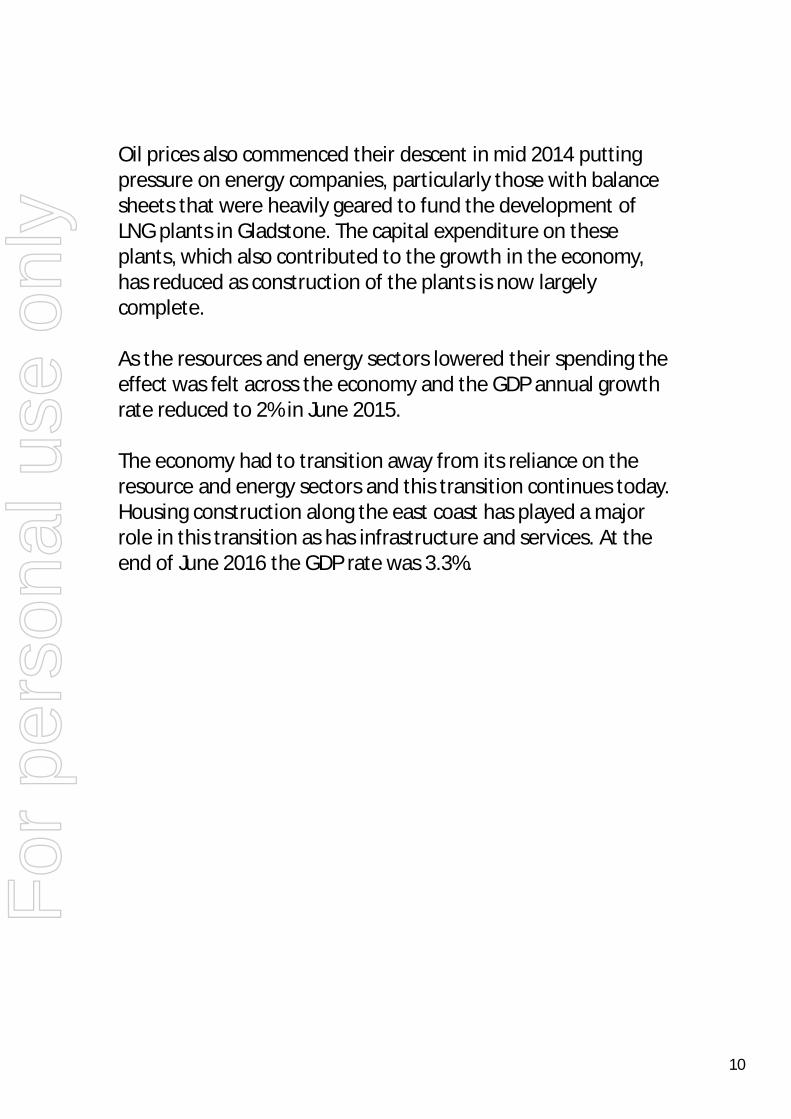
By comparison Australia’s interest rates remain relatively high despite the RBA cutting the official cash rate to just 1.5%. The rate cuts have so far had little impact on inflation with the CPI at the end of June 16 being 1% and the Australian dollar has remained higher than the RBA and our exporters would like.
As interest rates have fallen, investors have moved funds from low yielding cash accounts to relatively higher yielding asset classes such as equities, infrastructure and property and asset prices have risen. Accordingly the Australian securities market is trading on historically high forward PE ratios and dividend yields have been compressed.
There is a global ambition to lower banking risk and in Australia the requirement is for our Big 4 banks to be unquestionably strong. To comply the Big 4 banks issued additional equity over the past year making it difficult for them to maintain their return on capital, especially in a competitive, low interest rate environment. With the banks facing a number of headwinds their share prices have underperformed the market and are now trading on relatively lower PE ratios and higher dividend yields.
As always, there are also events on the horizon that affect the share market even though they are unlikely to affect the operating performance of many of our companies. Such events include interest rate increases in the US, the US election and Brexit.
12
For
per
sona
l use
onl
y
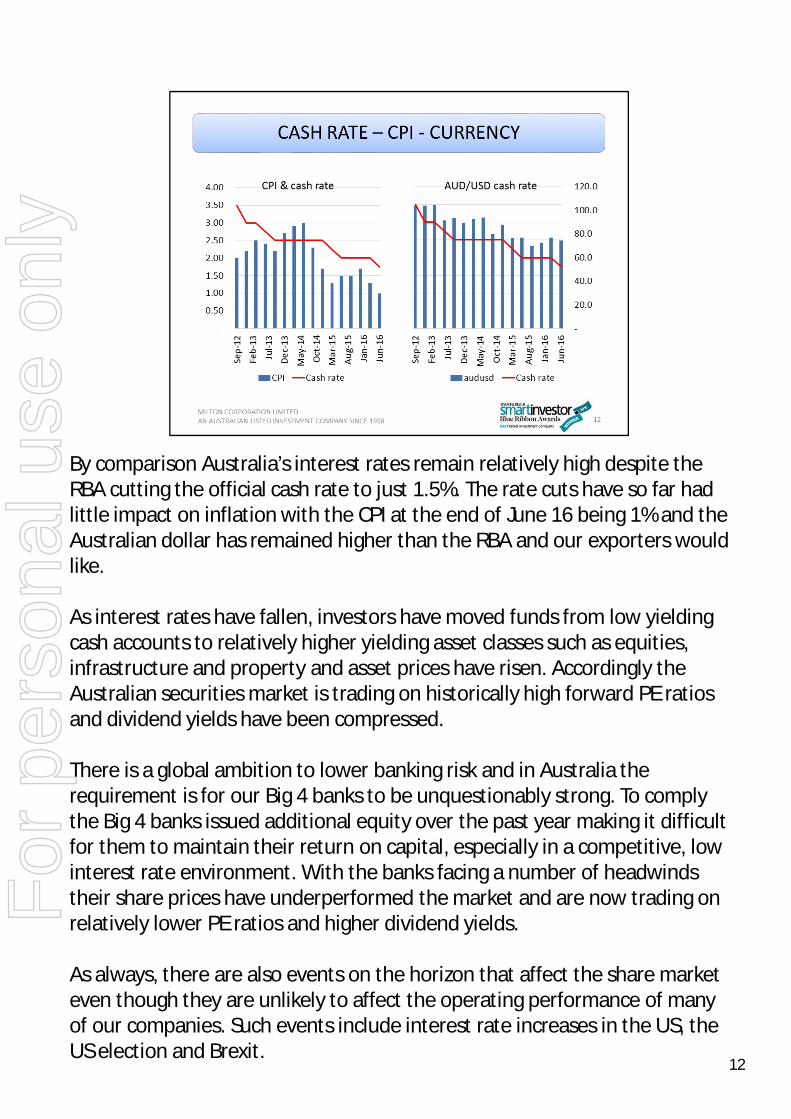
Turning now to the financial results for the 2016 year.
Milton delivered an underlying operating profit of $126.4 million, which was slightly higher than the prior year. Special dividends, which are excluded from the underlying profit, were lower this year but still added a further $1.5 million to the net profit.
The investment income, comprising dividends and distributions received from the long term equity portfolio, was a record $125.4 million. This exceeded the investment income earned in the prior year by $2.5 million.
13
For
per
sona
l use
onl
y

Investment income in the first half of the year was boosted by dividend per share increases from companies such as BHP Billiton, Bank of Queensland, Perpetual, Rio Tinto and Westpac.
However, these increases were partly offset by lower dividends per share from ALS, IAG and Woodside Petroleum.
Portfolio composition changes added $2.7 million to investment income.
Unfortunately, it was a different picture in the second half of the year with investment income down by $1.5 million when compared to the previous corresponding half.
Lower dividends per share were received from companies exposed to the energy and resources sectors, such as ALS, BHP Billiton, Origin, Santos, Woodside and Worley Parsons.
To compound the problem ANZ, Suncorp and Woolworths also reduced their dividends.
Increases were delivered by 57 companies with the larger increases coming from A P Eagers, Blackmores, Macquarie Group and TPG Telecom.
14
For
per
sona
l use
onl
y
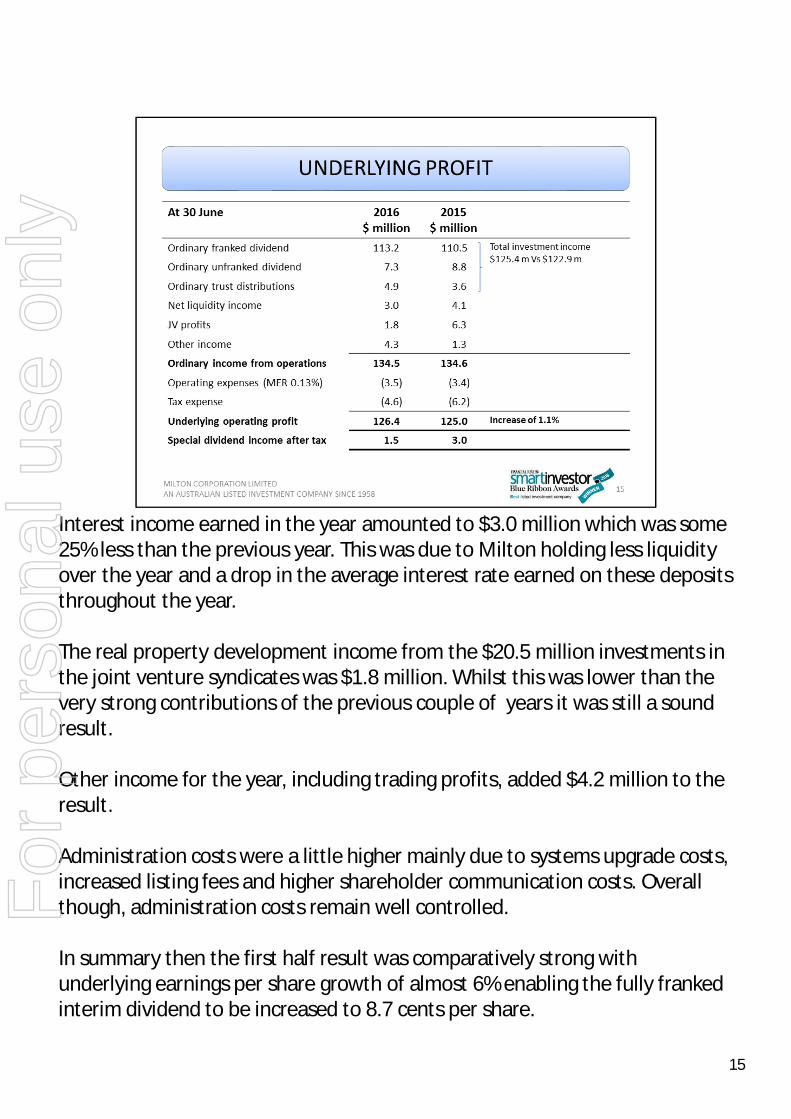
Interest income earned in the year amounted to $3.0 million which was some 25% less than the previous year. This was due to Milton holding less liquidity over the year and a drop in the average interest rate earned on these deposits throughout the year.
The real property development income from the $20.5 million investments in the joint venture syndicates was $1.8 million. Whilst this was lower than the very strong contributions of the previous couple of years it was still a sound result.
Other income for the year, including trading profits, added $4.2 million to the result.
Administration costs were a little higher mainly due to systems upgrade costs, increased listing fees and higher shareholder communication costs. Overall though, administration costs remain well controlled.
In summary then the first half result was comparatively strong with underlying earnings per share growth of almost 6% enabling the fully franked interim dividend to be increased to 8.7 cents per share.
15
For
per
sona
l use
onl
y
The underlying earnings per share in the second half were lower than the previous corresponding half however the final dividend was maintained at 9.9 cents per share.
Therefore, the full year ordinary dividend was increased by 1.1% and the resultant payout ratio for the year was 95.6% of underlying profit. This was just outside the target range of 90% to 95%.
With special dividends equating to just 0.3 cents per share no special dividend was declared.
15
For
per
sona
l use
onl
y
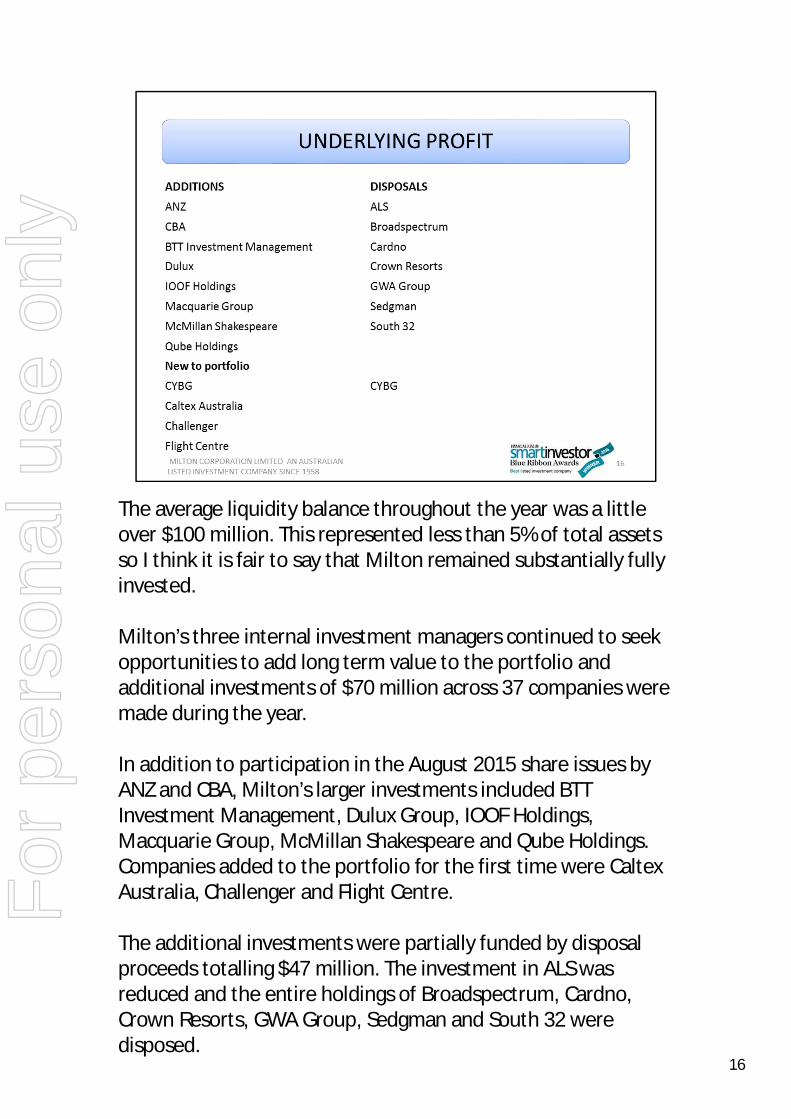
The average liquidity balance throughout the year was a little over $100 million. This represented less than 5% of total assets so I think it is fair to say that Milton remained substantially fully invested.
Milton’s three internal investment managers continued to seek opportunities to add long term value to the portfolio and additional investments of $70 million across 37 companies were made during the year.
In addition to participation in the August 2015 share issues by ANZ and CBA, Milton’s larger investments included BTT Investment Management, Dulux Group, IOOF Holdings, Macquarie Group, McMillan Shakespeare and Qube Holdings. Companies added to the portfolio for the first time were Caltex Australia, Challenger and Flight Centre.
The additional investments were partially funded by disposal proceeds totalling $47 million. The investment in ALS was reduced and the entire holdings of Broadspectrum, Cardno, Crown Resorts, GWA Group, Sedgman and South 32 were disposed.
16
For
per
sona
l use
onl
y
During the year NAB demerged its UK operations and Milton received CYBG shares and these shares were subsequently sold.
At the end of the financial year the long term investment portfolio was valued at $2.5 billion. If the entire investment portfolio had been sold at the balance date, there would have been a capital gains tax liability of $280 million, but of course there is no intention to sell the portfolio and so the realisation of this liability is extremely unlikely.
16
For
per
sona
l use
onl
y
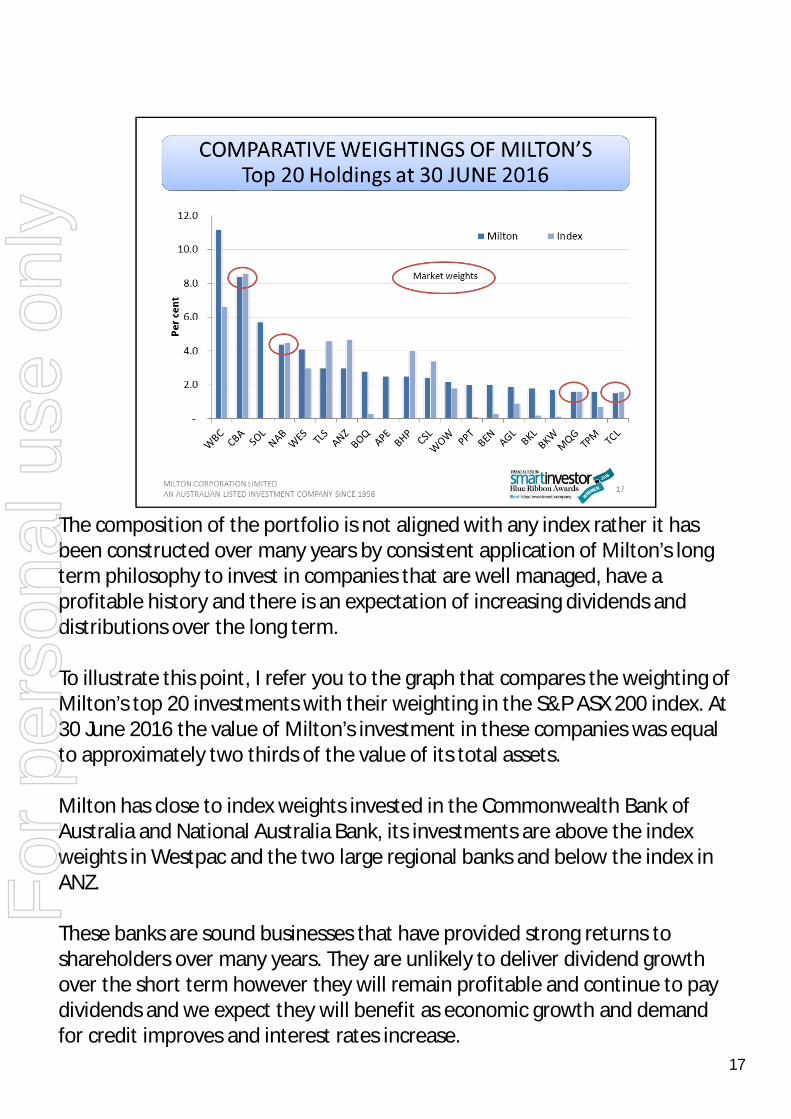
The composition of the portfolio is not aligned with any index rather it has been constructed over many years by consistent application of Milton’s long term philosophy to invest in companies that are well managed, have a profitable history and there is an expectation of increasing dividends and distributions over the long term.
To illustrate this point, I refer you to the graph that compares the weighting of Milton’s top 20 investments with their weighting in the S&P ASX 200 index. At 30 June 2016 the value of Milton’s investment in these companies was equal to approximately two thirds of the value of its total assets.
Milton has close to index weights invested in the Commonwealth Bank of Australia and National Australia Bank, its investments are above the index weights in Westpac and the two large regional banks and below the index in ANZ.
These banks are sound businesses that have provided strong returns to shareholders over many years. They are unlikely to deliver dividend growth over the short term however they will remain profitable and continue to pay dividends and we expect they will benefit as economic growth and demand for credit improves and interest rates increase.
17
For
per
sona
l use
onl
y
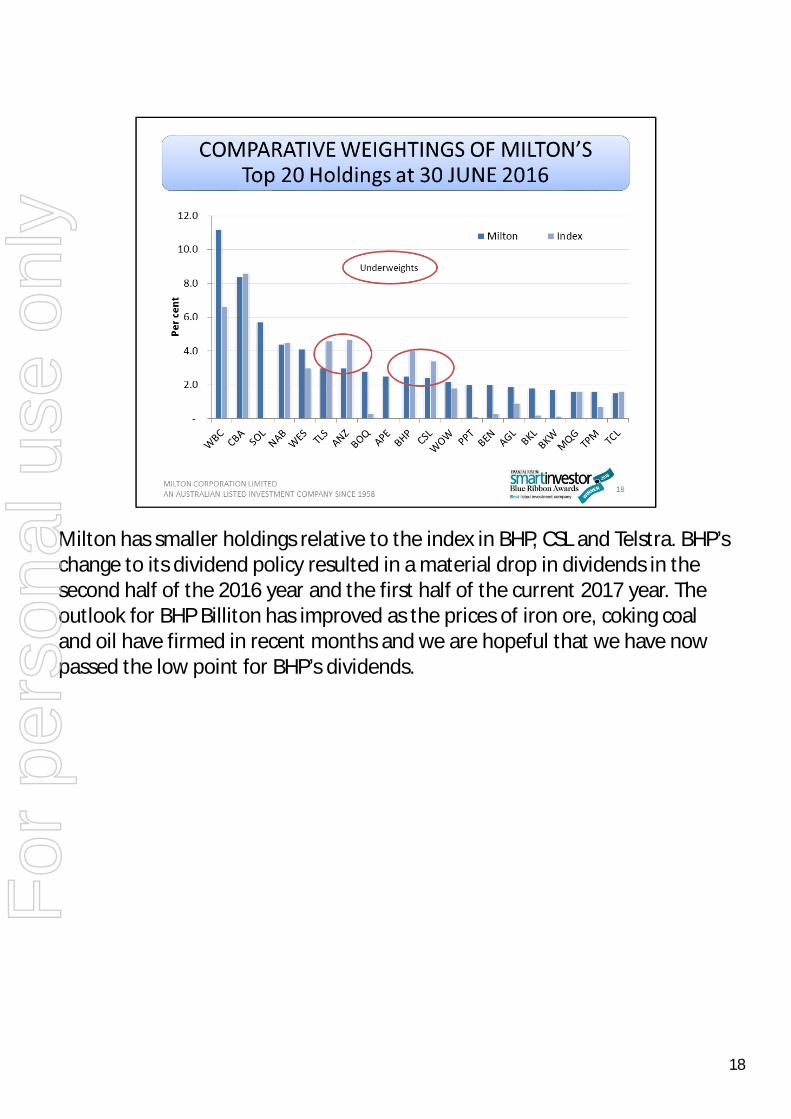
Milton has smaller holdings relative to the index in BHP, CSL and Telstra. BHP’s change to its dividend policy resulted in a material drop in dividends in the second half of the 2016 year and the first half of the current 2017 year. The outlook for BHP Billiton has improved as the prices of iron ore, coking coal and oil have firmed in recent months and we are hopeful that we have now passed the low point for BHP’s dividends.
18
For
per
sona
l use
onl
y
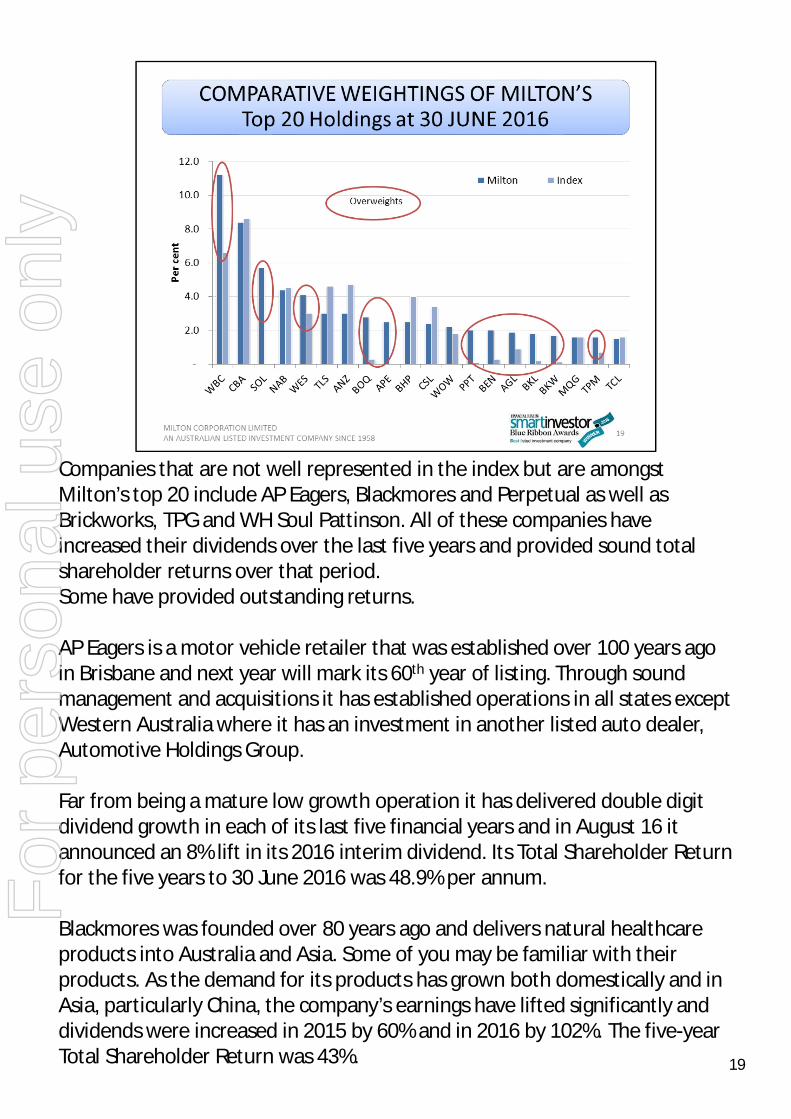
Companies that are not well represented in the index but are amongst Milton’s top 20 include AP Eagers, Blackmores and Perpetual as well as Brickworks, TPG and WH Soul Pattinson. All of these companies have increased their dividends over the last five years and provided sound total shareholder returns over that period.Some have provided outstanding returns.
AP Eagers is a motor vehicle retailer that was established over 100 years ago in Brisbane and next year will mark its 60th year of listing. Through sound management and acquisitions it has established operations in all states except Western Australia where it has an investment in another listed auto dealer, Automotive Holdings Group.
Far from being a mature low growth operation it has delivered double digit dividend growth in each of its last five financial years and in August 16 it announced an 8% lift in its 2016 interim dividend. Its Total Shareholder Return for the five years to 30 June 2016 was 48.9% per annum.
Blackmores was founded over 80 years ago and delivers natural healthcare products into Australia and Asia. Some of you may be familiar with their products. As the demand for its products has grown both domestically and in Asia, particularly China, the company’s earnings have lifted significantly and dividends were increased in 2015 by 60% and in 2016 by 102%. The five-year Total Shareholder Return was 43%. 19
For
per
sona
l use
onl
y

TPG has significantly expanded its operations and grown its dividend by more than 20% in each of the last 5 years and its five year Total Shareholder Return is 50.7% per annum.
19
For
per
sona
l use
onl
y
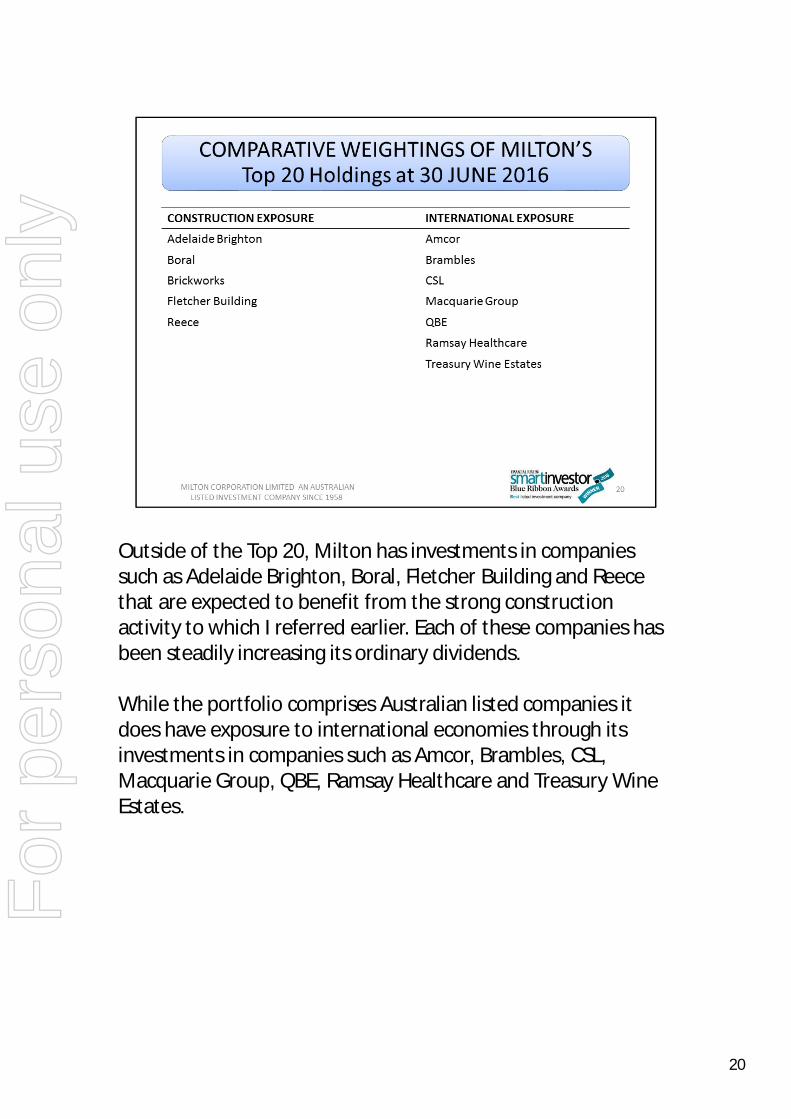
Outside of the Top 20, Milton has investments in companies such as Adelaide Brighton, Boral, Fletcher Building and Reece that are expected to benefit from the strong construction activity to which I referred earlier. Each of these companies has been steadily increasing its ordinary dividends.
While the portfolio comprises Australian listed companies it does have exposure to international economies through its investments in companies such as Amcor, Brambles, CSL, Macquarie Group, QBE, Ramsay Healthcare and Treasury Wine Estates.
20
For
per
sona
l use
onl
y
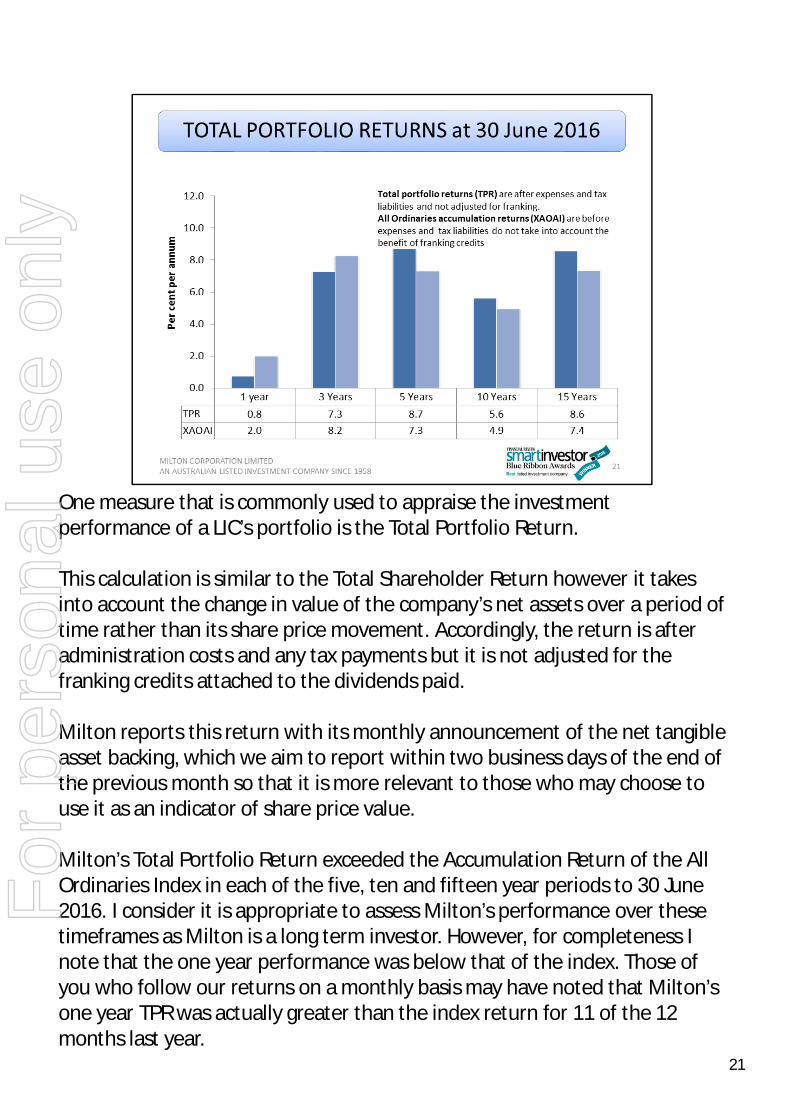
One measure that is commonly used to appraise the investment performance of a LIC’s portfolio is the Total Portfolio Return.
This calculation is similar to the Total Shareholder Return however it takes into account the change in value of the company’s net assets over a period of time rather than its share price movement. Accordingly, the return is after administration costs and any tax payments but it is not adjusted for the franking credits attached to the dividends paid.
Milton reports this return with its monthly announcement of the net tangible asset backing, which we aim to report within two business days of the end of the previous month so that it is more relevant to those who may choose to use it as an indicator of share price value.
Milton’s Total Portfolio Return exceeded the Accumulation Return of the All Ordinaries Index in each of the five, ten and fifteen year periods to 30 June 2016. I consider it is appropriate to assess Milton’s performance over these timeframes as Milton is a long term investor. However, for completeness I note that the one year performance was below that of the index. Those of you who follow our returns on a monthly basis may have noted that Milton’s one year TPR was actually greater than the index return for 11 of the 12 months last year.
21
For
per
sona
l use
onl
y
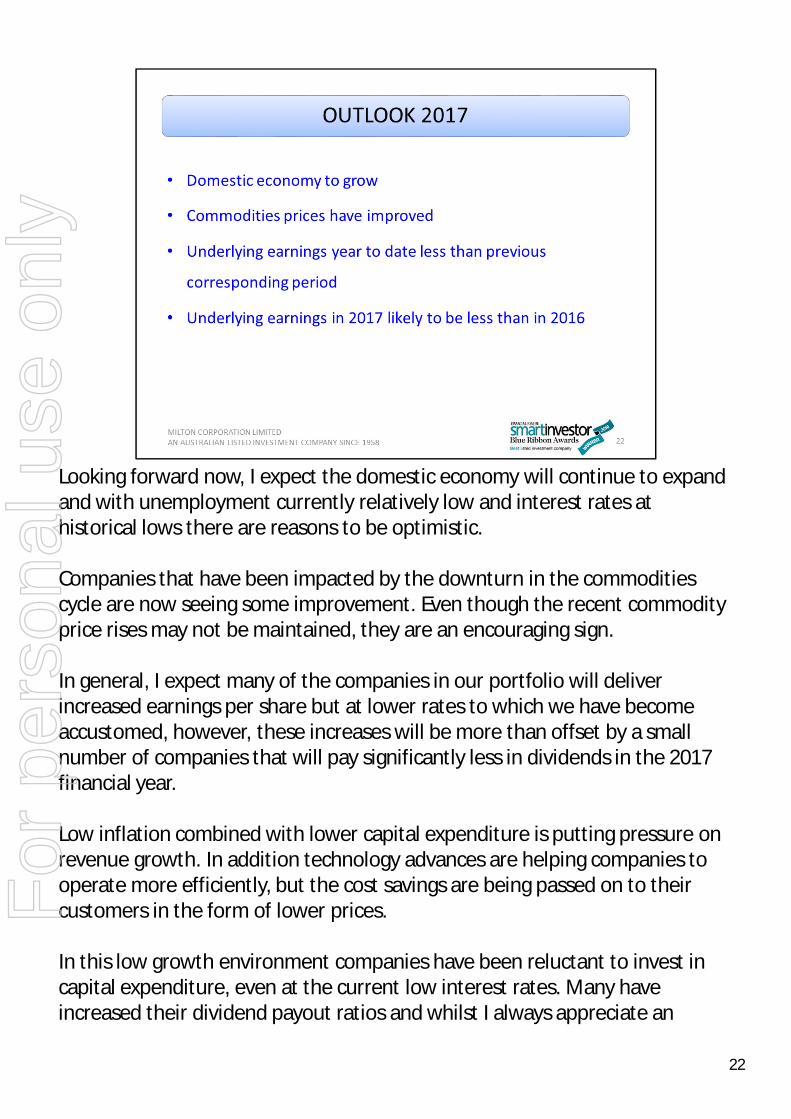
Looking forward now, I expect the domestic economy will continue to expand and with unemployment currently relatively low and interest rates at historical lows there are reasons to be optimistic.
Companies that have been impacted by the downturn in the commodities cycle are now seeing some improvement. Even though the recent commodity price rises may not be maintained, they are an encouraging sign.
In general, I expect many of the companies in our portfolio will deliver increased earnings per share but at lower rates to which we have become accustomed, however, these increases will be more than offset by a small number of companies that will pay significantly less in dividends in the 2017 financial year.
Low inflation combined with lower capital expenditure is putting pressure on revenue growth. In addition technology advances are helping companies to operate more efficiently, but the cost savings are being passed on to their customers in the form of lower prices.
In this low growth environment companies have been reluctant to invest in capital expenditure, even at the current low interest rates. Many have increased their dividend payout ratios and whilst I always appreciate an
22
For
per
sona
l use
onl
y
increase in dividends I am also wary of the impact on future dividend growth.
The banks have been a great source of dividend growth for a number of years now, however we are not expecting to see much dividend growth from them over the short term. Our current expectation is that the banks, with the exception of ANZ, will maintain their dividends to be paid in this 2017 financial year. We do believe they are sound businesses that will return to growth as the economy improves and interest rates increase.
With the half year reporting largely completed, we have seen a few companies, particularly those in the resource, energy and retail sectors, reduce their dividends and it is clear that Milton’s underlying operating profit for the first half and the full 2017 financial year is likely to be less than the 2016 results.
The directors are aware of the importance of at least maintaining the level of ordinary dividends and may consider paying a greater proportion of profits than the preferred 90% to 95% of underlying operating profit. When considering the declaration of dividends your directors take into account the current year underlying earnings as well as the outlook for future periods and the franking credits and funds available to be distributed.
In closing I would like to acknowledge the efforts of our small team at Milton and the support and counsel we receive from the non executive directors.
22
For
per
sona
l use
onl
y

23
For
per
sona
l use
onl
y