Embed Size (px)
Citation preview
1
2016 INTERIM RESULT 15 August 2016
For
per
sona
l use
onl
y
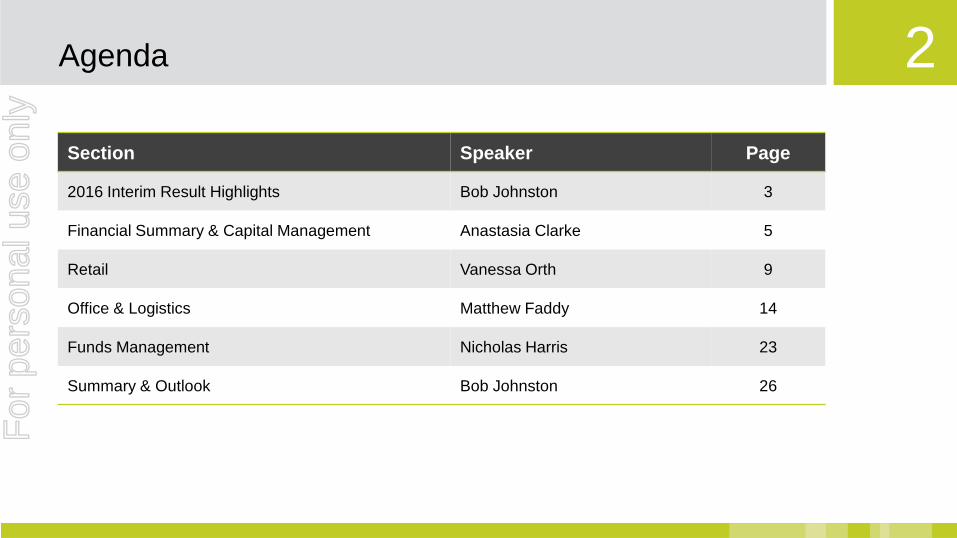
2 Agenda
Section Speaker Page
2016 Interim Result Highlights Bob Johnston 3
Financial Summary & Capital Management Anastasia Clarke 5
Retail Vanessa Orth 9
Office & Logistics Matthew Faddy 14
Funds Management Nicholas Harris 23
Summary & Outlook Bob Johnston 26
For
per
sona
l use
onl
y
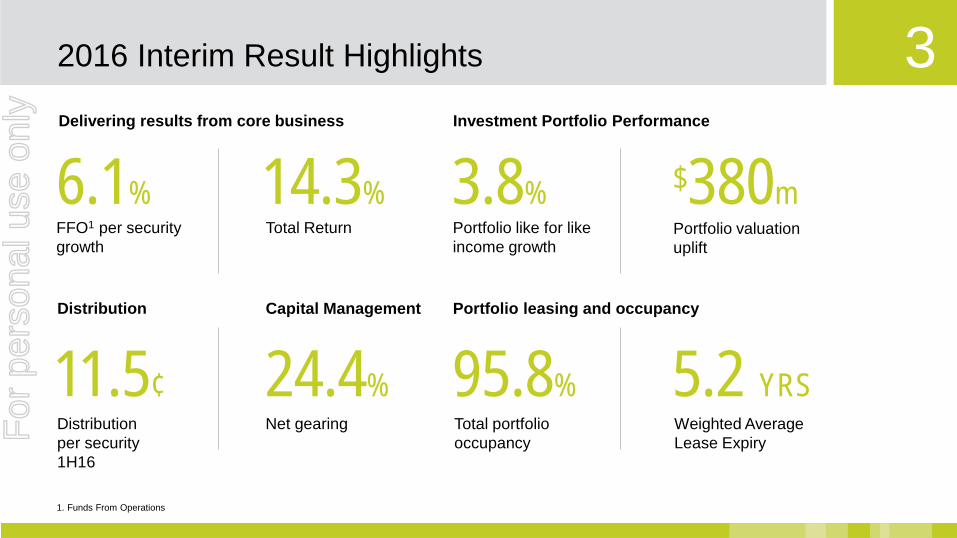
3 2016 Interim Result Highlights
6.1% 14.3%
Delivering results from core business
FFO1 per security growth
Total Return
Capital Management
1. Funds From Operations
Net gearing Distribution per security 1H16
24.4% 11.5¢
3.8% Portfolio valuation uplift
95.8%
Portfolio leasing and occupancy
Total portfolio occupancy
5.2 YRS Weighted Average Lease Expiry
Portfolio like for like income growth
Investment Portfolio Performance
$380m
Distribution
For
per
sona
l use
onl
y
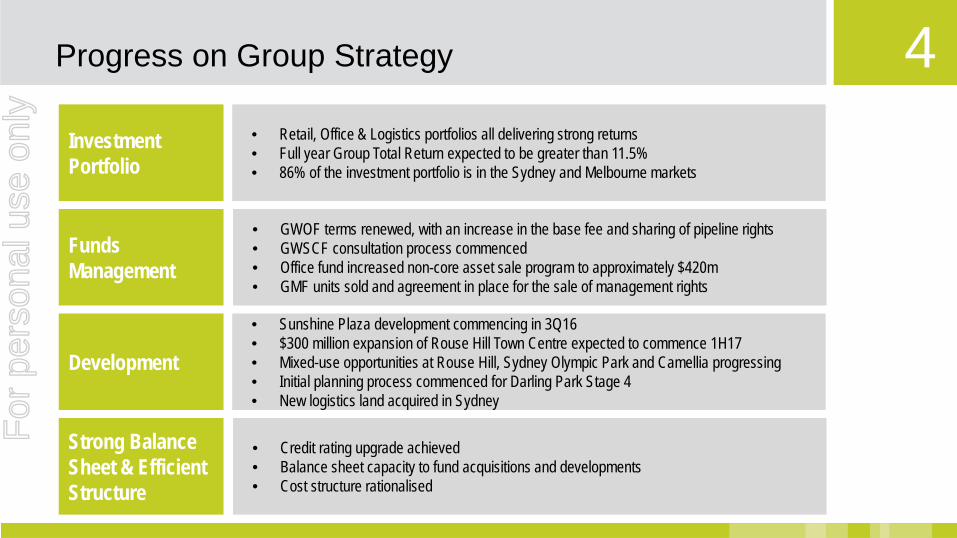
4 Progress on Group Strategy
Investment Portfolio
• Retail, Office & Logistics portfolios all delivering strong returns • Full year Group Total Return expected to be greater than 11.5% • 86% of the investment portfolio is in the Sydney and Melbourne markets
Funds Management
• GWOF terms renewed, with an increase in the base fee and sharing of pipeline rights • GWSCF consultation process commenced • Office fund increased non-core asset sale program to approximately $420m • GMF units sold and agreement in place for the sale of management rights
Development
• Sunshine Plaza development commencing in 3Q16 • $300 million expansion of Rouse Hill Town Centre expected to commence 1H17 • Mixed-use opportunities at Rouse Hill, Sydney Olympic Park and Camellia progressing • Initial planning process commenced for Darling Park Stage 4 • New logistics land acquired in Sydney
Strong Balance Sheet & Efficient Structure
• Credit rating upgrade achieved • Balance sheet capacity to fund acquisitions and developments • Cost structure rationalised
For
per
sona
l use
onl
y
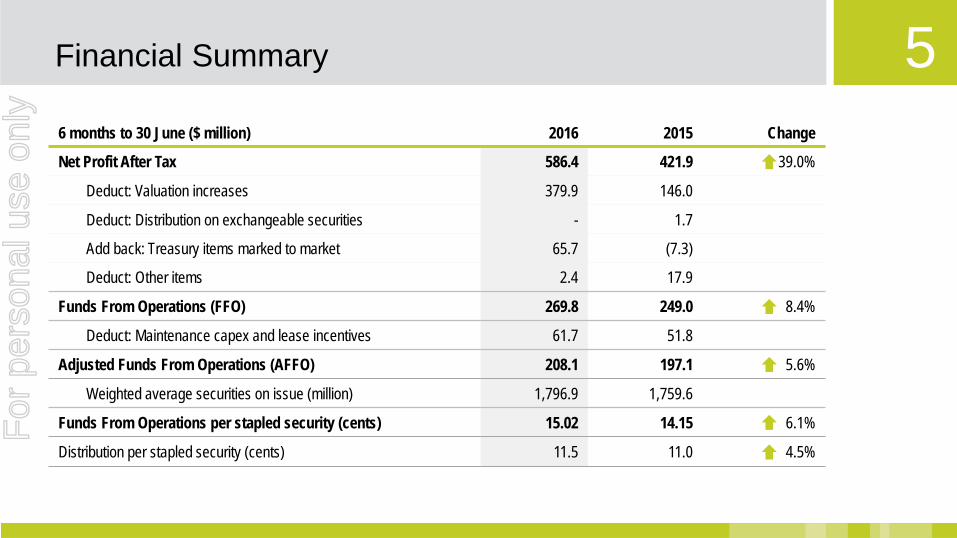
5 Financial Summary
6 months to 30 June ($ million) 2016 2015 Change
Net Profit After Tax 586.4 421.9 39.0%
Deduct: Valuation increases 379.9 146.0
Deduct: Distribution on exchangeable securities - 1.7
Add back: Treasury items marked to market 65.7 (7.3)
Deduct: Other items 2.4 17.9
Funds From Operations (FFO) 269.8 249.0 8.4%
Deduct: Maintenance capex and lease incentives 61.7 51.8
Adjusted Funds From Operations (AFFO) 208.1 197.1 5.6%
Weighted average securities on issue (million) 1,796.9 1,759.6
Funds From Operations per stapled security (cents) 15.02 14.15 6.1%
Distribution per stapled security (cents) 11.5 11.0 4.5%
For
per
sona
l use
onl
y
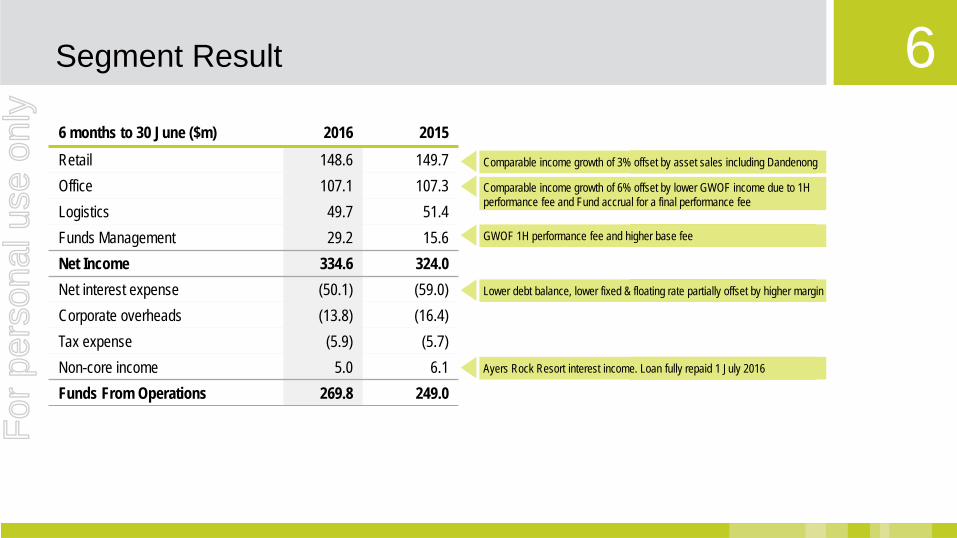
6 Segment Result
Comparable income growth of 3% offset by asset sales including Dandenong
6 months to 30 June ($m) 2016 2015 Retail 148.6 149.7 Office 107.1 107.3 Logistics 49.7 51.4 Funds Management 29.2 15.6 Net Income 334.6 324.0 Net interest expense (50.1) (59.0) Corporate overheads (13.8) (16.4) Tax expense (5.9) (5.7) Non-core income 5.0 6.1 Funds From Operations 269.8 249.0
Comparable income growth of 6% offset by lower GWOF income due to 1H performance fee and Fund accrual for a final performance fee
GWOF 1H performance fee and higher base fee
Ayers Rock Resort interest income. Loan fully repaid 1 July 2016
Lower debt balance, lower fixed & floating rate partially offset by higher margin
For
per
sona
l use
onl
y
7 GWOF Performance Fee
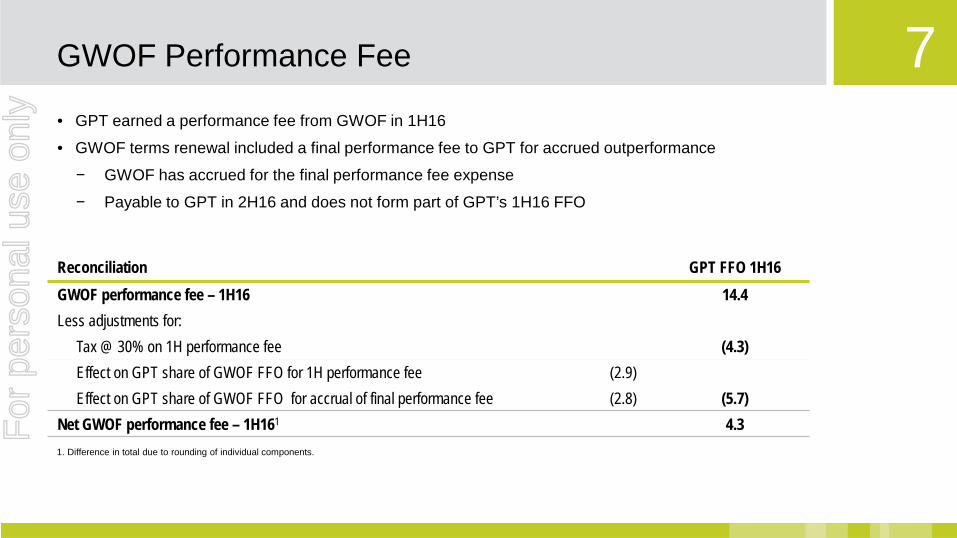
Reconciliation GPT FFO 1H16 GWOF performance fee – 1H16 14.4 Less adjustments for:
Tax @ 30% on 1H performance fee (4.3) Effect on GPT share of GWOF FFO for 1H performance fee (2.9) Effect on GPT share of GWOF FFO for accrual of final performance fee (2.8) (5.7)
Net GWOF performance fee – 1H161 4.3
• GPT earned a performance fee from GWOF in 1H16
• GWOF terms renewal included a final performance fee to GPT for accrued outperformance
− GWOF has accrued for the final performance fee expense
− Payable to GPT in 2H16 and does not form part of GPT’s 1H16 FFO
1. Difference in total due to rounding of individual components.
For
per
sona
l use
onl
y
8 Capital Management
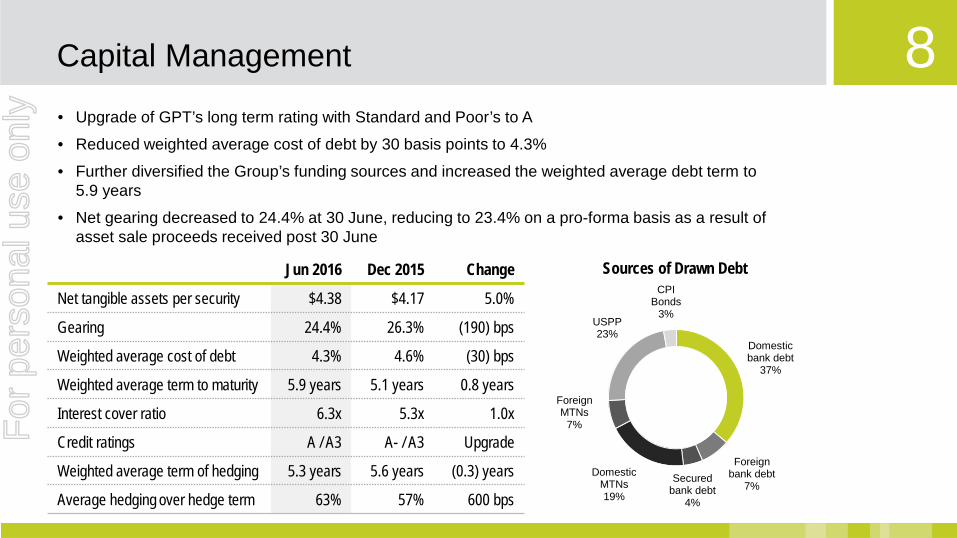
Sources of Drawn Debt Jun 2016 Dec 2015 Change
Net tangible assets per security $4.38 $4.17 5.0%
Gearing 24.4% 26.3% (190) bps
Weighted average cost of debt 4.3% 4.6% (30) bps
Weighted average term to maturity 5.9 years 5.1 years 0.8 years
Interest cover ratio 6.3x 5.3x 1.0x
Credit ratings A / A3 A- / A3 Upgrade
Weighted average term of hedging 5.3 years 5.6 years (0.3) years
Average hedging over hedge term 63% 57% 600 bps
• Upgrade of GPT’s long term rating with Standard and Poor’s to A
• Reduced weighted average cost of debt by 30 basis points to 4.3%
• Further diversified the Group’s funding sources and increased the weighted average debt term to 5.9 years
• Net gearing decreased to 24.4% at 30 June, reducing to 23.4% on a pro-forma basis as a result of asset sale proceeds received post 30 June
Domestic bank debt
37%
Foreign bank debt
7% Secured
bank debt 4%
Domestic MTNs 19%
Foreign MTNs
7%
USPP 23%
CPI Bonds
3%
For
per
sona
l use
onl
y
9 Retail | Highlights
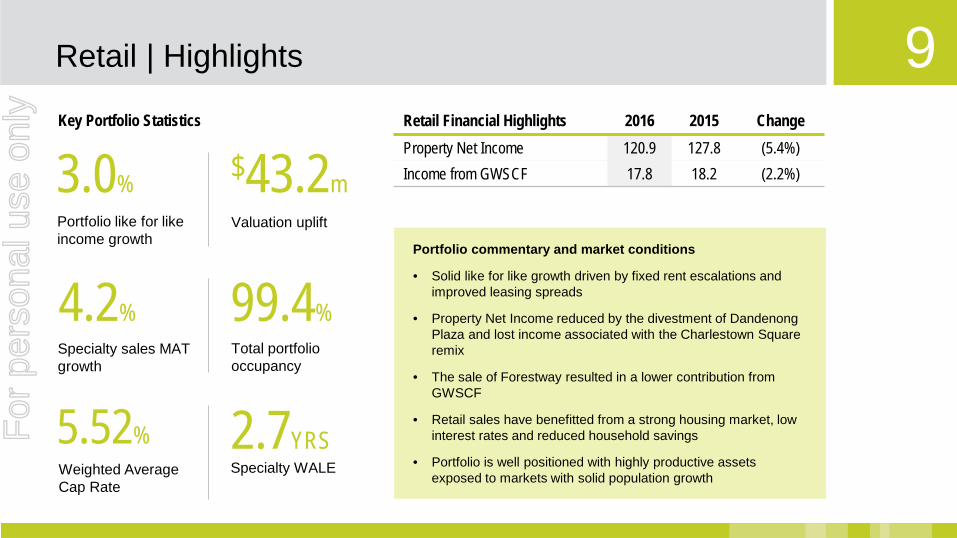
Retail Financial Highlights 2016 2015 Change Property Net Income 120.9 127.8 (5.4%) Income from GWSCF 17.8 18.2 (2.2%)
Portfolio commentary and market conditions
• Solid like for like growth driven by fixed rent escalations and improved leasing spreads
• Property Net Income reduced by the divestment of Dandenong Plaza and lost income associated with the Charlestown Square remix
• The sale of Forestway resulted in a lower contribution from GWSCF
• Retail sales have benefitted from a strong housing market, low interest rates and reduced household savings
• Portfolio is well positioned with highly productive assets exposed to markets with solid population growth
3.0% $43.2m Valuation uplift
4.2% Specialty sales MAT growth
99.4% Total portfolio occupancy
Portfolio like for like income growth
Key Portfolio Statistics
2.7YRS Specialty WALE
5.52% Weighted Average Cap Rate
For
per
sona
l use
onl
y
10 Retail | Specialty Sales
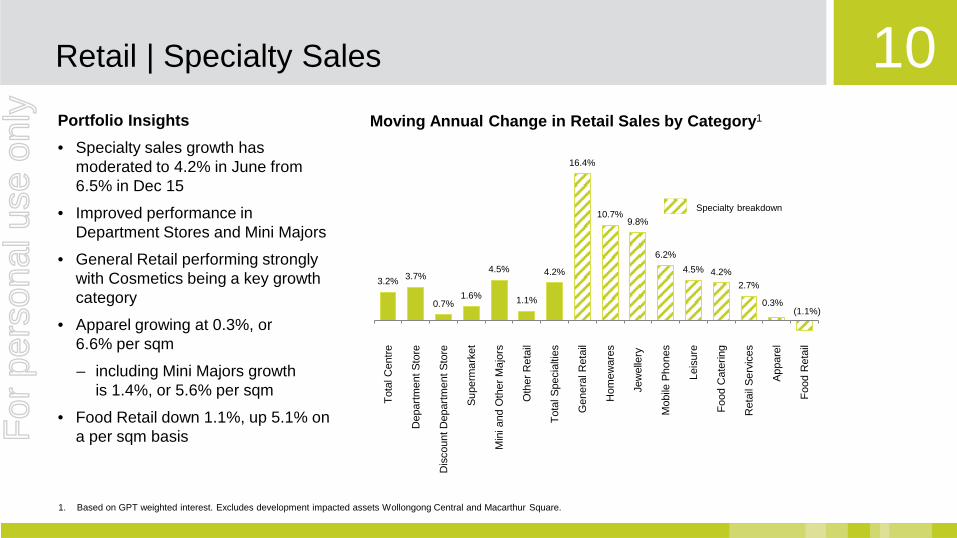
Moving Annual Change in Retail Sales by Category1
1. Based on GPT weighted interest. Excludes development impacted assets Wollongong Central and Macarthur Square.
3.2% 3.7%
0.7% 1.6%
4.5%
1.1%
4.2%
16.4%
10.7% 9.8%
6.2% 4.5% 4.2%
2.7%
0.3% (1.1%)
Tota
l Cen
tre
Dep
artm
ent S
tore
Dis
coun
t Dep
artm
ent S
tore
Supe
rmar
ket
Min
i and
Oth
er M
ajor
s
Oth
er R
etai
l
Tota
l Spe
cial
ties
Gen
eral
Ret
ail
Hom
ewar
es
Jew
elle
ry
Mob
ile P
hone
s
Leis
ure
Food
Cat
erin
g
Ret
ail S
ervi
ces
Appa
rel
Food
Ret
ail
Specialty breakdown
Portfolio Insights • Specialty sales growth has
moderated to 4.2% in June from 6.5% in Dec 15
• Improved performance in Department Stores and Mini Majors
• General Retail performing strongly with Cosmetics being a key growth category
• Apparel growing at 0.3%, or 6.6% per sqm
– including Mini Majors growth is 1.4%, or 5.6% per sqm
• Food Retail down 1.1%, up 5.1% on a per sqm basis F
or p
erso
nal u
se o
nly
11 Retail | Leasing
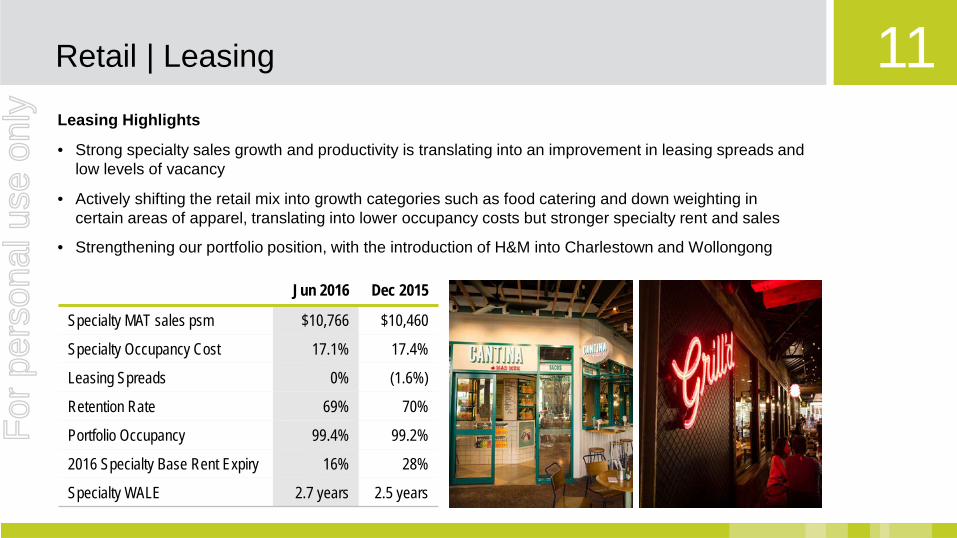
Leasing Highlights
• Strong specialty sales growth and productivity is translating into an improvement in leasing spreads and low levels of vacancy
• Actively shifting the retail mix into growth categories such as food catering and down weighting in certain areas of apparel, translating into lower occupancy costs but stronger specialty rent and sales
• Strengthening our portfolio position, with the introduction of H&M into Charlestown and Wollongong
Jun 2016 Dec 2015
Specialty MAT sales psm $10,766 $10,460
Specialty Occupancy Cost 17.1% 17.4%
Leasing Spreads 0% (1.6%)
Retention Rate 69% 70%
Portfolio Occupancy 99.4% 99.2%
2016 Specialty Base Rent Expiry 16% 28%
Specialty WALE 2.7 years 2.5 years
For
per
sona
l use
onl
y
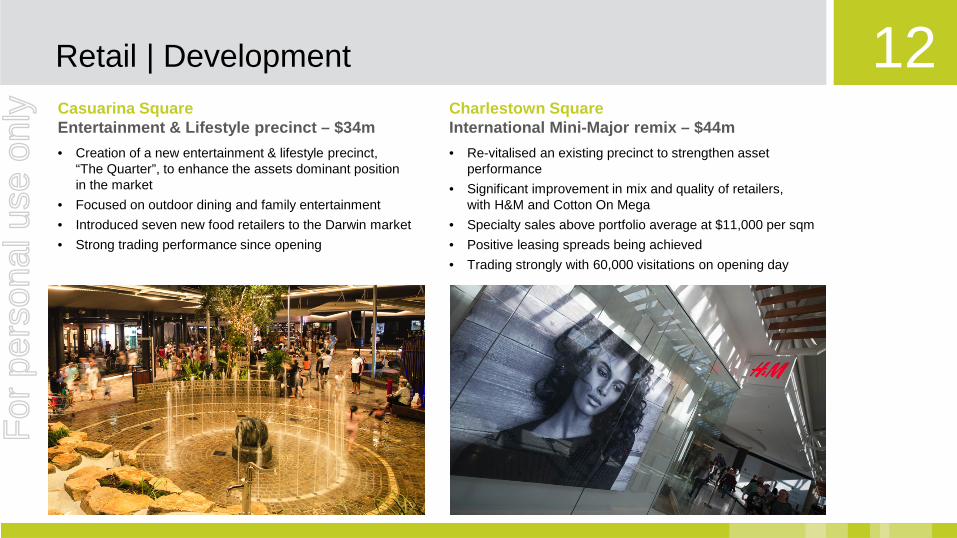
12 Retail | Development Casuarina Square Entertainment & Lifestyle precinct – $34m • Creation of a new entertainment & lifestyle precinct,
“The Quarter”, to enhance the assets dominant position in the market
• Focused on outdoor dining and family entertainment • Introduced seven new food retailers to the Darwin market • Strong trading performance since opening
Charlestown Square International Mini-Major remix – $44m • Re-vitalised an existing precinct to strengthen asset
performance • Significant improvement in mix and quality of retailers,
with H&M and Cotton On Mega • Specialty sales above portfolio average at $11,000 per sqm • Positive leasing spreads being achieved • Trading strongly with 60,000 visitations on opening day
For
per
sona
l use
onl
y
13 Retail | Sunshine Plaza Development
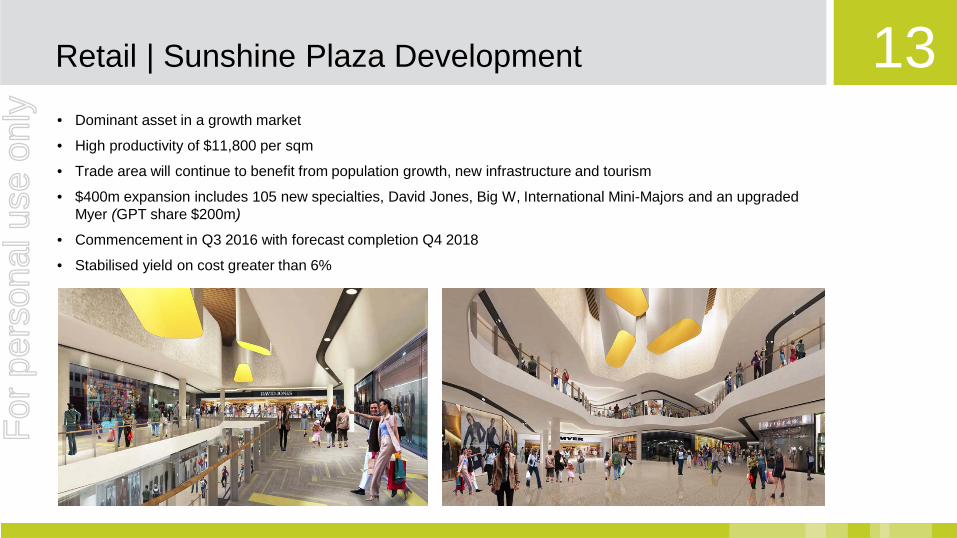
• Dominant asset in a growth market
• High productivity of $11,800 per sqm
• Trade area will continue to benefit from population growth, new infrastructure and tourism
• $400m expansion includes 105 new specialties, David Jones, Big W, International Mini-Majors and an upgraded Myer (GPT share $200m)
• Commencement in Q3 2016 with forecast completion Q4 2018
• Stabilised yield on cost greater than 6%
For
per
sona
l use
onl
y
14 Office | Highlights
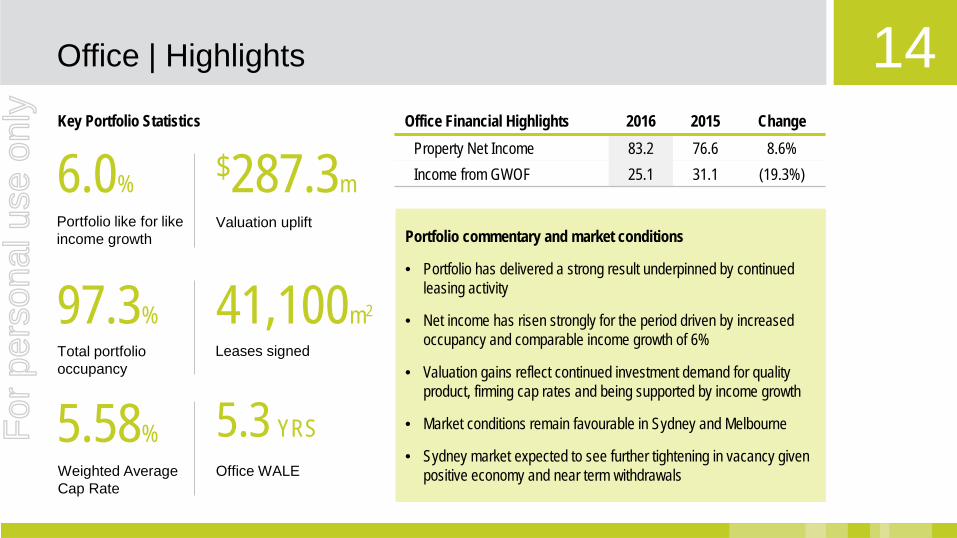
Portfolio commentary and market conditions
• Portfolio has delivered a strong result underpinned by continued leasing activity
• Net income has risen strongly for the period driven by increased occupancy and comparable income growth of 6%
• Valuation gains reflect continued investment demand for quality product, firming cap rates and being supported by income growth
• Market conditions remain favourable in Sydney and Melbourne
• Sydney market expected to see further tightening in vacancy given positive economy and near term withdrawals
6.0% $287.3m Valuation uplift
97.3% Total portfolio occupancy
41,100m2
Leases signed
Portfolio like for like income growth
Key Portfolio Statistics
5.58% Weighted Average Cap Rate
5.3 YRS Office WALE
Office Financial Highlights 2016 2015 Change Property Net Income 83.2 76.6 8.6% Income from GWOF 25.1 31.1 (19.3%)
For
per
sona
l use
onl
y
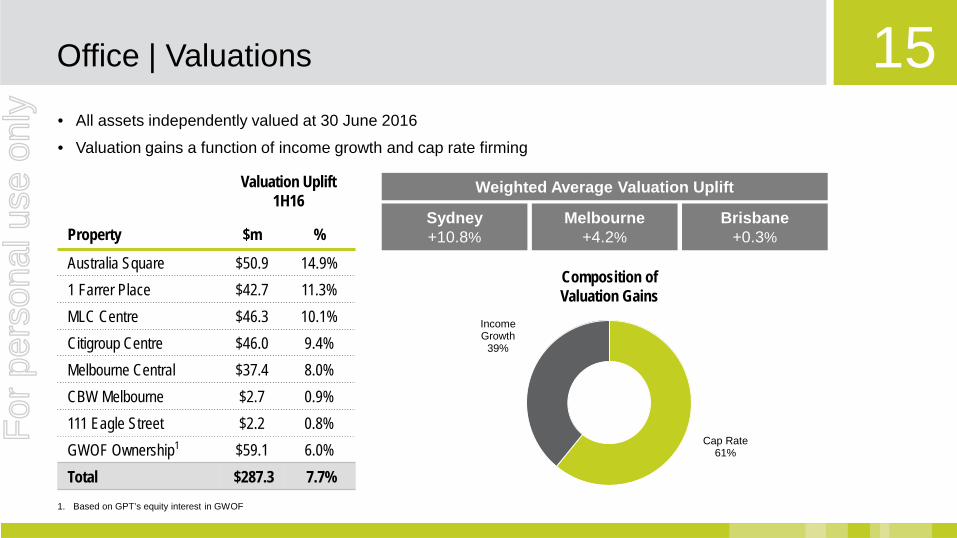
15 Office | Valuations
Property
Valuation Uplift 1H16
$m %
Australia Square $50.9 14.9% 1 Farrer Place $42.7 11.3% MLC Centre $46.3 10.1% Citigroup Centre $46.0 9.4% Melbourne Central $37.4 8.0% CBW Melbourne $2.7 0.9% 111 Eagle Street $2.2 0.8% GWOF Ownership1 $59.1 6.0% Total $287.3 7.7%
Cap Rate 61%
Income Growth
39%
Composition of Valuation Gains
Sydney +10.8%
Melbourne +4.2%
Brisbane +0.3%
• All assets independently valued at 30 June 2016
• Valuation gains a function of income growth and cap rate firming
Weighted Average Valuation Uplift
1. Based on GPT’s equity interest in GWOF
For
per
sona
l use
onl
y
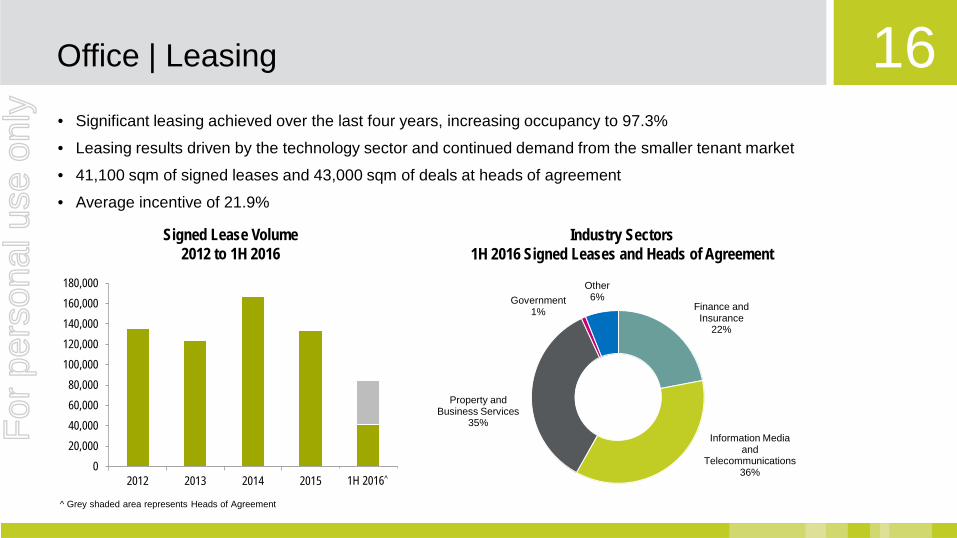
16
Finance and Insurance
22%
Information Media and
Telecommunications 36%
Property and Business Services
35%
Government 1%
Other 6%
Office | Leasing
• Significant leasing achieved over the last four years, increasing occupancy to 97.3%
• Leasing results driven by the technology sector and continued demand from the smaller tenant market
• 41,100 sqm of signed leases and 43,000 sqm of deals at heads of agreement
• Average incentive of 21.9%
Signed Lease Volume 2012 to 1H 2016
020,00040,00060,00080,000
100,000120,000140,000160,000180,000
2012 2013 2014 2015 H1 2016
Grey shaded area represents Heads of Agreement
Industry Sectors 1H 2016 Signed Leases and Heads of Agreement
1H 2016^
For
per
sona
l use
onl
y
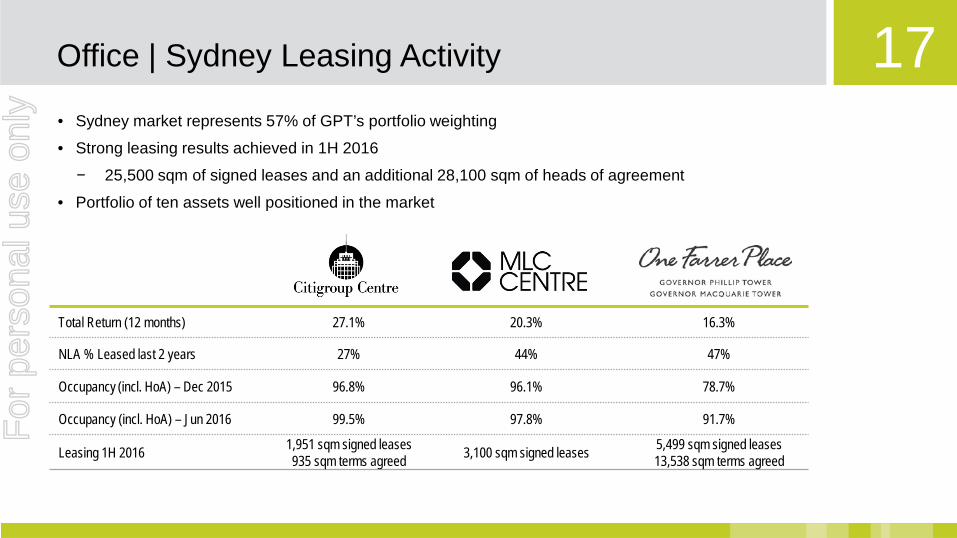
17 Office | Sydney Leasing Activity
• Sydney market represents 57% of GPT’s portfolio weighting
• Strong leasing results achieved in 1H 2016
− 25,500 sqm of signed leases and an additional 28,100 sqm of heads of agreement
• Portfolio of ten assets well positioned in the market
Total Return (12 months) 27.1% 20.3% 16.3%
NLA % Leased last 2 years 27% 44% 47%
Occupancy (incl. HoA) – Dec 2015 96.8% 96.1% 78.7%
Occupancy (incl. HoA) – Jun 2016 99.5% 97.8% 91.7%
Leasing 1H 2016 1,951 sqm signed leases 935 sqm terms agreed 3,100 sqm signed leases 5,499 sqm signed leases
13,538 sqm terms agreed
For
per
sona
l use
onl
y
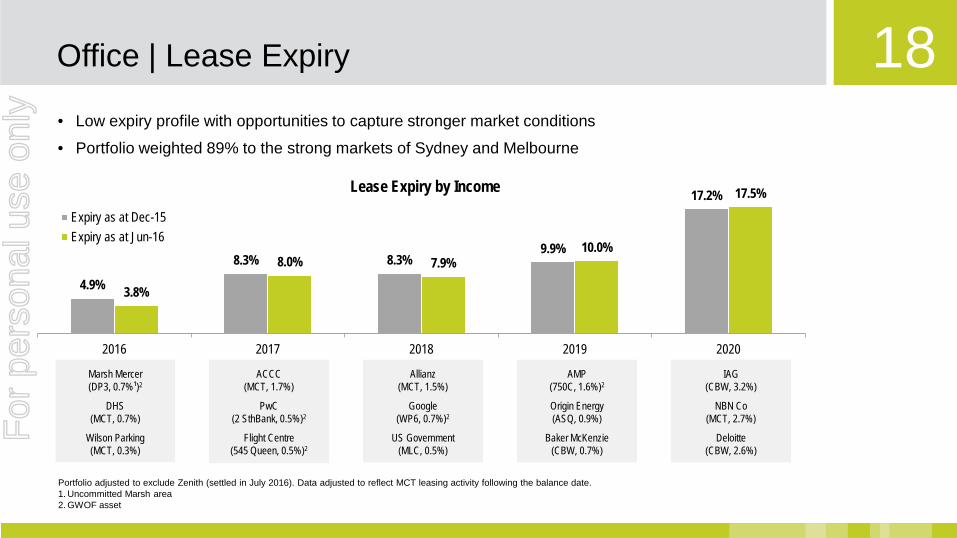
18 Office | Lease Expiry
Portfolio adjusted to exclude Zenith (settled in July 2016). Data adjusted to reflect MCT leasing activity following the balance date. 1. Uncommitted Marsh area 2. GWOF asset
Lease Expiry by Income
• Low expiry profile with opportunities to capture stronger market conditions
• Portfolio weighted 89% to the strong markets of Sydney and Melbourne
Marsh Mercer (DP3, 0.7%¹)2
DHS (MCT, 0.7%)
Wilson Parking (MCT, 0.3%)
ACCC (MCT, 1.7%)
PwC (2 SthBank, 0.5%)2
Flight Centre (545 Queen, 0.5%)2
Allianz (MCT, 1.5%)
Google (WP6, 0.7%)2
US Government (MLC, 0.5%)
AMP (750C, 1.6%)2
Origin Energy (ASQ, 0.9%)
Baker McKenzie (CBW, 0.7%)
IAG (CBW, 3.2%)
NBN Co (MCT, 2.7%)
Deloitte (CBW, 2.6%)
4.9%
8.3% 8.3% 9.9%
17.2%
3.8%
8.0% 7.9% 10.0%
17.5%
2016 2017 2018 2019 2020
Expiry as at Dec-15Expiry as at Jun-16
For
per
sona
l use
onl
y
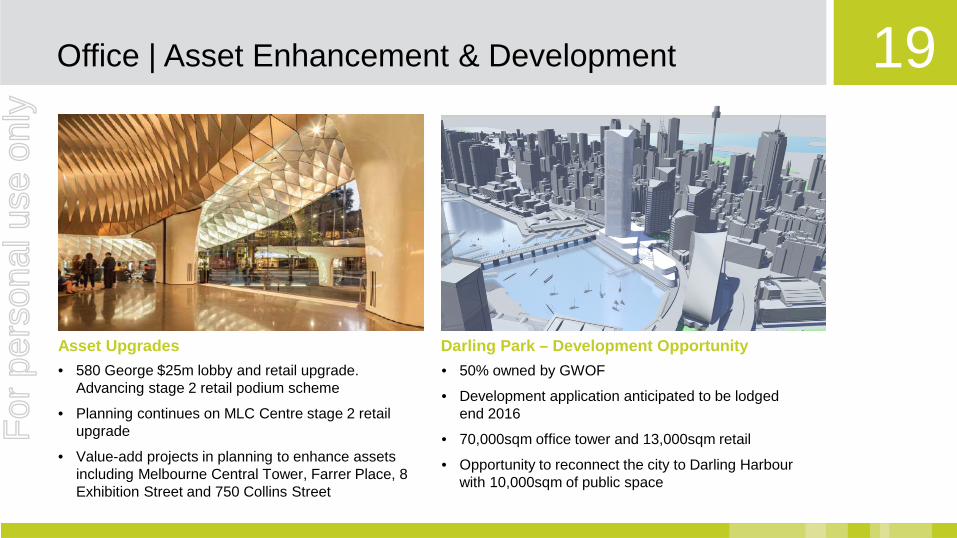
19 Office | Asset Enhancement & Development
Asset Upgrades Darling Park – Development Opportunity • 580 George $25m lobby and retail upgrade.
Advancing stage 2 retail podium scheme
• Planning continues on MLC Centre stage 2 retail upgrade
• Value-add projects in planning to enhance assets including Melbourne Central Tower, Farrer Place, 8 Exhibition Street and 750 Collins Street
• 50% owned by GWOF
• Development application anticipated to be lodged end 2016
• 70,000sqm office tower and 13,000sqm retail
• Opportunity to reconnect the city to Darling Harbour with 10,000sqm of public space
For
per
sona
l use
onl
y
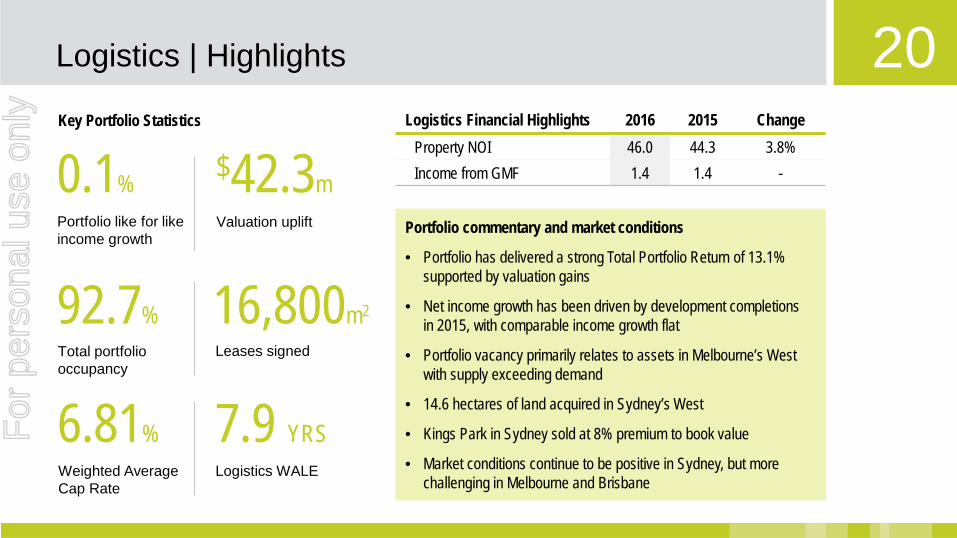
20 Logistics | Highlights
Logistics Financial Highlights 2016 2015 Change Property NOI 46.0 44.3 3.8% Income from GMF 1.4 1.4 -
Portfolio commentary and market conditions
• Portfolio has delivered a strong Total Portfolio Return of 13.1% supported by valuation gains
• Net income growth has been driven by development completions in 2015, with comparable income growth flat
• Portfolio vacancy primarily relates to assets in Melbourne’s West with supply exceeding demand
• 14.6 hectares of land acquired in Sydney’s West
• Kings Park in Sydney sold at 8% premium to book value
• Market conditions continue to be positive in Sydney, but more challenging in Melbourne and Brisbane
0.1% $42.3m Valuation uplift
92.7% Total portfolio occupancy
16,800m2
Leases signed
Portfolio like for like income growth
Key Portfolio Statistics
6.81% Weighted Average Cap Rate
7.9 YRS Logistics WALE
For
per
sona
l use
onl
y
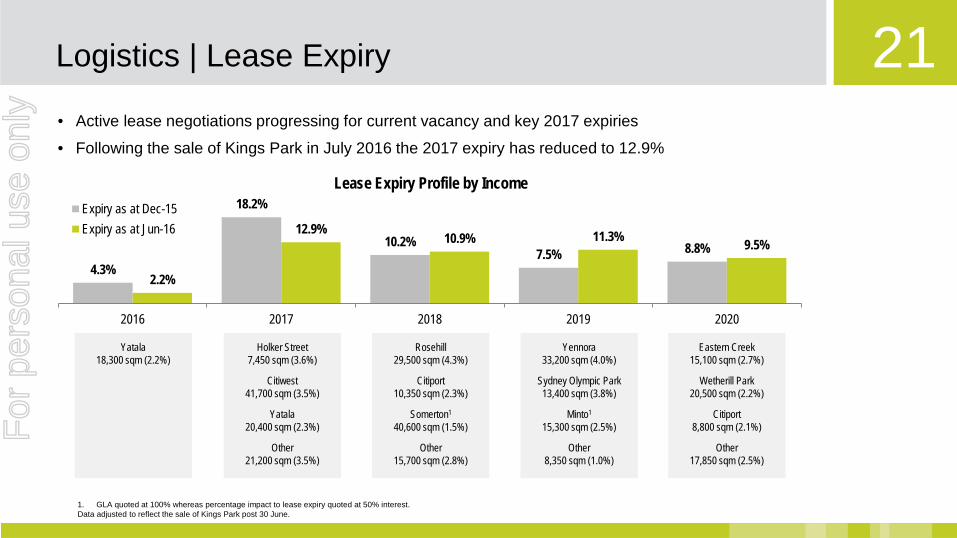
21 Logistics | Lease Expiry
Rosehill 29,500 sqm (4.3%)
Citiport 10,350 sqm (2.3%)
Somerton1 40,600 sqm (1.5%)
Other 15,700 sqm (2.8%)
Yatala 18,300 sqm (2.2%)
Holker Street 7,450 sqm (3.6%)
Citiwest 41,700 sqm (3.5%)
Yatala 20,400 sqm (2.3%)
Other 21,200 sqm (3.5%)
Yennora 33,200 sqm (4.0%)
Sydney Olympic Park 13,400 sqm (3.8%)
Minto1 15,300 sqm (2.5%)
Other 8,350 sqm (1.0%)
Eastern Creek 15,100 sqm (2.7%)
Wetherill Park 20,500 sqm (2.2%)
Citiport 8,800 sqm (2.1%)
Other 17,850 sqm (2.5%)
• Active lease negotiations progressing for current vacancy and key 2017 expiries
• Following the sale of Kings Park in July 2016 the 2017 expiry has reduced to 12.9%
4.3%
18.2%
10.2% 7.5% 8.8%
2.2%
12.9% 10.9% 11.3% 9.5%
2016 2017 2018 2019 2020
Lease Expiry Profile by Income Expiry as at Dec-15Expiry as at Jun-16
1. GLA quoted at 100% whereas percentage impact to lease expiry quoted at 50% interest. Data adjusted to reflect the sale of Kings Park post 30 June.
For
per
sona
l use
onl
y
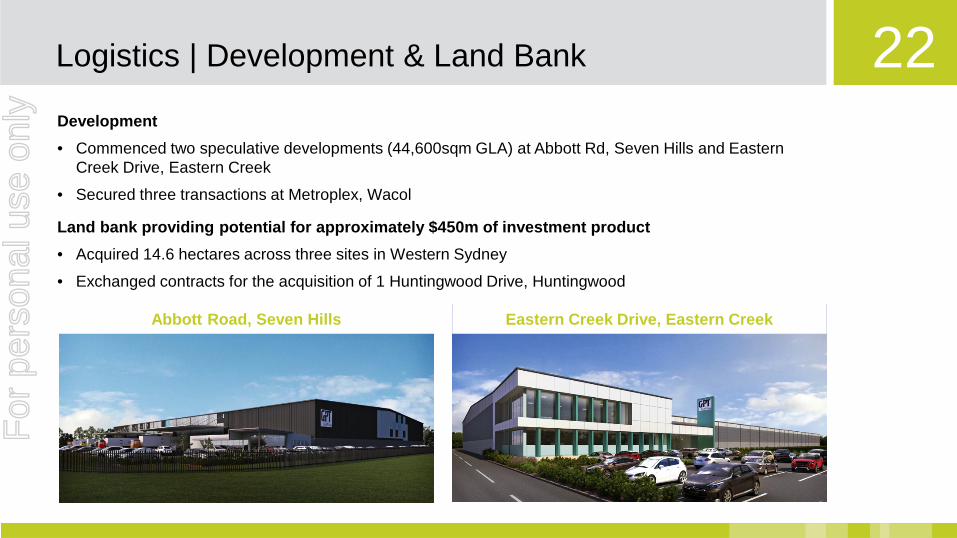
22 Logistics | Development & Land Bank
Development • Commenced two speculative developments (44,600sqm GLA) at Abbott Rd, Seven Hills and Eastern
Creek Drive, Eastern Creek
• Secured three transactions at Metroplex, Wacol
Land bank providing potential for approximately $450m of investment product • Acquired 14.6 hectares across three sites in Western Sydney
• Exchanged contracts for the acquisition of 1 Huntingwood Drive, Huntingwood
Abbott Road, Seven Hills Eastern Creek Drive, Eastern Creek
For
per
sona
l use
onl
y
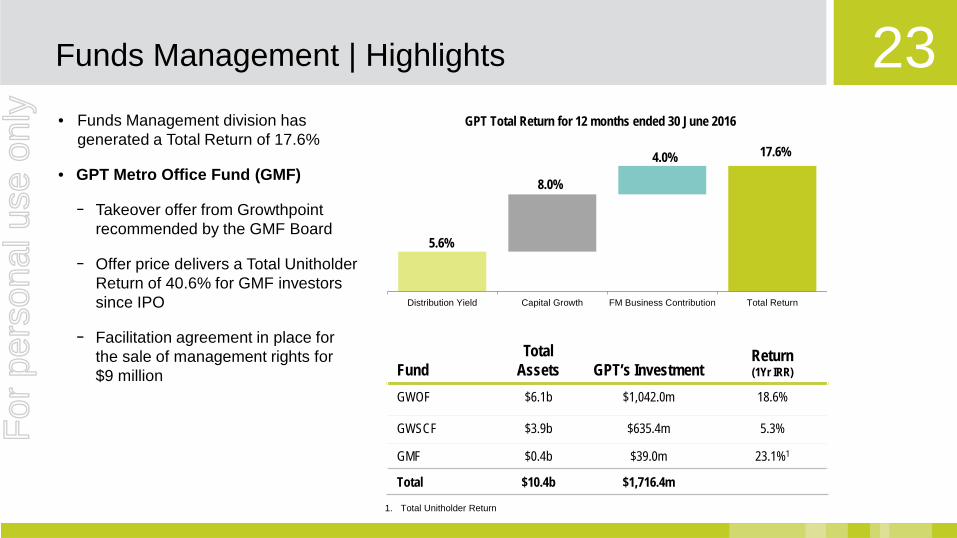
23 • Funds Management division has
generated a Total Return of 17.6%
• GPT Metro Office Fund (GMF)
− Takeover offer from Growthpoint recommended by the GMF Board
− Offer price delivers a Total Unitholder Return of 40.6% for GMF investors since IPO
− Facilitation agreement in place for the sale of management rights for $9 million
Funds Management | Highlights
Fund Total
Assets GPT’s Investment Return (1Yr IRR)
GWOF $6.1b $1,042.0m 18.6%
GWSCF $3.9b $635.4m 5.3%
GMF $0.4b $39.0m 23.1%1
Total $10.4b $1,716.4m
1. Total Unitholder Return
5.6%
8.0%
4.0% 17.6%
Distribution Yield Capital Growth FM Business Contribution Total Return
GPT Total Return for 12 months ended 30 June 2016
For
per
sona
l use
onl
y
24 Funds Management | GWSCF & GWOF
GPT Wholesale Shopping Centre Fund (GWSCF) • $240 million expansion of Macarthur Square
progressing well • Introducing H&M and new format David Jones to
Wollongong Central • Highpoint Shopping Centre continues to perform
strongly, with expansion plans under consideration • Consultation process with GWSCF investors for
March 2017 liquidity review has commenced
GPT Wholesale Office Fund (GWOF) • Performance fee earned in 1H16 of $14.4 million • $200 million of asset sales completed with a further
$220 million underway • Successfully concluded the renewal of Fund terms • Liquidity review closed with requests representing
2.4% of issued capital received
For
per
sona
l use
onl
y
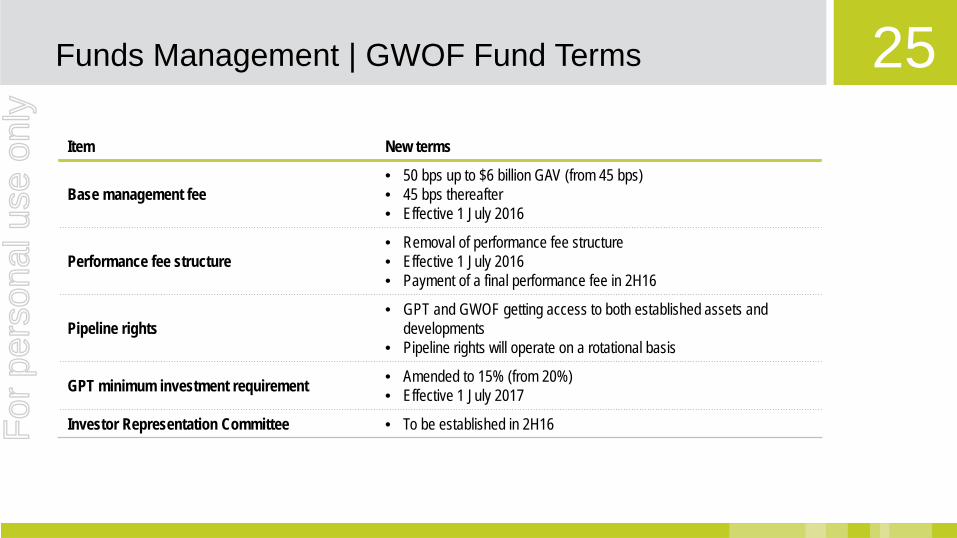
25 Item New terms
Base management fee • 50 bps up to $6 billion GAV (from 45 bps) • 45 bps thereafter • Effective 1 July 2016
Performance fee structure • Removal of performance fee structure • Effective 1 July 2016 • Payment of a final performance fee in 2H16
Pipeline rights • GPT and GWOF getting access to both established assets and
developments • Pipeline rights will operate on a rotational basis
GPT minimum investment requirement • Amended to 15% (from 20%) • Effective 1 July 2017
Investor Representation Committee • To be established in 2H16
Funds Management | GWOF Fund Terms F
or p
erso
nal u
se o
nly
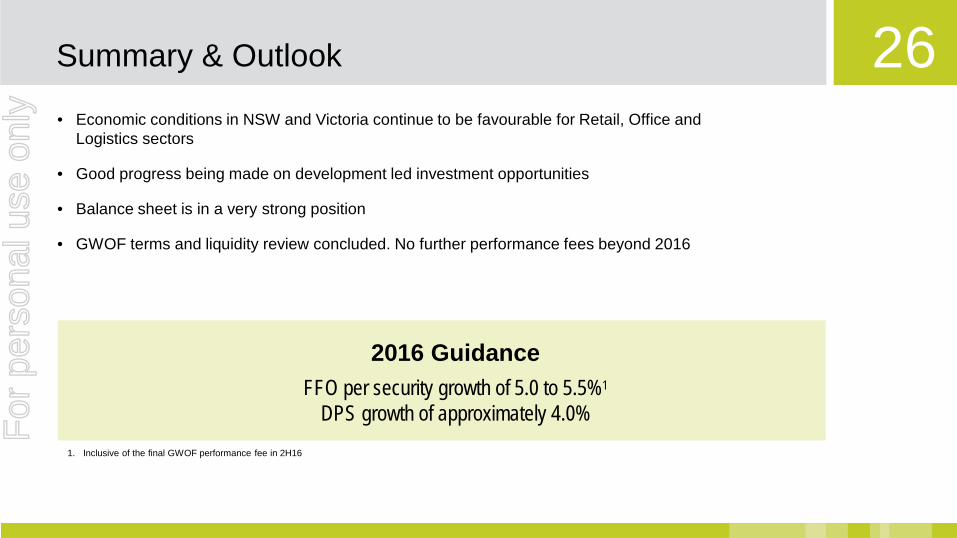
26 Summary & Outlook
• Economic conditions in NSW and Victoria continue to be favourable for Retail, Office and Logistics sectors
• Good progress being made on development led investment opportunities
• Balance sheet is in a very strong position
• GWOF terms and liquidity review concluded. No further performance fees beyond 2016
2016 Guidance FFO per security growth of 5.0 to 5.5%1
DPS growth of approximately 4.0% 1. Inclusive of the final GWOF performance fee in 2H16
For
per
sona
l use
onl
y
27
2016 INTERIM RESULT 15 August 2016
For
per
sona
l use
onl
y
28 The information provided in this presentation has been prepared by The GPT Group comprising GPT RE Limited (ACN 107 426 504) AFSL (286511), as responsible entity of the General Property Trust, and GPT Management Holdings Limited (ACN 113 510 188).
The information provided in this presentation is for general information only. It is not intended to be investment, legal or other advice and should not be relied upon as such. You should make your own assessment of, or obtain professional advice about, the information described in this paper to determine whether it is appropriate for you.
You should note that returns from all investments may fluctuate and that past performance is not necessarily a guide to future performance. Furthermore, while every effort is made to provide accurate and complete information, The GPT Group does not represent or warrant that the information in this presentation is free from errors or omissions, is complete or is suitable for your intended use. In particular, no representation or warranty is given as to the accuracy, likelihood of achievement or reasonableness of any forecasts, prospects or returns contained in the information - such material is, by its nature, subject to significant uncertainties and contingencies. To the maximum extent permitted by law, The GPT Group, its related companies, officers, employees and agents will not be liable to you in any way for any loss, damage, cost or expense (whether direct or indirect) howsoever arising in connection with the contents of, or any errors or omissions in, this presentation.
Information is stated as at 30 June 2016 unless otherwise indicated.
All values are expressed in Australian currency unless otherwise indicated.
FFO is reported in the Segment Note disclosures which are included in the financial report of The GPT Group for the six months ended 30 June 2016.
To provide information that reflects the Directors’ assessment of the net profit attributable to stapled securityholders calculated in accordance with Australian Accounting Standards, certain significant items that are relevant to an understanding of GPT’s result have been identified. The reconciliation FFO to Statutory Profit is useful as FFO is the measure of how GPT’s profitability is assessed.
FFO is a financial measure that represents GPT’s underlying and recurring earnings from its operations. This is determined by adjusting statutory net profit after tax under Australian Accounting Standards for certain items which are non-cash, unrealised or capital in nature. FFO has been determined based on guidelines established by the Property Council of Australia and is intended as a measure reflecting the underlying performance of the Group.
Disclaimer F
or p
erso
nal u
se o
nly