Embed Size (px)
Citation preview

For Electric Utilities The Future is Here
USEA WEC North America Regional Energy Forum 8 October 2015
Richard McMahon
Vice President, Energy Supply and Finance Edison Electric Institute

Edison Electric Institute
The Edison Electric Institute (EEI) is the association that represents all U.S. investor-owned electric companies. Our members provide electricity for 220 million Americans, operate in all 50 states and the District of Columbia, and directly employ more than 500,000 workers. With more than $85 billion in annual capital expenditures, the electric power industry is responsible for millions of additional jobs. Reliable, affordable, and sustainable electricity powers the economy and enhances the lives of all Americans. EEI has 70 international electric companies as Affiliate Members, and 250 industry suppliers and related organizations as Associate Members. Organized in 1933, EEI provides public policy leadership, strategic business intelligence, and essential conferences and forums.

Agenda
Electric Utility Industry CAPEX and its Drivers
Impacts on the Generation Fleet and the Grid
Environment and CPP
Cyber and Grid Security
The Evolving Grid and Regulation

Actuals
Projections (Sept.2015)
Source: EEI Finance Department, company reports, SNL Financial (September 2015).
Industry Capital Expenditures
Notes: Total company spending of U.S. Investor-Owned Electric Utilities, consolidated at the parent or appropriate holding company. Projections based on publicly available information and extrapolated for companies reporting fewer than three projected years (11% and 12% of industry for 2016 and 2017).
108.6
101.2
92.2
48.4
59.9
74.1
82.877.7
74.378.6
90.3 90.3
98.1
30
40
50
60
70
80
90
100
110
2005 2006 2007 2008 2009 2010 2011 2012 2013 2014 2015 2016 2017
($ Billions)

2013P 2015P
$95.2 B
as of October 2013 as of September 2015
$108.6 B
Generation
Distribution
Transmission
Gas-Related
Environment
Other
Source: EEI Finance Department, company reports (September 2015).
Notes: Total company functional spending of U.S. Investor-Owned Electric Utilities. 2015P total does not sum to 100% due to rounding. Projections based on publicly available information and extrapolated for companies not reporting functional detail (1.3% of industry).
Projected Functional CapEx
6% 6%7% 5%
12% 12%
17%18%
21%
26%
37%
32%
$0 B
$20 B
$40 B
$60 B
$80 B
$100 B

Drivers of Industry Investment
Environmental regulations
State renewable energy policies
Financial incentives
Low natural gas prices
Diversification Declining technology costs
Customer demand

Henry Hub Spot Price
Natural Gas Market Low Prices and Growing Production
U.S. Energy Information Administration, Annual Energy Outlook 2014 and Natural Gas Spot and Futures Prices
Natural Gas Production, tcf

Source: GTM/SEIA Solar Market Insight
Data is the average of quarterly data for each year.
Solar PV Costs Have Declined
Source: GTM/SEIA Solar Market Insight
Data is the average Q1-Q4 2014. Data only includes cost of PV technologies
Large-Scale Utility Solar PV is About Half The Cost of Residential Rooftop Solar
Solar PV costs decline

Utilities Lead the Way on Solar Power

Cleaner Fleet
New generating capacity is fueled by non-hydro renewables and natural gas
Announcements of New Generating Capacity (2014)
Source: EEI; Ventyx Inc., The Velocity Suite. Data as of December 31, 2014
Generating Capacity Additions

Agenda
Environment and CPP

Environmental Regulatory Challenges: 2015 and Beyond
12
Air
Climate
Water
Land & Natural Resources
Waste & Chemical
Management
Coal Ash
PCBs in Electrical Equipment
HazMat Transport
Transmission Siting and Permitting
Avian Protection
Endangered Species
Vegetation Management
316(b)
Effluent Limitation Guidelines
Waters of the United States
Total Maximum Daily Loads
(TMDLs)
NSPS- New Sources
NSPS-Existing Sources
BACT Permitting
International Negotiations
Mercury & Air Toxics Standards
(MATS)
Interstate Transport
(CAIR/CSAPR)
Regional Haze/Visibility
Multiple NAAQS
New Source Review (NSR)
Waterbody- Specific Standards

CO2 Emissions and Intensity
Source: Developed from U.S. Energy Information Administration, Monthly Energy Review March 2014
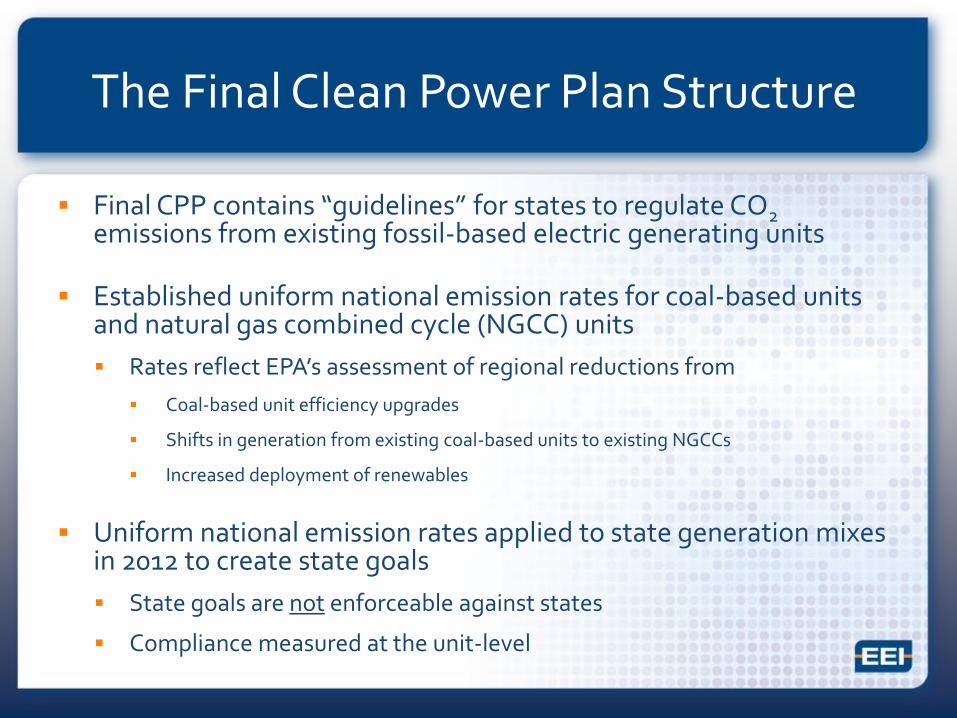
The Final Clean Power Plan Structure
Final CPP contains “guidelines” for states to regulate CO2 emissions from existing fossil-based electric generating units
Established uniform national emission rates for coal-based units and natural gas combined cycle (NGCC) units
Rates reflect EPA’s assessment of regional reductions from
Coal-based unit efficiency upgrades
Shifts in generation from existing coal-based units to existing NGCCs
Increased deployment of renewables
Uniform national emission rates applied to state generation mixes in 2012 to create state goals
State goals are not enforceable against states
Compliance measured at the unit-level

Final Clean Power Plan: The Big Picture
States’ main job is to design compliance plans
If states don’t file compliance plan, EPA will subject units in those states to less flexible federal plan
State plans must:
Require units to make reductions
Decide whether to allow units to trade reductions to demonstrate compliance
Measure compliance in terms of rate or mass
Units decide how and when to achieve reductions (or procure/buy reductions credits or allowances)
EPA assumes that a national trading system will emerge

Agenda
Cyber and Grid Security

17
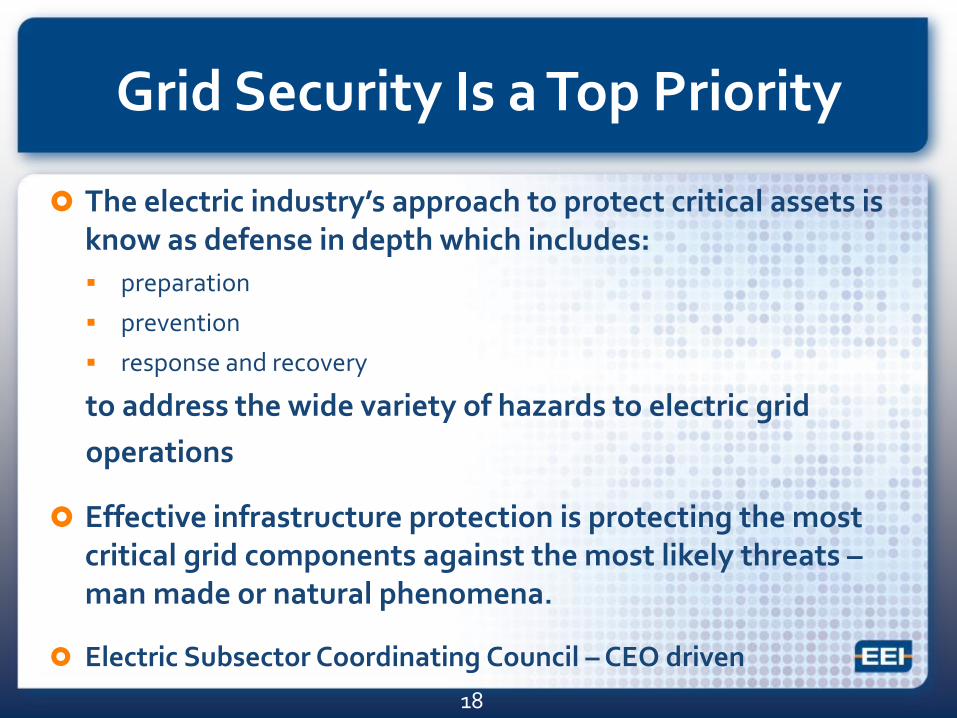
Grid Security Is a Top Priority
The electric industry’s approach to protect critical assets is know as defense in depth which includes:
preparation
prevention
response and recovery
to address the wide variety of hazards to electric grid
operations
Effective infrastructure protection is protecting the most critical grid components against the most likely threats – man made or natural phenomena.
Electric Subsector Coordinating Council – CEO driven
18

Agenda
The Evolving Grid

Reliability • Sufficient capacity the
system can rely on • Fuel diversity
Economic Sustainability • Low cost/efficient system • Reasonable return/ sustained
investments
Environmental Sustainability • Achieve carbon targets • Reduce other pollutants
• Accurate Energy Price Formation
• Fair and Competitive Capacity Market Design
• Compensating Valuable Resource Attributes
Keys to Realizing Market Structure Objectives

If we properly compensate for attributes generators provide in the wholesale market, it
would temporarily raise wholesale prices…
Wholesale Market Energy Price Formation Challenges
Customer Energy Cost
Time
with market reform
However, when low prices induce needed units to shutdown, total energy cost to
customers would rise to reflect shortage/ cost of new build
2
… However, it would minimize shutdowns and the need for new
builds
4
3
Out-of-market intervention can suppress wholesale power prices and customer energy cost in the short
term
1
Illustrative

Changing Electric Distribution Grid: Centralized to Distributed
IntegratedGrid
Platform
Today Future
Source graphs: EPRI

New Technologies and Residential Demand Charges Empower Consumers

Evolution of Rates: Three-Part Rates
Better reflect costs and eliminate cost-shift Promote energy efficiency
Potentially lower costs for customers
Three-Part Rate
Volumetric Charge Variable. Based on consumer’s monthly electricity consumption (e.g. fuel costs )
Fixed Charge Fixed. Based on fixed costs incurred by utility (e.g. like metering, poles)
Demand Charge Fixed but can vary over time. Based on a customer’s maximum kW demand over a billing cycle (e.g. transmission and generation capacity)
Getting there
The transition to three part rates should be carefully planned and gradual
The rate change will affect each customer differently
Changing to three part rate should be revenue neutral for utilities
Three part rates can result in lower electricity bills for consumers, promote reduction of peak demand
Based on Ryan Hledik, Rediscovering Residential Demand Charges, The Electricity Journal, Vol. 27, Issue 7, Aug/Sept 2014

Conclusion
The integrated grid is the backbone of our economy. Electric utilities are making needed investments in the integrated grid to meet the growing demands of our digital society
Electric utilities are empowering customers with more choices and control, while ensuring that our electric supply is reliable, affordable and clean.
Regulation is evolving to ensure a diverse and resilient integrated electric grid, as well as the deployment of new technology and innovation that will benefit ALL customers.

Questions?
Richard F. McMahon, Jr
Vice President, Energy Supply & Finance
Edison Electric Institute