Embed Size (px)
Citation preview

Footloose and Fancy Free: A Field Survey of Walkable Urban Places in the Top 30 U.S. Metropolitan Areas
Christopher B. Leinberger
The post-World War II era has witnessed the nearly exclusive building of low density suburbia, here termed “drivable sub-urban” development, as the American metropolitan built environment.. However, over the past 15 years, there has been a gradual shift in how Americans have created their built environment (defined as the real estate, which is generally privately owned, and the infrastructure that supports real estate, majority publicly owned), as demonstrated by the success of the many downtown revitalizations, new urbanism, and transit-oriented development. This has been the result of the re-introduction and expansion of higher density “walkable urban” places. This new trend is the focus of the recently published book, The Option of Urbanism: Investing in a New American Dream (Island Press, November, 2007).
This field survey attempts to identify the number and location of “regional-serving” walkable urban places in the 30 largest American metropolitan areas in the U.S, where 138 million, or 46 percent, of the US population lives. This field survey determines where these walkable urban places are most prevalent on a per capita basis, where they are generally located within the metro area, and the extent to which rail transit service is associated with walkable urban development.
The first section defines the key concepts used in the survey, providing relevant background information for those who have not read The Option of Urbanism. The second section outlines the methodology. The third section, which is the heart of the report, outlines the findings and conclusions of the survey.
Key Concepts
There are a number of key concepts and background information critical to understanding the rise of walkable urban places today. There is a more in-depth discussion of these terms in the book:
• Types of Built Environment Patterns. The built environment is generally marked by two kinds of development patterns—drivable sub-urban and walkable urban. Drivable sub-urban is very low density (floor-area-ratio of between 0.05 and 0.30), modular in nature, uses significantly more land relative to population growth and can generally only be accessed by car or truck. It is conventional suburban development. Walkable urban is:
- at least five times as dense as drivable sub-urban (floor-area-ratio of between 0.8 and upwards to 40.0),
- mixed-use (residential, office, retail, cultural, educational, etc.), - compact (regional-serving walkable urban places, as defined below, are generally between 100
and 500 acres in size), - generally accessible by multiple transportation means (transit, bike, car and walking), and - walkable for nearly every destination once in the place.
Christopher Leinberger is a visiting fellow at the Brookings Institution Metropolitan Policy Program, professor at the University of Michigan, and partner, Arcadia Land Company. He is also the author of The Option of Urbanism: Investing in A New American Dream published by Island Press in November, 2007, on which this field survey is based. He can be contacted at [email protected].
• Functions of Walkable Urban Places. There are two kinds of walkable urban places—local-serving and regional-serving. Local-serving places are primarily bedroom neighborhoods. They are residential in nature with limited commercial venues and instead serve everyday needs (grocery, drug store, etc.). Regional-serving places provide uses that have regional significance, such as employment, retail, medical, entertainment, cultural, higher education, etc., and generally integrates residential as well. This survey focuses only on regional-serving walkable urban places. For ease of usage, the term walkable urban as used in this survey means regional-serving walkable urban places.
• Types of Regional Walkable Urban Places. The book points out that five types of regional-serving walkable urban places have emerged in the country to date and these categories are used in the survey. These include:
- Downtown—the original center city of the largest city in the metropolitan area, though many metropolitan areas are so large that one could argue that there are multiple “original” downtowns, such as the case with downtown Brooklyn and Jersey City in the New York metropolitan area.
- Downtown Adjacent—Immediately adjacent to the original downtown or one or two transit stops away.
- Suburban Town Center—18th or 19th century towns that have been swept up in the growth of the metropolitan area but were laid out before the advent of the car.
- Suburban Redevelopment—failed drivable sub-urban commercial strips or regional malls that have been redeveloped into walkable urbanism.
- Greenfield—a walkable urban place developed on a greenfield site, such as the current trend of developing mixed-use “lifestyle centers” (note: not retail-only lifestyle centers).
• Critical Mass. The walkable urban places named in this survey are at or near “critical mass”. In this survey, critical mass is defined as places where new development projects do not need significant public or private subsidies to proceed with the next new project. There are many more walkable urban places in these 30 metro areas that are not yet at critical mass but probably will be over the next decade. Examples of places that are not yet at critical mass include Mid-Wilshire in Los Angeles, Crossroads in Kansas City, Royal Oak in the Detroit metropolitan area, Columbia Heights in Washington, DC, and nearly every downtown not listed in this field survey.
• Other Walkable Places Not Included in Survey. There are institutions within a metropolitan area that are regional-serving and walkable by their very nature. These include medical campuses, university and college campuses, large corporate headquarters campuses, theme parks, etc. Examples include the Texas Medical Center in Houston, University of California at Santa Cruz, General Motors Tech Center in Warren, Michigan, and Disney World in Orlando. These have not been listed as walkable urban places in this survey unless they have connected to the area immediately around their campuses, acting as an anchor in sparking walkable urban development on adjacent property.
• Maturity of Rail Transit System. The definition of the extent of a metropolitan rail transit system (which includes heavy rail, light rail, commuter rail and street car) in the survey is divided into four categories, using the judgment of the author:
- Full—The bulk of the inner suburbs and center city is served by a rail transit system, connecting many walkable urban places.
- Partial—A significant portion of the inner suburbs and center city is served by rail transit, connecting some walkable urban places.
- Starter—An initial transit line or two lines have been built serving a small portion of the inner suburbs and center city, connecting a few walkable urban places.
- None—no rail transit, though there may be rail circulator systems within a walkable urban place (the Las Vegas Strip monorail, Detroit’s downtown people mover, etc.), which is not counted due to the limited geography served.
Methodology
The walkable urban places identified in this field survey are based on the experience and observations of the author, who has been active as a real estate consultant, researcher, and developer for the past 30 years. He has worked in every one of these metropolitan areas. Those observations have been supplemented by the managing directors of Robert Charles Lesser & Co, an international consulting firm, Brookings Institution scholars, public officials, real estate developers, architectural critics, downtown business improvement managers, public officials, and academics, among others. This experience has been further complemented by web-based searches.
This field survey represents only a first step at understanding the breadth of walkable urban development in the country, which requires a more rigorous, systemic review. The most important caveat which needs to be corrected in future surveys relates to the lack of a meaningful measure of the size of each walkable urban place. The walkable urban places in New York are among the largest in the country; for example, Midtown Manhattan has over 300 million square feet of office space, tens of thousands of residential units and hotel rooms and millions of square feet of retail; by far the largest walkable urban place in the country. Yet in the survey calculation of the number of walkable urban places per capita, Midtown Manhattan is weighed the same as Reston Town Center in Washington, DC, which probably has around 1/30th of the office, residential, hotels and retail space. Therefore, size criteria need to be incorporated into the survey in the future.
A more rigorous definition of a regional-serving walkable urban place also needs to be developed. Still unclear is the best street-by-street definition to use to demarcate walkable urban place. For example, what are the discrete boundaries of Midtown Manhattan versus Chelsea, as defined by the market?
The definition of “critical mass” needs more rigorous definition. It has always been a concept somewhat like the judicial understanding of pornography; one knows it when one sees it. This survey applied the notion that critical mass is being near or past the point in time when the next real estate development project does not need government or private gap financing to make it financially feasible. This is a good first step but requires much more rigor and standardized measures in future research.
Results of the Survey
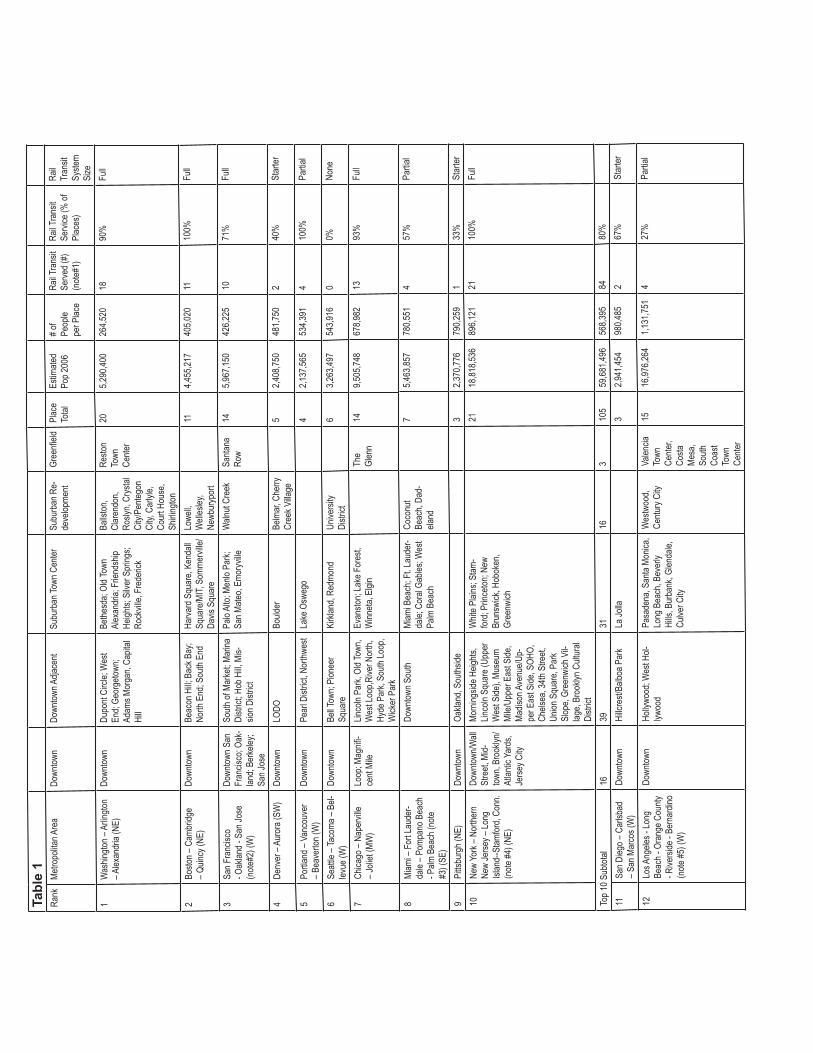
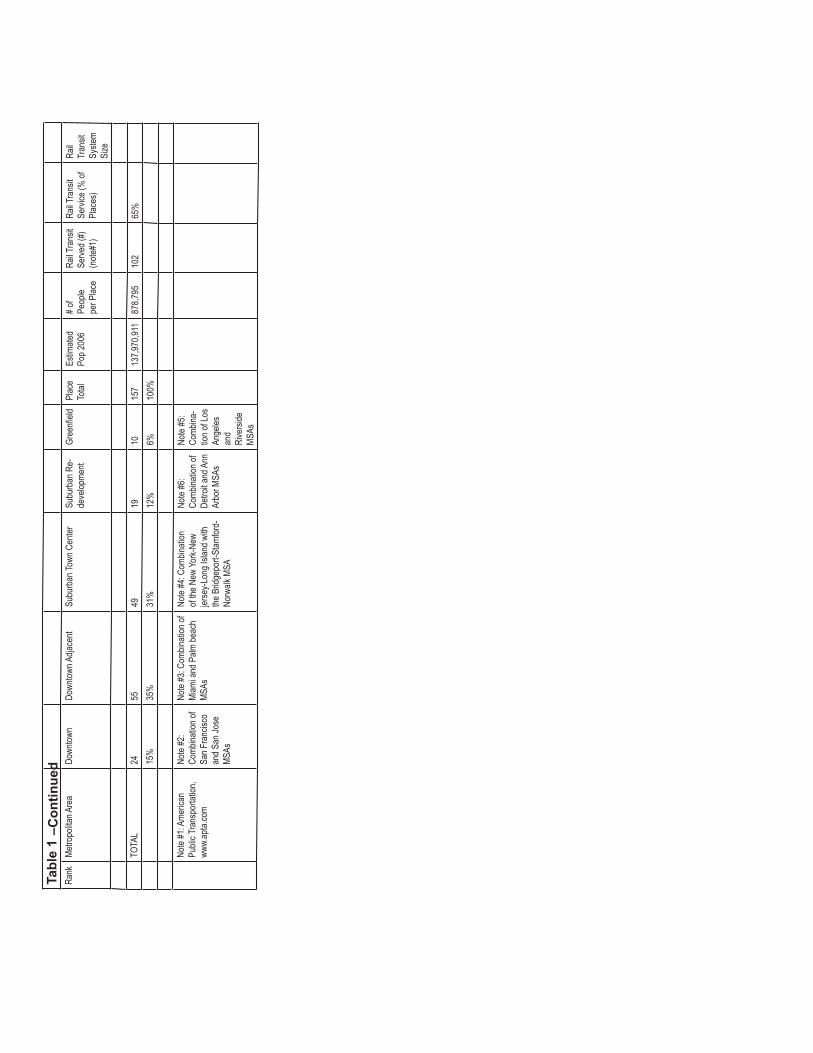
The survey results for the 30 largest metropolitan areas are found in Table 1. The metropolitan areas are ranked according to the number of people in the metropolitan area per regional-serving walkable urban place. Thus, the metro area with the lowest number of people needed to support a walkable urban place is the most advanced in developing walkable urbanism; the equivalent of the most walkable urban places per capita. The summary tabulations are in Table 2, which ranks the 30 metro areas by their ratio of walkable urban places to total population. This divides the 30 metropolitan areas into clusters of the top 10 most walkable urban, top 15, bottom 15 and bottom 10 for comparative purposes.
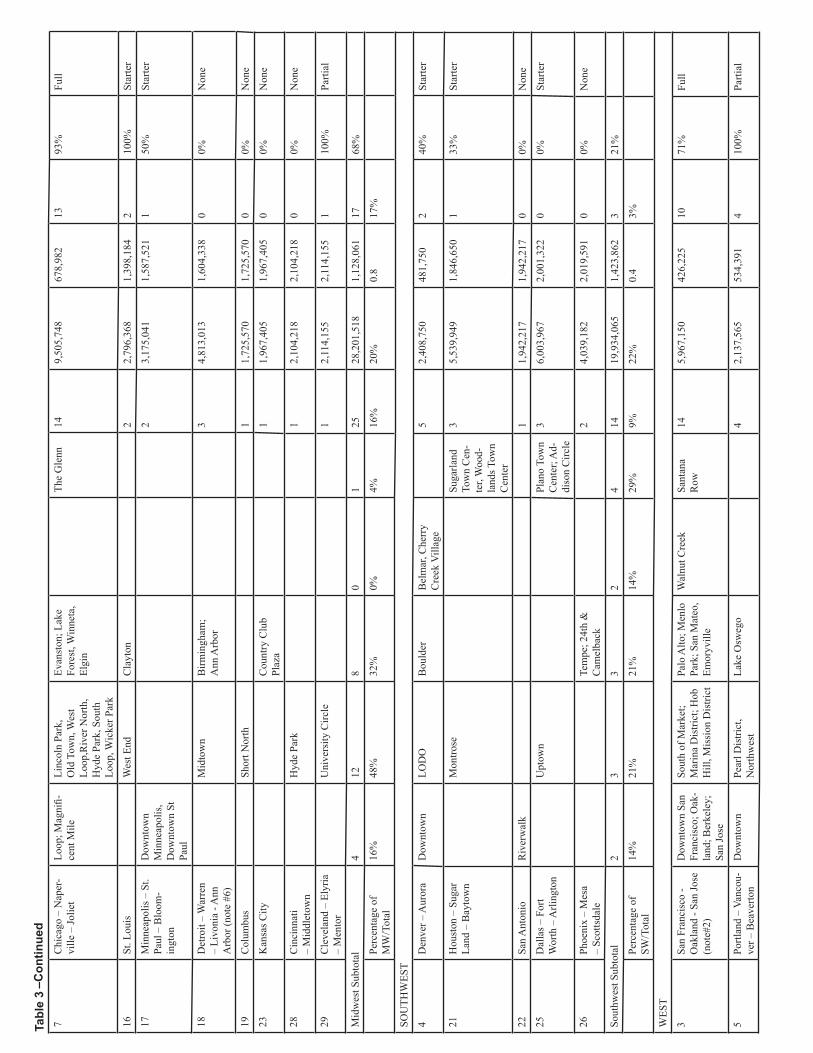
The base data is re-tabulated by region (Northeast, Southeast, Midwest, Southwest and West) in Table 3.
The key survey findings are:
1. There are 157 Walkable Urban Places in the Largest 30 Metro Areas in the Country—There are regional-serving walkable urban places at or near critical mass in nearly every surveyed metro area (29 of the 30). This is significant as the best way of encouraging the development of walkable urban places is to have hometown examples to demonstrate their function and market acceptance. While comparisons over time can be only impressionistic, one can safely assume that these 30 metropolitan areas probably had very few walkable urban places 20 years ago. For example, the Denver metropolitan area did not exhibit any regional-serving walkable urban places as of 1987; downtown was an office-only place with few residents, cultural attractions, or retail while the rest of the region was basically drivable sub-urban in nature. This survey identifies five regional-serving walkable urban places in the Denver region today. Many times that number are in the planning stages due to a
comprehensive new rail transit system that is funded and in the construction planning stage, building on an existing starter system.
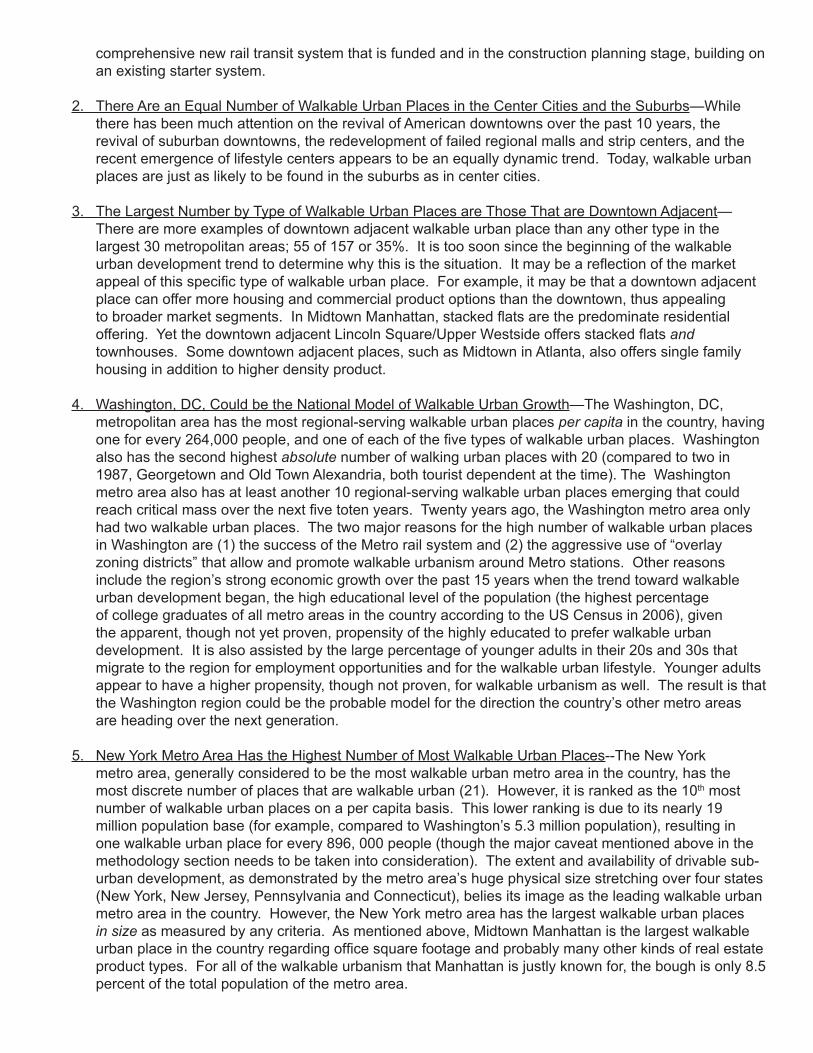
2. There Are an Equal Number of Walkable Urban Places in the Center Cities and the Suburbs—While there has been much attention on the revival of American downtowns over the past 10 years, the revival of suburban downtowns, the redevelopment of failed regional malls and strip centers, and the recent emergence of lifestyle centers appears to be an equally dynamic trend. Today, walkable urban places are just as likely to be found in the suburbs as in center cities.
3. The Largest Number by Type of Walkable Urban Places are Those That are Downtown Adjacent— There are more examples of downtown adjacent walkable urban place than any other type in the largest 30 metropolitan areas; 55 of 157 or 35%. It is too soon since the beginning of the walkable urban development trend to determine why this is the situation. It may be a reflection of the market appeal of this specific type of walkable urban place. For example, it may be that a downtown adjacent place can offer more housing and commercial product options than the downtown, thus appealing to broader market segments. In Midtown Manhattan, stacked flats are the predominate residential offering. Yet the downtown adjacent Lincoln Square/Upper Westside offers stacked flats and townhouses. Some downtown adjacent places, such as Midtown in Atlanta, also offers single family housing in addition to higher density product.
4. Washington, DC, Could be the National Model of Walkable Urban Growth—The Washington, DC, metropolitan area has the most regional-serving walkable urban places per capita in the country, having one for every 264,000 people, and one of each of the five types of walkable urban places. Washington also has the second highest absolute number of walking urban places with 20 (compared to two in 1987, Georgetown and Old Town Alexandria, both tourist dependent at the time). The Washington metro area also has at least another 10 regional-serving walkable urban places emerging that could reach critical mass over the next five toten years. Twenty years ago, the Washington metro area only had two walkable urban places. The two major reasons for the high number of walkable urban places in Washington are (1) the success of the Metro rail system and (2) the aggressive use of “overlay zoning districts” that allow and promote walkable urbanism around Metro stations. Other reasons include the region’s strong economic growth over the past 15 years when the trend toward walkable urban development began, the high educational level of the population (the highest percentage of college graduates of all metro areas in the country according to the US Census in 2006), given the apparent, though not yet proven, propensity of the highly educated to prefer walkable urban development. It is also assisted by the large percentage of younger adults in their 20s and 30s that migrate to the region for employment opportunities and for the walkable urban lifestyle. Younger adults appear to have a higher propensity, though not proven, for walkable urbanism as well. The result is that the Washington region could be the probable model for the direction the country’s other metro areas are heading over the next generation.
5. New York Metro Area Has the Highest Number of Most Walkable Urban Places--The New York metro area, generally considered to be the most walkable urban metro area in the country, has the most discrete number of places that are walkable urban (21). However, it is ranked as the 10th most number of walkable urban places on a per capita basis. This lower ranking is due to its nearly 19 million population base (for example, compared to Washington’s 5.3 million population), resulting in one walkable urban place for every 896, 000 people (though the major caveat mentioned above in the methodology section needs to be taken into consideration). The extent and availability of drivable sub-urban development, as demonstrated by the metro area’s huge physical size stretching over four states (New York, New Jersey, Pennsylvania and Connecticut), belies its image as the leading walkable urban metro area in the country. However, the New York metro area has the largest walkable urban places in size as measured by any criteria. As mentioned above, Midtown Manhattan is the largest walkable urban place in the country regarding office square footage and probably many other kinds of real estate product types. For all of the walkable urbanism that Manhattan is justly known for, the bough is only 8.5 percent of the total population of the metro area.
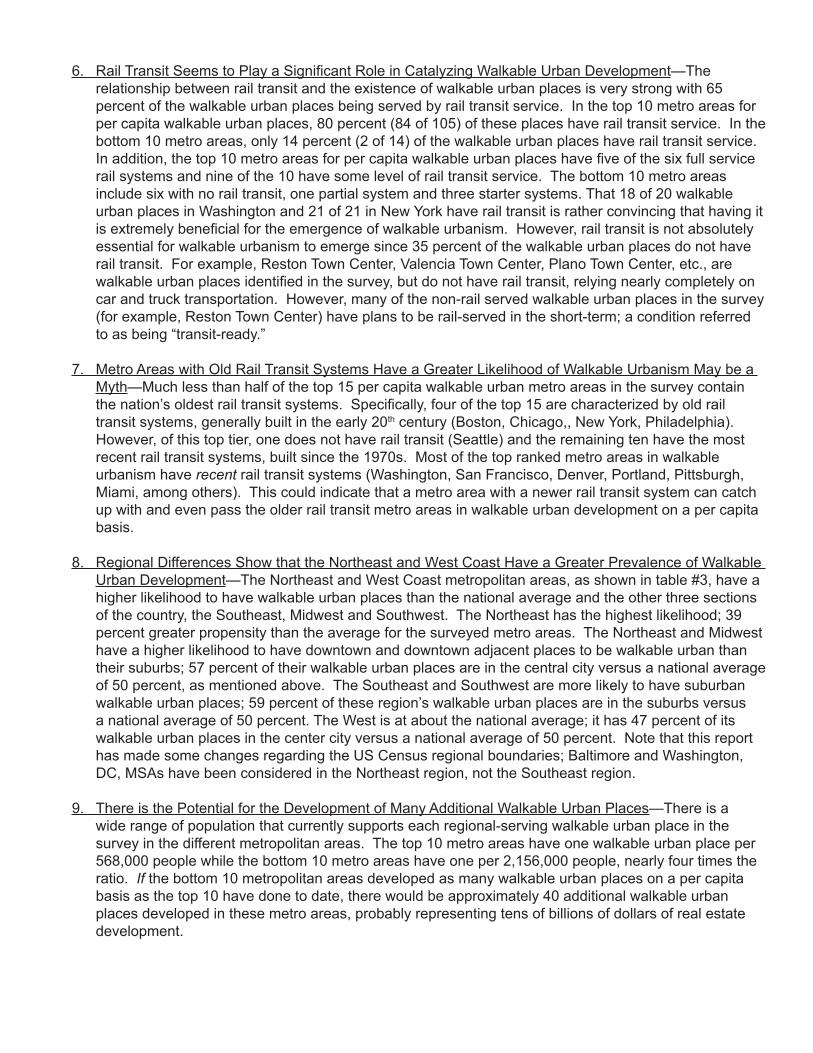
6. Rail Transit Seems to Play a Significant Role in Catalyzing Walkable Urban Development—The relationship between rail transit and the existence of walkable urban places is very strong with 65 percent of the walkable urban places being served by rail transit service. In the top 10 metro areas for per capita walkable urban places, 80 percent (84 of 105) of these places have rail transit service. In the bottom 10 metro areas, only 14 percent (2 of 14) of the walkable urban places have rail transit service. In addition, the top 10 metro areas for per capita walkable urban places have five of the six full service rail systems and nine of the 10 have some level of rail transit service. The bottom 10 metro areas include six with no rail transit, one partial system and three starter systems. That 18 of 20 walkable urban places in Washington and 21 of 21 in New York have rail transit is rather convincing that having it is extremely beneficial for the emergence of walkable urbanism. However, rail transit is not absolutely essential for walkable urbanism to emerge since 35 percent of the walkable urban places do not have rail transit. For example, Reston Town Center, Valencia Town Center, Plano Town Center, etc., are walkable urban places identified in the survey, but do not have rail transit, relying nearly completely on car and truck transportation. However, many of the non-rail served walkable urban places in the survey (for example, Reston Town Center) have plans to be rail-served in the short-term; a condition referred to as being “transit-ready.”
7. Metro Areas with Old Rail Transit Systems Have a Greater Likelihood of Walkable Urbanism May be a Myth—Much less than half of the top 15 per capita walkable urban metro areas in the survey contain the nation’s oldest rail transit systems. Specifically, four of the top 15 are characterized by old rail transit systems, generally built in the early 20th century (Boston, Chicago,, New York, Philadelphia). However, of this top tier, one does not have rail transit (Seattle) and the remaining ten have the most recent rail transit systems, built since the 1970s. Most of the top ranked metro areas in walkable urbanism have recent rail transit systems (Washington, San Francisco, Denver, Portland, Pittsburgh, Miami, among others). This could indicate that a metro area with a newer rail transit system can catch up with and even pass the older rail transit metro areas in walkable urban development on a per capita basis.
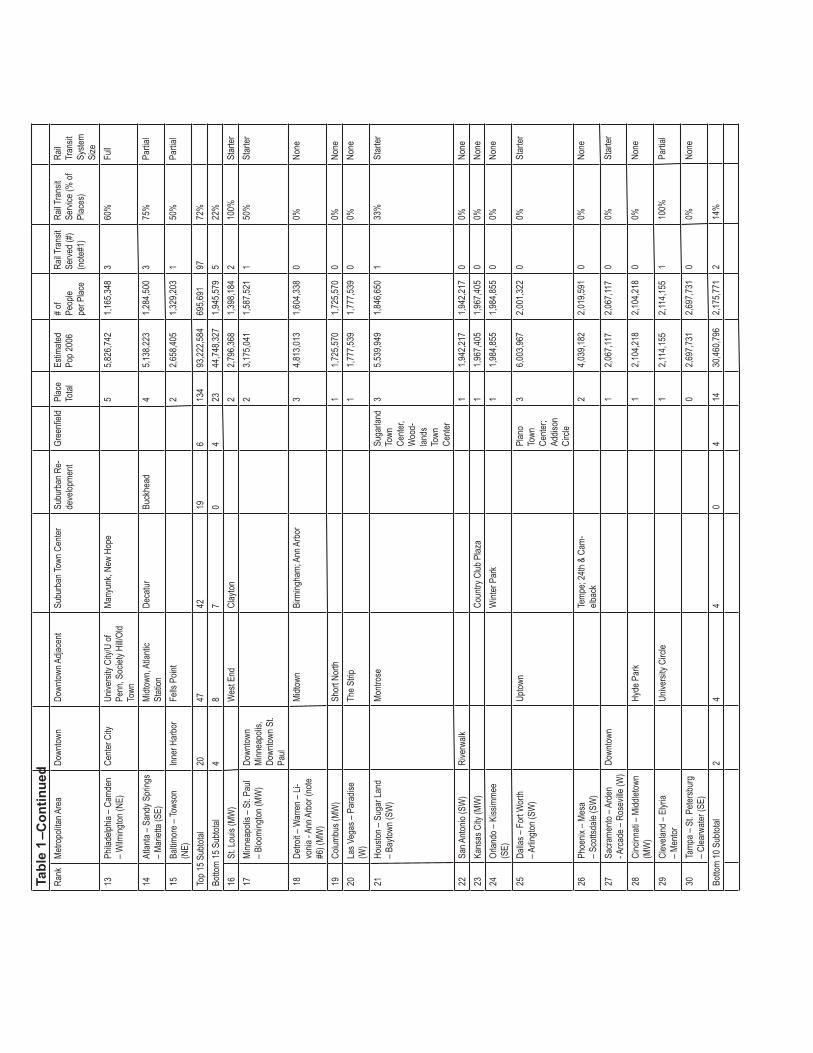
8. Regional Differences Show that the Northeast and West Coast Have a Greater Prevalence of Walkable Urban Development—The Northeast and West Coast metropolitan areas, as shown in table #3, have a higher likelihood to have walkable urban places than the national average and the other three sections of the country, the Southeast, Midwest and Southwest. The Northeast has the highest likelihood; 39 percent greater propensity than the average for the surveyed metro areas. The Northeast and Midwest have a higher likelihood to have downtown and downtown adjacent places to be walkable urban than their suburbs; 57 percent of their walkable urban places are in the central city versus a national average of 50 percent, as mentioned above. The Southeast and Southwest are more likely to have suburban walkable urban places; 59 percent of these region’s walkable urban places are in the suburbs versus a national average of 50 percent. The West is at about the national average; it has 47 percent of its walkable urban places in the center city versus a national average of 50 percent. Note that this report has made some changes regarding the US Census regional boundaries; Baltimore and Washington, DC, MSAs have been considered in the Northeast region, not the Southeast region.
9. There is the Potential for the Development of Many Additional Walkable Urban Places—There is a wide range of population that currently supports each regional-serving walkable urban place in the survey in the different metropolitan areas. The top 10 metro areas have one walkable urban place per 568,000 people while the bottom 10 metro areas have one per 2,156,000 people, nearly four times the ratio. If the bottom 10 metropolitan areas developed as many walkable urban places on a per capita basis as the top 10 have done to date, there would be approximately 40 additional walkable urban places developed in these metro areas, probably representing tens of billions of dollars of real estate development.

10. A Tale of Two Kinds of Metropolitan Areas May be Evolving: Those Metros Benefiting from the Trend Toward Walkable Urbanism and Those Out of Position—There appears to be a wide gap between metropolitan areas that have many walkable urban places and those that have only one or two. The top 15 in the survey have 134 of the 157 walkable urban places identified; 85 percent of the total for the 30 largest metro areas, even though they are home to 68 percent of the population. The top 15 metro areas also have the preponderance of full or partial rail transit systems and thus 95 percent of the rail transit-served walkable urban places, which re-enforces the apparent connection between rail transit and walkable urbanism as discussed above. It may be possible that if action is not taken with regard to rail transit, a “have” versus “have not” gap may appear in American metropolitan areas. Additionally, those metro areas that do not have high level of walkable urban development nor extensive rail transit seem to fall into two categories. Many of the metropolitan areas near the bottom of the survey that have experienced some of the fastest population growth in the nation (e.g., Phoenix, Dallas-Ft. Worth, Houston) have starter transit systems and/or plans for extensive rail transit. These metro areas seem to be positioning themselves to take advantage of walkable urban demand even if they have not fully done so as of yet. It appears that these fast growth metros are emulating highly ranked walkable urban metros like Denver, Portland, and San Diego that built rail systems over the past 10–15 years. Metropolitan areas that are not seriously committed to building rail transit systems—such as Cincinnati, Detroit, and Kansas City—may not have the option of walkable urban development due to slower economic growth and weak tax base. These slow growing metropolitan areas without rail transit today may be at a competitive disadvantage regarding future economic growth. This will especially be the case if crude oil prices continue to rise as they have since 2002 (increasing nearly three fold). These metropolitan areas may have “painted themselves into a corner”, due to both rising energy costs and the market opportunity of walkable urban development.
Conclusion
The number and growth of regional-serving walkable urban places is significant in many metropolitan areas in the country and is clearly emerging in both cities and suburbs. The probable correlation between walkable urban development and rail transit, while not definitively proven by this field survey, supports the intuitive relationship between them. This field survey also points out the need to gather real estate and transit data in a different manner; distinguishing between walkable urban and drivable sub-urban places. As the research in the book, The Option of Urbanism; Investing in a New American Dream, points out, these two kinds of places appear to perform fundamentally differently in how they lay out on the ground and how they perform regarding market acceptance, financial performance, rental rates/sales prices, tax revenue generation, and environmental sustainability. Finally, infrastructure investment, particularly in rail transit, and revised zoning regulations should be seriously considered by metropolitan area governments that are not seeing growth in this type of development pattern.
Tabl
e 1
Rank
Metro
polita
n Are
aDo
wntow
nDo
wntow
n Adja
cent
Subu
rban
Town
Cen
terSu
burb
an R
e-de
velop
ment
Gree
nfield
Plac
e To
tal
Estim
ated
Pop 2
006
# of
Peop
le pe
r Plac
e
Rail T
rans
it Se
rved (
#)
(note
#1)
Rail T
rans
it Se
rvice
(% of
Pl
aces
)
Rail
Tran
sit
Syste
m Si
ze
1W
ashin
gton –
Arlin
gton
– Alex
andr
ia (N
E)Do
wntow
nDu
pont
Circl
e; W
est
End;
Geor
getow
n; Ad
ams M
orga
n, Ca
pital
Hill
Bethe
sda;
Old T
own
Alex
andr
ia; F
riend
ship
Heigh
ts; S
ilver
Spr
ings;
Rock
ville,
Fre
deric
k
Balls
ton,
Clar
endo
n, Ro
slyn,
Crys
tal
City/
Pente
gon
City,
Car
lyle,
Cour
t Hou
se,
Shirli
ngton
Resto
n To
wn
Cente
r
205,2
90,40
026
4,520
1890
%Fu
ll
2Bo
ston –
Cam
bridg
e – Q
uincy
(NE)
Down
town
Beac
on H
ill; B
ack B
ay;
North
End
; Sou
th En
dHa
rvard
Squ
are,
Kend
all
Squa
re/M
IT, S
omme
rville
/Da
vis S
quar
e
Lowe
ll, W
elles
ley,
Newb
uryp
ort
114,4
55,21
740
5,020
1110
0%Fu
ll
3Sa
n Fra
ncisc
o - O
aklan
d - S
an Jo
se
(note
#2) (
W)
Down
town S
an
Fran
cisco
; Oak
-lan
d; Be
rkeley
; Sa
n Jos
e
South
of M
arke
t; Mar
ina
Distr
ict; H
ob H
ill, M
is-sio
n Dist
rict
Palo
Alto;
Men
lo Pa
rk;
San M
ateo,
Emor
yville
Waln
ut Cr
eek
Santa
na
Row
145,9
67,15
042
6,225
1071
%Fu
ll
4De
nver
– Au
rora
(SW
)Do
wntow
nLO
DOBo
ulder
Belm
ar, C
herry
Cr
eek V
illage
52,4
08,75
048
1,750
240
%St
arter
5Po
rtland
– Va
ncou
ver
– Bea
verto
n (W
)Do
wntow
nPe
arl D
istric
t, Nor
thwes
tLa
ke O
sweg
o4
2,137
,565
534,3
914
100%
Partia
l
6Se
attle
– Tac
oma –
Bel-
levue
(W)
Down
town
Bell T
own;
Pion
eer
Squa
reKi
rklan
d, Re
dmon
dUn
iversi
ty Di
strict
63,2
63,49
754
3,916
00%
None
7Ch
icago
– Na
pervi
lle
– Joli
et (M
W)
Loop
; Mag
nifi-
cent
Mile
Linco
ln Pa
rk, O
ld To
wn,
Wes
t Loo
p,Rive
r Nor
th,
Hyde
Par
k, So
uth Lo
op,
Wick
er P
ark
Evan
ston;
Lake
For
est,
Winn
eta, E
lgin
The
Glen
n14
9,505
,748
678,9
8213
93%
Full
8Mi
ami –
For
t Lau
der-
dale
– Pom
pano
Bea
ch
- Palm
Bea
ch (n
ote
#3) (
SE)
Down
town S
outh
Miam
i Bea
ch; F
t. Lau
der-
dale;
Cor
al Ga
bles;
Wes
t Pa
lm B
each
Coco
nut
Beac
h, Da
d-ela
nd
75,4
63,85
778
0,551
457
%Pa
rtial
9Pi
ttsbu
rgh (
NE)
Down
town
Oakla
nd, S
ouths
ide3
2,370
,776
790,2
591
33%
Star
ter
10Ne
w Yo
rk – N
orthe
rn
New
Jerse
y – Lo
ng
Islan
d--S
tamfor
d, Co
nn.
(note
#4) (
NE)
Down
town/W
all
Stre
et, M
id-tow
n, Br
ookly
n/At
lantic
Yar
ds,
Jerse
y City
Morn
ingsid
e Heig
hts,
Linco
ln Sq
uare
(Upp
er
Wes
t Side
), Mu
seum
Mi
le/Up
per E
ast S
ide,
Madis
on A
venu
e/Up-
per E
ast S
ide, S
OHO,
Ch
elsea
, 34th
Stre
et,
Union
Squ
are,
Park
Slop
e, Gr
eenw
ich V
il-lag
e, Br
ookly
n Cult
ural
Distr
ict
Whit
e Plai
ns; S
tam-
ford;
Princ
eton;
New
Brun
swick
, Hob
oken
, Gr
eenw
ich
2118
,818,5
3689
6,121
2110
0%Fu
ll
Top 1
0 Sub
total
1639
3116
310
559
,681,4
9656
8,395
8480
%
11Sa
n Dieg
o – C
arlsb
ad
– San
Mar
cos (
W)
Down
town
Hillc
rest/
Balbo
a Par
kLa
Jolla
32,9
41,45
498
0,485
267
%St
arter
12Lo
s Ang
eles -
Long
Be
ach -
Ora
nge C
ounty
- R
iversi
de -
Bern
ardin
o (n
ote #5
) (W
)
Down
town
Holly
wood
; Wes
t Hol-
lywoo
dPa
sade
na, S
anta
Monic
a, Lo
ng B
each
, Bev
erly
Hills
, Bur
bank
, Glen
dale,
Cu
lver C
ity
Wes
twoo
d, Ce
ntury
City
Valen
cia
Town
Ce
nter,
Costa
Me
sa,
South
Co
ast
Town
Ce
nter
1516
,976,2
641,1
31,75
14
27%
Partia
l
Tabl
e 1
Rank
Metro
polita
n Are
aDo
wntow
nDo
wntow
n Adja
cent
Subu
rban
Town
Cen
terSu
burb
an R
e-de
velop
ment
Gree
nfield
Plac
e To
tal
Estim
ated
Pop 2
006
# of
Peop
le pe
r Plac
e
Rail T
rans
it Se
rved (
#)
(note
#1)
Rail T
rans
it Se
rvice
(% of
Pl
aces
)
Rail
Tran
sit
Syste
m Si
ze13
Phila
delph
ia – C
amde
n – W
ilming
ton (N
E)Ce
nter C
ityUn
iversi
ty Ci
ty/U
of Pe
nn, S
ociet
y Hill/
Old
Town
Many
unk,
New
Hope
55,8
26,74
21,1
65,34
83
60%
Full
14At
lanta
– San
dy S
pring
s – M
ariet
ta (S
E)Mi
dtown
, Atla
ntic
Stati
onDe
catur
Buck
head
45,1
38,22
31,2
84,50
03
75%
Partia
l
15Ba
ltimor
e – To
wson
(N
E)Inn
er H
arbo
rFe
lls P
oint
22,6
58,40
51,3
29,20
31
50%
Partia
l
Top 1
5 Sub
total
2047
4219
613
493
,222,5
8469
5,691
9772
%Bo
ttom
15 S
ubtot
al4
87
04
2344
,748,3
271,9
45,57
95
22%
16St
. Lou
is (M
W)
Wes
t End
Clay
ton2
2,796
,368
1,398
,184
210
0%St
arter
17Mi
nnea
polis
– St
. Pau
l – B
loomi
ngton
(MW
)Do
wntow
n Mi
nnea
polis
, Do
wntow
n St.
Paul
23,1
75,04
11,5
87,52
11
50%
Star
ter
18De
troit –
War
ren –
Li-
vonia
- Ann
Arb
or (n
ote
#6) (
MW)
Midto
wnBi
rming
ham;
Ann
Arb
or3
4,813
,013
1,604
,338
00%
None
19Co
lumbu
s (MW
)Sh
ort N
orth
11,7
25,57
01,7
25,57
00
0%No
ne20
Las V
egas
– Pa
radis
e (W
)Th
e Strip
11,7
77,53
91,7
77,53
90
0%No
ne
21Ho
uston
– Su
gar L
and
– Bay
town (
SW)
Montr
ose
Suga
rland
To
wn
Cente
r, W
ood-
lands
To
wn
Cente
r
35,5
39,94
91,8
46,65
01
33%
Star
ter
22Sa
n Anto
nio (S
W)
Rive
rwalk
11,9
42,21
71,9
42,21
70
0%No
ne23
Kans
as C
ity (M
W)
Coun
try C
lub P
laza
11,9
67,40
51,9
67,40
50
0%No
ne24
Orlan
do –
Kiss
imme
e (S
E)W
inter
Par
k1
1,984
,855
1,984
,855
00%
None
25Da
llas –
For
t Wor
th – A
rlingto
n (SW
)Up
town
Plan
o To
wn
Cente
r; Ad
dison
Ci
rcle
36,0
03,96
72,0
01,32
20
0%St
arter
26Ph
oenix
– Me
sa
– Sco
ttsda
le (S
W)
Temp
e; 24
th &
Cam-
elbac
k2
4,039
,182
2,019
,591
00%
None
27Sa
crame
nto –
Arde
n - A
rcade
– Ro
sevil
le (W
)Do
wntow
n1
2,067
,117
2,067
,117
00%
Star
ter
28Ci
ncinn
ati –
Midd
letow
n (M
W)
Hyde
Par
k1
2,104
,218
2,104
,218
00%
None
29Cl
evela
nd –
Elyri
a – M
entor
Unive
rsity
Circl
e1
2,114
,155
2,114
,155
110
0%Pa
rtial
30Ta
mpa –
St. P
etersb
urg
– Clea
rwate
r (SE
)0
2,697
,731
2,697
,731
00%
None
Botto
m 10
Sub
total
24
40
414
30,46
0,796
2,175
,771
214
%
–Con
tinue
d
Tabl
e 1
Rank
Metro
polita
n Are
aDo
wntow
nDo
wntow
n Adja
cent
Subu
rban
Town
Cen
terSu
burb
an R
e-de
velop
ment
Gree
nfield
Plac
e To
tal
Estim
ated
Pop 2
006
# of
Peop
le pe
r Plac
e
Rail T
rans
it Se
rved (
#)
(note
#1)
Rail T
rans
it Se
rvice
(% of
Pl
aces
)
Rail
Tran
sit
Syste
m Si
ze
TOTA
L24
5549
1910
157
137,9
70,91
187
8,795
102
65%
15%
35%
31%
12%
6%10
0%
Note
#1: A
meric
an
Publi
c Tra
nspo
rtatio
n, ww
w.ap
ta.co
m
Note
#2:
Comb
inatio
n of
San F
ranc
isco
and S
an Jo
se
MSAs
Note
#3: C
ombin
ation
of
Miam
i and
Palm
beac
h MS
As
Note
#4: C
ombin
ation
of
the N
ew Yo
rk-Ne
w jer
sey-L
ong I
sland
with
the
Brid
gepo
rt-St
amfor
d-No
rwalk
MSA
Note
#6:
Comb
inatio
n of
Detro
it and
Ann
Ar
bor M
SAs
Note
#5:
Comb
ina-
tion o
f Los
An
geles
an
d Ri
versi
de
MSAs
–Con
tinue
d
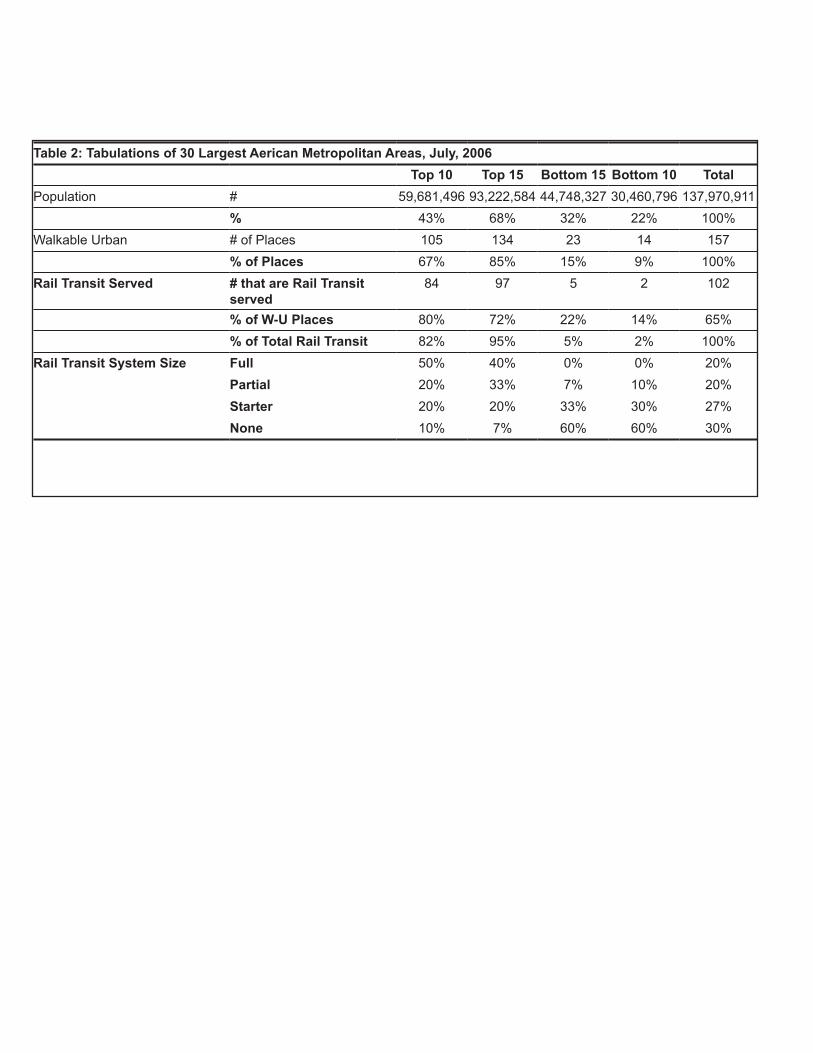
Table 2: Tabulations of 30 Largest Aerican Metropolitan Areas, July, 2006Top 10 Top 15 Bottom 15 Bottom 10 Total
Population # 59,681,496 93,222,584 44,748,327 30,460,796 137,970,911% 43% 68% 32% 22% 100%
Walkable Urban # of Places 105 134 23 14 157% of Places 67% 85% 15% 9% 100%
Rail Transit Served # that are Rail Transit served
84 97 5 2 102
% of W-U Places 80% 72% 22% 14% 65%% of Total Rail Transit 82% 95% 5% 2% 100%
Rail Transit System Size Full 50% 40% 0% 0% 20%Partial 20% 33% 7% 10% 20%Starter 20% 20% 33% 30% 27%None 10% 7% 60% 60% 30%
Nat
iona
l Ran
kM
etro
polit
an A
rea
Dow
ntow
nD
ownt
own
Adj
acen
tSu
burb
an T
own
Cen
ter
Subu
rban
Red
evel
-op
men
tG
reen
field
Plac
e To
tal
Estim
ated
Pop
20
06#
of P
eopl
e pe
r Pla
ceR
ail T
rans
it Se
rved
(#)
(not
e#1)
Rai
l Tra
nsit
Serv
ice
(%
of P
lace
s)
Rai
l Tra
nsit
Syst
em S
ize
NO
RTH
EAST
1W
ashi
ngto
n –
Ar-
lingt
on –
Ale
x-an
dria
Dow
ntow
nD
upon
t Circ
le; W
est
End;
Geo
rget
own;
A
dam
s Mor
gan,
C
apita
l Hill
Bet
hesd
a; O
ld
Tow
n A
lexa
n-dr
ia; F
riend
ship
H
eigh
ts; S
ilver
Sp
rings
; Roc
k-vi
lle, F
rede
rick
Bal
lsto
n, C
lare
n-do
n, R
osly
n, C
rys-
tal C
ity/P
ente
gon
City
, Car
lyle
, Cou
rt H
ouse
, Shi
rling
ton
Res
ton
Tow
n C
ente
r
205,
290,
400
264,
520
1890
%Fu
ll
2B
osto
n –
Cam
-br
idge
– Q
uinc
yD
ownt
own
Bea
con
Hill
; Bac
k B
ay; N
orth
End
; So
uth
End
Har
vard
Squ
are,
K
enda
ll Sq
uare
/M
IT, S
om-
mer
ville
/Dav
is
Squa
re
Low
ell,
Wel
lesl
ey,
New
bury
port
114,
455,
217
405,
020
1110
0%Fu
ll
9Pi
ttsbu
rgh
Dow
ntow
nO
akla
nd, S
outh
side
32,
370,
776
790,
259
133
%St
arte
r
10N
ew Y
ork
– N
orth
-er
n N
ew Je
rsey
–
Long
Isla
nd--
Stam
ford
, Con
n.
(not
e #4
)
Dow
ntow
n/W
all
Stre
et, M
idto
wn,
B
rook
lyn/
Atla
n-tic
Yar
ds, J
erse
y C
ity
Mor
ning
side
H
eigh
ts, L
inco
ln
Squa
re (U
pper
Wes
t Si
de),
Mus
eum
Mile
/U
pper
Eas
t Sid
e,
Mad
ison
Ave
nue/
Upp
er E
ast S
ide,
SO
HO
, Che
lsea
, 34
th S
treet
, Uni
on
Squa
re, P
ark
Slop
e,
Gre
enw
ich
Vill
age,
B
rook
lyn
Cul
tura
l D
istri
ct
Whi
te P
lain
s;
Stam
ford
; Pr
ince
ton;
New
B
runs
wic
k,
Hob
oken
, Gre
en-
wic
h
2118
,818
,536
896,
121
2110
0%Fu
ll
13Ph
ilade
lphi
a –
Cam
den
– W
ilm-
ingt
on
Cen
ter C
ityU
nive
rsity
City
/U
of P
enn,
Soc
iety
H
ill/O
ld T
own
Man
yunk
, New
H
ope
55,
826,
742
1,16
5,34
83
60%
Full
15B
altim
ore
– To
w-
son
Inne
r Har
bor
Fells
Poi
nt2
2,65
8,40
51,
329,
203
150
%Pa
rtial
Nor
thea
st S
ubto
tal (
Not
e #1
)9
2517
101
6239
,420
,076
635,
808
5589
%
Perc
enta
ge o
f N
E/To
tal
15%
40%
27%
16%
2%39
%28
%1.
3954
%
SOU
THEA
ST
8M
iam
i – F
ort
Laud
erda
le –
Pom
-pa
no B
each
- Pa
lm
Bea
ch (n
ote
#3)
Dow
ntow
n So
uth
Mia
mi B
each
; Ft
. Lau
derd
ale;
C
oral
Gab
les;
W
est P
alm
Bea
ch
Coc
onut
Bea
ch,
Dad
elan
d7
5,46
3,85
778
0,55
14
57%
Parti
al
14A
tlant
a –
Sand
y Sp
rings
– M
arie
tta
Mid
tow
n, A
tlant
ic
Stat
ion
Dec
atur
Buc
khea
d4
5,13
8,22
31,
284,
500
375
%Pa
rtial
24O
rland
o –
Kis
sim
-m
ee
Win
ter P
ark
11,
984,
855
1,98
4,85
50
0%N
one
30Ta
mpa
– S
t. Pe
ters
-bu
rg –
Cle
arw
ater
0
2,69
7,73
12,
697,
731
00%
Non
e
Sout
heas
t Sub
tota
l (N
ote
#1)
03
63
012
15,2
84,6
661,
273,
722
758
%
Perc
enta
ge o
f SE
/Tot
al0%
25%
50%
25%
0%8%
11%
0.72
7%
MID
WES
T
Tabl
e 3
–Con
tinue
d7
Chi
cago
– N
aper
-vi
lle –
Jolie
t Lo
op; M
agni
fi-ce
nt M
ileLi
ncol
n Pa
rk,
Old
Tow
n, W
est
Loop
,Riv
er N
orth
, H
yde
Park
, Sou
th
Loop
, Wic
ker P
ark
Evan
ston
; Lak
e Fo
rest
, Win
neta
, El
gin
The
Gle
nn14
9,50
5,74
867
8,98
213
93%
Full
16St
. Lou
is
Wes
t End
Cla
yton
22,
796,
368
1,39
8,18
42
100%
Star
ter
17M
inne
apol
is –
St.
Paul
– B
loom
-in
gton
Dow
ntow
n M
inne
apol
is,
Dow
ntow
n St
Pa
ul
23,
175,
041
1,58
7,52
11
50%
Star
ter
18D
etro
it –
War
ren
– Li
voni
a - A
nn
Arb
or (n
ote
#6)
Mid
tow
nB
irmin
gham
; A
nn A
rbor
34,
813,
013
1,60
4,33
80
0%N
one
19C
olum
bus
Shor
t Nor
th1
1,72
5,57
01,
725,
570
00%
Non
e
23K
ansa
s City
C
ount
ry C
lub
Plaz
a1
1,96
7,40
51,
967,
405
00%
Non
e
28C
inci
nnat
i –
Mid
dlet
own
Hyd
e Pa
rk1
2,10
4,21
82,
104,
218
00%
Non
e
29C
leve
land
– E
lyria
–
Men
tor
Uni
vers
ity C
ircle
12,
114,
155
2,11
4,15
51
100%
Parti
al
Mid
wes
t Sub
tota
l4
128
01
2528
,201
,518
1,12
8,06
117
68%
Perc
enta
ge o
f M
W/T
otal
16%
48%
32%
0%4%
16%
20%
0.8
17%
SOU
THW
EST
4D
enve
r – A
uror
a D
ownt
own
LOD
OB
ould
erB
elm
ar, C
herr
y C
reek
Vill
age
52,
408,
750
481,
750
240
%St
arte
r
21H
oust
on –
Sug
ar
Land
– B
ayto
wn
Mon
trose
Suga
rland
To
wn
Cen
-te
r, W
ood-
land
s Tow
n C
ente
r
35,
539,
949
1,84
6,65
01
33%
Star
ter
22Sa
n A
nton
io
Riv
erw
alk
11,
942,
217
1,94
2,21
70
0%N
one
25D
alla
s – F
ort
Wor
th –
Arli
ngto
n U
ptow
nPl
ano
Tow
n C
ente
r; A
d-di
son
Circ
le
36,
003,
967
2,00
1,32
20
0%St
arte
r
26Ph
oeni
x –
Mes
a –
Scot
tsda
le
Tem
pe; 2
4th
&
Cam
elba
ck2
4,03
9,18
22,
019,
591
00%
Non
e
Sout
hwes
t Sub
tota
l2
33
24
1419
,934
,065
1,42
3,86
23
21%
Perc
enta
ge o
f SW
/Tot
al14
%21
%21
%14
%29
%9%
22%
0.4
3%
WES
T
3Sa
n Fr
anci
sco
- O
akla
nd -
San
Jose
(n
ote#
2)
Dow
ntow
n Sa
n Fr
anci
sco;
Oak
-la
nd; B
erke
ley;
Sa
n Jo
se
Sout
h of
Mar
ket;
Mar
ina
Dis
trict
; Hob
H
ill, M
issi
on D
istri
ct
Palo
Alto
; Men
lo
Park
; San
Mat
eo,
Emor
yvill
e
Wal
nut C
reek
Sant
ana
Row
145,
967,
150
426,
225
1071
%Fu
ll
5Po
rtlan
d –
Vanc
ou-
ver –
Bea
verto
n D
ownt
own
Pear
l Dis
trict
, N
orth
wes
tLa
ke O
sweg
o4
2,13
7,56
553
4,39
14
100%
Parti
al
Tabl
e 3

6Se
attle
– T
acom
a –
Bel
levu
e D
ownt
own
Bel
l Tow
n; P
ione
er
Squa
reK
irkla
nd, R
ed-
mon
dU
nive
rsity
Dis
trict
63,
263,
497
543,
916
00%
Non
e
11Sa
n D
iego
– C
arls
-ba
d –
San
Mar
cos
Dow
ntow
nH
illcr
est/B
albo
a Pa
rkLa
Jolla
32,
941,
454
980,
485
267
%St
arte
r
12Lo
s Ang
eles
- L
ong
Bea
ch
- Ora
nge
Cou
nty
- Riv
ersi
de -
Ber
-na
rdin
o (n
ote
#5)
Dow
ntow
nH
olly
woo
d; W
est
Hol
lyw
ood
Pasa
dena
, San
ta
Mon
ica,
Lon
g B
each
, Bev
erly
H
ills,
Bur
bank
, G
lend
ale,
Cul
ver
City
Wes
twoo
d, C
entu
ry
City
Vale
ncia
To
wn
Cen
-te
r, C
osta
M
esa,
Sou
th
Coa
st T
own
Cen
ter
1516
,976
,264
1,13
1,75
14
27%
Parti
al
20La
s Veg
as –
Par
a-di
se
The
Strip
11,
777,
539
1,77
7,53
90
0%N
one
27Sa
cram
ento
–
Ard
en -
Arc
ade
– R
osev
ille
Dow
ntow
n1
2,06
7,11
72,
067,
117
00%
Star
ter
Wes
t Sub
tota
l9
1215
44
4435
,130
,586
798,
422
2045
%
Perc
enta
ge o
f W/
Tota
l20
%27
%34
%9%
9%28
%25
%1.
1220
%
TOTA
L24
5549
1910
157
137,
970,
911
878,
796
102
65%
Perc
enta
ge o
f Tot
al15
%35
%31
%12
%6%
100%
100%
1.00
100%
Not
e #1
: The
US
Cen
sus d
efini
tion
of B
altim
ore
and
Was
hing
ton,
DC
, M
SAs h
ave
been
sh
ifted
from
the
Sout
heas
t reg
ion
to th
e N
orth
east
re
gion

1775 Massachusetts Avenue, NWWashington, D.C. 20036-2188telephone 202.797.6000fax 202.797.6004web site www.brookings.edu
telephone 202.797.6139fax 202.797.2965web site www.brookings.edu/metro