Embed Size (px)
Citation preview
SS-AAEA Journal of Agricultural Economics Food Security, Labor Efficiency, and Technology Choice Neil Gerstein
Food Security, Labor Efficiency, and Technology Choice
Neil Gerstein, Iowa State University‡
Abstract
In order to achieve global food security in the twenty-first century, agricultural productivity rates in the developing world will need to outpace population growth rates and increases in food prices. Many developing economies try to incorporate agricultural technology from developed countries into their agricultural systems to increase efficiency and output. However, adopting these types of technologies may not be the optimal choice for maximizing agricultural output in the developing world because these types of technologies require relatively high skill levels to operate, among other frictions. This article uses the framework developed in Caselli and Coleman (2006) to propose that it is more effective in regards to agricultural output for countries abundant in low-skill labor (developing countries) to adopt low-skill complementary agricultural technology, while the reverse is true in developed countries. The chief finding of this article is that agricultural output is dependent on feasible technology and skill endowments, and that simply transferring agricultural technology from developed to developing countries will not yield large agricultural output increases—and may actually create output losses. The paradigm of global food security in the next century is to find a way in which the productivity of the agricultural systems of developing countries can increase such that they keep up with population growth and rising food prices. While population growth rates are expected to diminish globally in the first half of the twenty-first century, the world’s more destitute, food insecure regions are projected to maintain relatively higher population growth. As populations increase in developing regions—particularly Sub-Saharan Africa—food prices proportionally increase, making food less accessible for the impoverished populations in these regions. In order to achieve food security in developing countries, domestic agricultural systems must become more productive so that food supplies can keep up with population.
As of now, the prospects of agricultural productivity outpacing population in developing countries are slim. Zuberi and Thomas (2012) found that crop yields will increase slower in developing countries in response to population growth in Africa than in other world regions. Similarly, Sanchez (2002) found that in recent decades, agricultural technologies increased crop yields by only about 28% in Sub-Saharan Africa, while other developing regions of the world experienced increased yields of up to 60-80% in response to implementing better agricultural technologies.
Many developing economies try to incorporate technology from developed countries to increase efficiency and output. However, transferring agricultural technology from developed to developing countries comes with many frictions and may not be optimal for increasing agricultural production in the developing world. These technology-transfer frictions include any factors in less-developed societies that would make it difficult for their workers to use agricultural technology from developed countries. One of the most apparent frictions is that of the environment—agricultural technology is adaptive to the environment in which it is used. For example, the large, mechanical crop seeders used in the flat topography of the Midwestern United States would be of little use in the mountainous terrain that is farmed in most parts of China. Besides environmental, other transfer frictions include socio-economic factors, cultural factors, and educational factors. Mefford and Brunn (1998) found that cultural barriers
‡ Editor’s Note: Neil Gerstein’s paper won first place in the 2015 SS-AAEA Undergraduate Paper Competition.
SS-AAEA Journal of Agricultural Economics Food Security, Labor Efficiency, and Technology Choice Neil Gerstein
2
can be difficult to overcome in the transfer of technology. Furthermore, they found that the “attitudes of workers in these (developing) countries can be a significant barrier as well as low levels of education and industrial experience” (Mefford & Brunn 1998). While there is much evidence to indicate the presence of many factors that inhibit agricultural technology transfers, this article focuses on the effect of the education on this transferability.
The rationale behind the existence of educational transfer frictions is simple: technology from developed countries is hard to transfer to developing countries because these types of technologies are typically complementary with skilled labor—something developing countries relatively lack. Thus, it would be more efficient for a country to invest in technology that was complementary to the skill endowment of its labor force. This article proposes that some countries use skilled labor more efficiently, while others use unskilled labor more efficiently, and that agricultural output would increase in countries that utilized agricultural technology that complemented their more efficiently used labor-type (skilled or unskilled).
The most common production function used by macroeconomic researchers assumes output to be a function of capital and labor in the form
(1) 𝑦 = 𝑘∝(𝐴ℎ)!!∝,
where y is output, k is physical capital, h is human capital (all in per-worker terms), and A is a productivity term usually referred to as total factor productivity (TFP). The primary focus of this article is on the TFP term A and how it changes across countries and time for different types of labor.
Total factor productivity is not a term that can be measured directly. It is by definition the “portion of output not explained by the amount of inputs used in production” (Comin 2006). It can be interpreted as the level of efficiency that inputs are being utilized in production. As such, TFP is very important to growth and production. While physical and human capital (k and h in the model, respectively) are subject to diminishing returns, TFP is not bound by such a constraint. Thus TFP is integral to the long-term sustainability of growth.
Caselli and Coleman (2006) acknowledge that distinguishing between labor-skill levels in a production function has profound implications on output. In equation (1), the h term encompasses all types of labor, and thus assumes that workers of different education levels are perfect substitutes. However, it is obvious that this is an oversimplification—in most professions (including farming), the demand for labor is dependent on education level. In fact, Katz and Autor (1999) find that the elasticity of substitution between skilled and unskilled labor is 1.4, implying that they are most definitely not perfect substitutes.
Caselli and Coleman (2006) modify equation (1) by splitting labor into two groups—skilled and unskilled. Their resulting equation is (2) 𝑦 = 𝑘∝ 𝐴!𝐿! ! + 𝐴!𝐿! ! (!!!)/!, where h is replaced by Lu and Ls, which represent unskilled labor and skilled labor, respectively. Similarly, A is replaced by Au and As which represent the productivity of unskilled and skilled labor, respectively. In equation (2), 1/(1 – σ) is equal to the elasticity of substitution between skilled and unskilled labor, and the two remain imperfect substitutes as long as σ < 1 (Caselli & Coleman 2006). By using the production
SS-AAEA Journal of Agricultural Economics Food Security, Labor Efficiency, and Technology Choice Neil Gerstein
3
function (2) that distinguishes between skilled and unskilled labor, Caselli and Coleman find that Au and As change across countries.
The ratio of As/Au indicates how technical change is augmenting. When this ratio is constant over time, technical change is said to be skill neutral. However, if As increases over time, technical change is said to be skilled-labor augmenting, meaning that “the economy is becoming more efficient at using skilled workers” (Caselli & Coleman 2006). Similarly, if Au increases over time, the economy becomes unskilled-biased, and becomes more efficient at using unskilled workers. To compare As and Au across different countries, Caselli and Coleman measure them over per-capita income. The rationale is that per-capita income can be used a measurement of a country’s level of development. The hypothesized relationship between efficiency and per-capita income is that As will rise with income, meaning that wealthier countries are more efficient at using skilled labor. But how does Au rise with income? Are wealthier countries also more efficient at using unskilled labor—or is there a different relationship? To answer these questions this article elaborates on the methodologies established in Caselli and Coleman (2006) by using more data, focusing on the agricultural sector, and including a time parameter. Caselli and Coleman estimate As and Au for all workers in a cross-section of countries in the year 1988. Since this article is focused on agricultural productivity, our data instead focuses on agricultural sectors and rural workers.
Since this article is an elaboration on Caselli and Coleman (2006), it should be noted why it is a worthwhile elaboration, and why agriculture is a worthy subject of study for their methods. Caselli and Coleman’s methods produced very intriguing results, but as of yet, there has been little recreation of their work to check its accuracy. This article serves as a check of the accuracy of their findings, but also expands their argument to agriculture by using far more data, data that is more recent, and looking at the data throughout time. Furthermore, while Caselli and Coleman generalized their findings over all sectors, this article tests their accuracy in one sector—agriculture. Agriculture is arguably the best sector to test these methods because of the fact that there are many different ways to produce the same crops—meaning that there are people all over the world producing the same types of food using vastly different technologies. Similar to the previous example, corn is planted in the United States via the use of a large-scale, mechanized seed planter, which requires much training and education to use. However, in many developing countries, the same crop—corn—is planted manually using a seed drill, a device that is either pushed by a human or pulled by livestock to plant seeds. This example illustrates the use of two completely different agricultural technologies—one complementary to high-skilled workers, the other to low-skilled workers—that are in use in modern societies around the globe. Data and Methodologies Our primary goal was to solve for As and Au for each country and compare them to other countries and across time. In order to solve for As and Au, we used Caselli and Coleman’s closed form solutions
(3) 𝐴! = !!/(!!!)!!!/(!!!)
!!
!!!!!!!!!!!!!
!/!
(4) 𝐴! = !!/(!!!)!!!/(!!!)
!!
!!!!!!!!!!!!!
!/!,
The data on demographics and education was obtained from the World Bank and was provided by Dr. Peter Orazem from Iowa State University. This dataset was the accumulation of hundreds of surveys administered by the World Bank to thousands of people in countries all over the world from about 1960 to 2013. The resulting dataset had over 5 million observations.
SS-AAEA Journal of Agricultural Economics Food Security, Labor Efficiency, and Technology Choice Neil Gerstein
4
We first narrowed down the dataset by picking the first and last survey year for each country, eliminating surveys taken in between these years if any existed. It was assumed that people surveyed in the in between years would be accounted for in the first and last surveys at different ages, and those that were not were either too old or too young. We then defined a prime age group between the ages of 20 and 40. This group was selected because it was believed to be the prime age group of agricultural labor across countries. Using the prime age group and the first and last survey years, we were able to get data for the prime age group, for the in between years and for years outside the range of the survey years in ten-year increments, thus creating a decadal data set.
For example, the earliest survey year we had for Brazil was 1981. We used the data from the 1981 survey for the prime age group of 20-40 years in 1981. From this same survey, we used data for the prime age group in 1971 by assuming that those who were 20-40 in 1970 were 30-50 in 1981. Similarly, data for the prime age group in 1961 could be extracted from the 1981 survey by using people 40-60 years, for 1951 people 50-70 years, etc… By using this method of decadal incrementing, we were able to get data for the prime age group from the 1950’s to the 2010’s. These survey years were then ordered by decade from 1960 to 2010 so that we had data for every decade between these ranges. This was done by assigning surveys to the decade it was closest to. For example, decade = 1960 if 1955 > survey year ≤ 1965, decade = 1970 if 1965 > survey year ≤ 1975, etc…
Integral to finding As and Au are the total amounts of skilled and unskilled labor in each country, Ls and Lu, respectively. To find Ls and Lu, we defined unskilled labor Lu as any person with primary school education or less (≤ 6 years of education). We defined Ls as everyone else (> 6 years of education), consistent with the methods used in Caselli and Coleman (2006). Next, for each decade, we multiplied the unskilled and skilled surveyed population by the total population of the country to find the aggregate high and low skill populations Ls and Lu, for each decade.
Since this paper focused on agriculture, we used agricultural output per worker for y, and agricultural physical capital per worker for k. Data for y and k were taken from Horsager (2013), which were taken from the FAO. Agricultural wage data for ws and wu were taken from the pervious World Bank dataset. Following Caselli and Coleman (2006), we set α equal to 1/3. From Katz and Autor (1999) we know that 1/(1-σ) = 1.4, thus σ = 0.286. From equations (3) and (4), and all of our estimates, we were able to calculate As and Au for each country with available data for each decade from 1960 to 2010. Efficiency of Labor By plotting the log of As or Au by the log of output per agricultural worker, we can see how As and Au change by country and wealth. The results of this regression for As and Au are visible in figures 1 and 2, respectively. As hypothesized, there is obvious skill bias in developed countries towards skilled labor; the relationship between As and income (represented in figures 1 and 2 by agricultural output per worker) has a strong, positive correlation. This implies that the wealthier a country is, the more efficient it is at using skilled labor.
The relationship between Au and output is not as strong as the relationship between As and output, but it is apparent that Au falls as output increases. Thus, developing countries are relatively more efficient at using unskilled labor than developed countries, while the reverse is true for developed countries.
Table 1 provides the log value of As and Au for three different countries. Uganda, like other low income countries has an As value lower than more developed countries like Brazil and USA, and a relatively higher Au value. For each year included, Uganda consistently has the lowest As value of the
SS-AAEA Journal of Agricultural Economics Food Security, Labor Efficiency, and Technology Choice Neil Gerstein
5
three countries. Conversely, USA, like other high income countries, has a higher As value than less developed countries like Uganda and Brazil, while it has a much lower Au value than either Uganda or Brazil. Middle income countries like Brazil lie somewhere between the values of As and Au for high and low income countries (though in this case it appears Brazil is more efficient at using unskilled labor than Uganda).
An interesting observation is the flatting-out of the relationships between As or Au and output over time. This implies that over time developing and developed countries could be moving towards convergent values of As and Au, but more analysis would need to be done to understand this phenomenon.
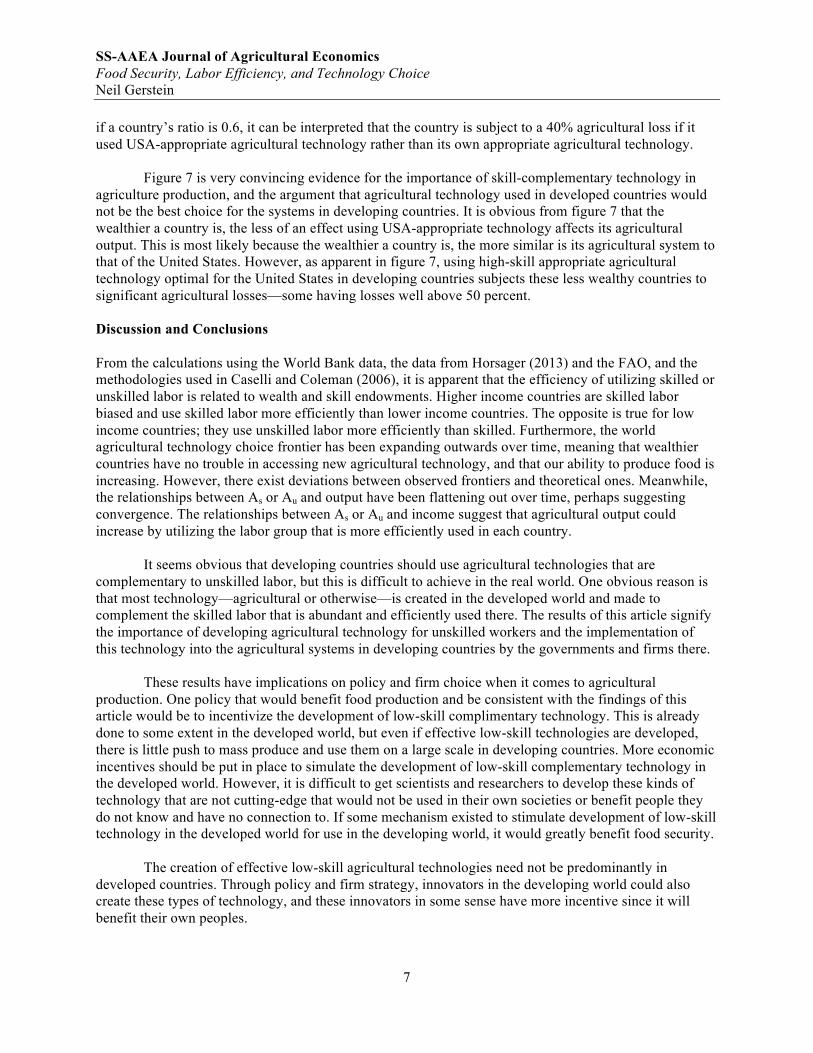
Besides being affected by wealth, As and Au are undoubtedly related to the endowment of skilled or unskilled labor in a country. From the same estimates of As and Au and the endowment of Ls in each country, we estimate this relationship in figure 3. Our estimates indicate that As is strongly positively correlated with increasing values of Ls while Au is strongly negatively correlated with increasing values of Ls. This can be interpreted as the efficiency at which a country uses skilled workers increases as its endowment of skilled workers increases, while a country’s efficiency of unskilled workers decreases as its endowment of skilled workers increases. The World Agricultural Technology Choice Frontier Caselli and Coleman (2006) use their calculated values of As and Au to describe what they refer to as “the world technology frontier,” where each country has the ability to choose “from a menu of different production methods that differ in the use they make of skilled and unskilled labor” (Caselli & Coleman 2006). They assume that the production function for each country is in the form of equation (2) that distinguishes between high and low skill labor, and that they differ in inputs Au and As. This results in a “technology choice frontier” where the axes measure the efficiencies of skilled and unskilled labor.
In figure 4, Country A has a technology choice frontier that is represented by the inner curve. It can choose some point (Au , As) along its frontier to input into its production function (2). Country B in figure 3 has a higher technology choice frontier. This represents the frontiers being country specific—country B being wealthier than A and having easier access to more technology choices, while country A experiences barriers to technology adoption. Depending on whether country A (or B) is skilled or unskilled labor abundant, it would be most efficient to choose technology complementary to its labor force. For example, if country A were unskilled labor abundant, it would do best to make a technology choice closer to Aa.
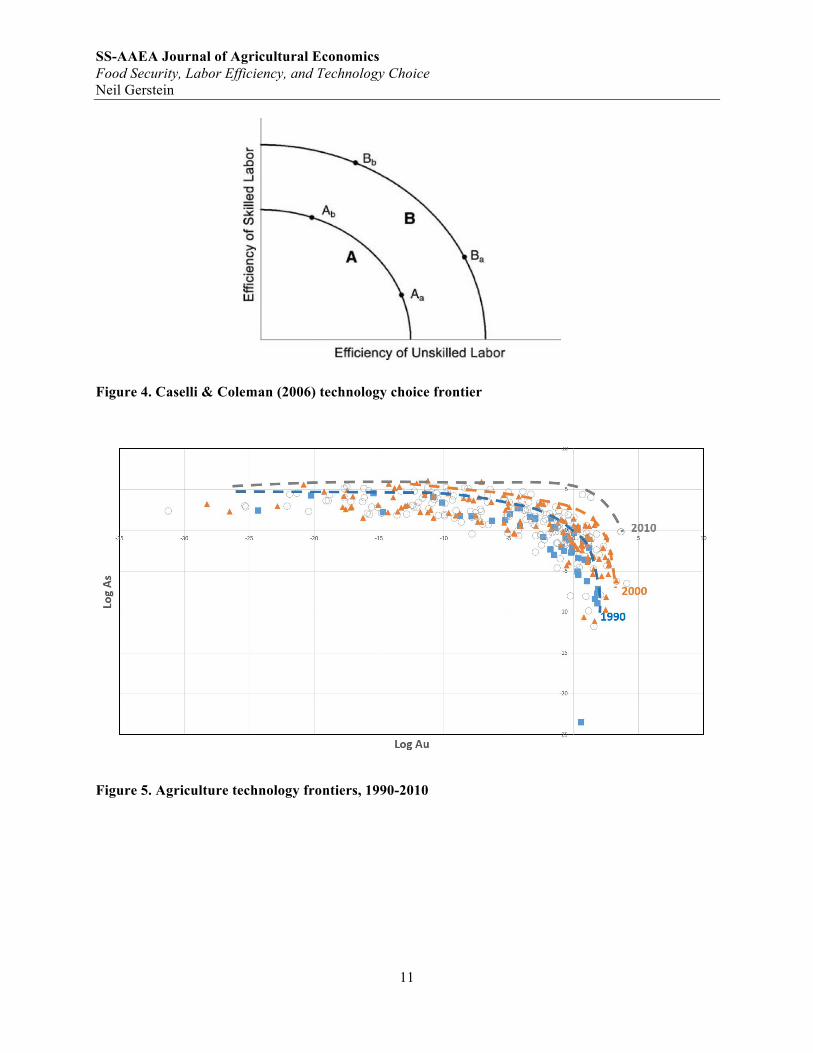
By plotting log of As by log of Au for the years in which we had the most data (1990, 2000, & 2010), we can see the observed agricultural technology choice frontiers for all countries in these time periods. Figure 5 displays the observed version of the world agricultural technology choice frontier. Each point represents a specific country’s agricultural technology choice (As, Au) on its respective agricultural technology choice frontier in a specific year. The so called “world” technology choice frontier in each year is the outermost frontier for that year, which corresponds to the country that had the highest level of access to agricultural technology choices. It is apparent from figure 4 that the observed world technology frontier is expanding outward over time. This implies that the wealthiest countries are gaining access to state of the art agricultural technologies as time progresses.
Following the observed technology frontiers, we can calculate the theoretical frontiers for different countries using the equation proposed by Caselli and Coleman (2006)

SS-AAEA Journal of Agricultural Economics Food Security, Labor Efficiency, and Technology Choice Neil Gerstein
6
(5) (𝐴!)! + 𝛾(𝐴!)! ≤ 𝐵, where 𝜔, 𝛾, and B are all positive exogenous parameters, and B is the value, or height, of the frontier. The parameters 𝜔 and 𝛾 can be thought of as the parameters that govern the trade-off between efficiency of unskilled labor and skilled labor. To obtain them, in accordance with Caselli and Coleman’s (2006) methods, we relax the assumption that all countries face the same trade-off parameter 𝛾, and instead allow it to be a random variable. Thus 𝛾! and 𝜔 can be found using Caselli and Coleman’s regression:
(6) log !!!
!!!= !
!!!𝑙𝑜𝑔 !!!
!!!+ !
!!!𝑙𝑜𝑔𝛾!
Our calculated estimation of 𝜔 from this regression is 0.35, which is fairly close to Caselli and
Coleman’s estimation at 0.41 for all sectors of the economy. The parameter 𝛾! is then calculated from the error in the regression, or the regression residual, thus yielding a 𝛾 estimation for each country. Plugging these parameters into equation (5) gives us the theoretical agricultural technology choice frontier B for each country. This value B can be interpreted as the highest amount of agricultural technology choice a country has access to, given its efficiency of skilled and unskilled rural workers.
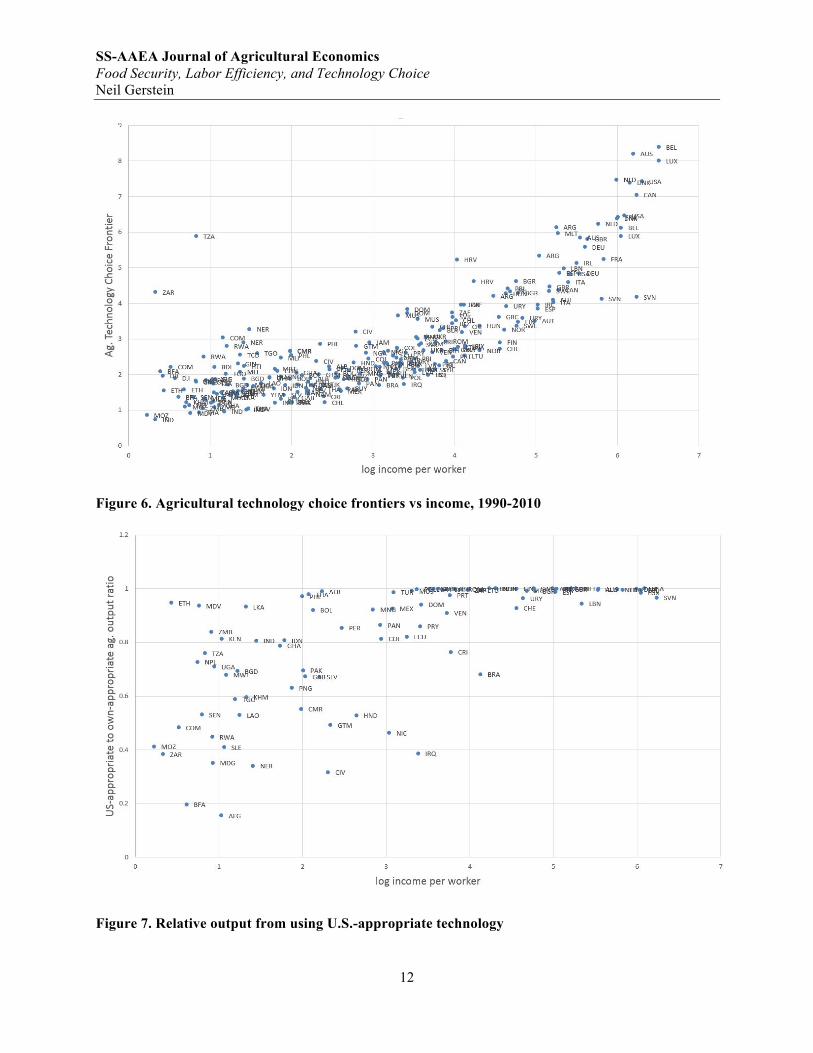
In figure 6 we plot the value, or “height,” of a country’s agricultural technology choice frontier against log income per worker. As is apparent from this graph, there is an obvious correlation between the height of the frontier and wealth. From our calculations, Belgium has the highest agricultural choice frontier, and thus, is the world’s agricultural technology choice frontier. Counterfactual Calculations Perhaps the most convincing argument as to the importance of appropriate technology on agricultural output comes from our last calculations. First, we allow each country access to the world agricultural technology choice frontier (Belgium’s, which is equal to 8.388) so that they are all operating on the same frontier. Next, we see what would happen were each country to use USA-appropriate technology over its own appropriate technology choice.
To do this, we calculate As and Au for each country given access to the world agricultural technology choice frontier B using Caselli and Coleman’s (2006) methods:
(7) 𝐴! = !
!! !!
!!!(!!!!)!"/(!!!)
!/!
(8) 𝐴! = !/!
!! !!
!!!(!!!!)!"/(!!!)
!/!
We then plug this As, Au combination into equation (2) to estimate each country’s optimal agricultural output if it had access to the world agricultural technology choice frontier. Next, we take the As, Au value for the USA from equations (7) and (8), and plug them into equation (2) to estimate the level of agricultural output a country would achieve if it used USA-appropriate technology.
The results of this calculation are presented in figure 7. The y-axis represents the ratio of using USA-appropriate agricultural technology to using the country’s own appropriate technology. For example,
SS-AAEA Journal of Agricultural Economics Food Security, Labor Efficiency, and Technology Choice Neil Gerstein
7
if a country’s ratio is 0.6, it can be interpreted that the country is subject to a 40% agricultural loss if it used USA-appropriate agricultural technology rather than its own appropriate agricultural technology.
Figure 7 is very convincing evidence for the importance of skill-complementary technology in agriculture production, and the argument that agricultural technology used in developed countries would not be the best choice for the systems in developing countries. It is obvious from figure 7 that the wealthier a country is, the less of an effect using USA-appropriate technology affects its agricultural output. This is most likely because the wealthier a country is, the more similar is its agricultural system to that of the United States. However, as apparent in figure 7, using high-skill appropriate agricultural technology optimal for the United States in developing countries subjects these less wealthy countries to significant agricultural losses—some having losses well above 50 percent. Discussion and Conclusions From the calculations using the World Bank data, the data from Horsager (2013) and the FAO, and the methodologies used in Caselli and Coleman (2006), it is apparent that the efficiency of utilizing skilled or unskilled labor is related to wealth and skill endowments. Higher income countries are skilled labor biased and use skilled labor more efficiently than lower income countries. The opposite is true for low income countries; they use unskilled labor more efficiently than skilled. Furthermore, the world agricultural technology choice frontier has been expanding outwards over time, meaning that wealthier countries have no trouble in accessing new agricultural technology, and that our ability to produce food is increasing. However, there exist deviations between observed frontiers and theoretical ones. Meanwhile, the relationships between As or Au and output have been flattening out over time, perhaps suggesting convergence. The relationships between As or Au and income suggest that agricultural output could increase by utilizing the labor group that is more efficiently used in each country.
It seems obvious that developing countries should use agricultural technologies that are complementary to unskilled labor, but this is difficult to achieve in the real world. One obvious reason is that most technology—agricultural or otherwise—is created in the developed world and made to complement the skilled labor that is abundant and efficiently used there. The results of this article signify the importance of developing agricultural technology for unskilled workers and the implementation of this technology into the agricultural systems in developing countries by the governments and firms there.
These results have implications on policy and firm choice when it comes to agricultural production. One policy that would benefit food production and be consistent with the findings of this article would be to incentivize the development of low-skill complimentary technology. This is already done to some extent in the developed world, but even if effective low-skill technologies are developed, there is little push to mass produce and use them on a large scale in developing countries. More economic incentives should be put in place to simulate the development of low-skill complementary technology in the developed world. However, it is difficult to get scientists and researchers to develop these kinds of technology that are not cutting-edge that would not be used in their own societies or benefit people they do not know and have no connection to. If some mechanism existed to stimulate development of low-skill technology in the developed world for use in the developing world, it would greatly benefit food security.
The creation of effective low-skill agricultural technologies need not be predominantly in developed countries. Through policy and firm strategy, innovators in the developing world could also create these types of technology, and these innovators in some sense have more incentive since it will benefit their own peoples.

SS-AAEA Journal of Agricultural Economics Food Security, Labor Efficiency, and Technology Choice Neil Gerstein
8
The primary conclusion of this article is that utilizing the abundance of unskilled, rural labor in developing countries through appropriate technology choices would significantly increase food production, and subsequently, food security. Drawing upon the example from earlier in this article on the benefits of using a large, mechanized corn seed planter versus using a smaller, manual seed drill: it is apparent that developing countries could do much better in terms of agricultural output and efficiency from investing in seed drills rather than seed planters. If more governments and agricultural firms in the developing world used this mindset and knowledge when it came to inputs, food production and food security would increase, and hopefully outpace population growth in developing countries in the 21st century.
An important inconsistency in the model that we use and its implications on agriculture should be noted: our model assumes that when it comes to producing a crop, there are skill intensive technologies that are used in the developed world, and non-skill intensive technologies that should be used in the developing world. This is an assumption Caselli and Coleman make in their original paper, which could hold true across all sectors and goods, but in agriculture, the technology may not be so dichotomous.
Referring back to our seed planter versus seed drill example: both are used to accomplish the same task, but one is skill intensive and one is not. In this sense of agricultural technology, there is a dichotomous element, but what about other sorts of agricultural technologies? Genetically modified seeds and better fertilizers are both technological inputs used in agriculture that were made in the developed world but are not skill intensive. Furthermore, these two inputs may be the most important when it comes to increasing crop yields. Thus, the findings of this article may not seem as convincing when the assumption of the dichotomy of agricultural technology is refuted, but we plan to incorporate these inputs in our model in the future.

SS-AAEA Journal of Agricultural Economics Food Security, Labor Efficiency, and Technology Choice Neil Gerstein
9
Figure 1. Efficiency of skilled agricultural labor, 1990-2010
Figure 2. Efficiency of unskilled agricultural labor, 1990-2010

SS-AAEA Journal of Agricultural Economics Food Security, Labor Efficiency, and Technology Choice Neil Gerstein
10
Table 1. Efficiency of Agricultural Labor in Uganda, Brazil and USA, 1990-2010
Figure 3. Efficiency of skilled and unskilled labor with skilled labor proportion, 1980-2010
SS-AAEA Journal of Agricultural Economics Food Security, Labor Efficiency, and Technology Choice Neil Gerstein
11
Figure 4. Caselli & Coleman (2006) technology choice frontier
Figure 5. Agriculture technology frontiers, 1990-2010
SS-AAEA Journal of Agricultural Economics Food Security, Labor Efficiency, and Technology Choice Neil Gerstein
12
Figure 6. Agricultural technology choice frontiers vs income, 1990-2010
Figure 7. Relative output from using U.S.-appropriate technology
SS-AAEA Journal of Agricultural Economics Food Security, Labor Efficiency, and Technology Choice Neil Gerstein
13
References Caselli F, Coleman JW. 2006. The World Technology Frontier. The American Economic Review. 96(3): 499-522 Horsager, J. 2014. Can We Feed the World?: Food Production, Input Prices, Trade Restrictions
and Technological Change, 1961-2010. Iowa State University. Comin D. 2008. Total Factor Productivity. The New Palgrave Dictionary of Economics. 2 Katz L, Autor D. 1999. Changes in the Wage Structure and Earnings Inequality. Handbook of
Labor Economics. 3(A): 1463-1555 Thomas K, Zuberi T. 2012. Demographic Change, the IMPACT Model, and Food Security in Sub-Saharan Africa. UN Development Programme, Regional Bureau for Africa. Sanchez, PA. 2002. Soil Fertility and Hunger in Africa. Sci. 15: 2019-2020 Mefford RN, Bruun P. 1998. Transferring World Class Production to Developing Countries: A
Strategic Model. Intl. J. of Production Econ. 56-57: 433-450