Embed Size (px)
Citation preview

Presentation Materials (PDF)
Pages 160 to 206 of the Transcript
Appendix 1: Materials used by Mr. Dudley
Class II FOMC - Restricted FR
Page 1
Top panel(1)
Title: Assets in Prime Money Market Funds Decline SharplySeries: Assets in Prime, Treasury, Treasury and Repo, and Treasury and Agency Money MarketFundsHorizon: January 1, 2008 - October 23, 2008Description: Assets in prime money market funds decline sharply.
Source: iMoneyNet
Middle panel(2)
Title: Treasury Bill Yields Decline After Lehman Brothers Holding Company Declares BankruptcySeries: One-, Three-, and Six-Month Treasury Bill YieldsHorizon: January 1, 2008 - October 24, 2008Description: Treasury bill yields decline after Lehman Brothers Holding Company declaresbankruptcy.
Source: Bloomberg
Bottom panel(3)
Title: Fails in the Treasury Market Rise as Treasury GC Repo Rates DeclineSeries: Fails Volume in the Treasury Market, Overnight GC Repo RatesHorizon: January 1, 2008 - October 24, 2008Description: Fails in the Treasury market increase as Treasury GC repo rates decline.
Source: Fixed Income Clearing Corporation, Federal Reserve Bank of New York
Page 2

Top panel(4)
Title: Three-Month AA-Rated Commercial Paper Rates Begin to Decline from Elevated LevelsSeries: Three-Month AA-Rated Financial, Non-Financial, and Asset Backed Commercial PaperRatesHorizon: January 1, 2008 - October 24, 2008Description: Three-month AA-rated financial and asset backed commercial paper rates begin todecline from elevated levels following the announcement of the Federal Reserve's Commercial PaperFunding Facility.
Source: Federal Reserve Board
Middle panel(5)
Title: Estimated Average Maturity of Outstanding AA-Rated Commercial Paper DeclinesSeries: Two-Week Moving Average of the Estimated Daily Weighted Average Maturity of AA-RatedFinancial, Non-Financial, and Asset Backed Commercial Paper OutstandingHorizon: January 1, 2008 - October 24, 2008Description: Estimated weighted average maturity of outstanding AA-rated financial and assetbacked commercial paper declines.
Source: Federal Reserve Board
Page 3
Top panel(6)
Title: One-Month Libor-OIS Spreads at Exceptionally Wide LevelsSeries: Spreads between One-Month Libor Rates and One-Month Overnight Index Swap Rates forU.S., U.K., and Euro AreaHorizon: July 1, 2007 - October 24, 2008Description: The spreads between the one-month Libor rate and the one-month overnight indexswap rate in the U.S., U.K., and Euro area are at exceptionally wide levels.
Source: Bloomberg
Middle panel(7)
Title: Three-Month Libor-OIS Spreads at Exceptionally Wide LevelsSeries: Spreads between Three-Month Libor Rate and Three-Month Overnight Index Swap Rates forU.S., U.K., and Euro AreaHorizon: July 1, 2007 - October 24, 2008Description: The spreads between the three-month Libor rate and the three-month overnight indexswap rate in the U.S., U.K., and Euro area are at exceptionally wide levels.
Source: Bloomberg
Page 4
Top panel(8) Term Auction Facility Auction Results
December 20, 2007 - October 23, 2008
AuctionSettlement
Term AmountMinimumBid Rate
Stop-outRate
Propositions Bid/Cover Bidders
12/20/2007 28 Days $20 b 4.17% 4.65% $61.6 b 3.08 93
12/27/2007 35 Days $20 b 4.15% 4.67% $57.7 b 2.88 73
1/17/2008 28 Days $30 b 3.88% 3.95% $55.5 b 1.85 56
1/31/2008 28 Days $30 b 3.10% 3.12% $37.5 b 1.25 52
2/14/2008 28 Days $30 b 2.86% 3.01% $58.4 b 1.95 66
2/28/2008 28 Days $30 b 2.81% 3.08% $68.0 b 2.27 72
3/13/2008 28 Days $50 b 2.39% 2.80% $92.6 b 1.85 82
3/27/2008 28 Days $50 b 2.19% 2.62% $88.9 b 1.78 88
4/10/2008 28 Days $50 b 2.11% 2.82% $91.6 b 1.83 79
4/24/2008 28 Days $50 b 2.05% 2.87% $88.9 b 1.77 89
5/8/2008 28 Days $75 b 2.00% 2.22% $96.8 b 1.29 71
5/22/2008 28 Days $75 b 1.99% 2.10% $84.4 b 1.13 75
6/5/2008 28 Days $75 b 2.00% 2.26% $95.9 b 1.28 73
6/19/2008 28 Days $75 b 2.05% 2.36% $89.4 b 1.19 76
7/3/2008 28 Days $75 b 2.01% 2.34% $90.9 b 1.21 77
7/17/2008 28 Days $75 b 2.01% 2.30% $93.3 b 1.24 82
7/31/2008 28 Days $75 b 2.01% 2.35% $90.6 b 1.21 70
8/14/2008 84 Days $25 b 2.04% 2.75% $54.8 b 2.19 64
8/14/2008 28 Days $50 b 2.01% 2.45% $75.5 b 1.51 65
8/28/2008 28 Days $75 b 2.01% 2.38% $84.2 b 1.12 66
9/11/2008 84 Days $25 b 2.02% 2.67% $31.6 b 1.27 38
9/11/2008 28 Days $25 b 2.01% 2.53% $46.2 b 1.85 53
9/25/2008 28 Days $75 b 1.94% 3.75% $133.6 b 1.78 85
10/9/2008 85 Days $150 b 1.39% 1.39% $138.1 b 0.92 71
10/23/2008 28 Days $150 b 1.11% 1.11% $113.3 b 0.76 74
Source: Federal Reserve Board
Page 5
Top panel(9) Outstanding FX Swap Lines
As of October 22, 2008
$ Billion

$ Billion
ECB 280
BOE 80
BOJ 50
SNB 24
RBA 20
Denmark National Banken 10
Riksbank 10
Norges Bank 3
Source: Federal Reserve Bank of New York
Bottom panel(10)
Title: Total Outstanding FX Swap Draw-DownsSeries: Total Outstanding FX Swap Draw-Downs for the Swiss National Bank, Riksbank, ReserveBank of Australia, European Central Bank, Norges Bank, Danmark National Banken, Bank of Japan,and Bank of EnglandHorizon: December 1, 2007 - October 22, 2008Description: Total outstanding FX swap draw-downs increase.
Source: Federal Reserve Bank of New York
Page 6
Top panel(11)
Title: Investment Bank CDS SpreadsSeries: Credit Default Swap Spreads for Morgan Stanley and Goldman SachsHorizon: August 1, 2007 - October 24, 2008Description: Credit default swap spreads for Morgan Stanley and Goldman Sachs narrow sharply.
Source: Markit
Middle panel(12)
Title: Commercial Bank CDS SpreadsSeries: Credit Default Swap Spreads for Bank of America, Citigroup, JPMorgan Chase, and WellsFargoHorizon: August 1, 2007 - October 24, 2008Description: Credit default swap spreads for Bank of America, Citigroup, JPMorgan Chase, andWells Fargo narrow sharply.
Source: Markit
Bottom panel(13)

Title: Non-Bank Financial CDS Spreads at Elevated LevelsSeries: Credit Default Swap Spreads for Hartford Financial Services Group, General Electric CapitalCorporation, American Express Company, and Prudential FinancialHorizon: January 1, 2008 - October 24, 2008Description: The credit default swap spreads for Hartford Financial Services Group, GeneralElectric Capital Corporation, American Express Company, and Prudential Financial narrow, but to alesser extent than the investment and commercial banks.
Source: Markit
Page 7
Top panel(14)
Title: Fannie Mae Discount Note Rates Increase Relative to OISSeries: Stop-Out Rate Spread to OIS for 3- and 6-Month Fannie Mae Discount Note AuctionsHorizon: January 1, 2008 - October 22, 2008Description: The stop-out rate spread to the overnight index swap rate in the 3- and 6-month FannieMae discount note auctions increases.
Source: Fannie Mae
Middle panel(15)
Title: Freddie Mac Discount Note Rates Increase Relative to OISSeries: Stop-Out Rate Spread to OIS for 3- and 6-Month Freddie Mac Discount Note AuctionsHorizon: January 1, 2008 - October 20, 2008Description: The stop-out rate spread to the overnight index swap rate in the 3- and 6-month FreddieMac discount note auctions increases.
Source: Freddie Mac
Bottom panel(16)
Title: Agency Debt Spreads Widen After the FDIC Announces Guarantee of Bank DebtSeries: Fannie Mae 5- and 10-Year Debt Spreads and Freddie Mac 5- and 10-Year Debt SpreadsHorizon: January 1, 2008 - October 24, 2008Description: Agency debt spreads widen after the FDIC announces the guarantee of bank debt.
Source: Bloomberg
Page 8
Top panel(17)
Title: Federal Reserve Balance SheetSeries: The Composition of the Federal Reserve Balance SheetHorizon: August 2007 - December 2008
Description: The Federal Reserve balance sheet expands.
Source: Federal Reserve Bank of New York
Middle panel(18)
Title: Fed Funds Rate Trades Below the TargetSeries: Fed Funds Target Rate, Fed Funds Effective Rate, Interest Rate Paid on Excess ReserveBalances, Fed Funds Low RateHorizon: August 1, 2008 - October 24, 2008Description: Fed funds effective rate nears the rate paid on excess reserve balances after the FederalReserve begins to pay interest on reserve balances.
Source: Federal Reserve Bank of New York
Bottom panel(19)
Title: Intraday Fed Funds TradingSeries: Fed Funds Target Rate, Fed Funds Effective Rate, Interest Rate Paid on Excess ReserveBalances, Intraday Fed Funds TradingHorizon: October 2, 2008 - October 23, 2008Description: The intraday trading range in the fed funds market progressively narrows.
Source: Federal Reserve Bank of New York
Page 9
Top panel(20)
Title: Hedge Fund Performance Declines SharplySeries: Three-Month Moving Average Rate of Return for the Credit Suisse/Tremont Hedge FundIndexHorizon: January 1, 2008 - October 1, 2008Description: Hedge fund returns decline sharply.
Source: Credit Suisse/Tremont
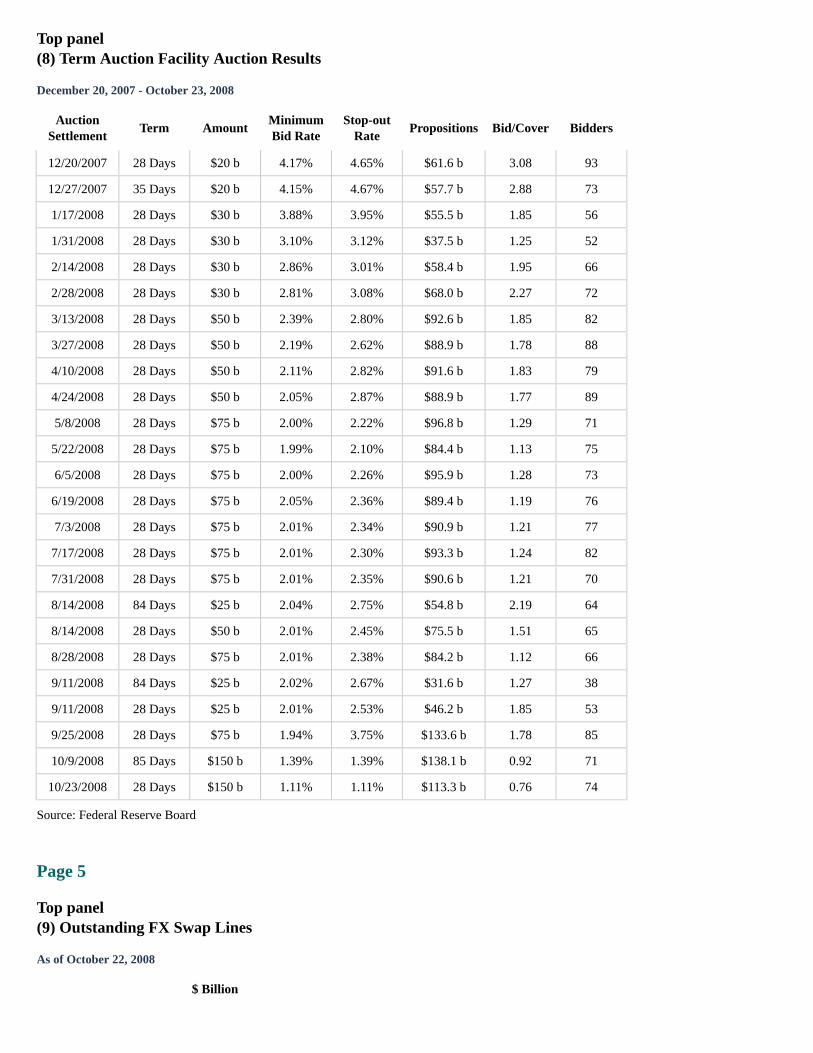
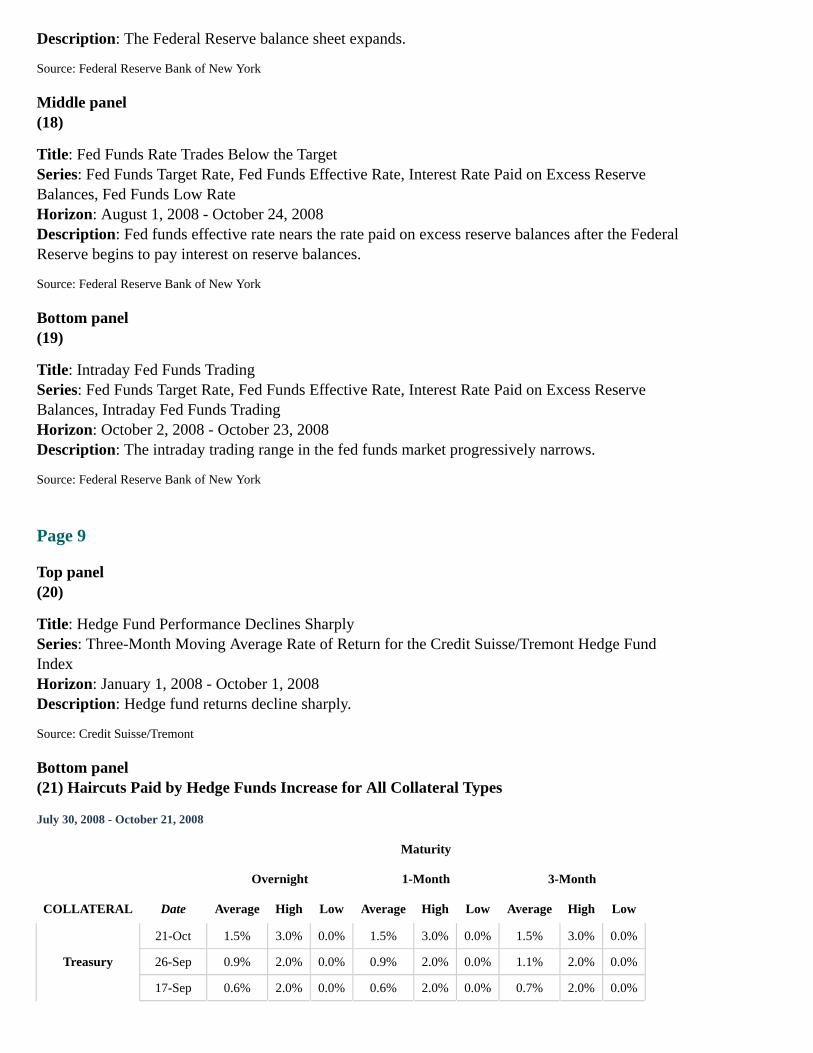
Bottom panel(21) Haircuts Paid by Hedge Funds Increase for All Collateral Types
July 30, 2008 - October 21, 2008
Maturity
Overnight 1-Month 3-Month
COLLATERAL Date Average High Low Average High Low Average High Low
Treasury
21-Oct 1.5% 3.0% 0.0% 1.5% 3.0% 0.0% 1.5% 3.0% 0.0%
26-Sep 0.9% 2.0% 0.0% 0.9% 2.0% 0.0% 1.1% 2.0% 0.0%
17-Sep 0.6% 2.0% 0.0% 0.6% 2.0% 0.0% 0.7% 2.0% 0.0%
Maturity
Overnight 1-Month 3-Month
COLLATERAL Date Average High Low Average High Low Average High Low
30-Jul 0.6% 2.0% 0.0% 0.6% 2.0% 0.0% 0.7% 2.0% 0.0%
Agency Debt
21-Oct 3.1% 5.0% 1.5% 3.3% 5.0% 1.5% 3.0% 5.0% 1.5%
26-Sep 2.3% 5.0% 0.0% 2.3% 5.0% 0.0% 2.0% 5.0% 0.0%
17-Sep 1.6% 3.5% 0.0% 1.7% 3.5% 0.0% 2.6% 5.0% 0.0%
30-Jul 1.4% 3.0% 0.0% 2.3% 7.5% 0.0% 2.1% 5.0% 0.0%
Agency MBS
21-Oct 6% 10% 5% 7% 10% 5% 6% 10% 5%
26-Sep 5% 6% 4% 5% 6% 4% 5% 6% 4%
17-Sep 5% 6% 4% 5% 6% 5% 6% 6% 6%
30-Jul 4% 6% 4% 5% 8% 4% 5% 7% 4%
Non-agency MBS
Prime
21-Oct 29% 33% 25%
26-Sep 35% 45% 28%
17-Sep 23% 23% 23%
30-Jul 26% 45% 20%
Alt-A
21-Oct
26-Sep
17-Sep 30% 30% 30%
30-Jul 29% 30% 28%
Corporate Debt
High Grade
21-Oct 21% 25% 15% 19% 23% 15%
26-Sep 20% 28% 13% 20% 28% 13%
17-Sep 8% 9% 8% 8% 9% 8% 8% 9% 8%
12-May 13% 25% 6% 14% 25% 8% 14% 25% 9%
High Yield
21-Oct 40% 60% 25% 38% 60% 25%
26-Sep 41% 60% 18% 41% 60% 18%
17-Sep 20% 23% 18% 20% 23% 18% 20% 23% 18%
12-May 28% 70% 13% 30% 70% 13% 32% 70% 14%
Source: Survey of 11 Hedge Funds
Page 10
Top panel(22)
Title: Fed Funds Futures Curve Shifts LowerSeries: Fed funds futures curves as of 8/4/2008, 9/15/2008, and 10/24/2008

Horizon: August 4, 2008 - October 24, 2008Description: The fed funds futures curve has shifted lower since the September FOMC meeting.
Source: Bloomberg
Middle panel(23)
Title: Eurodollar Futures Curve Shifts LowerSeries: Eurodollar futures curve as of 8/4/2008, 9/15/2008, and 10/24/2008Horizon: August 4, 2008 - October 24, 2008Description: The Eurodollar futures curve has shifted lower since the September FOMC meeting.
Source: Bloomberg
Page 11
Top panel(24)
Title: Distribution of Expected Policy Target Rate Among Primary Dealers Prior to October 29FOMC MeetingSeries: Dealer expectations for policy target rate by quarter, average forecast for policy target byquarter, and market rate for policy expectation by quarter as of 10/20/2008Horizon: 2008:Q4 - 2009:Q4Description: On average, primary dealer economists are forecasting a slower rate of increase in thepolicy target rate over the next five quarters than what is currently priced into Eurodollar futures.
Source: Dealer Policy Survey
Middle panel(25)
Title: Distribution of Expected Policy Target Rate Among Primary Dealers Prior to September 16FOMC MeetingSeries: Dealer expectations for policy target rate by quarter, average forecast for policy target byquarter, and market rate for policy expectation by quarter as of 9/8/2008Horizon: 2008:Q3 - 2009:Q4Description: On average, primary dealer economists' policy rate expectations are similar to what iscurrently priced into Eurodollar futures.
Source: Dealer Policy Survey
Page 12
Top panel(26)
Title: Spread Between Nominal and Inflation Protected Treasury Yields Narrows SharplySeries: Five- and Ten-Year Spreads between Nominal and Inflation Protected Treasury YieldsHorizon: January 1, 2008 - October 24, 2008Description: The spreads between 5- and 10-year nominal and inflation-protected Treasury yields
have narrowed sharply.
Source: Bloomberg
Middle panel(27)
Title: TIPS Implied Average Rate of Inflation: 5-10 Year HorizonSeries: Federal Reserve Board's 5-10 Year Horizon TIPS Inflation Compensation and Barclays' 5-10Year Horizon TIPS Inflation CompensationHorizon: January 1, 2008 - October 24, 2008Description: TIPS implied average rate of inflation over a 5-10 year horizon as measured by theFederal Reserve Board has diverged from the implied average rate of inflation measured by Barclays.
Source: Federal Reserve Board, Barclays Capital
Bottom panel(28)
Title: Expectations for Average Annual CPI Inflation Rate from 2013-2018Series: Primary Dealer Expectations for Average Annual CPI Inflation Rate from 2013-2018Horizon: 2013-2018Description: The Federal Reserve Bank of New York's October 2008 survey of primary dealersshows that, on average, expectation for the average annual CPI inflation rate between 2013 and 2018has shifted lower since the September survey.
Source: Federal Reserve Bank of New York
Appendix 2: Materials used by Mr. Bassett
Material for Staff Presentation on Financial DevelopmentsOctober 28, 2008
Class II FOMC - Restricted (FR)
Exhibit 1Market Functioning
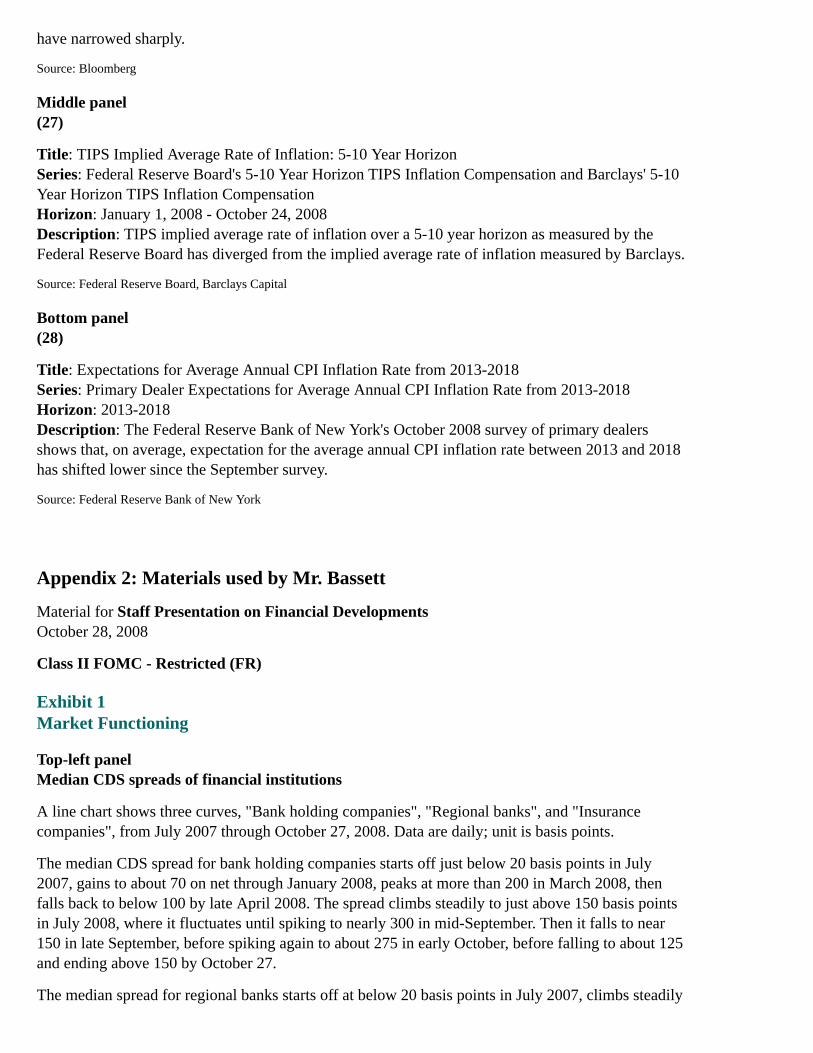
Top-left panelMedian CDS spreads of financial institutions
A line chart shows three curves, "Bank holding companies", "Regional banks", and "Insurancecompanies", from July 2007 through October 27, 2008. Data are daily; unit is basis points.
The median CDS spread for bank holding companies starts off just below 20 basis points in July2007, gains to about 70 on net through January 2008, peaks at more than 200 in March 2008, thenfalls back to below 100 by late April 2008. The spread climbs steadily to just above 150 basis pointsin July 2008, where it fluctuates until spiking to nearly 300 in mid-September. Then it falls to near150 in late September, before spiking again to about 275 in early October, before falling to about 125and ending above 150 by October 27.
The median spread for regional banks starts off at below 20 basis points in July 2007, climbs steadily
to 100 by March 2008, and hovers there until June 2008. The spread jumps to above 150 in late June,then remains steady until spiking to about 300 by mid-September, dropping in mid-October to about205, then recovering to just under 225 by October 27.
The median spread for insurance companies starts in July 2007 at around 30 basis points and climbson net to 100 by February 2008. It fluctuates around that level until climbing to just under 200 basispoints by October 27, 2008.
Note: Median spreads for 6 bank holding companies; 6 regional banks; and 59 insurance companies.
Source: Markit.
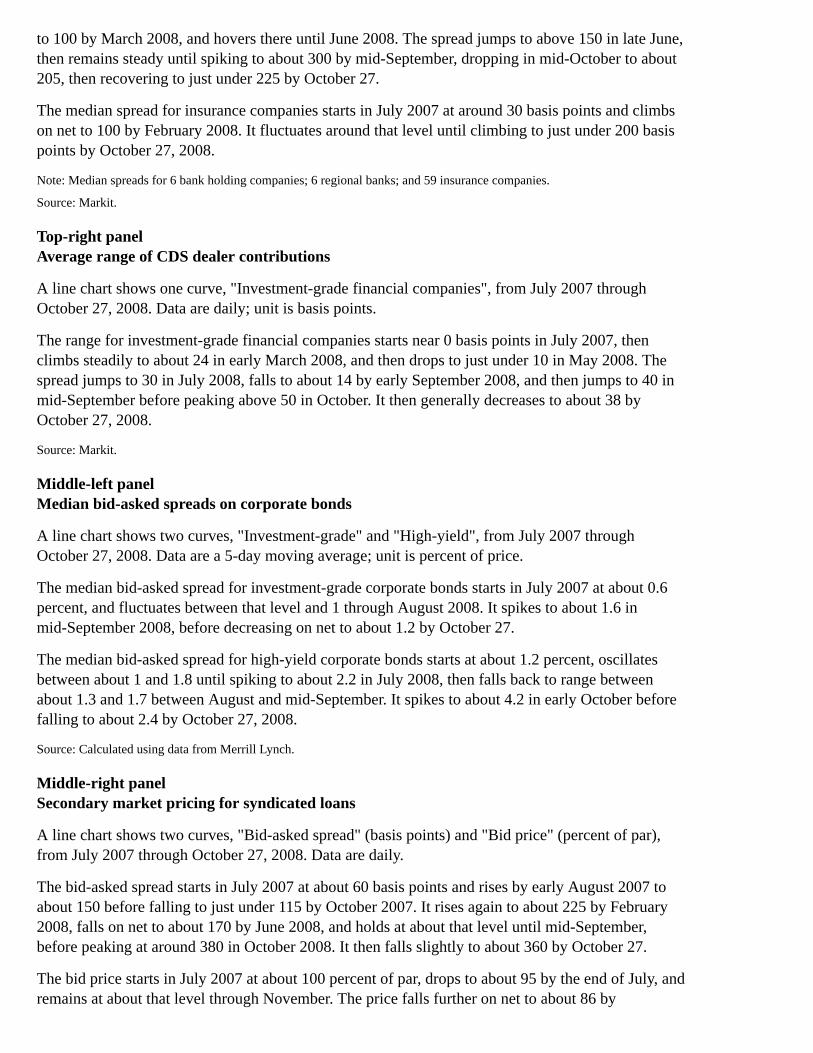
Top-right panelAverage range of CDS dealer contributions
A line chart shows one curve, "Investment-grade financial companies", from July 2007 throughOctober 27, 2008. Data are daily; unit is basis points.
The range for investment-grade financial companies starts near 0 basis points in July 2007, thenclimbs steadily to about 24 in early March 2008, and then drops to just under 10 in May 2008. Thespread jumps to 30 in July 2008, falls to about 14 by early September 2008, and then jumps to 40 inmid-September before peaking above 50 in October. It then generally decreases to about 38 byOctober 27, 2008.
Source: Markit.
Middle-left panelMedian bid-asked spreads on corporate bonds
A line chart shows two curves, "Investment-grade" and "High-yield", from July 2007 throughOctober 27, 2008. Data are a 5-day moving average; unit is percent of price.
The median bid-asked spread for investment-grade corporate bonds starts in July 2007 at about 0.6percent, and fluctuates between that level and 1 through August 2008. It spikes to about 1.6 inmid-September 2008, before decreasing on net to about 1.2 by October 27.
The median bid-asked spread for high-yield corporate bonds starts at about 1.2 percent, oscillatesbetween about 1 and 1.8 until spiking to about 2.2 in July 2008, then falls back to range betweenabout 1.3 and 1.7 between August and mid-September. It spikes to about 4.2 in early October beforefalling to about 2.4 by October 27, 2008.
Source: Calculated using data from Merrill Lynch.
Middle-right panelSecondary market pricing for syndicated loans
A line chart shows two curves, "Bid-asked spread" (basis points) and "Bid price" (percent of par),from July 2007 through October 27, 2008. Data are daily.
The bid-asked spread starts in July 2007 at about 60 basis points and rises by early August 2007 toabout 150 before falling to just under 115 by October 2007. It rises again to about 225 by February2008, falls on net to about 170 by June 2008, and holds at about that level until mid-September,before peaking at around 380 in October 2008. It then falls slightly to about 360 by October 27.
The bid price starts in July 2007 at about 100 percent of par, drops to about 95 by the end of July, andremains at about that level through November. The price falls further on net to about 86 by
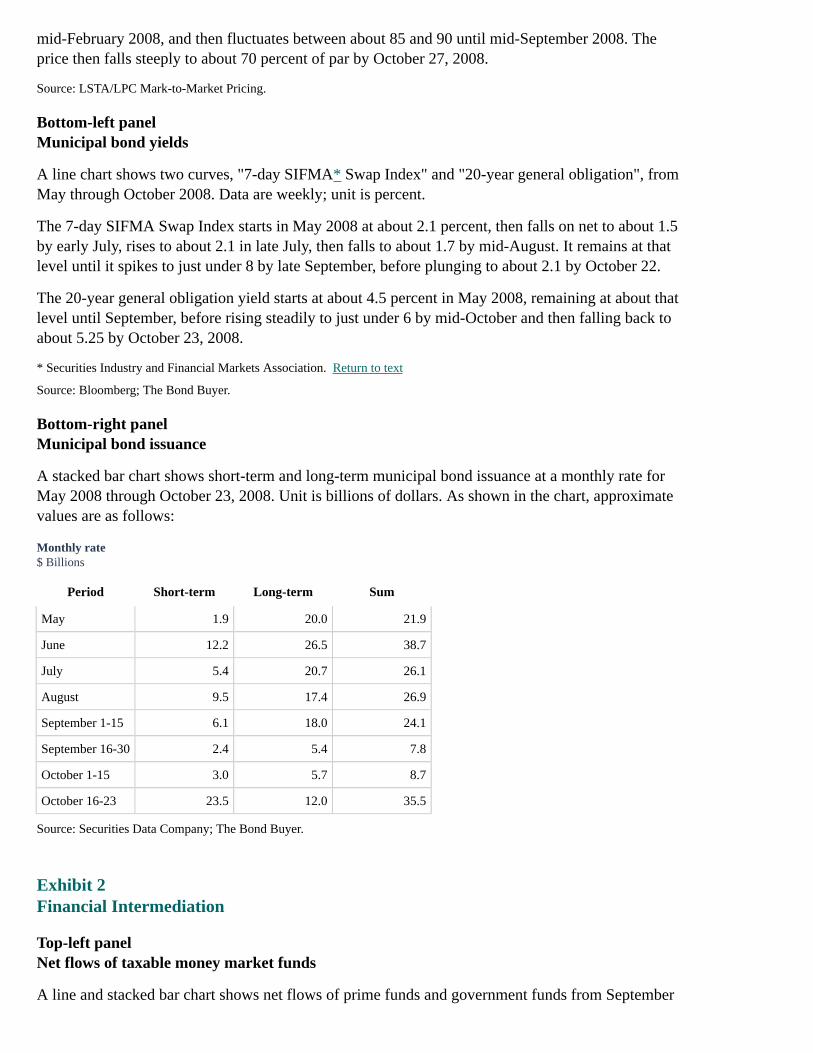
mid-February 2008, and then fluctuates between about 85 and 90 until mid-September 2008. Theprice then falls steeply to about 70 percent of par by October 27, 2008.
Source: LSTA/LPC Mark-to-Market Pricing.
Bottom-left panelMunicipal bond yields
A line chart shows two curves, "7-day SIFMA* Swap Index" and "20-year general obligation", fromMay through October 2008. Data are weekly; unit is percent.
The 7-day SIFMA Swap Index starts in May 2008 at about 2.1 percent, then falls on net to about 1.5by early July, rises to about 2.1 in late July, then falls to about 1.7 by mid-August. It remains at thatlevel until it spikes to just under 8 by late September, before plunging to about 2.1 by October 22.
The 20-year general obligation yield starts at about 4.5 percent in May 2008, remaining at about thatlevel until September, before rising steadily to just under 6 by mid-October and then falling back toabout 5.25 by October 23, 2008.
* Securities Industry and Financial Markets Association. Return to text
Source: Bloomberg; The Bond Buyer.
Bottom-right panelMunicipal bond issuance
A stacked bar chart shows short-term and long-term municipal bond issuance at a monthly rate forMay 2008 through October 23, 2008. Unit is billions of dollars. As shown in the chart, approximatevalues are as follows:
Monthly rate$ Billions
Period Short-term Long-term Sum
May 1.9 20.0 21.9
June 12.2 26.5 38.7
July 5.4 20.7 26.1
August 9.5 17.4 26.9
September 1-15 6.1 18.0 24.1
September 16-30 2.4 5.4 7.8
October 1-15 3.0 5.7 8.7
October 16-23 23.5 12.0 35.5
Source: Securities Data Company; The Bond Buyer.
Exhibit 2Financial Intermediation
Top-left panelNet flows of taxable money market funds
A line and stacked bar chart shows net flows of prime funds and government funds from September
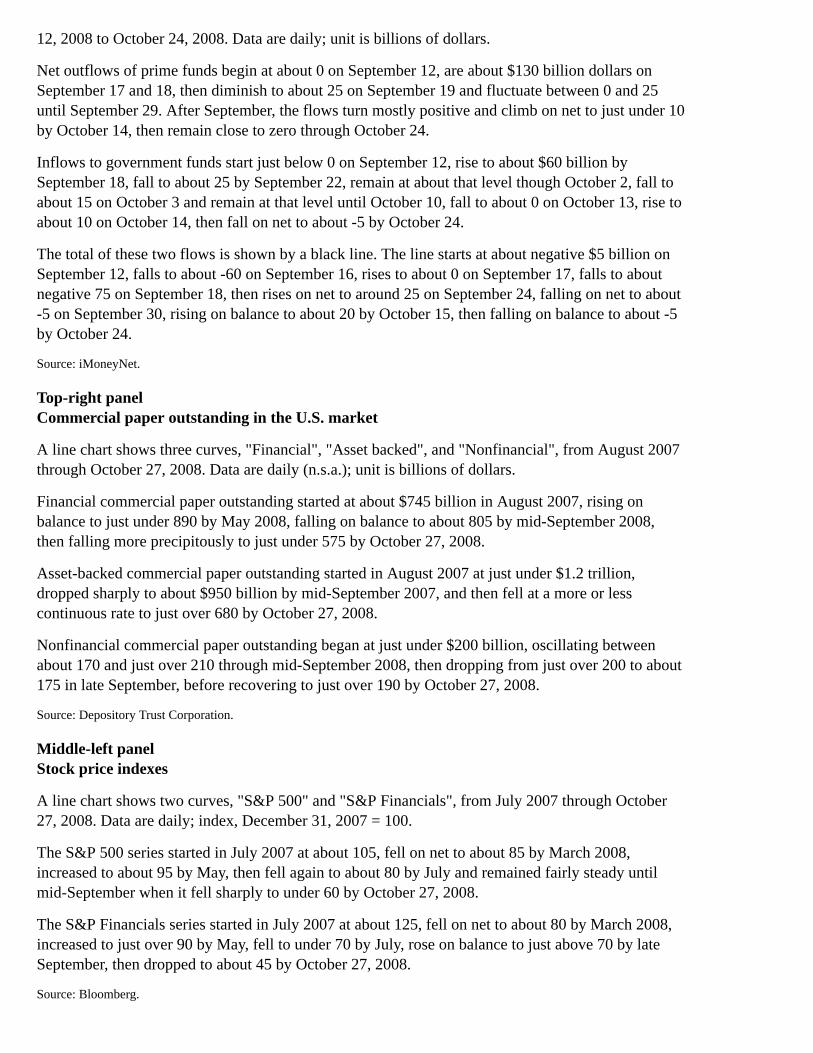
12, 2008 to October 24, 2008. Data are daily; unit is billions of dollars.
Net outflows of prime funds begin at about 0 on September 12, are about $130 billion dollars onSeptember 17 and 18, then diminish to about 25 on September 19 and fluctuate between 0 and 25until September 29. After September, the flows turn mostly positive and climb on net to just under 10by October 14, then remain close to zero through October 24.
Inflows to government funds start just below 0 on September 12, rise to about $60 billion bySeptember 18, fall to about 25 by September 22, remain at about that level though October 2, fall toabout 15 on October 3 and remain at that level until October 10, fall to about 0 on October 13, rise toabout 10 on October 14, then fall on net to about -5 by October 24.
The total of these two flows is shown by a black line. The line starts at about negative $5 billion onSeptember 12, falls to about -60 on September 16, rises to about 0 on September 17, falls to aboutnegative 75 on September 18, then rises on net to around 25 on September 24, falling on net to about-5 on September 30, rising on balance to about 20 by October 15, then falling on balance to about -5by October 24.
Source: iMoneyNet.
Top-right panelCommercial paper outstanding in the U.S. market
A line chart shows three curves, "Financial", "Asset backed", and "Nonfinancial", from August 2007through October 27, 2008. Data are daily (n.s.a.); unit is billions of dollars.
Financial commercial paper outstanding started at about $745 billion in August 2007, rising onbalance to just under 890 by May 2008, falling on balance to about 805 by mid-September 2008,then falling more precipitously to just under 575 by October 27, 2008.
Asset-backed commercial paper outstanding started in August 2007 at just under $1.2 trillion,dropped sharply to about $950 billion by mid-September 2007, and then fell at a more or lesscontinuous rate to just over 680 by October 27, 2008.
Nonfinancial commercial paper outstanding began at just under $200 billion, oscillating betweenabout 170 and just over 210 through mid-September 2008, then dropping from just over 200 to about175 in late September, before recovering to just over 190 by October 27, 2008.
Source: Depository Trust Corporation.
Middle-left panelStock price indexes
A line chart shows two curves, "S&P 500" and "S&P Financials", from July 2007 through October27, 2008. Data are daily; index, December 31, 2007 = 100.
The S&P 500 series started in July 2007 at about 105, fell on net to about 85 by March 2008,increased to about 95 by May, then fell again to about 80 by July and remained fairly steady untilmid-September when it fell sharply to under 60 by October 27, 2008.
The S&P Financials series started in July 2007 at about 125, fell on net to about 80 by March 2008,increased to just over 90 by May, fell to under 70 by July, rose on balance to just above 70 by lateSeptember, then dropped to about 45 by October 27, 2008.
Source: Bloomberg.
Middle-right panelNet flows into bond and stock mutual funds
A stacked bar chart shows net flows into bond funds and equity and hybrid mutual funds at amonthly rate for 2007 through September 2008. Unit is billions of dollars.
Flows into equity and hybrid mutual funds were at a monthly rate of nearly $17 billion for the firsthalf of 2007, about 2 for the second half of 2007, -14 in the first quarter of 2008, just under 10 forthe second quarter, about -30 in July, about -20 in August, then about -63 (estimated) in September2008.
Flows into bond mutual funds were at a monthly rate of nearly $15 billion for the first half of 2007,about 3.5 for the second half of 2007, nearly 16 for the first quarter of 2008, nearly 13 for the secondquarter of 2008, about 2 for July, just under 8 for August, and nearly -2 (estimated) in September2008.
Source: Investment Company Institute.
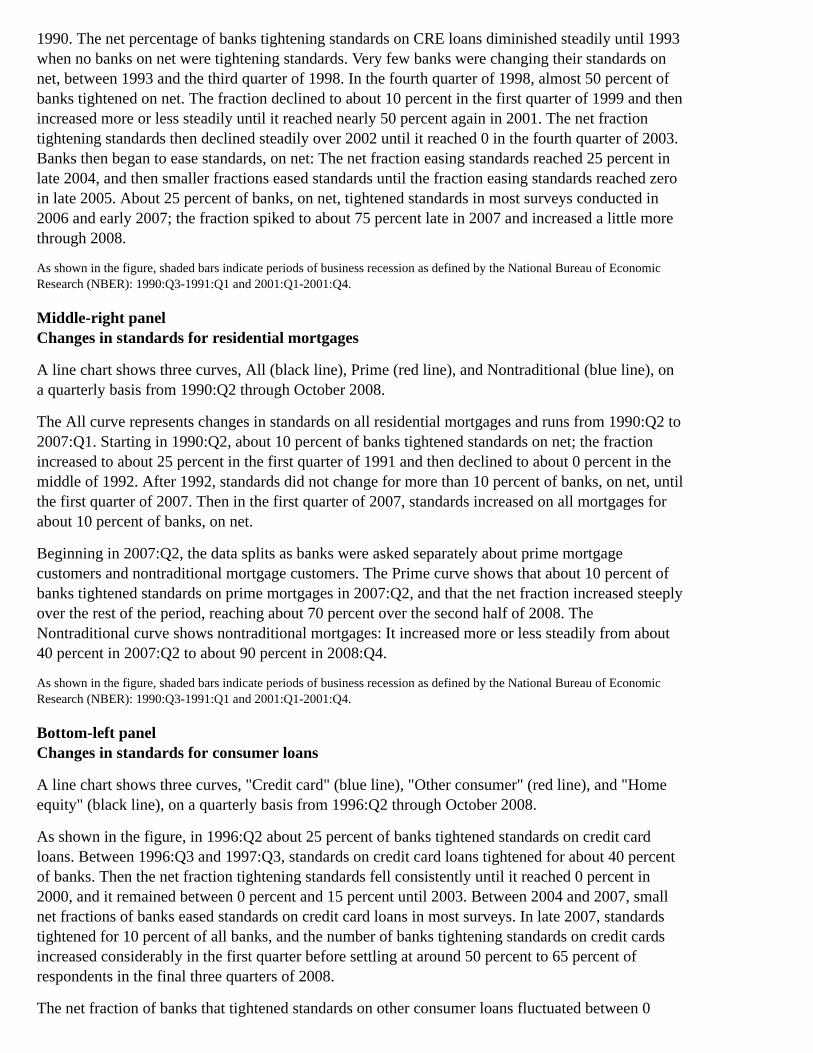
Bottom-left panelGrowth in selected components of M2 in 2008
Percent (s.a.a.r.)
H1 Q3 Sept. Oct.
1. Total M2 7.2 3.6 15.6 17.1
2. Liquid deposits 7.4 3.7 20.1 1.0
3. Retail money funds 22.4 -5.5 -0.5 44.6
4. Small time -1.4 9.3 17.6 52.8
5. Currency 0.9 6.8 6.7 20.5
e Estimated. Return to table
Source: Federal Reserve.
Bottom-right panelCommercial bank lending to businesses
A line chart shows two curves, "C&I loans" and "Other loans"*, from July 2007 through October 15,2008. Data are weekly, seasonally adjusted; unit is billions of dollars.
C&I loans started at about $1.275 trillion in July 2007, rose steadily to about $1.51 trillion bymid-September 2008, then increased more rapidly to just under $1.6 trillion by October 15, 2008.
Other loans began in July 2007 at about $475 billion, rose to about 575 by March 2008, declined toabout 525 by mid-April, and fluctuated around that level until mid-September. It then rose onbalance to just over $590 billion by October 15, 2008.
* Includes fed funds and RPs with entities other than banks and dealers and loans n.e.c.; the latter includes loans to nonbankfinancial institutions, banks abroad, and foreign governments. Return to text
Source: Calculated using data from Federal Reserve's H.8 release.
Exhibit 3October 2008 Senior Loan Officer Opinion Survey
e

Top-left panelChanges in standards and terms for C&I loans
A line chart shows two curves, Standards (black line) and Spreads (red line), on a quarterly basisfrom 1990:Q2 through October 2008. Unit is net percentage tightening.
The Standards curve shows the net percentage of banks that tightened lending standards. On net,over 50 percent of banks tightened standards on C&I loans in 1990. Smaller fractions of bankscontinued to tighten standards until about 1993, when the net fraction that tightened standardsreached zero. Between 10 and 25 percent of banks, on net, eased standards every quarter from 1993to the fourth quarter of 1995, and from the first quarter of 1996 to mid-1998 the net fraction of bankstightening standards hovered around 0. Standards tightened in the fourth quarter of 1998 for about 40percent of banks, but the fraction dropped to about 10 percent of banks during the four quarters of1999. The fraction rose considerably over the year 2000 and peaked at more than 50 percent early in2001. It fluctuated around 50 percent until 2002, and standards continued to tighten, on net, but at alower rate, until the end of 2003 when standards began to ease. In 2004 and 2005 about 20 percent ofbanks, on net, eased standards, and they continued to loosen standards at a lower rate until 2007.Beginning in the fourth quarter of 2007, large fractions of banks began to tighten standards on net;the fraction rose steeply through 2008 and reached above 80 percent of banks by October 2008.
The Spreads curve shows the net percentage of banks that widened spreads. In the second quarter of1990, about 10 percent of banks had widened their spreads, on net. The net percentage of banks thatreported wider spreads continued to increase until the first quarter of 1991 when about 50 percent ofbanks widened their spreads. The net percentage of banks that reported wider spreads declined moreor less steadily until early 1993 when the net fraction reached zero. Banks began lowering spreads,such that over 50 percent of banks, on net, were lowering spreads by 1994. The net fraction of banksthat lowered spreads declined gradually until late 1998, when about 25 percent were doing so. In thefourth quarter of 1998, about 50 percent of banks widened spreads. The net fraction wideningspreads dropped to about 10 percent during the first quarter of 1999, but then began rising sharply,and it fluctuated between about 25 percent and about 50 percent from 2000 to 2002. Over the firsthalf of 2003 the net percentage of banks widening spreads declined, and starting in the second half ofthe year an increasing fraction of banks began lowering spreads on net. The net fraction of bankslowering spreads reached 75 percent in 2005 and fluctuated between 25 percent and 70 percent untillate 2007. Starting in the fourth quarter of 2007, the net fraction of banks that widened spreads beganto increase substantially, with the fraction reaching almost 100 percent by October 2008.
As shown in the figure, shaded bars indicate periods of business recession as defined by the National Bureau of EconomicResearch (NBER): 1990:Q3-1991:Q1 and 2001:Q1-2001:Q4.
Top-right panelReasons for tightening credit conditions
Nearly all banks tightened in response to a less favorable economic outlook and a reducedtolerance for risk.About 40 percent of domestic banks tightened because of concerns about capital or liquidity.
Middle-left panelChanges in standards for CRE loans
A line chart shows one curve, the net percentage of banks tightening lending standards oncommercial real estate (CRE) loans, on a quarterly basis from 1990:Q2 through October 2008.
More than 50 percent of banks tightened lending standards on CRE loans in the second quarter of
1990. The net percentage of banks tightening standards on CRE loans diminished steadily until 1993when no banks on net were tightening standards. Very few banks were changing their standards onnet, between 1993 and the third quarter of 1998. In the fourth quarter of 1998, almost 50 percent ofbanks tightened on net. The fraction declined to about 10 percent in the first quarter of 1999 and thenincreased more or less steadily until it reached nearly 50 percent again in 2001. The net fractiontightening standards then declined steadily over 2002 until it reached 0 in the fourth quarter of 2003.Banks then began to ease standards, on net: The net fraction easing standards reached 25 percent inlate 2004, and then smaller fractions eased standards until the fraction easing standards reached zeroin late 2005. About 25 percent of banks, on net, tightened standards in most surveys conducted in2006 and early 2007; the fraction spiked to about 75 percent late in 2007 and increased a little morethrough 2008.
As shown in the figure, shaded bars indicate periods of business recession as defined by the National Bureau of EconomicResearch (NBER): 1990:Q3-1991:Q1 and 2001:Q1-2001:Q4.
Middle-right panelChanges in standards for residential mortgages
A line chart shows three curves, All (black line), Prime (red line), and Nontraditional (blue line), ona quarterly basis from 1990:Q2 through October 2008.
The All curve represents changes in standards on all residential mortgages and runs from 1990:Q2 to2007:Q1. Starting in 1990:Q2, about 10 percent of banks tightened standards on net; the fractionincreased to about 25 percent in the first quarter of 1991 and then declined to about 0 percent in themiddle of 1992. After 1992, standards did not change for more than 10 percent of banks, on net, untilthe first quarter of 2007. Then in the first quarter of 2007, standards increased on all mortgages forabout 10 percent of banks, on net.
Beginning in 2007:Q2, the data splits as banks were asked separately about prime mortgagecustomers and nontraditional mortgage customers. The Prime curve shows that about 10 percent ofbanks tightened standards on prime mortgages in 2007:Q2, and that the net fraction increased steeplyover the rest of the period, reaching about 70 percent over the second half of 2008. TheNontraditional curve shows nontraditional mortgages: It increased more or less steadily from about40 percent in 2007:Q2 to about 90 percent in 2008:Q4.
As shown in the figure, shaded bars indicate periods of business recession as defined by the National Bureau of EconomicResearch (NBER): 1990:Q3-1991:Q1 and 2001:Q1-2001:Q4.
Bottom-left panelChanges in standards for consumer loans
A line chart shows three curves, "Credit card" (blue line), "Other consumer" (red line), and "Homeequity" (black line), on a quarterly basis from 1996:Q2 through October 2008.
As shown in the figure, in 1996:Q2 about 25 percent of banks tightened standards on credit cardloans. Between 1996:Q3 and 1997:Q3, standards on credit card loans tightened for about 40 percentof banks. Then the net fraction tightening standards fell consistently until it reached 0 percent in2000, and it remained between 0 percent and 15 percent until 2003. Between 2004 and 2007, smallnet fractions of banks eased standards on credit card loans in most surveys. In late 2007, standardstightened for 10 percent of all banks, and the number of banks tightening standards on credit cardsincreased considerably in the first quarter before settling at around 50 percent to 65 percent ofrespondents in the final three quarters of 2008.
The net fraction of banks that tightened standards on other consumer loans fluctuated between 0
percent and about 10 percent between 1996 and the last quarter of 2003. From the beginning of 2004to 2006, small net fractions of banks eased standards on other consumer loans. Toward the end of2007, the net percentage of banks tightening standards on other loans began to increase sharply and itreached about 60 percent by the end of 2008.
In 2008:Q2, standards on home equity loans tightened for over 50 percent of banks. The percentageof banks tightening loans on net increased to about 75 percent in 2008:Q3 and 2008:Q4.
As shown in the figure, the shaded bar indicates a period of business recession as defined by the National Bureau of EconomicResearch (NBER): 2001:Q1-2001:Q4.
Bottom-right panelReductions in existing credit card limits
25 percent reported reducing limits for prime customers.60 percent reported cutting limits for nonprime borrowers.Most important reasons were the less favorable economic outlook, reduced tolerance for risk,and the credit quality of individual customers.
Exhibit 4Business Finance
Top-left panelSpreads on BBB-rated corporate bonds
A line chart shows two curves, Financial and Nonfinancial, from July 2007 through October 27,2008. Data are daily; unit is basis points.
As shown in the figure, spreads on BBB-rated bonds of financial corporations were at 200 basispoints in July 2007. They rose steadily to about 400 basis points by early September then fell back to300 basis points in mid-September through late-October. They then rose steadily to about 500 basispoints by December 2007 and stayed at about that level until early March 2008. They climbed toalmost 700 basis points in mid-March before declining to about 500 basis points in June. In July,they began to climb steadily, and they peaked at around 1000 basis points in mid-October, beforedeclining to about 900 basis points by October 27, 2008.
Spreads on bonds of nonfinancial corporations were at about 100 basis points in July 2007 and roseslowly, on balance, to about 300 basis points by early March 2008. Spreads remained at that levelthrough April, and they fell to just above 200 basis points in June 2008, followed by a slow rise to300 basis points by mid-September. After the September FOMC meeting, spreads on nonfinancialbonds rose sharply, reaching more than 600 basis points by October 27, 2008.
Source: Merrill Lynch.
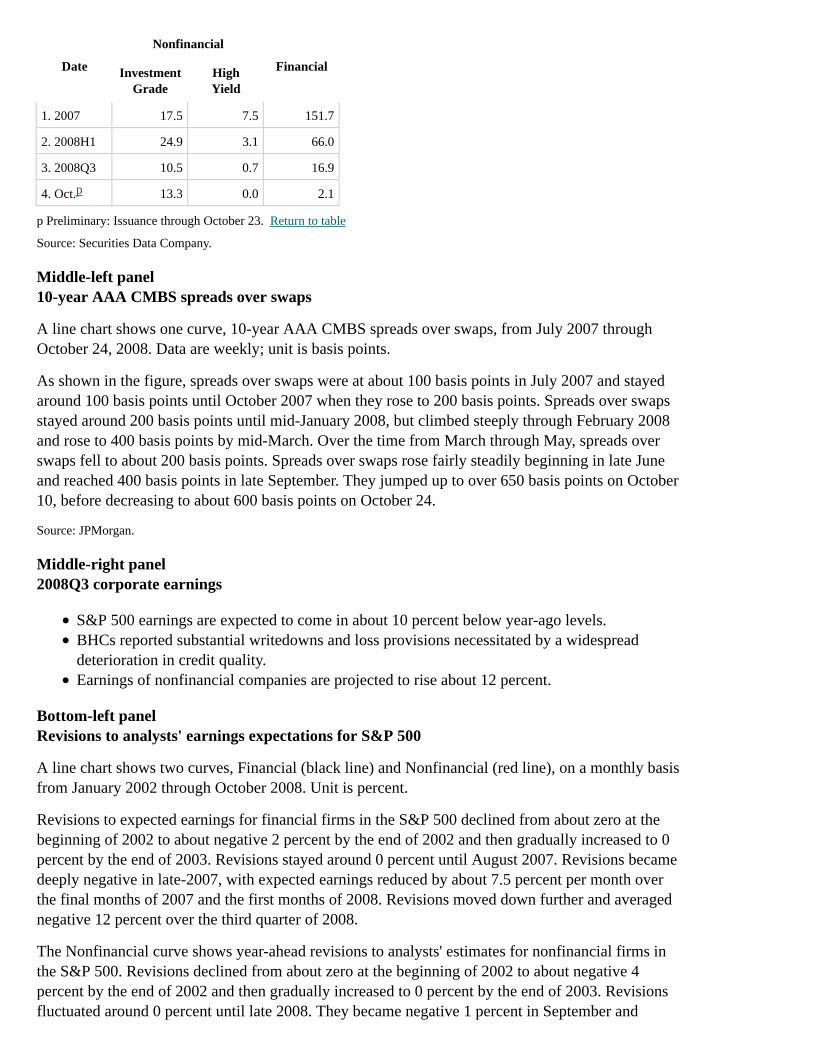
Top-right panelGross issuance of corporate bonds
(Billions of dollars, monthly rate)
Date
Nonfinancial
FinancialInvestmentGrade
HighYield
Date
Nonfinancial
FinancialInvestmentGrade
HighYield
1. 2007 17.5 7.5 151.7
2. 2008H1 24.9 3.1 66.0
3. 2008Q3 10.5 0.7 16.9
4. Oct. 13.3 0.0 2.1
p Preliminary: Issuance through October 23. Return to table
Source: Securities Data Company.
Middle-left panel10-year AAA CMBS spreads over swaps
A line chart shows one curve, 10-year AAA CMBS spreads over swaps, from July 2007 throughOctober 24, 2008. Data are weekly; unit is basis points.
As shown in the figure, spreads over swaps were at about 100 basis points in July 2007 and stayedaround 100 basis points until October 2007 when they rose to 200 basis points. Spreads over swapsstayed around 200 basis points until mid-January 2008, but climbed steeply through February 2008and rose to 400 basis points by mid-March. Over the time from March through May, spreads overswaps fell to about 200 basis points. Spreads over swaps rose fairly steadily beginning in late Juneand reached 400 basis points in late September. They jumped up to over 650 basis points on October10, before decreasing to about 600 basis points on October 24.
Source: JPMorgan.
Middle-right panel2008Q3 corporate earnings
S&P 500 earnings are expected to come in about 10 percent below year-ago levels.BHCs reported substantial writedowns and loss provisions necessitated by a widespreaddeterioration in credit quality.Earnings of nonfinancial companies are projected to rise about 12 percent.
Bottom-left panelRevisions to analysts' earnings expectations for S&P 500
A line chart shows two curves, Financial (black line) and Nonfinancial (red line), on a monthly basisfrom January 2002 through October 2008. Unit is percent.
Revisions to expected earnings for financial firms in the S&P 500 declined from about zero at thebeginning of 2002 to about negative 2 percent by the end of 2002 and then gradually increased to 0percent by the end of 2003. Revisions stayed around 0 percent until August 2007. Revisions becamedeeply negative in late-2007, with expected earnings reduced by about 7.5 percent per month overthe final months of 2007 and the first months of 2008. Revisions moved down further and averagednegative 12 percent over the third quarter of 2008.
The Nonfinancial curve shows year-ahead revisions to analysts' estimates for nonfinancial firms inthe S&P 500. Revisions declined from about zero at the beginning of 2002 to about negative 4percent by the end of 2002 and then gradually increased to 0 percent by the end of 2003. Revisionsfluctuated around 0 percent until late 2008. They became negative 1 percent in September and
p

negative 6 percent in October 2008.
Note: Index is a weighted average of the percent change in the consensus forecasts of current-year and following-year EPS fora fixed sample.
Source: Thomson Financial.
Bottom-right panelEquity premium
A line chart shows one curve, equity premium, on a monthly basis from January 1984 to October2008. Unit is percentage points.
As shown in the figure, the equity premium was nearly 6 percentage points in 1984 and trendeddown more or less steadily to around zero percent in 1999. The equity premium was negative, butnearly zero, for much of 1999, and the equity premium rose more or less steadily from that point tonearly four percentage points by the end of 2003. The premium fell to 2 percentage points by the endof 2004, but then began to rise again, reaching nearly 4 percent by the end of 2005. The equitypremium stayed just below 4 percentage points until 2007 when it increased to about 5 percent. Thenbetween September and October 2008 it jumped above 8 percentage points.
Note: The ratio of trend earnings to price for S&P 500 firms less the real perpetuity Treasury yield.
As shown in the figure, shaded bars indicate periods of business recession as defined by the National Bureau of EconomicResearch (NBER): 1990:Q3-1991:Q1 and 2001:Q1-2001:Q4.
Exhibit 5 -Last ExhibitHousehold Finance
Top-left panelRate on conforming residential mortgages
A line chart shows one curve, rate on conforming residential mortgages, on a weekly basis from July2007 through October 22, 2008. Unit is percent.
As shown in the figure, the mortgage rate started at above 6.5 percent in July 2007 and declinedmore or less steadily until December 2007 to a bit less than 6.0 percent. In January 2008 the ratedropped for a time to below 5.5 percent before rising again in February to about 6.25 percent. Therate then declined some in March back below 6 percent and remained steady in April. Beginning inMay the rate trended higher and reached 6.5 percent in August. From early August until lateSeptember the rate declined again to about 5.75 percent, and then rose again in October to almost 6.5percent. The rate declined to about 6 percent on October 22, 2008.
Source: Freddie Mac.
Top-right panelChange in house prices and mortgage debt
A line chart shows two curves, "Mortgage debt" (red line) and "OFHEO house prices" (black line),on a quarterly basis (seasonally adjusted annual rate) from 2000:Q1 through 2010:Q4. Unit ispercent.
As shown in the figure, growth of mortgage debt runs between 8 and 15 percent from early 2000 toearly 2006. In the fourth quarter of 2006, growth declines to 7½ percent and weakens further onbalance through 2007. Mortgage debt decelerates to 2½ percent in the first quarter of 2008 and to
zero percent in the second quarter. Data beyond the second quarter of 2008 is projected, and it isdenoted by a dotted line. In the third and fourth quarters of 2008, changes in mortgage debt areprojected to be approximately zero. Mortgage debt for 2009 dips to around negative 1 percent andstays around that rate until the first quarter of 2010, after which it begins to increase gradually,reaching 3 percent in the fourth quarter.
Change in OFHEO house prices starts at around 7 percent in the first quarter of 2000. Price increasesgenerally accelerate to around 9 percent by the fourth quarter of 2005, and then decelerate sharply. Inthe first quarter of 2006, the price increase slows to 7 percent, ebbs further to 4 percent in the secondquarter, and then to between 2 percent and 3 percent from the third quarter of 2006 until the thirdquarter of 2007. Home prices drop 5 percent to 7 percent per quarter between the fourth quarter of2007 and the third quarter of 2008. Data beyond the second quarter of 2008 is projected and isdenoted by a dotted line. The forecast assumes that home prices continue to decline rapidly in 2009,bottoming at negative 9 percent over the first half of the year. Home prices decline further thorough2010, but at a reduced rate.
Source: Flow of Funds Accounts and staff projections.
As shown in the figure, a shaded bar indicates a period of business recession as defined by the National Bureau of EconomicResearch (NBER): 2001:Q1-2001:Q4.
Middle-left panelSpreads on auto and credit card ABS
A line chart shows two curves, "Credit cards" (black line) and "Autos" (red line), on a weekly basisfrom July 2007 through October 17, 2008. Unit is basis points.
As shown in the figure, spreads on asset backed securities for credit cards begins at around zero basispoints for July 2007. Spreads increase to 25 basis points in late August, where they hover until midNovember when they increase to about 50 basis points. Spreads stay at around 50 basis points untilmid-February when they begin trending up steadily, reaching 110 basis points by the end of April.Spreads drop down to 65 basis points by the end of May, and they remain there until the end of Junewhen they drop to around 50 basis points. Spreads stay at 50 basis points until the end of July whenthey begin increasing again and reach 160 basis points by the end of September. In mid-October2008, spreads jump to 275 basis points.
Spreads on asset backed securities for autos begins in July 2007 at around zero basis points. Spreadsincrease to 25 basis points in August and stay at around 25 basis points until mid-November whenthey spike up to 75 basis points. Spreads stay at 75 basis points until mid-February 2008 when theybegin rising steadily and reach 150 basis points in April 2008. Spreads on auto ABS decrease to 125basis points in May and drop to 75 basis points in June, but begin increasing steeply at the end ofJuly. Spreads increase to 170 basis points by the end of August, 250 basis points by the end ofSeptember, and 325 basis points in mid-October 2008.
Note: Spread of the interest rate on AAA-rated 2-year ABS over the 2-year swap rate.
Source: Citigroup Global Markets.
Middle-right panelABS issuance
A stacked bar chart shows two series, ABS issuance for autos and credit cards at a monthly rate, for2007:Q1 through 2008:Q3 and October 2008 . Unit is billions of dollars.
As shown in the figure, ABS issuance for autos was $5.2 billion in 2007:Q1, $8.8 billion in 2007:Q2,
p
$6 billion in 2007:Q3, $5.25 billion in 2007:Q4, $3.5 billion in 2008:Q1, $6.75 billion in 2008:Q2,$2.5 billion in 2008:Q3, and $0.2 billion in October 2008.
ABS issuance for credit cards was $8.2 billion in 2007:Q1, $7.5 billion in 2007:Q2, $8.25 billion in2007:Q3, $7.9 billion in 2007:Q4, $10 billion in 2008:Q1, $7.1 billion in 2008:Q2, $3.3 billion in2008:Q3, and $0 billion in October 2008.
p Preliminary: Issuance through October 17. Return to text
Source: Citigroup Global Markets.
Bottom-left panelChange in consumer credit
A line chart shows one curve, change in consumer credit, on a quarterly basis (seasonally adjustedannual rate) from 2000:Q1 to 2010:Q4. Unit is percent.
Growth in consumer credit starts at about 8¼ percent in the first quarter of 2000, and increases overthe year to 13 percent in the fourth quarter. Over the four quarters of 2001, consumer creditdecelerates sharply to about 4 percent in the third quarter, but bounces back above 10 percent by theend of the year. From 2002 through mid-2007, growth of consumer credit fluctuates between about 3percent and about 7 percent. Consumer credit decelerates sharply to between about 4 and about 5percent in late 2007 and early 2008. Data beyond the second quarter of 2008 is projected and isdenoted by a dotted line. In the third quarter of 2008, consumer credit is projected to be about flatand it is expected to decrease about 1 percent in the fourth quarter. Consumer credit contracts at a 1½percent rate in the first quarter of 2009, and a 1 percent rate in the second quarter, then holds flat inthe third quarter. Growth increases over the remaining forecast period to about 4 percent in the fourthquarter of 2010.
Source: Flow of Funds Accounts and staff projections.
As shown in the figure, a shaded bar indicates a period of business recession as defined by the National Bureau of EconomicResearch (NBER): 2001:Q1-2001:Q4.
Bottom-right panelSummary
Despite modest improvement recently, pressures on financial firms and markets haveincreased.Those pressures led to concerns about the economic outlook and reduced tolerance for risk.The fall in asset prices and tightening of credit conditions have had substantial adverse effects.
Appendix 3: Materials used by Mr. Morin
October 28, 2008
Class II FOMC - Restricted (FR)
Exhibit 1The Near-term Projection
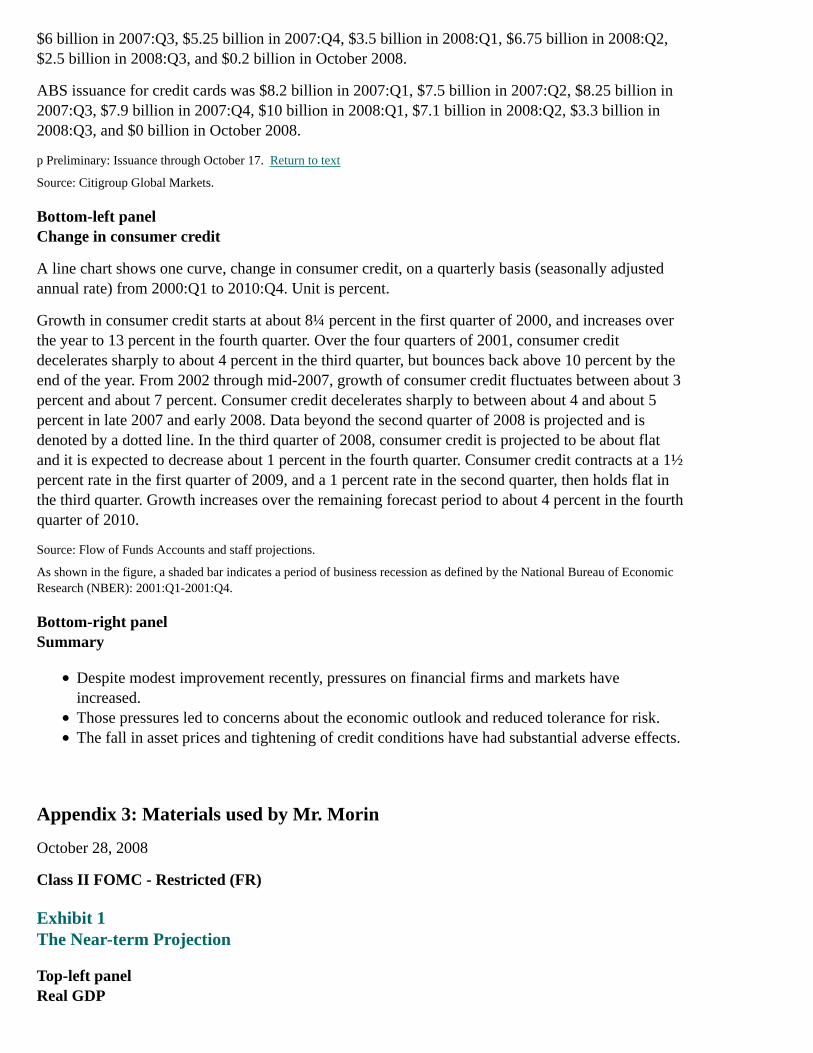
Top-left panelReal GDP
Percent change, annual rate
Period CurrentSeptember
GBCurrentForecast
SeptemberGB Forecast
2008:H1 1.84 2.16 ND ND
2008:Q3 ND ND -1.04 0.59
2008:Q4 ND ND -1.29 1.08
Note. Semiannual figures are Q2/Q4 percent changes at an annual rate.
ND No data Return to table
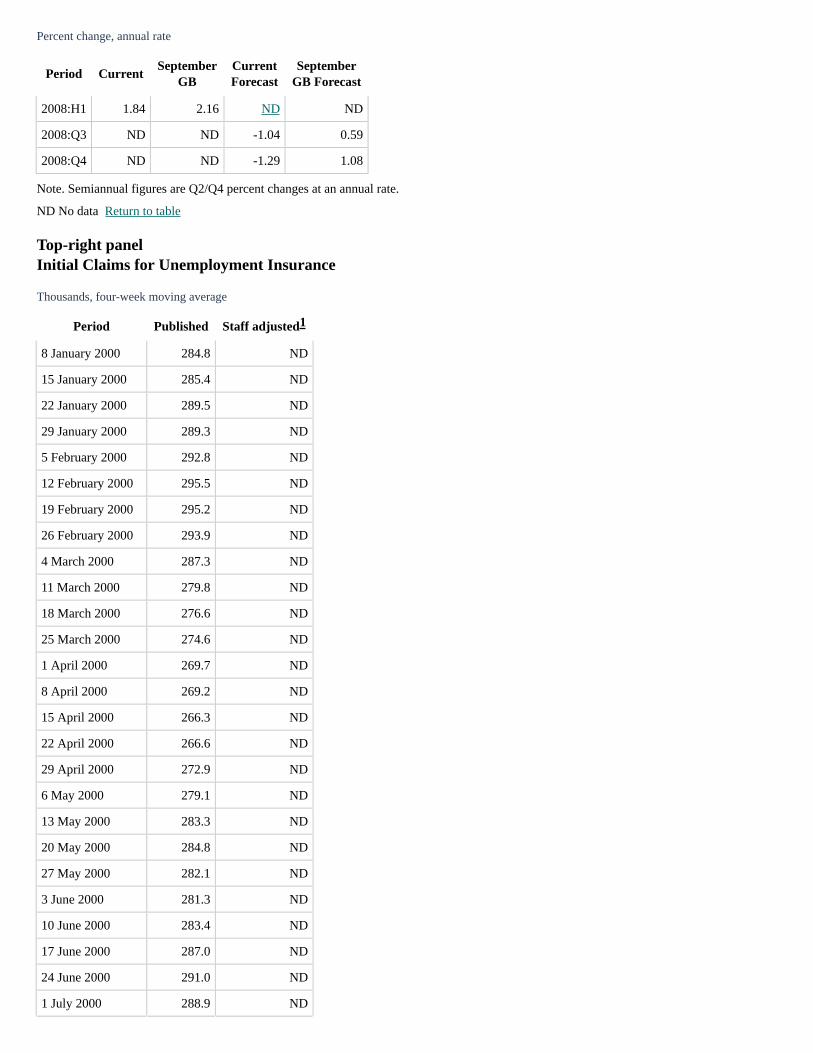
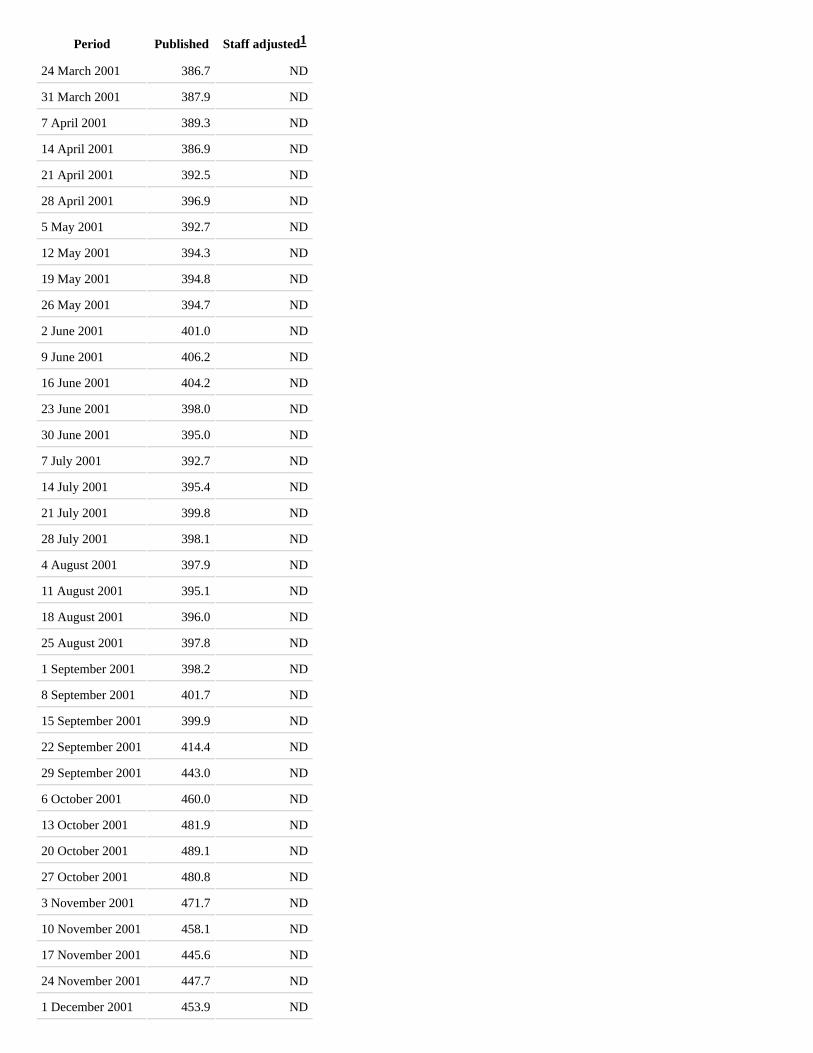
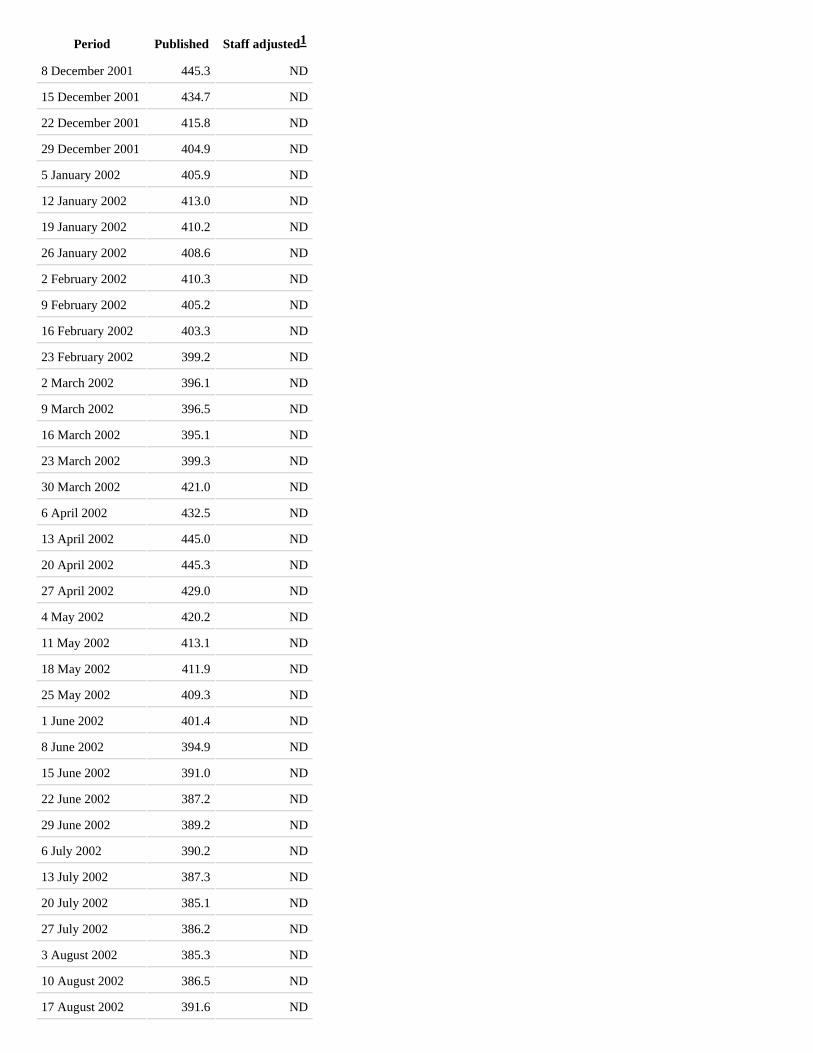
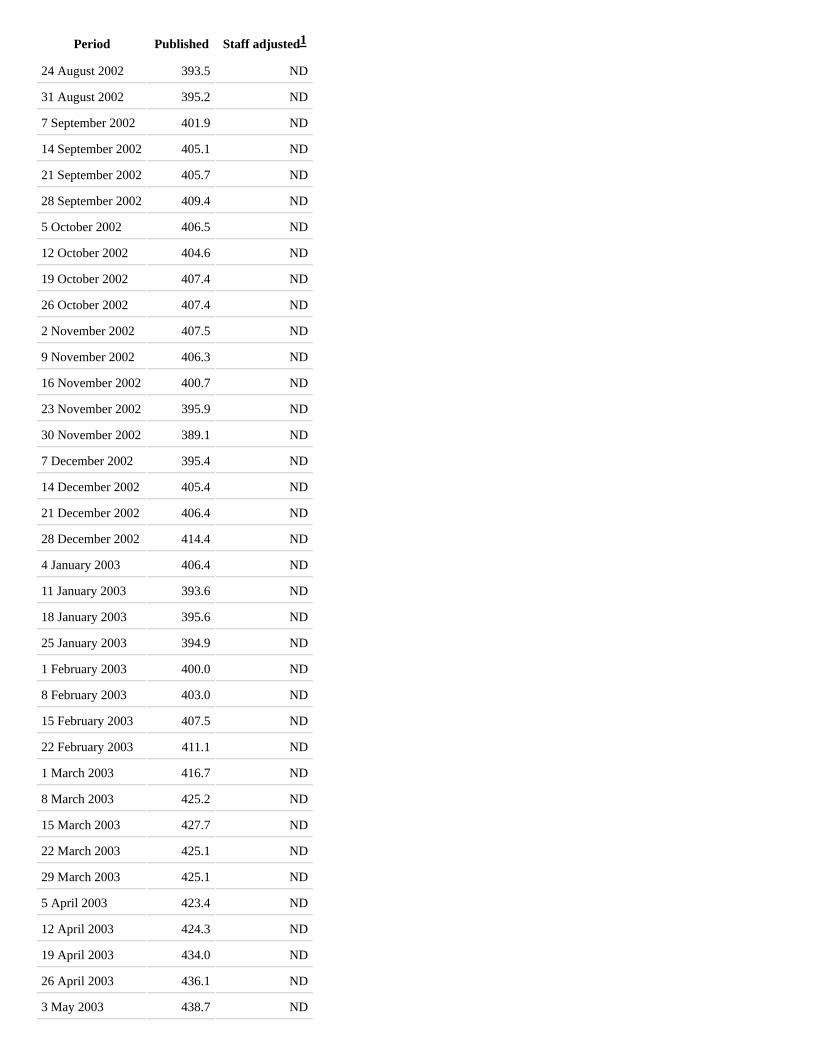
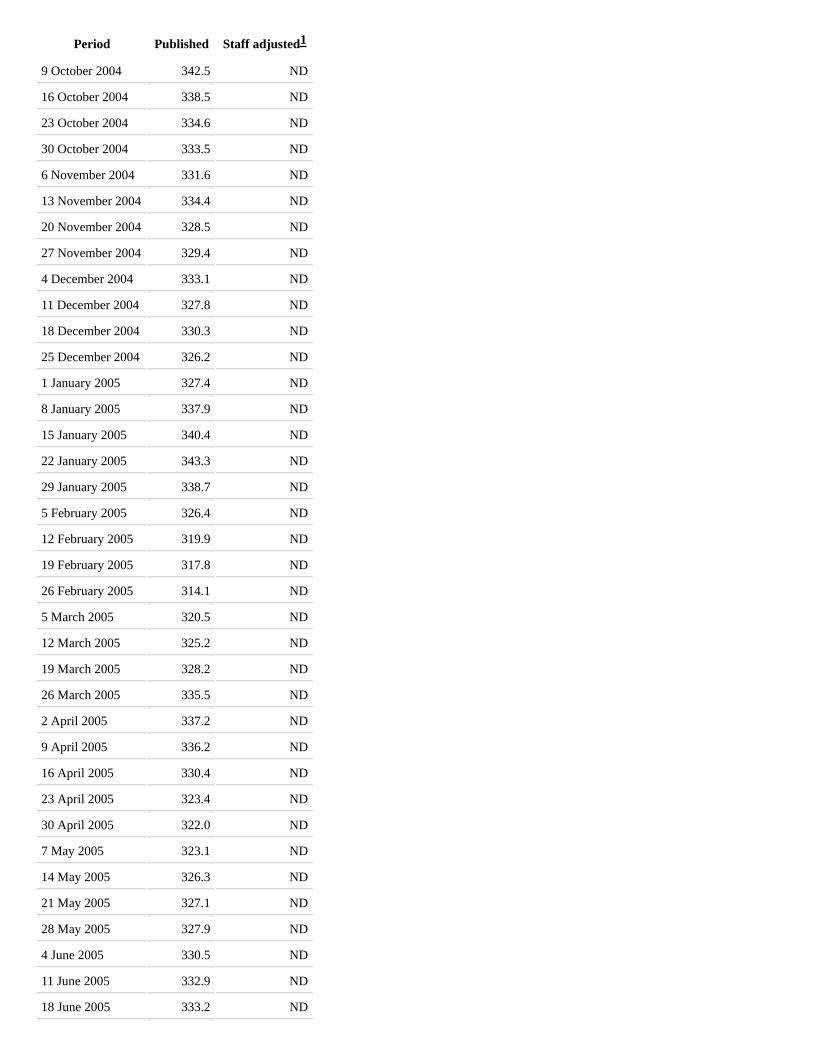
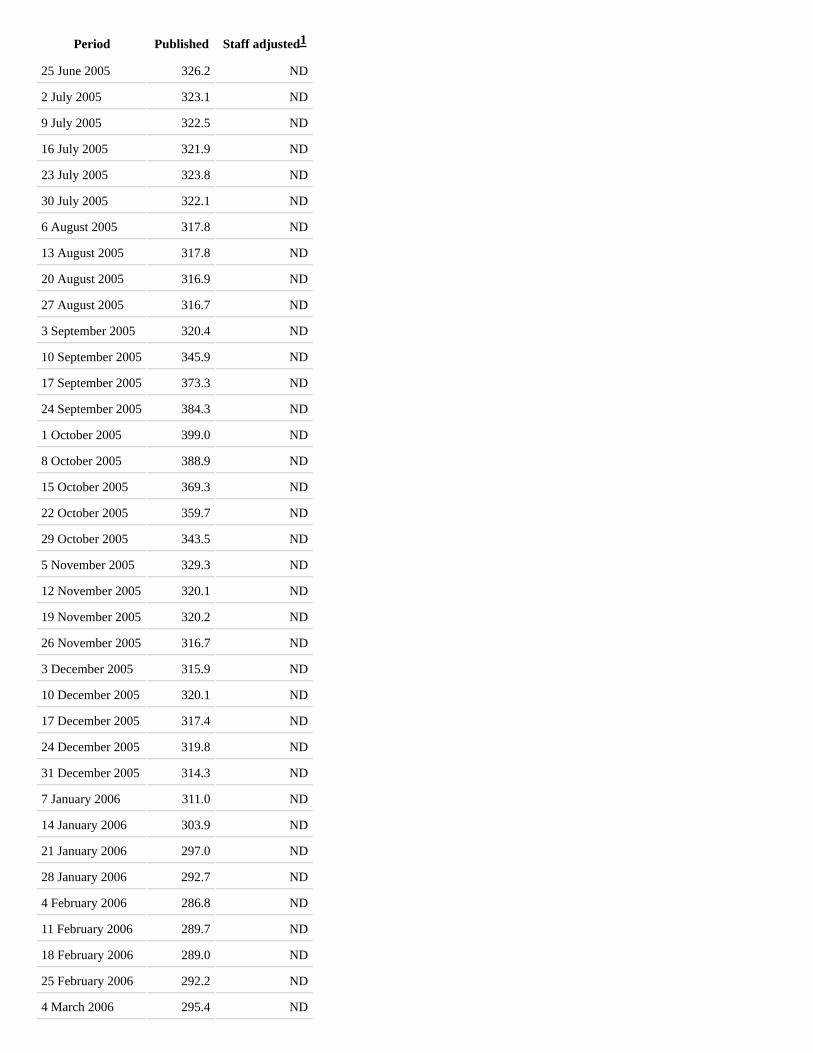
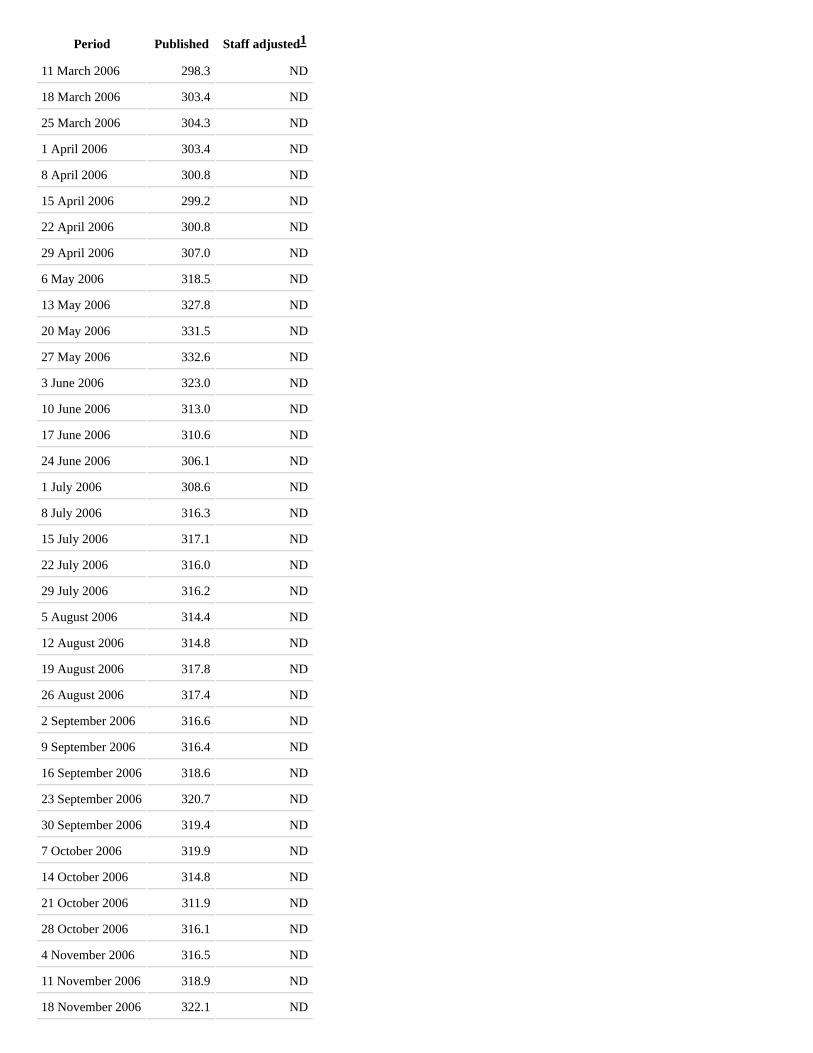
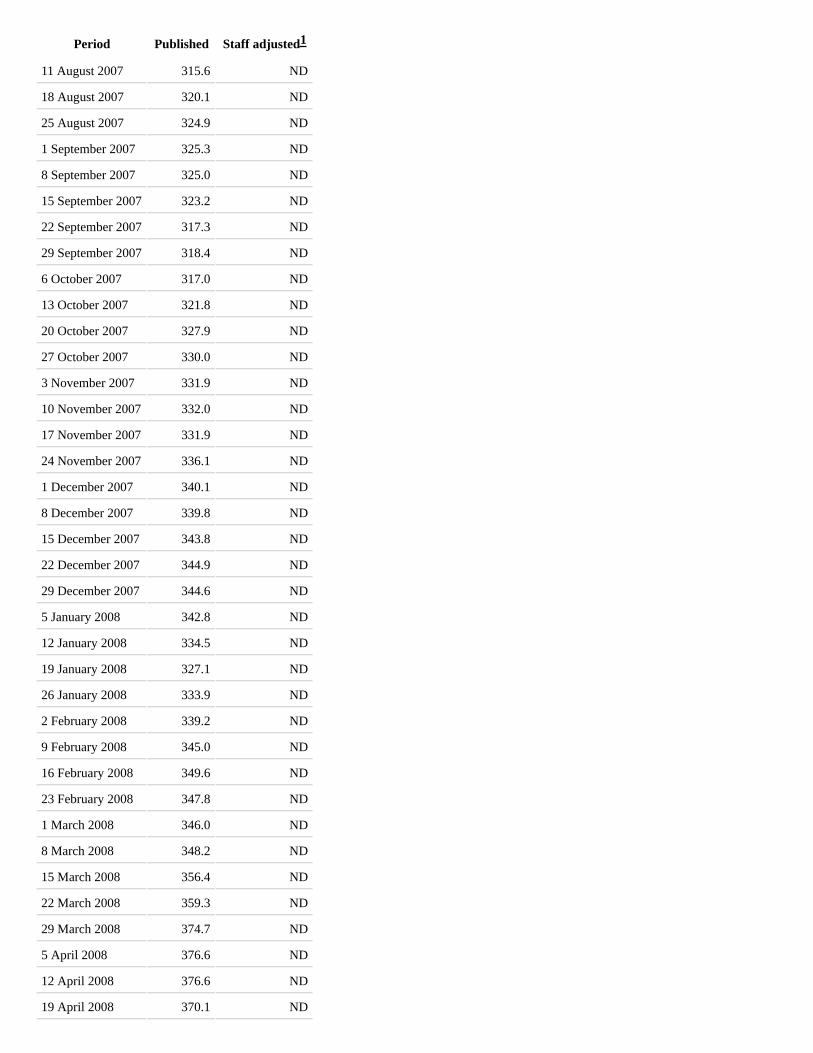
Top-right panelInitial Claims for Unemployment Insurance
Thousands, four-week moving average
Period Published Staff adjusted
8 January 2000 284.8 ND
15 January 2000 285.4 ND
22 January 2000 289.5 ND
29 January 2000 289.3 ND
5 February 2000 292.8 ND
12 February 2000 295.5 ND
19 February 2000 295.2 ND
26 February 2000 293.9 ND
4 March 2000 287.3 ND
11 March 2000 279.8 ND
18 March 2000 276.6 ND
25 March 2000 274.6 ND
1 April 2000 269.7 ND
8 April 2000 269.2 ND
15 April 2000 266.3 ND
22 April 2000 266.6 ND
29 April 2000 272.9 ND
6 May 2000 279.1 ND
13 May 2000 283.3 ND
20 May 2000 284.8 ND
27 May 2000 282.1 ND
3 June 2000 281.3 ND
10 June 2000 283.4 ND
17 June 2000 287.0 ND
24 June 2000 291.0 ND
1 July 2000 288.9 ND
1
Period Published Staff adjusted
8 July 2000 291.1 ND
15 July 2000 293.5 ND
22 July 2000 294.5 ND
29 July 2000 298.7 ND
5 August 2000 301.9 ND
12 August 2000 304.9 ND
19 August 2000 309.2 ND
26 August 2000 312.6 ND
2 September 2000 311.5 ND
9 September 2000 309.9 ND
16 September 2000 308.3 ND
23 September 2000 302.4 ND
30 September 2000 300.2 ND
7 October 2000 300.0 ND
14 October 2000 297.2 ND
21 October 2000 298.9 ND
28 October 2000 301.1 ND
4 November 2000 306.7 ND
11 November 2000 311.4 ND
18 November 2000 320.5 ND
25 November 2000 334.4 ND
2 December 2000 336.0 ND
9 December 2000 336.8 ND
16 December 2000 342.3 ND
23 December 2000 344.1 ND
30 December 2000 348.0 ND
6 January 2001 352.0 ND
13 January 2001 343.1 ND
20 January 2001 337.9 ND
27 January 2001 340.2 ND
3 February 2001 349.8 ND
10 February 2001 361.5 ND
17 February 2001 365.3 ND
24 February 2001 371.2 ND
3 March 2001 373.3 ND
10 March 2001 380.0 ND
17 March 2001 388.7 ND
1
Period Published Staff adjusted
24 March 2001 386.7 ND
31 March 2001 387.9 ND
7 April 2001 389.3 ND
14 April 2001 386.9 ND
21 April 2001 392.5 ND
28 April 2001 396.9 ND
5 May 2001 392.7 ND
12 May 2001 394.3 ND
19 May 2001 394.8 ND
26 May 2001 394.7 ND
2 June 2001 401.0 ND
9 June 2001 406.2 ND
16 June 2001 404.2 ND
23 June 2001 398.0 ND
30 June 2001 395.0 ND
7 July 2001 392.7 ND
14 July 2001 395.4 ND
21 July 2001 399.8 ND
28 July 2001 398.1 ND
4 August 2001 397.9 ND
11 August 2001 395.1 ND
18 August 2001 396.0 ND
25 August 2001 397.8 ND
1 September 2001 398.2 ND
8 September 2001 401.7 ND
15 September 2001 399.9 ND
22 September 2001 414.4 ND
29 September 2001 443.0 ND
6 October 2001 460.0 ND
13 October 2001 481.9 ND
20 October 2001 489.1 ND
27 October 2001 480.8 ND
3 November 2001 471.7 ND
10 November 2001 458.1 ND
17 November 2001 445.6 ND
24 November 2001 447.7 ND
1 December 2001 453.9 ND
1
Period Published Staff adjusted
8 December 2001 445.3 ND
15 December 2001 434.7 ND
22 December 2001 415.8 ND
29 December 2001 404.9 ND
5 January 2002 405.9 ND
12 January 2002 413.0 ND
19 January 2002 410.2 ND
26 January 2002 408.6 ND
2 February 2002 410.3 ND
9 February 2002 405.2 ND
16 February 2002 403.3 ND
23 February 2002 399.2 ND
2 March 2002 396.1 ND
9 March 2002 396.5 ND
16 March 2002 395.1 ND
23 March 2002 399.3 ND
30 March 2002 421.0 ND
6 April 2002 432.5 ND
13 April 2002 445.0 ND
20 April 2002 445.3 ND
27 April 2002 429.0 ND
4 May 2002 420.2 ND
11 May 2002 413.1 ND
18 May 2002 411.9 ND
25 May 2002 409.3 ND
1 June 2002 401.4 ND
8 June 2002 394.9 ND
15 June 2002 391.0 ND
22 June 2002 387.2 ND
29 June 2002 389.2 ND
6 July 2002 390.2 ND
13 July 2002 387.3 ND
20 July 2002 385.1 ND
27 July 2002 386.2 ND
3 August 2002 385.3 ND
10 August 2002 386.5 ND
17 August 2002 391.6 ND
1
Period Published Staff adjusted
24 August 2002 393.5 ND
31 August 2002 395.2 ND
7 September 2002 401.9 ND
14 September 2002 405.1 ND
21 September 2002 405.7 ND
28 September 2002 409.4 ND
5 October 2002 406.5 ND
12 October 2002 404.6 ND
19 October 2002 407.4 ND
26 October 2002 407.4 ND
2 November 2002 407.5 ND
9 November 2002 406.3 ND
16 November 2002 400.7 ND
23 November 2002 395.9 ND
30 November 2002 389.1 ND
7 December 2002 395.4 ND
14 December 2002 405.4 ND
21 December 2002 406.4 ND
28 December 2002 414.4 ND
4 January 2003 406.4 ND
11 January 2003 393.6 ND
18 January 2003 395.6 ND
25 January 2003 394.9 ND
1 February 2003 400.0 ND
8 February 2003 403.0 ND
15 February 2003 407.5 ND
22 February 2003 411.1 ND
1 March 2003 416.7 ND
8 March 2003 425.2 ND
15 March 2003 427.7 ND
22 March 2003 425.1 ND
29 March 2003 425.1 ND
5 April 2003 423.4 ND
12 April 2003 424.3 ND
19 April 2003 434.0 ND
26 April 2003 436.1 ND
3 May 2003 438.7 ND
1

Period Published Staff adjusted
10 May 2003 434.5 ND
17 May 2003 428.5 ND
24 May 2003 422.1 ND
31 May 2003 422.9 ND
7 June 2003 426.0 ND
14 June 2003 425.0 ND
21 June 2003 422.4 ND
28 June 2003 421.8 ND
5 July 2003 422.7 ND
12 July 2003 420.5 ND
19 July 2003 419.2 ND
26 July 2003 411.4 ND
2 August 2003 403.5 ND
9 August 2003 401.4 ND
16 August 2003 400.1 ND
23 August 2003 398.4 ND
30 August 2003 399.8 ND
6 September 2003 404.2 ND
13 September 2003 403.4 ND
20 September 2003 400.4 ND
27 September 2003 395.4 ND
4 October 2003 386.6 ND
11 October 2003 382.0 ND
18 October 2003 384.0 ND
25 October 2003 382.0 ND
1 November 2003 376.1 ND
8 November 2003 374.9 ND
15 November 2003 370.5 ND
22 November 2003 364.3 ND
29 November 2003 363.0 ND
6 December 2003 362.1 ND
13 December 2003 360.4 ND
20 December 2003 360.5 ND
27 December 2003 358.5 ND
3 January 2004 355.0 ND
10 January 2004 352.4 ND
17 January 2004 354.8 ND
1

Period Published Staff adjusted
24 January 2004 355.8 ND
31 January 2004 361.6 ND
7 February 2004 368.9 ND
14 February 2004 367.0 ND
21 February 2004 369.0 ND
28 February 2004 361.9 ND
6 March 2004 352.6 ND
13 March 2004 348.7 ND
20 March 2004 345.3 ND
27 March 2004 344.1 ND
3 April 2004 342.0 ND
10 April 2004 345.7 ND
17 April 2004 349.6 ND
24 April 2004 348.7 ND
1 May 2004 345.8 ND
8 May 2004 339.4 ND
15 May 2004 335.7 ND
22 May 2004 336.3 ND
29 May 2004 338.9 ND
5 June 2004 345.1 ND
12 June 2004 342.6 ND
19 June 2004 345.4 ND
26 June 2004 348.8 ND
3 July 2004 341.2 ND
10 July 2004 341.9 ND
17 July 2004 341.7 ND
24 July 2004 341.6 ND
31 July 2004 346.3 ND
7 August 2004 345.2 ND
14 August 2004 340.0 ND
21 August 2004 338.3 ND
28 August 2004 340.5 ND
4 September 2004 337.8 ND
11 September 2004 337.5 ND
18 September 2004 337.8 ND
25 September 2004 338.2 ND
2 October 2004 340.8 ND
1
Period Published Staff adjusted
9 October 2004 342.5 ND
16 October 2004 338.5 ND
23 October 2004 334.6 ND
30 October 2004 333.5 ND
6 November 2004 331.6 ND
13 November 2004 334.4 ND
20 November 2004 328.5 ND
27 November 2004 329.4 ND
4 December 2004 333.1 ND
11 December 2004 327.8 ND
18 December 2004 330.3 ND
25 December 2004 326.2 ND
1 January 2005 327.4 ND
8 January 2005 337.9 ND
15 January 2005 340.4 ND
22 January 2005 343.3 ND
29 January 2005 338.7 ND
5 February 2005 326.4 ND
12 February 2005 319.9 ND
19 February 2005 317.8 ND
26 February 2005 314.1 ND
5 March 2005 320.5 ND
12 March 2005 325.2 ND
19 March 2005 328.2 ND
26 March 2005 335.5 ND
2 April 2005 337.2 ND
9 April 2005 336.2 ND
16 April 2005 330.4 ND
23 April 2005 323.4 ND
30 April 2005 322.0 ND
7 May 2005 323.1 ND
14 May 2005 326.3 ND
21 May 2005 327.1 ND
28 May 2005 327.9 ND
4 June 2005 330.5 ND
11 June 2005 332.9 ND
18 June 2005 333.2 ND
1
Period Published Staff adjusted
25 June 2005 326.2 ND
2 July 2005 323.1 ND
9 July 2005 322.5 ND
16 July 2005 321.9 ND
23 July 2005 323.8 ND
30 July 2005 322.1 ND
6 August 2005 317.8 ND
13 August 2005 317.8 ND
20 August 2005 316.9 ND
27 August 2005 316.7 ND
3 September 2005 320.4 ND
10 September 2005 345.9 ND
17 September 2005 373.3 ND
24 September 2005 384.3 ND
1 October 2005 399.0 ND
8 October 2005 388.9 ND
15 October 2005 369.3 ND
22 October 2005 359.7 ND
29 October 2005 343.5 ND
5 November 2005 329.3 ND
12 November 2005 320.1 ND
19 November 2005 320.2 ND
26 November 2005 316.7 ND
3 December 2005 315.9 ND
10 December 2005 320.1 ND
17 December 2005 317.4 ND
24 December 2005 319.8 ND
31 December 2005 314.3 ND
7 January 2006 311.0 ND
14 January 2006 303.9 ND
21 January 2006 297.0 ND
28 January 2006 292.7 ND
4 February 2006 286.8 ND
11 February 2006 289.7 ND
18 February 2006 289.0 ND
25 February 2006 292.2 ND
4 March 2006 295.4 ND
1
Period Published Staff adjusted
11 March 2006 298.3 ND
18 March 2006 303.4 ND
25 March 2006 304.3 ND
1 April 2006 303.4 ND
8 April 2006 300.8 ND
15 April 2006 299.2 ND
22 April 2006 300.8 ND
29 April 2006 307.0 ND
6 May 2006 318.5 ND
13 May 2006 327.8 ND
20 May 2006 331.5 ND
27 May 2006 332.6 ND
3 June 2006 323.0 ND
10 June 2006 313.0 ND
17 June 2006 310.6 ND
24 June 2006 306.1 ND
1 July 2006 308.6 ND
8 July 2006 316.3 ND
15 July 2006 317.1 ND
22 July 2006 316.0 ND
29 July 2006 316.2 ND
5 August 2006 314.4 ND
12 August 2006 314.8 ND
19 August 2006 317.8 ND
26 August 2006 317.4 ND
2 September 2006 316.6 ND
9 September 2006 316.4 ND
16 September 2006 318.6 ND
23 September 2006 320.7 ND
30 September 2006 319.4 ND
7 October 2006 319.9 ND
14 October 2006 314.8 ND
21 October 2006 311.9 ND
28 October 2006 316.1 ND
4 November 2006 316.5 ND
11 November 2006 318.9 ND
18 November 2006 322.1 ND
1

Period Published Staff adjusted
25 November 2006 326.0 ND
2 December 2006 328.1 ND
9 December 2006 327.6 ND
16 December 2006 326.0 ND
23 December 2006 319.8 ND
30 December 2006 320.7 ND
6 January 2007 321.1 ND
13 January 2007 315.7 ND
20 January 2007 320.2 ND
27 January 2007 314.9 ND
3 February 2007 313.5 ND
10 February 2007 322.4 ND
17 February 2007 318.9 ND
24 February 2007 322.4 ND
3 March 2007 324.8 ND
10 March 2007 318.4 ND
17 March 2007 315.8 ND
24 March 2007 311.5 ND
31 March 2007 311.3 ND
7 April 2007 316.3 ND
14 April 2007 321.1 ND
21 April 2007 323.7 ND
28 April 2007 321.3 ND
5 May 2007 313.7 ND
12 May 2007 306.0 ND
19 May 2007 304.6 ND
26 May 2007 304.9 ND
2 June 2007 308.5 ND
9 June 2007 311.5 ND
16 June 2007 314.9 ND
23 June 2007 316.0 ND
30 June 2007 318.5 ND
7 July 2007 316.2 ND
14 July 2007 312.4 ND
21 July 2007 310.7 ND
28 July 2007 308.6 ND
4 August 2007 312.1 ND
1
Period Published Staff adjusted
11 August 2007 315.6 ND
18 August 2007 320.1 ND
25 August 2007 324.9 ND
1 September 2007 325.3 ND
8 September 2007 325.0 ND
15 September 2007 323.2 ND
22 September 2007 317.3 ND
29 September 2007 318.4 ND
6 October 2007 317.0 ND
13 October 2007 321.8 ND
20 October 2007 327.9 ND
27 October 2007 330.0 ND
3 November 2007 331.9 ND
10 November 2007 332.0 ND
17 November 2007 331.9 ND
24 November 2007 336.1 ND
1 December 2007 340.1 ND
8 December 2007 339.8 ND
15 December 2007 343.8 ND
22 December 2007 344.9 ND
29 December 2007 344.6 ND
5 January 2008 342.8 ND
12 January 2008 334.5 ND
19 January 2008 327.1 ND
26 January 2008 333.9 ND
2 February 2008 339.2 ND
9 February 2008 345.0 ND
16 February 2008 349.6 ND
23 February 2008 347.8 ND
1 March 2008 346.0 ND
8 March 2008 348.2 ND
15 March 2008 356.4 ND
22 March 2008 359.3 ND
29 March 2008 374.7 ND
5 April 2008 376.6 ND
12 April 2008 376.6 ND
19 April 2008 370.1 ND
1

Period Published Staff adjusted
26 April 2008 364.3 ND
3 May 2008 367.3 ND
10 May 2008 367.2 ND
17 May 2008 372.9 ND
24 May 2008 371.2 ND
31 May 2008 369.0 ND
7 June 2008 372.0 ND
14 June 2008 376.1 ND
21 June 2008 379.3 ND
28 June 2008 390.5 ND
5 July 2008 381.1 380.0
12 July 2008 377.9 ND
19 July 2008 381.7 ND
26 July 2008 393.0 ND
2 August 2008 420.1 ND
9 August 2008 438.1 440.0
16 August 2008 446.3 ND
23 August 2008 441.4 ND
30 August 2008 439.9 ND
6 September 2008 440.1 ND
13 September 2008 445.6 436.2
20 September 2008 462.3 433.5
27 September 2008 474.3 441.6
4 October 2008 483.2 461.5
11 October 2008 484.6 451.0
18 October 2008 480.1 463.8
Change inPrivate Payroll Emp.
Sept. Oct.
Current -168 -227
Sept. GB (-147) (-83)
1. Adjusted for hurricanes and EUC effects. Return to table
2. Thousands of employees. Return to table
Middle-left panelSales of Light Vehicles
1
2
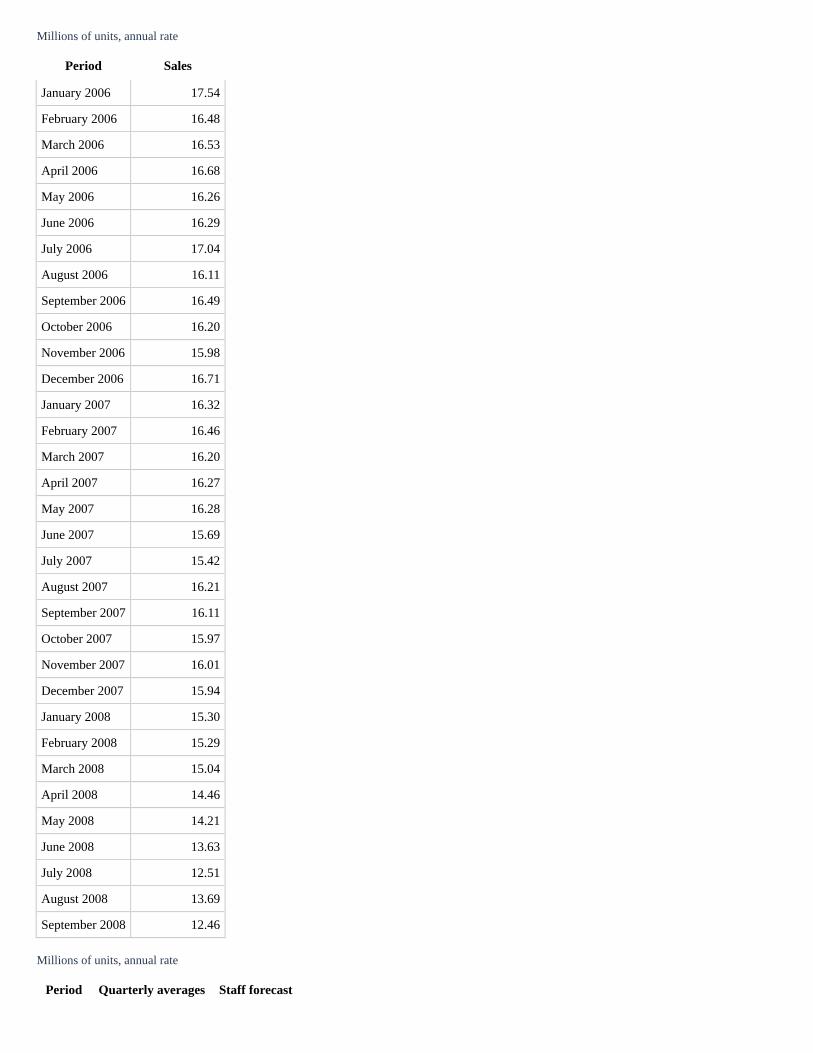
Millions of units, annual rate
Period Sales
January 2006 17.54
February 2006 16.48
March 2006 16.53
April 2006 16.68
May 2006 16.26
June 2006 16.29
July 2006 17.04
August 2006 16.11
September 2006 16.49
October 2006 16.20
November 2006 15.98
December 2006 16.71
January 2007 16.32
February 2007 16.46
March 2007 16.20
April 2007 16.27
May 2007 16.28
June 2007 15.69
July 2007 15.42
August 2007 16.21
September 2007 16.11
October 2007 15.97
November 2007 16.01
December 2007 15.94
January 2008 15.30
February 2008 15.29
March 2008 15.04
April 2008 14.46
May 2008 14.21
June 2008 13.63
July 2008 12.51
August 2008 13.69
September 2008 12.46
Millions of units, annual rate
Period Quarterly averages Staff forecast

Period Quarterly averages Staff forecast
2006:Q1 16.85 ND
2006:Q2 16.41 ND
2006:Q3 16.55 ND
2006:Q4 16.30 ND
2007:Q1 16.33 ND
2007:Q2 16.08 ND
2007:Q3 15.92 ND
2007:Q4 15.97 ND
2008:Q1 15.21 ND
2008:Q2 14.10 ND
2008:Q3 12.89 ND
2008:Q4 ND 12.17
Middle-right panelReal PCE Ex. Motor Vehicles
Three-month percent change, annual rate
Period Current September GB
July 2007 2.77 ND
August 2007 2.95 ND
September 2007 1.65 ND
October 2007 -0.13 ND
November 2007 1.61 ND
December 2007 1.64 ND
January 2008 2.85 ND
February 2008 -0.17 ND
March 2008 1.60 1.60
April 2008 1.66 1.80
May 2008 3.62 4.06
June 2008 1.42 2.43
July 2008 -0.53 0.43
August 2008 -2.86 -0.47
September 2008 -2.94 -0.43
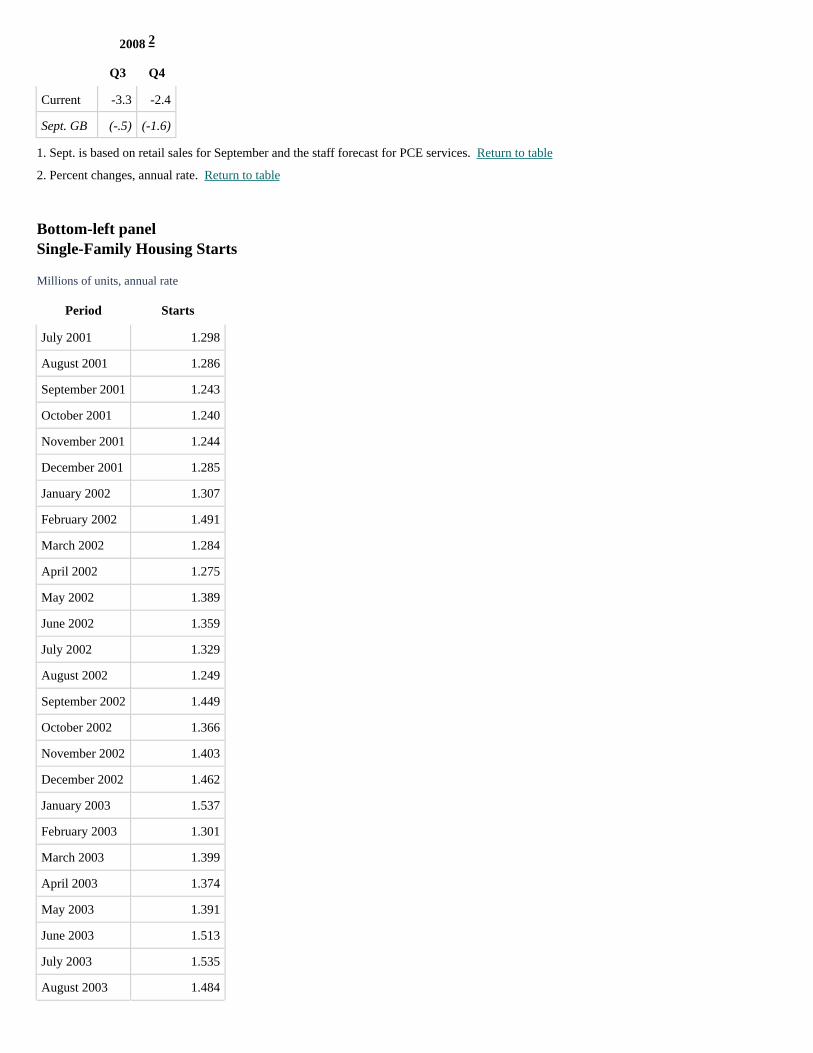
Total Real PCE
2008
Q3 Q4
1
2
2008
Q3 Q4
Current -3.3 -2.4
Sept. GB (-.5) (-1.6)
1. Sept. is based on retail sales for September and the staff forecast for PCE services. Return to table
2. Percent changes, annual rate. Return to table
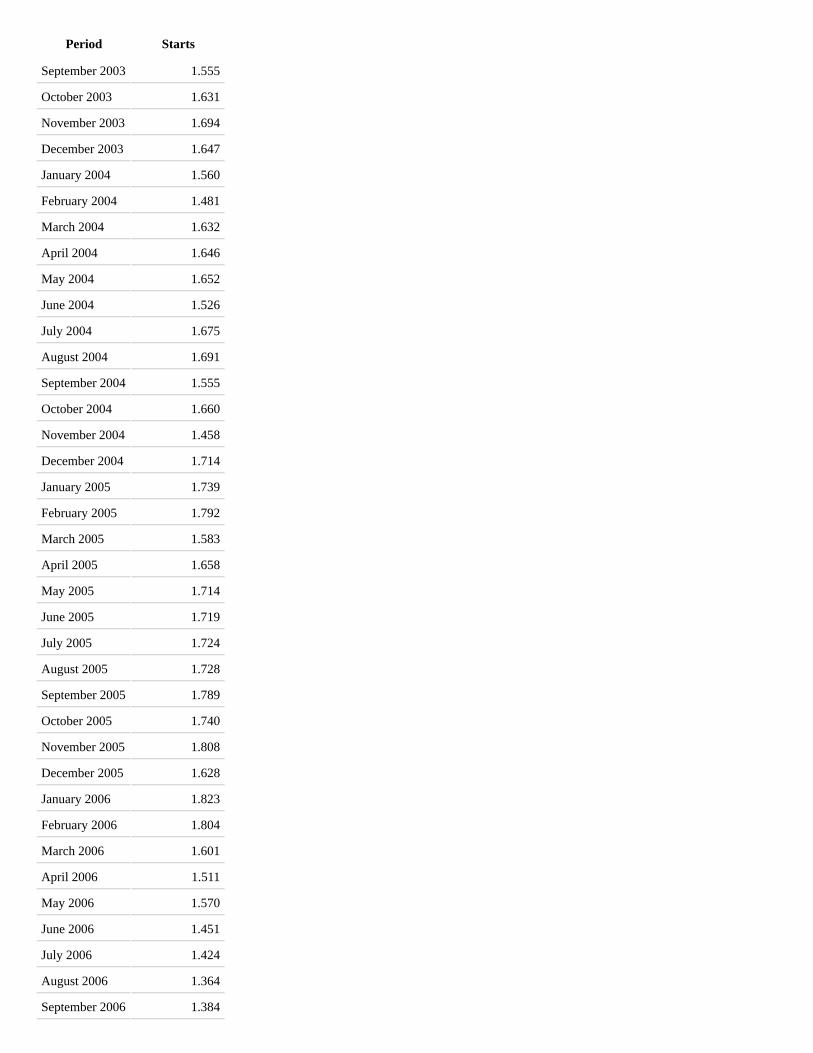
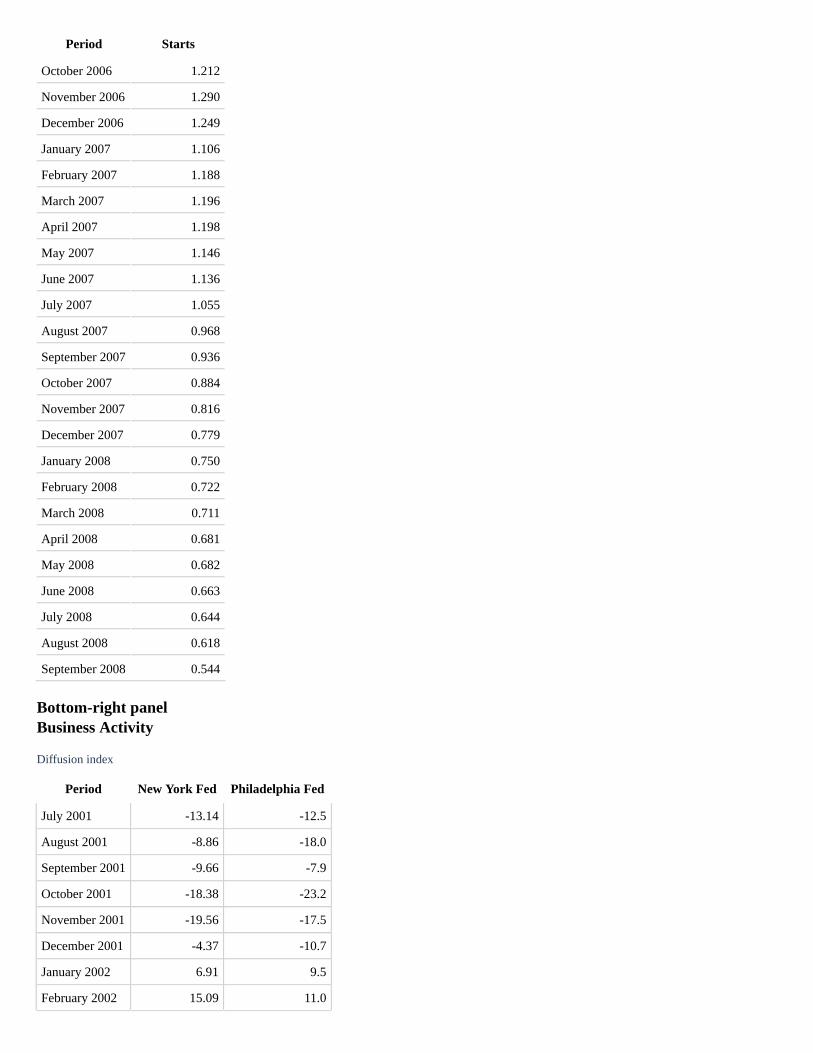
Bottom-left panelSingle-Family Housing Starts
Millions of units, annual rate
Period Starts
July 2001 1.298
August 2001 1.286
September 2001 1.243
October 2001 1.240
November 2001 1.244
December 2001 1.285
January 2002 1.307
February 2002 1.491
March 2002 1.284
April 2002 1.275
May 2002 1.389
June 2002 1.359
July 2002 1.329
August 2002 1.249
September 2002 1.449
October 2002 1.366
November 2002 1.403
December 2002 1.462
January 2003 1.537
February 2003 1.301
March 2003 1.399
April 2003 1.374
May 2003 1.391
June 2003 1.513
July 2003 1.535
August 2003 1.484
2
Period Starts
September 2003 1.555
October 2003 1.631
November 2003 1.694
December 2003 1.647
January 2004 1.560
February 2004 1.481
March 2004 1.632
April 2004 1.646
May 2004 1.652
June 2004 1.526
July 2004 1.675
August 2004 1.691
September 2004 1.555
October 2004 1.660
November 2004 1.458
December 2004 1.714
January 2005 1.739
February 2005 1.792
March 2005 1.583
April 2005 1.658
May 2005 1.714
June 2005 1.719
July 2005 1.724
August 2005 1.728
September 2005 1.789
October 2005 1.740
November 2005 1.808
December 2005 1.628
January 2006 1.823
February 2006 1.804
March 2006 1.601
April 2006 1.511
May 2006 1.570
June 2006 1.451
July 2006 1.424
August 2006 1.364
September 2006 1.384
Period Starts
October 2006 1.212
November 2006 1.290
December 2006 1.249
January 2007 1.106
February 2007 1.188
March 2007 1.196
April 2007 1.198
May 2007 1.146
June 2007 1.136
July 2007 1.055
August 2007 0.968
September 2007 0.936
October 2007 0.884
November 2007 0.816
December 2007 0.779
January 2008 0.750
February 2008 0.722
March 2008 0.711
April 2008 0.681
May 2008 0.682
June 2008 0.663
July 2008 0.644
August 2008 0.618
September 2008 0.544
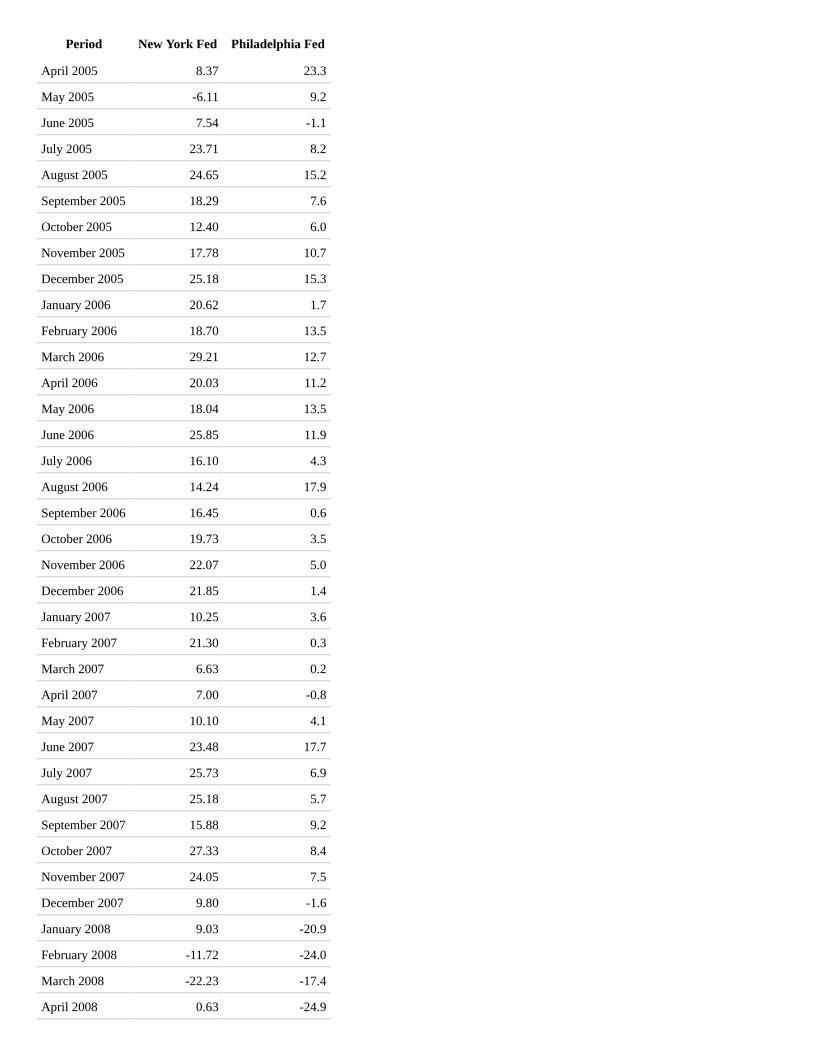
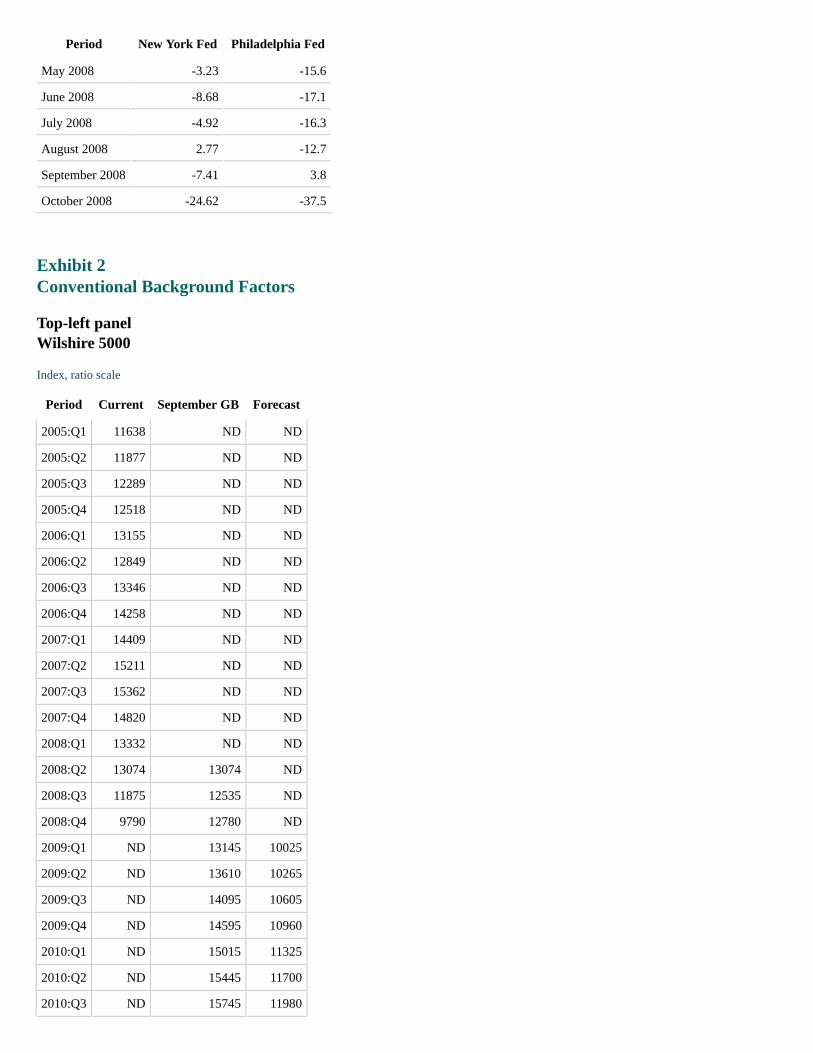
Bottom-right panelBusiness Activity
Diffusion index
Period New York Fed Philadelphia Fed
July 2001 -13.14 -12.5
August 2001 -8.86 -18.0
September 2001 -9.66 -7.9
October 2001 -18.38 -23.2
November 2001 -19.56 -17.5
December 2001 -4.37 -10.7
January 2002 6.91 9.5
February 2002 15.09 11.0

Period New York Fed Philadelphia Fed
March 2002 6.54 12.0
April 2002 17.21 12.3
May 2002 9.53 10.2
June 2002 10.76 20.3
July 2002 -1.71 6.0
August 2002 7.41 -0.8
September 2002 7.91 4.8
October 2002 -5.99 -7.1
November 2002 5.18 7.5
December 2002 6.53 8.0
January 2003 13.21 3.6
February 2003 -2.68 -1.6
March 2003 -0.46 -4.3
April 2003 -16.47 -7.3
May 2003 12.74 -0.5
June 2003 26.74 3.7
July 2003 19.45 7.7
August 2003 15.36 21.6
September 2003 21.24 21.3
October 2003 36.76 28.9
November 2003 34.43 27.1
December 2003 30.93 27.7
January 2004 36.85 33.5
February 2004 37.16 28.0
March 2004 26.43 29.0
April 2004 37.54 31.1
May 2004 34.61 29.1
June 2004 27.65 30.7
July 2004 35.02 34.6
August 2004 15.98 27.4
September 2004 29.14 20.0
October 2004 24.61 28.0
November 2004 15.44 19.7
December 2004 24.30 27.5
January 2005 19.53 9.7
February 2005 15.95 20.8
March 2005 19.03 13.8
Period New York Fed Philadelphia Fed
April 2005 8.37 23.3
May 2005 -6.11 9.2
June 2005 7.54 -1.1
July 2005 23.71 8.2
August 2005 24.65 15.2
September 2005 18.29 7.6
October 2005 12.40 6.0
November 2005 17.78 10.7
December 2005 25.18 15.3
January 2006 20.62 1.7
February 2006 18.70 13.5
March 2006 29.21 12.7
April 2006 20.03 11.2
May 2006 18.04 13.5
June 2006 25.85 11.9
July 2006 16.10 4.3
August 2006 14.24 17.9
September 2006 16.45 0.6
October 2006 19.73 3.5
November 2006 22.07 5.0
December 2006 21.85 1.4
January 2007 10.25 3.6
February 2007 21.30 0.3
March 2007 6.63 0.2
April 2007 7.00 -0.8
May 2007 10.10 4.1
June 2007 23.48 17.7
July 2007 25.73 6.9
August 2007 25.18 5.7
September 2007 15.88 9.2
October 2007 27.33 8.4
November 2007 24.05 7.5
December 2007 9.80 -1.6
January 2008 9.03 -20.9
February 2008 -11.72 -24.0
March 2008 -22.23 -17.4
April 2008 0.63 -24.9
Period New York Fed Philadelphia Fed
May 2008 -3.23 -15.6
June 2008 -8.68 -17.1
July 2008 -4.92 -16.3
August 2008 2.77 -12.7
September 2008 -7.41 3.8
October 2008 -24.62 -37.5
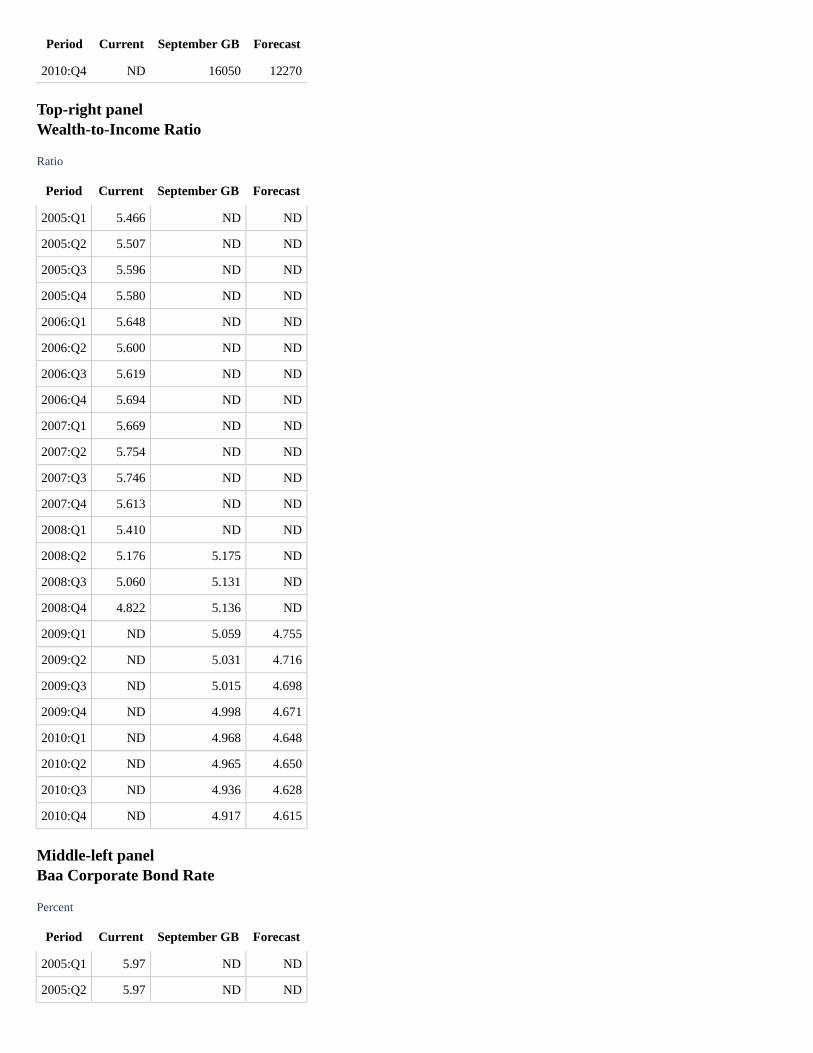
Exhibit 2Conventional Background Factors
Top-left panelWilshire 5000
Index, ratio scale
Period Current September GB Forecast
2005:Q1 11638 ND ND
2005:Q2 11877 ND ND
2005:Q3 12289 ND ND
2005:Q4 12518 ND ND
2006:Q1 13155 ND ND
2006:Q2 12849 ND ND
2006:Q3 13346 ND ND
2006:Q4 14258 ND ND
2007:Q1 14409 ND ND
2007:Q2 15211 ND ND
2007:Q3 15362 ND ND
2007:Q4 14820 ND ND
2008:Q1 13332 ND ND
2008:Q2 13074 13074 ND
2008:Q3 11875 12535 ND
2008:Q4 9790 12780 ND
2009:Q1 ND 13145 10025
2009:Q2 ND 13610 10265
2009:Q3 ND 14095 10605
2009:Q4 ND 14595 10960
2010:Q1 ND 15015 11325
2010:Q2 ND 15445 11700
2010:Q3 ND 15745 11980
Period Current September GB Forecast
2010:Q4 ND 16050 12270
Top-right panelWealth-to-Income Ratio
Ratio
Period Current September GB Forecast
2005:Q1 5.466 ND ND
2005:Q2 5.507 ND ND
2005:Q3 5.596 ND ND
2005:Q4 5.580 ND ND
2006:Q1 5.648 ND ND
2006:Q2 5.600 ND ND
2006:Q3 5.619 ND ND
2006:Q4 5.694 ND ND
2007:Q1 5.669 ND ND
2007:Q2 5.754 ND ND
2007:Q3 5.746 ND ND
2007:Q4 5.613 ND ND
2008:Q1 5.410 ND ND
2008:Q2 5.176 5.175 ND
2008:Q3 5.060 5.131 ND
2008:Q4 4.822 5.136 ND
2009:Q1 ND 5.059 4.755
2009:Q2 ND 5.031 4.716
2009:Q3 ND 5.015 4.698
2009:Q4 ND 4.998 4.671
2010:Q1 ND 4.968 4.648
2010:Q2 ND 4.965 4.650
2010:Q3 ND 4.936 4.628
2010:Q4 ND 4.917 4.615
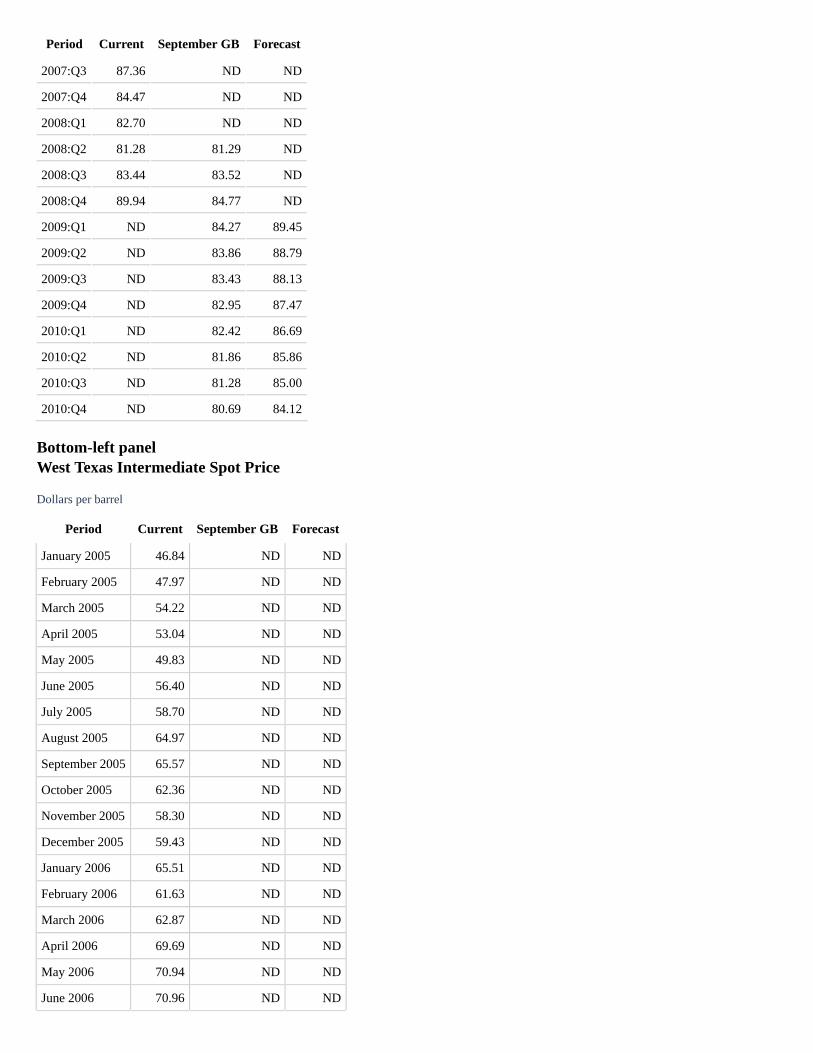
Middle-left panelBaa Corporate Bond Rate
Percent
Period Current September GB Forecast
2005:Q1 5.97 ND ND
2005:Q2 5.97 ND ND

Period Current September GB Forecast
2005:Q3 5.98 ND ND
2005:Q4 6.34 ND ND
2006:Q1 6.31 ND ND
2006:Q2 6.74 ND ND
2006:Q3 6.59 ND ND
2006:Q4 6.28 ND ND
2007:Q1 6.30 ND ND
2007:Q2 6.49 ND ND
2007:Q3 6.63 ND ND
2007:Q4 6.51 ND ND
2008:Q1 6.75 ND ND
2008:Q2 6.99 6.99 ND
2008:Q3 7.21 7.10 ND
2008:Q4 9.05 6.95 ND
2009:Q1 ND 6.90 8.65
2009:Q2 ND 6.80 8.25
2009:Q3 ND 6.65 7.95
2009:Q4 ND 6.45 7.65
2010:Q1 ND 6.40 7.40
2010:Q2 ND 6.30 7.20
2010:Q3 ND 6.25 7.00
2010:Q4 ND 6.15 6.80
Middle-right panelBroad Real Dollar Index
Index
Period Current September GB Forecast
2005:Q1 91.84 ND ND
2005:Q2 93.01 ND ND
2005:Q3 94.00 ND ND
2005:Q4 95.06 ND ND
2006:Q1 93.63 ND ND
2006:Q2 92.48 ND ND
2006:Q3 92.40 ND ND
2006:Q4 91.05 ND ND
2007:Q1 91.01 ND ND
2007:Q2 89.19 ND ND
Period Current September GB Forecast
2007:Q3 87.36 ND ND
2007:Q4 84.47 ND ND
2008:Q1 82.70 ND ND
2008:Q2 81.28 81.29 ND
2008:Q3 83.44 83.52 ND
2008:Q4 89.94 84.77 ND
2009:Q1 ND 84.27 89.45
2009:Q2 ND 83.86 88.79
2009:Q3 ND 83.43 88.13
2009:Q4 ND 82.95 87.47
2010:Q1 ND 82.42 86.69
2010:Q2 ND 81.86 85.86
2010:Q3 ND 81.28 85.00
2010:Q4 ND 80.69 84.12
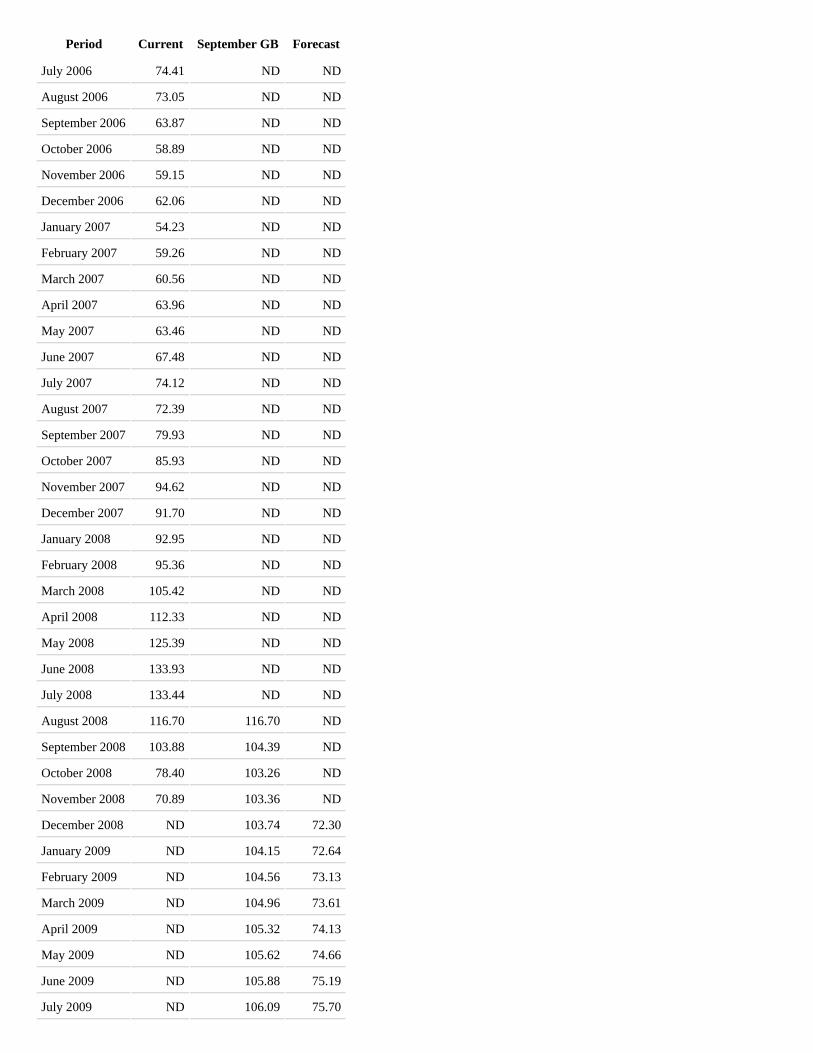
Bottom-left panelWest Texas Intermediate Spot Price
Dollars per barrel
Period Current September GB Forecast
January 2005 46.84 ND ND
February 2005 47.97 ND ND
March 2005 54.22 ND ND
April 2005 53.04 ND ND
May 2005 49.83 ND ND
June 2005 56.40 ND ND
July 2005 58.70 ND ND
August 2005 64.97 ND ND
September 2005 65.57 ND ND
October 2005 62.36 ND ND
November 2005 58.30 ND ND
December 2005 59.43 ND ND
January 2006 65.51 ND ND
February 2006 61.63 ND ND
March 2006 62.87 ND ND
April 2006 69.69 ND ND
May 2006 70.94 ND ND
June 2006 70.96 ND ND
Period Current September GB Forecast
July 2006 74.41 ND ND
August 2006 73.05 ND ND
September 2006 63.87 ND ND
October 2006 58.89 ND ND
November 2006 59.15 ND ND
December 2006 62.06 ND ND
January 2007 54.23 ND ND
February 2007 59.26 ND ND
March 2007 60.56 ND ND
April 2007 63.96 ND ND
May 2007 63.46 ND ND
June 2007 67.48 ND ND
July 2007 74.12 ND ND
August 2007 72.39 ND ND
September 2007 79.93 ND ND
October 2007 85.93 ND ND
November 2007 94.62 ND ND
December 2007 91.70 ND ND
January 2008 92.95 ND ND
February 2008 95.36 ND ND
March 2008 105.42 ND ND
April 2008 112.33 ND ND
May 2008 125.39 ND ND
June 2008 133.93 ND ND
July 2008 133.44 ND ND
August 2008 116.70 116.70 ND
September 2008 103.88 104.39 ND
October 2008 78.40 103.26 ND
November 2008 70.89 103.36 ND
December 2008 ND 103.74 72.30
January 2009 ND 104.15 72.64
February 2009 ND 104.56 73.13
March 2009 ND 104.96 73.61
April 2009 ND 105.32 74.13
May 2009 ND 105.62 74.66
June 2009 ND 105.88 75.19
July 2009 ND 106.09 75.70

Period Current September GB Forecast
August 2009 ND 106.26 76.21
September 2009 ND 106.39 76.74
October 2009 ND 106.49 77.28
November 2009 ND 106.57 77.83
December 2009 ND 106.64 78.38
January 2010 ND 106.70 78.91
February 2010 ND 106.76 79.42
March 2010 ND 106.80 79.93
April 2010 ND 106.82 80.40
May 2010 ND 106.83 80.85
June 2010 ND 106.84 81.27
July 2010 ND 106.85 81.68
August 2010 ND 106.86 82.08
September 2010 ND 106.87 82.48
October 2010 ND 106.88 82.83
November 2010 ND 106.89 83.16
December 2010 ND 106.90 83.46
Bottom-right panelSummary
These background factors exert a considerable drag on activity through conventional wealth,cost-of-capital, and terms-of-trade channelsThese effects likely understate the fallout on real activity from financial turmoilWe use supplementary analyses to try to account for credit-channel effects
Exhibit 3Judgmental Effects of Financial Market Turmoil
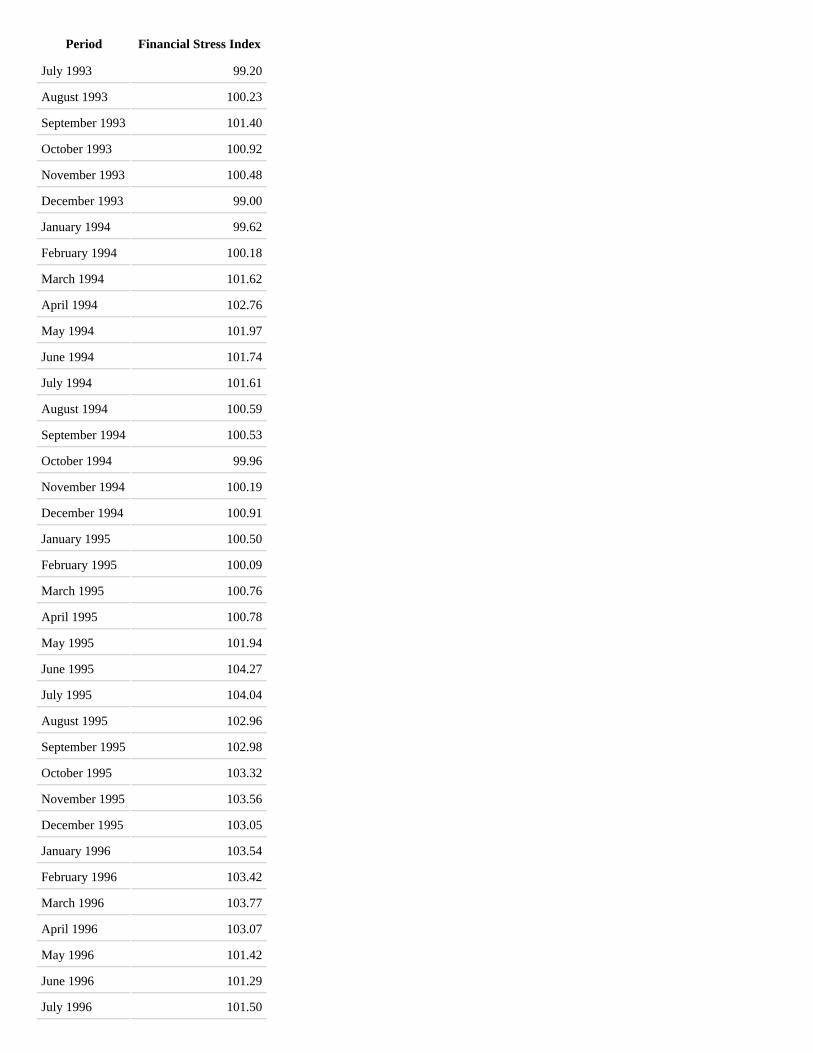
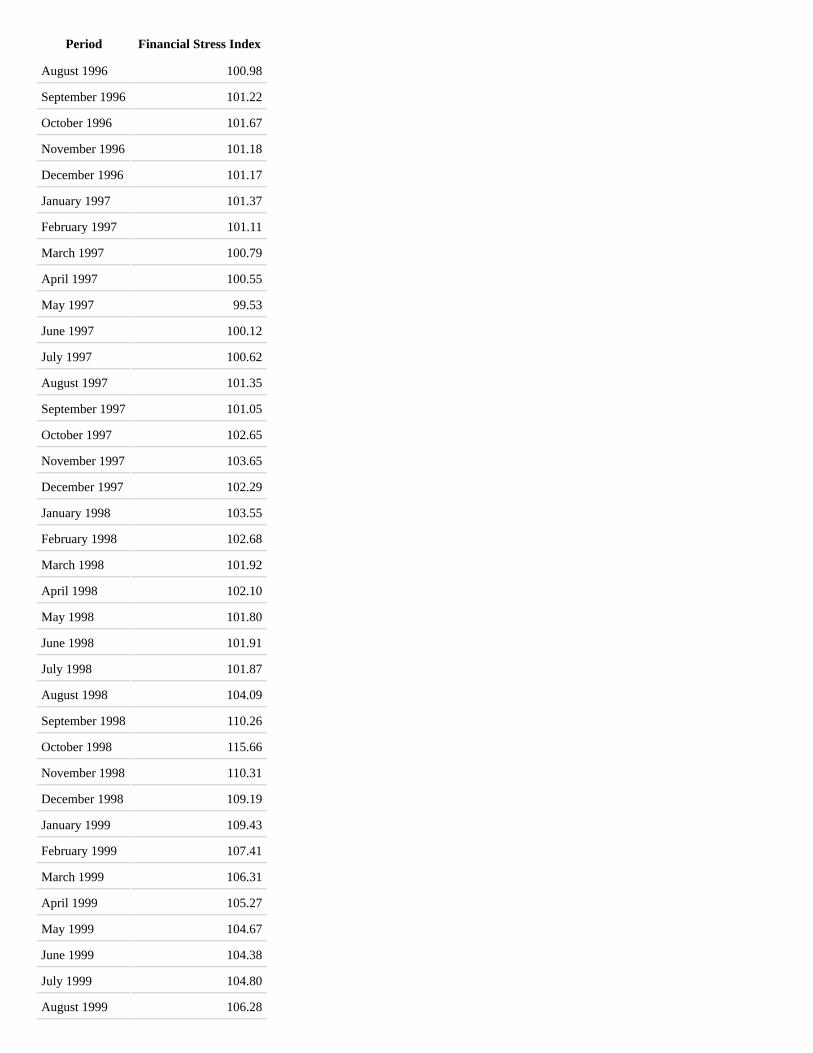
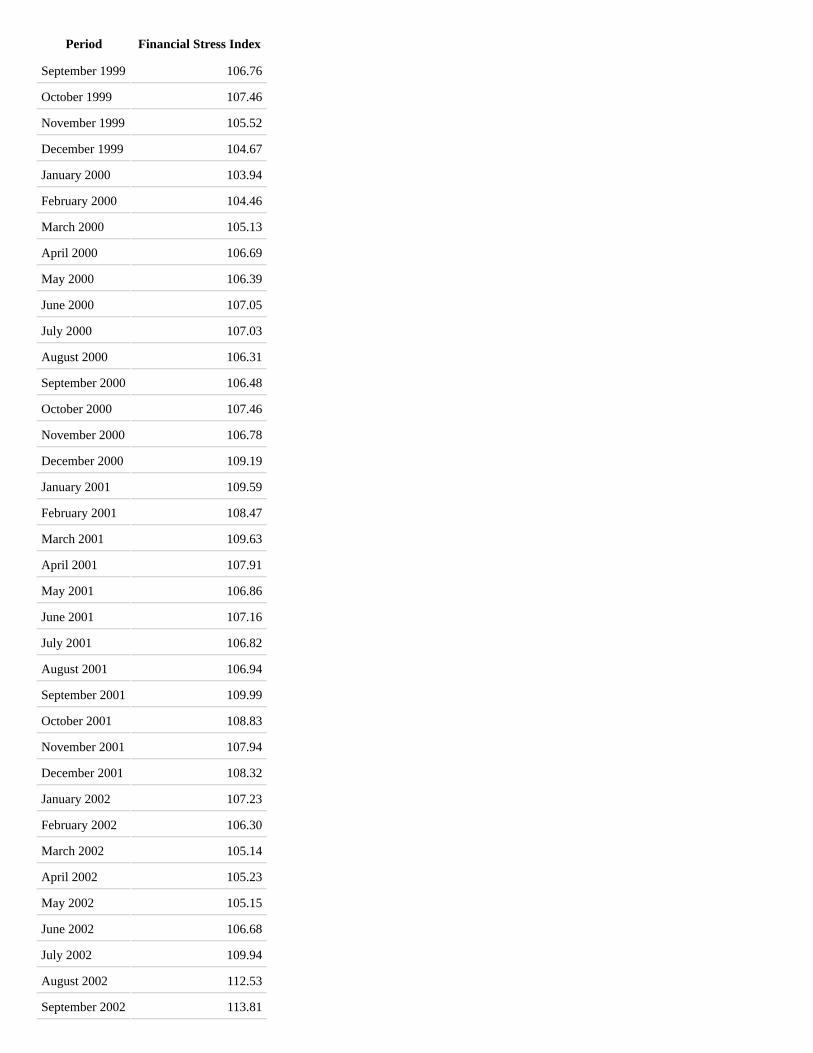
Top-left panelNine-Variable Financial Stress Index
1994 = 100
Period Financial Stress Index
January 1990 104.97
February 1990 104.45
March 1990 103.54
April 1990 103.31
May 1990 102.47
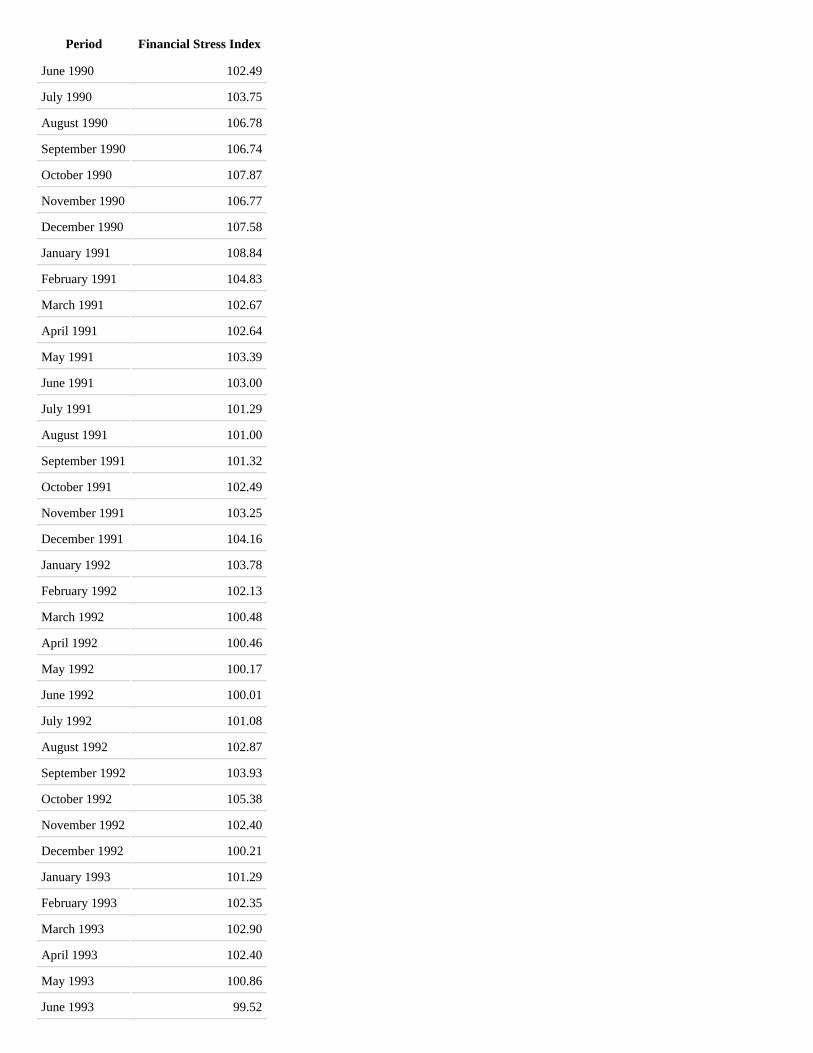
Period Financial Stress Index
June 1990 102.49
July 1990 103.75
August 1990 106.78
September 1990 106.74
October 1990 107.87
November 1990 106.77
December 1990 107.58
January 1991 108.84
February 1991 104.83
March 1991 102.67
April 1991 102.64
May 1991 103.39
June 1991 103.00
July 1991 101.29
August 1991 101.00
September 1991 101.32
October 1991 102.49
November 1991 103.25
December 1991 104.16
January 1992 103.78
February 1992 102.13
March 1992 100.48
April 1992 100.46
May 1992 100.17
June 1992 100.01
July 1992 101.08
August 1992 102.87
September 1992 103.93
October 1992 105.38
November 1992 102.40
December 1992 100.21
January 1993 101.29
February 1993 102.35
March 1993 102.90
April 1993 102.40
May 1993 100.86
June 1993 99.52
Period Financial Stress Index
July 1993 99.20
August 1993 100.23
September 1993 101.40
October 1993 100.92
November 1993 100.48
December 1993 99.00
January 1994 99.62
February 1994 100.18
March 1994 101.62
April 1994 102.76
May 1994 101.97
June 1994 101.74
July 1994 101.61
August 1994 100.59
September 1994 100.53
October 1994 99.96
November 1994 100.19
December 1994 100.91
January 1995 100.50
February 1995 100.09
March 1995 100.76
April 1995 100.78
May 1995 101.94
June 1995 104.27
July 1995 104.04
August 1995 102.96
September 1995 102.98
October 1995 103.32
November 1995 103.56
December 1995 103.05
January 1996 103.54
February 1996 103.42
March 1996 103.77
April 1996 103.07
May 1996 101.42
June 1996 101.29
July 1996 101.50
Period Financial Stress Index
August 1996 100.98
September 1996 101.22
October 1996 101.67
November 1996 101.18
December 1996 101.17
January 1997 101.37
February 1997 101.11
March 1997 100.79
April 1997 100.55
May 1997 99.53
June 1997 100.12
July 1997 100.62
August 1997 101.35
September 1997 101.05
October 1997 102.65
November 1997 103.65
December 1997 102.29
January 1998 103.55
February 1998 102.68
March 1998 101.92
April 1998 102.10
May 1998 101.80
June 1998 101.91
July 1998 101.87
August 1998 104.09
September 1998 110.26
October 1998 115.66
November 1998 110.31
December 1998 109.19
January 1999 109.43
February 1999 107.41
March 1999 106.31
April 1999 105.27
May 1999 104.67
June 1999 104.38
July 1999 104.80
August 1999 106.28
Period Financial Stress Index
September 1999 106.76
October 1999 107.46
November 1999 105.52
December 1999 104.67
January 2000 103.94
February 2000 104.46
March 2000 105.13
April 2000 106.69
May 2000 106.39
June 2000 107.05
July 2000 107.03
August 2000 106.31
September 2000 106.48
October 2000 107.46
November 2000 106.78
December 2000 109.19
January 2001 109.59
February 2001 108.47
March 2001 109.63
April 2001 107.91
May 2001 106.86
June 2001 107.16
July 2001 106.82
August 2001 106.94
September 2001 109.99
October 2001 108.83
November 2001 107.94
December 2001 108.32
January 2002 107.23
February 2002 106.30
March 2002 105.14
April 2002 105.23
May 2002 105.15
June 2002 106.68
July 2002 109.94
August 2002 112.53
September 2002 113.81
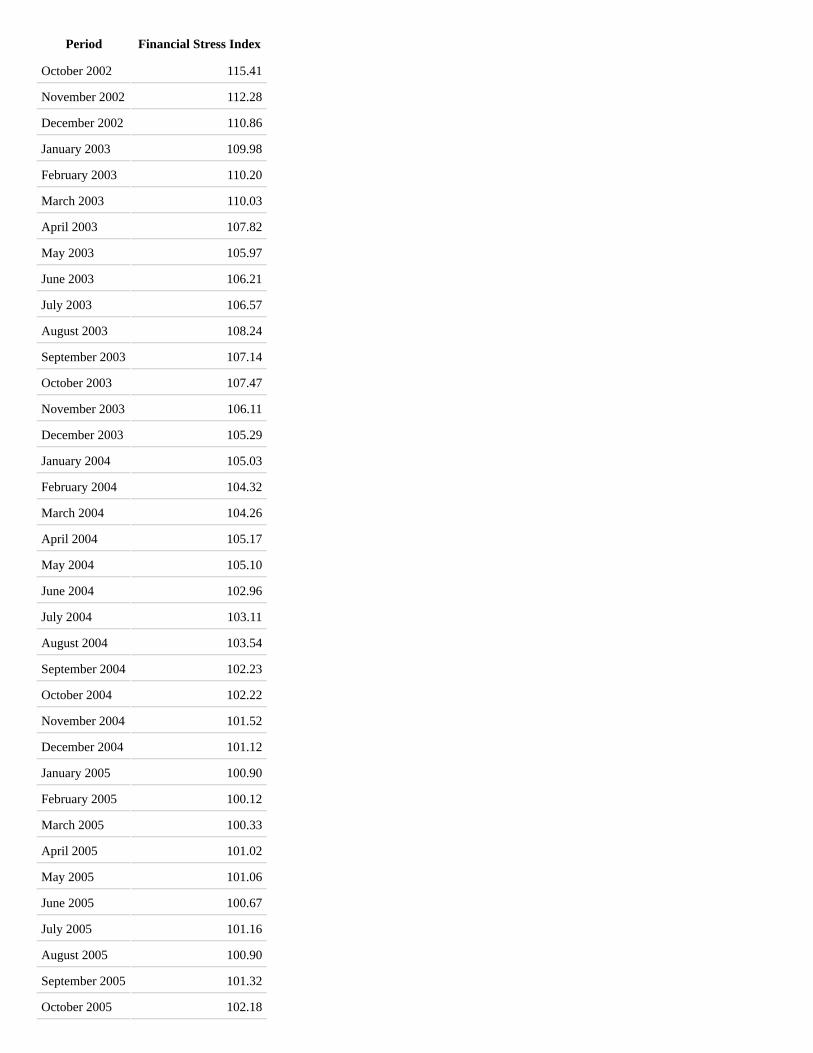
Period Financial Stress Index
October 2002 115.41
November 2002 112.28
December 2002 110.86
January 2003 109.98
February 2003 110.20
March 2003 110.03
April 2003 107.82
May 2003 105.97
June 2003 106.21
July 2003 106.57
August 2003 108.24
September 2003 107.14
October 2003 107.47
November 2003 106.11
December 2003 105.29
January 2004 105.03
February 2004 104.32
March 2004 104.26
April 2004 105.17
May 2004 105.10
June 2004 102.96
July 2004 103.11
August 2004 103.54
September 2004 102.23
October 2004 102.22
November 2004 101.52
December 2004 101.12
January 2005 100.90
February 2005 100.12
March 2005 100.33
April 2005 101.02
May 2005 101.06
June 2005 100.67
July 2005 101.16
August 2005 100.90
September 2005 101.32
October 2005 102.18
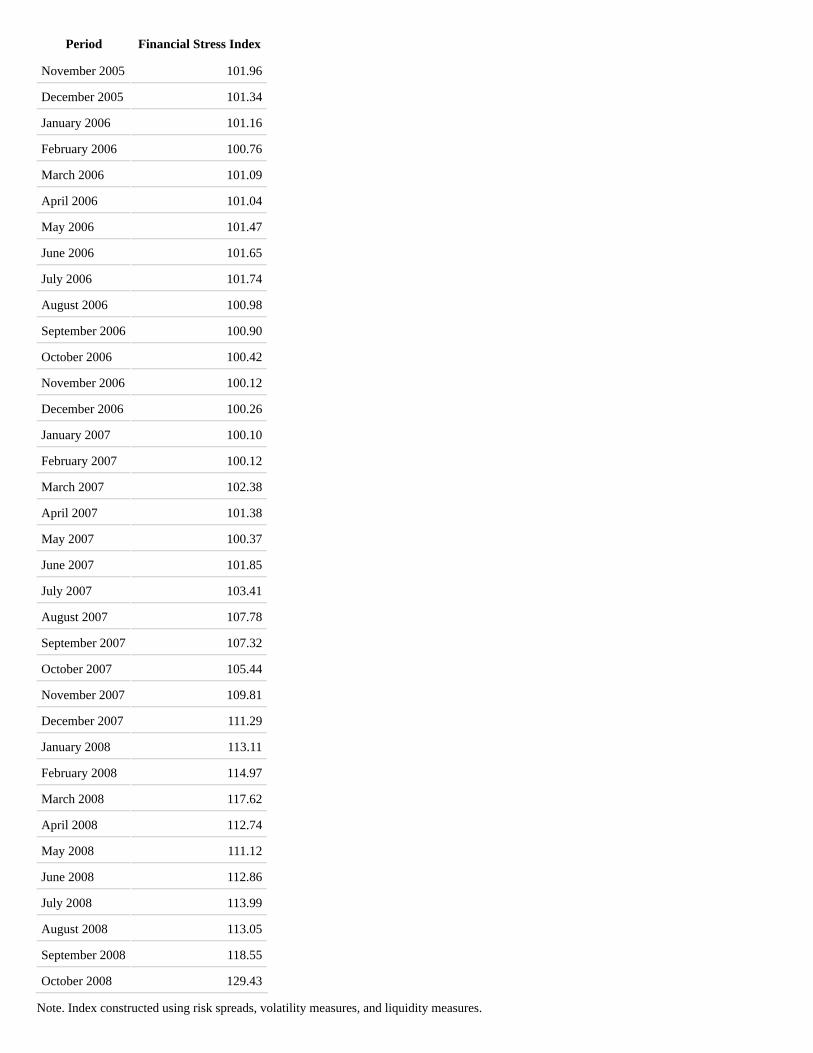
Period Financial Stress Index
November 2005 101.96
December 2005 101.34
January 2006 101.16
February 2006 100.76
March 2006 101.09
April 2006 101.04
May 2006 101.47
June 2006 101.65
July 2006 101.74
August 2006 100.98
September 2006 100.90
October 2006 100.42
November 2006 100.12
December 2006 100.26
January 2007 100.10
February 2007 100.12
March 2007 102.38
April 2007 101.38
May 2007 100.37
June 2007 101.85
July 2007 103.41
August 2007 107.78
September 2007 107.32
October 2007 105.44
November 2007 109.81
December 2007 111.29
January 2008 113.11
February 2008 114.97
March 2008 117.62
April 2008 112.74
May 2008 111.12
June 2008 112.86
July 2008 113.99
August 2008 113.05
September 2008 118.55
October 2008 129.43
Note. Index constructed using risk spreads, volatility measures, and liquidity measures.
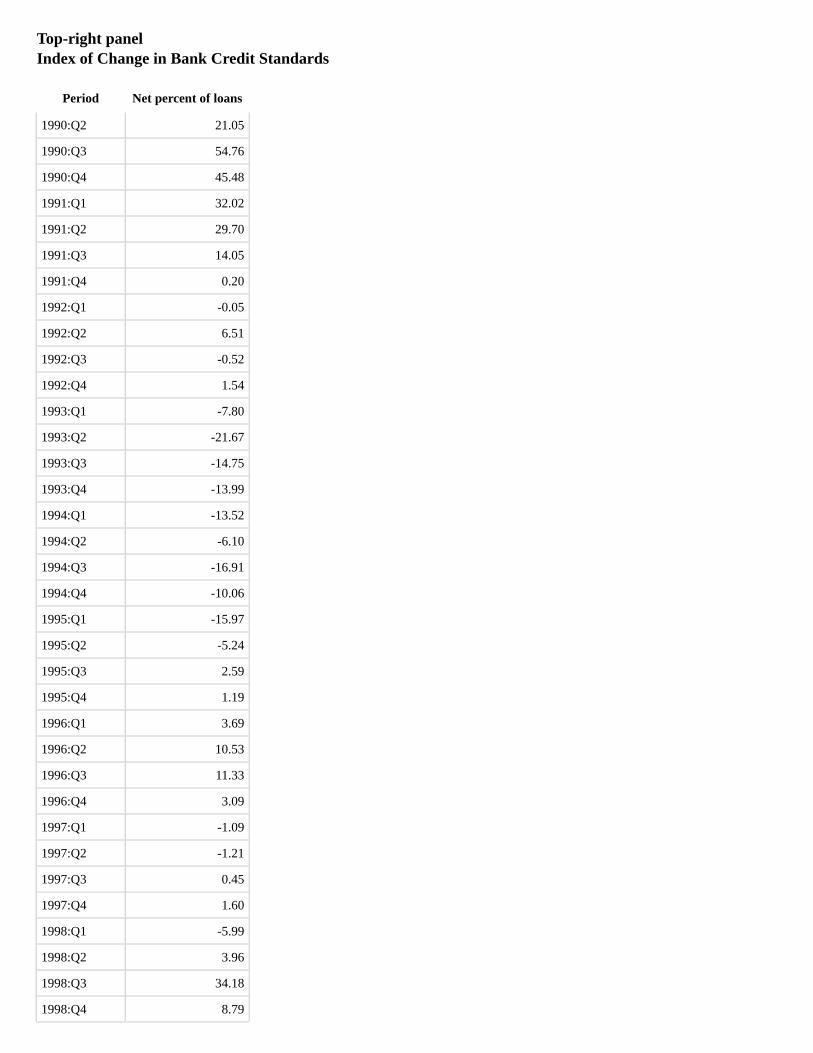
Top-right panelIndex of Change in Bank Credit Standards
Period Net percent of loans
1990:Q2 21.05
1990:Q3 54.76
1990:Q4 45.48
1991:Q1 32.02
1991:Q2 29.70
1991:Q3 14.05
1991:Q4 0.20
1992:Q1 -0.05
1992:Q2 6.51
1992:Q3 -0.52
1992:Q4 1.54
1993:Q1 -7.80
1993:Q2 -21.67
1993:Q3 -14.75
1993:Q4 -13.99
1994:Q1 -13.52
1994:Q2 -6.10
1994:Q3 -16.91
1994:Q4 -10.06
1995:Q1 -15.97
1995:Q2 -5.24
1995:Q3 2.59
1995:Q4 1.19
1996:Q1 3.69
1996:Q2 10.53
1996:Q3 11.33
1996:Q4 3.09
1997:Q1 -1.09
1997:Q2 -1.21
1997:Q3 0.45
1997:Q4 1.60
1998:Q1 -5.99
1998:Q2 3.96
1998:Q3 34.18
1998:Q4 8.79
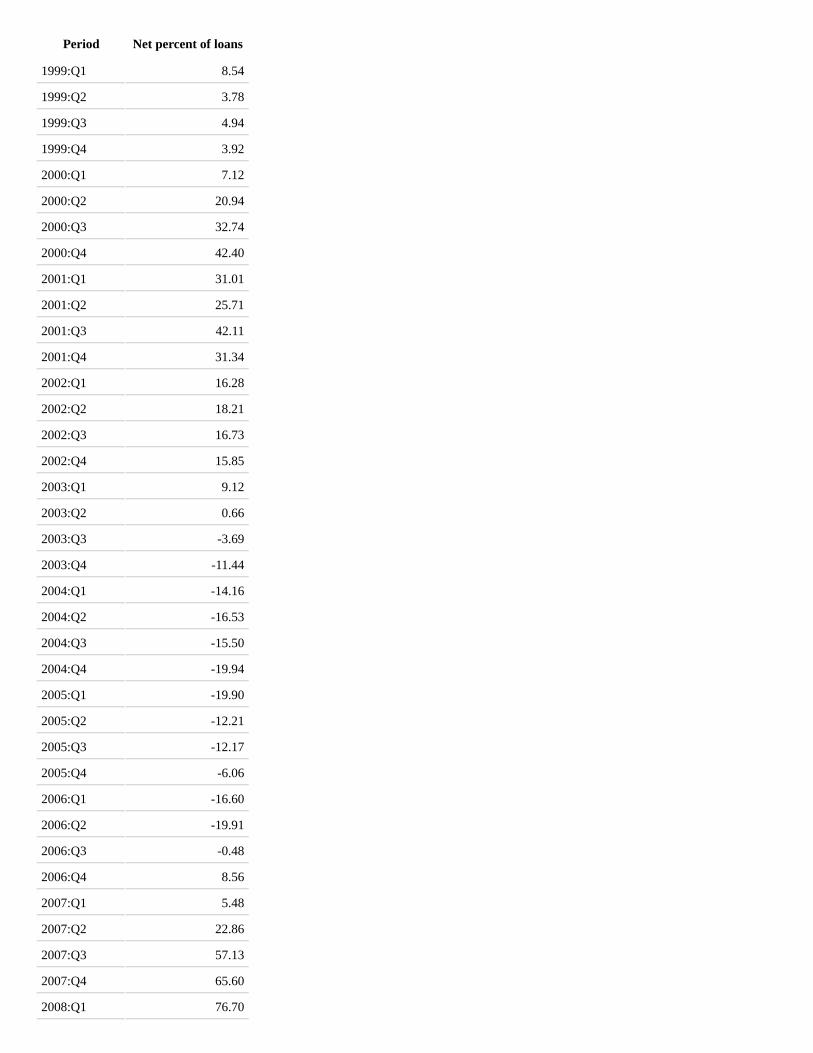
Period Net percent of loans
1999:Q1 8.54
1999:Q2 3.78
1999:Q3 4.94
1999:Q4 3.92
2000:Q1 7.12
2000:Q2 20.94
2000:Q3 32.74
2000:Q4 42.40
2001:Q1 31.01
2001:Q2 25.71
2001:Q3 42.11
2001:Q4 31.34
2002:Q1 16.28
2002:Q2 18.21
2002:Q3 16.73
2002:Q4 15.85
2003:Q1 9.12
2003:Q2 0.66
2003:Q3 -3.69
2003:Q4 -11.44
2004:Q1 -14.16
2004:Q2 -16.53
2004:Q3 -15.50
2004:Q4 -19.94
2005:Q1 -19.90
2005:Q2 -12.21
2005:Q3 -12.17
2005:Q4 -6.06
2006:Q1 -16.60
2006:Q2 -19.91
2006:Q3 -0.48
2006:Q4 8.56
2007:Q1 5.48
2007:Q2 22.86
2007:Q3 57.13
2007:Q4 65.60
2008:Q1 76.70
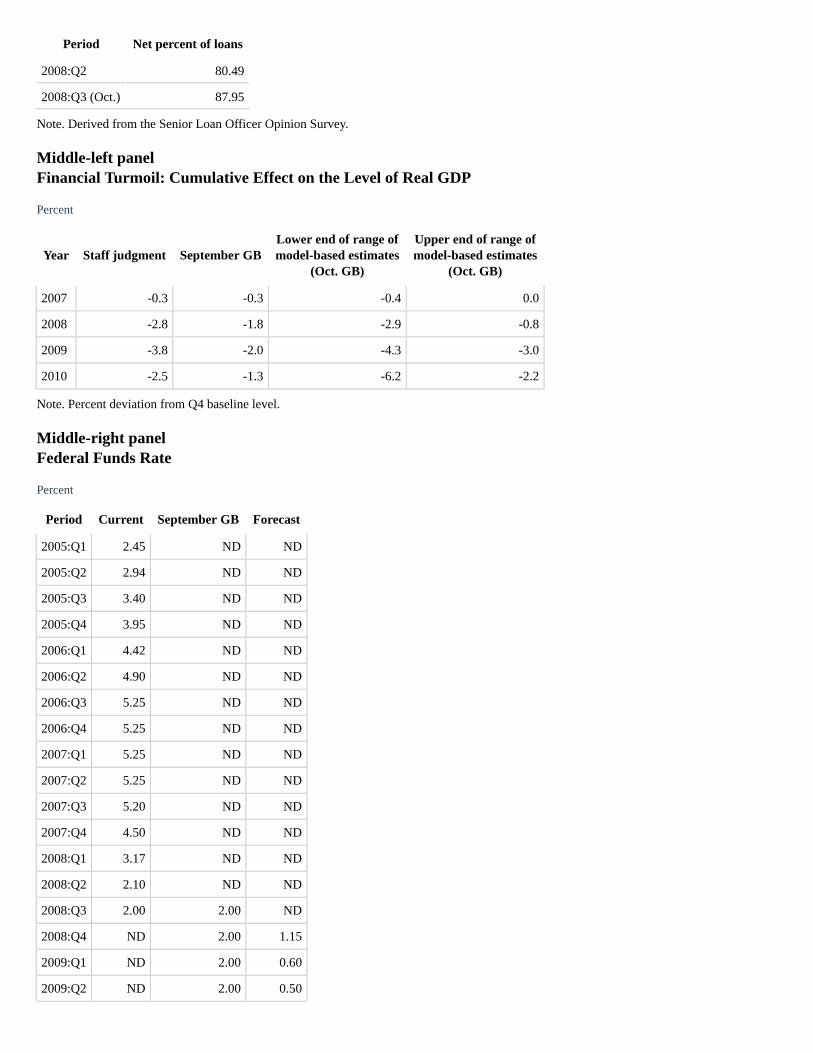
Period Net percent of loans
2008:Q2 80.49
2008:Q3 (Oct.) 87.95
Note. Derived from the Senior Loan Officer Opinion Survey.
Middle-left panelFinancial Turmoil: Cumulative Effect on the Level of Real GDP
Percent
Year Staff judgment September GBLower end of range ofmodel-based estimates
(Oct. GB)
Upper end of range ofmodel-based estimates
(Oct. GB)
2007 -0.3 -0.3 -0.4 0.0
2008 -2.8 -1.8 -2.9 -0.8
2009 -3.8 -2.0 -4.3 -3.0
2010 -2.5 -1.3 -6.2 -2.2
Note. Percent deviation from Q4 baseline level.
Middle-right panelFederal Funds Rate
Percent
Period Current September GB Forecast
2005:Q1 2.45 ND ND
2005:Q2 2.94 ND ND
2005:Q3 3.40 ND ND
2005:Q4 3.95 ND ND
2006:Q1 4.42 ND ND
2006:Q2 4.90 ND ND
2006:Q3 5.25 ND ND
2006:Q4 5.25 ND ND
2007:Q1 5.25 ND ND
2007:Q2 5.25 ND ND
2007:Q3 5.20 ND ND
2007:Q4 4.50 ND ND
2008:Q1 3.17 ND ND
2008:Q2 2.10 ND ND
2008:Q3 2.00 2.00 ND
2008:Q4 ND 2.00 1.15
2009:Q1 ND 2.00 0.60
2009:Q2 ND 2.00 0.50
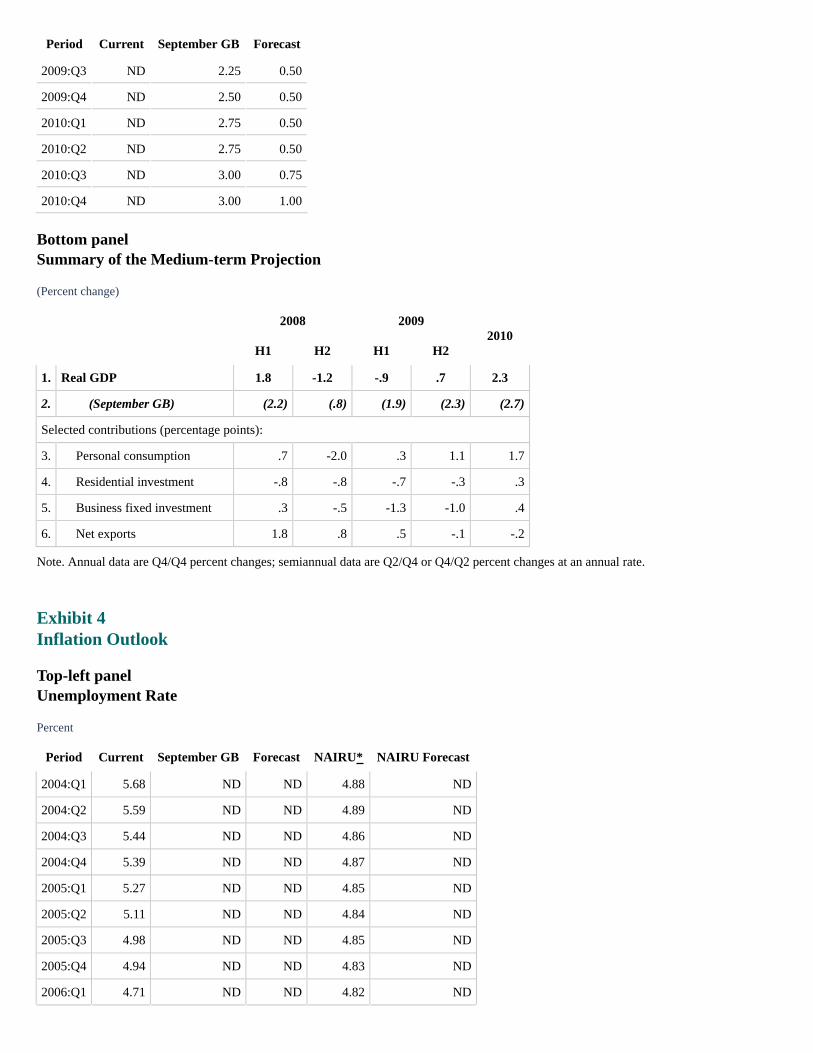
Period Current September GB Forecast
2009:Q3 ND 2.25 0.50
2009:Q4 ND 2.50 0.50
2010:Q1 ND 2.75 0.50
2010:Q2 ND 2.75 0.50
2010:Q3 ND 3.00 0.75
2010:Q4 ND 3.00 1.00
Bottom panelSummary of the Medium-term Projection
(Percent change)
2008 20092010
H1 H2 H1 H2
1. Real GDP 1.8 -1.2 -.9 .7 2.3
2. (September GB) (2.2) (.8) (1.9) (2.3) (2.7)
Selected contributions (percentage points):
3. Personal consumption .7 -2.0 .3 1.1 1.7
4. Residential investment -.8 -.8 -.7 -.3 .3
5. Business fixed investment .3 -.5 -1.3 -1.0 .4
6. Net exports 1.8 .8 .5 -.1 -.2
Note. Annual data are Q4/Q4 percent changes; semiannual data are Q2/Q4 or Q4/Q2 percent changes at an annual rate.
Exhibit 4Inflation Outlook
Top-left panelUnemployment Rate
Percent
Period Current September GB Forecast NAIRU* NAIRU Forecast
2004:Q1 5.68 ND ND 4.88 ND
2004:Q2 5.59 ND ND 4.89 ND
2004:Q3 5.44 ND ND 4.86 ND
2004:Q4 5.39 ND ND 4.87 ND
2005:Q1 5.27 ND ND 4.85 ND
2005:Q2 5.11 ND ND 4.84 ND
2005:Q3 4.98 ND ND 4.85 ND
2005:Q4 4.94 ND ND 4.83 ND
2006:Q1 4.71 ND ND 4.82 ND
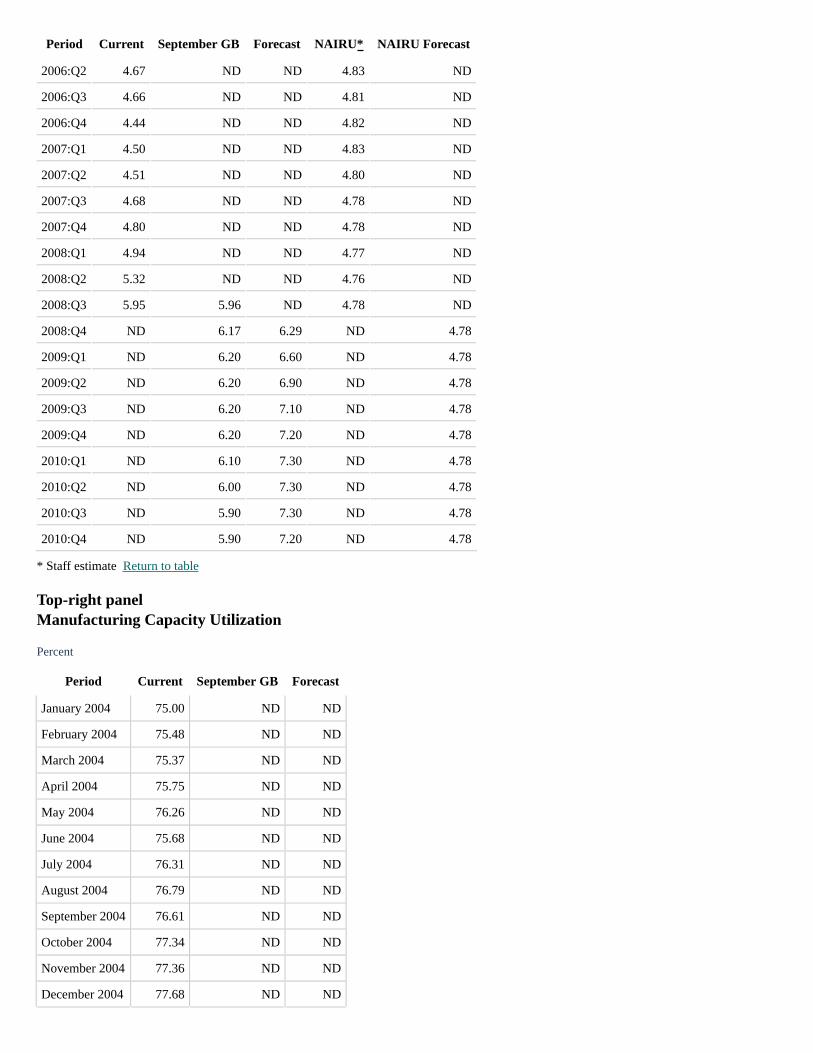
Period Current September GB Forecast NAIRU* NAIRU Forecast
2006:Q2 4.67 ND ND 4.83 ND
2006:Q3 4.66 ND ND 4.81 ND
2006:Q4 4.44 ND ND 4.82 ND
2007:Q1 4.50 ND ND 4.83 ND
2007:Q2 4.51 ND ND 4.80 ND
2007:Q3 4.68 ND ND 4.78 ND
2007:Q4 4.80 ND ND 4.78 ND
2008:Q1 4.94 ND ND 4.77 ND
2008:Q2 5.32 ND ND 4.76 ND
2008:Q3 5.95 5.96 ND 4.78 ND
2008:Q4 ND 6.17 6.29 ND 4.78
2009:Q1 ND 6.20 6.60 ND 4.78
2009:Q2 ND 6.20 6.90 ND 4.78
2009:Q3 ND 6.20 7.10 ND 4.78
2009:Q4 ND 6.20 7.20 ND 4.78
2010:Q1 ND 6.10 7.30 ND 4.78
2010:Q2 ND 6.00 7.30 ND 4.78
2010:Q3 ND 5.90 7.30 ND 4.78
2010:Q4 ND 5.90 7.20 ND 4.78
* Staff estimate Return to table
Top-right panelManufacturing Capacity Utilization
Percent
Period Current September GB Forecast
January 2004 75.00 ND ND
February 2004 75.48 ND ND
March 2004 75.37 ND ND
April 2004 75.75 ND ND
May 2004 76.26 ND ND
June 2004 75.68 ND ND
July 2004 76.31 ND ND
August 2004 76.79 ND ND
September 2004 76.61 ND ND
October 2004 77.34 ND ND
November 2004 77.36 ND ND
December 2004 77.68 ND ND
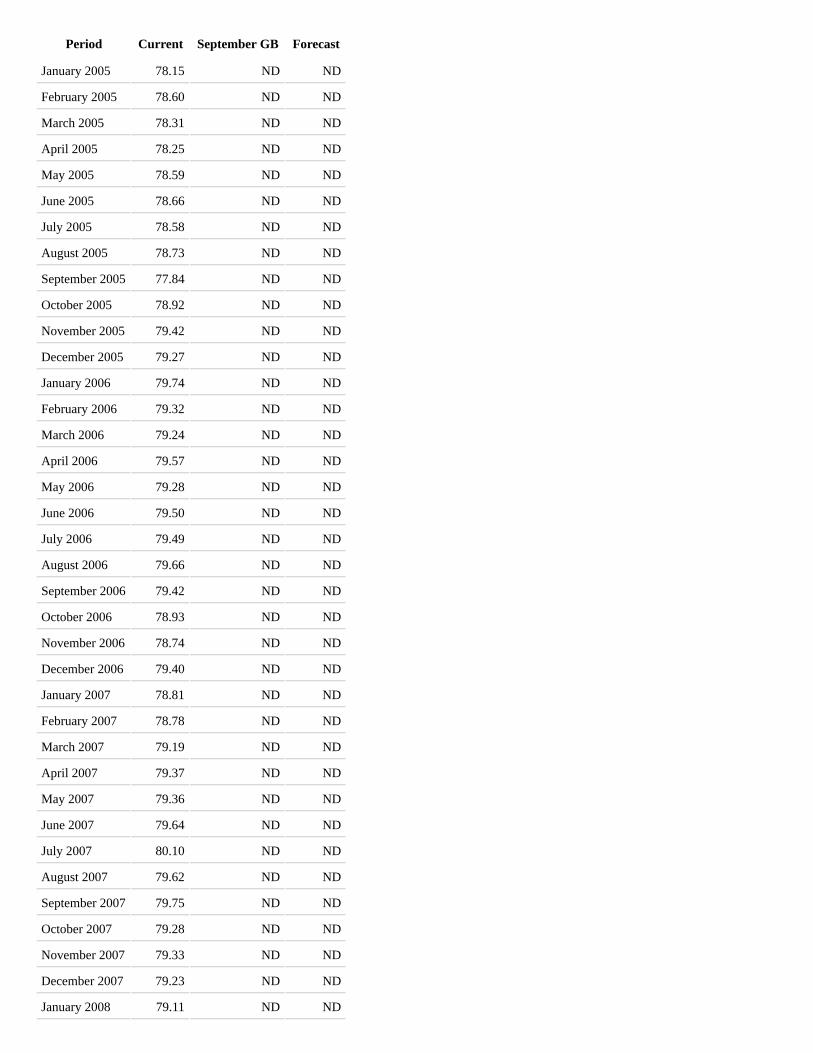
Period Current September GB Forecast
January 2005 78.15 ND ND
February 2005 78.60 ND ND
March 2005 78.31 ND ND
April 2005 78.25 ND ND
May 2005 78.59 ND ND
June 2005 78.66 ND ND
July 2005 78.58 ND ND
August 2005 78.73 ND ND
September 2005 77.84 ND ND
October 2005 78.92 ND ND
November 2005 79.42 ND ND
December 2005 79.27 ND ND
January 2006 79.74 ND ND
February 2006 79.32 ND ND
March 2006 79.24 ND ND
April 2006 79.57 ND ND
May 2006 79.28 ND ND
June 2006 79.50 ND ND
July 2006 79.49 ND ND
August 2006 79.66 ND ND
September 2006 79.42 ND ND
October 2006 78.93 ND ND
November 2006 78.74 ND ND
December 2006 79.40 ND ND
January 2007 78.81 ND ND
February 2007 78.78 ND ND
March 2007 79.19 ND ND
April 2007 79.37 ND ND
May 2007 79.36 ND ND
June 2007 79.64 ND ND
July 2007 80.10 ND ND
August 2007 79.62 ND ND
September 2007 79.75 ND ND
October 2007 79.28 ND ND
November 2007 79.33 ND ND
December 2007 79.23 ND ND
January 2008 79.11 ND ND
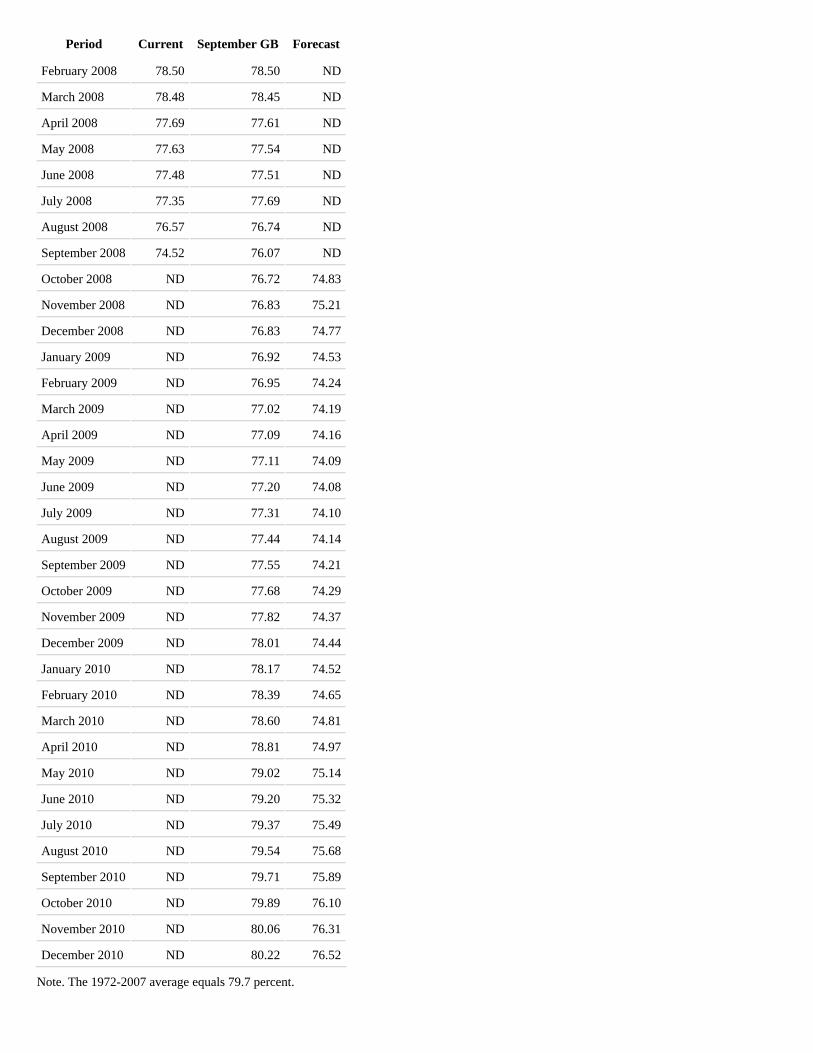
Period Current September GB Forecast
February 2008 78.50 78.50 ND
March 2008 78.48 78.45 ND
April 2008 77.69 77.61 ND
May 2008 77.63 77.54 ND
June 2008 77.48 77.51 ND
July 2008 77.35 77.69 ND
August 2008 76.57 76.74 ND
September 2008 74.52 76.07 ND
October 2008 ND 76.72 74.83
November 2008 ND 76.83 75.21
December 2008 ND 76.83 74.77
January 2009 ND 76.92 74.53
February 2009 ND 76.95 74.24
March 2009 ND 77.02 74.19
April 2009 ND 77.09 74.16
May 2009 ND 77.11 74.09
June 2009 ND 77.20 74.08
July 2009 ND 77.31 74.10
August 2009 ND 77.44 74.14
September 2009 ND 77.55 74.21
October 2009 ND 77.68 74.29
November 2009 ND 77.82 74.37
December 2009 ND 78.01 74.44
January 2010 ND 78.17 74.52
February 2010 ND 78.39 74.65
March 2010 ND 78.60 74.81
April 2010 ND 78.81 74.97
May 2010 ND 79.02 75.14
June 2010 ND 79.20 75.32
July 2010 ND 79.37 75.49
August 2010 ND 79.54 75.68
September 2010 ND 79.71 75.89
October 2010 ND 79.89 76.10
November 2010 ND 80.06 76.31
December 2010 ND 80.22 76.52
Note. The 1972-2007 average equals 79.7 percent.

Middle-left panelPCE Energy Prices
Four-quarter percent change
Period Current Forecast
2004:Q1 3.53 ND
2004:Q2 13.08 ND
2004:Q3 11.02 ND
2004:Q4 18.27 ND
2005:Q1 13.06 ND
2005:Q2 9.03 ND
2005:Q3 23.72 ND
2005:Q4 23.10 ND
2006:Q1 20.40 ND
2006:Q2 21.71 ND
2006:Q3 9.81 ND
2006:Q4 -3.98 ND
2007:Q1 0.47 ND
2007:Q2 4.05 ND
2007:Q3 1.23 ND
2007:Q4 19.08 ND
2008:Q1 20.05 ND
2008:Q2 19.69 ND
2008:Q3 27.46 ND
2008:Q4 ND -1.02
2009:Q1 ND -9.70
2009:Q2 ND -14.29
2009:Q3 ND -19.30
2009:Q4 ND -2.25
2010:Q1 ND 3.55
2010:Q2 ND 3.59
2010:Q3 ND 3.51
2010:Q4 ND 3.34
As shown in the figure, the September Greenbook curve begins just under 20 percent in 2008:Q2, and increases to about 28 byQ3. Entering the current forecast period, the curve decreases to about 11 by 2008:Q4, and again to about -6 by 2009:Q3. Itthen increases to about 2 by 2010:Q1, and ends at about 1 percent in 2010:Q4.
Middle-right panelCore Goods Import Prices

Four-quarter percent change
Period Current Forecast
2004:Q1 2.36 ND
2004:Q2 3.17 ND
2004:Q3 3.40 ND
2004:Q4 3.58 ND
2005:Q1 3.49 ND
2005:Q2 2.88 ND
2005:Q3 2.24 ND
2005:Q4 2.22 ND
2006:Q1 1.30 ND
2006:Q2 1.69 ND
2006:Q3 2.75 ND
2006:Q4 2.37 ND
2007:Q1 2.79 ND
2007:Q2 2.91 ND
2007:Q3 2.71 ND
2007:Q4 3.40 ND
2008:Q1 4.78 ND
2008:Q2 6.49 ND
2008:Q3 7.37 ND
2008:Q4 ND 5.55
2009:Q1 ND 2.25
2009:Q2 ND -0.26
2009:Q3 ND -1.65
2009:Q4 ND -0.54
2010:Q1 ND 1.00
2010:Q2 ND 1.35
2010:Q3 ND 1.55
2010:Q4 ND 1.53
As shown in the figure, the September Greenbook curve begins at about 6.5 percent in 2008:Q2, and increases to about 7.5 byQ3. Entering the current forecast period, the curve decreases to about 1 by 2009:Q4, and ends at about 1.25 percent in2010:Q4.
Note. Core goods imports exclude computers, semiconductors, oil, and natural gas.
Bottom-left panelMedian Expected Inflation: Reuters/Michigan
Percent
Period Next twelve months Next five to ten years
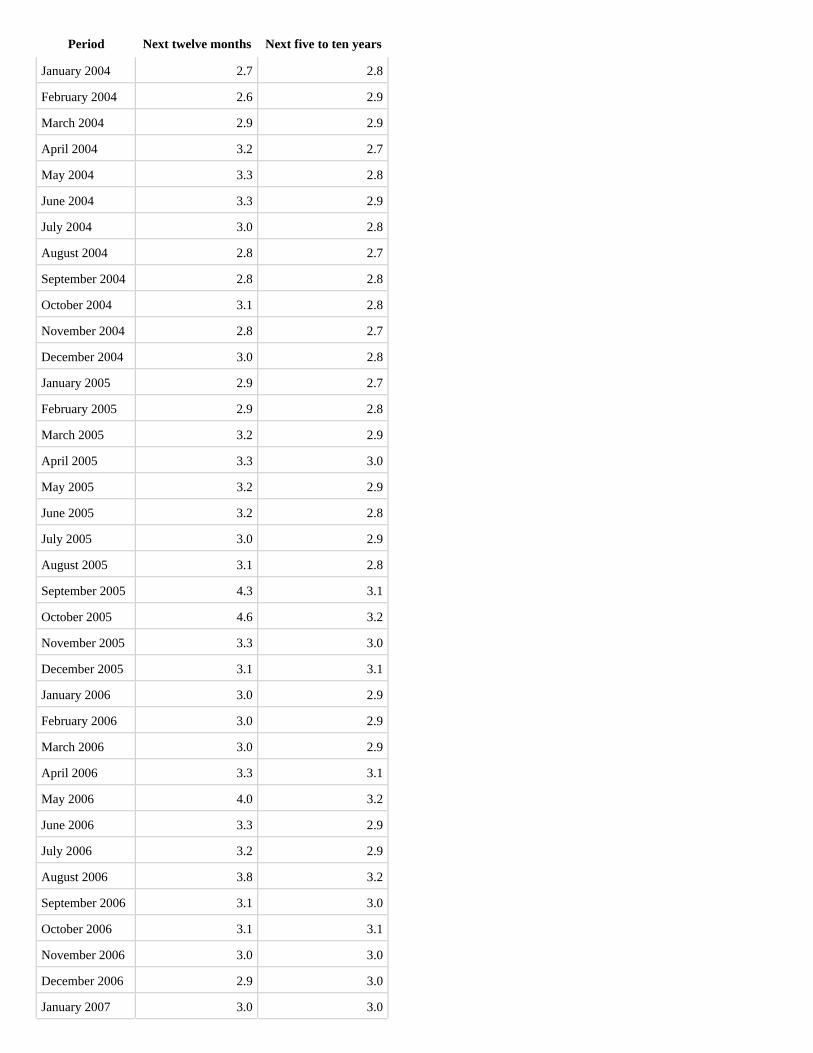
Period Next twelve months Next five to ten years
January 2004 2.7 2.8
February 2004 2.6 2.9
March 2004 2.9 2.9
April 2004 3.2 2.7
May 2004 3.3 2.8
June 2004 3.3 2.9
July 2004 3.0 2.8
August 2004 2.8 2.7
September 2004 2.8 2.8
October 2004 3.1 2.8
November 2004 2.8 2.7
December 2004 3.0 2.8
January 2005 2.9 2.7
February 2005 2.9 2.8
March 2005 3.2 2.9
April 2005 3.3 3.0
May 2005 3.2 2.9
June 2005 3.2 2.8
July 2005 3.0 2.9
August 2005 3.1 2.8
September 2005 4.3 3.1
October 2005 4.6 3.2
November 2005 3.3 3.0
December 2005 3.1 3.1
January 2006 3.0 2.9
February 2006 3.0 2.9
March 2006 3.0 2.9
April 2006 3.3 3.1
May 2006 4.0 3.2
June 2006 3.3 2.9
July 2006 3.2 2.9
August 2006 3.8 3.2
September 2006 3.1 3.0
October 2006 3.1 3.1
November 2006 3.0 3.0
December 2006 2.9 3.0
January 2007 3.0 3.0
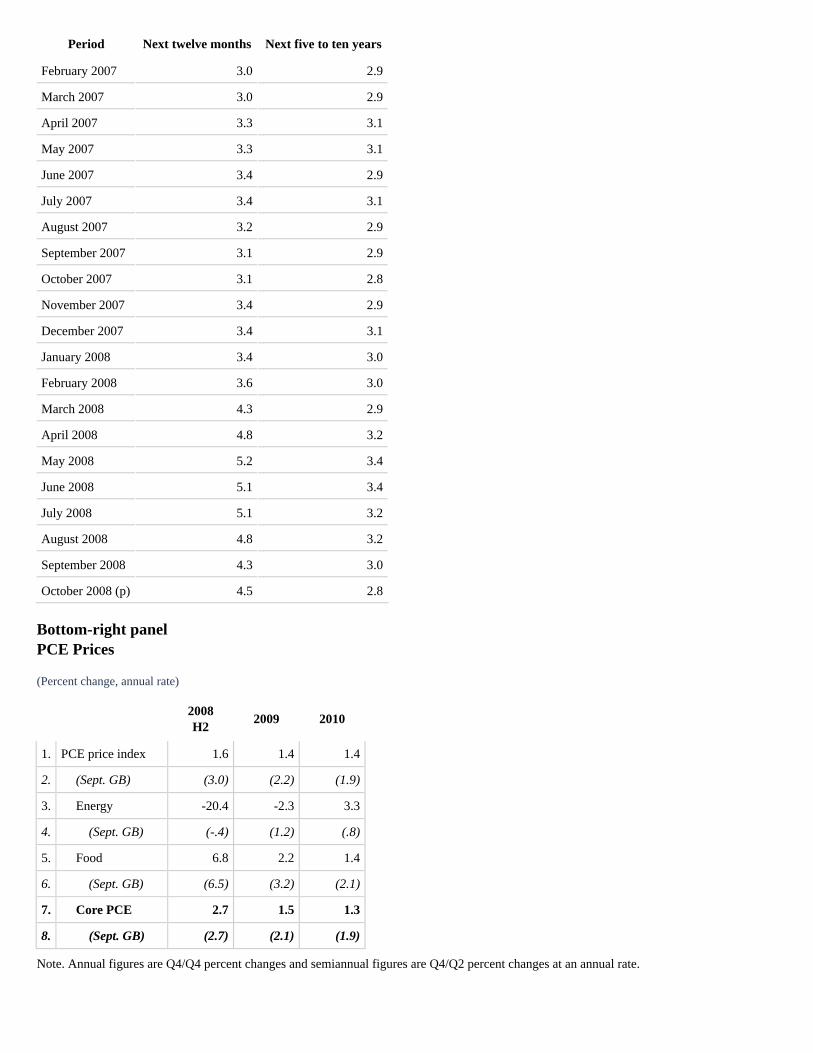
Period Next twelve months Next five to ten years
February 2007 3.0 2.9
March 2007 3.0 2.9
April 2007 3.3 3.1
May 2007 3.3 3.1
June 2007 3.4 2.9
July 2007 3.4 3.1
August 2007 3.2 2.9
September 2007 3.1 2.9
October 2007 3.1 2.8
November 2007 3.4 2.9
December 2007 3.4 3.1
January 2008 3.4 3.0
February 2008 3.6 3.0
March 2008 4.3 2.9
April 2008 4.8 3.2
May 2008 5.2 3.4
June 2008 5.1 3.4
July 2008 5.1 3.2
August 2008 4.8 3.2
September 2008 4.3 3.0
October 2008 (p) 4.5 2.8
Bottom-right panelPCE Prices
(Percent change, annual rate)
2008H2
2009 2010
1. PCE price index 1.6 1.4 1.4
2. (Sept. GB) (3.0) (2.2) (1.9)
3. Energy -20.4 -2.3 3.3
4. (Sept. GB) (-.4) (1.2) (.8)
5. Food 6.8 2.2 1.4
6. (Sept. GB) (6.5) (3.2) (2.1)
7. Core PCE 2.7 1.5 1.3
8. (Sept. GB) (2.7) (2.1) (1.9)
Note. Annual figures are Q4/Q4 percent changes and semiannual figures are Q4/Q2 percent changes at an annual rate.
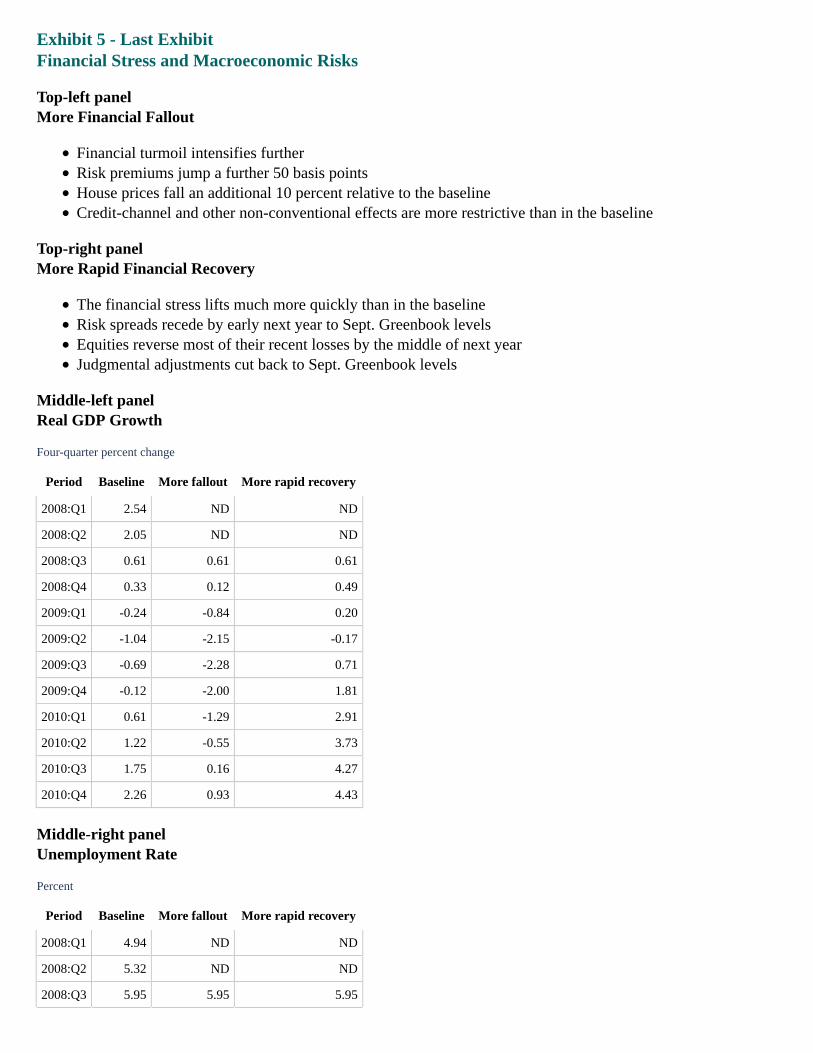
Exhibit 5 - Last ExhibitFinancial Stress and Macroeconomic Risks
Top-left panelMore Financial Fallout
Financial turmoil intensifies furtherRisk premiums jump a further 50 basis pointsHouse prices fall an additional 10 percent relative to the baselineCredit-channel and other non-conventional effects are more restrictive than in the baseline
Top-right panelMore Rapid Financial Recovery
The financial stress lifts much more quickly than in the baselineRisk spreads recede by early next year to Sept. Greenbook levelsEquities reverse most of their recent losses by the middle of next yearJudgmental adjustments cut back to Sept. Greenbook levels
Middle-left panelReal GDP Growth
Four-quarter percent change
Period Baseline More fallout More rapid recovery
2008:Q1 2.54 ND ND
2008:Q2 2.05 ND ND
2008:Q3 0.61 0.61 0.61
2008:Q4 0.33 0.12 0.49
2009:Q1 -0.24 -0.84 0.20
2009:Q2 -1.04 -2.15 -0.17
2009:Q3 -0.69 -2.28 0.71
2009:Q4 -0.12 -2.00 1.81
2010:Q1 0.61 -1.29 2.91
2010:Q2 1.22 -0.55 3.73
2010:Q3 1.75 0.16 4.27
2010:Q4 2.26 0.93 4.43
Middle-right panelUnemployment Rate
Percent
Period Baseline More fallout More rapid recovery
2008:Q1 4.94 ND ND
2008:Q2 5.32 ND ND
2008:Q3 5.95 5.95 5.95
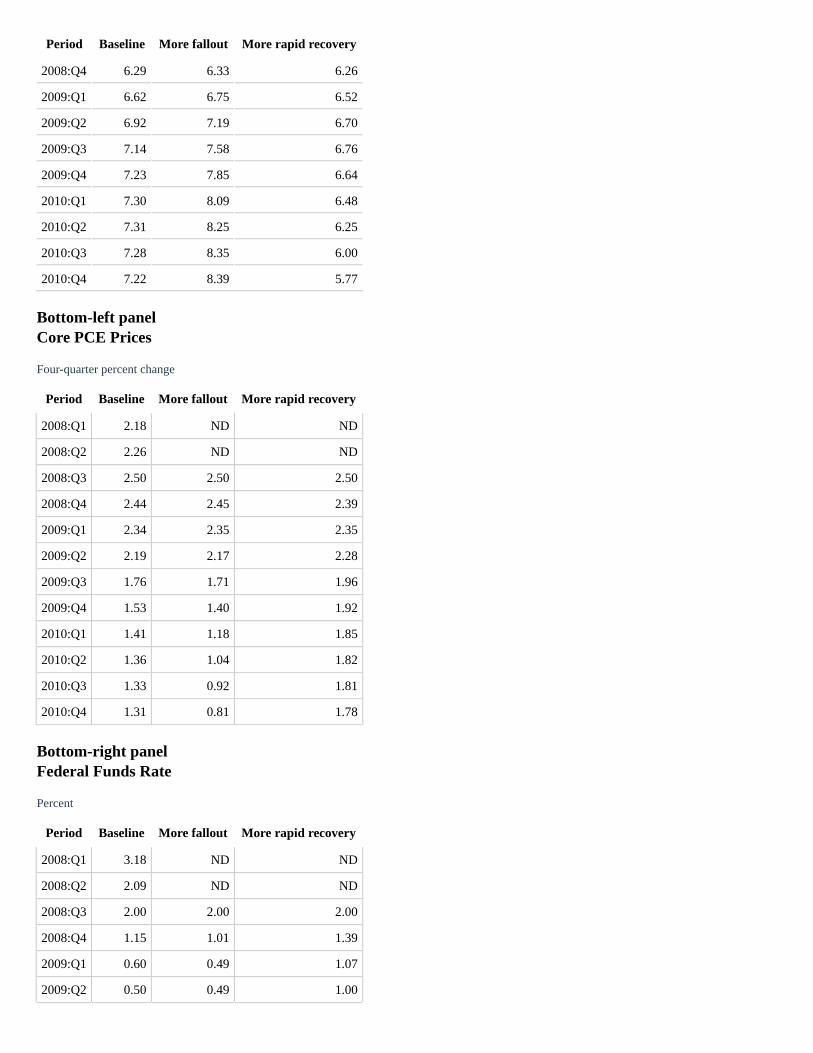
Period Baseline More fallout More rapid recovery
2008:Q4 6.29 6.33 6.26
2009:Q1 6.62 6.75 6.52
2009:Q2 6.92 7.19 6.70
2009:Q3 7.14 7.58 6.76
2009:Q4 7.23 7.85 6.64
2010:Q1 7.30 8.09 6.48
2010:Q2 7.31 8.25 6.25
2010:Q3 7.28 8.35 6.00
2010:Q4 7.22 8.39 5.77
Bottom-left panelCore PCE Prices
Four-quarter percent change
Period Baseline More fallout More rapid recovery
2008:Q1 2.18 ND ND
2008:Q2 2.26 ND ND
2008:Q3 2.50 2.50 2.50
2008:Q4 2.44 2.45 2.39
2009:Q1 2.34 2.35 2.35
2009:Q2 2.19 2.17 2.28
2009:Q3 1.76 1.71 1.96
2009:Q4 1.53 1.40 1.92
2010:Q1 1.41 1.18 1.85
2010:Q2 1.36 1.04 1.82
2010:Q3 1.33 0.92 1.81
2010:Q4 1.31 0.81 1.78
Bottom-right panelFederal Funds Rate
Percent
Period Baseline More fallout More rapid recovery
2008:Q1 3.18 ND ND
2008:Q2 2.09 ND ND
2008:Q3 2.00 2.00 2.00
2008:Q4 1.15 1.01 1.39
2009:Q1 0.60 0.49 1.07
2009:Q2 0.50 0.49 1.00

Period Baseline More fallout More rapid recovery
2009:Q3 0.50 0.49 1.13
2009:Q4 0.50 0.49 1.43
2010:Q1 0.50 0.49 1.82
2010:Q2 0.50 0.49 2.26
2010:Q3 0.75 0.49 2.73
2010:Q4 1.00 0.49 3.19
Appendix 4: Materials used by Ms. Kole
Material for Staff Presentation on The International OutlookOctober 28, 2008
Class II FOMC - Restricted (FR)
Exhibit 1Global Financial Developments
(Weekly Data)
Equity Prices
Top-left panelAdvanced Economies
A line chart describes the movement in equity prices for Europe (DJ Euro Stoxx), the UnitedKingdom (FTSE 350), the United States (S&P 500), and Japan (Nikkei) with the data indexed toJanuary 5, 2007. The y-axis is the index ranging from 40 to 160, and the x-axis is weekly showingdata from Friday -- the x-axis ranges from 2007 to 2008. All of the equity indexes shown weresteadily declining starting in mid-2007. However, starting in late 2008 the equity prices fell sharply.
Top-right panelEmerging Markets
A line chart describes the movement in the emerging market equity prices, specifically the LatinAmerican MSCI and the Emerging Asia MSCI with the data indexed to January 5, 2007. The y-axisis the index ranging from 40 to 160, and the x-axis is weekly showing data from Friday -- the x-axisranges from 2007 to 2008. Over the last two years the Emerging Asia MSCI and the Latin AmericanMSCI series were steadily increasing relative to the index date, but, starting in mid-2008 the equityprices in the emerging markets fell sharply.
Credit Spreads
Middle-left panel10-year BBB Corporate
A line chart describes the movement in credit spreads of 10-year BBB corporate bonds in the US,Japan, euro area, and the UK. The y-axis is in basis points ranging from 0 to 600, and the x-axisranges from 2007 to 2008. The credit spreads between industrial countries' risky corporates and
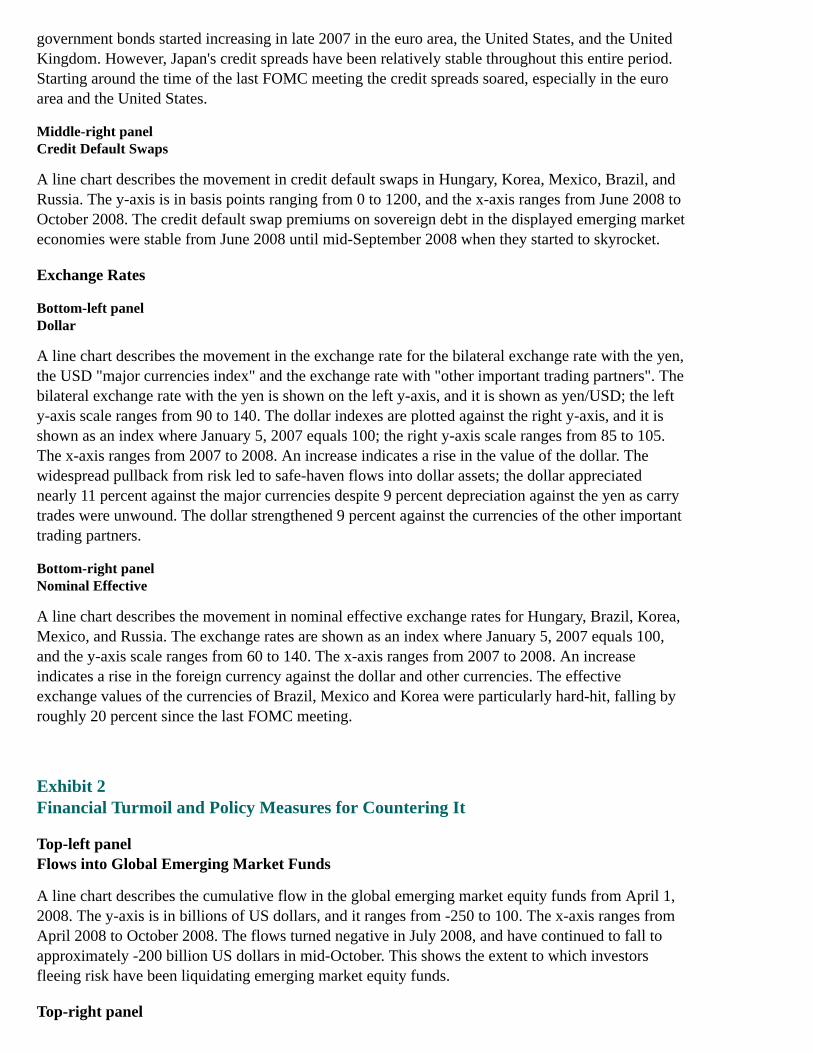
government bonds started increasing in late 2007 in the euro area, the United States, and the UnitedKingdom. However, Japan's credit spreads have been relatively stable throughout this entire period.Starting around the time of the last FOMC meeting the credit spreads soared, especially in the euroarea and the United States.
Middle-right panelCredit Default Swaps
A line chart describes the movement in credit default swaps in Hungary, Korea, Mexico, Brazil, andRussia. The y-axis is in basis points ranging from 0 to 1200, and the x-axis ranges from June 2008 toOctober 2008. The credit default swap premiums on sovereign debt in the displayed emerging marketeconomies were stable from June 2008 until mid-September 2008 when they started to skyrocket.
Exchange Rates
Bottom-left panelDollar
A line chart describes the movement in the exchange rate for the bilateral exchange rate with the yen,the USD "major currencies index" and the exchange rate with "other important trading partners". Thebilateral exchange rate with the yen is shown on the left y-axis, and it is shown as yen/USD; the lefty-axis scale ranges from 90 to 140. The dollar indexes are plotted against the right y-axis, and it isshown as an index where January 5, 2007 equals 100; the right y-axis scale ranges from 85 to 105.The x-axis ranges from 2007 to 2008. An increase indicates a rise in the value of the dollar. Thewidespread pullback from risk led to safe-haven flows into dollar assets; the dollar appreciatednearly 11 percent against the major currencies despite 9 percent depreciation against the yen as carrytrades were unwound. The dollar strengthened 9 percent against the currencies of the other importanttrading partners.
Bottom-right panelNominal Effective
A line chart describes the movement in nominal effective exchange rates for Hungary, Brazil, Korea,Mexico, and Russia. The exchange rates are shown as an index where January 5, 2007 equals 100,and the y-axis scale ranges from 60 to 140. The x-axis ranges from 2007 to 2008. An increaseindicates a rise in the foreign currency against the dollar and other currencies. The effectiveexchange values of the currencies of Brazil, Mexico and Korea were particularly hard-hit, falling byroughly 20 percent since the last FOMC meeting.
Exhibit 2Financial Turmoil and Policy Measures for Countering It
Top-left panelFlows into Global Emerging Market Funds
A line chart describes the cumulative flow in the global emerging market equity funds from April 1,2008. The y-axis is in billions of US dollars, and it ranges from -250 to 100. The x-axis ranges fromApril 2008 to October 2008. The flows turned negative in July 2008, and have continued to fall toapproximately -200 billion US dollars in mid-October. This shows the extent to which investorsfleeing risk have been liquidating emerging market equity funds.
Top-right panel

Foreign Reserves
A line chart describes the movement in foreign reserves held by Mexico, Brazil, Korea, and Russia.The y-axis is split into two scales. The foreign reserves held by Russia are shown on the left y-axisranging from 150 to 600 billion US dollars. The foreign reserves for Mexico, Brazil, and Korea areshown on the right y-axis ranging from $0 to $300 billion. The x-axis ranges from January 2006through 2008. Several foreign governments, notably Russia's, have fought related currency pressuresby drawing down their reserves to roughly 250, down from the peak of nearly $300 billion inmid-2008. Since the peso fell sharply against the dollar in early October, the Bank of Mexico hasdeployed 15 percent of its reserves to shore up its value. Korea's reserves increased steadily startingin 2006 with the peak of roughly $250 billion in early 2008; they have been tapering off over theremainder of the year. Brazil's reserves have doubled over the past two years, and in October 2008they stand at roughly $200 billion.
Middle panelBanking System Support and Financial Stability Measures
Some central banks have injected massive amounts of liquidity and many have cut rates and/orreserve requirements including:
US, ECB, UK, Canada, Switzerland, Sweden, Norway, Australia, New Zealand, China,Hong Kong, Taiwan, Korea, Singapore, India, and Brazil.
Governments have guaranteed bank deposits and new debt.Public capital injections into banks.Swap lines have been expanded and new ones are being negotiated.Hungary, Ukraine, Iceland, and Pakistan have approached the IMF for a loan.
Bottom-left panelCDS Premiums - Banks
A line chart describes the movement in Markit's median credit default swap premiums for banks inthe US, the UK, and Europe excluding the UK. The y-axis ranges from 60 to 300 basis points, andthe x-axis ranges from September 2008 to October 2008. There was a marked increase in the spreadsaround the time of the last FOMC meeting in all of the countries shown. However, they all startedexperiencing declines in the beginning of October. This suggests that the announcement of thebanking system support and financial stability measures by central banks improved confidence inbanks' safety, even if they have not restored confidence in broader economic prospects.
Source: Markit.
Bottom-center panelImplied OIS Forward Rates
A line chart describes the movement in implied OIS forward rates (allowing for term premiums) forthe euro area and the UK with vintages from the September FOMC and the October FOMC. They-axis ranges from 2.0 percent to 5.0 percent, and the x-axis ranges from September 2008 to Dec2009. The implied OIS forward rates for the UK and the euro area from the October FOMC vintageare down by about 1 percent when compared to the implied OIS forward rates from the SeptemberFOMC vintage. The market participants expect considerably more monetary policy easing in Europethan they did at the time of the last FOMC meeting.
Bottom-right panelPolicy Rates
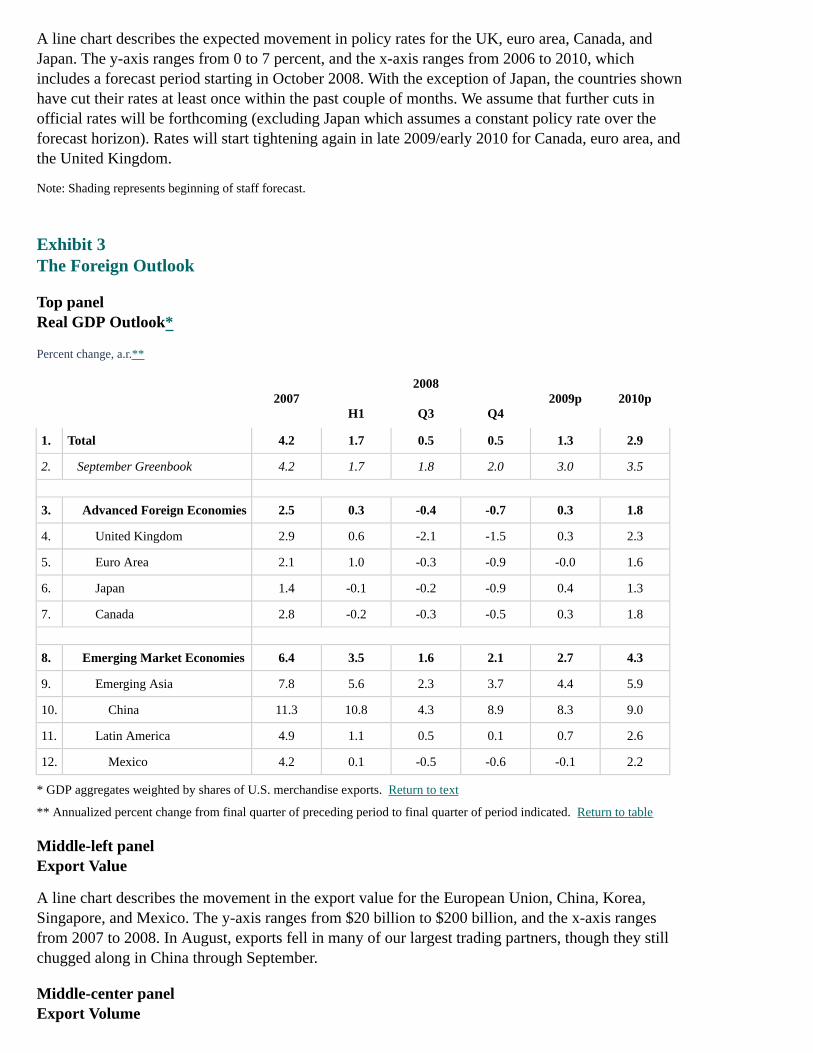
A line chart describes the expected movement in policy rates for the UK, euro area, Canada, andJapan. The y-axis ranges from 0 to 7 percent, and the x-axis ranges from 2006 to 2010, whichincludes a forecast period starting in October 2008. With the exception of Japan, the countries shownhave cut their rates at least once within the past couple of months. We assume that further cuts inofficial rates will be forthcoming (excluding Japan which assumes a constant policy rate over theforecast horizon). Rates will start tightening again in late 2009/early 2010 for Canada, euro area, andthe United Kingdom.
Note: Shading represents beginning of staff forecast.
Exhibit 3The Foreign Outlook
Top panelReal GDP Outlook*
Percent change, a.r.**
20072008
2009p 2010pH1 Q3 Q4
1. Total 4.2 1.7 0.5 0.5 1.3 2.9
2. September Greenbook 4.2 1.7 1.8 2.0 3.0 3.5
3. Advanced Foreign Economies 2.5 0.3 -0.4 -0.7 0.3 1.8
4. United Kingdom 2.9 0.6 -2.1 -1.5 0.3 2.3
5. Euro Area 2.1 1.0 -0.3 -0.9 -0.0 1.6
6. Japan 1.4 -0.1 -0.2 -0.9 0.4 1.3
7. Canada 2.8 -0.2 -0.3 -0.5 0.3 1.8
8. Emerging Market Economies 6.4 3.5 1.6 2.1 2.7 4.3
9. Emerging Asia 7.8 5.6 2.3 3.7 4.4 5.9
10. China 11.3 10.8 4.3 8.9 8.3 9.0
11. Latin America 4.9 1.1 0.5 0.1 0.7 2.6
12. Mexico 4.2 0.1 -0.5 -0.6 -0.1 2.2
* GDP aggregates weighted by shares of U.S. merchandise exports. Return to text
** Annualized percent change from final quarter of preceding period to final quarter of period indicated. Return to table
Middle-left panelExport Value
A line chart describes the movement in the export value for the European Union, China, Korea,Singapore, and Mexico. The y-axis ranges from $20 billion to $200 billion, and the x-axis rangesfrom 2007 to 2008. In August, exports fell in many of our largest trading partners, though they stillchugged along in China through September.
Middle-center panelExport Volume
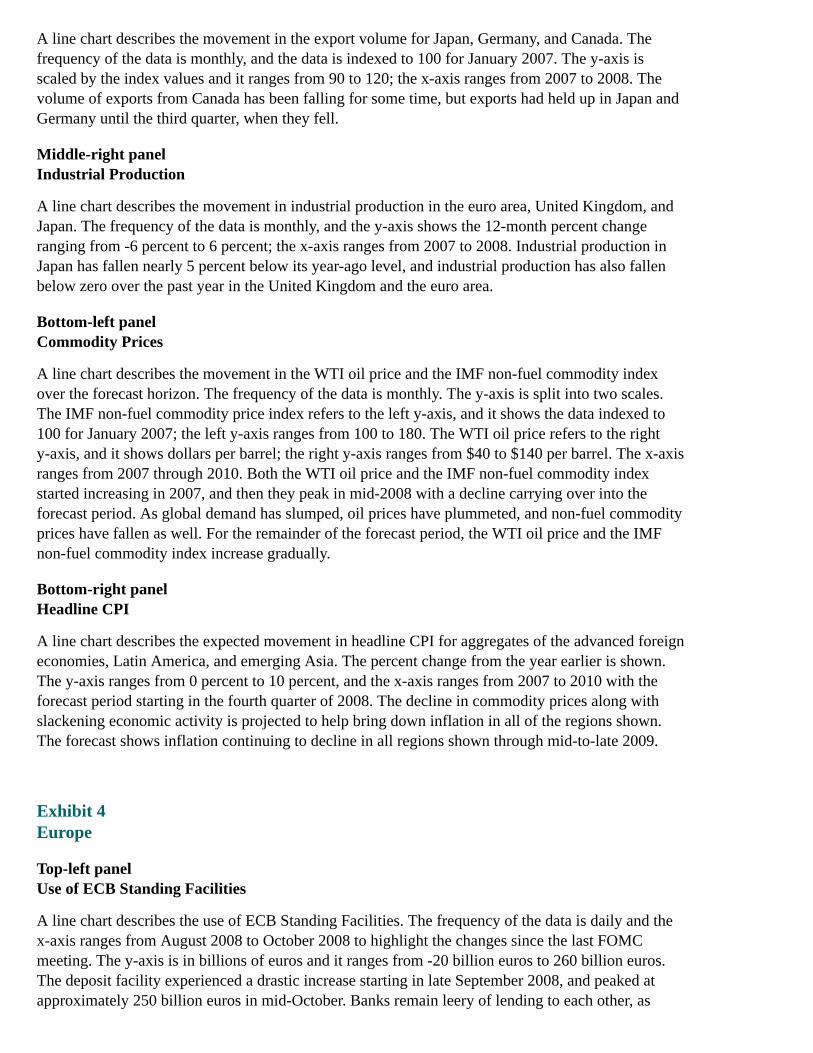
A line chart describes the movement in the export volume for Japan, Germany, and Canada. Thefrequency of the data is monthly, and the data is indexed to 100 for January 2007. The y-axis isscaled by the index values and it ranges from 90 to 120; the x-axis ranges from 2007 to 2008. Thevolume of exports from Canada has been falling for some time, but exports had held up in Japan andGermany until the third quarter, when they fell.
Middle-right panelIndustrial Production
A line chart describes the movement in industrial production in the euro area, United Kingdom, andJapan. The frequency of the data is monthly, and the y-axis shows the 12-month percent changeranging from -6 percent to 6 percent; the x-axis ranges from 2007 to 2008. Industrial production inJapan has fallen nearly 5 percent below its year-ago level, and industrial production has also fallenbelow zero over the past year in the United Kingdom and the euro area.
Bottom-left panelCommodity Prices
A line chart describes the movement in the WTI oil price and the IMF non-fuel commodity indexover the forecast horizon. The frequency of the data is monthly. The y-axis is split into two scales.The IMF non-fuel commodity price index refers to the left y-axis, and it shows the data indexed to100 for January 2007; the left y-axis ranges from 100 to 180. The WTI oil price refers to the righty-axis, and it shows dollars per barrel; the right y-axis ranges from $40 to $140 per barrel. The x-axisranges from 2007 through 2010. Both the WTI oil price and the IMF non-fuel commodity indexstarted increasing in 2007, and then they peak in mid-2008 with a decline carrying over into theforecast period. As global demand has slumped, oil prices have plummeted, and non-fuel commodityprices have fallen as well. For the remainder of the forecast period, the WTI oil price and the IMFnon-fuel commodity index increase gradually.
Bottom-right panelHeadline CPI
A line chart describes the expected movement in headline CPI for aggregates of the advanced foreigneconomies, Latin America, and emerging Asia. The percent change from the year earlier is shown.The y-axis ranges from 0 percent to 10 percent, and the x-axis ranges from 2007 to 2010 with theforecast period starting in the fourth quarter of 2008. The decline in commodity prices along withslackening economic activity is projected to help bring down inflation in all of the regions shown.The forecast shows inflation continuing to decline in all regions shown through mid-to-late 2009.
Exhibit 4Europe
Top-left panelUse of ECB Standing Facilities
A line chart describes the use of ECB Standing Facilities. The frequency of the data is daily and thex-axis ranges from August 2008 to October 2008 to highlight the changes since the last FOMCmeeting. The y-axis is in billions of euros and it ranges from -20 billion euros to 260 billion euros.The deposit facility experienced a drastic increase starting in late September 2008, and peaked atapproximately 250 billion euros in mid-October. Banks remain leery of lending to each other, as

evidenced by the growing amount of funds parked at the ECB's deposit facility. The marginal lendingfacility also experienced an increase in late September, and in October fluctuated within the range ofabout 8 to 25 billion euros.
Top-right panelBank of England Credit Conditions Survey
A bar chart describes the movement in Bank of England credit conditions survey. The y-axis shows apercent balance of opinions (with a positive response indicating reduced credit availability), and itranges from -10 to 60. The frequency of the data is quarterly and the x-axis ranges from 2007:Q2 to2008:Q4, where the fourth quarter expectations formed in early September. The latest BOE banklending survey pointed to further tightening of U.K. household and corporate lending standards in thethird quarter and suggested that banks expected to tighten them somewhat further in the fourthquarter. Notably, this survey was taken before Lehman failed. A confidential conversation with acontact at the BOE who had talked with a few bankers more recently suggested that the latest surveyconsiderably underestimated the recent tightening of standards.
Middle-left panelUnited Kingdom Loans
A line chart describes the movement in United Kingdom loans to nonfinancial corporations andhouseholds. The frequency of the data is quarterly, and the x-axis shows 2006:Q1 through 2008:Q3(staff estimate). The y-axis shows the annualized quarter-over-quarter percent change, and it rangesfrom 0 percent to 25 percent. The quarterly growth of U.K. loans to nonfinancial corporations fellfrom double-digit paces for the past two years to 5 percent in the third quarter. Credit expansion tohouseholds declined as well.
Middle-center panelEuro Area Loans
A line chart describes the movement in euro area loans to nonfinancial corporations and households.The y-axis shows the annualized quarter-over-quarter percent change, and the range goes from 0percent to 25 percent. The x-axis shows 2006:Q1 through 2008:Q3. Loan growth to households andnonfinancial corporations in the euro area slowed.
Middle-right panelHouse Prices
A line chart describes the movement in house prices in the UK, France, Spain, and Ireland. They-axis shows the percent change from the year earlier, and the range goes from -15 percent to 20percent. The x-axis shows 2006 through 2008. The plotted curves show that house prices have fallenover the past year in the United Kingdom and Ireland and have also slowed in other Europeanlocales, such as France and Spain.
Bottom-left panelBusiness Climate Surveys
A line chart describes the movement in business climate surveys in the UK, Germany, and euro area.The y-axis is split into two scales. The UK survey is shown as a percent balance on the left y-axis,and the range goes from -40 to 30. The German and euro area survey data is shown as an index equalto 100 for January 2006, and the range goes from 80 to 115. Business confidence in all threecountries has disintegrated.

Bottom-center panelTotal Economy PMIs
A line chart describes the movement in total economy purchasing managers index (PMIs) in the euroarea and the UK, with an October 2008 flash estimate for the euro area. The frequency of the data ismonthly and the x-axis ranges from 2006 to 2008. The y-axis is a diffusion index where a valueabove 50 represents expansionary territory, and below 50 represents contractionary territory -- they-axis ranges from 40 to 65. Total economy PMIs are in the contractionary range in both the UnitedKingdom and the euro area; both measures have been declining since late 2007. The October 2008flash estimate for the euro area is slightly less than 45.
Bottom-right panelUnemployment Rate
A line chart describes the movement in unemployment rates in Spain, Ireland, euro area, France, andthe UK. The y-axis ranges from 4 percent to 12 percent and the x-axis ranges from 2006 to 2008.Unemployment rates have increased in all countries shown, especially in France and Spain, whereconstruction activity has slowed sharply.
Exhibit 5The Rest of the World
Top-left panelJapan
A line chart describes the movement of the Tankan survey, job offers/applicants, and shipments inJapan. The frequency of the data is monthly, and the x-axis ranges from 2006 to 2008. The y-axis issplit into two scales. The Tankan survey, a business confidence index forecast for all industries, isshown against the left y-axis as a percent ranging from -20 percent to 10 percent. The joboffers/applicants and shipments are shown against the right y-axis as an index set equal to 100 inJanuary 2006. The right y-axis ranges from 80 to 110. In Japan, business confidence has plunged,partly because lending terms faced by firms, particularly small and medium-sized enterprises, havebecome more restrictive. Shipments (the black line) and exports have declined. The labor market hasdeteriorated, with the job offers/applicants ratio falling to its lowest level in the past four years.
Top-right panelChina
A line chart describes the movement in nominal investment in fixed assets and nominal retail sales inChina. The frequency of the data is monthly, and the x-axis ranges from 2006 to 2008. The y-axisshows a 12-month percent change, and ranges from 0 percent to 40 percent. Investment spendingcontinued to be strong through September and retail sales accelerated.
Middle-left panelIndustrial Production
A line chart describes the movement in industrial production in China, Korea, and Taiwan. Thefrequency of the data is monthly, and the x-axis ranges from 2006 to 2008. The y-axis shows12-month percent change, and it ranges from -10 percent to 30 percent. Industrial production slowedthis summer in China, partly because of efforts to reduce pollution in Beijing during the AugustOlympics but also owing to declining steel production, suggesting further slowing. Industrial
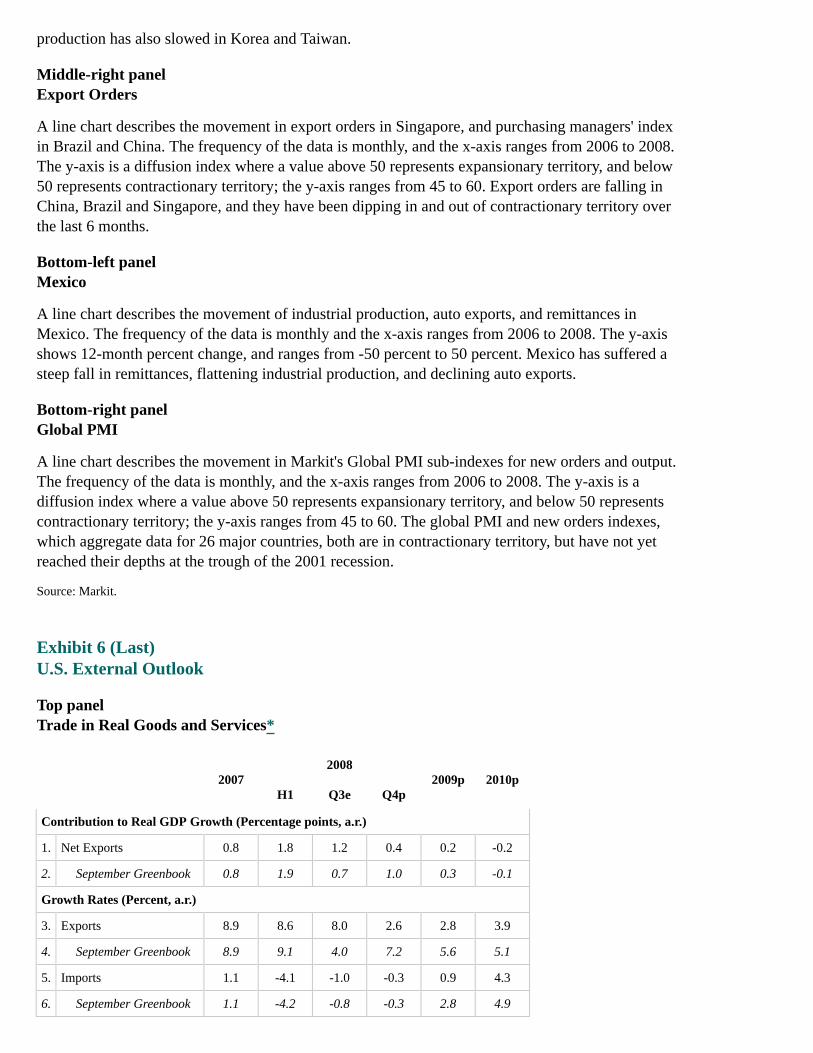
production has also slowed in Korea and Taiwan.
Middle-right panelExport Orders
A line chart describes the movement in export orders in Singapore, and purchasing managers' indexin Brazil and China. The frequency of the data is monthly, and the x-axis ranges from 2006 to 2008.The y-axis is a diffusion index where a value above 50 represents expansionary territory, and below50 represents contractionary territory; the y-axis ranges from 45 to 60. Export orders are falling inChina, Brazil and Singapore, and they have been dipping in and out of contractionary territory overthe last 6 months.
Bottom-left panelMexico
A line chart describes the movement of industrial production, auto exports, and remittances inMexico. The frequency of the data is monthly and the x-axis ranges from 2006 to 2008. The y-axisshows 12-month percent change, and ranges from -50 percent to 50 percent. Mexico has suffered asteep fall in remittances, flattening industrial production, and declining auto exports.
Bottom-right panelGlobal PMI
A line chart describes the movement in Markit's Global PMI sub-indexes for new orders and output.The frequency of the data is monthly, and the x-axis ranges from 2006 to 2008. The y-axis is adiffusion index where a value above 50 represents expansionary territory, and below 50 representscontractionary territory; the y-axis ranges from 45 to 60. The global PMI and new orders indexes,which aggregate data for 26 major countries, both are in contractionary territory, but have not yetreached their depths at the trough of the 2001 recession.
Source: Markit.
Exhibit 6 (Last)U.S. External Outlook
Top panelTrade in Real Goods and Services*
20072008
2009p 2010pH1 Q3e Q4p
Contribution to Real GDP Growth (Percentage points, a.r.)
1. Net Exports 0.8 1.8 1.2 0.4 0.2 -0.2
2. September Greenbook 0.8 1.9 0.7 1.0 0.3 -0.1
Growth Rates (Percent, a.r.)
3. Exports 8.9 8.6 8.0 2.6 2.8 3.9
4. September Greenbook 8.9 9.1 4.0 7.2 5.6 5.1
5. Imports 1.1 -4.1 -1.0 -0.3 0.9 4.3
6. September Greenbook 1.1 -4.2 -0.8 -0.3 2.8 4.9

* Years are Q4/Q4. Half year is Q2/Q4. Return to text
Middle-left panelReal GDP
A line chart describes the movement in real GDP for "total foreign," emerging markets, advancedforeign economies, and the U.S. The frequency of the data is quarterly, and the x-axis ranges from2000 to 2010, with the forecast period starting in the fourth quarter of 2008. The y-axis shows4-quarter percent change ranging from -4 percent to 10 percent. The aggregate series are weighted byshares of U.S. exports. Total foreign growth is now projected to dip down about as much as U.S.growth.
Middle-right panelBroad Real Exchange Value of the U.S. Dollar
A line chart describes the movement in broad real exchange value of the U.S. dollar relative to theSeptember Greenbook. The x-axis ranges from 2000 to 2010 with the forecast period starting in thefourth quarter of 2008. The y-axis shows an index where the average of the year 2000 is set to equal100, and ranges from 75 to 115. The dollar is well above the level projected in the SeptemberGreenbook.
Bottom panelU.S. Trade and Current Account Balances
A line chart describes the movement in U.S. trade and current account balances, and it gives a longerperspective on U.S. external deficits. The x-axis ranges from 1980 to 2010, with the forecast periodstarting in the fourth quarter of 2008. The y-axis shows the percent of GDP, and it ranges from -8percent to 4 percent. The non-oil trade deficit and current account deficit have continued to narrowover the past year and a half although oil imports have remained large. The current accountdeficit/GDP ratio is forecast to fall below 3 percent in 2010, a level last reached in 1998.
Appendix 5: Materials used by Mr. Madigan
Material for Briefing on FOMC Participants' Economic ProjectionsBrian MadiganOctober 29, 2008
Class I FOMC - Restricted Controlled (FR)
Exhibit 1Economic Projections of Federal Reserve Governors and Reserve Bank Presidents for2008
Top panelReal GDP Growth
2008 2008:H2
Central Tendency 0.0 to 0.3 -1.8 to -1.2
June projections 1.0 to 1.6 0.6 to 2.1
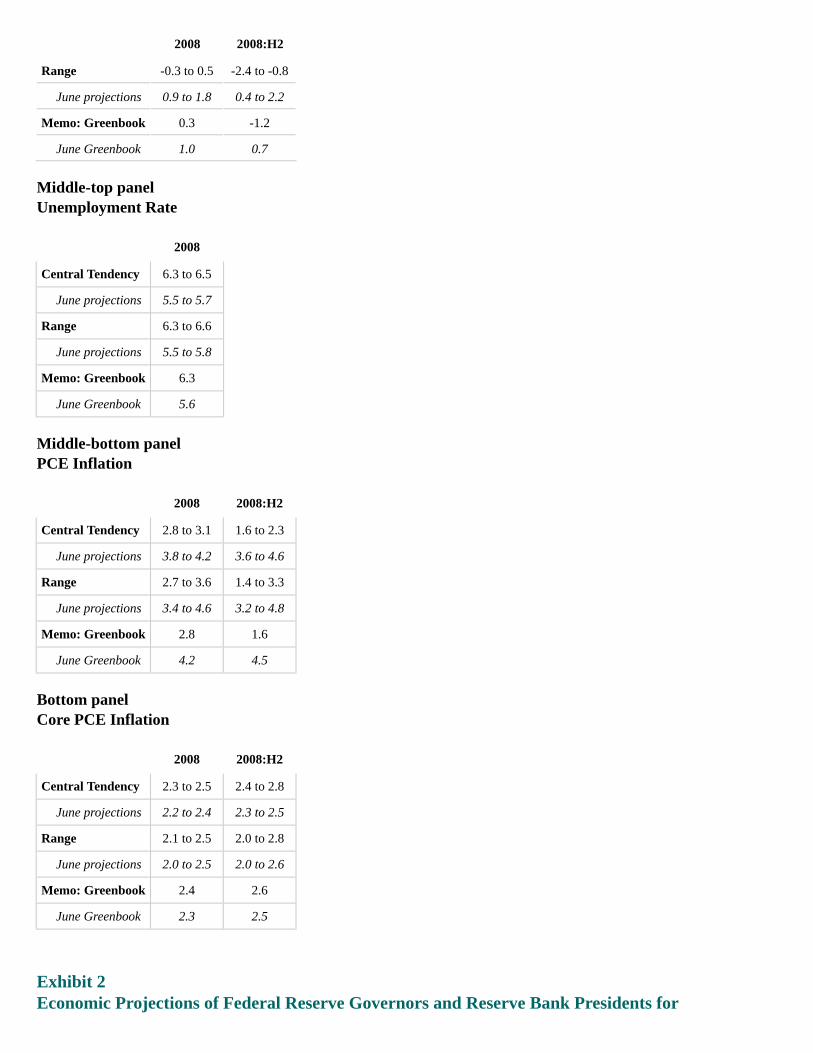
2008 2008:H2
Range -0.3 to 0.5 -2.4 to -0.8
June projections 0.9 to 1.8 0.4 to 2.2
Memo: Greenbook 0.3 -1.2
June Greenbook 1.0 0.7
Middle-top panelUnemployment Rate
2008
Central Tendency 6.3 to 6.5
June projections 5.5 to 5.7
Range 6.3 to 6.6
June projections 5.5 to 5.8
Memo: Greenbook 6.3
June Greenbook 5.6
Middle-bottom panelPCE Inflation
2008 2008:H2
Central Tendency 2.8 to 3.1 1.6 to 2.3
June projections 3.8 to 4.2 3.6 to 4.6
Range 2.7 to 3.6 1.4 to 3.3
June projections 3.4 to 4.6 3.2 to 4.8
Memo: Greenbook 2.8 1.6
June Greenbook 4.2 4.5
Bottom panelCore PCE Inflation
2008 2008:H2
Central Tendency 2.3 to 2.5 2.4 to 2.8
June projections 2.2 to 2.4 2.3 to 2.5
Range 2.1 to 2.5 2.0 to 2.8
June projections 2.0 to 2.5 2.0 to 2.6
Memo: Greenbook 2.4 2.6
June Greenbook 2.3 2.5
Exhibit 2Economic Projections of Federal Reserve Governors and Reserve Bank Presidents for
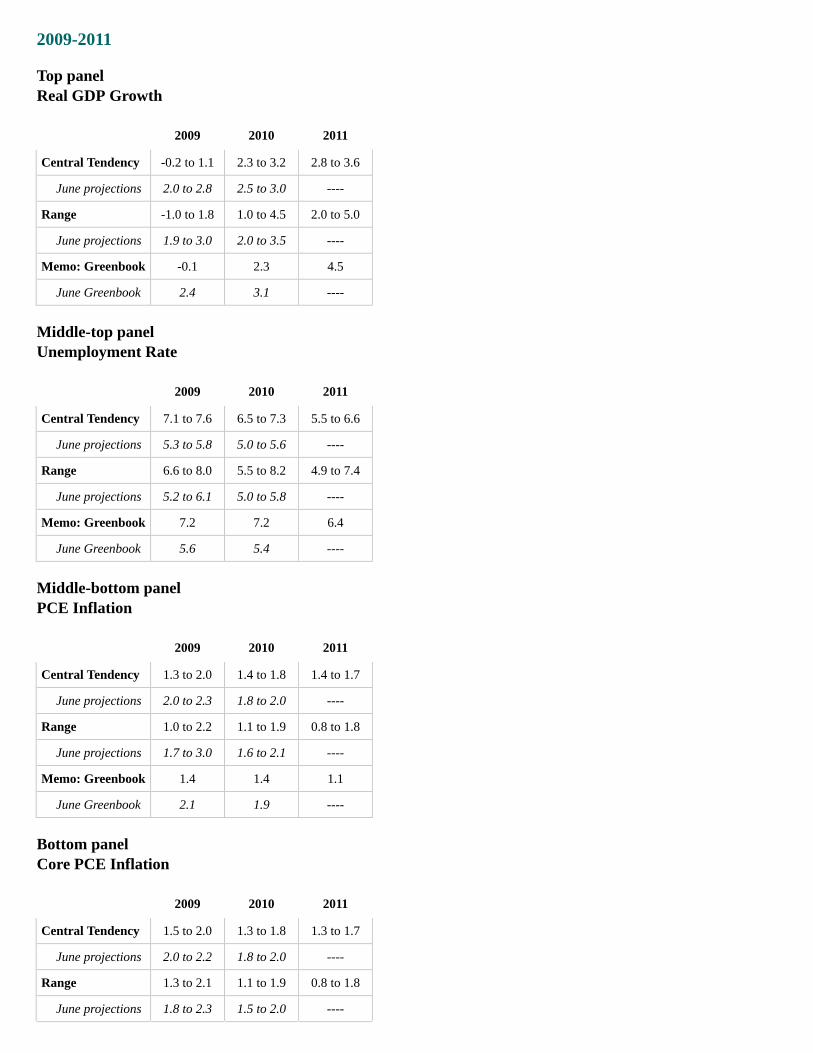
2009-2011
Top panelReal GDP Growth
2009 2010 2011
Central Tendency -0.2 to 1.1 2.3 to 3.2 2.8 to 3.6
June projections 2.0 to 2.8 2.5 to 3.0 ----
Range -1.0 to 1.8 1.0 to 4.5 2.0 to 5.0
June projections 1.9 to 3.0 2.0 to 3.5 ----
Memo: Greenbook -0.1 2.3 4.5
June Greenbook 2.4 3.1 ----
Middle-top panelUnemployment Rate
2009 2010 2011
Central Tendency 7.1 to 7.6 6.5 to 7.3 5.5 to 6.6
June projections 5.3 to 5.8 5.0 to 5.6 ----
Range 6.6 to 8.0 5.5 to 8.2 4.9 to 7.4
June projections 5.2 to 6.1 5.0 to 5.8 ----
Memo: Greenbook 7.2 7.2 6.4
June Greenbook 5.6 5.4 ----
Middle-bottom panelPCE Inflation
2009 2010 2011
Central Tendency 1.3 to 2.0 1.4 to 1.8 1.4 to 1.7
June projections 2.0 to 2.3 1.8 to 2.0 ----
Range 1.0 to 2.2 1.1 to 1.9 0.8 to 1.8
June projections 1.7 to 3.0 1.6 to 2.1 ----
Memo: Greenbook 1.4 1.4 1.1
June Greenbook 2.1 1.9 ----
Bottom panelCore PCE Inflation
2009 2010 2011
Central Tendency 1.5 to 2.0 1.3 to 1.8 1.3 to 1.7
June projections 2.0 to 2.2 1.8 to 2.0 ----
Range 1.3 to 2.1 1.1 to 1.9 0.8 to 1.8
June projections 1.8 to 2.3 1.5 to 2.0 ----
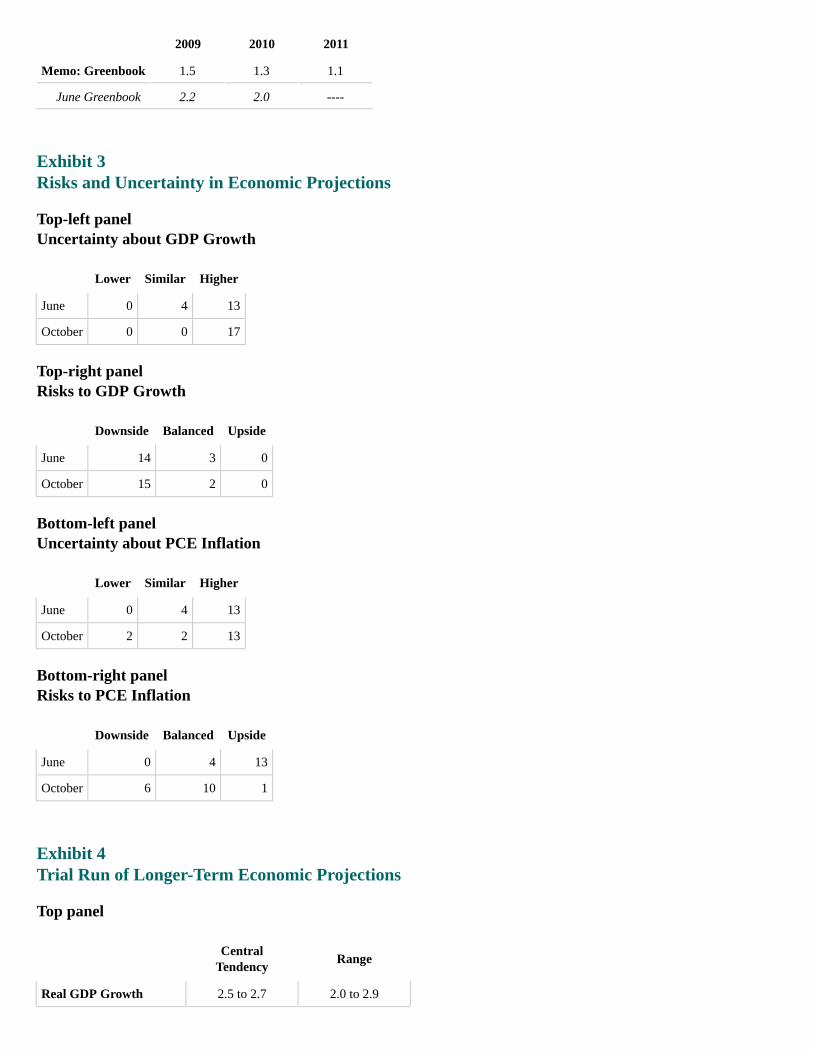
2009 2010 2011
Memo: Greenbook 1.5 1.3 1.1
June Greenbook 2.2 2.0 ----
Exhibit 3Risks and Uncertainty in Economic Projections
Top-left panelUncertainty about GDP Growth
Lower Similar Higher
June 0 4 13
October 0 0 17
Top-right panelRisks to GDP Growth
Downside Balanced Upside
June 14 3 0
October 15 2 0
Bottom-left panelUncertainty about PCE Inflation
Lower Similar Higher
June 0 4 13
October 2 2 13
Bottom-right panelRisks to PCE Inflation
Downside Balanced Upside
June 0 4 13
October 6 10 1
Exhibit 4Trial Run of Longer-Term Economic Projections
Top panel
CentralTendency
Range
Real GDP Growth 2.5 to 2.7 2.0 to 2.9
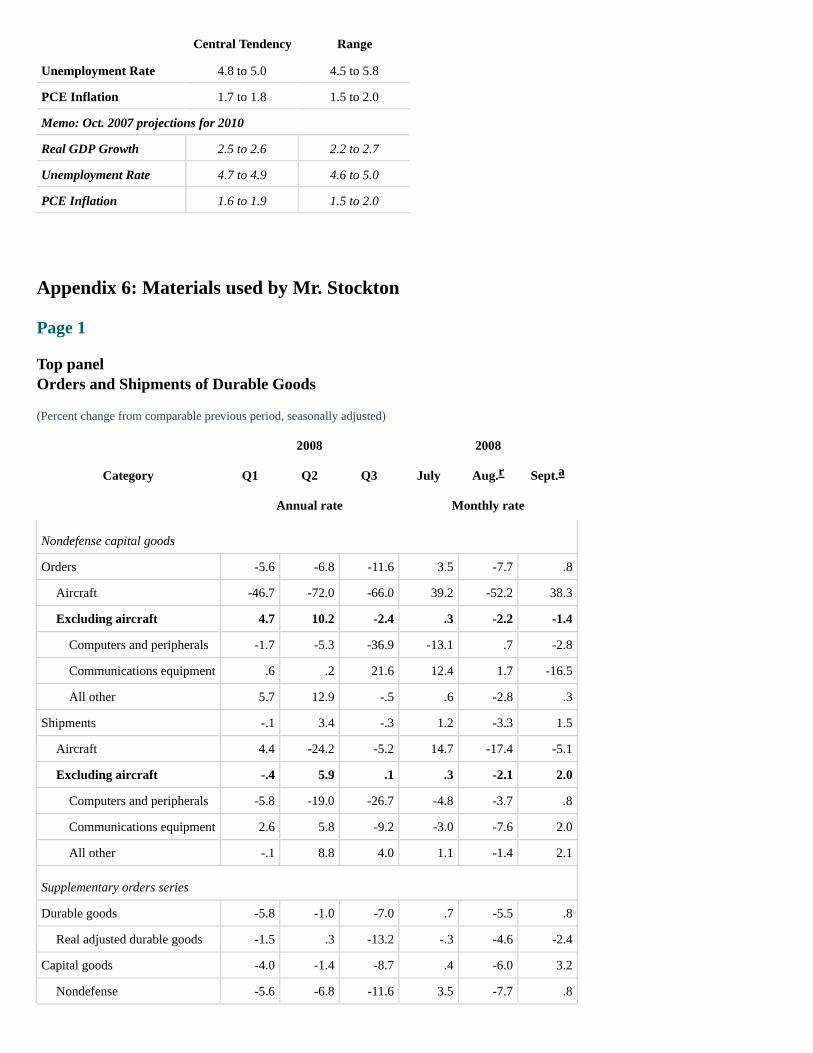
Central Tendency Range
Unemployment Rate 4.8 to 5.0 4.5 to 5.8
PCE Inflation 1.7 to 1.8 1.5 to 2.0
Memo: Oct. 2007 projections for 2010
Real GDP Growth 2.5 to 2.6 2.2 to 2.7
Unemployment Rate 4.7 to 4.9 4.6 to 5.0
PCE Inflation 1.6 to 1.9 1.5 to 2.0
Appendix 6: Materials used by Mr. Stockton
Page 1
Top panelOrders and Shipments of Durable Goods
(Percent change from comparable previous period, seasonally adjusted)
Category
2008 2008
Q1 Q2 Q3 July Aug. Sept.
Annual rate Monthly rate
Nondefense capital goods
Orders -5.6 -6.8 -11.6 3.5 -7.7 .8
Aircraft -46.7 -72.0 -66.0 39.2 -52.2 38.3
Excluding aircraft 4.7 10.2 -2.4 .3 -2.2 -1.4
Computers and peripherals -1.7 -5.3 -36.9 -13.1 .7 -2.8
Communications equipment .6 .2 21.6 12.4 1.7 -16.5
All other 5.7 12.9 -.5 .6 -2.8 .3
Shipments -.1 3.4 -.3 1.2 -3.3 1.5
Aircraft 4.4 -24.2 -5.2 14.7 -17.4 -5.1
Excluding aircraft -.4 5.9 .1 .3 -2.1 2.0
Computers and peripherals -5.8 -19.0 -26.7 -4.8 -3.7 .8
Communications equipment 2.6 5.8 -9.2 -3.0 -7.6 2.0
All other -.1 8.8 4.0 1.1 -1.4 2.1
Supplementary orders series
Durable goods -5.8 -1.0 -7.0 .7 -5.5 .8
Real adjusted durable goods -1.5 .3 -13.2 -.3 -4.6 -2.4
Capital goods -4.0 -1.4 -8.7 .4 -6.0 3.2
Nondefense -5.6 -6.8 -11.6 3.5 -7.7 .8
r a
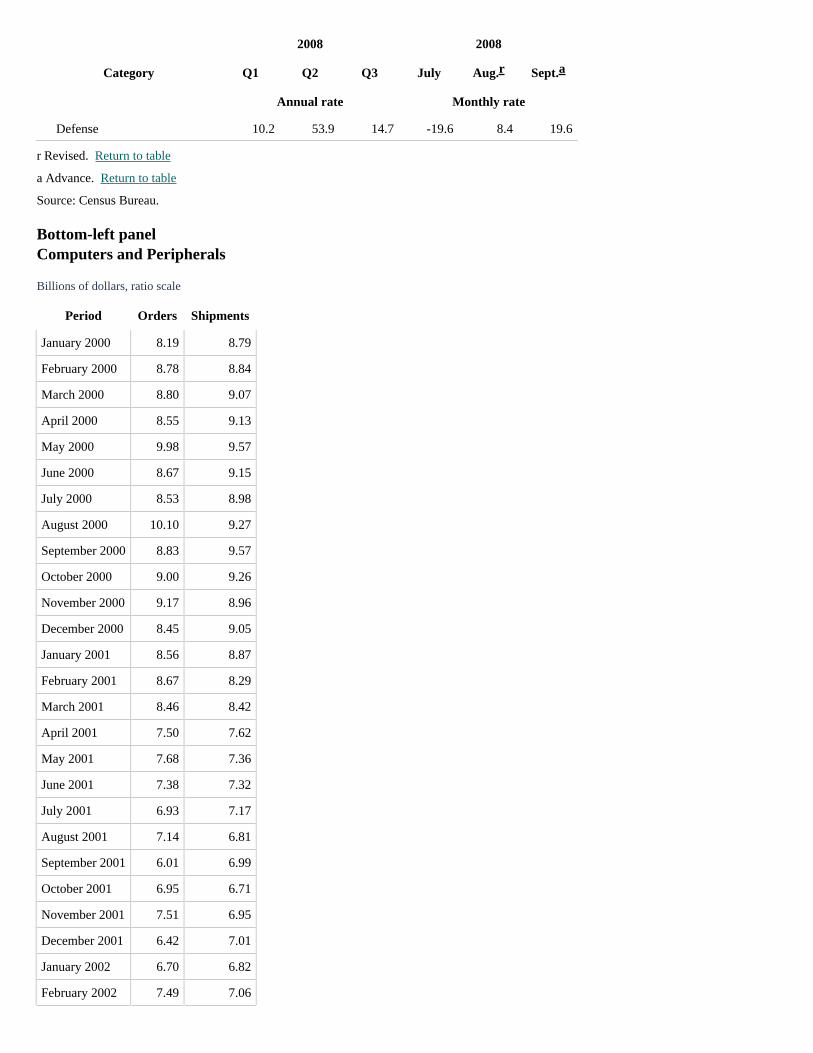
Category
2008 2008
Q1 Q2 Q3 July Aug. Sept.
Annual rate Monthly rate
Defense 10.2 53.9 14.7 -19.6 8.4 19.6
r Revised. Return to table
a Advance. Return to table
Source: Census Bureau.
Bottom-left panelComputers and Peripherals
Billions of dollars, ratio scale
Period Orders Shipments
January 2000 8.19 8.79
February 2000 8.78 8.84
March 2000 8.80 9.07
April 2000 8.55 9.13
May 2000 9.98 9.57
June 2000 8.67 9.15
July 2000 8.53 8.98
August 2000 10.10 9.27
September 2000 8.83 9.57
October 2000 9.00 9.26
November 2000 9.17 8.96
December 2000 8.45 9.05
January 2001 8.56 8.87
February 2001 8.67 8.29
March 2001 8.46 8.42
April 2001 7.50 7.62
May 2001 7.68 7.36
June 2001 7.38 7.32
July 2001 6.93 7.17
August 2001 7.14 6.81
September 2001 6.01 6.99
October 2001 6.95 6.71
November 2001 7.51 6.95
December 2001 6.42 7.01
January 2002 6.70 6.82
February 2002 7.49 7.06
r a
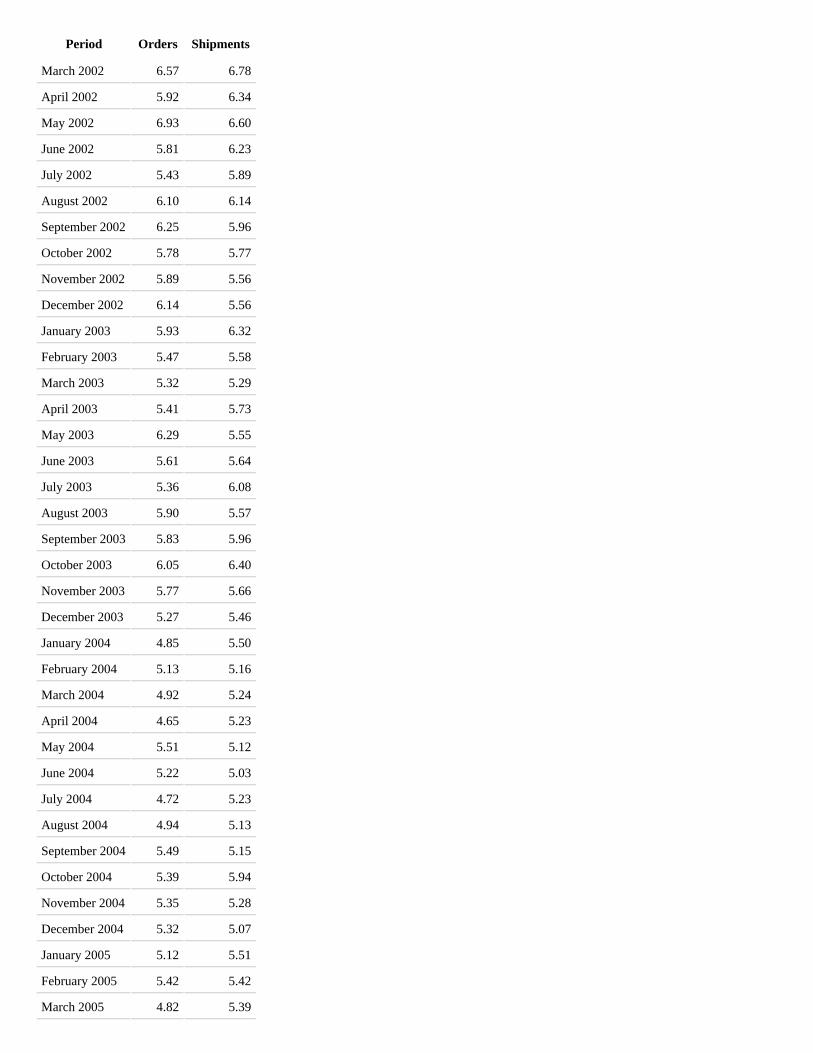
Period Orders Shipments
March 2002 6.57 6.78
April 2002 5.92 6.34
May 2002 6.93 6.60
June 2002 5.81 6.23
July 2002 5.43 5.89
August 2002 6.10 6.14
September 2002 6.25 5.96
October 2002 5.78 5.77
November 2002 5.89 5.56
December 2002 6.14 5.56
January 2003 5.93 6.32
February 2003 5.47 5.58
March 2003 5.32 5.29
April 2003 5.41 5.73
May 2003 6.29 5.55
June 2003 5.61 5.64
July 2003 5.36 6.08
August 2003 5.90 5.57
September 2003 5.83 5.96
October 2003 6.05 6.40
November 2003 5.77 5.66
December 2003 5.27 5.46
January 2004 4.85 5.50
February 2004 5.13 5.16
March 2004 4.92 5.24
April 2004 4.65 5.23
May 2004 5.51 5.12
June 2004 5.22 5.03
July 2004 4.72 5.23
August 2004 4.94 5.13
September 2004 5.49 5.15
October 2004 5.39 5.94
November 2004 5.35 5.28
December 2004 5.32 5.07
January 2005 5.12 5.51
February 2005 5.42 5.42
March 2005 4.82 5.39

Period Orders Shipments
April 2005 5.53 5.56
May 2005 5.41 5.46
June 2005 5.54 5.39
July 2005 4.77 5.11
August 2005 5.45 5.32
September 2005 5.25 5.18
October 2005 5.01 5.31
November 2005 5.41 5.45
December 2005 5.67 5.64
January 2006 5.37 5.57
February 2006 5.73 5.74
March 2006 6.04 6.00
April 2006 5.67 5.72
May 2006 5.67 5.67
June 2006 5.72 5.62
July 2006 6.14 6.02
August 2006 5.72 5.97
September 2006 5.56 5.43
October 2006 4.60 4.53
November 2006 5.75 5.64
December 2006 5.59 5.53
January 2007 5.19 5.25
February 2007 5.76 5.84
March 2007 5.41 5.20
April 2007 4.95 5.13
May 2007 5.78 5.78
June 2007 5.70 5.60
July 2007 5.18 4.90
August 2007 5.76 5.53
September 2007 5.75 5.66
October 2007 5.02 5.62
November 2007 5.62 5.55
December 2007 5.76 5.61
January 2008 5.02 5.60
February 2008 5.67 5.51
March 2008 5.64 5.42
April 2008 5.05 5.17
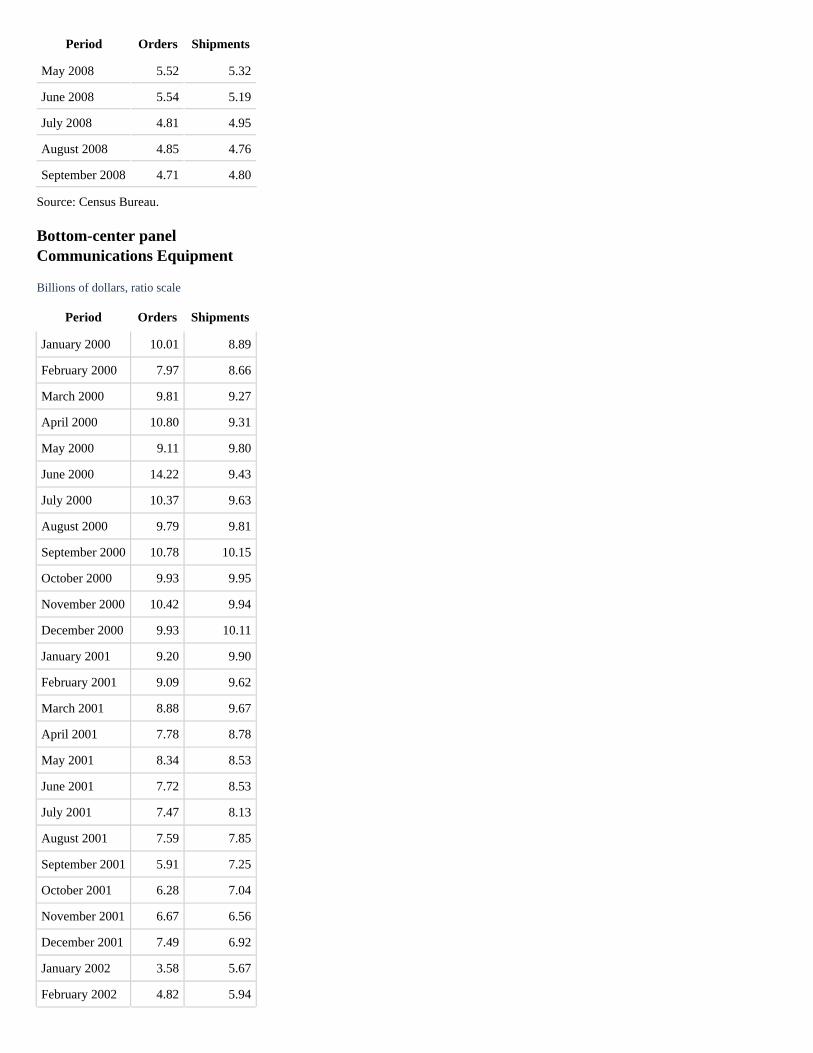
Period Orders Shipments
May 2008 5.52 5.32
June 2008 5.54 5.19
July 2008 4.81 4.95
August 2008 4.85 4.76
September 2008 4.71 4.80
Source: Census Bureau.
Bottom-center panelCommunications Equipment
Billions of dollars, ratio scale
Period Orders Shipments
January 2000 10.01 8.89
February 2000 7.97 8.66
March 2000 9.81 9.27
April 2000 10.80 9.31
May 2000 9.11 9.80
June 2000 14.22 9.43
July 2000 10.37 9.63
August 2000 9.79 9.81
September 2000 10.78 10.15
October 2000 9.93 9.95
November 2000 10.42 9.94
December 2000 9.93 10.11
January 2001 9.20 9.90
February 2001 9.09 9.62
March 2001 8.88 9.67
April 2001 7.78 8.78
May 2001 8.34 8.53
June 2001 7.72 8.53
July 2001 7.47 8.13
August 2001 7.59 7.85
September 2001 5.91 7.25
October 2001 6.28 7.04
November 2001 6.67 6.56
December 2001 7.49 6.92
January 2002 3.58 5.67
February 2002 4.82 5.94
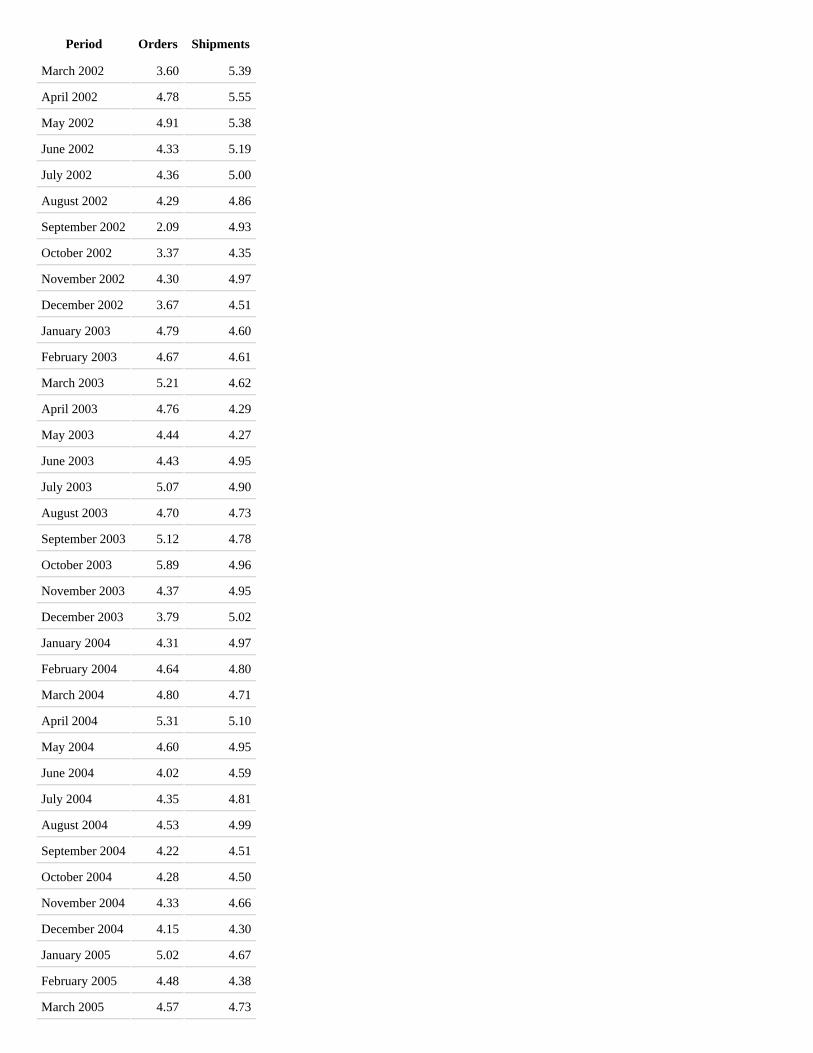
Period Orders Shipments
March 2002 3.60 5.39
April 2002 4.78 5.55
May 2002 4.91 5.38
June 2002 4.33 5.19
July 2002 4.36 5.00
August 2002 4.29 4.86
September 2002 2.09 4.93
October 2002 3.37 4.35
November 2002 4.30 4.97
December 2002 3.67 4.51
January 2003 4.79 4.60
February 2003 4.67 4.61
March 2003 5.21 4.62
April 2003 4.76 4.29
May 2003 4.44 4.27
June 2003 4.43 4.95
July 2003 5.07 4.90
August 2003 4.70 4.73
September 2003 5.12 4.78
October 2003 5.89 4.96
November 2003 4.37 4.95
December 2003 3.79 5.02
January 2004 4.31 4.97
February 2004 4.64 4.80
March 2004 4.80 4.71
April 2004 5.31 5.10
May 2004 4.60 4.95
June 2004 4.02 4.59
July 2004 4.35 4.81
August 2004 4.53 4.99
September 2004 4.22 4.51
October 2004 4.28 4.50
November 2004 4.33 4.66
December 2004 4.15 4.30
January 2005 5.02 4.67
February 2005 4.48 4.38
March 2005 4.57 4.73
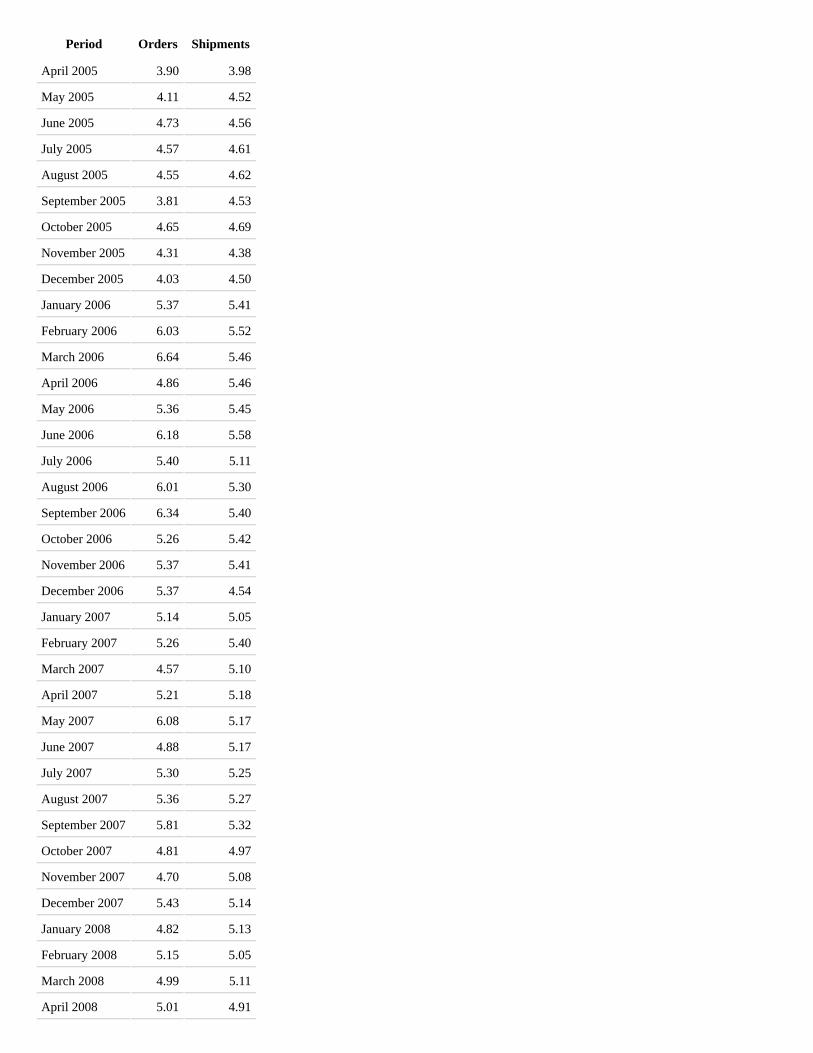
Period Orders Shipments
April 2005 3.90 3.98
May 2005 4.11 4.52
June 2005 4.73 4.56
July 2005 4.57 4.61
August 2005 4.55 4.62
September 2005 3.81 4.53
October 2005 4.65 4.69
November 2005 4.31 4.38
December 2005 4.03 4.50
January 2006 5.37 5.41
February 2006 6.03 5.52
March 2006 6.64 5.46
April 2006 4.86 5.46
May 2006 5.36 5.45
June 2006 6.18 5.58
July 2006 5.40 5.11
August 2006 6.01 5.30
September 2006 6.34 5.40
October 2006 5.26 5.42
November 2006 5.37 5.41
December 2006 5.37 4.54
January 2007 5.14 5.05
February 2007 5.26 5.40
March 2007 4.57 5.10
April 2007 5.21 5.18
May 2007 6.08 5.17
June 2007 4.88 5.17
July 2007 5.30 5.25
August 2007 5.36 5.27
September 2007 5.81 5.32
October 2007 4.81 4.97
November 2007 4.70 5.08
December 2007 5.43 5.14
January 2008 4.82 5.13
February 2008 5.15 5.05
March 2008 4.99 5.11
April 2008 5.01 4.91

Period Orders Shipments
May 2008 5.09 5.15
June 2008 4.88 5.44
July 2008 5.49 5.28
August 2008 5.58 4.88
September 2008 4.66 4.98
Source: Census Bureau.
Bottom-right panelOther (non-high-tech, nontransportation)
Billions of dollars, ratio scale
Period Orders Shipments
January 2000 46.17 44.22
February 2000 41.70 41.97
March 2000 44.83 43.95
April 2000 44.96 44.82
May 2000 44.82 43.80
June 2000 45.74 44.92
July 2000 45.18 44.49
August 2000 44.72 44.36
September 2000 46.41 44.96
October 2000 44.57 44.55
November 2000 43.32 44.37
December 2000 43.33 44.58
January 2001 44.67 43.82
February 2001 43.20 43.86
March 2001 41.30 42.96
April 2001 40.40 41.74
May 2001 42.05 42.16
June 2001 40.72 41.46
July 2001 39.81 40.20
August 2001 40.43 40.68
September 2001 38.76 38.98
October 2001 37.04 39.24
November 2001 38.21 38.00
December 2001 38.33 38.41
January 2002 36.32 37.96
February 2002 37.17 38.36
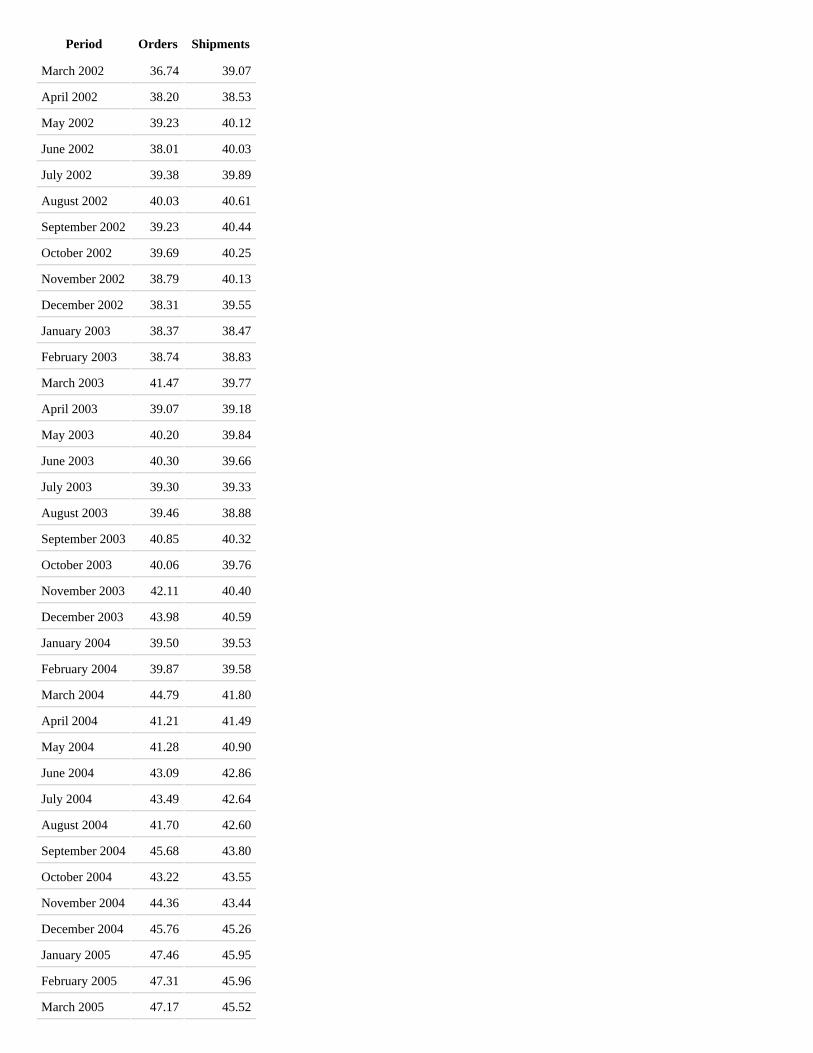
Period Orders Shipments
March 2002 36.74 39.07
April 2002 38.20 38.53
May 2002 39.23 40.12
June 2002 38.01 40.03
July 2002 39.38 39.89
August 2002 40.03 40.61
September 2002 39.23 40.44
October 2002 39.69 40.25
November 2002 38.79 40.13
December 2002 38.31 39.55
January 2003 38.37 38.47
February 2003 38.74 38.83
March 2003 41.47 39.77
April 2003 39.07 39.18
May 2003 40.20 39.84
June 2003 40.30 39.66
July 2003 39.30 39.33
August 2003 39.46 38.88
September 2003 40.85 40.32
October 2003 40.06 39.76
November 2003 42.11 40.40
December 2003 43.98 40.59
January 2004 39.50 39.53
February 2004 39.87 39.58
March 2004 44.79 41.80
April 2004 41.21 41.49
May 2004 41.28 40.90
June 2004 43.09 42.86
July 2004 43.49 42.64
August 2004 41.70 42.60
September 2004 45.68 43.80
October 2004 43.22 43.55
November 2004 44.36 43.44
December 2004 45.76 45.26
January 2005 47.46 45.95
February 2005 47.31 45.96
March 2005 47.17 45.52
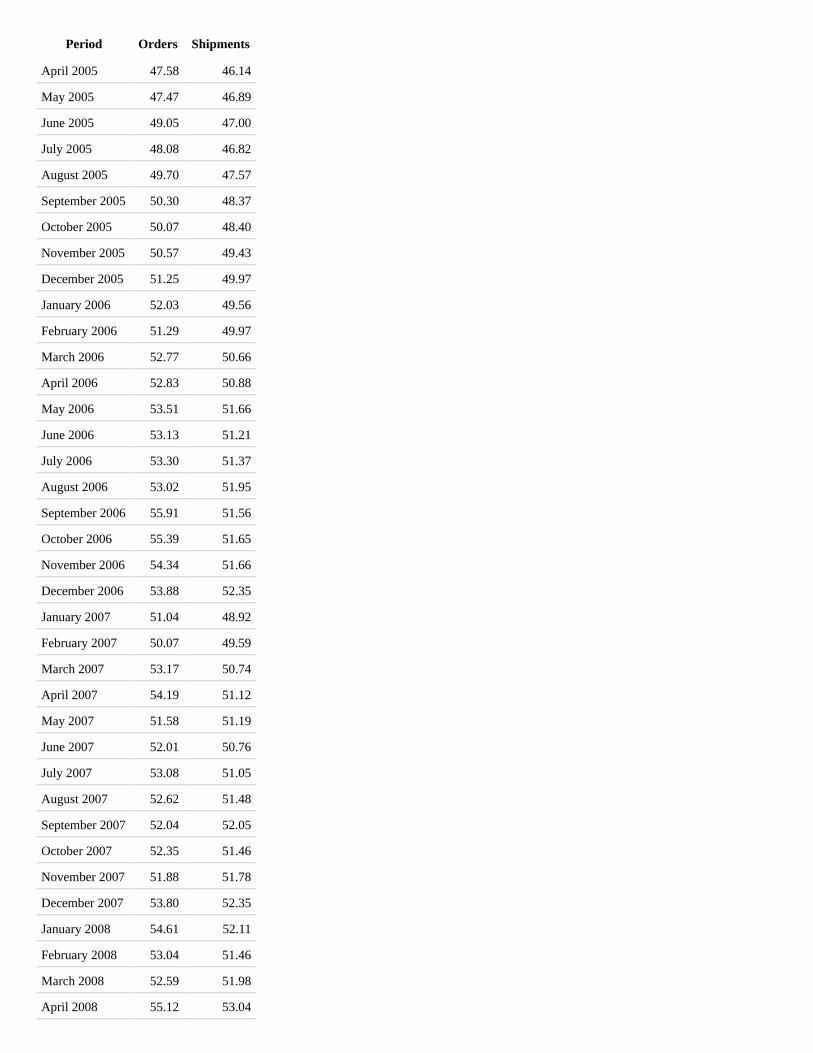
Period Orders Shipments
April 2005 47.58 46.14
May 2005 47.47 46.89
June 2005 49.05 47.00
July 2005 48.08 46.82
August 2005 49.70 47.57
September 2005 50.30 48.37
October 2005 50.07 48.40
November 2005 50.57 49.43
December 2005 51.25 49.97
January 2006 52.03 49.56
February 2006 51.29 49.97
March 2006 52.77 50.66
April 2006 52.83 50.88
May 2006 53.51 51.66
June 2006 53.13 51.21
July 2006 53.30 51.37
August 2006 53.02 51.95
September 2006 55.91 51.56
October 2006 55.39 51.65
November 2006 54.34 51.66
December 2006 53.88 52.35
January 2007 51.04 48.92
February 2007 50.07 49.59
March 2007 53.17 50.74
April 2007 54.19 51.12
May 2007 51.58 51.19
June 2007 52.01 50.76
July 2007 53.08 51.05
August 2007 52.62 51.48
September 2007 52.04 52.05
October 2007 52.35 51.46
November 2007 51.88 51.78
December 2007 53.80 52.35
January 2008 54.61 52.11
February 2008 53.04 51.46
March 2008 52.59 51.98
April 2008 55.12 53.04

Period Orders Shipments
May 2008 54.39 52.79
June 2008 55.65 53.03
July 2008 56.00 53.63
August 2008 54.41 52.86
September 2008 54.55 53.96
Source: Census Bureau.
Appendix 7: Materials used by Mr. Madigan
Material for FOMC Briefing on Monetary Policy AlternativesBrian MadiganOctober 29, 2008
Class I FOMC - Restricted Controlled (FR)
Table 1:Alternative Language for the October 29 FOMC Announcement
October 27, 2008[Note: In Appendix 7, Table 1, strong emphasis (bold) has been added to indicate underlined red text in the original document. Emphasis (italic)indicates underlined blue text in the original document.]
October 8 Statement Alternative A Alternative B Alternative C
PolicyDecision
1. The Federal Open MarketCommittee has decided tolower its target for the federalfunds rate 50 basis points to1½ percent.
The Federal Open MarketCommittee decided today tolower its target for the federalfunds rate 50 basis points to 1percent.
The Federal Open MarketCommittee decided today tolower its target for the federalfunds rate 25 basis points to1¼ percent.
The Federal Open MarketCommittee decided today tokeep its target for the federalfunds rate at 1½ percent.
Rationale
2. The Committee took thisaction in light of evidencepointing to a weakening ofeconomic activity and areduction in inflationarypressures. Incomingeconomic data suggest thatthe pace of economic activityhas slowed markedly inrecent months. Moreover, theintensification of financialmarket turmoil is likely toexert additional restraint onspending, partly by furtherreducing the ability ofhouseholds and businesses toobtain credit.
The pace of economic activityappears to have slowedmarkedly, owing importantlyto a decline in consumerexpenditures. Businessequipment spending andindustrial production haveweakened in recent months,and slowing economicactivity in many foreigneconomies is damping theprospects for U.S. exports.Moreover, the intensificationof financial market turmoil islikely to exert additionalrestraint on spending, partlyby further reducing the abilityof households and businessesto obtain credit.
The pace of economicactivity appears to haveslowed markedly, owingimportantly to a decline inconsumer expenditures.Moreover, the intensificationof financial market turmoil islikely to exert additionalrestraint on spending, partlyby further reducing the abilityof households and businessesto obtain credit.
Reflecting in part theintensification of financialmarket turmoil, the outlookfor economic activity hasweakened. Consumerspending and industrialproduction have declined inrecent months. However,policy actions taken inrecent weeks, includingcoordinated interest ratecuts by central banks,extraordinary liquiditymeasures, and official stepsto strengthen financialsystems, should help overtime to improve creditconditions and promote areturn to moderateeconomic growth.

October 8 Statement Alternative A Alternative B Alternative C
3. Inflation has been high, butthe Committee believes thatthe decline in energy andother commodity prices andthe weaker prospects foreconomic activity havereduced the upside risks toinflation.
In light of the declines in theprices of energy and othercommodities and the weakerprospects for economicactivity, the Committeeexpects inflation tomoderate in comingquarters to levels consistentwith price stability.
In light of the declines in theprices of energy and othercommodities and the weakerprospects for economicactivity, the Committeeexpects inflation tomoderate in comingquarters to levels consistentwith price stability.
Inflation has been high, butthe Committee believes thatthe declines in the prices ofenergy and other commoditiesand the weaker prospects foreconomic activity havereduced the upside risks toinflation.
Assessmentof Risk
4. The Committee willmonitor economic andfinancial developmentscarefully and will act asneeded to promotesustainable economic growthand price stability.
Recent policy actions,including today's ratereduction, coordinatedinterest rate cuts by centralbanks, extraordinary liquiditymeasures, and official stepsto strengthen financialsystems, should help overtime to improve creditconditions and promote areturn to moderate economicgrowth. Nevertheless,downside risks to growthremain. The Committee willmonitor economic andfinancial developmentscarefully and will act asneeded to promotesustainable economic growthand price stability.
Policy actions taken inrecent weeks, includingcoordinated interest ratecuts by central banks,extraordinary liquiditymeasures, and official stepsto strengthen financialsystems, should help overtime to improve creditconditions and promote areturn to moderateeconomic growth.Nevertheless, thepredominant concern of theCommittee is the downsiderisks to growth. TheCommittee will monitoreconomic and financialdevelopments carefully andwill act as needed to promotesustainable economic growthand price stability.
In these circumstances, theCommittee's primaryconcern is the downsiderisks to growth. TheCommittee will monitoreconomic and financialdevelopments carefully inlight of the recent policyactions and will act asneeded to promote sustainableeconomic growth and pricestability.
Appendix 8: Materials used by Mr. Bullard
Page 1
Top panelTwo Steady States
A line chart shows two axes and two curves. The horizontal axis is labeled "\pi,\pi^e" and ispositioned at the bottom of the chart. The vertical axis is labeled "R" and is positioned near themiddle of the chart. A line labeled "Fisher: R = r + \pi^e" begins on the horizontal axis at point (-r,0)and has a moderate positive slope. The other curve is labeled "Policy" and consists of two linesegments. Policy begins as a horizontal line on the left side of the chart with a low, constant positivevalue of R**, and intersects the Fisher line at point (\pi**,R**), which is labeled "Steady state withlow nominal interest rate and deflation." The Policy curve continues at a constant value until it is tothe right of the R axis, and then begins to rise with a steep positive slope. Policy intersects Fisheragain at point (\pi*,R*), which is labeled "Steady state with inflation at target."
J. Benhabib, S. Schmitt-Grohe, M. Uribe, 2001, J. Econ. Thy.

Return to top
Home | Monetary policy | FOMC | FOMC transcriptsAccessibility | Contact UsLast update: February 21, 2014