Embed Size (px)
Citation preview

Presentation Materials (715 KB PDF)
Pages 16 to 34 of the Transcript
Appendix 1: Materials used by Mr. Reinhart
Exhibit 1Treasury Securities Market
Exhibit 1 contains three charts and a table that contain information on developments in the Treasurysecurities market during the first quarter of 2003.
Top panelTwo- and Ten-year Treasury Yields
A line chart displays the yields on the on-the-run two- and ten-year Treasury notes from March 13,2003 through April 1, 2003 at 5-minute intervals. Two vertical lines are included in the chart. Thefirst denotes the March 19, 2003 8:00 p.m. deadline to Iraq and the second denotes 4:00 p.m. onMarch 24, 2003 (the end of available data for the March 25, 2003 conference call). Two-year yieldsrise from around 1.5 percent to over 1.7 percent as the March 19 deadline approaches. Ten-yearyields rise from around 3.7 percent to over 4.0 percent during the same period. Volatility in the yieldsincreases between the deadline and March 24 after which yields slowly decline to earlier levels andthe spread between two and ten-year yields widens.
Middle-left panelTreasury Yield Curve
A line chart shows the Treasury yield curve at 4:00 p.m. on March 19, 2003 and at 12:00 p.m. onApril 1, 2003. The plot displays a small parallel downward shift of the yield curve from March 19,2003 to April 1, 2003.
Middle-right panelTen-year TIPS Yield
A line chart displays the yield on the ten-year Treasury Inflation Indexed note (TIPS) at a dailyfrequency from January 2003 through March 31, 2003. A plus sign denotes the yield on April 1,2003, at approximately 12:00 p.m. The yield declines steadily from 2.4 percent to 1.6 percent fromthe beginning of January through early March. The yield then rises sharply in the middle of March toaround 2.2 percent before declining again to below 2 percent by the end of the period.
Bottom panel
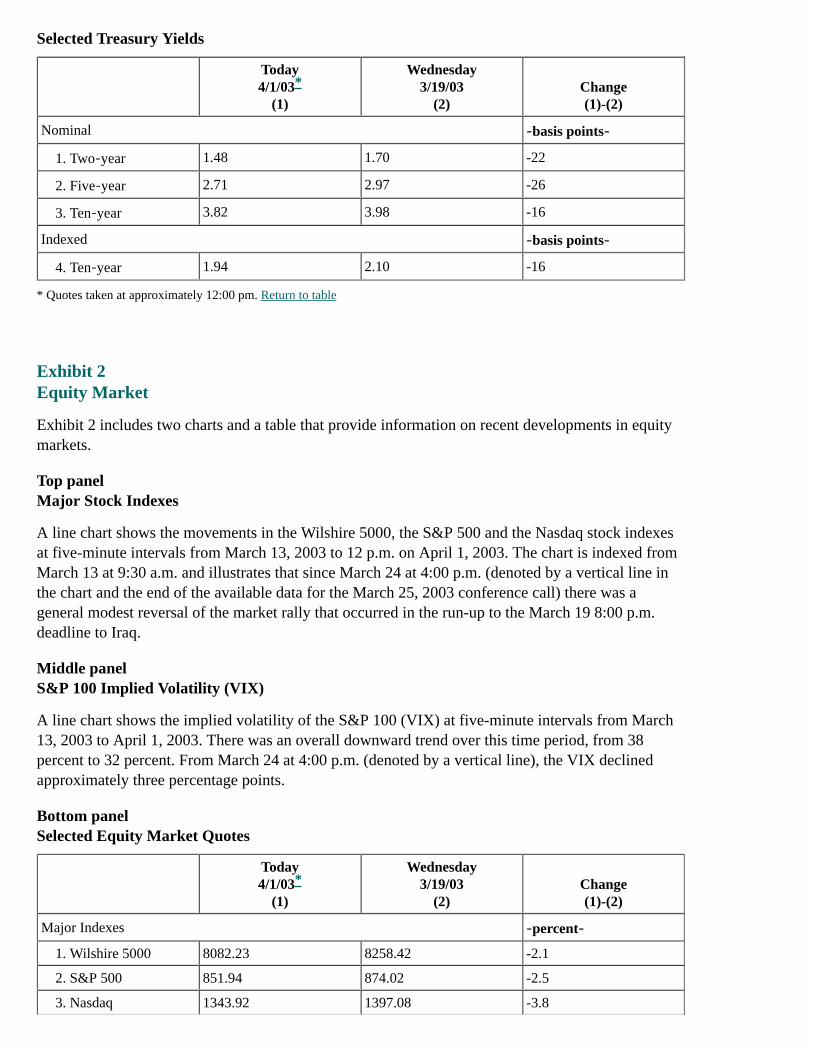
Selected Treasury Yields
Today4/1/03
(1)
Wednesday3/19/03
(2)Change(1)-(2)
Nominal ‑basis points‑
1. Two‑year 1.48 1.70 -22
2. Five‑year 2.71 2.97 -26
3. Ten‑year 3.82 3.98 -16
Indexed ‑basis points‑
4. Ten‑year 1.94 2.10 -16
* Quotes taken at approximately 12:00 pm. Return to table
Exhibit 2Equity Market
Exhibit 2 includes two charts and a table that provide information on recent developments in equitymarkets.
Top panelMajor Stock Indexes
A line chart shows the movements in the Wilshire 5000, the S&P 500 and the Nasdaq stock indexesat five-minute intervals from March 13, 2003 to 12 p.m. on April 1, 2003. The chart is indexed fromMarch 13 at 9:30 a.m. and illustrates that since March 24 at 4:00 p.m. (denoted by a vertical line inthe chart and the end of the available data for the March 25, 2003 conference call) there was ageneral modest reversal of the market rally that occurred in the run-up to the March 19 8:00 p.m.deadline to Iraq.
Middle panelS&P 100 Implied Volatility (VIX)
A line chart shows the implied volatility of the S&P 100 (VIX) at five-minute intervals from March13, 2003 to April 1, 2003. There was an overall downward trend over this time period, from 38percent to 32 percent. From March 24 at 4:00 p.m. (denoted by a vertical line), the VIX declinedapproximately three percentage points.
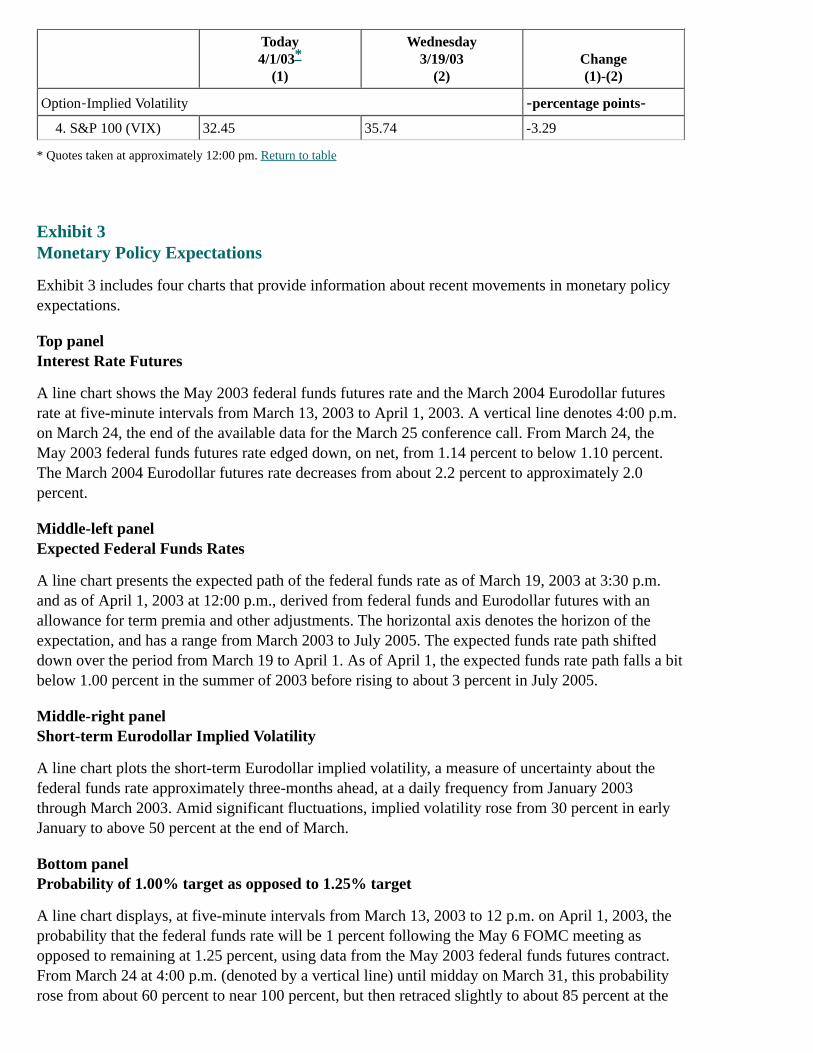
Bottom panelSelected Equity Market Quotes
Today4/1/03
(1)
Wednesday3/19/03
(2)Change(1)-(2)
Major Indexes ‑percent‑
1. Wilshire 5000 8082.23 8258.42 -2.1
2. S&P 500 851.94 874.02 -2.5
3. Nasdaq 1343.92 1397.08 -3.8
*
*
Today4/1/03
(1)
Wednesday3/19/03
(2)Change(1)-(2)
Option‑Implied Volatility ‑percentage points‑
4. S&P 100 (VIX) 32.45 35.74 -3.29
* Quotes taken at approximately 12:00 pm. Return to table
Exhibit 3Monetary Policy Expectations
Exhibit 3 includes four charts that provide information about recent movements in monetary policyexpectations.
Top panelInterest Rate Futures
A line chart shows the May 2003 federal funds futures rate and the March 2004 Eurodollar futuresrate at five-minute intervals from March 13, 2003 to April 1, 2003. A vertical line denotes 4:00 p.m.on March 24, the end of the available data for the March 25 conference call. From March 24, theMay 2003 federal funds futures rate edged down, on net, from 1.14 percent to below 1.10 percent.The March 2004 Eurodollar futures rate decreases from about 2.2 percent to approximately 2.0percent.
Middle-left panelExpected Federal Funds Rates
A line chart presents the expected path of the federal funds rate as of March 19, 2003 at 3:30 p.m.and as of April 1, 2003 at 12:00 p.m., derived from federal funds and Eurodollar futures with anallowance for term premia and other adjustments. The horizontal axis denotes the horizon of theexpectation, and has a range from March 2003 to July 2005. The expected funds rate path shifteddown over the period from March 19 to April 1. As of April 1, the expected funds rate path falls a bitbelow 1.00 percent in the summer of 2003 before rising to about 3 percent in July 2005.
Middle-right panelShort-term Eurodollar Implied Volatility
A line chart plots the short-term Eurodollar implied volatility, a measure of uncertainty about thefederal funds rate approximately three-months ahead, at a daily frequency from January 2003through March 2003. Amid significant fluctuations, implied volatility rose from 30 percent in earlyJanuary to above 50 percent at the end of March.
Bottom panelProbability of 1.00% target as opposed to 1.25% target
A line chart displays, at five-minute intervals from March 13, 2003 to 12 p.m. on April 1, 2003, theprobability that the federal funds rate will be 1 percent following the May 6 FOMC meeting asopposed to remaining at 1.25 percent, using data from the May 2003 federal funds futures contract.From March 24 at 4:00 p.m. (denoted by a vertical line) until midday on March 31, this probabilityrose from about 60 percent to near 100 percent, but then retraced slightly to about 85 percent at the
*
end of the period.
Exhibit 4Selected Credit Market Indicators
Exhibit 4 includes two charts and a table that provide information on a number of credit marketindicators.
Top panelTen-year Swap Spread
A line chart shows the ten-year swap spread over Treasuries at five-minute intervals from March 13,2003 to April 1, 2003. This spread generally increased over the first part of this period, rising from41 basis points on March 13 to nearly 46 basis points on March 21. The spread subsequentlydecreased to about 41 basis points at the end of the period. A vertical line is placed at March 24,2003 at 4:00 p.m., denoting the available information at the time of the previous conference call onMarch 25.
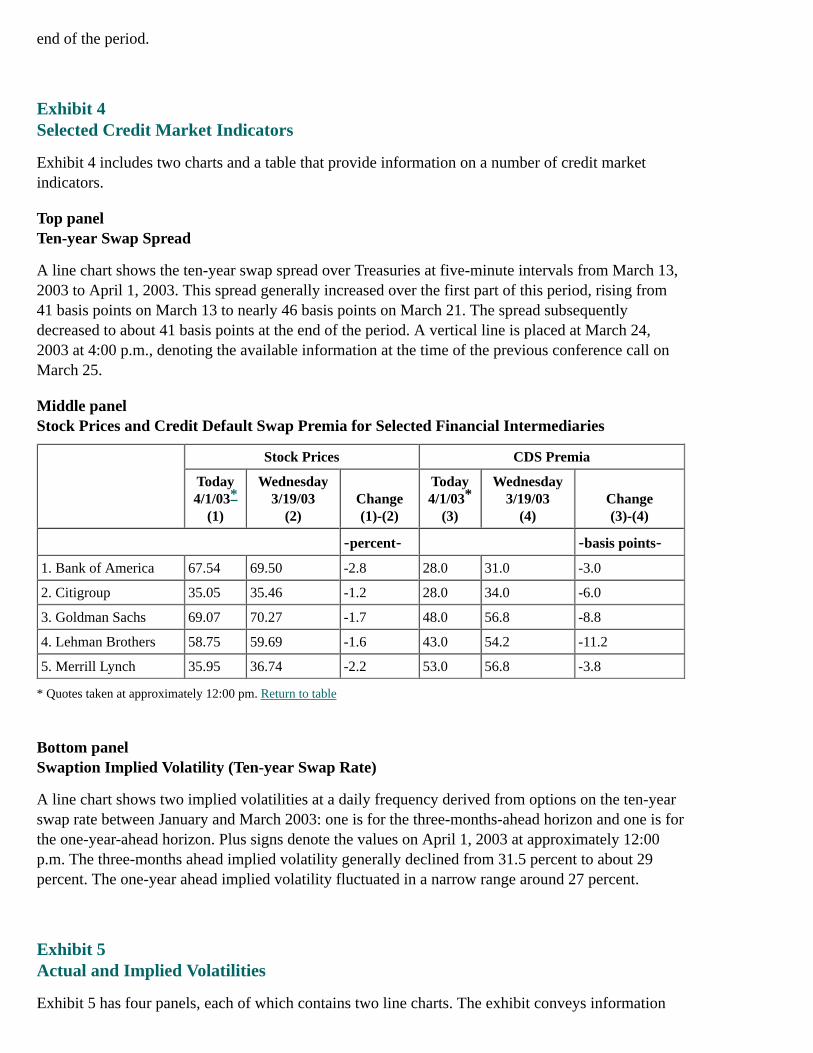
Middle panelStock Prices and Credit Default Swap Premia for Selected Financial Intermediaries
Stock Prices CDS Premia
Today4/1/03
(1)
Wednesday3/19/03
(2)Change(1)-(2)
Today4/1/03
(3)
Wednesday3/19/03
(4)Change(3)-(4)
‑percent‑ ‑basis points‑
1. Bank of America 67.54 69.50 -2.8 28.0 31.0 -3.0
2. Citigroup 35.05 35.46 -1.2 28.0 34.0 -6.0
3. Goldman Sachs 69.07 70.27 -1.7 48.0 56.8 -8.8
4. Lehman Brothers 58.75 59.69 -1.6 43.0 54.2 -11.2
5. Merrill Lynch 35.95 36.74 -2.2 53.0 56.8 -3.8
* Quotes taken at approximately 12:00 pm. Return to table
Bottom panelSwaption Implied Volatility (Ten-year Swap Rate)
A line chart shows two implied volatilities at a daily frequency derived from options on the ten-yearswap rate between January and March 2003: one is for the three-months-ahead horizon and one is forthe one-year-ahead horizon. Plus signs denote the values on April 1, 2003 at approximately 12:00p.m. The three-months ahead implied volatility generally declined from 31.5 percent to about 29percent. The one-year ahead implied volatility fluctuated in a narrow range around 27 percent.
Exhibit 5Actual and Implied Volatilities
Exhibit 5 has four panels, each of which contains two line charts. The exhibit conveys information
* *

about actual volatility in a number of financial markets as well as implied volatility (based on optionsprices) in those same markets. In each panel, the chart on the left displays the volatilities in percent ata daily frequency from May 1998 to March 31, 2003. The chart on the right provides more detailabout the recent movements in volatilities, running from February 1, 2002 to March 31, 2003.
Top panelTwo-Year Swap Volatilities
The line charts plot implied and actual volatilities of the two-year swap rate. In the left chart, impliedand actual volatility generally move together and rose from about 10 percent in October 2000 toabout 60 percent in March 2003. In the right chart, there was a sharp rise in volatility from about 30percent to 60 percent between May and August 2002, after which volatility fluctuated between 45and 60 percent. Actual volatility was below implied volatility in February and early March 2003, butrose back to near implied volatility by the end of March.
Upper middle panelTen-Year Swap Volatilities
The line charts plot implied and actual volatilities of the ten-year swap rate. In the left chart, impliedand actual volatility generally move together through the five-year period. After a modest downtrendfrom October 1998 through October 2000, these volatilities generally rose from about 10 percent inOctober 2000 to about 30 percent in March 2003. In the right chart, there was a sharp rise involatility from about 20 percent to 30 percent between May and August 2002, after which volatilityremained near that level. Actual volatility was below implied volatility in February and early March2003, but rose back to near implied volatility by the end of March.
Lower middle panelS&P 100 Volatilities
The line charts plot implied and actual volatilities of the S&P 100 equity price index. In the leftchart, implied and actual volatility generally move together through the five-year period, althoughactual volatility shows larger fluctuations. Implied volatility fluctuated between 20 and 50 percent inthe May 1998-March 2003 period, while actual volatility fluctuated between 10 and 60 percent. Inthe right chart, there was a notable increase in volatility from about 20 percent to 40 percent betweenMay and August 2002, after which volatilities fluctuated in a narrow range, ending the periodmodestly above 30 percent. Actual volatility was below implied volatility in February and earlyMarch 2003, but rose back to near implied volatility by the end of March.
Bottom panelNasdaq Volatilities
The line charts plot implied and actual volatilities of the Nasdaq equity price index. In the left chart,implied and actual volatility generally move together through the five-year period, although actualvolatility shows some larger spikes in 2000 and 2001. Implied volatility fluctuated between 20 and60 percent in the May 1998-March 2003 period, while actual volatility fluctuated between 20 and100 percent. In the right chart, there was an increase in volatility from about 30 percent to 50 percentbetween May and August 2002, followed by a modest decline to about 40 percent at the end ofMarch 2003. Actual volatility was below implied volatility in January through early March 2003, butrose back to near implied volatility by the end of March.
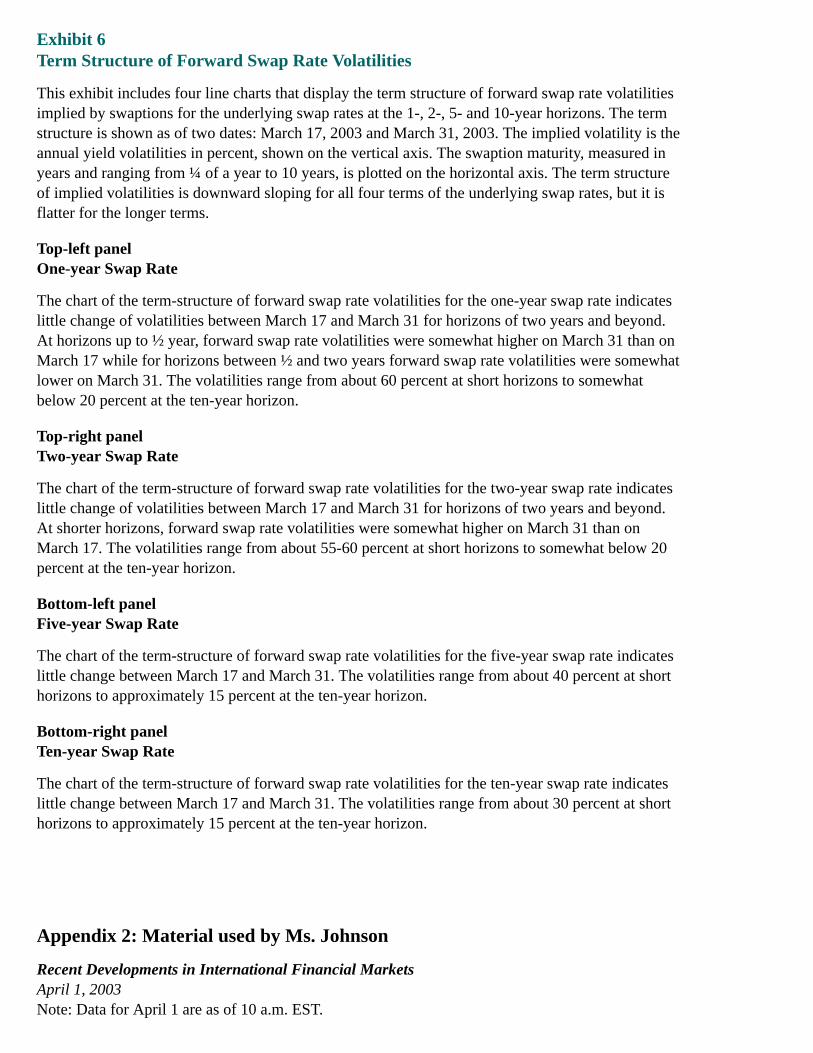
Exhibit 6Term Structure of Forward Swap Rate Volatilities
This exhibit includes four line charts that display the term structure of forward swap rate volatilitiesimplied by swaptions for the underlying swap rates at the 1-, 2-, 5- and 10-year horizons. The termstructure is shown as of two dates: March 17, 2003 and March 31, 2003. The implied volatility is theannual yield volatilities in percent, shown on the vertical axis. The swaption maturity, measured inyears and ranging from ¼ of a year to 10 years, is plotted on the horizontal axis. The term structureof implied volatilities is downward sloping for all four terms of the underlying swap rates, but it isflatter for the longer terms.
Top-left panelOne-year Swap Rate
The chart of the term-structure of forward swap rate volatilities for the one-year swap rate indicateslittle change of volatilities between March 17 and March 31 for horizons of two years and beyond.At horizons up to ½ year, forward swap rate volatilities were somewhat higher on March 31 than onMarch 17 while for horizons between ½ and two years forward swap rate volatilities were somewhatlower on March 31. The volatilities range from about 60 percent at short horizons to somewhatbelow 20 percent at the ten-year horizon.
Top-right panelTwo-year Swap Rate
The chart of the term-structure of forward swap rate volatilities for the two-year swap rate indicateslittle change of volatilities between March 17 and March 31 for horizons of two years and beyond.At shorter horizons, forward swap rate volatilities were somewhat higher on March 31 than onMarch 17. The volatilities range from about 55-60 percent at short horizons to somewhat below 20percent at the ten-year horizon.
Bottom-left panelFive-year Swap Rate
The chart of the term-structure of forward swap rate volatilities for the five-year swap rate indicateslittle change between March 17 and March 31. The volatilities range from about 40 percent at shorthorizons to approximately 15 percent at the ten-year horizon.
Bottom-right panelTen-year Swap Rate
The chart of the term-structure of forward swap rate volatilities for the ten-year swap rate indicateslittle change between March 17 and March 31. The volatilities range from about 30 percent at shorthorizons to approximately 15 percent at the ten-year horizon.
Appendix 2: Material used by Ms. Johnson
Recent Developments in International Financial MarketsApril 1, 2003Note: Data for April 1 are as of 10 a.m. EST.
STRICTLY CONFIDENTIAL (FR) CLASS II-FOMC
Chart 1
04-01-03
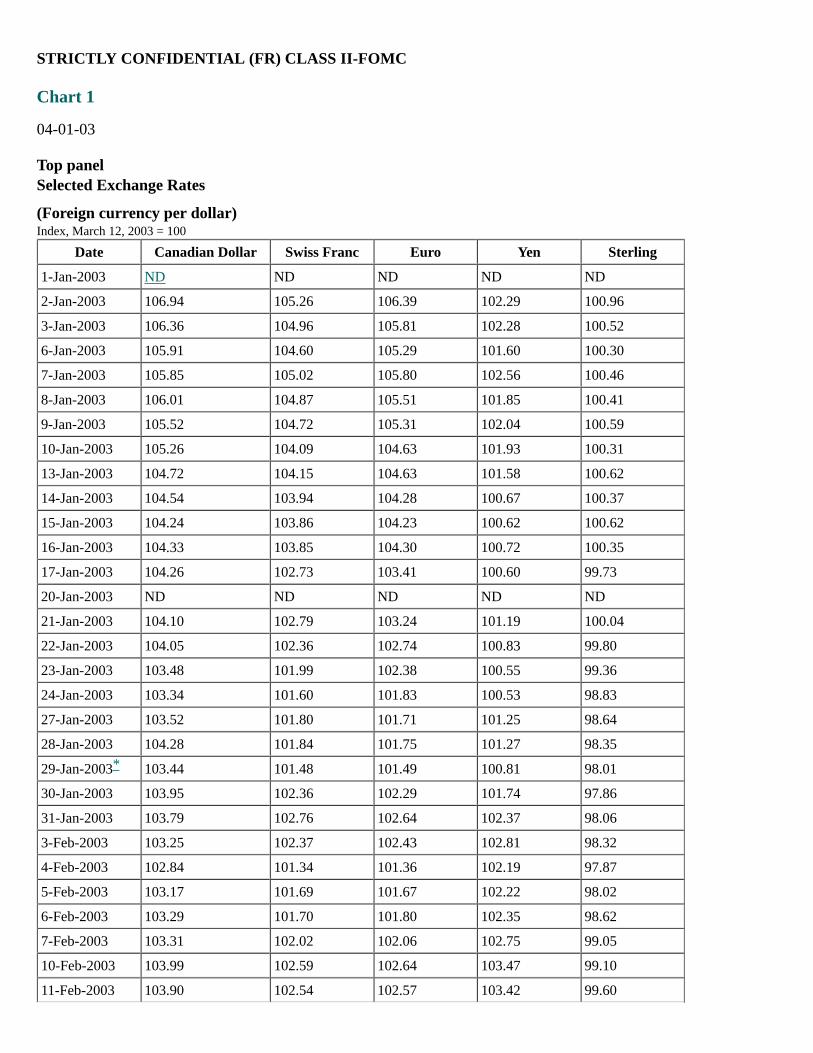
Top panelSelected Exchange Rates
(Foreign currency per dollar)Index, March 12, 2003 = 100
Date Canadian Dollar Swiss Franc Euro Yen Sterling
1-Jan-2003 ND ND ND ND ND
2-Jan-2003 106.94 105.26 106.39 102.29 100.96
3-Jan-2003 106.36 104.96 105.81 102.28 100.52
6-Jan-2003 105.91 104.60 105.29 101.60 100.30
7-Jan-2003 105.85 105.02 105.80 102.56 100.46
8-Jan-2003 106.01 104.87 105.51 101.85 100.41
9-Jan-2003 105.52 104.72 105.31 102.04 100.59
10-Jan-2003 105.26 104.09 104.63 101.93 100.31
13-Jan-2003 104.72 104.15 104.63 101.58 100.62
14-Jan-2003 104.54 103.94 104.28 100.67 100.37
15-Jan-2003 104.24 103.86 104.23 100.62 100.62
16-Jan-2003 104.33 103.85 104.30 100.72 100.35
17-Jan-2003 104.26 102.73 103.41 100.60 99.73
20-Jan-2003 ND ND ND ND ND
21-Jan-2003 104.10 102.79 103.24 101.19 100.04
22-Jan-2003 104.05 102.36 102.74 100.83 99.80
23-Jan-2003 103.48 101.99 102.38 100.55 99.36
24-Jan-2003 103.34 101.60 101.83 100.53 98.83
27-Jan-2003 103.52 101.80 101.71 101.25 98.64
28-Jan-2003 104.28 101.84 101.75 101.27 98.35
29-Jan-2003 103.44 101.48 101.49 100.81 98.01
30-Jan-2003 103.95 102.36 102.29 101.74 97.86
31-Jan-2003 103.79 102.76 102.64 102.37 98.06
3-Feb-2003 103.25 102.37 102.43 102.81 98.32
4-Feb-2003 102.84 101.34 101.36 102.19 97.87
5-Feb-2003 103.17 101.69 101.67 102.22 98.02
6-Feb-2003 103.29 101.70 101.80 102.35 98.62
7-Feb-2003 103.31 102.02 102.06 102.75 99.05
10-Feb-2003 103.99 102.59 102.64 103.47 99.10
11-Feb-2003 103.90 102.54 102.57 103.42 99.60
*
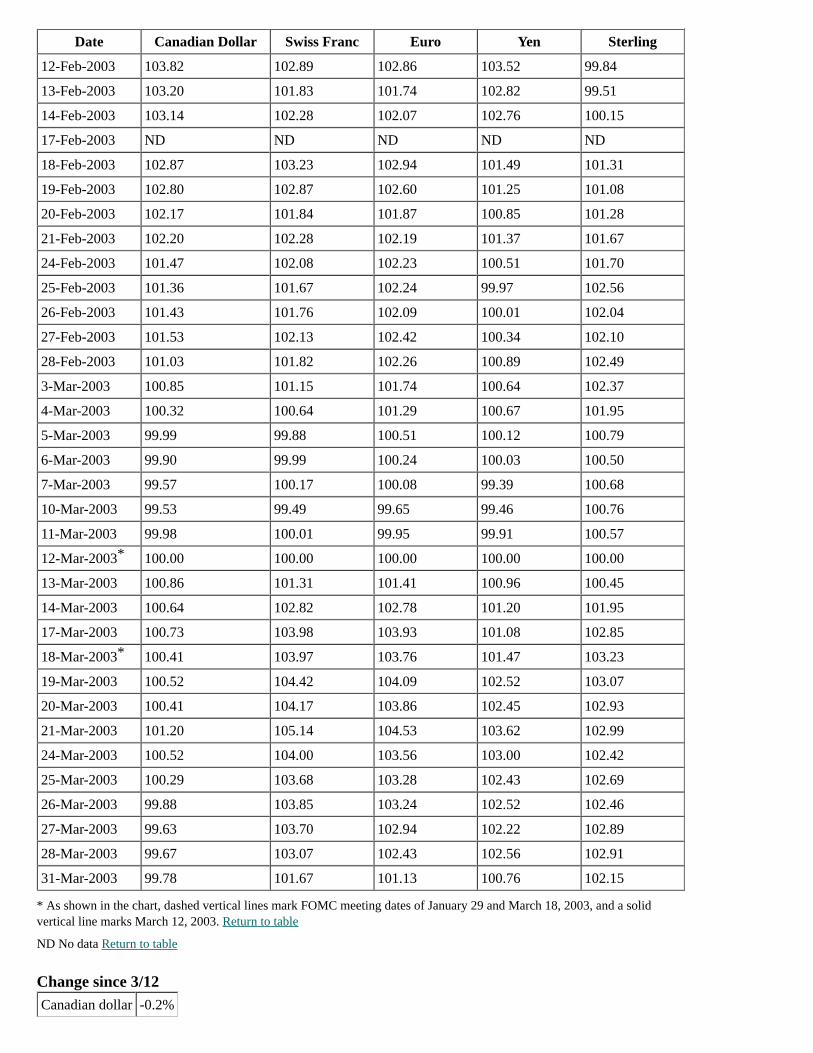
Date Canadian Dollar Swiss Franc Euro Yen Sterling
12-Feb-2003 103.82 102.89 102.86 103.52 99.84
13-Feb-2003 103.20 101.83 101.74 102.82 99.51
14-Feb-2003 103.14 102.28 102.07 102.76 100.15
17-Feb-2003 ND ND ND ND ND
18-Feb-2003 102.87 103.23 102.94 101.49 101.31
19-Feb-2003 102.80 102.87 102.60 101.25 101.08
20-Feb-2003 102.17 101.84 101.87 100.85 101.28
21-Feb-2003 102.20 102.28 102.19 101.37 101.67
24-Feb-2003 101.47 102.08 102.23 100.51 101.70
25-Feb-2003 101.36 101.67 102.24 99.97 102.56
26-Feb-2003 101.43 101.76 102.09 100.01 102.04
27-Feb-2003 101.53 102.13 102.42 100.34 102.10
28-Feb-2003 101.03 101.82 102.26 100.89 102.49
3-Mar-2003 100.85 101.15 101.74 100.64 102.37
4-Mar-2003 100.32 100.64 101.29 100.67 101.95
5-Mar-2003 99.99 99.88 100.51 100.12 100.79
6-Mar-2003 99.90 99.99 100.24 100.03 100.50
7-Mar-2003 99.57 100.17 100.08 99.39 100.68
10-Mar-2003 99.53 99.49 99.65 99.46 100.76
11-Mar-2003 99.98 100.01 99.95 99.91 100.57
12-Mar-2003 100.00 100.00 100.00 100.00 100.00
13-Mar-2003 100.86 101.31 101.41 100.96 100.45
14-Mar-2003 100.64 102.82 102.78 101.20 101.95
17-Mar-2003 100.73 103.98 103.93 101.08 102.85
18-Mar-2003 100.41 103.97 103.76 101.47 103.23
19-Mar-2003 100.52 104.42 104.09 102.52 103.07
20-Mar-2003 100.41 104.17 103.86 102.45 102.93
21-Mar-2003 101.20 105.14 104.53 103.62 102.99
24-Mar-2003 100.52 104.00 103.56 103.00 102.42
25-Mar-2003 100.29 103.68 103.28 102.43 102.69
26-Mar-2003 99.88 103.85 103.24 102.52 102.46
27-Mar-2003 99.63 103.70 102.94 102.22 102.89
28-Mar-2003 99.67 103.07 102.43 102.56 102.91
31-Mar-2003 99.78 101.67 101.13 100.76 102.15
* As shown in the chart, dashed vertical lines mark FOMC meeting dates of January 29 and March 18, 2003, and a solidvertical line marks March 12, 2003. Return to table
ND No data Return to table
Change since 3/12
Canadian dollar -0.2%
*
*
Swiss franc 1.7%
Euro 1.1%
Yen 0.9%
Sterling 2.5%
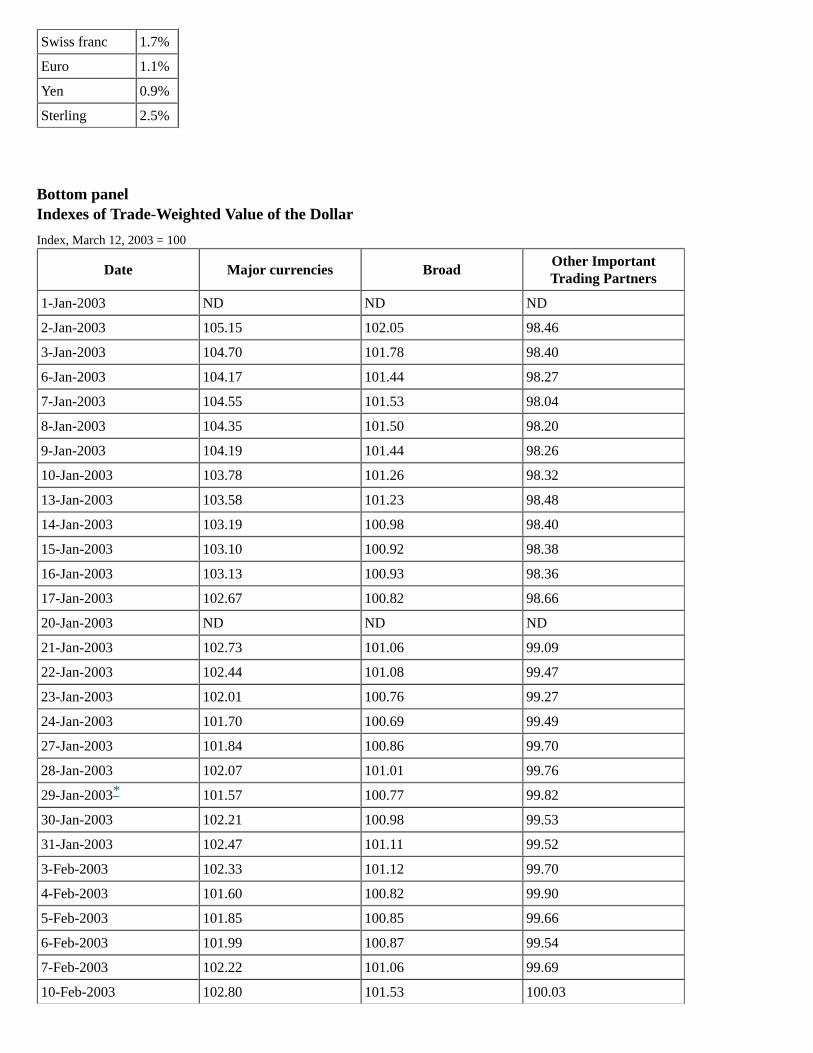
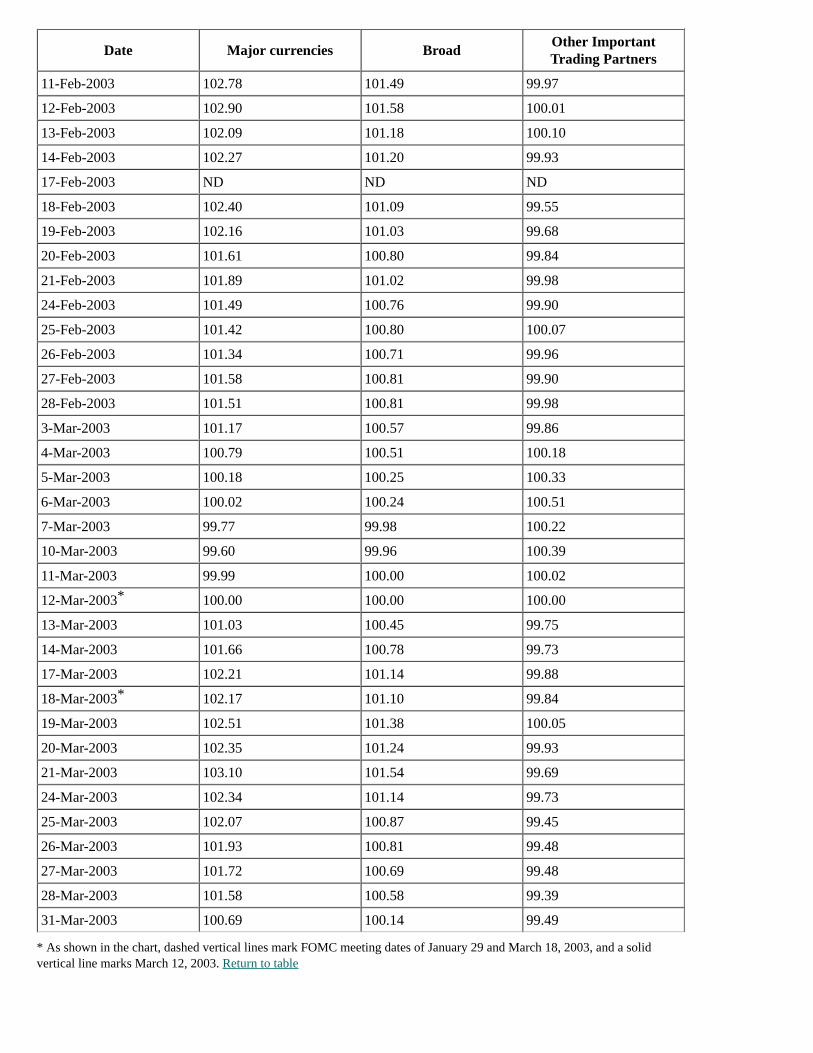
Bottom panelIndexes of Trade-Weighted Value of the Dollar
Index, March 12, 2003 = 100
Date Major currencies BroadOther ImportantTrading Partners
1-Jan-2003 ND ND ND
2-Jan-2003 105.15 102.05 98.46
3-Jan-2003 104.70 101.78 98.40
6-Jan-2003 104.17 101.44 98.27
7-Jan-2003 104.55 101.53 98.04
8-Jan-2003 104.35 101.50 98.20
9-Jan-2003 104.19 101.44 98.26
10-Jan-2003 103.78 101.26 98.32
13-Jan-2003 103.58 101.23 98.48
14-Jan-2003 103.19 100.98 98.40
15-Jan-2003 103.10 100.92 98.38
16-Jan-2003 103.13 100.93 98.36
17-Jan-2003 102.67 100.82 98.66
20-Jan-2003 ND ND ND
21-Jan-2003 102.73 101.06 99.09
22-Jan-2003 102.44 101.08 99.47
23-Jan-2003 102.01 100.76 99.27
24-Jan-2003 101.70 100.69 99.49
27-Jan-2003 101.84 100.86 99.70
28-Jan-2003 102.07 101.01 99.76
29-Jan-2003 101.57 100.77 99.82
30-Jan-2003 102.21 100.98 99.53
31-Jan-2003 102.47 101.11 99.52
3-Feb-2003 102.33 101.12 99.70
4-Feb-2003 101.60 100.82 99.90
5-Feb-2003 101.85 100.85 99.66
6-Feb-2003 101.99 100.87 99.54
7-Feb-2003 102.22 101.06 99.69
10-Feb-2003 102.80 101.53 100.03
*
Date Major currencies BroadOther ImportantTrading Partners
11-Feb-2003 102.78 101.49 99.97
12-Feb-2003 102.90 101.58 100.01
13-Feb-2003 102.09 101.18 100.10
14-Feb-2003 102.27 101.20 99.93
17-Feb-2003 ND ND ND
18-Feb-2003 102.40 101.09 99.55
19-Feb-2003 102.16 101.03 99.68
20-Feb-2003 101.61 100.80 99.84
21-Feb-2003 101.89 101.02 99.98
24-Feb-2003 101.49 100.76 99.90
25-Feb-2003 101.42 100.80 100.07
26-Feb-2003 101.34 100.71 99.96
27-Feb-2003 101.58 100.81 99.90
28-Feb-2003 101.51 100.81 99.98
3-Mar-2003 101.17 100.57 99.86
4-Mar-2003 100.79 100.51 100.18
5-Mar-2003 100.18 100.25 100.33
6-Mar-2003 100.02 100.24 100.51
7-Mar-2003 99.77 99.98 100.22
10-Mar-2003 99.60 99.96 100.39
11-Mar-2003 99.99 100.00 100.02
12-Mar-2003 100.00 100.00 100.00
13-Mar-2003 101.03 100.45 99.75
14-Mar-2003 101.66 100.78 99.73
17-Mar-2003 102.21 101.14 99.88
18-Mar-2003 102.17 101.10 99.84
19-Mar-2003 102.51 101.38 100.05
20-Mar-2003 102.35 101.24 99.93
21-Mar-2003 103.10 101.54 99.69
24-Mar-2003 102.34 101.14 99.73
25-Mar-2003 102.07 100.87 99.45
26-Mar-2003 101.93 100.81 99.48
27-Mar-2003 101.72 100.69 99.48
28-Mar-2003 101.58 100.58 99.39
31-Mar-2003 100.69 100.14 99.49
* As shown in the chart, dashed vertical lines mark FOMC meeting dates of January 29 and March 18, 2003, and a solidvertical line marks March 12, 2003. Return to table
*
*
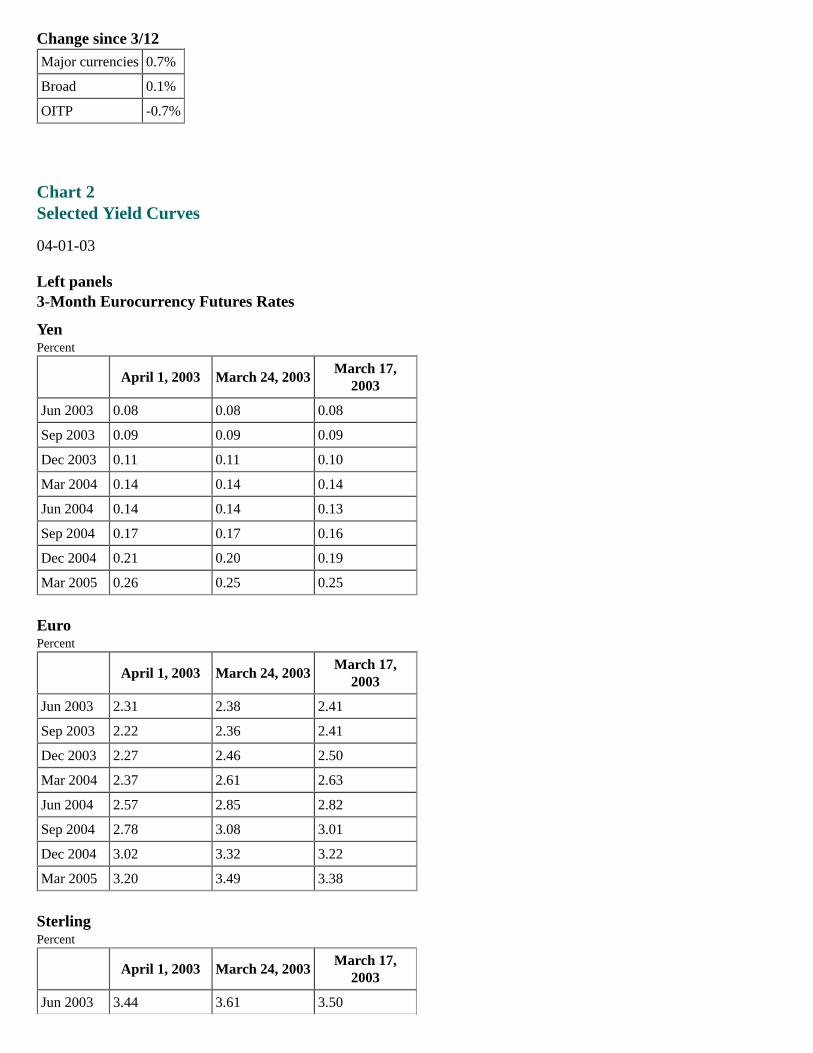
Change since 3/12
Major currencies 0.7%
Broad 0.1%
OITP -0.7%
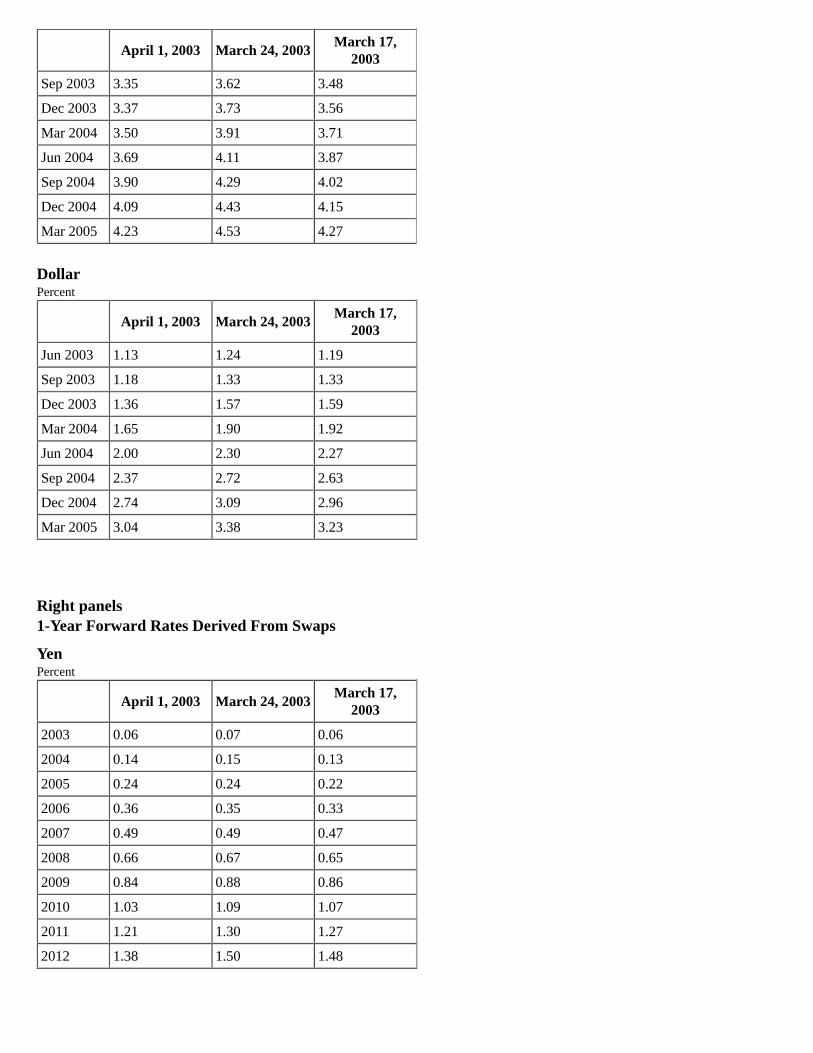
Chart 2Selected Yield Curves
04-01-03
Left panels3-Month Eurocurrency Futures Rates
YenPercent
April 1, 2003 March 24, 2003March 17,
2003
Jun 2003 0.08 0.08 0.08
Sep 2003 0.09 0.09 0.09
Dec 2003 0.11 0.11 0.10
Mar 2004 0.14 0.14 0.14
Jun 2004 0.14 0.14 0.13
Sep 2004 0.17 0.17 0.16
Dec 2004 0.21 0.20 0.19
Mar 2005 0.26 0.25 0.25
EuroPercent
April 1, 2003 March 24, 2003March 17,
2003
Jun 2003 2.31 2.38 2.41
Sep 2003 2.22 2.36 2.41
Dec 2003 2.27 2.46 2.50
Mar 2004 2.37 2.61 2.63
Jun 2004 2.57 2.85 2.82
Sep 2004 2.78 3.08 3.01
Dec 2004 3.02 3.32 3.22
Mar 2005 3.20 3.49 3.38
SterlingPercent
April 1, 2003 March 24, 2003March 17,
2003
Jun 2003 3.44 3.61 3.50
April 1, 2003 March 24, 2003March 17,
2003
Sep 2003 3.35 3.62 3.48
Dec 2003 3.37 3.73 3.56
Mar 2004 3.50 3.91 3.71
Jun 2004 3.69 4.11 3.87
Sep 2004 3.90 4.29 4.02
Dec 2004 4.09 4.43 4.15
Mar 2005 4.23 4.53 4.27
DollarPercent
April 1, 2003 March 24, 2003March 17,
2003
Jun 2003 1.13 1.24 1.19
Sep 2003 1.18 1.33 1.33
Dec 2003 1.36 1.57 1.59
Mar 2004 1.65 1.90 1.92
Jun 2004 2.00 2.30 2.27
Sep 2004 2.37 2.72 2.63
Dec 2004 2.74 3.09 2.96
Mar 2005 3.04 3.38 3.23
Right panels1-Year Forward Rates Derived From Swaps
YenPercent
April 1, 2003 March 24, 2003March 17,
2003
2003 0.06 0.07 0.06
2004 0.14 0.15 0.13
2005 0.24 0.24 0.22
2006 0.36 0.35 0.33
2007 0.49 0.49 0.47
2008 0.66 0.67 0.65
2009 0.84 0.88 0.86
2010 1.03 1.09 1.07
2011 1.21 1.30 1.27
2012 1.38 1.50 1.48
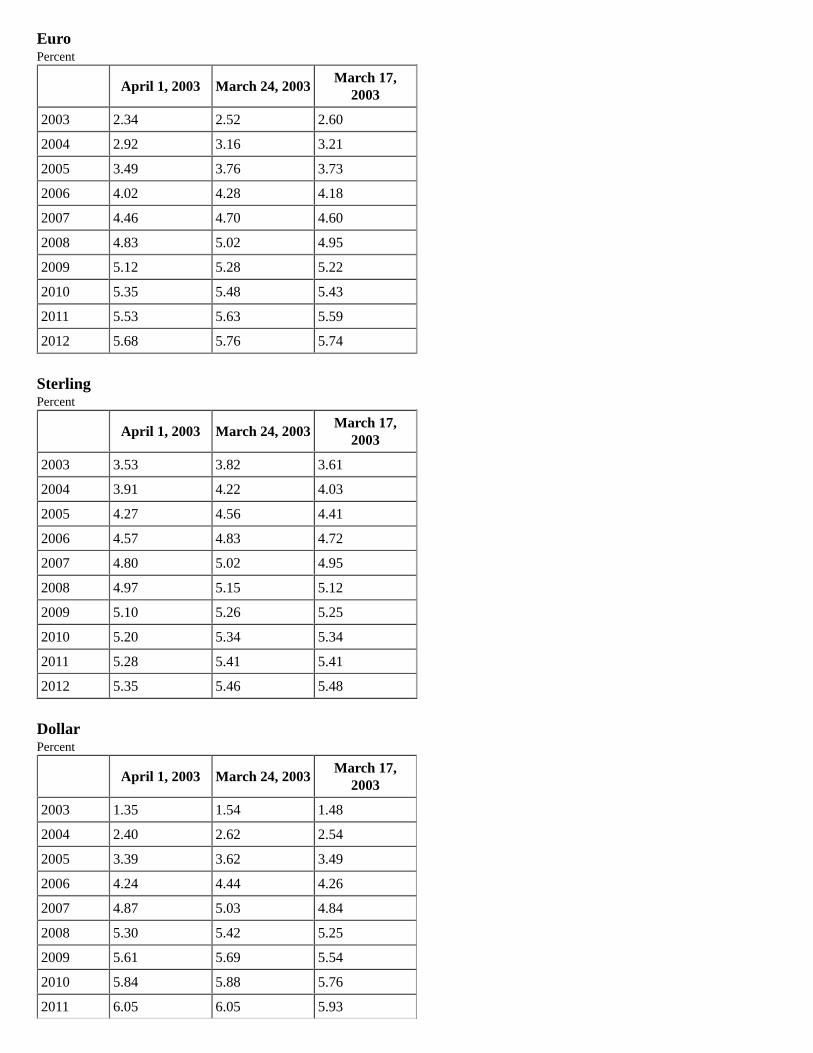
EuroPercent
April 1, 2003 March 24, 2003March 17,
2003
2003 2.34 2.52 2.60
2004 2.92 3.16 3.21
2005 3.49 3.76 3.73
2006 4.02 4.28 4.18
2007 4.46 4.70 4.60
2008 4.83 5.02 4.95
2009 5.12 5.28 5.22
2010 5.35 5.48 5.43
2011 5.53 5.63 5.59
2012 5.68 5.76 5.74
SterlingPercent
April 1, 2003 March 24, 2003March 17,
2003
2003 3.53 3.82 3.61
2004 3.91 4.22 4.03
2005 4.27 4.56 4.41
2006 4.57 4.83 4.72
2007 4.80 5.02 4.95
2008 4.97 5.15 5.12
2009 5.10 5.26 5.25
2010 5.20 5.34 5.34
2011 5.28 5.41 5.41
2012 5.35 5.46 5.48
DollarPercent
April 1, 2003 March 24, 2003March 17,
2003
2003 1.35 1.54 1.48
2004 2.40 2.62 2.54
2005 3.39 3.62 3.49
2006 4.24 4.44 4.26
2007 4.87 5.03 4.84
2008 5.30 5.42 5.25
2009 5.61 5.69 5.54
2010 5.84 5.88 5.76
2011 6.05 6.05 5.93
April 1, 2003 March 24, 2003March 17,
2003
2012 6.26 6.22 6.07
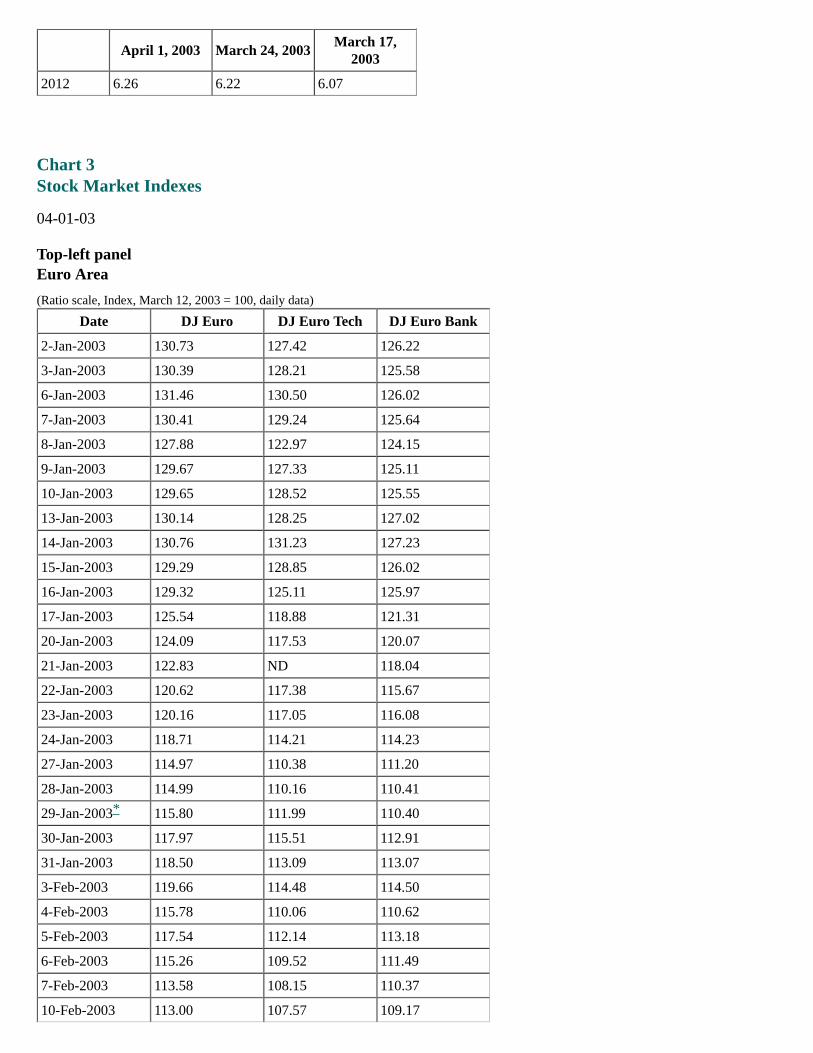
Chart 3Stock Market Indexes
04-01-03
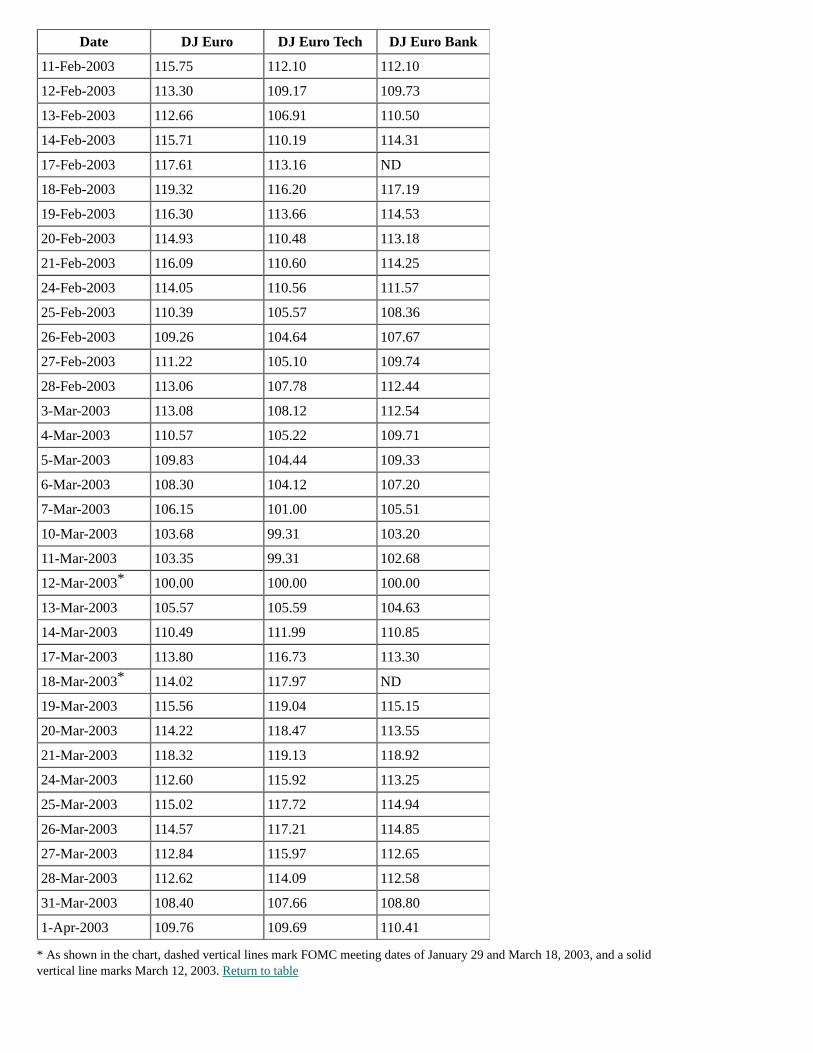
Top-left panelEuro Area
(Ratio scale, Index, March 12, 2003 = 100, daily data)
Date DJ Euro DJ Euro Tech DJ Euro Bank
2-Jan-2003 130.73 127.42 126.22
3-Jan-2003 130.39 128.21 125.58
6-Jan-2003 131.46 130.50 126.02
7-Jan-2003 130.41 129.24 125.64
8-Jan-2003 127.88 122.97 124.15
9-Jan-2003 129.67 127.33 125.11
10-Jan-2003 129.65 128.52 125.55
13-Jan-2003 130.14 128.25 127.02
14-Jan-2003 130.76 131.23 127.23
15-Jan-2003 129.29 128.85 126.02
16-Jan-2003 129.32 125.11 125.97
17-Jan-2003 125.54 118.88 121.31
20-Jan-2003 124.09 117.53 120.07
21-Jan-2003 122.83 ND 118.04
22-Jan-2003 120.62 117.38 115.67
23-Jan-2003 120.16 117.05 116.08
24-Jan-2003 118.71 114.21 114.23
27-Jan-2003 114.97 110.38 111.20
28-Jan-2003 114.99 110.16 110.41
29-Jan-2003 115.80 111.99 110.40
30-Jan-2003 117.97 115.51 112.91
31-Jan-2003 118.50 113.09 113.07
3-Feb-2003 119.66 114.48 114.50
4-Feb-2003 115.78 110.06 110.62
5-Feb-2003 117.54 112.14 113.18
6-Feb-2003 115.26 109.52 111.49
7-Feb-2003 113.58 108.15 110.37
10-Feb-2003 113.00 107.57 109.17
*
Date DJ Euro DJ Euro Tech DJ Euro Bank
11-Feb-2003 115.75 112.10 112.10
12-Feb-2003 113.30 109.17 109.73
13-Feb-2003 112.66 106.91 110.50
14-Feb-2003 115.71 110.19 114.31
17-Feb-2003 117.61 113.16 ND
18-Feb-2003 119.32 116.20 117.19
19-Feb-2003 116.30 113.66 114.53
20-Feb-2003 114.93 110.48 113.18
21-Feb-2003 116.09 110.60 114.25
24-Feb-2003 114.05 110.56 111.57
25-Feb-2003 110.39 105.57 108.36
26-Feb-2003 109.26 104.64 107.67
27-Feb-2003 111.22 105.10 109.74
28-Feb-2003 113.06 107.78 112.44
3-Mar-2003 113.08 108.12 112.54
4-Mar-2003 110.57 105.22 109.71
5-Mar-2003 109.83 104.44 109.33
6-Mar-2003 108.30 104.12 107.20
7-Mar-2003 106.15 101.00 105.51
10-Mar-2003 103.68 99.31 103.20
11-Mar-2003 103.35 99.31 102.68
12-Mar-2003 100.00 100.00 100.00
13-Mar-2003 105.57 105.59 104.63
14-Mar-2003 110.49 111.99 110.85
17-Mar-2003 113.80 116.73 113.30
18-Mar-2003 114.02 117.97 ND
19-Mar-2003 115.56 119.04 115.15
20-Mar-2003 114.22 118.47 113.55
21-Mar-2003 118.32 119.13 118.92
24-Mar-2003 112.60 115.92 113.25
25-Mar-2003 115.02 117.72 114.94
26-Mar-2003 114.57 117.21 114.85
27-Mar-2003 112.84 115.97 112.65
28-Mar-2003 112.62 114.09 112.58
31-Mar-2003 108.40 107.66 108.80
1-Apr-2003 109.76 109.69 110.41
* As shown in the chart, dashed vertical lines mark FOMC meeting dates of January 29 and March 18, 2003, and a solidvertical line marks March 12, 2003. Return to table
*
*
Change since 3/12
DJ Euro 9.1%
DJ Euro Tech 8.6%
DJ Euro Bank 9.9%
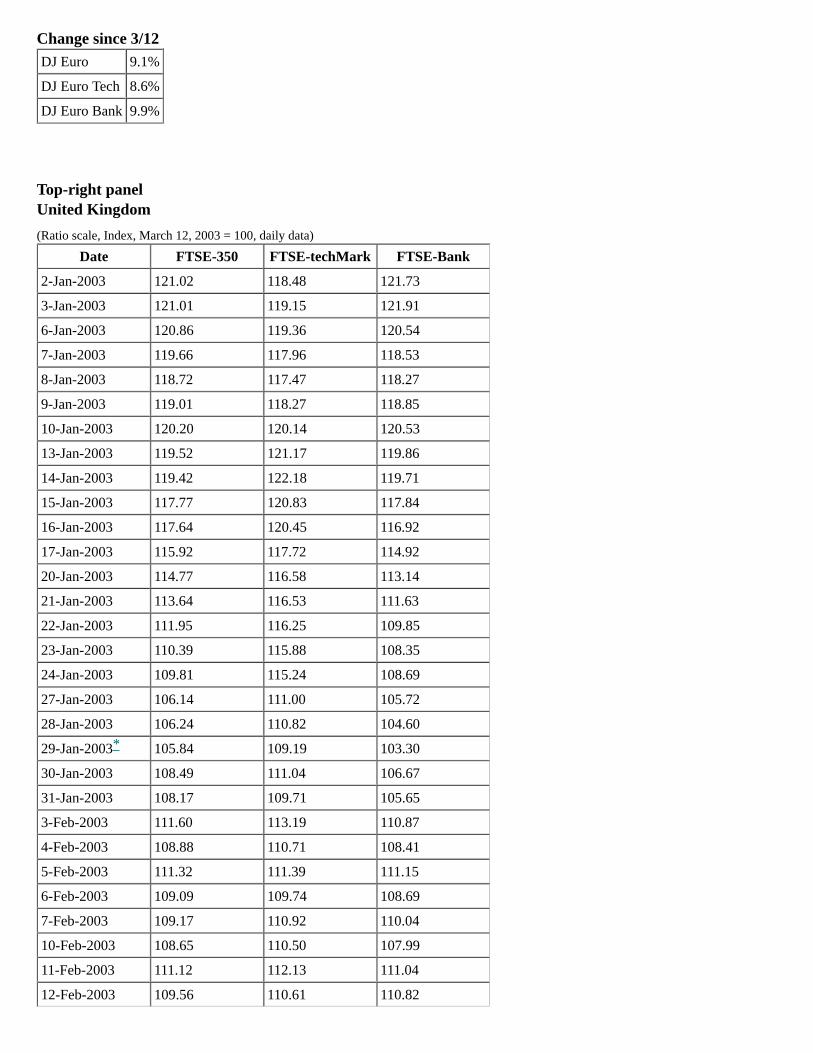
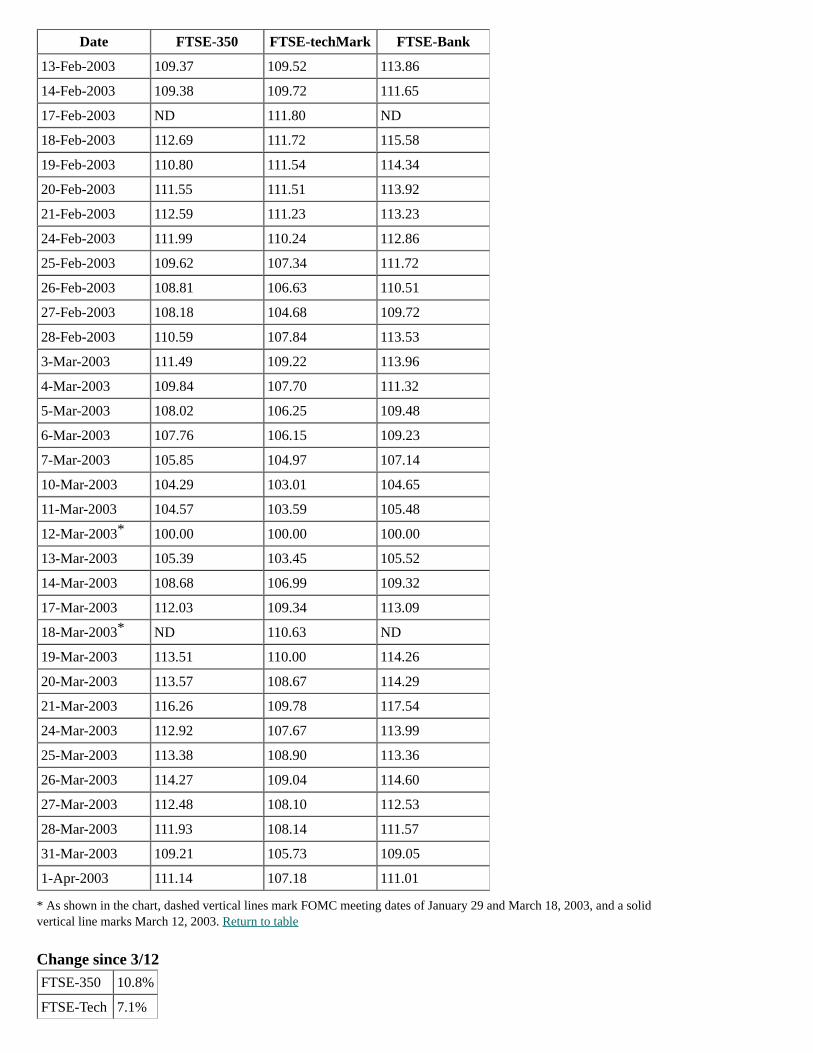
Top-right panelUnited Kingdom
(Ratio scale, Index, March 12, 2003 = 100, daily data)
Date FTSE-350 FTSE-techMark FTSE-Bank
2-Jan-2003 121.02 118.48 121.73
3-Jan-2003 121.01 119.15 121.91
6-Jan-2003 120.86 119.36 120.54
7-Jan-2003 119.66 117.96 118.53
8-Jan-2003 118.72 117.47 118.27
9-Jan-2003 119.01 118.27 118.85
10-Jan-2003 120.20 120.14 120.53
13-Jan-2003 119.52 121.17 119.86
14-Jan-2003 119.42 122.18 119.71
15-Jan-2003 117.77 120.83 117.84
16-Jan-2003 117.64 120.45 116.92
17-Jan-2003 115.92 117.72 114.92
20-Jan-2003 114.77 116.58 113.14
21-Jan-2003 113.64 116.53 111.63
22-Jan-2003 111.95 116.25 109.85
23-Jan-2003 110.39 115.88 108.35
24-Jan-2003 109.81 115.24 108.69
27-Jan-2003 106.14 111.00 105.72
28-Jan-2003 106.24 110.82 104.60
29-Jan-2003 105.84 109.19 103.30
30-Jan-2003 108.49 111.04 106.67
31-Jan-2003 108.17 109.71 105.65
3-Feb-2003 111.60 113.19 110.87
4-Feb-2003 108.88 110.71 108.41
5-Feb-2003 111.32 111.39 111.15
6-Feb-2003 109.09 109.74 108.69
7-Feb-2003 109.17 110.92 110.04
10-Feb-2003 108.65 110.50 107.99
11-Feb-2003 111.12 112.13 111.04
12-Feb-2003 109.56 110.61 110.82
*
Date FTSE-350 FTSE-techMark FTSE-Bank
13-Feb-2003 109.37 109.52 113.86
14-Feb-2003 109.38 109.72 111.65
17-Feb-2003 ND 111.80 ND
18-Feb-2003 112.69 111.72 115.58
19-Feb-2003 110.80 111.54 114.34
20-Feb-2003 111.55 111.51 113.92
21-Feb-2003 112.59 111.23 113.23
24-Feb-2003 111.99 110.24 112.86
25-Feb-2003 109.62 107.34 111.72
26-Feb-2003 108.81 106.63 110.51
27-Feb-2003 108.18 104.68 109.72
28-Feb-2003 110.59 107.84 113.53
3-Mar-2003 111.49 109.22 113.96
4-Mar-2003 109.84 107.70 111.32
5-Mar-2003 108.02 106.25 109.48
6-Mar-2003 107.76 106.15 109.23
7-Mar-2003 105.85 104.97 107.14
10-Mar-2003 104.29 103.01 104.65
11-Mar-2003 104.57 103.59 105.48
12-Mar-2003 100.00 100.00 100.00
13-Mar-2003 105.39 103.45 105.52
14-Mar-2003 108.68 106.99 109.32
17-Mar-2003 112.03 109.34 113.09
18-Mar-2003 ND 110.63 ND
19-Mar-2003 113.51 110.00 114.26
20-Mar-2003 113.57 108.67 114.29
21-Mar-2003 116.26 109.78 117.54
24-Mar-2003 112.92 107.67 113.99
25-Mar-2003 113.38 108.90 113.36
26-Mar-2003 114.27 109.04 114.60
27-Mar-2003 112.48 108.10 112.53
28-Mar-2003 111.93 108.14 111.57
31-Mar-2003 109.21 105.73 109.05
1-Apr-2003 111.14 107.18 111.01
* As shown in the chart, dashed vertical lines mark FOMC meeting dates of January 29 and March 18, 2003, and a solidvertical line marks March 12, 2003. Return to table
Change since 3/12
FTSE-350 10.8%
FTSE-Tech 7.1%
*
*

FTSE-Bank 10.5%
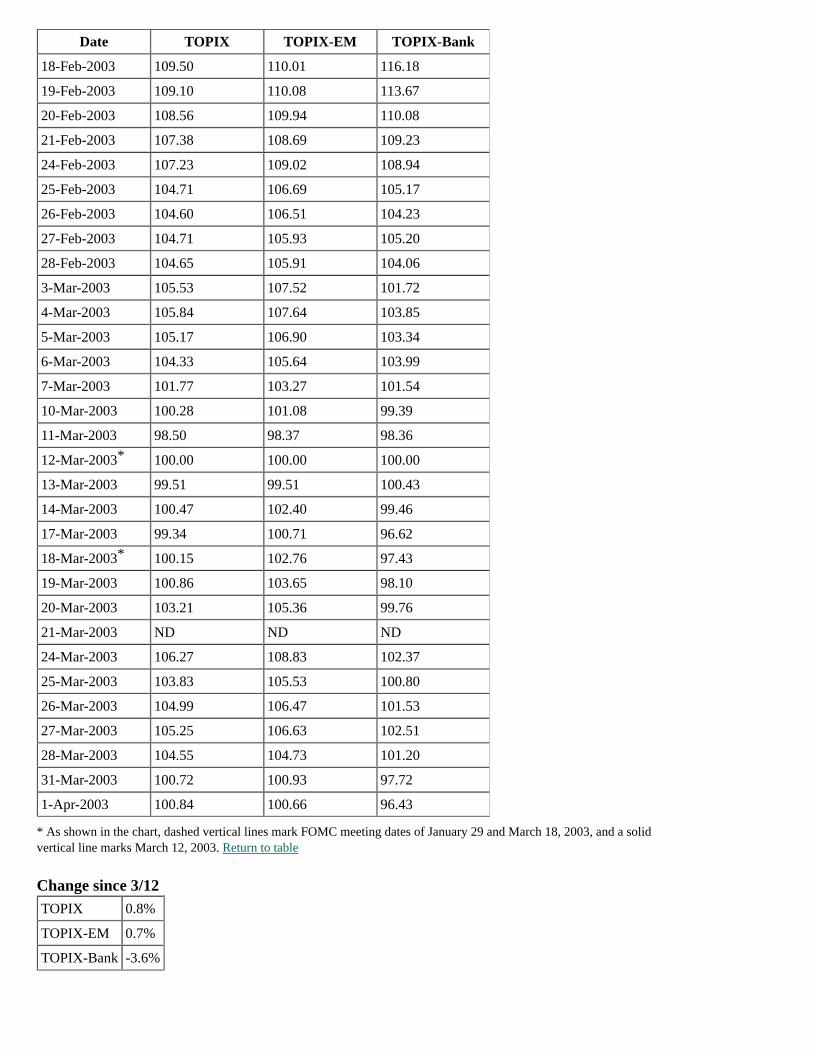
Bottom-left panelJapan
(Ratio scale, Index, March 12, 2003 = 100, daily data)
Date TOPIX TOPIX-EM TOPIX-Bank
2-Jan-2003 ND ND ND
3-Jan-2003 ND ND ND
6-Jan-2003 109.93 111.44 116.30
7-Jan-2003 109.15 111.68 113.70
8-Jan-2003 107.31 109.79 111.00
9-Jan-2003 107.28 109.37 110.77
10-Jan-2003 107.07 109.73 111.11
13-Jan-2003 ND ND ND
14-Jan-2003 108.12 111.11 113.06
15-Jan-2003 109.37 111.70 116.58
16-Jan-2003 109.45 111.67 118.21
17-Jan-2003 109.83 112.88 119.28
20-Jan-2003 109.14 111.09 119.46
21-Jan-2003 110.39 112.61 120.86
22-Jan-2003 109.16 112.02 119.14
23-Jan-2003 110.62 114.56 121.24
24-Jan-2003 110.10 113.32 120.99
27-Jan-2003 108.65 110.57 118.39
28-Jan-2003 107.51 109.35 116.54
29-Jan-2003 105.54 106.66 113.07
30-Jan-2003 105.47 107.15 112.12
31-Jan-2003 104.96 106.59 111.13
3-Feb-2003 107.07 109.13 115.74
4-Feb-2003 107.91 109.09 116.97
5-Feb-2003 108.04 109.30 115.93
6-Feb-2003 107.36 107.92 114.92
7-Feb-2003 107.25 107.13 114.51
10-Feb-2003 107.71 107.71 114.74
11-Feb-2003 ND ND ND
12-Feb-2003 109.57 109.72 118.13
13-Feb-2003 109.03 108.55 119.55
14-Feb-2003 109.67 109.76 119.44
17-Feb-2003 110.14 111.02 118.79
*
Date TOPIX TOPIX-EM TOPIX-Bank
18-Feb-2003 109.50 110.01 116.18
19-Feb-2003 109.10 110.08 113.67
20-Feb-2003 108.56 109.94 110.08
21-Feb-2003 107.38 108.69 109.23
24-Feb-2003 107.23 109.02 108.94
25-Feb-2003 104.71 106.69 105.17
26-Feb-2003 104.60 106.51 104.23
27-Feb-2003 104.71 105.93 105.20
28-Feb-2003 104.65 105.91 104.06
3-Mar-2003 105.53 107.52 101.72
4-Mar-2003 105.84 107.64 103.85
5-Mar-2003 105.17 106.90 103.34
6-Mar-2003 104.33 105.64 103.99
7-Mar-2003 101.77 103.27 101.54
10-Mar-2003 100.28 101.08 99.39
11-Mar-2003 98.50 98.37 98.36
12-Mar-2003 100.00 100.00 100.00
13-Mar-2003 99.51 99.51 100.43
14-Mar-2003 100.47 102.40 99.46
17-Mar-2003 99.34 100.71 96.62
18-Mar-2003 100.15 102.76 97.43
19-Mar-2003 100.86 103.65 98.10
20-Mar-2003 103.21 105.36 99.76
21-Mar-2003 ND ND ND
24-Mar-2003 106.27 108.83 102.37
25-Mar-2003 103.83 105.53 100.80
26-Mar-2003 104.99 106.47 101.53
27-Mar-2003 105.25 106.63 102.51
28-Mar-2003 104.55 104.73 101.20
31-Mar-2003 100.72 100.93 97.72
1-Apr-2003 100.84 100.66 96.43
* As shown in the chart, dashed vertical lines mark FOMC meeting dates of January 29 and March 18, 2003, and a solidvertical line marks March 12, 2003. Return to table
Change since 3/12
TOPIX 0.8%
TOPIX-EM 0.7%
TOPIX-Bank -3.6%
*
*
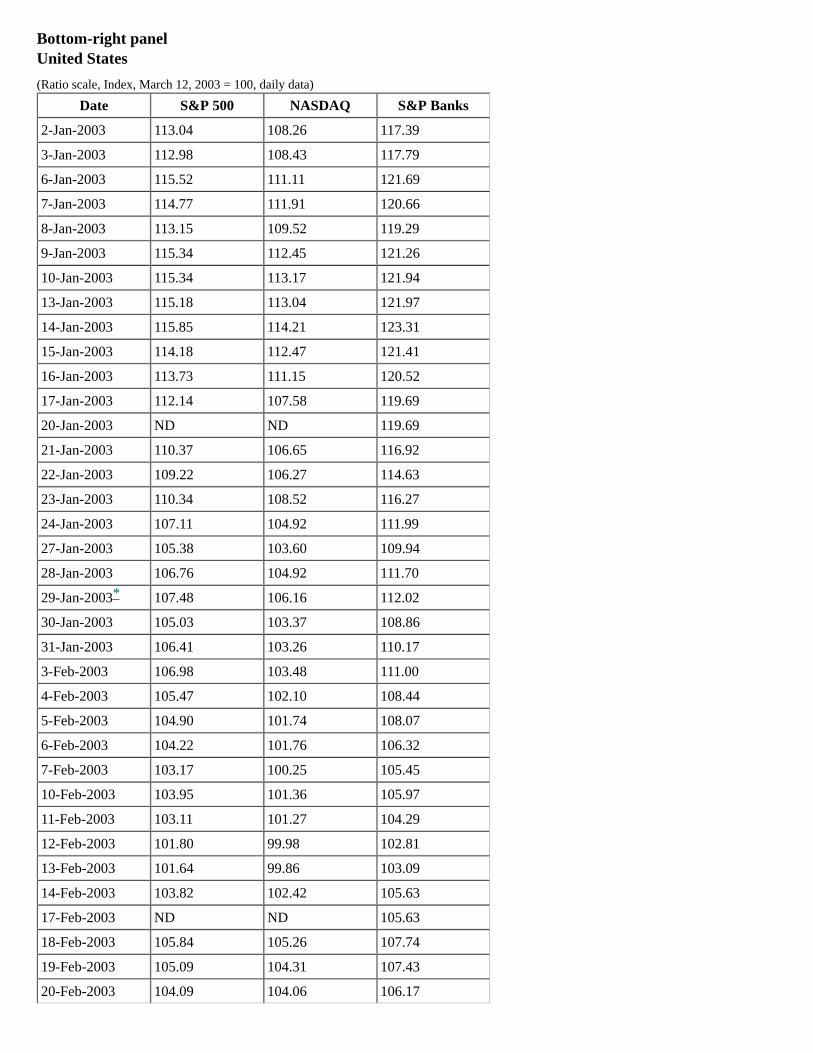
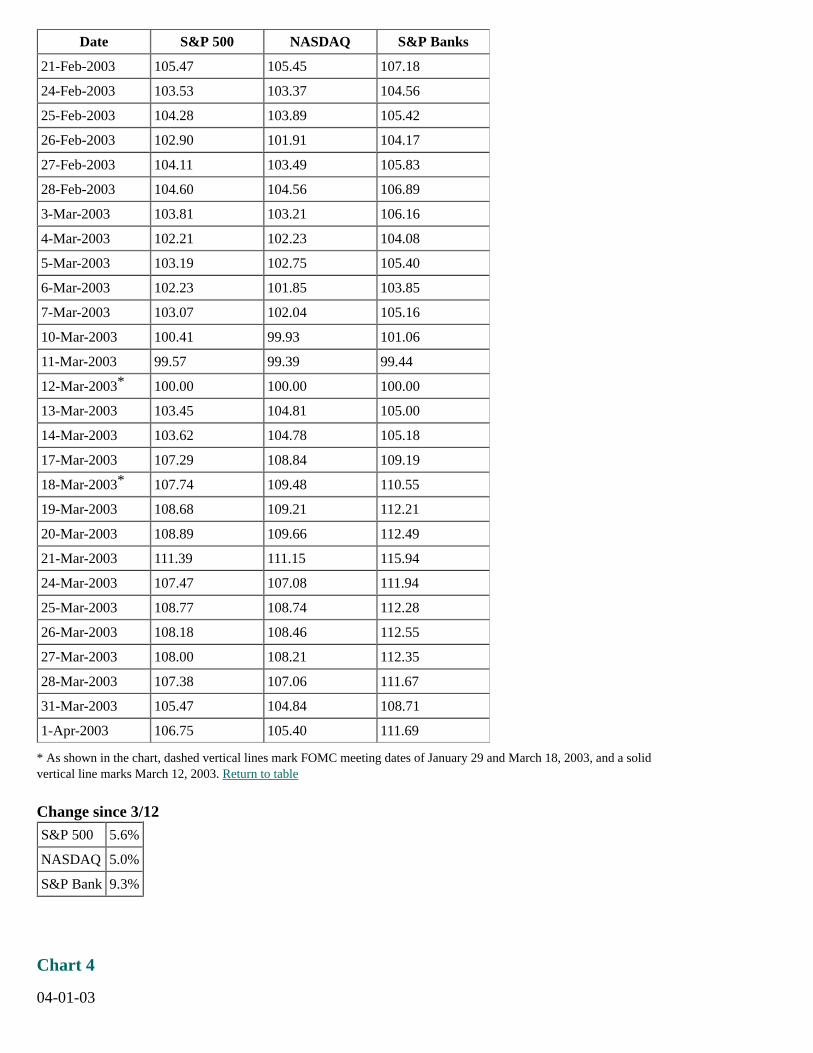
Bottom-right panelUnited States
(Ratio scale, Index, March 12, 2003 = 100, daily data)
Date S&P 500 NASDAQ S&P Banks
2-Jan-2003 113.04 108.26 117.39
3-Jan-2003 112.98 108.43 117.79
6-Jan-2003 115.52 111.11 121.69
7-Jan-2003 114.77 111.91 120.66
8-Jan-2003 113.15 109.52 119.29
9-Jan-2003 115.34 112.45 121.26
10-Jan-2003 115.34 113.17 121.94
13-Jan-2003 115.18 113.04 121.97
14-Jan-2003 115.85 114.21 123.31
15-Jan-2003 114.18 112.47 121.41
16-Jan-2003 113.73 111.15 120.52
17-Jan-2003 112.14 107.58 119.69
20-Jan-2003 ND ND 119.69
21-Jan-2003 110.37 106.65 116.92
22-Jan-2003 109.22 106.27 114.63
23-Jan-2003 110.34 108.52 116.27
24-Jan-2003 107.11 104.92 111.99
27-Jan-2003 105.38 103.60 109.94
28-Jan-2003 106.76 104.92 111.70
29-Jan-2003 107.48 106.16 112.02
30-Jan-2003 105.03 103.37 108.86
31-Jan-2003 106.41 103.26 110.17
3-Feb-2003 106.98 103.48 111.00
4-Feb-2003 105.47 102.10 108.44
5-Feb-2003 104.90 101.74 108.07
6-Feb-2003 104.22 101.76 106.32
7-Feb-2003 103.17 100.25 105.45
10-Feb-2003 103.95 101.36 105.97
11-Feb-2003 103.11 101.27 104.29
12-Feb-2003 101.80 99.98 102.81
13-Feb-2003 101.64 99.86 103.09
14-Feb-2003 103.82 102.42 105.63
17-Feb-2003 ND ND 105.63
18-Feb-2003 105.84 105.26 107.74
19-Feb-2003 105.09 104.31 107.43
20-Feb-2003 104.09 104.06 106.17
*
Date S&P 500 NASDAQ S&P Banks
21-Feb-2003 105.47 105.45 107.18
24-Feb-2003 103.53 103.37 104.56
25-Feb-2003 104.28 103.89 105.42
26-Feb-2003 102.90 101.91 104.17
27-Feb-2003 104.11 103.49 105.83
28-Feb-2003 104.60 104.56 106.89
3-Mar-2003 103.81 103.21 106.16
4-Mar-2003 102.21 102.23 104.08
5-Mar-2003 103.19 102.75 105.40
6-Mar-2003 102.23 101.85 103.85
7-Mar-2003 103.07 102.04 105.16
10-Mar-2003 100.41 99.93 101.06
11-Mar-2003 99.57 99.39 99.44
12-Mar-2003 100.00 100.00 100.00
13-Mar-2003 103.45 104.81 105.00
14-Mar-2003 103.62 104.78 105.18
17-Mar-2003 107.29 108.84 109.19
18-Mar-2003 107.74 109.48 110.55
19-Mar-2003 108.68 109.21 112.21
20-Mar-2003 108.89 109.66 112.49
21-Mar-2003 111.39 111.15 115.94
24-Mar-2003 107.47 107.08 111.94
25-Mar-2003 108.77 108.74 112.28
26-Mar-2003 108.18 108.46 112.55
27-Mar-2003 108.00 108.21 112.35
28-Mar-2003 107.38 107.06 111.67
31-Mar-2003 105.47 104.84 108.71
1-Apr-2003 106.75 105.40 111.69
* As shown in the chart, dashed vertical lines mark FOMC meeting dates of January 29 and March 18, 2003, and a solidvertical line marks March 12, 2003. Return to table
Change since 3/12
S&P 500 5.6%
NASDAQ 5.0%
S&P Bank 9.3%
Chart 4
04-01-03
*
*
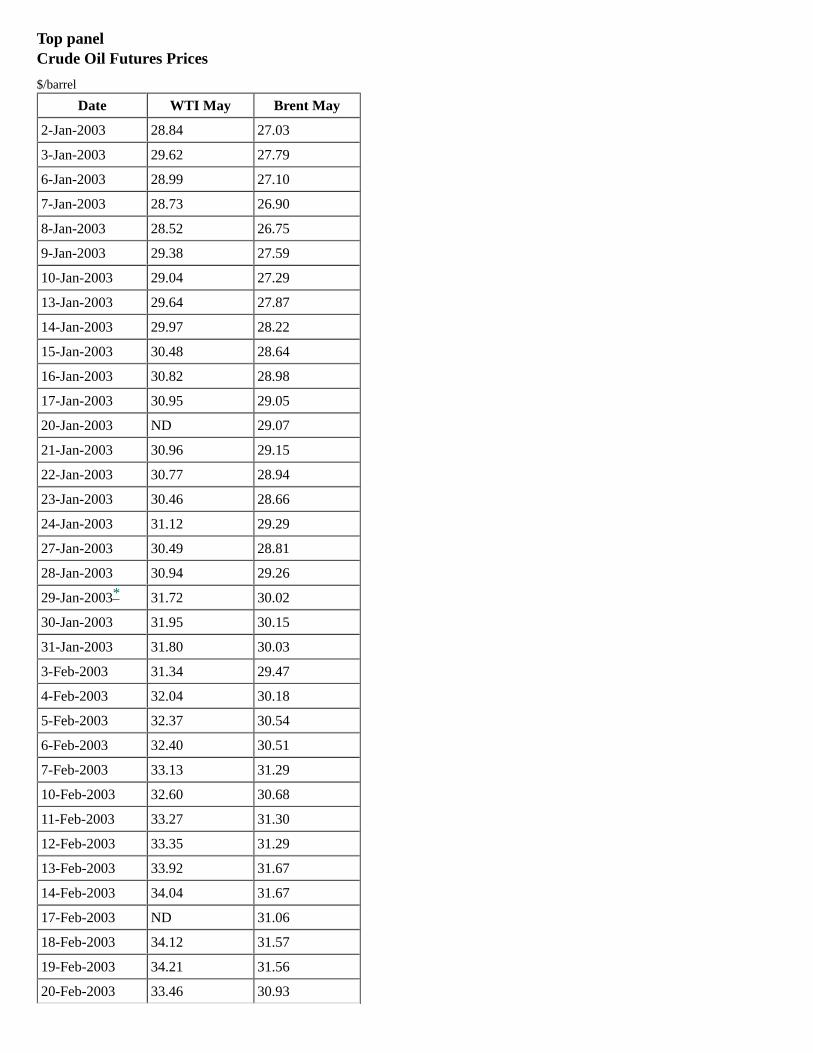
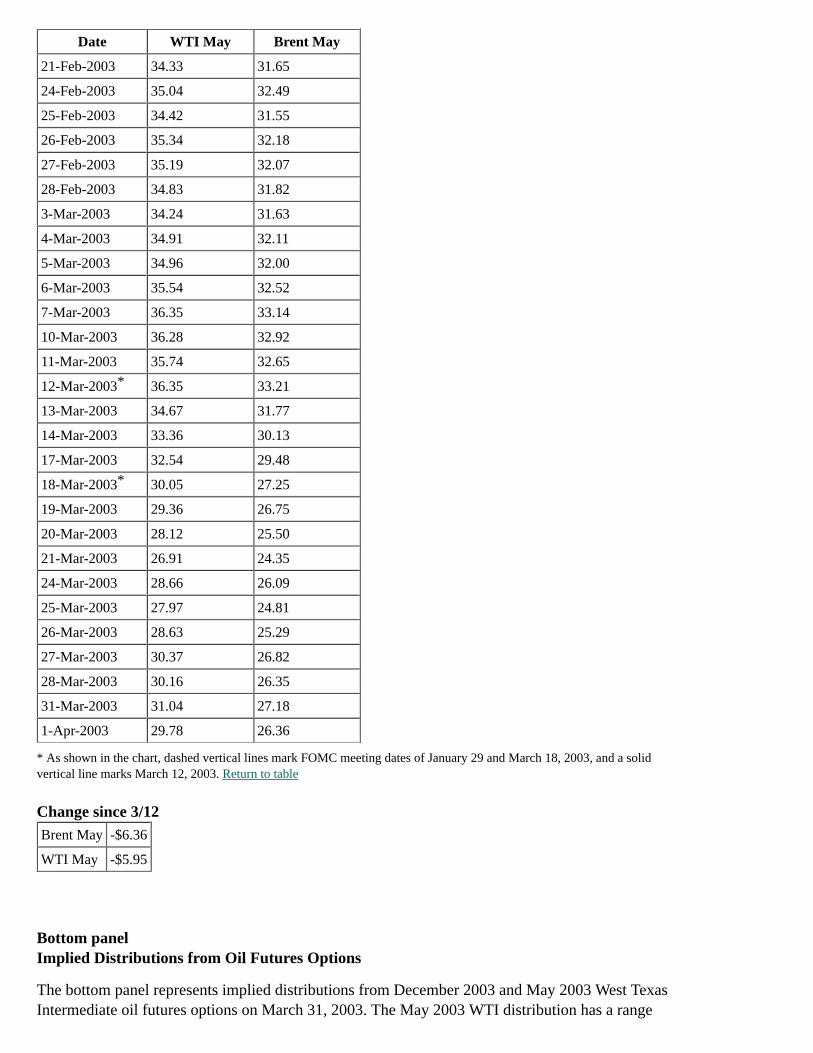
Top panelCrude Oil Futures Prices
$/barrel
Date WTI May Brent May
2-Jan-2003 28.84 27.03
3-Jan-2003 29.62 27.79
6-Jan-2003 28.99 27.10
7-Jan-2003 28.73 26.90
8-Jan-2003 28.52 26.75
9-Jan-2003 29.38 27.59
10-Jan-2003 29.04 27.29
13-Jan-2003 29.64 27.87
14-Jan-2003 29.97 28.22
15-Jan-2003 30.48 28.64
16-Jan-2003 30.82 28.98
17-Jan-2003 30.95 29.05
20-Jan-2003 ND 29.07
21-Jan-2003 30.96 29.15
22-Jan-2003 30.77 28.94
23-Jan-2003 30.46 28.66
24-Jan-2003 31.12 29.29
27-Jan-2003 30.49 28.81
28-Jan-2003 30.94 29.26
29-Jan-2003 31.72 30.02
30-Jan-2003 31.95 30.15
31-Jan-2003 31.80 30.03
3-Feb-2003 31.34 29.47
4-Feb-2003 32.04 30.18
5-Feb-2003 32.37 30.54
6-Feb-2003 32.40 30.51
7-Feb-2003 33.13 31.29
10-Feb-2003 32.60 30.68
11-Feb-2003 33.27 31.30
12-Feb-2003 33.35 31.29
13-Feb-2003 33.92 31.67
14-Feb-2003 34.04 31.67
17-Feb-2003 ND 31.06
18-Feb-2003 34.12 31.57
19-Feb-2003 34.21 31.56
20-Feb-2003 33.46 30.93
*
Date WTI May Brent May
21-Feb-2003 34.33 31.65
24-Feb-2003 35.04 32.49
25-Feb-2003 34.42 31.55
26-Feb-2003 35.34 32.18
27-Feb-2003 35.19 32.07
28-Feb-2003 34.83 31.82
3-Mar-2003 34.24 31.63
4-Mar-2003 34.91 32.11
5-Mar-2003 34.96 32.00
6-Mar-2003 35.54 32.52
7-Mar-2003 36.35 33.14
10-Mar-2003 36.28 32.92
11-Mar-2003 35.74 32.65
12-Mar-2003 36.35 33.21
13-Mar-2003 34.67 31.77
14-Mar-2003 33.36 30.13
17-Mar-2003 32.54 29.48
18-Mar-2003 30.05 27.25
19-Mar-2003 29.36 26.75
20-Mar-2003 28.12 25.50
21-Mar-2003 26.91 24.35
24-Mar-2003 28.66 26.09
25-Mar-2003 27.97 24.81
26-Mar-2003 28.63 25.29
27-Mar-2003 30.37 26.82
28-Mar-2003 30.16 26.35
31-Mar-2003 31.04 27.18
1-Apr-2003 29.78 26.36
* As shown in the chart, dashed vertical lines mark FOMC meeting dates of January 29 and March 18, 2003, and a solidvertical line marks March 12, 2003. Return to table
Change since 3/12
Brent May -$6.36
WTI May -$5.95
Bottom panelImplied Distributions from Oil Futures Options
The bottom panel represents implied distributions from December 2003 and May 2003 West TexasIntermediate oil futures options on March 31, 2003. The May 2003 WTI distribution has a range
*
*
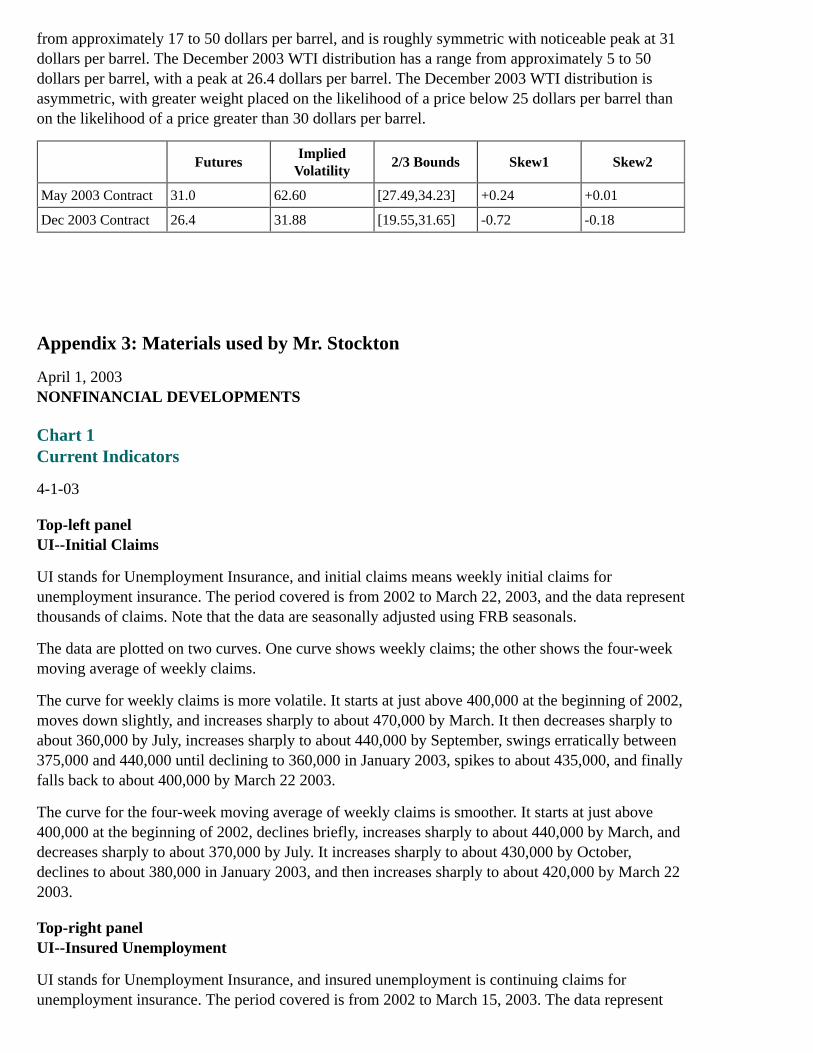
from approximately 17 to 50 dollars per barrel, and is roughly symmetric with noticeable peak at 31dollars per barrel. The December 2003 WTI distribution has a range from approximately 5 to 50dollars per barrel, with a peak at 26.4 dollars per barrel. The December 2003 WTI distribution isasymmetric, with greater weight placed on the likelihood of a price below 25 dollars per barrel thanon the likelihood of a price greater than 30 dollars per barrel.
FuturesImplied
Volatility2/3 Bounds Skew1 Skew2
May 2003 Contract 31.0 62.60 [27.49,34.23] +0.24 +0.01
Dec 2003 Contract 26.4 31.88 [19.55,31.65] -0.72 -0.18
Appendix 3: Materials used by Mr. Stockton
April 1, 2003NONFINANCIAL DEVELOPMENTS
Chart 1Current Indicators
4-1-03
Top-left panelUI--Initial Claims
UI stands for Unemployment Insurance, and initial claims means weekly initial claims forunemployment insurance. The period covered is from 2002 to March 22, 2003, and the data representthousands of claims. Note that the data are seasonally adjusted using FRB seasonals.
The data are plotted on two curves. One curve shows weekly claims; the other shows the four-weekmoving average of weekly claims.
The curve for weekly claims is more volatile. It starts at just above 400,000 at the beginning of 2002,moves down slightly, and increases sharply to about 470,000 by March. It then decreases sharply toabout 360,000 by July, increases sharply to about 440,000 by September, swings erratically between375,000 and 440,000 until declining to 360,000 in January 2003, spikes to about 435,000, and finallyfalls back to about 400,000 by March 22 2003.
The curve for the four-week moving average of weekly claims is smoother. It starts at just above400,000 at the beginning of 2002, declines briefly, increases sharply to about 440,000 by March, anddecreases sharply to about 370,000 by July. It increases sharply to about 430,000 by October,declines to about 380,000 in January 2003, and then increases sharply to about 420,000 by March 222003.
Top-right panelUI--Insured Unemployment
UI stands for Unemployment Insurance, and insured unemployment is continuing claims forunemployment insurance. The period covered is from 2002 to March 15, 2003. The data represent
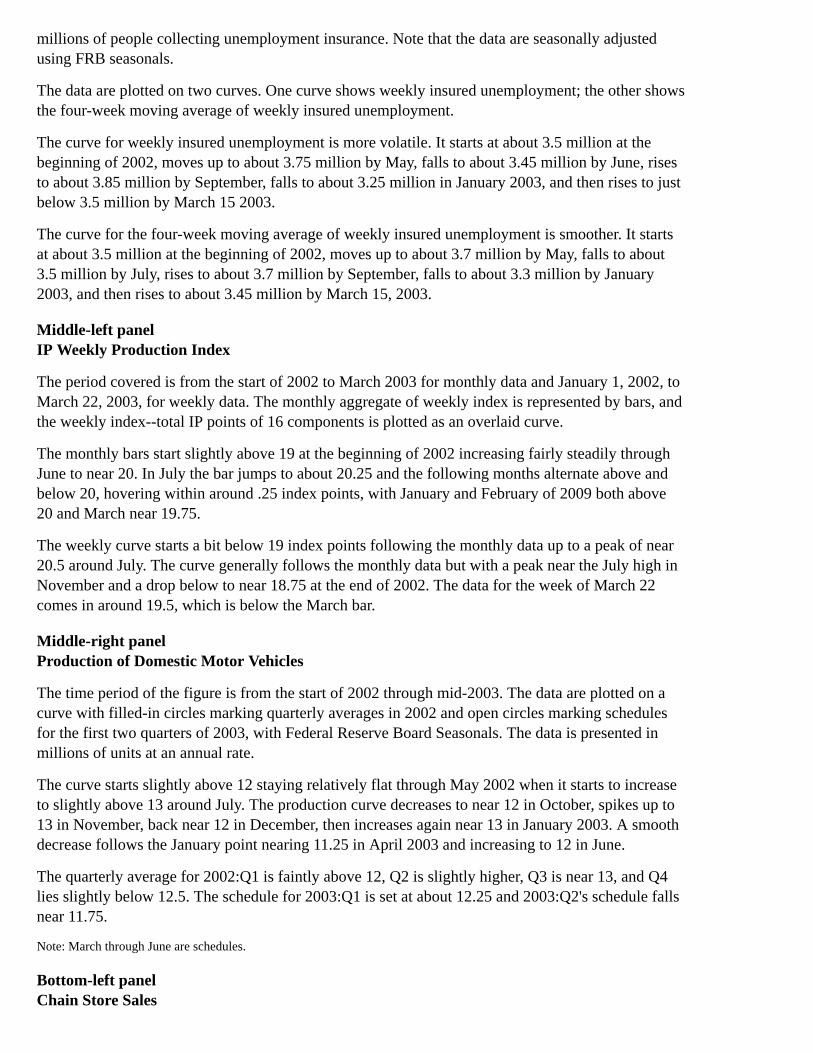
millions of people collecting unemployment insurance. Note that the data are seasonally adjustedusing FRB seasonals.
The data are plotted on two curves. One curve shows weekly insured unemployment; the other showsthe four-week moving average of weekly insured unemployment.
The curve for weekly insured unemployment is more volatile. It starts at about 3.5 million at thebeginning of 2002, moves up to about 3.75 million by May, falls to about 3.45 million by June, risesto about 3.85 million by September, falls to about 3.25 million in January 2003, and then rises to justbelow 3.5 million by March 15 2003.
The curve for the four-week moving average of weekly insured unemployment is smoother. It startsat about 3.5 million at the beginning of 2002, moves up to about 3.7 million by May, falls to about3.5 million by July, rises to about 3.7 million by September, falls to about 3.3 million by January2003, and then rises to about 3.45 million by March 15, 2003.
Middle-left panelIP Weekly Production Index
The period covered is from the start of 2002 to March 2003 for monthly data and January 1, 2002, toMarch 22, 2003, for weekly data. The monthly aggregate of weekly index is represented by bars, andthe weekly index--total IP points of 16 components is plotted as an overlaid curve.
The monthly bars start slightly above 19 at the beginning of 2002 increasing fairly steadily throughJune to near 20. In July the bar jumps to about 20.25 and the following months alternate above andbelow 20, hovering within around .25 index points, with January and February of 2009 both above20 and March near 19.75.
The weekly curve starts a bit below 19 index points following the monthly data up to a peak of near20.5 around July. The curve generally follows the monthly data but with a peak near the July high inNovember and a drop below to near 18.75 at the end of 2002. The data for the week of March 22comes in around 19.5, which is below the March bar.
Middle-right panelProduction of Domestic Motor Vehicles
The time period of the figure is from the start of 2002 through mid-2003. The data are plotted on acurve with filled-in circles marking quarterly averages in 2002 and open circles marking schedulesfor the first two quarters of 2003, with Federal Reserve Board Seasonals. The data is presented inmillions of units at an annual rate.
The curve starts slightly above 12 staying relatively flat through May 2002 when it starts to increaseto slightly above 13 around July. The production curve decreases to near 12 in October, spikes up to13 in November, back near 12 in December, then increases again near 13 in January 2003. A smoothdecrease follows the January point nearing 11.25 in April 2003 and increasing to 12 in June.
The quarterly average for 2002:Q1 is faintly above 12, Q2 is slightly higher, Q3 is near 13, and Q4lies slightly below 12.5. The schedule for 2003:Q1 is set at about 12.25 and 2003:Q2's schedule fallsnear 11.75.
Note: March through June are schedules.
Bottom-left panelChain Store Sales
This panel displays an index of chain stores sales, where an increase in the index indicates anincrease in merchandise sold at selected chain stores and a decrease indicates a decrease inmerchandise sold from one month to the next. The period covered is from January 2002 to March 29,2003.
The curve starts at about 397 at the beginning of 2002, spikes to about 415 by February, falls toabout 399 by April, rises steeply to about 416 by June, falls to about 393 by December, rises steeplyto about 412 by January 2003, and moves down, on net, to about 405 by March 29, 2003.
Source: Bank of Tokyo-Mitsubishi.
Bottom-right panelMichigan SRC Survey
Feb:H2 Mar:H1 Mar:H2
1. Total 81.3 75.0 81.9
2. Current 95.6 87.1 94.8
3. Expected 72.1 67.2 73.6
Chart 2Domestic Energy Markets
4-1-03
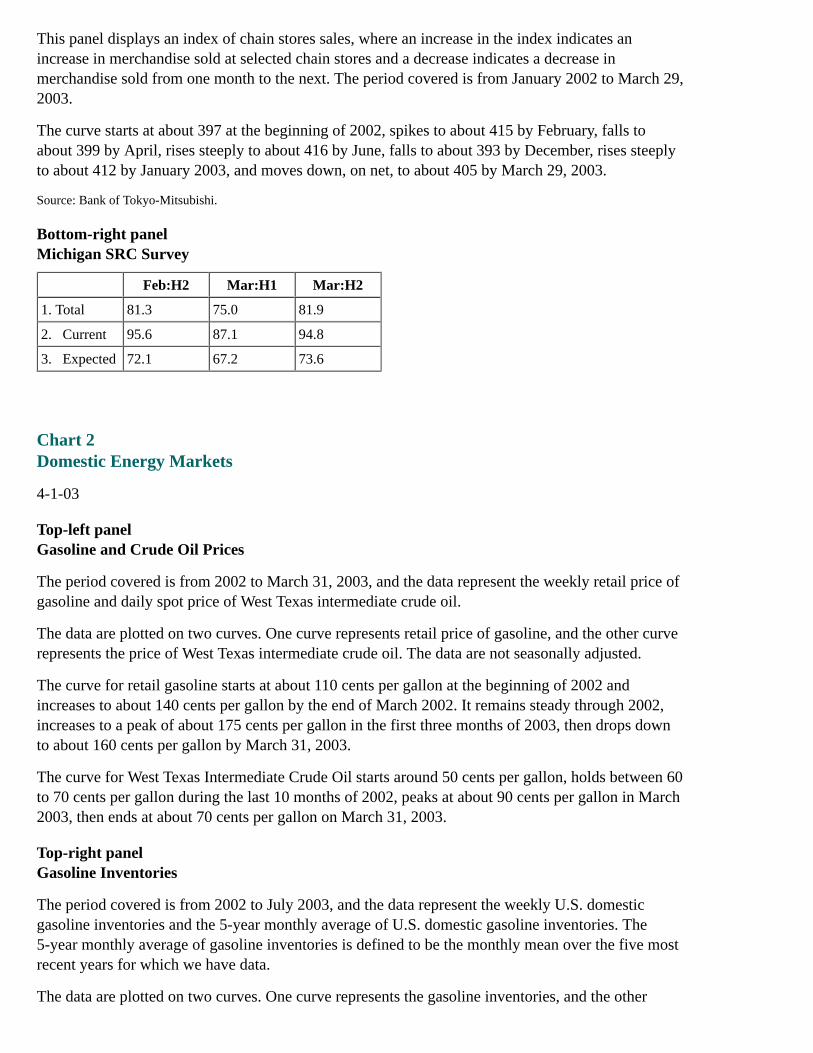
Top-left panelGasoline and Crude Oil Prices
The period covered is from 2002 to March 31, 2003, and the data represent the weekly retail price ofgasoline and daily spot price of West Texas intermediate crude oil.
The data are plotted on two curves. One curve represents retail price of gasoline, and the other curverepresents the price of West Texas intermediate crude oil. The data are not seasonally adjusted.
The curve for retail gasoline starts at about 110 cents per gallon at the beginning of 2002 andincreases to about 140 cents per gallon by the end of March 2002. It remains steady through 2002,increases to a peak of about 175 cents per gallon in the first three months of 2003, then drops downto about 160 cents per gallon by March 31, 2003.
The curve for West Texas Intermediate Crude Oil starts around 50 cents per gallon, holds between 60to 70 cents per gallon during the last 10 months of 2002, peaks at about 90 cents per gallon in March2003, then ends at about 70 cents per gallon on March 31, 2003.
Top-right panelGasoline Inventories
The period covered is from 2002 to July 2003, and the data represent the weekly U.S. domesticgasoline inventories and the 5-year monthly average of U.S. domestic gasoline inventories. The5-year monthly average of gasoline inventories is defined to be the monthly mean over the five mostrecent years for which we have data.
The data are plotted on two curves. One curve represents the gasoline inventories, and the other
curve represents the repeated 5-year monthly average of gasoline inventories. The data are notseasonally adjusted.
The curve for gasoline inventories starts at about 210 million barrels at the beginning of 2002, hits aminimum at about 192 million barrels by November 2002, retraces back to 215 million barrels byJanuary 2003, then ends at approximately 198 million barrels on March 21, 2003.
The curve for the 5-year monthly average of gasoline inventories starts at about 218 million barrelsin 2002, decreases to about 209 million barrels in March 2002, increases to 215 million barrels byMay 2002, declines to its minimum at about 199 million barrels in August 2002, then ends 2002 at205 million barrels. In 2003, the curve follows the same path as 2002, by definition.
Bottom-left panelNatural Gas Spot Price
The period covered is from 2002 to March 31, 2003, and the data represent the daily Henry HubNatural Gas Spot Price. The data are plotted on one curve.
The curve for natural gas starts at about 2 dollars per million British Thermal Units (MMBtU) at thebeginning of 2002, climbs steadily to about 6 dollars per MMBtU in February 2003, then spikes toabout 19 dollars per MMBtU in late February 2003, then retraces back to about 5 dollars perMMBtU by March 31, 2003.
Bottom-right panelNatural Gas Inventories
The period covered is from January 1997 to March 21, 2003, and the data represent the end-of-monthU.S. domestic Natural Gas Inventories, defined as working gas in storage.
The data are plotted on four curves and an open circle. One curve represents the 1997-2000 averageof U.S. domestic natural gas inventories. The second curve represents the 2001 U.S. domestic naturalgas inventories. The third curve represents the 2002 U.S. domestic natural gas inventories. Thefourth and final curve represents the 2003 U.S. domestic natural gas inventories. The open circlerepresents U.S. domestic natural gas inventories on March 21, 2003.
The curve for 1997-2000 average U.S. domestic natural gas inventories starts at around 1750 billioncubic feet in January, decreases to about 1250 billion cubic feet in March, increases to about 3000billion cubic feet in October, and ends at about 2250 billion cubic feet in December.
The curve for 2001 U.S. domestic natural gas inventories starts at around 1250 billion cubic feet inJanuary, decreases to about 750 billion cubic feet in March, increases to about 3200 billion cubic feetin November, and ends at about 2900 billion cubic feet in December.
The curve for 2002 U.S. domestic natural gas inventories starts at around 2400 billion cubic feet inJanuary, decreases to about 1500 billion cubic feet in March, increases to about 3100 billion cubicfeet in October, and ends at about 2400 billion cubic feet in December.
The curve for 2003 U.S. domestic natural gas inventories starts at around 1500 billion cubic feet inJanuary and ends at about 800 billion cubic feet in February. The open circle represents natural gasinventories, which stood at approximately 700 billion cubic feet on March 21, 2003.
Chart 3
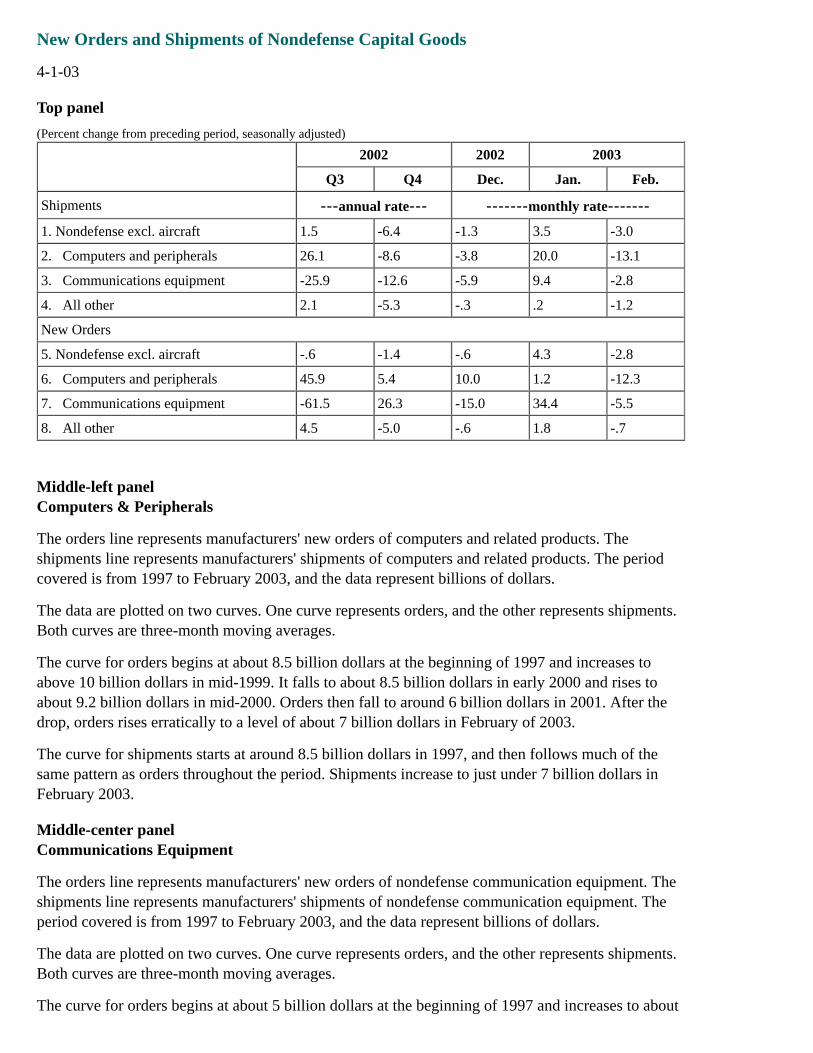
New Orders and Shipments of Nondefense Capital Goods
4-1-03
Top panel
(Percent change from preceding period, seasonally adjusted)
2002 2002 2003
Q3 Q4 Dec. Jan. Feb.
Shipments ‑‑‑annual rate‑‑‑ ‑‑‑‑‑‑‑monthly rate‑‑‑‑‑‑‑
1. Nondefense excl. aircraft 1.5 -6.4 -1.3 3.5 -3.0
2. Computers and peripherals 26.1 -8.6 -3.8 20.0 -13.1
3. Communications equipment -25.9 -12.6 -5.9 9.4 -2.8
4. All other 2.1 -5.3 -.3 .2 -1.2
New Orders
5. Nondefense excl. aircraft -.6 -1.4 -.6 4.3 -2.8
6. Computers and peripherals 45.9 5.4 10.0 1.2 -12.3
7. Communications equipment -61.5 26.3 -15.0 34.4 -5.5
8. All other 4.5 -5.0 -.6 1.8 -.7
Middle-left panelComputers & Peripherals
The orders line represents manufacturers' new orders of computers and related products. Theshipments line represents manufacturers' shipments of computers and related products. The periodcovered is from 1997 to February 2003, and the data represent billions of dollars.
The data are plotted on two curves. One curve represents orders, and the other represents shipments.Both curves are three-month moving averages.
The curve for orders begins at about 8.5 billion dollars at the beginning of 1997 and increases toabove 10 billion dollars in mid-1999. It falls to about 8.5 billion dollars in early 2000 and rises toabout 9.2 billion dollars in mid-2000. Orders then fall to around 6 billion dollars in 2001. After thedrop, orders rises erratically to a level of about 7 billion dollars in February of 2003.
The curve for shipments starts at around 8.5 billion dollars in 1997, and then follows much of thesame pattern as orders throughout the period. Shipments increase to just under 7 billion dollars inFebruary 2003.
Middle-center panelCommunications Equipment
The orders line represents manufacturers' new orders of nondefense communication equipment. Theshipments line represents manufacturers' shipments of nondefense communication equipment. Theperiod covered is from 1997 to February 2003, and the data represent billions of dollars.
The data are plotted on two curves. One curve represents orders, and the other represents shipments.Both curves are three-month moving averages.
The curve for orders begins at about 5 billion dollars at the beginning of 1997 and increases to about
12 billion dollars in mid-2000. It falls to about 5 billion dollars in 2001 and has small movementsaround 5 billions dollars until the end of the series in February 2003.
The curve for shipments starts at about 5 billion dollars in 1997, then follows much of the samepattern as orders throughout the period. Shipments decrease to around 5 billion dollars in February2003.
Middle-right panelOther Equipment
The orders line represents manufacturers' new orders of nondefense capital goods excluding aircraftand parts, computers and peripherals, and communications equipment. The shipments line representsmanufacturers' shipments of nondefense capital goods excluding aircraft and parts, computers andperipherals, and communications equipment. The period covered is from 1997 to February 2003, andthe data represent billions of dollars.
The data are plotted on two curves. One curve represents orders, and the other represents shipments.Both curves are three-month moving averages.
The curve for orders begins at just above 38 billion dollars at the beginning of 1997 and increases toabove 42 billion dollars at the beginning of 1998. It falls to about 41 billion dollars in late 1998 andrises to about 46 billion dollars in early 2000. Orders then fall to under 40 billion dollars in 2001.After this drop, orders rise erratically to a level of about 41 billion dollars in February 2003.
The curve for shipments starts at around 38 billion dollars in 1997, and then follows much of thesame pattern as orders throughout the period. Shipments end at about 41 billion dollars in February2003.
Bottom-left panelISM Survey--Total
This panel is the Institute for Supply Management survey index of the manufacturing economy. Theperiod covered is from 1997 to March 2003, and the data is an index.
The curve begins at about 55 at the beginning of 1997 and decreases to just below 50 by the end of1998. It increases to about 60 in late 1999 and falls to 40 in early 2001, remaining there through2001. The survey rises to around 55 in 2002 before erratically falling to around 45 in March 2003.
Bottom-right panelISM Survey--New Orders
This panel is the Institute for Supply Management survey index of manufacturing's new orders. Theperiod covered is from 1997 to March 2003, and the data is an index.
The curve begins at just below 60 at the beginning of 1997 and decreases to just below 50 at the endof 1998. It increases to above 60 in late 1999 and falls to 40 in early 2001. The survey erraticallyrises to around 60 in 2002 before sharply falling to about 45 in March 2003.
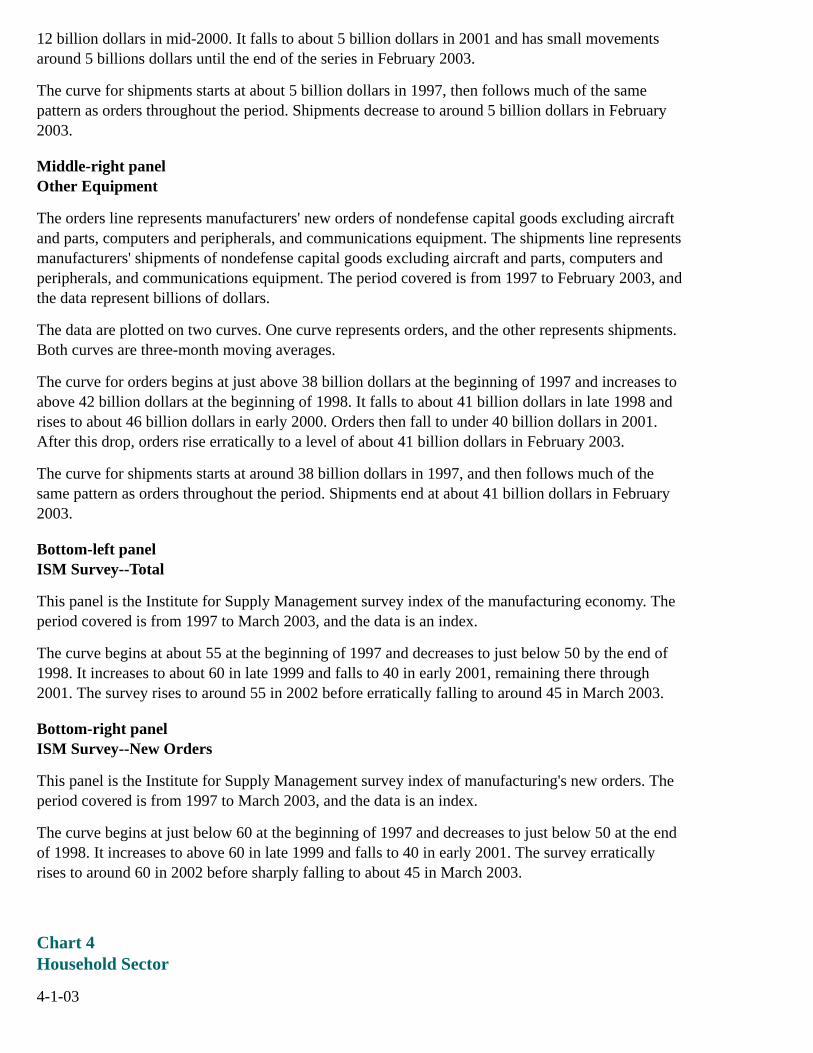
Chart 4Household Sector
4-1-03
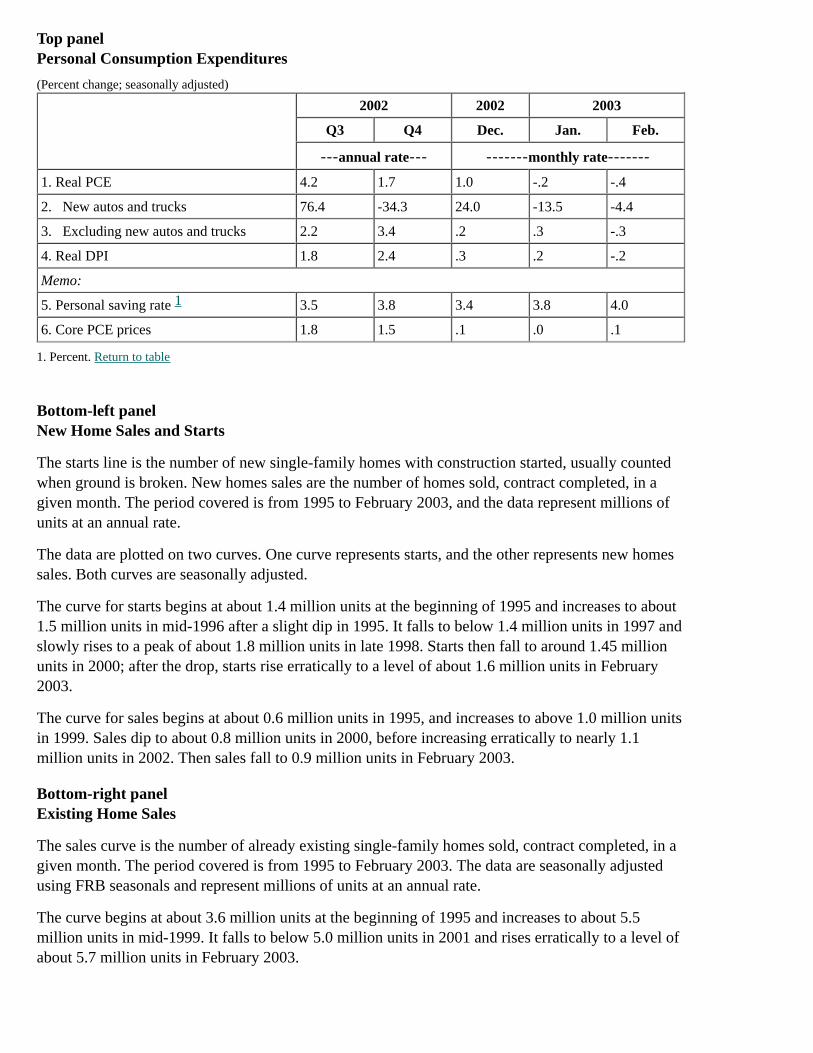
Top panelPersonal Consumption Expenditures
(Percent change; seasonally adjusted)
2002 2002 2003
Q3 Q4 Dec. Jan. Feb.
‑‑‑annual rate‑‑‑ ‑‑‑‑‑‑‑monthly rate‑‑‑‑‑‑‑
1. Real PCE 4.2 1.7 1.0 -.2 -.4
2. New autos and trucks 76.4 -34.3 24.0 -13.5 -4.4
3. Excluding new autos and trucks 2.2 3.4 .2 .3 -.3
4. Real DPI 1.8 2.4 .3 .2 -.2
Memo:
5. Personal saving rate 3.5 3.8 3.4 3.8 4.0
6. Core PCE prices 1.8 1.5 .1 .0 .1
1. Percent. Return to table
Bottom-left panelNew Home Sales and Starts
The starts line is the number of new single-family homes with construction started, usually countedwhen ground is broken. New homes sales are the number of homes sold, contract completed, in agiven month. The period covered is from 1995 to February 2003, and the data represent millions ofunits at an annual rate.
The data are plotted on two curves. One curve represents starts, and the other represents new homessales. Both curves are seasonally adjusted.
The curve for starts begins at about 1.4 million units at the beginning of 1995 and increases to about1.5 million units in mid-1996 after a slight dip in 1995. It falls to below 1.4 million units in 1997 andslowly rises to a peak of about 1.8 million units in late 1998. Starts then fall to around 1.45 millionunits in 2000; after the drop, starts rise erratically to a level of about 1.6 million units in February2003.
The curve for sales begins at about 0.6 million units in 1995, and increases to above 1.0 million unitsin 1999. Sales dip to about 0.8 million units in 2000, before increasing erratically to nearly 1.1million units in 2002. Then sales fall to 0.9 million units in February 2003.
Bottom-right panelExisting Home Sales
The sales curve is the number of already existing single-family homes sold, contract completed, in agiven month. The period covered is from 1995 to February 2003. The data are seasonally adjustedusing FRB seasonals and represent millions of units at an annual rate.
The curve begins at about 3.6 million units at the beginning of 1995 and increases to about 5.5million units in mid-1999. It falls to below 5.0 million units in 2001 and rises erratically to a level ofabout 5.7 million units in February 2003.
1

Return to top
Home | Monetary policy | FOMC | FOMC transcriptsAccessibility | Contact UsLast update: July 23, 2009