Embed Size (px)
Citation preview

Prefatory Note
The attached document represents the most complete and accurate version available based on original copies culled from the files of the FOMC Secretariat at the Board of Governors of the Federal Reserve System. This electronic document was created through a comprehensive digitization process which included identifying the best-preserved paper copies, scanning those copies,1 and then making the scanned versions text-searchable.2 Though a stringent quality assurance process was employed, some imperfections may remain.
Please note that this document may contain occasional gaps in the text. These gaps are the result of a redaction process that removed information obtained on a confidential basis. All redacted passages are exempt from disclosure under applicable provisions of the Freedom of Information Act.
1 In some cases, original copies needed to be photocopied before being scanned into electronic format. All scanned images were deskewed (to remove the effects of printer- and scanner-introduced tilting) and lightly cleaned (to remove dark spots caused by staple holes, hole punches, and other blemishes caused after initial printing). 2 A two-step process was used. An advanced optimal character recognition computer program (OCR) first created electronic text from the document image. Where the OCR results were inconclusive, staff checked and corrected the text as necessary. Please note that the numbers and text in charts and tables were not reliably recognized by the OCR process and were not checked or corrected by staff.

Strictly Confidential (FR) Class I FOMC
MONETARY POLICY ALTERNATIVES
Prepared for the Federal Open Market Committee
By the staff Board of Governors of the Federal Reserve System

STRICTLY CONFIDENTIAL (FR)CLASS I - FOMC May 10, 1991
MONETARY POLICY ALTERNATIVES
Recent Developmnts
(1) In the period immediately after the March FOMC meeting the
Desk sought to maintain existing reserve pressures, consistent with
federal funds continuing to trade in the area of 6 percent. Reserve
targets were based initially on an allowance for adjustment plus seasonal
borrowing of $125 million. Through the end of April, the federal funds
rate averaged a little below 6 percent, with downward pressure coming at
times from market anticipation of further policy easing and from unex-
pected surpluses of reserves. On April 30, in response to indications of
continued economic weakness and abating inflationary pressures, the dis-
count rate was reduced 1/2 percentage point to 5-1/2 percent. Half of
this reduction was allowed to pass through to the federal funds rate.
Consistent with the wider spread between the federal funds rate and the
discount rate, the borrowing allowance was raised by $25 million.1 Thus
far in the current maintenance period, the federal funds rate has averaged
5.78 percent, and borrowing is just below its path allowance of $200 mil-
lion. Borrowing during each complete maintenance period since the FOMC
meeting averaged close to its allowance.
(2) Most money market interest rates fell 35 to 45 basis points
during the intermeeting period, somewhat more than the decrease in the
2federal funds rate. About half of the decline occurred in advance of
1. In addition, the borrowing allowance was increased by $25 million onApril 18, and again on May 2, to keep up with expected increases inseasonal borrowing.2. Discussions of interest and exchange rates and stock prices are
based on data through noon, May 10.

the policy easing, as the near-term response of aggregate demand to the
end of the Gulf War and to earlier monetary policy easings seemed to be
less buoyant than many had expected. Banks cut the prime rate 1/2 per-
centage point shortly after the easing but, at 8-1/2 percent, it remains
high relative to market interest rates. Despite the sense of a delay in
the recovery, market participants appeared to retain optimism about
longer-term economic prospects: Treasury bond yields dropped less than
10 basis points over the intermeeting period; risk premia on corporate
debt, which had fallen sharply in February and March, declined further,
in some cases to or below levels prevailing before the recession; and
major stock price indexes, although not sustaining the record levels
reached midway through the period, still rose on balance. Prices of bank
debt and equity outpaced the broader averages, reflecting the anticipated
effects of lower interest rates on bank profitability as well as first-
quarter earnings reports that, in general, were not as bad as had been
feared.
(3) Despite the drop in U.S. interest rates, the dollar rose
almost 2 percent on a weighted average basis over the intermeeting period
amid considerable volatility. Although no foreign authorities followed
the Federal Reserve's easing move, short-term interest rates abroad
declined by about 25 basis points over the period, mitigating downward
pressures on the dollar from the drop in rates here. The dollar was
boosted by political developments in Germany and the Soviet Union, par-
ticularly in late April when it rose rapidly against the mark. The dollar
dropped sharply from its late April peak, especially following the Federal

-3-
Reserve's discount rate action, but has since recovered somewhat.
The Desk did not intervene.
(4) After accelerating earlier in the year, the monetary
aggregates slowed appreciably in April. Though M2 growth was only 2-1/2
percent at an annual rate, it was sufficient to maintain this measure
near the middle of its annual range. M3 stalled last month after meager
expansion in March, bringing this aggregate down into the middle portion
of its annual range.
(5) M2 growth for April was well below expectations, and its
sluggishness appears to reflect a number of factors. Currency stopped
growing last month, as net demands from abroad apparently turned negative
on balance. Some slowing of the monetary aggregates had been anticipated
this April, in part owing to lower final tax liabilities for 1990 and an
associated smaller-than-usual buildup of liquid household balances. In
the event, tax payments came in even below projections, likely contribut-
ing to the unexpected weakness of M2.3 Over the years, April money
growth frequently has deviated from expectations, reflecting the
3. With contractions in currency and demand deposits and modest growthin other checkable deposits, M1 fell at a 1 percent annual rate inApril, and required reserves were flat. The average level of excessreserves declined a little further, to $1,050 million, only about $100million or so above the level typical before the reduction in reserverequirements. The slight decline in currency, together with a drop intotal reserves, caused the monetary base to contract at a 1-1/2 percentannual rate last month.

-4-
MONEY, CREDIT, AND RESERVE AGGREGATES(Seasonally adjusted annual rates of growth)
Money and credit aggregates
March
9.3
7.5
2.7
Domestic nonfinancial debt
Bank credit
Reserve measures
Nonborrowed reserves2Nonborrowed reserves
Total reserves
Monetary base
April
-1.0
2.6
0.0
-0.1
-0.4
-1.1
Memo: (Millions of dollars)
Adjustment plus seasonalborrowing
Excess reserves 1179
-2.6
-3.7
-1.4
QIV'90to
April
5.5
4.3
3.6
5.01
2.9
5.7
4.9
10.4
145
1050
1. Q4 to March.2. Includes "other extended credit" from the Federal Reserve.
NOTE: Monthly reserve measures, including excess reserves and borrow-ing, are calculated by prorating averages for two-week reservemaintenance periods that overlap months. Reserve data incor-porate adjustments for discontinuities associated with changesin reserve requirements.

-5-
difficulty of capturing massive tax-related flows in seasonal factors.4
The expansionary effects of the drop in short-term rates on money demand
may have been mitigated to the extent that holders of small time depos-
its and money funds were encouraged by the unusually low level of own
rates and the steep yield curve to shift funds to capital market instru-
ments. Finally, the shortfall in money growth may be partly related to
the lower-than-expected nominal income implied by recent data.
(6) The weakness of M3, while reflecting in part the sluggish
expansion of M2, also accords with a picture of contracting credit at
depository institutions. Bank credit was unchanged in April; all major
loan categories showed appreciable weakness. The modest growth of core
deposits and the decline in loans left banks with a surfeit of funds,
leading domestically chartered banks to continue to purchase substantial
volumes of securities and to run off large time deposits. Thrift in-
stitutions also continued to pay down sizable volumes of large CDs in
April, while their core deposits rose only slightly, suggesting that the
drop in their assets continued despite a lull in RTC activity. Though
still brisk, issuance of large CDs by U.S. branches and agencies of
foreign banks slowed, reflecting quarter-end downsizing in response to
capital standards. By and large, the proceeds of these CDs appear not
to be financing credit to U.S. residents, but rather to be substituting
for other sources of funding at the U.S. branches and agencies and their
offices abroad. Thus far this year, increases in these Yankee CDs have
4. Partial data for the first week in May show a substantial rebound inM2, supporting the notion that some of the April weakness was due totemporary tax-related influences.

accounted for two-thirds of the 3-1/2 percent annualized growth in M3
from its fourth-quarter base.
(7) Growth of domestic nonfinancial sector debt apparently
remained damped in March and April, leaving this aggregate well down in
its monitoring range. In the federal sector, borrowing needs have been
limited temporarily by contributions related to Operation Desert Storm
and by the slow pace of RTC resolutions. Private credit growth appears
to have remained weak. Demands for funds this year have been restrained
not only by slow spending, but also by a marked abatement of net equity
retirements as corporate restructuring ebbed and equity issuance surged.
On the supply side, securities markets have become more receptive to
private borrowers, including those with below-investment grade ratings.
In the improved securities market environment, banks have raised sub-
stantial volumes of debt and equity capital in recent months, but as
indicated by the latest survey of senior loan officers and by continued
wide spreads of bank lending rates over costs of funds, they remain very
cautious lenders. Reflecting these patterns, offerings of nonfinancial
corporate bonds and commercial paper were brisk, with the funds appar-
ently used in part to pay down bank loans. The few available indicators
for the household sector point to quite sluggish borrowing. Consumer
loan growth at banks in April was anemic, even after adjusting for
securitizations, and home equity loans at banks continued their sharp

-7-
deceleration of the past few months. Widening spreads between rates on
mortgage and consumer debt, on the one hand, and those on household
assets, on the other, may be encouraging some deleveraging of this
sector.

Policy Alternatives
(8) Two policy alternatives for Committee consideration are
discussed below. Under alternative B, the federal funds rate would remain
in the 5-3/4 percent area, in association with an initial specification
for adjustment plus seasonal borrowing of $225 million--an increase of $25
million from the current level to take account of the likely rise of sea-
sonal borrowing. Under alternative A, federal funds would trade around
5-1/4 percent; this level could be achieved either by a reduction in the
initial borrowing specification to $175 million together with the current
5-1/2 percent discount rate, or by a cut in the discount rate to 5 percent
combined with the $225 million initial borrowing specification. 5 Drop-
ping the funds rate below the discount rate and operating at frictional
levels of borrowing could have the minor disadvantage of further circum-
scribing the role of the discount window in cushioning unexpected shifts
in reserve supply and demand, thereby adding a little to volatility in the
funds rate.
(9) Money growth projections under the two alternatives are
shown below. (More detailed data appear in the table and charts on the
following pages.) Under both alternatives, the monetary aggregates are
expected to strengthen in May and June from their reduced April rates,
keeping M2 and M3 in the middle portions of their annual ranges through
midyear. The projected pickup in M2 growth primarily reflects the unwind-
ing of apparently tax-related weakness in April. The effects of previous
5. Under any of these policy approaches, further increases in seasonalborrowing are likely to necessitate upward technical adjustments to theborrowing assumption over the intermeeting period.

-9-
declines in interest rates continue to contribute to the growth of M2
relative to income. However, largely because of the downward revisions to
forecasts for nominal income in the second quarter, we now expect M2
growth over March to June to fall short of the pace specified in the last
directive. This shortfall occurs despite the slight easing in money mar-
ket rates at the end of April and persists even with the further drop in
rates under alternative A. The March-to-June growth projected for M3 also
has been lowered since the last meeting, but in this case the reduction
results entirely from the aggregate's unexpected weakness in April. Pro-
jected expansion of M3 in May and June is about the same as in the last
bluebook, as additional issuance of CDs by U.S. branches and agencies of
foreign banks offsets the effect of slower growth in M2 and depository
credit.
Alt. A Alt. B
Growth from Marchto June
M2 4-1/2 4M3 2-1/4 2Ml 3-3/4 3
Implied growth from1990:Q4 to June
M2 4-3/4 4-1/2M3 3-1/2 3-1/2M1 5-3/4 5-1/2

Alternative Levels and Growth Rates for Key Monetary Aggregates
M2 M3 M1
Alt. A Alt. B Alt. A Alt. B Alt. A Alt. B
Levels in billions1991 January 3333.1 3333.1 4126.9 4126.9 826.7 826.7
February 3357.2 3357.2 4164.2 4164.2 836.4 836.4March 3378.3 3378.3 4173.6 4173.6 842.9 842.9
April 3385.7 3385.7 4173.7 4173.7 842.2 842.2May 3397.8 3396.7 4181.4 4181.0 846.6 846.2June 3416.7 3412.0 4196.3 4193.9 850.6 849.0
Monthly Growth Rates1991 January 1.1 1.1 3.7 3.7 1.9 1.9
February 8.7 8.7 10.8 10.8 14.1 14.1March 7.5 7.5 2.7 2.7 9.3 9.3
o
April 2.6 2.6 0.0 0.0 -1.0 -1.0May 4.3 3.9 2.2 2.1 6.2 5.7June 6.7 5.4 4.3 3.7 5.8 4.0
Quarterly Ave. Growth Rates1990 Q1 6.2 6.2 2.9 2.9 5.2 5.2
Q2 3.9 3.9 1.3 1.3 4.2 4.2Q3 3.0 3.0 1.6 1.6 3.7 3.7Q4 2.1 2.1 1.0 1.0 3.4 3.4
1991 Q1 3.6 3.6 4.3 4.3 5.8 5.8Q2 5.2 5.0 2.8 2.7 5.3 5.0
Dec. 90 to Mar. 91 5.8 5.8 5.8 5.8 8.5 8.5Mar. 91 to June 91 4.5 4.0 2.2 1.9 3.7 2.9
Q4 89 to Q4 90 3.8 3.8 1.7 1.7 4.2 4.2Q4 90 to Q1 91 3.6 3.6 4.3 4.3 5.8 5.8Q4 90 to Q2 91 4.4 4.3 3.5 3.5 5.6 5.5Q4 90 to Apr. 91 4.3 4.3 3.6 3.6 5.5 5.5Q4 90 to June 91 4.7 4.4 3.5 3.4 5.7 5.4
2.5 to 6.5 1.0 to 5.01991 Target Ranges:

Chart 1
ACTUAL AND TARGETED M2
Billlons of dollars
Actual Level* Short-Run Alternatives
O N D J F M A M J J A S O N D
3600
3550
3500
3450
3400
3350
3300
3250
1990 1991

Chart 2
ACTUAL AND TARGETED M3
Billions of dollars
Actual LevelSShort-Run Aternatives
..-
--^ o'
4350
-- 4300
-- 4250
-1 4200
1% -j 4150
-I 4100
-- 4050S
I I I 1 I I I I I I I I I IO N D J F M A M J J A S O N D
4000
rr
rr
1990 1991

Chart 3
M1
Billions of dollars
I
S
II
I
II
II
II
SA* r-
-I
I I I I I I I I I I I I
O N D J F M A M J J A S O N D
Actual Level------ Growth From Fourth Quarter
,-'10%I
II
II --I 00
-- s880
IS
I
II
I II
- J 860
-- 840
I 0rp I r
r, B°
.. . . . . . . . . . . . . 0 %
-4 820
I I
1990 1991

Chart 4
DEBTBillions of dollars
- Actual Level* Projected Level
I I I I I I I I I
O N D J F M A M J J A S O N D
11400
-- 11200
-I 11000
4.5%
-4 10800
-- 10600
-1 10400
-- 10200
1990 1991

-11-
(10) Under alternative B, M2 is expected to strengthen to a
4-3/4 percent pace in May and June. Much of the acceleration in M2 is
likely to be concentrated in its transaction component. M1 should resume
growing at nearly a 5 percent pace over the two months, as demand deposits
and OCDs recover from their tax-related weakness and are buttressed later
in the quarter by the expected strengthening in nominal income. Moreover,
currency expansion is expected to reemerge with the waning of reflows from
the Persian Gulf region. The nontransaction component of M2 also is
likely to accelerate; money funds should rebound a bit, and, with a
smaller amount thought to be maturing, the runoff of retail time deposits
probably will abate from the unusually rapid pace of April. The 4 percent
growth of M2 from March to June under alternative B implies a quarterly
average growth rate of 5 percent; this exceeds the staff's projected
growth of nominal GNP by 2 percentage points, producing a third straight
quarter of M2 velocity decline. Still, the projected M2 growth remains
below that forecast by the staff's econometric model, but, at less than a
percentage point, the model overprediction would be considerably smaller
than in the last three quarters. Some lessening of concerns about the
soundness of depositories and the virtual cessation of RTC activity and
associated disruptions to deposit flows may be the main factors behind the
closer alignment of second-quarter M2 growth with historical patterns.
(11) The growth of M3 under alternative B is seen as picking up
to a 3 percent average pace in May and June, lifting its March-to-June
6. Depositor confidence, however, might again erode should proposals tolimit deposit insurance progress through Congress, or should bankfailures pick up. In the event of losses to uninsured depositors, anyeffect of these failures on M3 could be amplified.

-12-
rate of change to 2 percent. In addition to heavier projected inflows to
M2 deposits, rapid issuance of Yankee CDs seems to be resuming. Further-
more, the paydown by domestic banks of large time deposits, which was
especially pronounced in April, should abate over May and June. Under-
lying depository financing needs should increase as a turnaround in lend-
ing to businesses and households produces some expansion in bank credit in
the last two months of the quarter. Nevertheless, growth in overall
private nonfinancial debt is expected to remain quite damped, in line with
sluggish spending and reflecting the effects of continuing restraint on
credit availability and still-elevated loan rates at depository
institutions. In the federal sector, debt growth is expected to surge
over the balance of the second quarter, in part to fund enlarged RTC
payouts. Even so, total domestic nonfinancial debt is projected to grow
at only a 4-1/2 percent rate from March to June, putting expansion from
its fourth-quarter base close to the lower bound of the aggregate's
monitoring range.
(12) The current structure of interest rates appears to embody
market expectations of no further monetary policy move in the near term,
so implementation of alternative B is unlikely to engender any immediate
reaction in domestic financial or foreign exchange markets. Over the
intermeeting period, market participants no doubt will encounter mixed
evidence about the outlook, as is typical in a period near a turning
7. The likely gearing up of RTC activity as the quarter comes to aclose will shift assets and associated funding needs from thrifts to thefederal government and will accelerate the decline of large timedeposits at thrifts, but the pickup is coming so late in the quarterthat the effects on monthly M3 will not be felt until July.

-13-
point. With expectations somewhat fragile, there may be frequent adjust-
ments to financial asset prices in the face of these mixed signals.
Markets also may be particularly sensitive to clues about the Federal
Reserve's policy strategy around the cycle trough; the unchanged policy
stance of alternative B--if maintained through the intermeeting period
in the absence of clear evidence of a trough--could be seen as
incorporating a more cautious policy approach to assuring an upturn.
(13) Because the immediate 1/2 percentage point drop in the
federal funds rate under alternative A would come as a surprise to finan-
cial market participants, most of it would be passed through to other
short-term market interest rates, and the prime rate likely would be
reduced again. Bond yields are likely to decline in response, especially
if this action were seen as signalling the Federal Reserve's assessment
that the economic situation was worsening or price pressures were sub-
stantially reduced. However, with this easing coming on the heels of the
recent discount rate reduction, alternative A would be seen as especially
aggressive and could arouse concerns about the expected downward trajec-
tory for inflation unless softness in the economy or prices were confirmed
by subsequent data. With quality spreads already having narrowed con-
siderably, any further decline in private interest rates relative to Trea-
sury yields is likely to be quite limited. The exchange value of the
dollar would tend to adjust downward; this movement would be limited to
the extent the upward pressure on foreign currencies, against a backdrop
of a general softening in economic performance abroad, occasioned a
relaxation of monetary policy in some major trading partners.

-14-
(14) The lower market rates of alternative A would further en-
hance the attractiveness of retail deposits, likely boosting the average
growth of M2 in May and June to around a 5-1/2 percent rate, and to 4-1/2
percent from March to June. A lower prime rate, enhanced prospects for
a turnaround in output, and stronger prices of real assets would stimulate
demands for bank loans. But only a small impetus to bank credit expansion
would be given in the near term, partly because business borrowing likely
would remain focused on long-term markets, so the effect on M3 through
June would not be large. This aggregate's growth over the three months
ending in June, projected at a 2-1/4 percent pace, is only 1/4 percentage
point faster than under alternative B. For both aggregates, the major
effect of lower interest rates under alternative A would occur in the
third quarter; with no subsequent change in policy, M2 likely would end up
in the upper portion of its range by next fall, and M3 somewhat above the
midpoint of its range.

-15-
Directive Language
(15) Draft language for the operational paragraph, including the
usual options, is shown below.
OPERATIONAL PARAGRAPH
In the implementation of policy for the immediate
future, the Committee seeks to DECREASE SOMEWHAT/maintain/
INCREASE SOMEWHAT the existing degree of pressure on re-
serve positions. Depending upon progress toward price
stability, trends in economic activity, the behavior of the
monetary aggregates, and developments in foreign exchange
and domestic financial markets, somewhat (SLIGHTLY) greater
reserve restraint (WOULD/MIGHT) or somewhat (SLIGHTLY)
lesser reserve restraint (WOULD) might be acceptable in the
intermeeting period. The contemplated reserve conditions
are expected to be consistent with growth of M2 and M3 over
the period from March through June at annual rates of about
____ AND ____ [DEL: 5-1/2 and 3-1/2] percent, respectively.

May 10, 1991SELECTED INTEREST RATES
(percent)
IShot|l-Tenm I L in- TernI I I CDs I money I I corporate I conventional home morlages
federal I Treasury is I secondary comm. market Dank I( US governmment constant A ulflly I munticlpl secondary Ifunds secondary markel mnarke paper mutual prime I maturity yields recently B ond mark pmar rary market
. .____l3 nth I mnLMI loan |_IK. _ |0-.t I __ l nlr Il - i off Iered -- al I Am i Buy xe-rate I llLu l I ARM_ I . 2 1t 3._1 1 & 6 1 7 a ---- I--- -- --- 1 10 I 11 I 12 1 13 1I 14 .I .. I 16
90 - HighLow
91 HighLow
MonthlyMay 90Jun 90Jul 90Aug 90Sep 90Oct 90Nov 90Dec 90
Jan 91Feh 91Mar 91Apr 91
WeeklyFeb 6 91Feb 13 91Feb 20 91Feb 27 91
Mar 6 91Mar 13 91Mar 20 91Mar 27 91
Apr 3 91Apr 10 91Apr 17 91Apr 24 91
May 1 91May 8 91
DailyMay 3 91May 9 91May 10 91
8.337.16
7.465.69
8.188.298.158.138.208.117817.31
6.916.256.125.91
6.326.296.266.31
6.476.176.106.10
6.005.905.695.92
5.92I 5.79
7966.54
6.46548
7.747.737.627457.367.17706674
622594590565
6.015.895.92599
6.065.92583586
5.765.665.575.69
5.57548
5.76 547 5.57 5.74 5.92 5.905.76 5.48 5.63 5.76 5.92 5.92
5.89 5.91
10.5010.00
9.938.50
10.0010.0010.0010.0010.0010.0010.0010.00
9.529.059.009.00
9.299.009.009.00
9.009.009.009.00
9.009.009.009.00
8.938.50
8.508.508.50
907 9.13794 8.00
8.21 8.407.79 7.97
876 8.738,48 8.468.47 8.50875 8.868.89 9.038.72 8.868.39 8.548.07 8.24
809 8.27785 8.038.11 8.29804 8.21
7.89 8.087.79 7.977.81 7.997.93 8.09
8.09 8.268.07 8.248.14 8.338.13 8.31
8.05 8.248.02 8.207.99 8.168.09 8.24
8.05 8.218.03 8.21
8.04 8.228.02 8.21
10_509.55
9.969.41
10.049.859.96
10.2910.2810.2310.079.95
9.839.549.58946
7,83 10997.28 9.91
7.40 9.977.07 9.52
7.59 10.687.47 10.377.40 10.267.57 10.417.72 10.457.74 10.47745 10.257.34 9.95
732 9.897.17 9.637.32 9.817.24 9.75
8.698.408.268.228.278.077.747.47
7.387.087.357.23
7.096.987.047.21
7.367.317.357.39
7.287.237.197.27
7.197.13
7.167.12
1067956
975925
104810161004101010.1810181001967
964937950949
936925929940
9499.50959952
9.499.489.479.53
9.47
8.637.86
7.787.23
8.598.508.438.358.288218.107.93
7.747.657 47738
7.687.597.577.53
7.517.457447.41
7.397.397.377.36
7.23
9.53 7.08 9.609.46 7.07 9.529.53 7.23 9.689.64 7.31 9.85
9.62 7.30 9.819.54 7.29 9.719.60 7.33 9.849.49 7.35 9.83
9.41 7.29 9:679.41 7.27 9.749.49 7.19 9.799.50 7.22 9.79
9.42 7.14 9.737.09
NOTE Weekly data or columrn I hrough 11 are statement week w age a DIta In column tae taken& rm Donoghues Money Fund elpor Columns 12. 13 and 14am I -day quoesoi Friday. Thusdayor Friday respectively folowhing te endof the statement week Counm 13 lsthe Bond Buyer reveril ndex Ctlumin 14 IsMte FNMA puirasd yeld. plus lo secng tee. an 30-dy mandatory devery commwt t Column 15 Is the average contrac toae on new commnitmerlo fixed tale maongages(FRMs) with 80 percent loan-to-value ratkos a maimo Instlutlonal lenders Column 16 Is the average Inlitl contac rate on new commitments for 1 -year adjustable-tate montgages(ARMs) at malor Institulknal lendersoffering both FRMs and ARMs with the same number of discount poits
p preliminary dala
:: 1-

Strictly Confidential (FR)-
Money and Credit Aggregate Measures Class II FOMC
Seasonally adjusted MAY. 13, 1991
Money stock measures and liquid assets Bank credit Domestic nonfinancial debt1
nontransactions total loans U.S.Period M1 M2 components M3 L and government other* total'
in M2 in M3 only investments
1 2 3 4 5 6 7 8 9 10
ANN. GROWTH RATES 1%) :ANNUALLY (Q4 TO 41)
1988 4.2 5.2 5.5 10.7 6.3 7.2 7.7 8.0 9.5 9.21989 0.6 4.7 6.1 -0.6 3.6 4.8 7.5 7.5 7.8 7.71990 4.2 3.8 3.7 -6.4 1.7 1.8 5.4 11.0 5.5 6.8
QUARTERLY AVERAGE1990-2nd QTR. 4.2 3.9 3.8 -9.1 1.3 0.9 6.4 9.7 6.2 7.01990-3rd QTR. 3.7 3.0 2.7 -3.8 1.6 2.0 6.2 14.4 4.9 7.11990-4th QTR. 3.4 2.1 1.7 -3.5 1.0 1.5 2.9 11.4 4.2 6.01991-1st QTR. 5.8 3.6 2.8 7.1 4.3 2.7 12.2 2.7 5.0
MONTHLY1990-APR. 4.5 3.8 3.5 -7.1 1.6 1.4 6.9 7.5 6.7 6.9
MAY -0.3 1.1 1.5 -4.3 0.0 -4.2 3.2 7.5 4.5 5.2JUNE 5.9 2.9 1.8 -7.1 0.9 4.8 6.6 14.9 4.1 6.6JULY -1.2 1.8 2.7 -2.1 1.0 1.0 5.9 13.9 5.1 7.2AUG. 8.6 5.1 4.0 0.2 4.1 2.1 9.8 18.9 5.2 8.4SEP. 7.8 4.4 3.2 -9.7 1.7 5.4 1.4 11.0 5.5 6.8OCT. -0.9 1.1 1.7 -3.8 0.1 -0.4 2.6 5.6 4.4 4.7NOV. 3.1 0.1 -0.9 0.5 0.1 0.5 1.3 15.5 3.2 6.2DEC. 3.1 1.9 1.5 -1.8 1.2 0.5 3.1 13.1 2.3 4.9
1991-JAN. 1.9 1.1 0.9 14.7 3.7 4.9 -1.0 10.9 2.0 4.2FEB. 14.1 8.7 6.9 20.1 10.8 9.1 6.3 14.4 3.2 5.9MAR. 9.3 7.5 6.9 -17.4 2.7 6.8 5.6 3.8 4.2APR. pe -1 3 4 -11 0 0
LEVELS I*BILLIONS) :MONTHLY
1990-NOV. 823.3 3324.7 2501,4 785.3 4110.0 4958.0 2716.6 2505.4 7900.5 10405.9DEC. 825.4 3330.0 2504.6 784.1 4114.1 4960.0 2723.6 2532.8 7915.7 10448.5
1991-JAN. 826.7 3333.1 2506.4 793.7 4126.9 4980.3 2721.2 2555.9 7929.2 10485.1FEB. 836.4 3357.2 2520.9 807.0 4164.2 5018.2 2735.1 2586.6 7950.4 10537.0MAR. 842.9 3378.3 2535.4 795.3 4173.6 .2750.9 2598.6 7975.7 10574.2
NEEKLY1991-MAR. 4 837.7 3366.7 2528.9 804.6 4171.2
11 839.6 3372.6 2533.0 803.8 4176.418 839.9 3378.9 2539.0 799.7 4178.625 844.2 3385.5 2541.3 788.1 4173.6
APR. 1 851.8 3382.7 2530.9 782.2 4164.98 841.9 3388.2 2546.3 783.8 4172.0
15 844.2 3390.9 2546.7 795.9 4186.822 p 841.3 3386.6 2545.3 790.9 4177.529 p 840.3 3377.9 2537.6 783.1 4161.0
1. Debt data are on a monthly average basis, derived by averaging end-of-month levels of adjacent months, and have been adjusted to removediscontinuities.p-preliminarype-preliminary estimate
Strictly Confidential (FR).
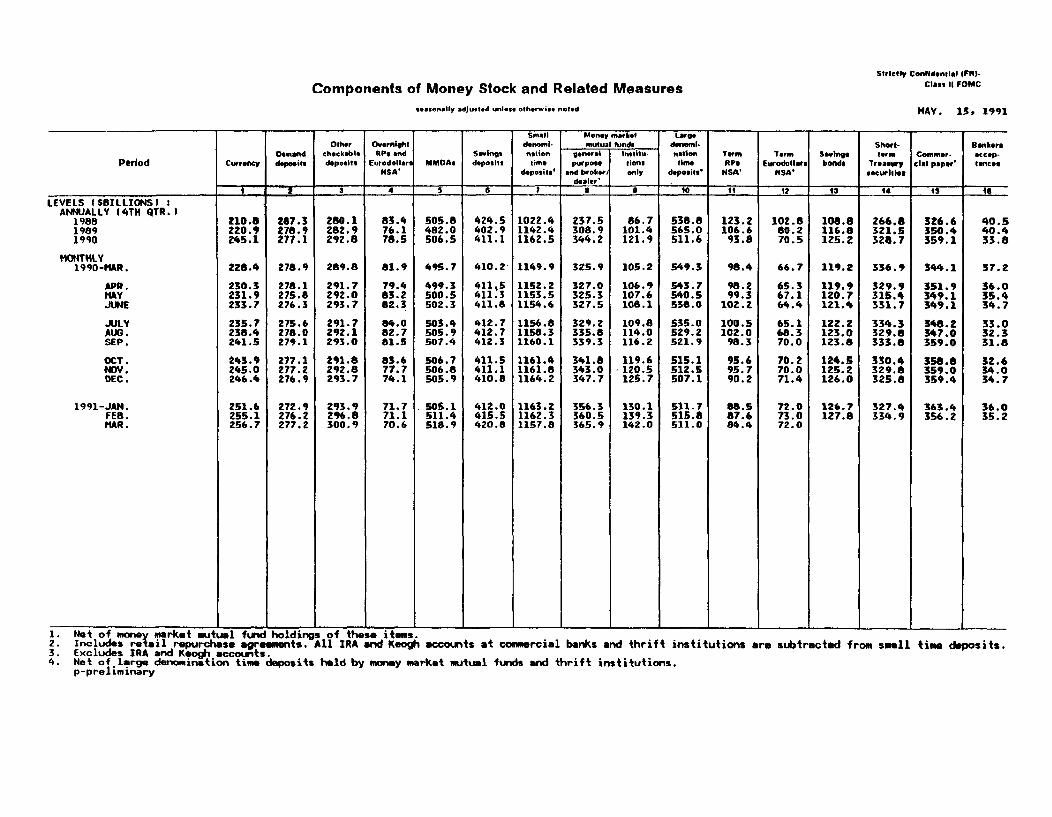
Components of Money Stock and Related Measures Class II FOMC
seasonally adjusted unless otherwise noted MAY. 13, 1991
Small Money market LargeOther Overnlghl denomi. mutual funds dwrmml- Short- Bankers
Demead checkabl RP and Savings nftion general Institu- nation Term Term Savings term Commer- accep-Period Currency depeie deposits Eurodollar MMOAs deposits time purpose lions time f P Eurodollars bonds Treasury clt paper* lances
NSA' deposits' and braoker only depositsl NSA' NSA' securitiecdealer'
__ 3 4 5 6 1 8 0 10 11t 12 t3 14 Is 16
LEVELS i$BILLIONS) :ANNUALLY (4TH QTR. )
198819891990
MONTHLY1990-MAR.
APR.MAYJUNE
JULYAUG.SEP.
OCT.NOV.DEC.
210.8 267.3220.9 278.9245.1 277.1
228.4
230.3231.9233.7
235.7238.4241.5
243.9245.0246.4
278.9
278.1275.8276.3
275.6278.0279.1
277.1277.2276.9
251.6 272.9255.1 276.2256.7 277.2
280.1282.9292.8
289.8
291.7292.0293.7
291.7292.1293.0
291.8292.8293.7
293.9296.8300.9
83.476.178.5
81.9
79.483.282.3
84.082.781.5
83.677.774.1
71.771.170.6
505.8482.0506.5
495.7
499.3500.5502.3
503.4505.9507.4
506.7506.8505.9
424.5402.9411.1
410.2
411,5411.3411.8
412.7412.7412.3
411.5411.1410.8
505.1 412.0511.4 415.5518.9 420.8
1022.41142.41162.5
1149.9
1152.21153.51154.6
1156.81158.31160.1
1161.41161.81164.2
1163.21162.31157.8
237.5308.9344.2
325.9
327.0325.3327.5
329.2335.8339.3
341.8343.0347.7
356.3360.5365.9
86.7101.4121.9
105.2
106.9107.6108.1
109.8114.0116.2
119.6120.5125.7
130.1139.3142.0
538.8565.0511,6
549.3
543.7540.5538.0
535.0529.2521.9
515.1512.5507.1
511.7515.8511.0
123.2106.693.8
98.4
98.299.3
102.2
100.5102.098.3
95.695.790.2
88.587.684.4
102.880.270.5
66.7
65.367.164.4
65.168.370.0
70.270.071.4
72.073.072.0
108.8 266.8 326.6116.8 321.5 350.4125.2 328.7 359.1
119.2
119.9120.7121.4
122.2123.0123.8
124.5125.2126.0
126.7127.8
336.9
329.9315.4331.7
334.3329.8333.8
330.4329.8325.8
344.1
351.9349.1349.1
348.2347.0359.0
358.8359.0359.4
40.540.433.8
37.2
36.035.434.7
33.032.331.8
32.634.034.7
327.4 I 363.4 36.0334.9 356.2 35.2
1991-JAN.FEB.MAR.
1. Net of money market mutual fund holdings of these items.2. Includes retail repurchase agreements. All IRA and Keogh accounts at commercial banks and thrift institutions are subtracted from small time deposits.3. Excludes IRA and Keogh accounts.4. Net of large denomination time deposits held by money market mutual funds and thrift institutions.
p-preliminary

May 10, 1991
Period
1991 -- Q1
1990 MayJuneJulyAugustSeptemberOctober
ovemberDecember
1991 JanuryFebuaryMuchApril
WeeklyFebumry 6Febnuary 13Febuwy 20Febuary 27
Much 6Makch 13MmIch 20Mmch 27
April 3'- 3April 10April 17April 24
May 1May 8
Mamo: LEVEL (il $)7May 8
NET CHANGES IN SYSTEM HOLDINGS OF SECURTES 1
MIMone of dollari, not semaonaey adulkd
7.6351,468
17.448
-3.7910.002
5.1155.241
2,160
3,3651,732
2874.197
631933
6.858-2,350
-1201,967
313908
225381
1,193
2200 5,43512,730 -11.2634,400 13,048
1,400 -5,199- 10,892- 5,115
3,000 2241
1.000 1.160
3.000
1.000
3,3651,732
2874.197
631933
6.658-5.350
-1,1201.967
313906
2,176327425
1.404 1.398258 284
-100 -
100150
°_
-200
2,950
9,6651,315
375
200- 150
- 25
S 4.150
- 50
- 325- -300
4503,7001,250
1,200
600800
25.9 61.4
- 1,200
Soo-- 00
- 800
13.8 24.7
STRICTLY CONFIDENTIAL (FR)
CLASS II-FOMC
Net changeoutright
14.513-10,39013,240
-5.00010,9645.0452.230
5.310
3.3651,782
2544.160
631809
6.983-5,651
-1,1202,4174.0132,067
225381
1,643
8391,061
9311.200
1,557-1,6839.157
-4,061509
9512614
-21,810
-37821462.6631,110
-3,878-1,224
50913,329
-5,800-1,127
-14,7931,370
-5.395,3323.466
-2,757
2460-7,1779,762
-8.227
1.035 3.5851,273 -,778
- 5.560-01 -5.997
- 5.180- -3,263
256.0 -11.4
S2.6 2.4 1.0 0.2 .2
1. Change from andff-peiod to end-of-period. 5. Relect net change n iduptions (-) of Trewuy and agency securti.2 Outgr tranacUons in market and with foreign ccoun. 6. Include change i R (+), matched selepurchlse tansactons (-), mnd mchd purchase *e bianmscMan (+).3. Outright tranactions in market and with foreign accounts. nd aho-tem note acquired 7. The levels o agency sues we as folows:in exchng for maturing bills. Exdudes maturty shlht md rmovem of maturing ibues,4. Weekly net purchases of Trea6uy coupons e summed aver a mludMit. Iy 1-5 I 5-10 I or 10 Itol I
ay 8