Embed Size (px)
Citation preview

Prefatory Note
The attached document represents the most complete and accurate version available based on original copies culled from the files of the FOMC Secretariat at the Board of Governors of the Federal Reserve System. This electronic document was created through a comprehensive digitization process which included identifying the best-preserved paper copies, scanning those copies,1 and then making the scanned versions text-searchable.2 Though a stringent quality assurance process was employed, some imperfections may remain.
Please note that this document may contain occasional gaps in the text. These gaps are the result of a redaction process that removed information obtained on a confidential basis. All redacted passages are exempt from disclosure under applicable provisions of the Freedom of Information Act.
1 In some cases, original copies needed to be photocopied before being scanned into electronic format. All scanned images were deskewed (to remove the effects of printer- and scanner-introduced tilting) and lightly cleaned (to remove dark spots caused by staple holes, hole punches, and other blemishes caused after initial printing). 2 A two-step process was used. An advanced optimal character recognition computer program (OCR) first created electronic text from the document image. Where the OCR results were inconclusive, staff checked and corrected the text as necessary. Please note that the numbers and text in charts and tables were not reliably recognized by the OCR process and were not checked or corrected by staff.

Strictly Confidential (FR) Class I FOMC
MONETARY POLICY ALTERNATIVES
Prepared for the Federal Open Market Committee
By the staff Board of Governors of the Federal Reserve System

STRICTLY CONFIDENTIAL (FR)CLASS I - FOMC March 23, 1990
MONETARY POLICY ALTERNATIVES
Recent Developments
(1) Open market operations since the last FOMC meeting have been
aimed at maintaining reserve pressures at the level prevailing since late
last year. The federal funds rate stayed mostly around 8-1/4 percent.
Abstracting from special situation borrowing by the Bank of New England,
initially classified as adjustment borrowing, the allowance for adjustment
plus seasonal borrowing incorporated in the nonborrowed reserve objective
during the intermeeting period was $150 million. Seasonal plus adjustment
borrowing averaged $160 million in the three maintenance periods since the
February meeting. Borrowing generally has run well below this level,
except for occasional surges on settlement Wednesdays owing to unexpected
movements in the supply and demand for reserves; not only was adjustment
borrowing usually quite low, but the increase in seasonal borrowing has
been somewhat less than typical over this part of the year. Market
concerns about financial strains on some institutions evidently have made
banks even more chary of being seen at the window, and needs for liquidity
have been held down by sluggish loan demand and robust inflows of retail
deposits.
(2) Although the federal funds rate was steady over the inter-
meeting period, other short-term rates edged higher as have yields on
1. This average excludes the adjustment credit of the Bank of NewEngland in the first maintenance period. This borrowing was classifiedas extended credit on February 21, the last day of that period.

intermediate-term issues, maintaining a modest upward tilt to the Treasury
yield curve out to 3 years. Somewhat mixed economic information received
over the intermeeting period evidently was interpreted as pointing, on
balance, to some firming of economic activity and the persistence of price
pressures. The Federal Reserve, consequently, is now seen as unlikely to
ease policy any further in the near term, especially against the back-
ground of its stated commitment to reducing inflation gradually, and pos-
sibly even having to tighten over a somewhat longer horizon. Treasury
bond yields, though fluctuating over a fairly wide range, fell slightly on
balance over the period, despite increases in long-term rates in other
major countries, which reflected importantly increases in inflation
expectations, as discussed below in paragraph (3). Indeed, bond yields
may have been held down to an extent by shifting demands toward dollar
assets, as evidenced also by a rise in the foreign exchange value of the
dollar. Stock prices also were firm, with major indexes rising 1 to 2
percent over the intermeeting period. The collapse of Drexel Burnham
Lambert had little impact on financial markets outside the noninvestment-
grade sectors. Its collapse, along with potential sales by some large
institutional holders, contributed to a widening of the spread between
yields on junk bonds and other long-term securities. In addition, some
corporations that had been issuing low-grade or unrated commercial paper
through Drexel were unable to roll over maturing issues.
(3) The dollar's exchange value has appreciated by about 3 per-
cent on a weighted-average basis since the last Committee meeting, rising
6 percent against the yen and sterling and 3 percent against the mark.

The dollar's strength generally seemed to reflect various political and
financial difficulties in foreign countries. Despite a favorable result
for the ruling LDP in the Japanese parliamentary elections, a generally
bearish mood continued to prevail in Japanese financial markets. Stock
prices declined by about 20 percent while long-term bond yields rose by
more than 50 basis points. Three-month interest rates in Japan also rose
by 50 basis points, all in advance of the Bank of Japan's one percentage
point increase in its discount rate on March 20. In Germany, increased
inflation expectations, related to monetary unification, propelled bond
rates more than 50 basis points higher, while 3-month German rates rose by
30 basis points. German stock prices rose slightly, on balance, over the
period. In the United Kingdom, an uncertain political situation combined
with a more pessimistic outlook for inflation and the external deficit to
depress sterling.
the Desk accounted for
nearly $1.7 billion, $1.5 billion against yen and $200 million against DM.
All of the Desk's sales of dollars after March 2--$830 million--were for
the Treasury's account.
(4) M2 accelerated to a 9-1/2 percent rate of increase in Febru-
ary but, based on partial deposit data through March 19, is estimated to
be slowing to a 6 percent rate this month. This pattern would bring the
rate of increase from December to 6-1/2 percent, a bit below the 7 percent
path specified by the Committee for the December-to-March period. Demands
for M2 this quarter likely have been boosted by strength in nominal in-
come, by some acceleration in personal income tax refunds, and, perhaps

earlier in the quarter, by a reluctance to commit funds to junk bond and
stock markets in view of unsettled conditions. However, the opportunity
costs of holding M2 instruments have risen over the first three months of
the year, as retail deposit offering rates have remained relatively flat,
especially at shorter maturities, while most market rates have risen. In
addition to the usual lag of deposit behind market rates, depository
institutions may have held down offering rates as core deposits remained
fairly strong relative to asset growth. The damping influence on M2
demand of higher opportunity costs is evidenced by the recent strength in
noncompetitive tenders at Treasury auctions, and, along with the ebbing
effects of earlier market rate decreases, has contributed to a small
estimated increase in M2 velocity in the first quarter, after two quarters
of substantial declines.2
(5) Following a 5-1/2 percent rate of expansion in February,
growth of M3 is estimated at a 1-1/2 percent rate in March. Over the
first three months of the year, M3 has grown at a 3 percent rate, 1/2
percentage point below the pace specified by the Committee for the
December-to-March period. Expansion of M3 thus far this year has been
curbed by continued contraction of the thrift industry, though apparently
the rate of decline has been slower than in the fourth quarter. In addi-
tion, a variety of influences have damped M3 growth at banks: growth of
2. Currency growth, though moderating, remained strong in March, fol-lowing three months of expansion averaging 11 percent; foreign demandsappear to account for the unusual strength in currency. Even so, M1growth was held down to only about 4-1/2 percent over the first threemonths of the year by slow growth in transaction deposits. Reflectingrapid increases in currency, the monetary base expanded at a 10 percentrate from December to March.

bank credit was weak in January, while the financing of stronger asset
growth in February and March relied heavily on non-M3 managed liabilities
and government deposits. Although banks have tapped the Eurodollar
deposit market for funds this year, holdings of those deposits by U.S.
residents--a component of M3--has continued to decline, further depressing
growth of this aggregate. Apparently, U.S. residents have found these
investments less attractive at the unusually narrow spreads prevailing
relative to returns on domestic investments.
(6) Growth in the debt of nonfinancial sectors over the first
quarter is estimated to have continued at about the 7-1/2 percent pace of
the last three months of 1989, leaving this aggregate around the middle of
its monitoring range. Treasury borrowing has picked up, seasonally ad-
justed, in anticipation of funding RTC working capital needs; borrowing by
private sectors, however, evidently moderated slightly. Business borrow-
ing remained subdued. Equity retirements dropped further, reflecting
inhospitable conditions in the junk bond market and more stringent credit
standards by banks and other lenders; on the other hand, business needs
for external funds to finance increases in capital spending widened as
internal funds dropped further. A survey of large banks also suggested
they were taking a more cautious approach to lending to below investment-
grade business borrowers for other purposes; however, recent business-loan
price information does not provide any evidence of widespread increases in
spreads of loan rates over funding costs. For the first time in the cur-
rent expansion, banks showed virtually no overall increases in their wil-
lingness to extend consumer installment loans over recent months, and a

-6-
substantial proportion have tightened standards on home equity lines of
credit. Nevertheless, consumer credit extended by banks and others so far
this year appears to be expanding at around its moderate fourth-quarter
pace, maintained in part by generous auto incentive packages. Mortgage
rate spreads suggest that credit for residential first mortgages is gener-
ally available, but survey evidence coupled with Call report data indicate
that banks have reduced the availability of commercial real estate credit,
particularly for construction and land development purposes.

MONEY, CREDIT, AND RESERVE AGGREGATES(Seasonally adjusted annual rates of growth)
Dec. QIV'89to to
Jan. Feb. Mar. Mar.pe Mar.pe
Money and credit aggregates
Ml -0.2 10.0 4-1/4 4-3/4 5
M2 3.8 9.4 6 6-1/2 6-3/4
M3 1.8 5.5 1-1/2 3 3
Domestic nonfinancial debt 5.4 8.0 n.a. 6-3/4 6-1/21
Bank credit 2.7 8.6 7-1/4 6-1/4 5-1/2
Reserve measures
2Nonborrowed reserves -6.1 -3.5 18-1/2 3 4
Total reserves -2.7 6.5 3-1/4 2-1/4 3
Monetary base 10.9 9.4 9-3/4 10 9
Memo: (Millions of dollars)
Adjustment plus seasonalborrowing 414 913 159
Excess reserves 1016 988 862
n.a. - Not available.pe - Preliminary estimates.1. Through February.2. Includes "other extended credit" from the Federal Reserve.
NOTE: Monthly reserve measures, including excess reserves and borrowing, arecalculated by prorating averages for two-week reserve maintenance periods thatoverlap months. Reserve data have been revised to reflect annual revisions toseasonal factors and to adjust for discontinuities associated with the annualindexations of the reserve requirement exemption and low reserve tranche.

Policy Alternatives
(7) Three policy alternatives are presented for Committee con-
sideration. Under alternative B, maintaining federal funds trading around
8-1/4 percent is anticipated to be associated with about $150 million of
adjustment plus seasonal borrowing, the assumption used since the last
FOMC meeting in constructing reserve paths. Although seasonal borrowing
should increase over coming weeks, underlying demands for adjustment bor-
rowing, absent unusual settlement day pressures, are likely to remain
weak. Alternative A embodies a 7-3/4 percent federal funds rate and a
borrowing assumption of $100 million, while the 8-3/4 percent funds rate
of alternative C reflects borrowing of $200 million. Predicting the rela-
tionship between the federal funds rate and discount window borrowing
remains difficult, however, justifying continued flexibility in the Desk's
approach to the borrowing objective.
(8) Projected growth rates for the monetary aggregates from March
to June under the three policy alternatives are given in the table below.
(The table and charts on the following pages show more detailed data.)
Under all the alternatives, M2 and M3 are likely to remain within the
upper and lower halves of their respective annual growth ranges through
June. The monthly pattern of monetary growth is highly uncertain because
of normal difficulties in assessing the effects of individual tax payments
around the mid-April tax season. Last year, liquid balances were
depressed by tax payments in April and by still more in May, before
rebounding sharply over the summer. We have assumed that the element of
surprise in tax payments reflected in the behavior of money in 1989 will

-9-
be absent this year, so that deposit flows will be better captured by the
current seasonal factors and hence will be smoother, seasonally adjusted.
Still, with total individual nonwithheld tax payments expected to exceed
last year's elevated pace by a little, the possibility of above-normal
reductions in liquid balances to pay those taxes poses a downside risk to
the money paths given below. Another such risk, particularly at the M3
level, is the possibility of very large expenditures by the RTC. These
expenditures tend to depress M3 by, in effect, substituting Treasury
financing for monetary liabilities. The staff has assumed a substantial
pickup in RTC activity in the second quarter, though by less than the
announced plans of the RTC.
Alt. A Alt. B Alt. C
Growth from Marchto June
M2 7 6 5M3 4-1/2 4 3-1/2Ml 6 4-1/2 3
Associated federalfunds rate ranges 6 to 10 6 to 10 7 to 11
(9) Financial market participants evidently expect no monetary
policy change in the near term, meaning that a funds rate around the 8-1/4
percent level of alternative B is built into the current structure of
market interest rates. Even so, alternative B would involve some easing
in Treasury bill rates from most recent levels to the extent that supply
pressures in the market dissipate. That will depend to some extent on the
pace of RTC activity and associated working capital needs. Greater RTC

Alternative Levels and Growth Rates for Key Monetary Aggregates
M2 M3 M1
Alt. A Alt. B Alt. C Alt. A Alt. B Alt. C Alt. A Alt. B Alt. C
Levels in billions1990 January 3232.0 3232.0 3232.0 4047.1 4047.1 4047.1 794.7 794.7 794.7
February 3257.2 3257.2 3257.2 4065.8 4065.8 4065.8 801.3 801.3 801.3March 3273.4 3273.4 3273.4 4070.8 4070.8 4070.8 804.1 804.1 804.1
April 3291.1 3289.8 3288.5 4085.0 4084.4 4083.8 807.7 807.1 806.5May 3310.1 3306.2 3302.3 4100.0 4098.0 4096.0 811.6 810.1 808.6June 3330.8 3322.6 3314.4 4116.6 4111.5 4106.4 816.1 813.1 810.1
Monthly Growth Rates1990 January 3.8 3.8 3.8 1.8 1.8 1.8 -0.2 -0.2 -0.2
February 9.4 9.4 9.4 5.5 5.5 5.5 10.0 10.0 10.0March 6.0 6.0 6.0 1.5 1.5 1.5 4.2 4.2 4.2
April 6.5 6.0 5.5 4.2 4.0 3.8 5.4 4.5 3.6May 6.9 6.0 5.1 4.4 4.0 3.6 5.9 4.5 3.1 "June 7.5 6.0 4.4 4.9 4.0 3.0 6.7 4.4 2.2 ?
Quarterly Ave. Growth Rates1989 Q2 1.6 1.6 1.6 3.2 3.2 3.2 -4.4 -4.4 -4.4
Q3 6.9 6.9 6.9 3.9 3.9 3.9 1.8 1.8 1.8Q4 7.1 7.1 7.1 1.8 1.8 1.8 5.1 5.1 5.1
1990 Q1 6.6 6.6 6.6 3.2 3.2 3.2 4.7 4.7 4.7Q2 6.9 6.4 5.8 3.9 3.6 3.4 5.9 5.1 4.2
Dec. 89 to Mar. 90 6.4 6.4 6.4 2.9 2.9 2.9 4.7 4.7 4.7Mar. 90 to June 90 7.0 6.0 5.0 4.5 4.0 3.5 6.0 4.5 3.0
Q4 88 to Q4 89 4.6 4.6 4.6 3.2 3.2 3.2 0.6 0.6 0.6Q4 89 to Q1 90 6.6 6.6 6.6 3.2 3.2 3.2 4.7 4.7 4.7Q4 89 to Q2 90 6.8 6.6 6.3 3.6 3.4 3.3 5.3 4.9 4.5Q4 89 to Mar. 90 6.8 6.8 6.8 3.1 3.1 3.1 5.1 5.1 5.1Q4 89 to June 90 6.9 6.5 6.1 3.7 3.5 3.3 5.5 4.9 4.2
1990 Target Ranges: 3.0 to 7.0 2.5 to 6.5

Chart 1
ACTUAL AND TARGETED M2
Billions of dollars
Actual Level* Short-Run Alternatives
- - Projected Level
O N D J F M A M J J A S O N D
3450
3400
3350
3300
3250
3200
3150
3100
1989 1990
- Actual Level* Short-Run Altemat
- - Projected Lev
Chart 2
ACTUAL AND TARGETED M3
Billions of dollars4350
6.5%ives'el 4300
,-''SSS - 4250* - 4100S- 42504200
S• 2.5%- 4150
0 B
• -4100
S ' 4050
-- 4000
3950
O N D J F M A M J J A S O N D3900
^^
19901989

Billions of dollars
Actual Level------ Growth From Fourth Quarter- - Projected Level
II
pV
10%
5%
d, .
* A ,
.- ' *Sc
-"
O%
----
'*'
., -5%S
I I I I I I I I I I I I I I
O N D J F M A M J J A S O N D
Chart 3
M1
825
-- 800
-- 775
750
*
,
19901989

Actual LevelSProjected Level
O N D J F M A M J
1989
rBillions of dollars
10750
9%
10500
5%, u10250
10000
9750
I I I I I I 9500J A S 0 N D
1990
^^
^^

-11-
funding needs would be met in the first instance by a drawdown in Treasury
cash balances--since some RTC working capital usage has already been
financed--and only subsequently by augmenting Treasury borrowing. Conse-
quently, we are projecting a substantial paydown in Treasury bills over
the intermeeting period after the tax date. Moreover, central bank sales
of Treasury securities to fund their dollar sales in foreign exchange
markets could drop off at any time should intervention activity decline.
The staff anticipates relative stability in the exchange value of the
dollar under alternative B. Decisions regarding economic and monetary
union of East and West Germany, which are to be made by the end of April,
could affect the dollar's value against the mark. If those decisions
heighten expectations of German inflation, the dollar could continue under
upward pressure against the mark; increases in German interest rates owing
solely to such expectations would not necessarily affect real and nominal
interest rates in the United States. Bond prices in the U.S. will remain
most sensitive to prospects for U.S. economic growth and inflation.
Incoming data on prices and the economy about in line with staff expecta-
tions should not change market expectations that Federal Reserve policy
will remain essentially unchanged for a time, and consequently would be
associated with only minor movements in bond yields.
(10) An immediate policy easing under alternative A that brought
the federal funds rate down to 7-3/4 percent would run counter to market
sentiment and ripple through the money market, with other short-term rates
likely declining a similar amount. Lower short-term funding costs also
should engender reductions in lending rates on business and consumer
credit. The exchange value of the dollar would tend to adjust downward.

-12-
A dollar depreciation might combine with prospects for somewhat stronger
U.S. economic activity to heighten domestic inflationary expectations,
limiting the declines in longer-term yields.
(11) The rise in the federal funds rate under alternative C to
8-3/4 percent also would surprise market participants, inducing an across-
the-board increase of comparable size in other short-term rates. Recent
upward pressure on the exchange value of the dollar would continue. Bond
yields would tend to rise, though with inflation expectations lessened by
the monetary policy tightening, the increases could be muted. The addi-
tional policy restraint might reinforce current concerns about default
risk on some loan categories, and would tend to encourage a further firm-
ing in credit standards, implying additional restraint on economic
activity.
(12) Under alternative B, M2 growth from March to June is pro-
jected at a 6 percent annual rate--about 1/2 percentage point below its
average growth rate over the first three months of the year. Nominal
income growth is projected to slow next quarter. Opportunity costs may
narrow only a little from recently elevated levels. Thrifts are discour-
aging deposit inflows as part of their effort to trim balance sheets; many
of these deposits are going to banks instead, and these deposit shifts
would be augmented as the RTC steps up the rate at which it resolves
institutions. Banks may be unwilling, however, to expand their assets in
line with deposit inflows, given concerns about loan quality and the
capital requirements associated with a pickup in asset growth. In such
circumstances, offering rates on retail deposits are likely to stay some-
what depressed relative to Treasury bill rates. With opportunity costs

-13-
little changed, velocity probably will be about flat in the second quar-
ter.3 M1 is expected to continue expanding at a 4-1/2 percent annual
rate from March to June, as a slowing of currency growth is offset by a
little faster inflow to transactions deposits than over the first quar-
ter.4
(13) M3 growth under alternative B is projected at a 4 percent
pace, somewhat higher than the December-to-March rate of advance. The
acceleration primarily owes to some pickup in bank credit growth from
6-1/2 percent over the first quarter to around a 7-1/4 percent pace,
reflecting a resumption of business lending; as a consequence, the decline
in large time deposits at commercial banks should cease. In addition, the
runoff of the term Eurodollar component of this aggregate is likely to
ebb. Greater RTC activity would tend to hold down M3 growth to the extent
that such activity necessitated additional government borrowing; the
expenditure of funds previously borrowed by the Treasury would not affect
M3 because such funds are already on deposit at commercial banks. Thrifts
are assumed to continue trimming their large time deposits at about the 25
percent annual rate of the first quarter, while their runoffs of term RPs
abate a bit because the outstanding stock of these liabilities has fallen
to a rather low level.
3. Revisions to the staff greenbook forecast for 1990 have counter-vailing effects on projected growth rates of the monetary aggregates forthe year as a whole. Projected M2 and M3 growth remains unchanged at6-1/2 and 4 percent, respectively, as the impact of stronger GNP growthis about offset by higher nominal interest rates.4. Owing to the outlook for slower currency growth, the monetary base
is projected to record a 4-3/4 percent annual rate of change from Marchto June, compared with the 10 percent increase from December to March.

-14-
(14) Domestic nonfinancial debt is projected to grow at a 6-1/2
percent annual rate from March to June, down from an estimated 7-1/2 per-
cent pace over the previous three months.5 The slowing is attributable
to net federal borrowing, which is projected to slacken substantially,
despite some borrowing to finance RTC working capital. The household,
business, and state and local sectors are all expected to maintain debt
growth at about their first-quarter rates. Some continued restraint on
business credit expansion is assumed to derive from a further reduction in
net equity retirements. Overall debt growth from the fourth quarter of
last year to June is foreseen at the middle of its 5 to 9 percent monitor-
ing range.
(15) Under the less restrictive policy posture of alternative A,
M2 and M3 growth from March to June would be boosted to 7 and 4-1/2 per-
cent rates, respectively. M2 would be close to the 7 percent upper limit
of its annual range, and on a trajectory that would carry it above its
upper bound in the third quarter. M3 would remain well below its midpoint
in June, reflecting both the downsizing of the thrift industry and a lower
responsiveness than M2 to movements in market interest rates. Under the
tighter financial market conditions of alternative C, M2 and M3 growth
from March to June likely would slow to 5 and 3-1/2 percent rates,
respectively. M2 growth from the fourth-quarter base of its annual range
5. Projections of debt growth for 1990 also have been left unchanged;however, the composition of borrowing differs. Federal debt increasessignificantly faster than projected in the last greenbook, owing to thedecision to finance RTC working capital through the Federal FinancingBank. The assumed added borrowing in this calendar year of around $35billion boosts overall debt growth in 1990 by about 1/4 percentagepoint. However, anticipated growth of nonfederal debt in 1990 has beenreduced, reflecting the recent trend of lower business borrowing forcorporate restructuring and slower growth of household debt.

-15-
to June would be 6 percent. The associated growth for M3 by June would be
3-1/2 percent, compared with the 2-1/2 percent lower bound of its annual
growth cone.
-16-
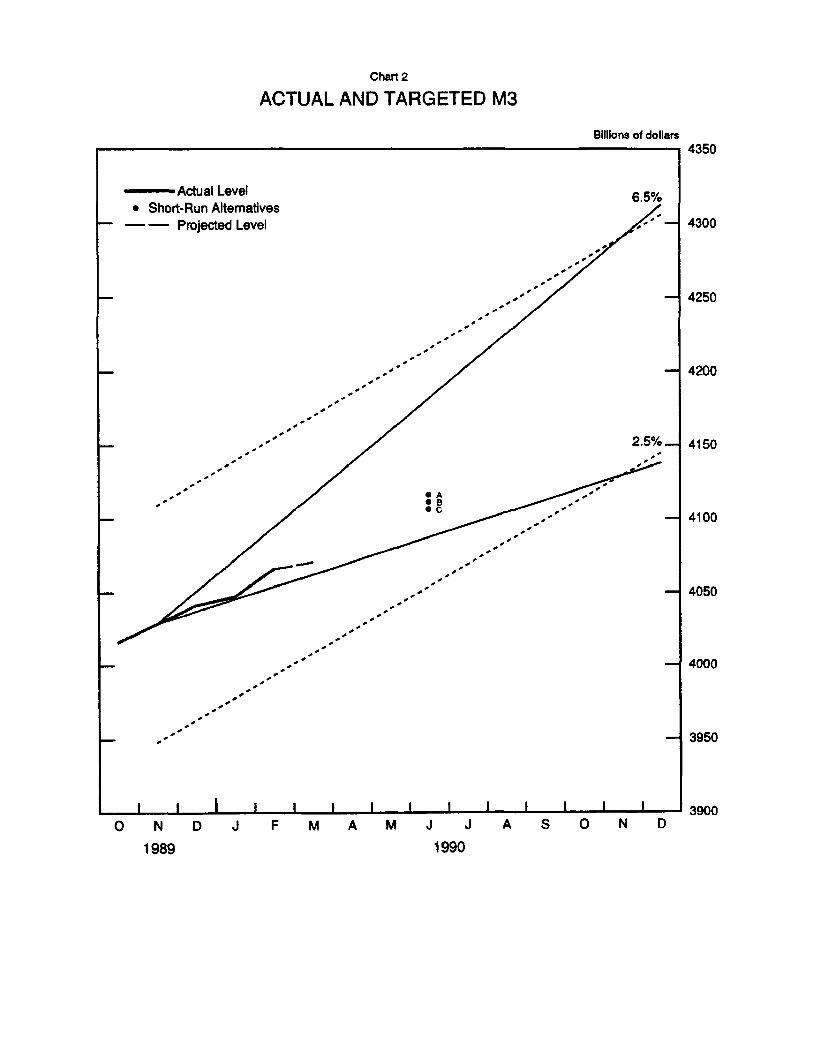
Directive Language
(16) Draft language for the operational paragraph, including the
usual options and updating, is shown below.
OPERATIONAL PARAGRAPH
In the implementation of policy for the immediate
future, the Committee seeks to DECREASE SOMEWHAT/maintain/
INCREASE SOMEWHAT the existing degree of pressure on reserve
positions. Taking account of progress toward price stabil-
ity, the strength of the business expansion, the behavior of
the monetary aggregates, and developments in foreign ex-
change and domestic financial markets, slightly (SOMEWHAT)
greater reserve restraint (WOULD/ MIGHT) or slightly
(SOMEWHAT) lesser reserve restraint would (MIGHT) be accept-
able in the intermeeting period. The contemplated reserve
conditions are expected to be consistent with growth of M2
and M3 over the period from [DEL: December through] March THROUGH
JUNE at annual rates of about ____ AND ____ [DEL: 7 and 3-1/2] percent
respectively. The Chairman may call for Committee consul-
tation if it appears to the Manager for Domestic Operations
that reserve conditions during the period before the next
meeting are likely to be associated with a federal funds
rate persistently outside a range of ____ TO ____ [DEL: 6 to 10] per-
cent.

March 26. 1990SELECTED INTEREST RATES
(percent)
89 -- HighLow
90 -- HighLow
MonthlyMar 89
May 89
Jul 89Aug 89Sep 89Oct 89Nov 89Dec 89
Jan 90Feb 90
wedadyDec 6 89Dec 13 89Dec 20 89Dec 27 89
Jan 3 90Jan 10 90Jan 17 90Jan 24 90Jan 31 90
Feb 7 90Feb 14 90Feb 21 90Feb 28 90
Mar 7 90Mar 14 90Mar 21 90
DallyMar 16 90Mar 22 90Mar 23 90
SCDO | m oney Ilunml thWy bM seconday I comm | maert bank
lundi condaiy mark- mare I pate I muual t rone-.---- im_- I.a .-L -_a_ 1mh iund .Ian
9.95 9.04 9.07 8.96 10.23 9.98 9.19 11.508.38 7.54 7.35 7.15 6.24 8.35 7.87 10.50
8.32 7.96 7.89 7.82 8.40 8.48 806 10.508.20 7.54 7.45 7.28 8.11 8.14 7.62 10.00
9.85 8.82 8.85 882 10.09 9.88 8.89 11.509.84 865 8.65 8.64 9.94 9.77 9.14 11.509.81 8.43 8.41 8.31 9.59 9.57 913 11.50953 8.15 7.93 7.84 9.20 9.34 896 11.079.24 7.88 7.61 7.36 8.76 8.95 8.72 10.988.99 7.90 7.74 7.61 8.64 8.79 8.32 10.509.02 7.75 7 74 7 65 8.78 8.87 8.25 10.508.84 7.64 7.62 745 8.60 8.66 821 10.508.55 7.69 7.49 7.25 8.39 8.47 800 10.508.45 7.63 7.42 7.21 8.32 8.61 7.90 10.50
8.23 7.64 7.55 738 8.16 8.20 7.74 10.118.24 7.74 7.70 7.55 8.22 8.22 7.64 10.00
8.52 7.57 7.35 7.19 8.24 8.51 7.94 10.50847 7.86 7.39 7.25 8.32 8.57 7.89 10.508.52 7.62 7.41 7.15 8.41 8.72 7.91 10508.38 7.66 7.51 7.23 8.32 8.60 7.87 10.50
8.32 7.61 7.52 7.28 8.23 848 8.06 10508.22 7.54 7.45 7.28 8.15 8.19 7.79 10.298.20 7.60 7.50 7.31 8.11 8.14 7.74 10.008.23 7.72 7.60 745 8.20 8.20 7.70 10.008.24 7.72 7.67 752 8.19 8.21 7.70 10.00
8.22 7.80 7.74 7.58 8.22 8.24 765 10.008.21 7.70 7.66 7.50 8.21 8.19 7.65 10008.25 7.74 7.72 7.59 8.22 8.22 7.64 10.008.27 7.72 7.70 7.55 8.24 8.22 7.64 10.00
8.28 7.84 7.79 769 8.27 8.27 7.62 10.008.27 7.96 7.87 7.82 8.38 8.33 7.64 10.008.27 7.94 7.89 7.78 8.40 8.35 7.66 10.00
8.228.28S 827 p
7.86 7.76 8.40 8.347.83 7.73 8.38 8.357.83 7.71 8.35 8.34
10.0010.0010.00
Lral Termcorpwate I ( convPnitonal home mortgages
US gomnmen constant A ullMy | municipal I secondary Ir matuly yields recntly | Bond ) market ptmar rnartre
--i ) I ..-.-l aI I -. lu nid |-B l J Jal I I1- e edu -la -e lARM
10 11 1- -_ _12 1 _ 1. 14 1 1 - 1 Ir
10,479.26
10.009.55
10.3710.3310.099.659.549559.559.399.28936
9.639.84
9.299.339.40954
9559.579.659.759.83
9.759.849.949.91
10.009.929.82
7.74 7.837.78 7.847.70 7.787.83 7.87
7.90 7.947.94 8.018.04 8.138.24 8.308.37 8.47
8.41 8.518.29 8.388.43 8.528.42 8.49
8.55 8.598.69 8.658.66 8.59
8.628.608.59p
8.598.538.52p
7.95 1173 1122719 9.92 968
755 1067 1034735 1013 9 RO
7.85 11.47 11037.73 11.32 11057.51 10.90 10777.35 10.39 10207.28 10.11 9887.36 1038 9997.52 10.44 10137.48 10.19 9.957.39 10.06 9777.31 10.06 9.74
7.43 1030 990752 1049 10.20
7.35 10.07 9.767.29 9.98 9.757.28 10.01 9,697.33 10.17 9.78
7.36 1013 9837.35 10.18 9.807.49 10.34 9,907.52 10.53 10057.52 10.50 10.17
7.50 10.36 10.217.49 10.50 10.107.55 1060 10317.50 10.55 10.23
7.50 10.67 10.297.55 10.63 10.347.54 10.55 10.26
8.34
8.568.35
9099.409.309.038.748.658.718.628.518.39
8398.46
8.398.398.348.39
8.358.418.398418.45
8.468.488.448.48
8.508.558.56
8.558.498.48p
NOTE Wekm y data l olrm C ms 1 through 11 are statement week aerages Oan column 7 ate laln fom Donoghue s Money Fund Repor Column 12. 13 and 14 aIe 1-day quotes or Friday Thursday or Friday respectlly fol nwlng ti endolihe alelwn t e Column 13 Ilht Bond Buyer revMteiendek Column 14Is ttFNMA purcuhae yOed pius loan servcing ee on 30-day madatoryde ry com"nminnmes Column 15 s lhe average contract rate on new comnimlrenls
for fixd rat modgagas(FRu t W h 0 ercent loan o- lue ratios at major instliutlinal l nd n Column 16 Is the average Inilal contrc rate aon new comItments toI 1 -ye adjustable -ale morgagestARMsl at majlo Insitlutional lenders
olteing bot FRMs and ARMs with the sam number of dIcount pointsp -- pretnilly data

Strictly Confidential (FR)
Money and Credit Aggregate Measures Class II FOMC
Seasonally adjusted MAR. 26, 1990
Money slock measures and liquid ast I Bkank credit Domestic nonfinancial debt'
nontranlKctionl total loans U.S.Period M M components M3 L ind government* other' total"
in M2 I in M3 only Inve tmen( 3 6 7 8_ 1 10
ANN. GROHTH RATES (%) :ANNUALLY (Q4 TO 44)
198719881989
QUARTERLY AVERAGE1989-1st QTR.1989-2nd QTR.1989-3rd QTR.1989-4th QTR.
MONTHLY1989-FEB.
MAR.APR.MAYJUNEJULYAUG.SEP.OCT.NOV.DEC.
1990-JAN.FEB. p
LEVELS I(BILLIONS) :MONTHLY
1989-OCT.NOV.DEC.
1990-JAN.FEB. p
WEEKLY1990-FEB.
MAR. 5 p12 p
6.34.30.6
-0.1-4.41.85.1
1.4-1.8-5.2-9.1-3.98.42.03.88.02.08.2
-0.210.0
788.1789.4794.8
794.7801.3
798.6798.9800.5804.9
807.0802.2
1. Debt date are on a monthly average basis,discontinuities.p-preliminarype-preliminary estimte
4.35,24.6
2.31,66.97.1
1.83.41.0-1.66.39.87.66.36.97.37.8
3.89.4
3181.43200.83221.7
3232.03257.2
3249.53252.53256.73264.7
3269.73269.3
3.65.55.9
3.23.78.77.7
1.95.23.10.99.8
10.39.57.06.69.07.7
5.19.2
2393.42411.42426.9
2437.32456.0
2450.92453.52456.22459.8
2462.72467.0
12.010.6-1.5
9.69.1
-6.9-17.3
8.715.28.46.34.1
-4.2-20.3-23.0-19.8-10.1-12.0
-6.3-9.7
834.7827.7819.4
815.1808.5
810.0810.1809.6806.6
803.0800.1
5.86.33.2
3.93.23.91.8
3.36.02.60.25.86.71.40.01.33.73.8
1.85.5
4016.24028.54041.1
4047.14065.8
4059.54062.64066.34071.3
4072.74069.4
5.67.14.4
5.25.04.22.7
4.48.26.3
-0.15.66.33.41.32.13.84.6
0.3
4831.24846.44864.8
4865.9
7.97.87.1
6.66.77.07.6
12.57.S4.36.66.37.97.15.511.47.11.6
2.78.6
2562.62577.72581.2
2585.02603.5
9.08.07.4
7.76.94.69.5
9.011.75.64.24.3
-0.19.1
10.99.5
10.93.7
5.710.8
2238.22258.52265.4
2276.12296.5
10.29.48.1
8.37.97.97.4
8.66.77.98.87.68.38.06.18.08.25.2
5.37.2
7423.17474.07506.2
7539.47584.8
.5. 2 5 ... f . L J
derived by averaging end-of-month levels of adjacent months, and have been adjusted to remove
9.99.18.0
8.27.77.27.9
8.77.97.47.76.96.48.27.28.48.84.8
5.48.0
9661.39732.59771.6
9815.59881.3

Strictly Confidential (FR)-Class II FOMCComponents of Money Stock and Related Measures
seasonally adjusted unless otherwise noted MAR. 26, 1990
Smell Money market LargeOther Overnight denomi. mutual funds denomi- Short- Bankers
Demand checkable RPs end Savings nation geeral Inslitu. notion Term erm Savings term Commer- accep-Period Currmy deposits deposilt Eurodollar MMDAe depolitl time purpose lions time RPs Eurodollars bonds Treasury cll paper' ances
NSA' deposits' and broker only deposit' NSA' NSA' securitiesdealer'
S3 4 5 6 7 8 9 10 1t 12 13 4 15 Is
LEVELS (*BILLIONS) iANNUALLY 14TH QTR.)
198719881989
MONTHLY1989-FEB.
MAR.
APR.MAYJUNE
JULYAUG.SEP.
OCT.NOV.DEC.
1990-JAN.FEB. p
195.0210.7220.8
214.1215.3
215.7216.6217.2
217.8218.6219.3
220.0220.4221.9
224.6226.6
291.5287.6279.5
284.9283.9
281.3279.6276.3
279.6278.5278.1
280.0278.8279.7
277.3280.2
260.5 87.6280.4 83.3283.1 75.6
280.2279.1
277.9272.8273.0
274.5276.0278.4
280.8282.8285.7
285.3286.8
83.382.1
78.577.879.6
81.078.374.9
75.374.876.8
80.781.6
529.3504.9480.0
485.6479.9
473.2463.1460.9
463.9468.2471.9
475.3480.8483.8
484.9489.3
416.2 903.6428.2 1021.6407.7 1138.9
421.0417.9
412.0405.4403.4
403.3404.0405.5
406.1407.9409.0
1054.21066.4
1084.11103.01114.0
1122.41130.01132.6
1135.91138.51142.2
410.3 1142.5413.7 11141.2
220.5237.5308.3
247.2253.4
257.8261.2268.3
277.7287.8295.9
302.7309.1313.1
320.8329.1
87.286.7101.5
86.986.3
88.392.196.3
99.0101.4101.6
101.1101.1102.3
103.2103.7
482.3538.0560.7
553.3560.1
568.3573.1574.9
574.7570.5565.6
562.7561.0558.3
554.1549.6
107.4123.2103.4
126.7128.9
126.3127.5128.4
123.8116.9112.9
108.3107.294.8
91.494.9
92.4102.779.6
100.1105.7
100.397.293.4
91.889.685.3
80.078.979.9
74.370.7
99.8108.9116.8
110.7111.5
112.2112.8113.6
114.3115.0115.7
116.2116.8117.5
117.7
262.1267.0311.8
268.1274.2
280.0288.1289.6
290.9293.3303.7
308.9309.3317.1
317.0
258.4326.2349.7
343.6348.3
358.2348.8349.4
349.5354.3350.3
350.0351.3347.9
343.3
44.540.740.6
40.641.4
41.541.241.2
41.942.641.0
40.040.541.2
40.7
1. Net of money market mutual fund holdings of these items.2. Includes retail repurchase agreements. All IRA and Keogh accounts at commercial banks and thrift institutions are subtracted from small time deposits.3. Excludes IRA and Keogh accounts.4. Net of large denomination time deposits held by money market mutual funds and thrift institutions.
p-preliminary

NET CHANGES IN SYSTEM HOLDINGS OF SECURITIES 1Millions of dollars, not seasonally adjustedMarch 26, 1990
STRICTLY CONFIDENTIAL (FR)CLASS II-FOMC
Treasu bills Treasury coupons Federal Net change
Net purchases_ agencies outrightPeriod Net Redep- Net within Redenp- Net redemptions holdings
Spurchases tions (-) chan 1-year 1-5 5-10 over 10 tions (-) change (-) total Net RP 5
198419851986198719881989
1988--Q1Q2Q3Q4
1989--Q1Q2Q304
1989--JuneJulyAugustSeptemberOctoberNovemberDecember
1990--JanuaryFebruary
Feb. 7142128
Mar. 71421
Memo: LEVEL (bil. $)March 21
11,47918,09620,09912,9337,6351,466
319423
1,7955,098
-3,8422,496-6,4509,263
-571-5,516
-934
-1,4148,7941,883
-1,065-3,277
-3,384
108
488
101.4
Change from end-of-pariod to end-of-period.Outright transactions in market and with foreign accounts.Outright transactions in market and with foreign accounts,short-term notes acquired in exchange for maturing bills.maturity shifts and rollover* of maturing coupon issues,
1,
3,2,
1,
1,
826 1,938,349 2,185190 893
,358 9,779177 4,686327 946
-- -800,092 3,661
,084 1,824
-- -228172 1,361-- -163155 -24
7,7003,5001,0009,0292,200
12,730
2,200
2,2002,4003,2004,930
1,2002,400
800
1,4003,530
1,000400
400
andExcludes
236358236
2,4411,404
258
-1751,017
562
441293158
1,8581,398
284
56.6 12.6 26.2
3,4404,1851,476
17,3669,6651,315
-9756,737
3,903
-2482,104-172-369
-- 122.4
3,77914,59619,0993,9055,435
-11,264
-1,881423
1,7955,098
-6,04296
-9,6504,333
-1,771-7,916-1,734
-2,8145,2641,883
-2,065-3,677
-3,784
108
488
6,96418,61920,17820,99414,513
-10,391
-3,0117,0301,7178,776
-6,4772,075
-9,9213,934
-1,771-7,983-1,884
54-3,3685,4191,883
-2,065-3,677
-3,784
108
688
230.3
4. Reflects net change and redeptions (-) of Treasury and agency securities.5. Includes change in RPa (+), matched sale-purchase transactions (-), and matched
purchase sale tranaactions (+).6. The levels of agency issues were
as follows: I thin I I I1-year 1-5 5-10 ovr 101 total2.2 I 3.1 I 1.0 0.2 I 6.5
100
27.0
1,4503,001
10,033-11,033
1,557-1,683
-3,5145,2201,393
-1,541
-5,591924
-8933,877
10,002-5,152
6173,641
463-453
3,867-8,4354,417
-2,1392,844
5023,210
4,201-5,3533,112
-2.0
4
I