Embed Size (px)
Citation preview
Prefatory Note The attached document represents the most complete and accurate version available based on original copies culled from the files of the FOMC Secretariat at the Board of Governors of the Federal Reserve System. This electronic document was created through a comprehensive digitization process which included identifying the best-preserved paper copies, scanning those copies,1
and then making the scanned versions text-searchable.2
Though a stringent quality assurance process was employed, some imperfections may remain. Please note that some material may have been redacted from this document if that material was received on a confidential basis. Redacted material is indicated by occasional gaps in the text or by gray boxes around non-text content. All redacted passages are exempt from disclosure under applicable provisions of the Freedom of Information Act. 1 In some cases, original copies needed to be photocopied before being scanned into electronic format. All scanned images were deskewed (to remove the effects of printer- and scanner-introduced tilting) and lightly cleaned (to remove dark spots caused by staple holes, hole punches, and other blemishes caused after initial printing). 2 A two-step process was used. An advanced optical character recognition computer program (OCR) first created electronic text from the document image. Where the OCR results were inconclusive, staff checked and corrected the text as necessary. Please note that the numbers and text in charts and tables were not reliably recognized by the OCR process and were not checked or corrected by staff.
Content last modified 6/05/2009.
April 16, 1976Strictly Confidential (FR) Class I FOMC
MONETARY AGGREGATES ANDMONEY MARKET CONDITIONS
Prepared for the Federal Open Market Committee
By the staff Board of Governors of the Federal Reserve System
STRICTLY CONFIDENTIAL (FR) April 16, 1976CLASS I - FOMC
MONETARY AGGREGATES ANDMONEY MARKET CONDITIONS
Recent developments
(1) M1 increased at about a 6½ per cent annual rate during March.
With incoming data for early April showing further strength, growth for
March and April combined now appears to be running at about a 7¼ per cent
annual rate, as compared with the 6 per cent mid-point of the Committee's
range. Growth in M2 over the March-April period is now projected at nearly
a 10 per cent annual rate, also above the mid-point of the Committee's
range. Inflows to savings accounts at banks, although below the extra-
ordinary February pace, have remained quite strong. Deposit growth at
nonbank thrift institutions also has been well maintained, with March
expansion at S&L's and savings banks combined running close to a 15 per
cent annual rate.
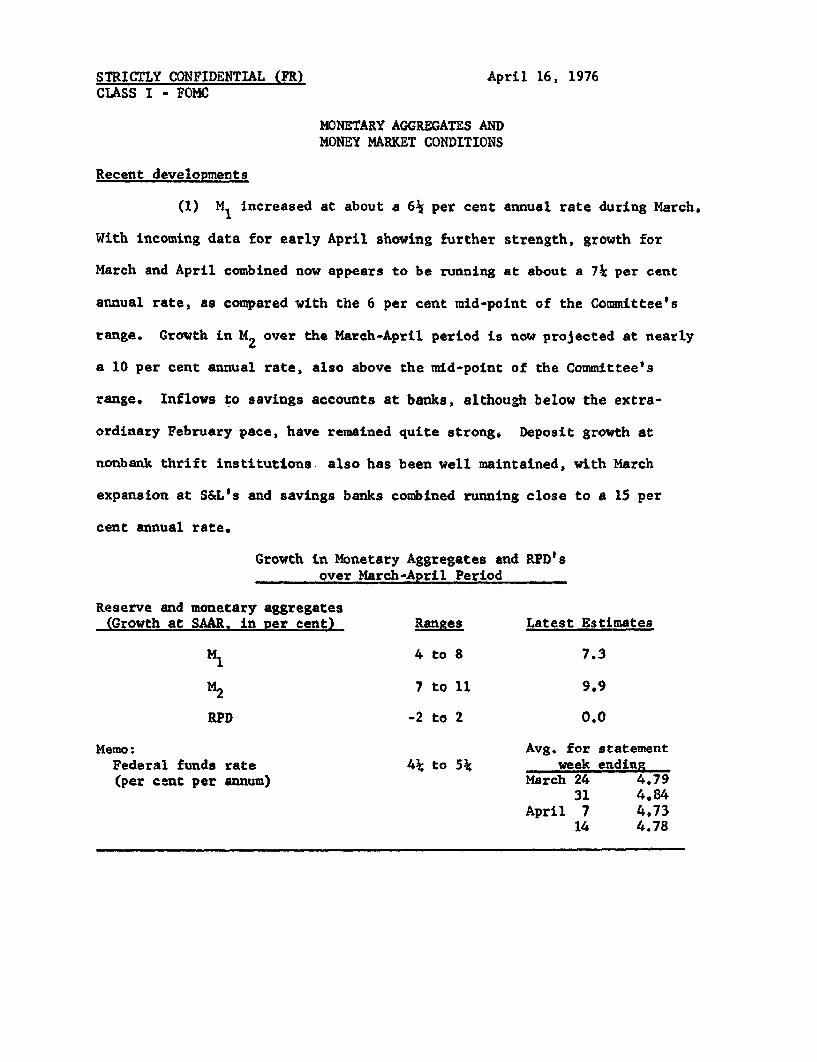
Growth in Monetary Aggregates and RPD'sover March-April Period
Reserve and monetary aggregates(Growth at SAAR, in per cent) Ranges Latest Estimates
M1 4 to 8 7.3
M2 7 to 11 9.9
RPD -2 to 2 0.0
Memo: Avg. for statementFederal funds rate 4¼ to 5¼ week ending(per cent per annum) March 24 4.79
31 4.84April 7 4.73
14 4.78
(2) During the intermeeting period, estimates of growth in M1
and M2 for March-April fluctuated around the mid-point of the FOMC's ranges,
and the Desk continued to aim for reserve availability consistent with
Federal funds trading around 4¾ per cent. In the four statement weeks since
the March meeting, excess reserves and member bank borrowing have averaged
$210 million and $50 million, respectively, both somewhat below their recent
levels. Nonborrowed reserves over the March-April period have shown little
net change, as reserves to support M1 and M2 continued to be released by
declines in CD's; in addition, more of the money growth than expected took
the form of currency, which requires no reserves.
(3) With the funds rate remaining stable, short-term interest
rates have dropped back to levels reached in mid-January, when the funds
rate first moved down into the 4¾ per cent range. These declines, together
with the relatively favorable performance of the wholesale and consumer
price indexes, have contributed to a further strengthening of investor
demands for longer-term investments. Since the last FOMC meeting, bond
yields have declined another 15 to 40 basis points despite the heavy recent
volume of new issues. In mortgage markets, rates have declined 5-10 basis
points further.
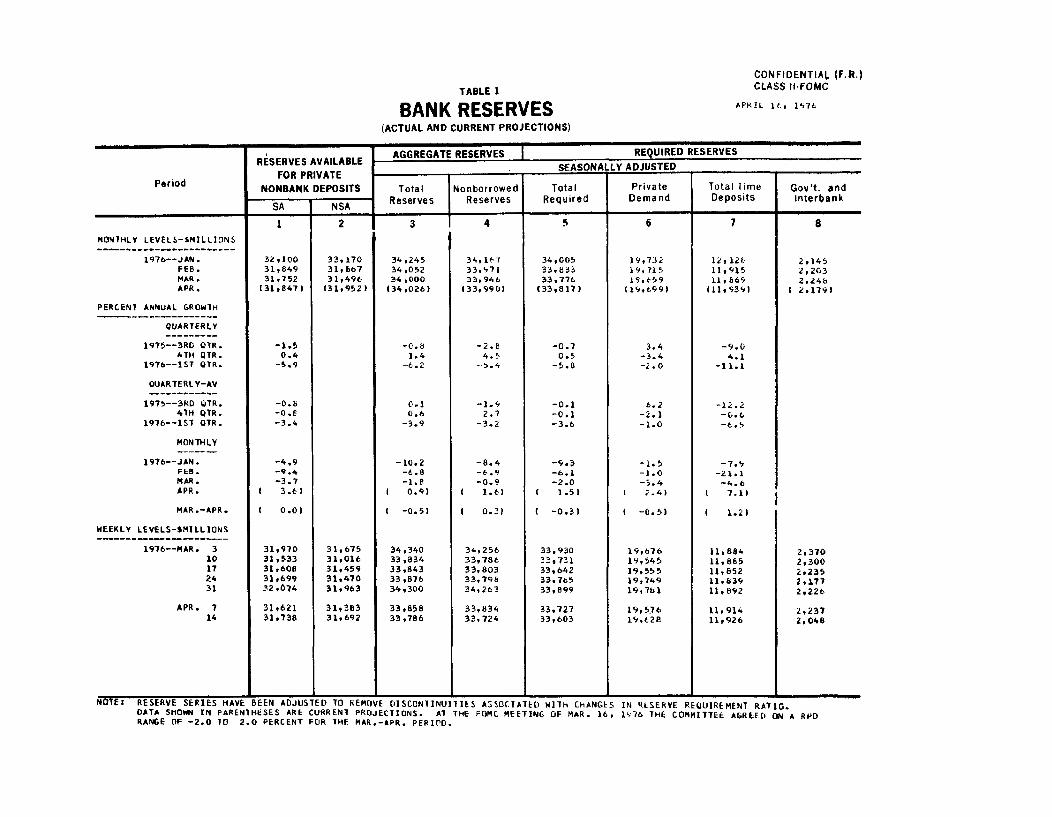
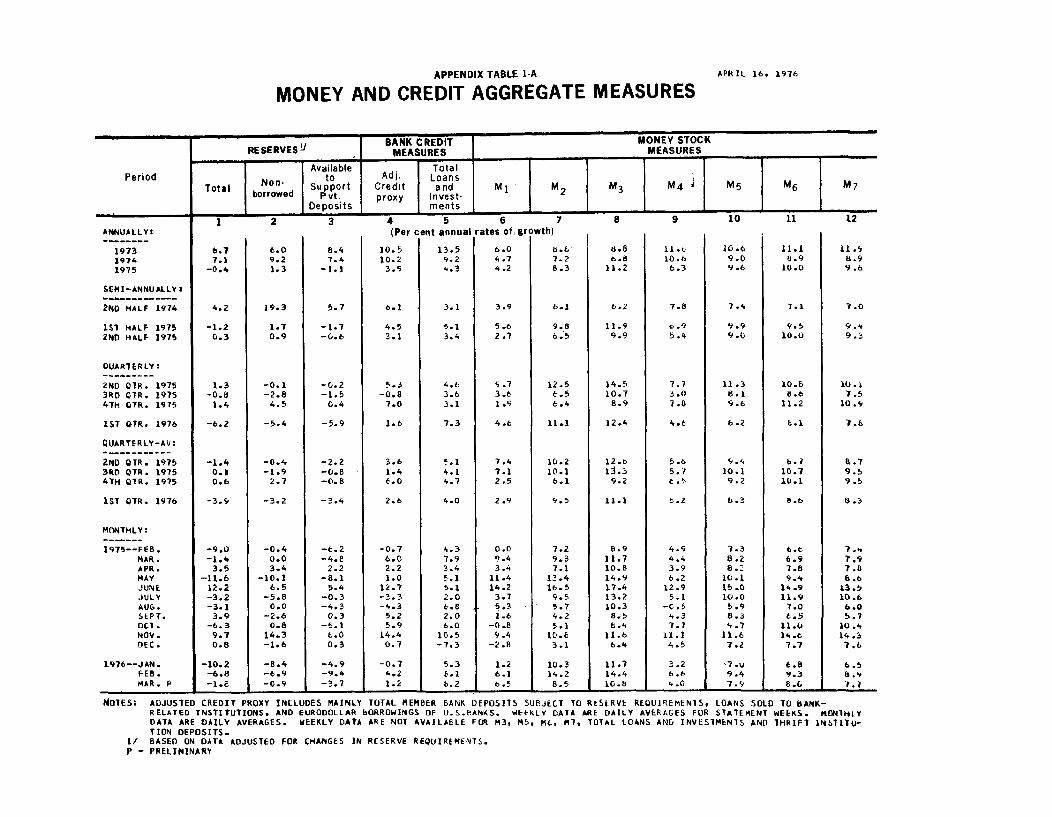
(4) The table on the following page shows (in percentage annual
rates of change) selected monetary and financial flows over various time
periods.
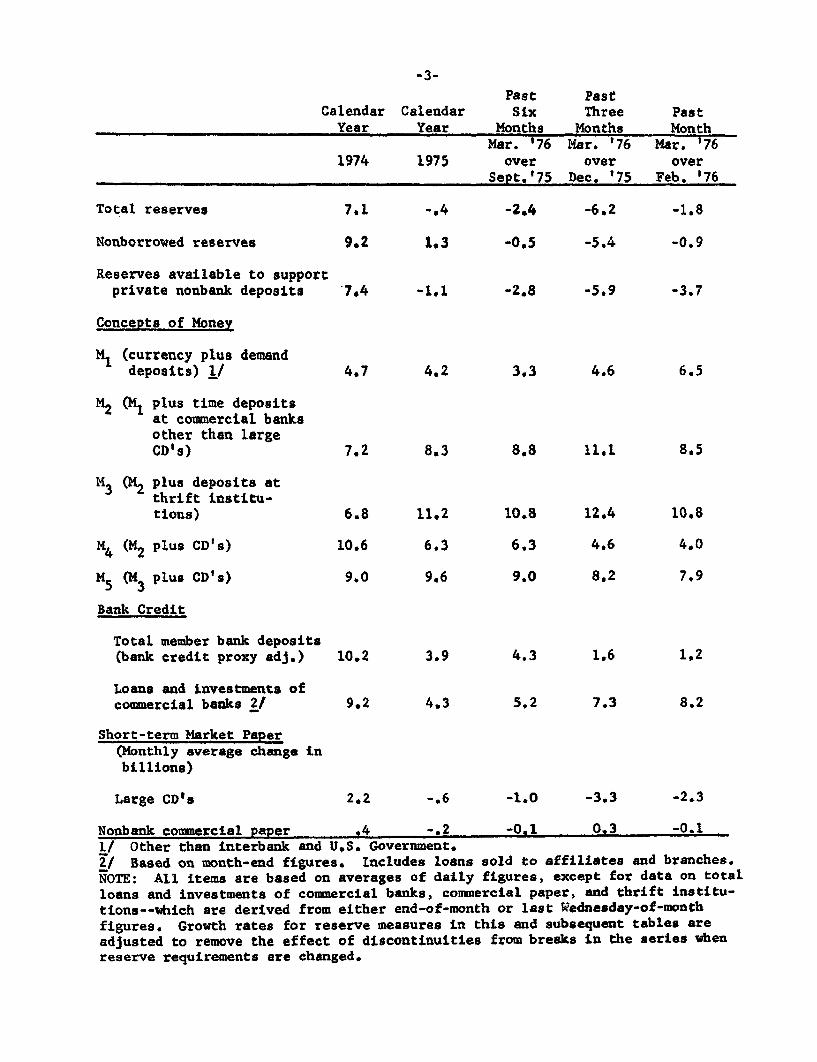
Past PastCalendar Calendar Six Three Past
Year Year Months Months MonthMar. '76 Mar. '76 Mar. '76
1974 1975 over over over
Sept,'75 Dec. '75 Feb. '76
Total reserves 7.1 -,4 -2.4 -6.2 -1,8
Nonborrowed reserves 9.2 1.3 -0.5 -5.4 -0.9
Reserves available to supportprivate nonbank deposits 7.4 -1.1 -2.8 -5.9 -3.7
Concepts of Money
M1 (currency plus demanddeposits) 1/ 4.7 4.2 3.3 4.6 6.5
M2 (M1 plus time depositsat commercial banksother than largeCD's) 7.2 8,3 8,8 11.1 8.5
M3 (M2 plus deposits atthrift institu-tions) 6.8 11.2 10.8 12.4 10.8
M4 (M2 plus CD's) 10.6 6.3 6.3 4.6 4.0
M5 (M3 plus CD's) 9.0 9.6 9.0 8.2 7.9
Bank Credit
Total member bank deposits(bank credit proxy adj.) 10.2 3.9 4.3 1.6 1,2
Loans and investments ofcommercial banks 21 9.2 4.3 5,2 7.3 8.2
Short-term Market Paper(Monthly average change inbillions)
Large CD's 2.2 -.6 -1.0 -3.3 -2.3
Nonbank commercial paper .4 -.2 -0.1 0.3 -0.1
I/ Other than interbank and U.S. Government.
if Based on month-end figures. Includes loans sold to affiliates and branches.
NOTE: All items are based on averages of daily figures, except for data on total
loans and investments of commercial banks, commercial paper, and thrift institu-
tions--which are derived from either end-of-month or last Wednesday-of-month
figures. Growth rates for reserve measures in this and subsequent tables are
adjusted to remove the effect of discontinuities from breaks in the series when
reserve requirements are changed.

Prospective developments
(5) Alternative longer-run growth ranges for the monetary
aggregates are shown below for Committee consideration. They pertain to the
one year period from QI '76 to QI '77. The ranges shown under alternative B
are the same as those adopted in January for the QIV '75-QIV '76 period.
Alt. A Alt. B Alt. C
M1 5½-8½ 4½-7½ 3½-6½
M2 9-12 7¾-10¾ 6-9
M3 10-13 9-12 7½-10½
Proxy 7-10 6-9 5-8
(6) In considering these alternative longer-run targets, the
Committee may be interested in their relationship to the QIV '76 levels for
the monetary aggregates that were implied by the mid-points of the ranges
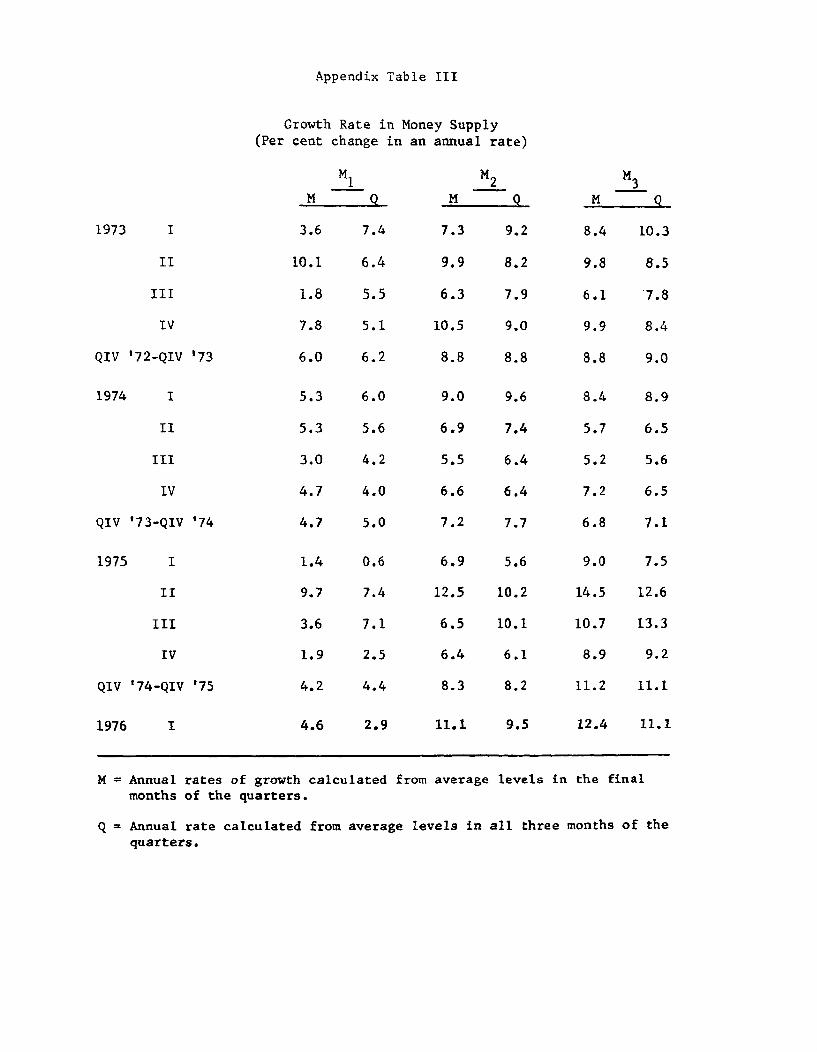
adopted in January. From the fourth quarter of '75 to first quarter of '76,
M2 and M3 expanded at annual rates very near the mid-points of the ranges
adopted previously (and shown above under alternative B); thus, continuation
of growth near these rates would be associated with QIV '76 levels close to
those implied by the earlier targets. However, M1 growth from the fourth
to first quarter--at a 2.9 per cent annual rate--was well below both the
lower limit of the longer-run range and the 6 per cent mid-point of
that range. To achieve the level in QIV '76 implied by the mid-point of the
earlier range, M1 would have to grow at almost a 7 per cent annual rate over
the last three quarters of this year. Assuming M1 growth returns to a 6 per
cent annual rate in the first quarter of 1977, this would imply a growth rate
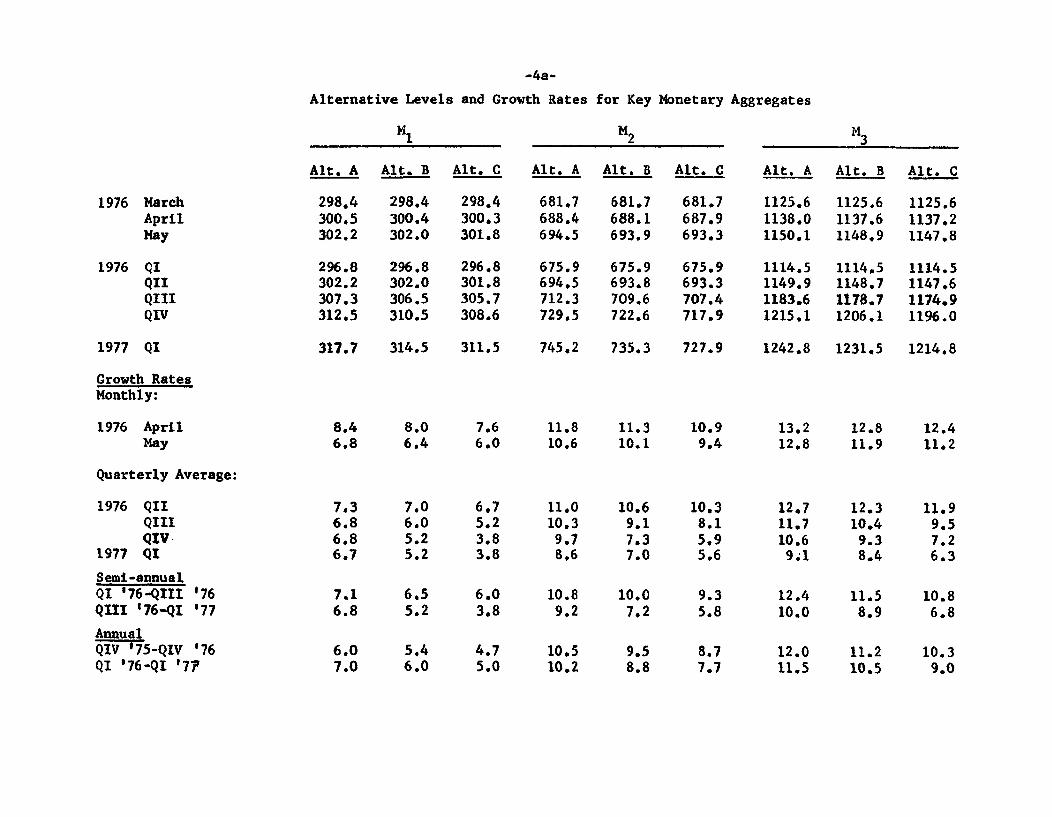
-4a-
Alternative Levels and Growth Rates for Key Monetary Aggregates
Alt. A Alt. B Alt. C Alt. A Alt. B Alt. C Alt. A Alt. B Alt. C
1976 MarchAprilMay
1976 QIQIIQIIIQIV
317.7 314.5 311.5 745.2 735.3 727.9 1242.8 1231.5 1214.8
Growth RatesMonthly:
1976 AprilMay
Quarterly Average:
1976 QIIQIIIQIV
1977 QI
Semi-annualQI '76-QIII '76QIII '76-QI '77
AnnualQIV '75-QIV '76QI '76-QI '77
298.4300.5302.2
296.8302.2307.3312.5
298.4300.4302.0
296.8302.0306.5310.5
298.4300.3301.8
296.8301.8305.7308.6
1977 QI
681.7688.4694.5
675.9694.5712.3729.5
681.7688.1693.9
675.9693.8709.6722.6
681.7687.9693.3
675.9693.3707.4717.9
1125.61138.01150.1
1114.51149.91183.61215,1
1125.61137.61148.9
1114.51148.71178.71206.1
1125.61137.21147,8
1114.51147.61174.91196.0
8.46.8
8.06.4
7.06.05.25.2
6.55.2
5.46.0
7.66.0
6.75.23.83.8
6.03.8
4.75.0
7.36.86.86.7
7.16.8
6.07.0
11.810.6
11.010.39.78,6
10.89.2
10.510.2
11.310.1
10.69.17.37.0
10.07,2
9.58.8
10.99.4
10.38.15.95.6
9.35.8
8.77.7
13.212.8
12.711.710.69.1
12.410.0
12.011.5
12.811.9
12.310.49.38.4
11.58.9
11.210.5
12.411,2
11.99.57.26.3
10.86.8
10.39.0
__
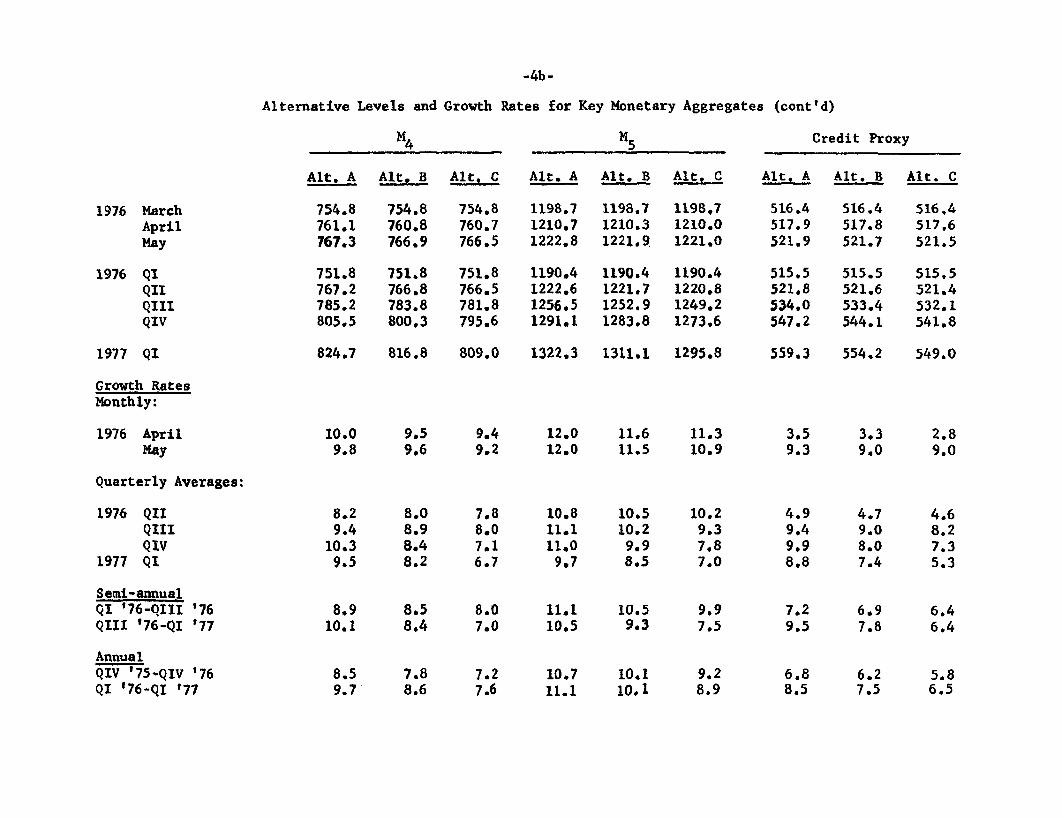
-4b-
Alternative Levels and Growth Rates for Key Monetary Aggregates (cont'd)
Credit Proxy
Alt. A Alt. B Alt. C Alt. A Alt. B Alt. C Alt, A Alt. B Alt. C
1976 MarchAprilMay
1976 QIQIIQIIIQIV
824.7 816,8 809.0 1322.3 1311.1 1295.81977 QI
Growth RatesMonthly:
1976 AprilMay
10.09.8
9.49.2
12.012.0
11.611.5
559.3 554.2 549.0
11.310.9
3.39.0
2.89.0
Quarterly Averages:
1976 QIIQIIIQIV
1977 QI
Semi-annualQI '76-QIII '76QIII '76-QI '77
AnnualQIV '75-QIV '76QI '76-QI '77
754.8761.1767.3
751.8767.2785.2805.5
754.8760.8766.9
751.8766.8783.8800,3
754.8760.7766.5
751.8766.5781.8795.6
1198.71210.71222.8
1190.41222.61256.51291.1
1198.71210.31221.9
1190.41221.71252.91283.8
1198,71210.01221.0
1190.41220,81249.21273.6
516.4517.9521.9
515.5521.8534.0547.2
516.4517.8521.7
515.5521.6533.4544.1
516,4517.6521.5
515.5521.4532.1541.8
8.29.4
10.39.5
8.910.1
8.59.7
8.08.98.48.2
8.58.4
7.88.6
7.88.07.16.7
8.07.0
7.27.6
10.811.111.09.7
11.110.5
10.711.1
10.510.2
9.98.5
10.59.3
10.110.1
10.29.37.87.0
9.97.5
9.28.9
4.99.49.98.8
7.29.5
6.88.5
4.79.08.07.4
6.97.8
6.27.5
4.68.27.35.3
6.46.4
5.86.5
I

for the new one-year target period QI '76-QI '77 of about 6¾ per cent--well
within the ranges of alternatives A and B and a shade above the upper limit
of alternative C.
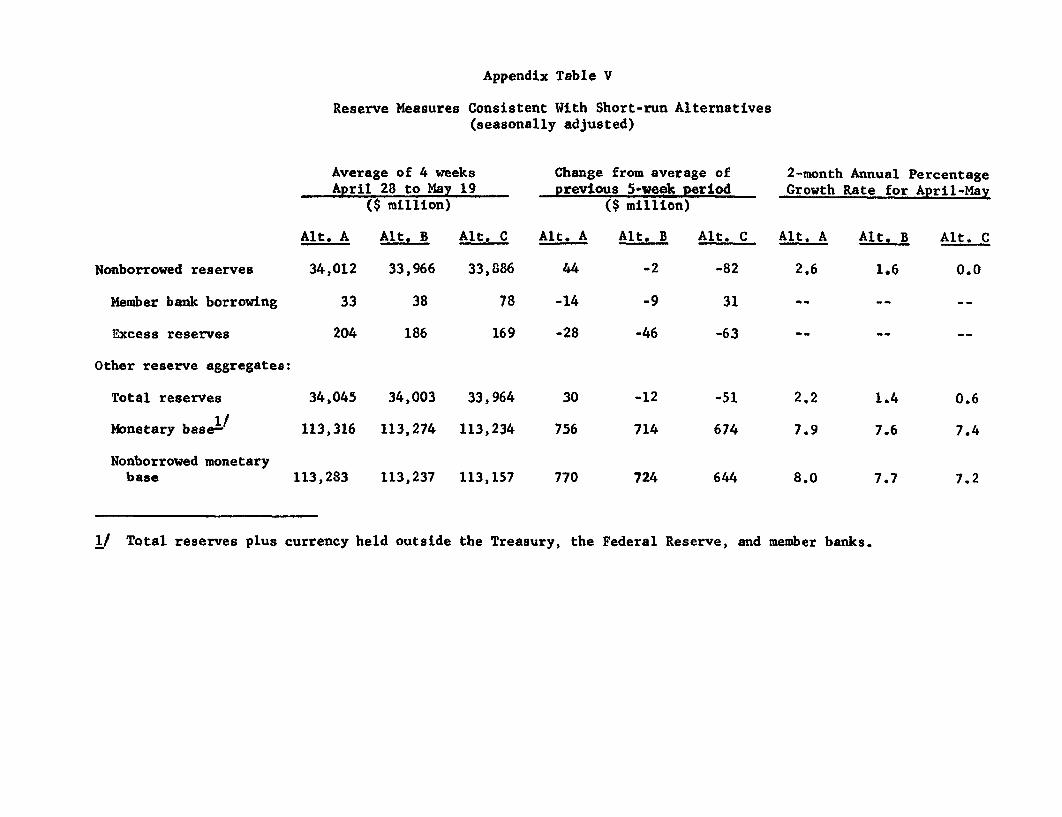
(7) Short-run operating strategies roughly corresponding to the
longer-run ranges are suggested below:
Alt. A Alt. B Alt. C
Ranges for April-May 1/
M1 5½-9½ 5-9 4½-8½
M2 9½-13½ 8½-12½ 8-12
Federal funds rate 3¾-4¾ 4¼-¼ 4¾-5¾(intermeeting range)
(8) The Federal funds rate range of alternative B is centered
on the recently prevailing 4¾ per cent level. Given the bulge in M1 in
early April, we expect that such a funds rate would be accompanied by M1
growth in a 5-9 per cent, annual rate, range over the April-May period.
With expansion in time and savings deposits other than large CD's remaining
relatively strong, M2 growth over the same period is likely to be in an
8½-12½ per cent annual rate range.
(9) M1 growth has been generally strengthening in recent months.
Part of the expansion in recent weeks may be attributable to declining
Treasury deposits, but on balance it seems likely that a somewhat more
typical relationship between M1 and GNP is being re-established. We would
expect M1 to grow at about a 7 per cent annual rate from the first to second
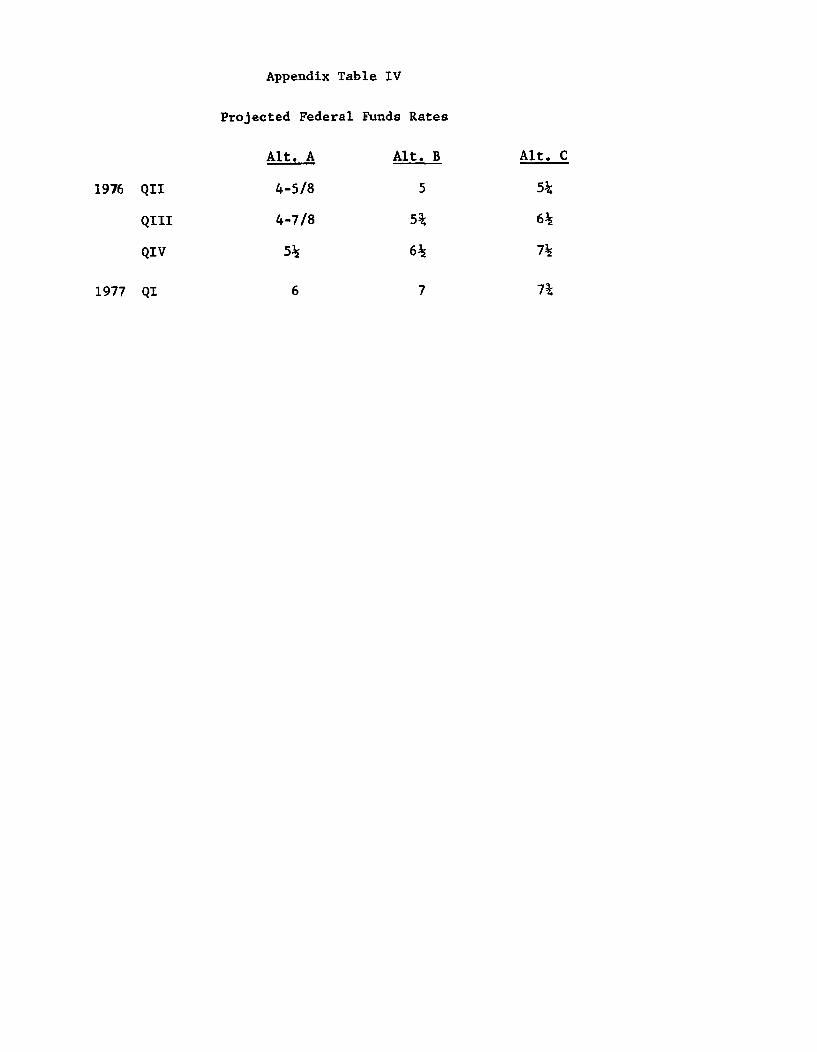
quarter. The staff expects that interest rates will soon have to begin
1/ Reserve aggregates thought to be consistent with these ranges areshown in appendix table V.
rising if growth over the one-year QI '76-QI '77 period is to be constrained
to 6 per cent--the mid-point of the longer-run growth range of alternative B.
Our projected Federal funds rate patterns through the first quarter of 1977
for all alternatives are shown in appendix table IV. Under alternative B,
the funds rate is expected to reach the 7 per cent level by early next
year.
(10) If the funds rate stays around the mid-point of its
alternative B range over the next four weeks, short- and longer-term interest
rates are unlikely to change significantly. On April 28, the Treasury will
be announcing its mid-May refunding of some $4 billion of publicly-held
maturing debt. The Treasury may also raise about $1 -2 billion of new cash
at the same time. It is possible that a longer-term bond as well as a note
in the 7-10 year maturity area may be included in the offering. While the
volume of corporate and municipal bond offerings appears to be dropping
off from its exceptional March pace, the forward calendar remains high,
and substantial longer-term offerings by the Treasury could exert some
upward pressure on bond yields.
(11) Alternative C contemplates a gradual tightening of the
money market over the next four weeks to the mid-point of a 4¾-5¾ per cent
funds rate range in the process of moving toward lower longer-run growth
rates for the aggregates. In the short-run, however, the impact on M1
and M2 probably would be no more than minor because member banks would
respond to the reduced availability of nonborrowed reserves contemplated
under this alternative by increasing their borrowing. It is possible,
though, that a substantial upward adjustment in the Treasury bill and other
short-term rates would occur in response to signs of a sustained upward
movement in the funds rate. Under these conditions, if short-rates moved
well above the 5 per cent passbook ceiling rate, there could be sizable
outflows of interest-sensitive funds from savings accounts, particularly those
held by businesses and State and local governments. This would tend to drop
the rate of growth in M2 toward the bottom of the indicated April-May range.
(12) Under alternative C, we expect that interest rates would
have to rise considerably further to achieve a 5 per cent M1 growth from
QI '76 to QI '77. By early 1977, the funds rate might be around 7¾ per
cent.
(13) Under alternative A, the mid-point of the longer-run growth
target for M1 is 7 per cent. In order to achieve this more rapid growth,
money market conditions would probably have to ease somewhat over the
next few weeks, and the funds rate would probably remain below 5 per
cent until well into the summer months. Thereafter, however, interest
rates would need to rise, with the Federal funds rate probably reaching
the 6 per cent area in early 1977. Given the expected pattern of market
interest rates, interest-bearing deposits would likely remain quite strong
into the third quarter, but inflows would begin to slow later on as rates
on market instruments became more attractive.
(14) Over the period immediately ahead, internal funds available
to the business sector are expected to remain quite ample relative to
-8-
requirements generated by inventory and capital investment, so that little
pick-up in business short-term credit demands is anticipated. As expenditures
continue to rise, though, businesses later this year are expected to turn
increasingly to commercial banks and the paper market for funds. Under
alternatives A and B, banks are likely to have sufficient funds available
without reliance on significant increases in CD's. But under alternative
C limited fund flows by late this year could induce banks to rely
appreciably more on sales of CD's to satisfy credit demands.

Proposed directive
(15) Presented below are four alternative formulations for the
operational paragraph of the directive. The first three are couched in terms
of desired growth in monetary aggregates over the months ahead and are intended
to correspond to the similarly lettered policy alternatives discussed in the
preceding section. The fourth alternative is proposed in the event that the
Committee wishes to formulate its instructions in terms of money market con-
ditions and wishes to maintain the conditions now prevailing. Since the
last meeting, exchange market conditions have tended to become stable,
although the pound and the lira remain subject to particular uncer-
tainties. Therefore, in all alternatives, we propose deleting the
specific reference to "the sensitive state of foreign exchange markets"
that was inserted at the last meeting, and restoring the previously long-
standing reference to international financial markets.
Alternative "Monetary Aggregates" Proposals
Alternative A
To implement this policy, while taking account of developments
in domestic AND INTERNATIONAL financial markets, [DEL: and the sensitive
state of foreign exchange markets,] the Committee seeks to achieve
bank reserve and money market conditions consistent with [DEL: moderate]
SUBSTANTIAL growth in monetary aggregates over the period ahead.
-10-
Alternative B
To implement this policy, while taking account of developments
in domestic AND INTERNATIONAL financial markets, [DEL; and the sensitive
state of foreign exchange markets,] the Committee seeks to achieve
bank reserve and money market conditions consistent with moderate
growth in monetary aggregates over the period ahead.
Alternative C
To implement this policy, while taking account of developments
in domestic AND INTERNATIONAL financial markets, [DEL; and the sensitve
state of foreign exchange markets,] the Committee seeks to achieve
bank reserve and money market conditions consistent with [DEL: moderate]
MODEST growth in monetary aggregates over the period ahead.
'Money Market" Proposal
To implement this policy, while taking account of developments
in domestic AND INTERNATIONAL financial markets, [DEL: and the sensitive
state of foreign exchange markets,] the Committee seeks to [DEL: achieve]
MAINTAIN PREVAILING bank reserve and money market conditions [DEL: consistent
with moderate growth in monetary aggregates] over the period ahead,
PROVIDED THAT MONETARY AGGREGATES APPEAR TO BE GROWING AT ABOUT THE
RATES CURRENTLY EXPECTED.
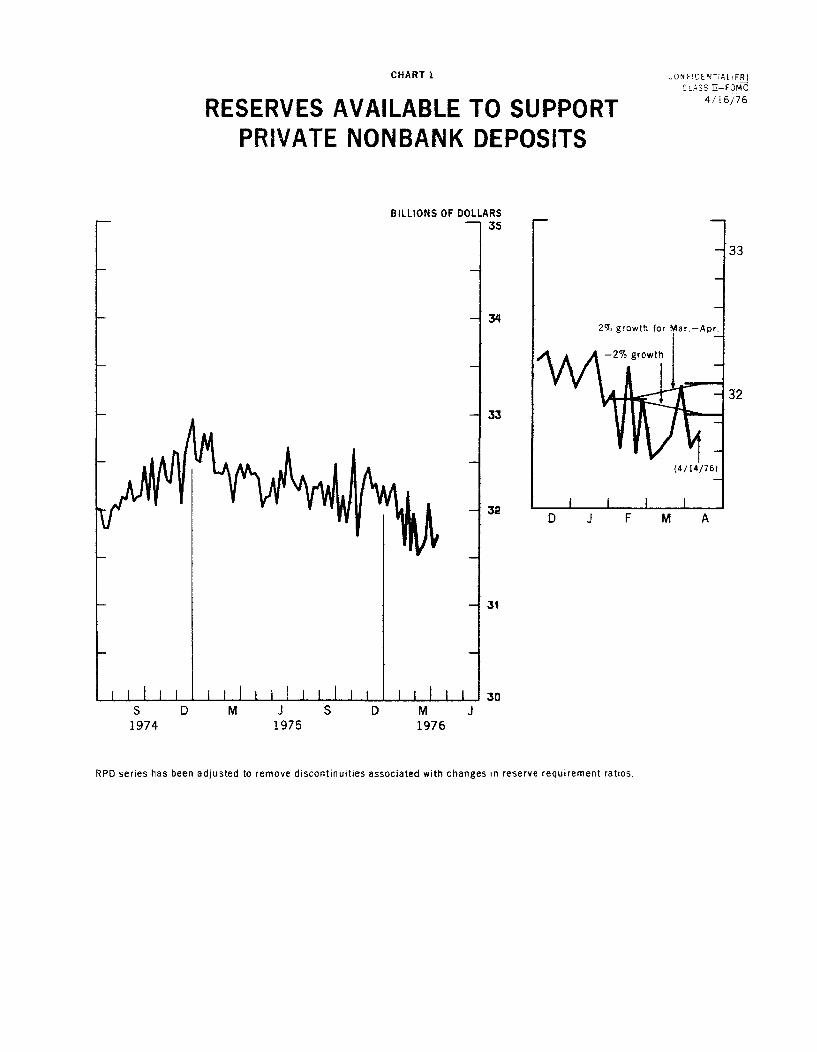
CHART 1
RESERVES AVAILABLE TO SUPPORTPRIVATE NONBANK DEPOSITS
CONFIDENTIAL (FR)CLASS II-FOMC
4/16/76
BILLIONS OF DOLLARS1 35
D M J S D M J1975
D J F M A
1976
RPD series has been adjusted to remove discontinuities associated with changes in reserve requirement ratios.
S1974

CHART 2
MONETARY AGGREGATESCONFIDENTIAL (FR)
CLASS II-FOMC
4/16/76
NARROW MONEY SUPPLY M1 BILLIONS OF DOLLARS320
300
280
1974 1975 D J1975
F M1976
305
300
295
290

CHART 3 4/16/76
MONETARY AGGREGATESADJUSTED CREDIT PROXY BILLIONS OF DOLLARS
-540
-520
-500
-480
I ! i I I I I l
RESERVES BILLIONS OF DOLLARS39
- 37
-TOTAL - 35
NONBORROWED33
31
1974 1975 1976
Total and nonborrowed reserve series have been adjusted to remove discontinuities associated with changes in reserve requirement ratios.
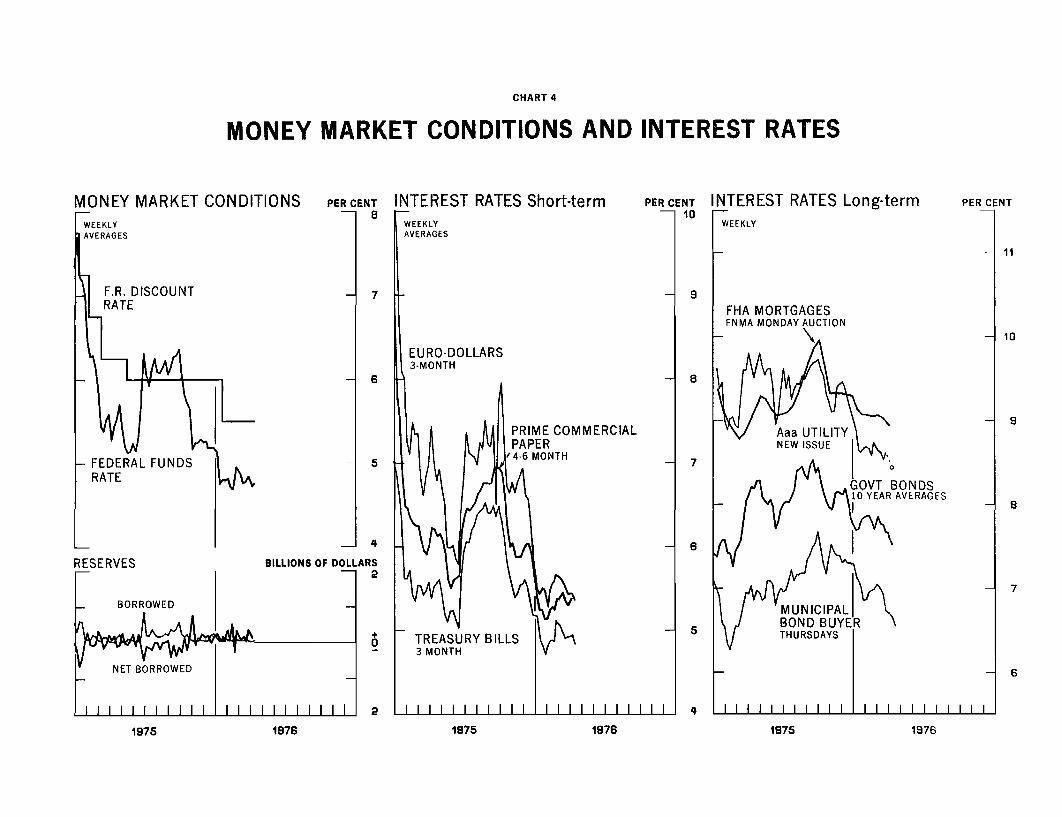
CHART 4
MONEY MARKET CO
F.R. DISCOUNTRATE
RATE
MONEY MARKET CONDITIONS AND INTEREST RATES
NDITIONS PER CENT INTEREST RATES Short-term PERCENT INTEREST RATES10
WEEKLY WEEKLYAVERAGES
- 7 - 9
- 6
1 4
1975 19761975 1976 1975 1976
CONFIDENTIAL (F.R.)
TABLE 1 CLASS II-FOMC
BANK RESERVES APRIL 16, 1976
(ACTUAL AND CURRENT PROJECTIONS)
RSERVES AVAILABLE AGGREGATE RESERVES REQUIRED RESERVESRESERVES AVAILABLE SEASONALLYADJUSTEDdFOR PRIVATE ASEASONALLY ADJUSTED
FOR PRIVATEPeriod NONBANK DEPOSITS Total Nonborrowed Total Private Total Time Gov't. and
SA NSA Reserves Reserves Required Demand Deposits InterbankSA NSA
1 2 3 4 5 6 7 8MONTHLY LEVELS-$MILLIONS
1976--JAN. 32,100 33.170 34,245 34, 1'7 34,005 19,732 12,126 2,145FEB. 31,849 31,667 34,052 33,971 33,833 19,715 11,915 2,203MAR. 31,752 31,496 34,000 33,946 33,776 19,t59 11,869 2,24bAPR. 131,847) (31,952) (34,026) (33,990) (33,817) (19t,99) (S11,939 ( 2.179)
PERCENT ANNUAL GROWTH
QUARTERLY
1975--3RD OTR. -1.5 -0.8 -2.8 -0.7 3.4 -9.04TH QTR. 0.4 1.4 4.5 0.5 -3.4 4.1
1976--IST QTR. -5.9 -6.2 -5.4 -5.8 -2.0 -
QUARTERLY-AV
1975--3RD OTR. -0.8 0.1 -1.9 -0.1 6.2 -12.24TH QTR. -0.8 0.6 2.7 -0.1 -2.1 -0.6
1976--1ST QTR. -3.4 -3.9 -3.2 -3.6 -1.0 -t.4
MONTHLY
1976--JAN. -4.9 -10.2 -8.4 -9.3 -1.5 -7.'FEB. -9.4 -6.8 -6.9 -6.1 -1.0 -21.1MAR. -3.7 -1.8 -0.9 -2.0 -5.4 -4.6APR. ( 3.6) ( 0.9) ( 1.6) ( 1.5) 1 2.4) ( 7.1)
MAR.-APR. ( 0.0) ( -0.5) ( 0.3) ( -0.3) 1 -0.5) 1 1.2)
WEEKLY LEVELS-SMILLIONS
1976--MAR. 3 31,970 31,675 34,340 34,256 33,930 19,676 11,884 2,37010 31,533 31,016 33 834 33,786 33,731 19,545 11,885 2,30017 31,608 31,459 33,843 33,803 33,642 19,555 11,852 2,23524 31.699 31,470 33,876 337.98 33,765 19,749 11,839 2,17731 32,074 31,963 34,300 34,263 33,899 19,761 11,892 2,226
APR. 7 31t621 31,383 33t858 33,834 33,727 19,576 11,914 2,23714 31,738 31,692 33,786 33,724 33,603 19,628 11,926 2,048
NOTE: RESERVE SERIES HAVE BEEN ADJUSTED TO REMOVE DISCONTINUITIES ASSOCIATED WITH CHANGES IN RESERVE REQUIREMENT RATIO.DATA SHOWN IN PARENTHESES ARE CURRENT PROJECTIONS. AT THE FOMC MEETING OF MAR. 16, 1l76 THE COMMITTEE AGREED ON A RPDRANGE OF -2.0 TO 2.0 PERCENT FOR THE MAR.-APR. PERIOD.
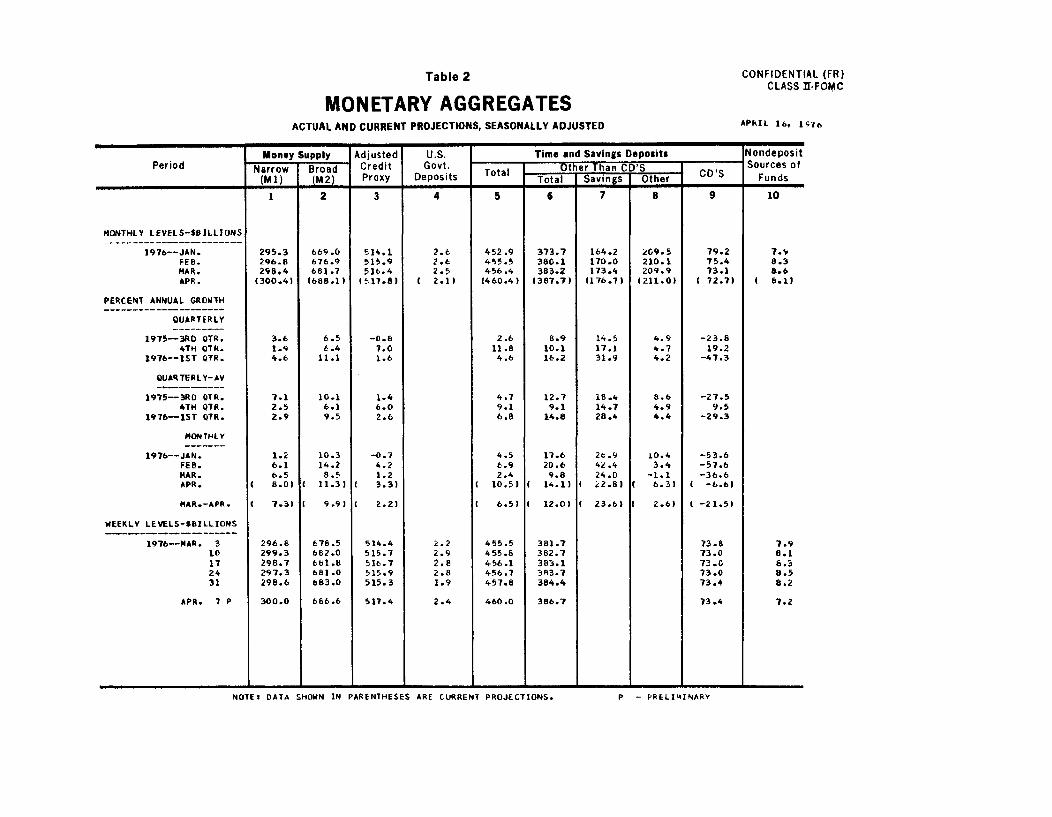
Table 2 CONFIDENTIAL (FR)CLASS II-FOMC
MONETARY AGGREGATESACTUAL AND CURRENT PROJECTIONS, SEASONALLY ADJUSTED APRIL 16, 1976
Money Supply Adjusted U.S. Time and Savings Deposits NondepositPeriod Narrow Broad Credit Govt Total Other Than CD'S S Sources of
(M1) (M2) Proxy Deposits Total Total Savings Other Funds
1 2 3 4 5 6 7 8 9 10
MONTHLY LEVELS-SBILLIONS
1976--JAN. 295.3 669.0 514.1 2.6 452.9 373.7 164.2 209.5 79.2 7.9FEB. 296.8 676.9 515.9 2.6 455.5 380.1 170.0 210.1 75.4 8.3MAR. 298.4 681.7 516.4 2.5 456.4 383.2 173.4 209.9 73.1 8.6APR. (300.41 (688.11 (517.8) ( 2.1) (460.4) (387.7) (176.7) (211.0) ( 72.7) ( 8.1)
PERCENT ANNUAL GROWTH
QUARTERLY
1975--3RD QTR. 3.6 6.5 -0.8 2.6 8.9 14.5 4.9 -23.84TH 0TR. 1.9 6.4 7.0 11.8 10.1 17.1 4.7 19.2
1976--15T OTR. 4.6 11.1 1.6 4.6 16.2 31.9 4.2 -47.3
QUARTERLY-AV
1975--3RD QTR. 7.1 10.1 1.4 4.7 12.7 18.4 8.6 -27.54TH QTR. 2.5 6.1 6.0 9.1 9.1 14.7 4.9 9.5
1976-1ST QTR. 2.9 9.5 2.6 6.8 14.8 28.4 4.4 -29.3
MONTHLY
1976--JAN. 1.2 10.3 -0.7 4.5 17.6 26.9 10.4 -53.6FEB. 6.1 14.2 4.2 6.9 20.6 42.4 3.4 -57.6MAR. 6.5 8.5 1.2 2.4 9.8 24.0 -1.1 -36.6APR. ( 8.0) ( 11.3) ( 3.3) ( 10.5) ( 14.1) 2.8) ( 6.3) -6.6)
MAR.-APR. ( 7.3) I 9.9) ( 2.2) 1 6.5) 1 12.0) ( 23.6) ( 2.6) -21.5)
WEEKLY LEVELS-SBILLIONS
1976--MAR. 3 296.8 678.5 514.4 2.2 455.5 381.7 73.8 7.910 299.3 682.0 515.7 2.9 455.8 382.7 73.0 8.117 298.7 681.8 516.7 2.8 456.1 383.1 73.0 6.324 297.3 681.0 515.9 2.8 456.7 383.7 73.0 8.531 298.6 683.0 515.3 1.9 457.8 384.4 73.4 8.2
APR. 7 P 300.0 686.6 517.4 2.4 460.0 386.7 73.4 7.2
- - I I h
NOIEI DATA SHOWN IN PARENTHESES ARE CURRENT PROJECTIONS. P - PRELIMINARY
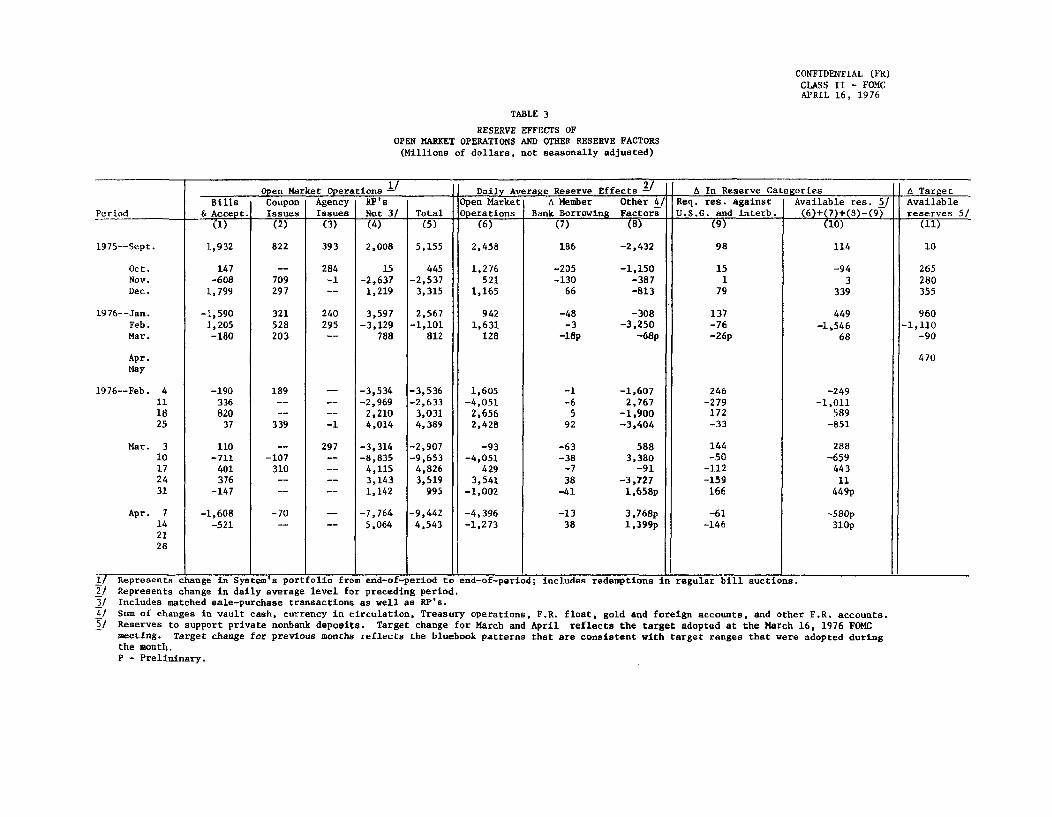
CONFIDENTIAL (FR)
CLASS II - FOMCAPRIL 16, 1976
TABLE 3
RESERVE EFFECTS OFOPEN MARKET OPERATIONS AND OTHER RESERVE FACTORS(Millions of dollars, not seasonally adjusted)
Open Market Operations / Daily Average Reserve Effects 2- A In Reserve Categories A Target
Bills Coupon Agency RP's Open Market A Member Other 4/ Req. res. against Available res. 5/ Available
Period & Accept. Issues Issues Net 3/ Total Operations Bank Borrowing factors U.S.G. and interb. (6)+(7)+(8)-(9) reserves 5/
(1) (2) (3) (4) (5) (6) (7) (8) (9) (10) (11)
1975--Sept. 1,932 822 393 2,008 5,155 2,458 186 -2,432 98 114 10
Oct. 147 -- 284 15 445 1,276 -205 -1,150 15 -94 265Nov. -608 709 -1 -2,637 -2,537 521 -130 -387 1 3 280Dec. 1,799 297 -- 1,219 3,315 1,165 66 -813 79 339 355
1976--Jan. -1,590 321 240 3,597 2,567 942 -48 -308 137 449 960Feb. 1,205 528 295 -3,129 -1,101 1,631 -3 -3,250 -76 -1,546 -1,110
Apr. 470
May
1976--Feb. 4 -190 189 -- -3,534 -3,536 1,605 -1 -1,607 246 -24911 336 - -- -2,969 -2,633 -4,051 -6 2,767 -279 -1,01118 820 - -- 2,210 3,031 2,656 5 -1,900 172 589
25 37 339 -1 4,014 4,389 2,428 92 -3,404 -33 -851
Mar. 3 110 -- 297 -3,314 -2,907 -93 -63 588 144 28810 -711 -107 -- -8,835 -9,653 -4,051 -38 3,380 -50 -65917 401 310 -- 4,115 4,826 429 -7 -91 -112 44324 376 - -- 3,143 3,519 3,541 38 -3,727 -159 1131 -147 -- - 1,142 995 -1,002 -41 1,658p 166 449p
Apr. 7 -1,608 -70 -- -7,764 -9,442 -4,396 -13 3,768p -61 -580p14 -521 - -- 5,064 4,543 -1,273 38 1,399p -146 310p2128
1/ Represents change in System's portfolio from end-of-period to end-of-period; includes redemptions in regular bill auctions.2/ Represents change in daily average level for preceding period.
3/ Includes matched sale-purchase transactions as well as RP's.
4/ Sum of changes in vault cash, currency in circulation, Treasury operations, F.R. float, gold and foreign accounts, and other F.R. accounts.5/ Reserves to support private nonbank deposits. Target change for March and April reflects the target adopted at the March 16, 1976 FOMC
meeting. Target change for previous months reflects the bluebook patterns that are consistent with target ranges that were adopted duringthe month.P - Preliminary.

CONFIDENTIAL (FR)
CLASS II - FOMC
APRIL 16, 1976
TABLE 4
NET CHANGES IN SYSTEM HOLDINGS OF SECURITIES 1/($ millions, not seasonally adjusted)
Treasury Coupons Federal Agencies Net ChangeNet Purchases 3/ Net Purchases 4/ Outright
Treasury Bills Within Over Within Over Holdings NetPeriod Net Change 2/ 1-year 1 - 5 5 - 10 10 Total 1-year I - 5 5 - 10 10 Total Total 5/ RP's 6/
1972 -490 87 789 539 167 1,582 46 592 253 168 1,059 1,631 -1,3581973 7,232 207 579 500 129 1,415 120 400 244 101 864 9,273 -461974 1,280 320 797 434 196 1,747 439 1,665 659 318 3,082 6,303 -1541975 -468 337 3,284 1,510 1,070 6,202 191 824 460 138 1,613 7,267 1,272
1975--Qtr. I -2,093 33 1,054 625 312 2,024 69 169 285 61 584 508 53Qtr. II 1,086 218 1,135 454 273 2,079 - -- -2 -- -2 3,076 230Qtr. III -757 13 712 201 171 1,096 64 514 106 63 747 1,060 2,392Qtr. IV 1,294 74 385 234 315 1,006 58 141 71 14 284 2,626 -1,403
1976--Qtr. I -363 115 554 226 156 1,052 102 288 108 38 535 1,022 1,256
1975--Oct. 97 -- -- - - -- 58 141 71 14 284 430 15Nov. -588 43 267 156 244 709 -- -- - - -- 99 -2,637Dec. 1,784 31 118 78 71 297 - -- - -- -- 2,096 1,219
1976--Jan. -1,596 37 110 100 73 321 26 139 47 27 240 -1,030 3,597Feb. 1,275 40 366 63 59 528 76 149 61 11 297 2,029 -3,129Mar. -42 38 78 63 24 203 - -- -- - -- 23 788
Apr.
1976--Feb. 4 -189 -- 189 - -- 189 - -- - -- -- -1 -3,53411 356 - -- -- -- - -- - - - -- 336 -2,96918 840 - -- -- -- -- - - -- - - 820 2,21025 53 40 177 63 59 339 - -- - -- -- 376 4,014
Mar. 3 150 - -- - -- -- 76 149 61 11 297 407 -3,31410 -688 -- -107 - -- -107 - -- -- - -- -818 -8,83517 438 38 185 63 24 310 - - - -- -- 711 4,11524 431 - -- -- -- - -- -- - - - 376 3,14331 -156 - - - -- - -- - - - - -147 1,142
Apr. 7 -1,593 -- -70 -- -70 - -- -- -- - - -1,678 -7,76414 -501 - -.. ..-21 -- - - -- -521 5,06428
1/ Change from end-of-period to end-of-period.2/ Outright transactions in market and with foreign accounts, and redemptions (-) in bill auctions.3/ Outright transactions in market and with foreign accounts and short-term notes acquired in exchange for maturing bills. Excludes redemptions,
maturity shifts, rollovers of maturing coupon issues, and direct Treasury borrowings from the System.4/ Outright transactions in market and with foreign accounts only. Excludes redemptions and maturity shifts.5/ In addition to net purchases of securities, also reflects changes in System holdings of bankers' acceptances, direct Treasury borrowings from the
System, and redemptions (-) of Agency and Treasury coupon issues.6/ Tncludes changes in both RP's (+) and matched sale-purchase transactions (-).
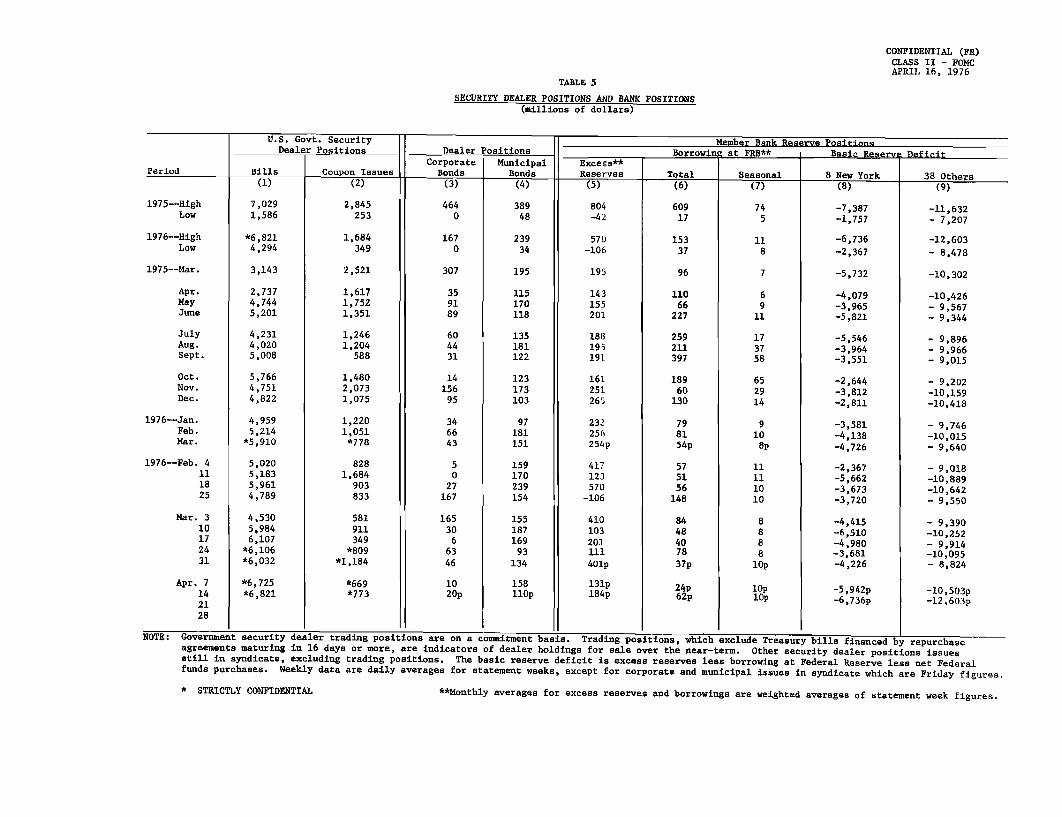
CONFIDENTIAL (FR)CLASS II - FOMCAPRIL 16, 1976
TABLE 5
SECURITY DEALER POSITIONS AND BANK POSITIONS(millions of dollars)
U.S. Govt. Security Member Bank Reserve PositionDealer Positions Dealer Positions Borrowin at FRB** Basic Reserve Deficit
Corporate Municipal Excess**Period Bills Coupon Issues Bonds Bonds Reserves Total Seasonal 8 New York 38 Others1I\
\
7,0291,586
*6,8214,294
3,143
2,7374,7445,201
4,2314,0205,008
5,7664,7514,822
4,9595,214
*5,910
5,0205,1835,9614,789
4,5305,9846,107*6,106*6,032
*6,725*6,821
2,845253
1,684349
2,521
1,6171,7521,351
1,2461,204
588
1,4802,0731,075
1,2201,051*778
8281,684
903833
581911349
*809*1,184
*669*773
(S)
804-42
570-106
195
143155201
188195
191
161251265
232256254p
417123570
-106
410103201111401p
131p
184p
(6)
60917
15337
96
11066
227
259211397
18960
130
798154p
575156
148
84484078
37p
24p62p
(8)
-7,387-1,757
-6,736
-2,367
-5,732
-4,079-3,965-5,821
-5,546-3,964-3,551
-2,644-3,812-2,811
-3,581-4,138-4,726
-2,367-5,662-3,673-3,720
-4,415-6,510-4,980-3,681-4,226
-5,942p-6,736p
1975--HighLow
1976--HighLow
1975--Mar.
Apr.MayJune
JulyAug.Sept.
Oct.Nov.Dec.
1976--Jan.Feb.Mar.
1976--Feb. 4111825
Mar. 310172431
Apr. 7142128
(9)
-11,632- 7,207
-12,603
- 8,478
-10,302
-10,426- 9,567- 9,344
- 9,896- 9,966
- 9,015
- 9,202
-10,159-10,418
- 9,746
-10,015- 9,640
- 9,018
-10,889-10,642- 9,550
- 9,390
-10,252- 9,914-10,095- 8,824
-10,503p
-12,603p
NOTE: Government security dealer trading positions are on a commitment basis. Trading positions, which exclude Treasury bills financed by repurchaseagreements maturing in 16 days or more, are indicators of dealer holdings for sale over the near-term. Other security dealer positions issuesstill in syndicate, excluding trading positions. The basic reserve deficit is excess reserves less borrowing at Federal Reserve less net Federalfunds purchases. Weekly data are daily averages for statement weeks, except for corporate and municipal issues in syndicate which are Friday figures.
* STRICTLY CONFIDENTIAL **Monthly averages for excess reserves and borrowings are weighted averages of statement week figures.
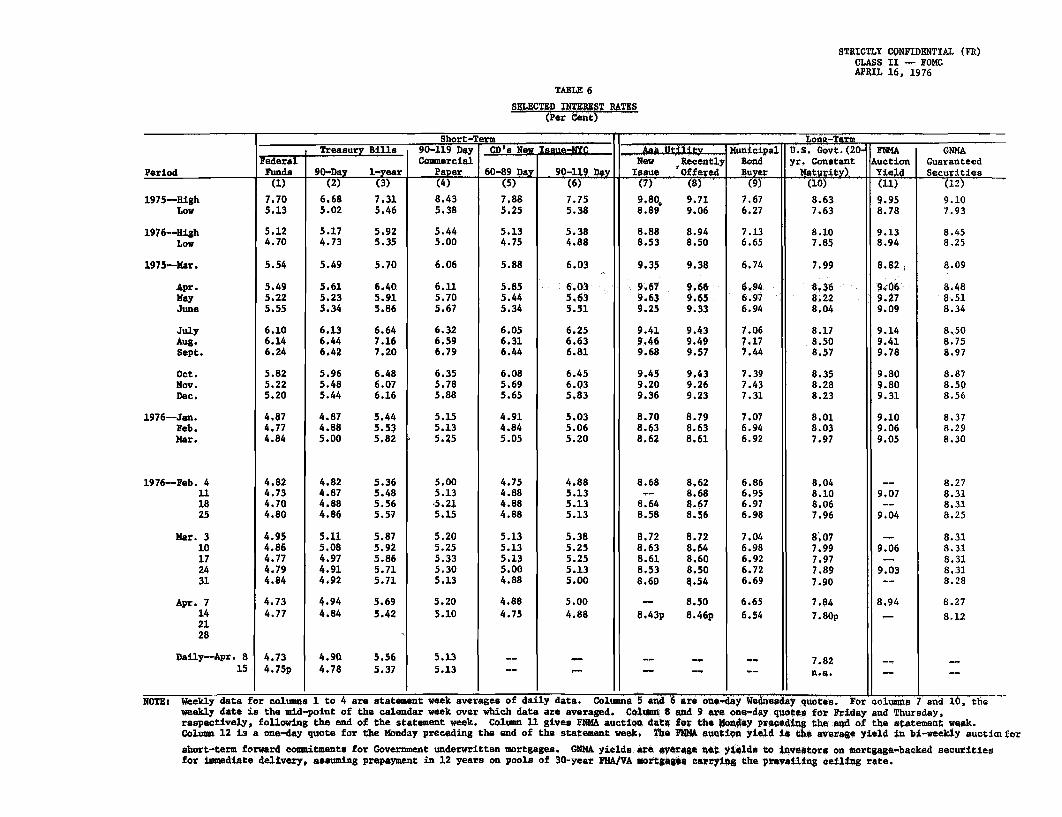
STRICTLY CONFIDENTIAL (FR)CLASS II -- FOMCAPRIL 16, 1976
TABLE 6
SELECTED INTEREST RATES(Per Cent)
Short-Term . Lona-Te r m
Treasury Bills 90-119 Day CD's New ssue-NYC aA Ut .y Municipal U.S. Govt.(20- IFNA lONMAFederal Commercial New Recently Bond yr, Constant Auction Guaranteed
Period Funds 90-Day 1-year Paper 60-89 Day 90-119 Day Issue Offered Buysr Natrity) Yield Securities
1975--HighLow
1976--HighLow
1975--Mar.
Apr.MayJune
JulyAug.Sept.
Oct.Nov.Dec.
1976--Jan.Feb.Mar.
1976-Feb. 4111825
Mar. 310172431
Apr. 7142128
Daily-Apr.
NOTE:
(1)
7.705.13
5.124.70
5.54
5.495.225.55
6.106.146.24
5.825.225.20
4.874.774.84
4.824.734.704.80
4.954.864.774.794.84
4.734.77
4.734 .75p
(3)
7.315.46
5.925.35
5.70
6.405.915.86
6.647.167.20
6.486.076.16
5.445.535.82
4.9Q 5.564.78 5.37
5.005.13.5.215.15
5.205.255.335.305.13
5.205.10
5.135.13
(6)
7.755.38
5.384.88
6.03
6.035.635.51
6.256.636.81
6.456.035,83
5.035.065.20
4.885.135.135.13
5.385.255.255.135.00
5.004.88
(7)
9.80,8.89
8.888.53
9.35
9.679.639.25
9.419.469.68
9.459.209.36
8.708.638.62
8.68
8.648.58
8.728.638.618.538.60
8.43p
(8)9.719.06
8.948.50
9.38
9.669.659.33
9.439,499.57
9.439.269.23
8.798.638.61
8.628.688.678.56
8.728.648.608.508.54
8.508.4 6p
(10)
8.637.63
8.107.85
7.99
8,368.228.04
8.178.508.57
8.358.288.23
8.018.037.97
8.048.108.067.96
8,077.997.977.897.90
7.84
7.80p
7.82n.a.
(11)
9.958.78
9.138.94
8.82
9069.279.09
9.149.419.78
9.809.809.31
9.109.069.05
9.07
9,04
9.06
9.03
8.94
(12)
9.107.93
8.458.25
8.09
8.488.518.34
8.508.758.97
8.878.508.56
8.378.298.30
Weekly data for columns 1 to 4 are statement week averages of daily data. Columns 5 and 6 are one-day Wednesday quotes. For colmm 7 and 10, theweekly date is the mid-point of the calendar week over which data are averaged. Column 8 and 9 are one-day quotes for Friday and Thursday,respectively, following the end of the statement week. Column 11 gives FNMA auction data fo the Monay preceding the and of the statement week.Column 12 is a one-day quote for the Monday preceding the end of the statement week. The EMA auction yield is the average yield in bi-weekly auctiaofor
short-term forward commitments for Government underwritten mortgages. GNMA yields are average nota yild to tiveators on mortgage-backed securitiesfor immediate delivery, assuming prepayment in 12 years on pools of 30-year FHA/VA mlotgages carrylg the prevaling ceiling rate.
"
APPENDIX TABLE 1-A
MONEY AND CREDIT AGGREGATE MEASURESAPRIL 16, 1976
BANK CREDIT MONEY STOCKRESERVES MEASURES MEASURES
Available TotalPeriod Noto Adl- Loans
Total Non Support Credit and M1 M2 M3 M4 M5 M6 M?borrowed Pvt. proxy Invest-
Deposits ments1 2 3 4 5 6 7 8 9 10 11 12
ANNUALLY:
197319741975
SEMI-ANNUALLY:
END HALF 1974
1ST HALF 19752ND HALF 1975
DUARTERLY:
2ND QTR. 19753RD OTR. 19754TH OTR. 1975
IST QTR. 1976
QUARTERLY-AV:
2ND OTR. 19753RD QTR. 19754TH QTR. 1975
1ST QTR. 1976
MONTHLY:
1975--FEB.MAR.APR.MAYJUNEJULYAUG.SEPT.OCT.NOV.DEC.
1976--JAN.FEB.MAR. P
6.77.1-0.4
4.2
-1.20.3
1.3-o.d1.4
-6.2
-1.40.10.6
-3.9
-9.0-1.43.5
-11.612.2-3.2-3.13.9-6.39.70.8
-10.2-6.8
-1.8
6.09.21.3
19.3
1.70.9
-0.1-2.84.5
-5.4
-0.4-1.92.7
-3.2
-0.40.03.4
-10.16.5
-5.80.0
-2.60.8
14.3-1.6
-8.4-6.9-0.9
8.47.4
-1.1
5.7
-1.7-0.6
-0.2-1.5
0.4
-5.9
-2.2-0.8-0.8
-3.4
-6.2-4.e
2.2-8.1
5.4-0.3-4.3
0.3-5.1
6.00.3
-4.9-9.4-3.7
(Per cent annual rates of growth)
10.5 13.5 6.0 b10.2 9.2 4.73.9 4.3 4.2 8
3.1
5.13.4
4.63.63.1
7.3
!.14.14.7
4.0
4.37.93.45.15.12.06.82.06.0
10.5-7.3
5.36.16.2
3.9
5.62.7
9.73.61.9
4.6
7.47.12.5
2.9
0.09.43.4
11.414.2
3.75.31.6
-0.89.4
-2.8
1.26.16.5
6.1
4.53.1
5.3-0.87.0
1.6
3.6
1.46.0
2.6
-0.76.02.21.0
12.7-3.3-4.3
5.25.9
14.40.7
-0.74.21.2
11.010.6
6.3
7.8
C.95.4
7.73.07.8
4.E
5.65.7t.5
5.2
4.94.43.96.2
12.95.1
-C.54.37.7
11.14.5
3.26.64'.0
10.69.09.6
7.'.
9.99.0
11.38.19.6
6.2
9.4
10.19.2
6.3
7.38.28.2
10.116.010.05.98.3'-.711.67.2
'7.u9.47.9
11.18.9
10.0
7.1
9.510.U
10.68.6
11.2
6.1
U.710.710.1
8.6
6.t6.97.89.4
14.911.9
7.06.5
11.014.67.7
6.89.38.G
11. ,6.99.6
7.0
9.49.3
10.17.5
10.9
7.6
8.79.59.5
8.i
7.97.86.6
13.510.6
6.03.7
10.414.3
7.6
6.58.9
7.1
NOTES: ADJUSTED CREDIT PROXY INCLUDES MAINLY TOTAL MEMBER BANK DEPOSITS SUBJECT TO RESERVE REQUIREMEN1S, LOANS SOLD TO BANK-RELATED INSTITUTIONS, AND EURODOLLAR bORROWINGS OF U.S.BANKS. WEEKLY DATA ARE DAILY AVERAGES FOR STATEMENT WEEKS. ONMHLYDATA ARE DAILY AVERAGES. WEEKLY DATA ARE NOT AVAILABLE FOR M3, MS. Mt, M1, TOTAL LOANS AND INVESTMENTS AND THRIFT INSTITU-TION DEPOSITS.
1/ BASED ON DATA ADJUSTED FOR CHANGES IN RESERVE REQUIREMENTS.P - PRELIMINARY
I I

APPENDIX TABLE 1-B
MONEY AND CREDIT AGGREGATE MEASURESSEASONALLY ADJUSTED, BILLIONS OF DOLLARS
APRIL 16, 1976
BANK CREDIT MONEY STOCKRESERVESU MEASURES MEASURES
Available TotalPeriod Non to Adj. Loans
Total Support Credit and MI M2 M M4 M5 M6 M7borrowed Pvt. proxy Invest-
Deposits ments
1 2 3 5 6 7 8 9 10 11 12ANNUALLY:
197319741975
MONTHLY:
1975--MAP.
APR.MAYJUNE
JULYAUG.SEPT.
OCT.NOV.DEC.
1976--JAN.FEB.MAR, P
WEEKLY:
1976--FEB. 111825
MAR. 310172431P
APR. 7P
32,39034,69334,539
34,377
34,47734.14334,490
34,39934,31034,421
34,23934,51534,539
34,24534,05234,000
33,77534,21033,774
34,34033,83433,84333,87634,300
33,858
31,09233,96634,409
34,271
34,36734,07734,263
34,09834,09934,024
3',04834,45534.409
34,16733.97133,946
33,72434,15433,626
34,25633.78633,80333,79834,263
33,834
30,33532,59132,231
32,337
32,39632,17632.320
32,3)132,19432,201
32,06332,22432,231
32,10031.84931,752
31,62632 17631,578
31,97031,53331 60831 69932,074
31,621
449.4495.3514.4
499.9
500.8501.2506.5
505.1503.3505.5
508.0514.1514.4
514.1515.19516.4
516.4516.9515.4
514.4515.7516.7515.9515.3
517.4
634.6691.9721.6
701.7
703.7706.7709.7
710.9714.9716.1
719.7726.0721.6
724.8729.7734.7
270.5283.1295.0
284.1
284.9287.6291.0
291.9293.2293.6
293.4295.7295.0
295.3296.8298.4
297.3297.9295.8
296.8299.3298.7297.3298.6
300.0
571.4612.4663.3
623.0
626.7633.7642.4
647.5650.6652.9
655.7661.6663.3
669.0676.9
681.7
676.7678.4676.7
678.5682.0681.8681.066b.0
686.6
919.5981.6
1091.8
1003.7
1012.71025.31040.2
1051.61060.61068.1
1075.61086.01091.8
1102.41115.61125.6
634.9702.2746.2
712.8
715.1718.8726.5
729.6729.3731.9
736.6743.4746.2
748.2752.3754.8
752.5753.7751.4
752.3755.0754.8754.0756.4
760.0
982.91071.41174.7
1093.5
1101.11110.41124.3
1133.71139.31147.2
1156.51167.71174.7
1181.61190.91198.7
1093.71191.01310.0
1214.9
1222.81232,41247.7
1260.11267.51274.4
1286.11301.71310.0
1317.41327.61336.5
1132.01232.71350.5
1259.0
1267.21276.31290.7
1302,11308,61314.6
1326.21342.01350.5
1357.61367.91376.1
I I . I I I 6NOTES: ADJUSTED CREDIT PROXY INCLUDES MAINLY TOTAL MEMBER BANK DEPOSITS SUBJECT TO RESERVE REQUIREMENTS, LOANS SOLL 10 BANK-
RELATED INSTITUTIONS, AND EURODOLLAR BORROWINGS OF U.S.DANKS. WEEKLY DATA ARE DAILY AVERAGES FOR STATEMENT WEEKS. MONTHLYDATA ARE DAILY AVERAGES. WEEKLY DATA ARE NOT AVAILABLE FOR M3, MS, M6, M7, TOTAL LOANS AND INVESTMENTS AND THRIFT INSTITU-TION DEPOSITS.
I/ BASED ON DATA ADJUSTED FOR CHANGES IN RESERVE REQUIREMENTS.P - PRELIMINARY

APPENDIX TABLE 2-A
COMPONENTS OF MONEY STOCK AND RELATED MEASURES
Demand otal Other Savings Credit Savings Term ICommercialTime Mutual ShortPeriod Currency Dp Time Than ank Union CD's Bonds UST v't C
PaperDeposits CD's and S & L Shares Securities
. Sharesy 11 2 3 4 5 6 7 8 9 10
S(Per cent annual rates of growth)ANNUALLY :
1.731974
SMI-ANNUALLY:
2ND HALF 1974
1ST HALF 19752NO HALF 1975
QUAI RKLY:
2ND QIR. 19753RD R. 19754TH QiiR. 1975
1lT O-TR. 1976
QUARTERLY-AV:
2ND OTR. 19753RD QTR. 19754tfl QTR. 1975
1'1 QTR. 1976
MOT HLY:
)97h---MAR.
MAYJUNEJULYAUG.SEPT.OCT.NOV.DLL.
1976--JAN.FEB.MAR. P
16.215.07.7
10.6
7.87.2
6.32.6
11.8
4.6
4.54.79.1
6.8
1.13.93.1
12.05.8
-3.85.8
13.411.99.7
4.56.92.4
11.49.4
11.8
8.0
13.49.6
14.68.9
10.1
16.2
12.512.79.1
14.8
10.09.9
15.118.414.0
6.46.0
10.411.9
7.9
17.620.69.8
6.55.6
15.7
., I
15.215.2
17.717.412.4
14.1
16.218.214.0
13.2
15.216.417.218.916.917.714.913.512.411.0
13.414.413.9
13.812.120.2
11.5
20.917.6
20.617.017.6
19.2
21.018.616.5
18.3
21.020.620.319.915.719.415.218.814.818.3
18.010.728.2
45.641.4-7.7
20.9
-12.7-2.9
-25.4-23.819.2
-47.3
-24.5-27.5
9.5
-29.3
-30.0-18.7-44.8-14.1-28.5-48.2
4.627.313.416.1
-53.6-57.6-36.6
31.311.921.0
4.4
6.734.0
7.019.246.6
8.2
-2.626.430.7
17.0
-16.60.0
-2.123.153.627.6
-23.237.478.219.7
1.810.612.2
39.39.1
-3.3
4.4
5.7-12.1
-9.1-24.2
0.0
-2.0
9.3-23.7
-8.7
0.0
33.610.9
-13.5-24.6-25.1-28.-20.
-5.96.00.0
0.0-3.0-3.0
MONTHLY AVERAGE LEVELS DERIVED BY AVERAGING END OF CURRENT MONTH AND END OF
8.110.
8.7
9.9
9.47.6
9.25.69.4
10.9
8.18.58.4
9.8
12.21.7
12.113.7
5.110.1
1.710.013.2
4.9
8.112.911.2
1/ GROWTH RATES ARE BASED ON ESTIMATEDPREVIOUS MONTH REPORTED DATA.
P - PRELIMINARY.
APKIL 1t, 19ft.

APRIL 16, 1976
APPENDIX TABLE 2-B
COMPONENTS OF MONEY STOCK AND RELATED MEASURES
Time Mutual ShortDemand -Total Other Savings Credit Savings Term Commercial Non- U.S.
Period Currency Time rhn Bank Union CD's Bnds S 't deposit Gov'td Cu ncy D Deposits C D' and S & L Shares Scurite Fu n d s Demand
_ _ Shares y i Secur1 2 3 4 5 6 7 8 9 10 11 12
ANNUALLY:
1973 61.5 209.0 364,4 300.9 323.5 24.7 63.5 60.4 50.3 38.3 6.6 5.01974 67.8 215.3 419.1 329.3 341.6 17.7 89.8 63.3 56.3 41.8 8.4 3.41915 73.7 221.3 451.2 368.3 395.4 13.3 82.9 67.3 68.1 40.4 8.4 3.0
MONTHLY:
1975--MAR. 69.4 214.7 428.7 339.0 351.9 29.1 89.8 64.2 57.2 44.0 6.5 2.5
APR. 69.5 215.4 430.1 341.8 356.7 29.6 88.4 64.5 57.2 44.4 6.7 2.7MAY 70.2 217.4 431.2 346.1 361.8 30.1 85.1 64.8 57.1 43.9 7.4 2.5JUNE 71.0 220.0 435.5 351.4 367.5 .0.6 84.1 65.1 58.2 43.0 7.0 3.2
JULY 71.3 220.6 4jT.6 355.5 373.3 31.0 82.1 65.6 60.8 42.1 6.8 2.6AUG. 71.9 221.3 436.2 351.4 378.8 31.5 78.8 65.9 62.2 41.1 7.0 2.8SEPT. 72.0 221.6 438.3 359.2 383.5 31.9 79.1 66.2 61.0 40.4 7.0 3.0
OCT. 72.6 220.8 443.2 362.3 387.8 32.4 80.9 66.6 62.9 40.2 7.9 3.0NOV. 73.4 222.3 447.6 365.9 391-8 32.8 81.8 67.0 67.0 40.4 8.2 3.9DEC. 73.7 221.3 451.2 36.3 395.4 33.3 82.9 67.3 68.1 40.4 8.4 3.0
1976--JAN. 74.2 221.2 452.9 373.7 399.8 33.8 79.2 67.6 68.2 40.4 7.9 2.6FEB. 75.0 221.8 455.5 380.1 404.6 34.1 75.4 67.9 68.8 40.3 8.3 2.6MAR. P 75.7 222.8 456.4 383.2 409.3 34.9 73.1 68.3 69.5 40.2 8.6 2.5
WE;KLY:
1976--FEB. 11 74.9 222.4 455.2 379.4 75.8 8.1 2.518 75.0 222.8 455.8 380.5 75.3 8.1 2.825 75.1 220.7 455.7 380.9 74.8 8.0 3.0
MAR. 3 75.2 221.6 455.5 381.7 73.8 7.9 2.210 75.7 223.5 455.8 382.7 73.0 8.1 2.917 75.7 223.0 456.1 383.1 73.0 8.3 2.824 75.8 221.5 456.7 383.7 73.0 8.5 2.831P 75.8 222.6 457.8 384.4 73.4 8.2 1.9
APR. 7P 76.2 223.8 460.0 386.7 73.4 7.2 2.4
1/ ESTIMATED MONTHLY AVERAGE LEVELS DERIVED BY AVERAGING END OF CURRENT MONTH AND END OF PREVIOUS MONTH REPORTED DATA.DATA.
P - PRELIMINARY
Appendix Table III
Growth Rate in Money Supply(Per cent change in an annual rate)
1973 I
II
III
IV
QIV '72-QIV '73
1974 I
II
III
IV
QIV '73-QIV '74
1975 I
II
III
IV
QIV '74-QIV '75
MlM q
3.6 7.4
10.1 6.4
1.8 5.5
7.8 5.1
6.0 6.2
5.3
5.3
3.0
4.7
4.7
1.4
9.7
3.6
1.9
4.2
1976
6.0
5.6
4.2
4.0
5.0
0.6
7.4
7.1
2.5
4.4
2.9
7.3
9.9
6.3
10.5
8.8
9.0
6.9
5.5
6.6
7.2
6.9
12.5
6.5
6.4
8.3
11.1
9.2
8.2
7.9
9.0
8.8
9.6
7.4
6.4
6.4
7.7
5.6
10.2
10.1
6.1
8.2
9.5
M3M Q
8.4 10.3
9.8 8.5
6.1 7.8
9.9 8.4
8.8 9.0
8.4
5.7
5.2
7.2
6.8
9.0
14.5
10.7
8.9
11.2
8.9
6.5
5.6
6.5
7.1
7.5
12.6
13.3
9.2
11.1
12.4 11.1
M = Annual rates of growth calculatedmonths of the quarters.
from average levels in the final
Q = Annual rate calculated from average levels in all three months of thequarters.
M 2
M Q
1976 QII
QIII
QIV
1977 QI
Appendix Table IV
Projected Federal Funds Rates
Alt. A Alt. B
4-5/8 5
4-7/8 5%
5k 6
6 7
Alt. C
5k
6
7
7%
Appendix Table V
Reserve Measures Consistent With Short-run Alternatives(seasonally adjusted)
Nonborrowed reserves
Member bank borrowing
Excess reserves
Other reserve aggregates:
Total reserves
1/Monetary base-
Nonborrowed monetarybase
Average of 4 weeksApril 28 to May 19
($ million)
Alt. A Alt. B Alt, C
34,012 33,966 33,88(
33 38 7
204 186 16!
34,045
113,316
34,003
113,274
Change from average ofprevious 5-weok period
($ million)
Alt. A Alt. B Alt. C
44 -2 -82
-14 -9 31
-28 -46 -639
33,964
113,234
113,283 113,237 113,157
30
756
770
-12
714
724
-51
674
644
2-month Annual PercentageGrowth Rate for April-May
Alt. A
2.6
2.2
7.9
8.0
Alt, B
1.6
Alt. C
0.0
1.4
7.6
7.7
0.6
7.4
7.2
1/ Total reserves plus currency held outside the Treasury, the Federal Reserve, and member banks.