Embed Size (px)
Citation preview
Published: November 14, 2011
r 2011 American Chemical Society 20634 dx.doi.org/10.1021/ja2092823 | J. Am. Chem. Soc. 2011, 133, 20634–20643
ARTICLE
pubs.acs.org/JACS
Folding of Human Telomerase RNA Pseudoknot Using Ion-Jump andTemperature-Quench SimulationsShi Biyun,†,‡ Samuel S. Cho,†,# and D. Thirumalai*,†,§
†Biophysics Program, Institute for Physical Science and Technology, University of Maryland, College Park, Maryland 20742,United States‡Bio-X Laboratory, Department of Physics and Soft Matter Research Center, Zhejiang University, Hangzhou 310027, China§Department of Chemistry, University of Maryland, College Park, Maryland 20742, United States
’ INTRODUCTION
In order to function, RNA molecules have to adopt nearlycompact structures, thus making it necessary to understand theirfolding in quantitative detail. Folding landscapes of RNAs arerugged1�6 because they readily adopt alternate structures withfree energies that are not significantly higher than the nativefold. Consequently, the stability gap relative to kBT (kB is theBoltzmann constant and T is the temperature), which is the freeenergy difference between the native state and other low freeenergy conformations,7,8 is only modest. As a result there is asubstantial probability that RNA molecules are kineticallytrapped in alternate misfolded structures. Trapping in low-lyingfree energy states gives rise to complex folding kinetics even inthe formation of simple hairpins.9�12 Although the generalprinciples governing the folding of RNA are in place,3,13�16 theinterplay of multiple conflicting energy scales makes it difficult tomap the major stages of RNA folding from an initial ensemble ofunfolded conformations.
Folding (unfolding) of RNA can be triggered by increasing(decreasing) the concentration, C, of counterions. In typicalensemble experiments C (or T) is used to trigger folding orunfolding of RNA.1,17,18 Considerable insights into the fold-ing mechanisms of RNA have come from such experi-ments,13,15,16,19,20 theoretical arguments,3 and simulations usingcoarse-grained (CG) models.21�24 These studies have shownthat RNA folds by multiple parallel pathways and is succinctlysummarized by the kinetic partitioning mechanism (KPM).16,25
According to KPM a fraction (Φ) of initially unfolded moleculesreaches the native basin of attraction (NBA), whereas theremaining fraction is kinetically trapped in competing basinsof attraction (CBAs). The long transition times from CBAs toNBA result in slow folding of ribozymes.5,26 Single-moleculefluorescence resonance energy transfer (smFRET) experiments
Received: October 2, 2011
ABSTRACT: Globally RNA folding occurs in multiple stages involving chain compac-tion and subsequent rearrangement by a number of parallel routes to the folded state.However, the sequence-dependent details of the folding pathways and the link betweencollapse and folding are poorly understood. To obtain a comprehensive picture of thethermodynamics and folding kinetics we used molecular simulations of coarse-grainedmodel of a pseudoknot found in the conserved core domain of the human telomerase(hTR) by varying both temperature (T) and ion concentration (C). The phase diagramin the [T,C] plane shows that the boundary separating the folded and unfolded state forthe finite 47-nucleotide system is relatively sharp, implying that from a thermodynamicperspective hTR behaves as an apparent two-state system. However, the folding kineticsfollowing single C-jump or T-quench is complicated, involving multiple channels to thenative state. Although globally folding kinetics triggered by T-quench and C-jump aresimilar, the kinetics of chain compaction are vastly different, which reflects the role ofinitial conditions in directing folding and collapse. Remarkably, even after substantial reduction in the overall size of hTR, theensemble of compact conformations are far from being nativelike, suggesting that the search for the folded state occurs among theensemble of low-energy fluidlike globules. The rate of unfolding, which occurs in a single step, is faster uponC-decrease compared toa jump in temperature. To identify “hidden” states that are visited during the folding process we performed simulations byperiodically interrupting the approach to the folded state by lowering C. These simulations show that hTR reaches the folded statethrough a small number of connected clusters that are repeatedly visited during the pulse sequence in which the folding or unfoldingis interrupted. The results from interrupted folding simulations, which are in accord with non-equilibrium single-molecule folding ofa large ribozyme, show that multiple probes are needed to reveal the invisible states that are sampled by RNA as it folds. Although wehave illustrated the complexity of RNA folding using hTR as a case study, general arguments and qualitative comparisons to time-resolved scattering experiments on Azoarcus group I ribozyme and single-molecule non-equilibrium periodic ion-jump experimentsestablish the generality of our findings.
20635 dx.doi.org/10.1021/ja2092823 |J. Am. Chem. Soc. 2011, 133, 20634–20643
Journal of the American Chemical Society ARTICLE
performed by immobilizingTetrahymena ribozyme on a surface27
have given additional insights into RNA folding. Analysis of thesmFRET trajectories following a single jump in ion concentra-tion quantitatively confirmed the predictions of the KPM.28
Cumulatively, these studies firmly established that RNA mol-ecules fold bymultiple pathways with an array of time scales, thusconfirming the rugged nature of their folding landscapes.
Single ion-jump experiments29,30 are useful in describing thedominant ensemble of intermediate structures {Ii} that accumu-late under folding conditions. However, due to limitations intemporal resolution, they cannot be used to probe the ensembleof structures that are sampled prior to the formation of {Ii} or theNBA. These states, if they are accessed during the foldingprocess, would be “hidden” in conventional near-equilibriumsmFRET experiments. The nature of hidden conformations canbe revealed by interrupting folding after initiating an ion-jump.31
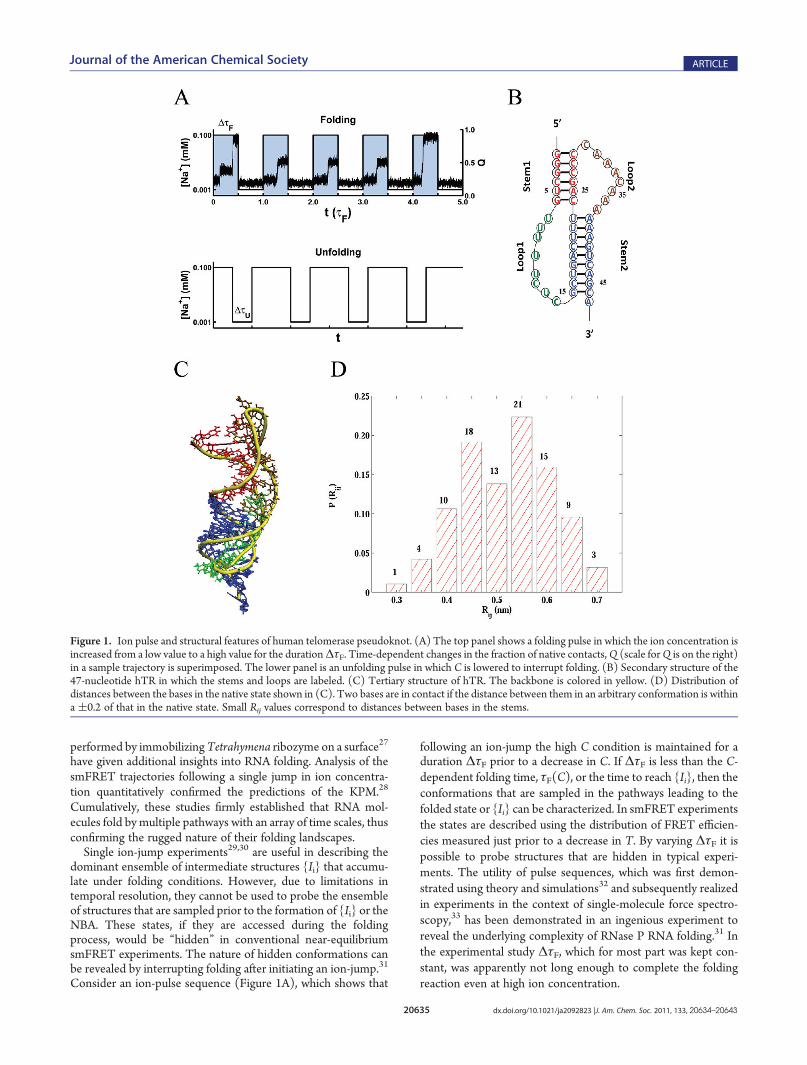
Consider an ion-pulse sequence (Figure 1A), which shows that
following an ion-jump the high C condition is maintained for aduration ΔτF prior to a decrease in C. If ΔτF is less than the C-dependent folding time, τF(C), or the time to reach {Ii}, then theconformations that are sampled in the pathways leading to thefolded state or {Ii} can be characterized. In smFRET experimentsthe states are described using the distribution of FRET efficien-cies measured just prior to a decrease in T. By varying ΔτF it ispossible to probe structures that are hidden in typical experi-ments. The utility of pulse sequences, which was first demon-strated using theory and simulations32 and subsequently realizedin experiments in the context of single-molecule force spectro-scopy,33 has been demonstrated in an ingenious experiment toreveal the underlying complexity of RNase P RNA folding.31 Inthe experimental study ΔτF, which for most part was kept con-stant, was apparently not long enough to complete the foldingreaction even at high ion concentration.
Figure 1. Ion pulse and structural features of human telomerase pseudoknot. (A) The top panel shows a folding pulse in which the ion concentration isincreased from a low value to a high value for the durationΔτF. Time-dependent changes in the fraction of native contacts,Q (scale forQ is on the right)in a sample trajectory is superimposed. The lower panel is an unfolding pulse in which C is lowered to interrupt folding. (B) Secondary structure of the47-nucleotide hTR in which the stems and loops are labeled. (C) Tertiary structure of hTR. The backbone is colored in yellow. (D) Distribution ofdistances between the bases in the native state shown in (C). Two bases are in contact if the distance between them in an arbitrary conformation is withina (0.2 of that in the native state. Small Rij values correspond to distances between bases in the stems.
20636 dx.doi.org/10.1021/ja2092823 |J. Am. Chem. Soc. 2011, 133, 20634–20643
Journal of the American Chemical Society ARTICLE
Inspired by the interrupted multiple ion-jump single-moleculeexperiments31 we performed simulations using a coarse-grainedmodel of the human telomerase (hTR) pseudoknot.34 First, wecalculated the thermodynamics of the hTR pseudoknot in termsof a phase diagram in the [T,C] plane.3 The folded (F) and theunfolded (U) states are separated by a well-defined boundary,which shows that the melting temperature, Tm, increases non-linearly as C increases. Folding kinetics using single ion-jump orT-quench shows that the flux to the folded state occurs throughtwo dominant channels. In all trajectories folding is preceded bycollapse of the hTR, as assessed by a decrease in the radius ofgyration. The time-dependent changes in the radius of gyrationshow that even after substantial compaction the collapsedstructures are not nativelike. There are dramatic differences inthe approach to the native state between folding initiated by C-jump or T-quench. By performing several interrupted ion-jumps,with varying waiting times ΔτF, we establish that there aremultiple folding pathways reflecting the heterogeneity of thefolding process. Conformations, which are difficult to character-ize in a single ion-jump, become visible as (ΔτF)/(τF(C)) isvaried. These results, which are qualitatively similar to thosefound in the folding of RNase P RNA, show that the completecharacterization of the states that are sampled during the foldingprocess will require a combination of nonequilibrium experi-ments31 and simulations.
’MODELS AND METHODS
Coarse-Grained TIS Model for RNA. We used a modified formof the three interaction site (TIS) model to represent RNA. The energyfunction and parameters are described in detail elsewhere.21 Briefly, inthe TIS model each nucleotide is represented by three beads (orinteraction centers) corresponding to the base, ribose sugar, and thecharged phosphate group. The Hamiltonian for the TIS model is HT =HC +HNB. The term,HC, accounts for chain connectivity and rotationaldegrees of freedom. The term HNB representing interactions betweensites that are not directly connected to each other is HNB = HNC +Hstacking + Helec. The term HNC represents stabilizing native contactinteractions, and Hstacking is for base stacking interactions based onTurner’s Rules.35�37 Finally, Helec accounts for electrostatic repulsionsbetween the charged phosphate groups. For interactions betweenphosphate groups Pi and Pj we use the Debye�H€uckel potential,
VPiPj ¼zPi zPj e
2
4πε0εrre�r=lD ð1Þ
We vary the ion concentration in our simulations by changing the Debyelength lD = ((8πlBI)
1/2)�1 for monovalent cations. Here, lB ≈ 7 Å isthe Bjerrum length at room temperature and I, the ionic strength, isproportional to the ion concentration. In our earlier study,34 we showedthat the melting temperatures of three psedoknots obtained using theTIS model simulations were in excellent agreement with experimentalmeasurements, which we consider to be a key validation of the coarse-graining procedure. We should note that there are other theoreticalapproaches that have also reproduced the thermodynamics of pseudo-knot folding.38
Simulation Details. We used Langevin dynamics in the lowfriction limit, which has been shown to enhance conformationalsampling of proteins and RNA, to calculate various thermodynamicproperties.39 In order to produce realistic estimates of folding andunfolding times we performed Brownian dynamics simulations using afriction coefficient that is appropriate for water.40 For each simulationcondition (specified by ion concentration or temperature) we generated100 trajectories, which seem sufficient to obtain converged results.
Simulations at friction coefficient corresponding to water viscosity allowus to map the simulation time scales to real times, as detailed in theSupporting Information of ref 34. All simulations were performed for thehuman telomerase pseudoknot (PDB code: 1YMO), referred to as hTRthrough out the paper.Analysis of the Trajectories. To monitor the collapse transition
we calculated the radius of gyration using
Rg ¼
ffiffiffiffiffiffiffiffiffi∑ijr2ij
2N2
vuutð2Þ
where rij is the distance between sites i and j, andN is the total number ofinteraction centers in RNA. The folding and unfolding transitions aredetermined using the fraction of native contacts,Q. Two interaction sitesare in tertiary contact if the distance between them is less than the cutoff,rc. We only consider contacts between bases, which suffice to uniquelyspecify the conformations of hTR. With this definition there are 94tertiary contacts in the TIS representation of the native structure of hTR(1YMO). The native contacts are computed by considering basesincluding those that are part of the two stems (see Figure 1B). Withsuch a definition we are assured that in the folded state both secondaryand tertiary interactions are fully developed. In the TIS representation ofthe native state of hTR there is a distribution of distances involvingcontacts between bases in the native state (Figure 1D). The values ofrc vary, depending on the contact. For each contact we allow a toleranceof about 20% to take thermal fluctuations into account. Thus, if a contactis at a distance RN in the native state then it is assumed to be a nativecontact in any arbitrary conformation if the distance between them is atRN + 0.2RN.
We characterize the ensemble of unfolded conformations using anumber of order parameters including q-score41 given by
q ¼ 1ðN � 1ÞðN � 2Þ ∑
N
i < j � 1exp � ðrij � r0ijÞ2
σ2ij
24
35 ð3Þ
where ij labels the non-neighboring pair, rij is the distance between thetwo beads, and rij
0 is the native distance between two beads. The value ofq varies from 0 to 1with q = 1 corresponding to the native state. We alsocalculated the structural overlap function,42 χ = 1 � (NK)/(NT) where
NK ¼ ∑N
i < j � 1Hðδ� jrij � r0ij jÞ ð4Þ
with NT = [(n � 1)n)]/2, H(x) is the Heavyside function, and δ =0.1 nm. Note that if χ = 0 the conformation is in the naive state. At finitetemperatures both χ and q-score have well-defined values. In the TISrepresentation of the 47-nucleotide hTR the value of n = 140 because thefirst nucleotide has only two interaction centers.
’RESULTS
Phase Diagram in C and T Plane.We determined the phasediagram as a function of C and T of the experimentally well-characterized hTR pseudoknot.43�45 The hTR pseudoknothas 47 nucleotides with a secondary structure (Figure 1B) thatcorresponds to the commonly observed H-type RNA pseudo-knot, which is defined as two double-stranded and base-pairedhelices that are each connected by single-stranded loops(Figure 1B and C). We designate the two helices as Stem1(S1) and Stem2 (S2), and the loops as Loop1 (L1) and Loop2(L2). Both the stems are predicted to be stable based onMfold,46
and could form RNA hairpins (S1 and S2) in isolation.34 Thereare extensive Hoogsteen base triples between S2 and L1, which
20637 dx.doi.org/10.1021/ja2092823 |J. Am. Chem. Soc. 2011, 133, 20634–20643
Journal of the American Chemical Society ARTICLE
we classify as tertiary interactions. Recently, Cho, Pincus, andThirumalai (hereafter referred to as CPT) showed that thethermodynamic properties of hTR pseudoknot could be accu-rately predicted using the TIS model.34 The folding transitionwas highly cooperative with a large value of the dimensionlesscooperative measure.34,47
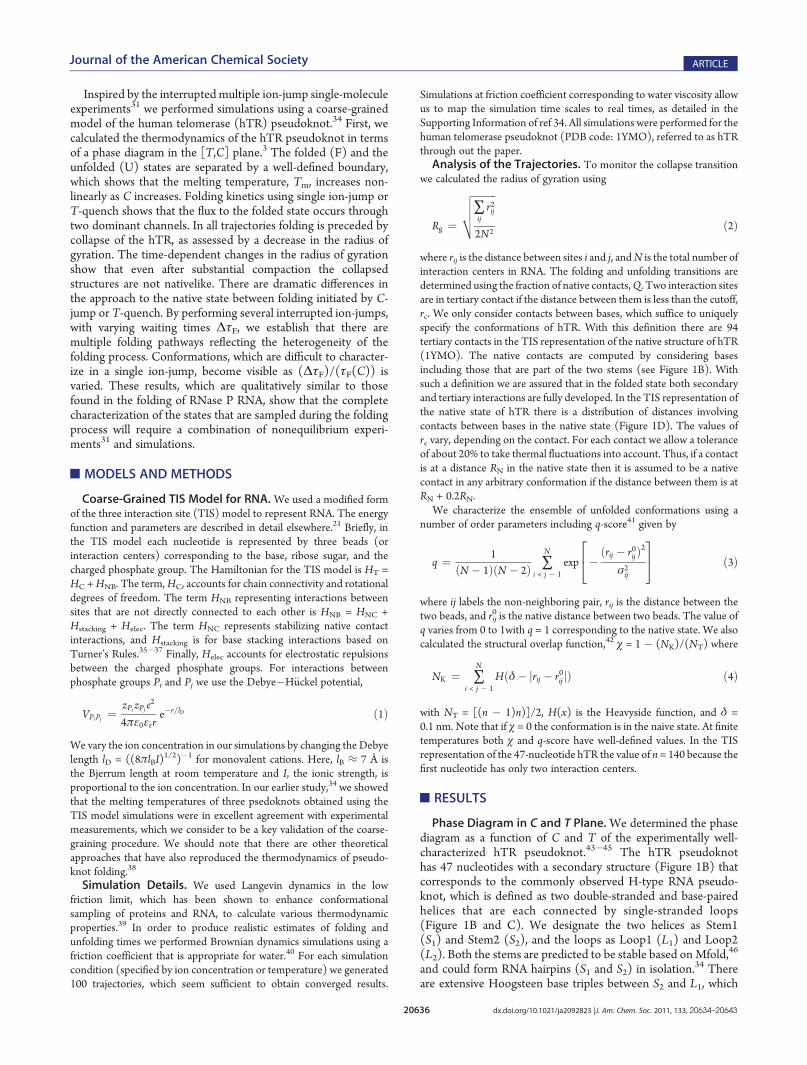
To calculate the phase diagram of the hTR pseudoknot in the[C,T] plane, we performed a series of coarse-grained MDsimulations using the TISmodel in the low friction underdampedlimit.39 Multiple simulations were performed over a broad rangeof ion concentrations (0.001 mM to 0.1 mM) and temperatures(150 K to 400 K). During the time course of each trajectory, wemonitored the degree of folding by Q, the fraction of nativecontacts (SeeModels andMethods for a formal definition). Theensemble average, ÆQæ, is used as an order parameter in thecalculation of the phase diagram (Figure 2A). From a thermo-dynamic perspective there are two distinct states that correspondto the unfolded (red) and folded (blue) states with a boundarybetween the two states. However, there is a region (shown asgreen in Figure 2A), which perhaps should be classified asintermediate states. The locus of points separating the folded
and unfolded states can be approximately described as Tm ≈ Cmα
with α ≈ 0.3.Kinetics of hTR Folding. CPT showed that the related VPK
pseudoknot folds in ∼5 ms upon temperature quench. Themeasured folding times in a recent temperature jump experi-ment18 are in near quantitative agreement with our earlier pre-dictions, which further validates the efficacy of the TIS modelin predicting the overall folding times. With this as an additionalvalidation of the TIS model and the Brownian dynamics proto-col, we carried out two kinds of folding simulations, one in whichfolding is triggered by a temperature quench and the other by anion concentration jump. The folding times were estimated usingτF =
RPU(s) ds where PU(t) is the probability that the molecule
has not folded at time t. We computed PU(t) =R0t PFP(s) ds from
the distribution of first passage times PFP(s) obtained from ahundred independent trajectories. The first passage time for eachtrajectory is the time at which a molecule starting from anunfolded state reaches the folded state for the first time. Weassume that the folded state is reached if Q is 0.8.In the CPT study it was established that upon temperature
quench hTR folded by parallel pathways in a few milliseconds.
Figure 2. Phase diagram and folding kinetics. (A) phases of hTR pseudoknot as a function of temperature (T) and ion concentration (C). Theconcentration of monovalent ions is in mM and temperature is in Kelvin. The phases are assigned on the basis of the fraction of native contactsQwhosescale is on the right. The boundary between theNBA andUBA corresponds toQ = 0.5. (B) Fraction of unfoldedmolecules uponT-quench (blue) andC-jump (red). The T-quench simulations are performed with C = 0.1 mM, and T is quenched from 400 K to 250 K. For the C-jump T is fixed at 250 K, andthe ion concentration is increased from 0.001 mM to 0.1 mM. The solid lines are fits to the data accounting for flux to the NBA through two dominantchannels and are given by PU(t) = Φ1 exp(�t/τ1) + Φ2 exp(�t/τ2). The values for Φ1 and Φ2 for C-jump folding are 0.47 (0.50) and 0.35 (0.36),respectively, where the numbers in parentheses are for T-quench folding. Similarly, the values of τ1 and τ2 are 4.3 ms (4.9 ms) and 2.0 ms (3.0 ms),respectively. (C) Folding trajectories for two dominant pathways by which hTR folds. The contact formation involving S2, L2, and S1, are in blue, green,and red, respectively. The fractionΦ2L1 (Φ1L2) corresponds to the formation of S2 (S1) followed by L2 (S2) and finally S1 (S2). The left panel is for C-jump folding, and the right is for T-quench folding.
20638 dx.doi.org/10.1021/ja2092823 |J. Am. Chem. Soc. 2011, 133, 20634–20643
Journal of the American Chemical Society ARTICLE
Here, we carried out T-quench and ion-jump folding kinetics ofhTR so that a detailed comparison between the two methodsused to initiate folding can be made. Figure 2B shows the timedependence of PU(t) when folding is initiated by ion-jump andT-quench. In both cases, PU(t) is well fit using PU(t) =Φ1 exp(�t/τ1) + Φ2 exp(�t/τ2) where Φ1 and Φ2 are the amplitudesrepresenting flux of the two dominant channels to the foldedstate. Our results are in accord with previous work48 showing theuse of a master equation that pseudoknots fold by biphasickinetics. The values ofΦ1,Φ2, τ1, and τ2 are given in the captionto Figure 2. Using extensive structural analysis CPT showed that,for T-quench folding, the biexponential fits for PU(t) implythat there are two dominant parallel (and a few subdominant)routes to folding. A similar interpretation holds well for foldinginduced by jumping the ion concentration (see below). Inter-estingly, the global parameters obtained from PU(t) fits char-acterizing both the T-quench and ion-jump folding are similar.Thus, the differences in folding mechanisms on time scalesexceeding about one millisecond do not significantly dependon the differences between the initial conformations at hightemperatures and low ion concentrations. As detailed below, theeffect of the initial conditions are lost on time scales that arecomparable to the overall collapse time, τc.Parallel Routes to Folding. In both T-quench and C-jump
folding, we find that there are two dominant pathways thataccount for flux in excess of 80% to the native state (Figure 2B).In addition, there are four minor pathways to the folded state.The time dependence of the fraction of native contacts Q(t) fortwo sample trajectories, one for C-jump and the other for T-quench, illustrates the distinct routes to the native state(Figure 2C). In pathway I, S2 forms first, which subsequentlynucleates interactions with L2. Subsequently, S1 forms, leading totertiary structure formation. In pathway II, the order of formationis folding of S1 followed by interactions involving L2, and finallyconsolidation of S2 and the native structure. The amplitudes forthese pathways using T-quench and C-jump folding are similar(Figure 2C), which suggests that the overall folding mechanismsdo not change significantly. However, on time scales that are shorterthan τc, the nature of the populated structures are different, depend-ing on the protocol used to trigger folding (see below).Link between Collapse and Folding. In order to establish
the link between collapse and folding transitions we computedthe time-dependent changes in ÆRg(t)æ upon initiation of folding.The normalized radius of gyration,
SgðtÞ ¼ RgðtÞ� �� RN
g
Rgð0Þ� �� RN
g
ð5Þ
where ÆRg(t)æ is the average (over an ensemble of trajectories)radius of gyration at time t, and Rg
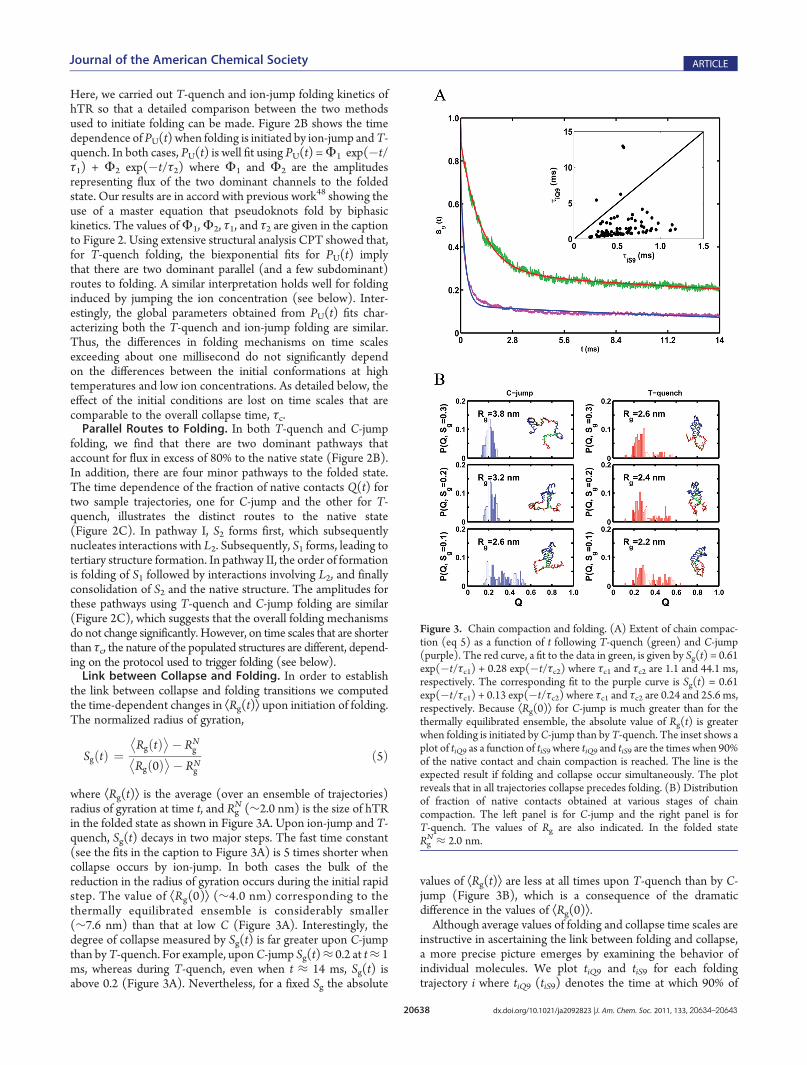
N (∼2.0 nm) is the size of hTRin the folded state as shown in Figure 3A. Upon ion-jump and T-quench, Sg(t) decays in two major steps. The fast time constant(see the fits in the caption to Figure 3A) is 5 times shorter whencollapse occurs by ion-jump. In both cases the bulk of thereduction in the radius of gyration occurs during the initial rapidstep. The value of ÆRg(0)æ (∼4.0 nm) corresponding to thethermally equilibrated ensemble is considerably smaller(∼7.6 nm) than that at low C (Figure 3A). Interestingly, thedegree of collapse measured by Sg(t) is far greater upon C-jumpthan byT-quench. For example, uponC-jump Sg(t)≈ 0.2 at t≈ 1ms, whereas during T-quench, even when t ≈ 14 ms, Sg(t) isabove 0.2 (Figure 3A). Nevertheless, for a fixed Sg the absolute
values of ÆRg(t)æ are less at all times upon T-quench than by C-jump (Figure 3B), which is a consequence of the dramaticdifference in the values of ÆRg(0)æ.Although average values of folding and collapse time scales are
instructive in ascertaining the link between folding and collapse,a more precise picture emerges by examining the behavior ofindividual molecules. We plot tiQ9 and tiS9 for each foldingtrajectory i where tiQ9 (tiS9) denotes the time at which 90% of
Figure 3. Chain compaction and folding. (A) Extent of chain compac-tion (eq 5) as a function of t following T-quench (green) and C-jump(purple). The red curve, a fit to the data in green, is given by Sg(t) = 0.61exp(�t/τc1) + 0.28 exp(�t/τc2) where τc1 and τc2 are 1.1 and 44.1 ms,respectively. The corresponding fit to the purple curve is Sg(t) = 0.61exp(�t/τc1) + 0.13 exp(�t/τc2) where τc1 and τc2 are 0.24 and 25.6 ms,respectively. Because ÆRg(0)æ for C-jump is much greater than for thethermally equilibrated ensemble, the absolute value of Rg(t) is greaterwhen folding is initiated byC-jump than by T-quench. The inset shows aplot of tiQ9 as a function of tiS9 where tiQ9 and tiS9 are the times when 90%of the native contact and chain compaction is reached. The line is theexpected result if folding and collapse occur simultaneously. The plotreveals that in all trajectories collapse precedes folding. (B) Distributionof fraction of native contacts obtained at various stages of chaincompaction. The left panel is for C-jump and the right panel is forT-quench. The values of Rg are also indicated. In the folded stateRgN ≈ 2.0 nm.
20639 dx.doi.org/10.1021/ja2092823 |J. Am. Chem. Soc. 2011, 133, 20634–20643
Journal of the American Chemical Society ARTICLE
folding (collapse) has occurred. As before, folding is assessed byQ. If folding and collapse occur nearly simultaneously, then the[tiQ9, tiS9] plot should be linear with a slope of near unity asindicated by the line in the inset to Figure 3A. However, the insetin Figure 3A shows that in all the trajectories collapse occurs ontime scales that are considerably shorter than the first passagetime. Although on an average the folding time is about an order ofmagnitude greater than the collapse time, there are great varia-tions in the behavior of individual molecules. A substantialnumber of points are clustered around the lower left of the[tiQ9, tiS9] plot. For this subset of molecules the collapse times areabout a factor of (5�10) smaller than the folding time. Collapsehere may be considered to be specific in the sense that theyproduce nativelike compact structures. However, the ensembleof hTR may be topologically frustrated, leading to the formationof a few non-native conformations. This finding provides astructural interpretation for the prediction made in an earlierstudy.48 For a large number of molecules there is a clearseparation in collapse and folding time scales, which is likely aconsequence of incomplete formation of the necessary interac-tions to nucleate the folded conformation. The partitioningof the initial pool of molecules into two distinct populationswith very different folding behavior is consistent with earlierpredictions based on KPM, and is in accord with a variety ofexperiments.The extent to which nativelike structures form as hTR
collapses can be obtained by plotting the distribution of thefraction of native contacts that are formed when hTR hascompacted to varying fractions of the starting size. In the panelson the left side of Figure 3B we show P(Q,t = tiSk), which is thedistribution ofQ calculated at various stages of chain compactionfollowing a jump in C. The corresponding distribution upon T-jump is on the right side in Figure 3B. Surprisingly, both thesedistributions are far from being nativelike, which implies that,despite acquiring compact structures, the folding (as measuredbyQ) is incomplete. We also find that at this level of compactionthe secondary structures (S1 or S2) are not fully formed. The lackof nativelike character even after considerable compaction is dueto formation of incorrect contacts due to topological frustration.Even after nearly 90% compaction the ensemble of structuresafter C-jump and T-quench remain as only near-native globules.This implies that rearrangement to the native stage in a largefraction of molecules occurs at times that are longer than thecollapse time.Differences between C-Jump and T-Quench Folding. The
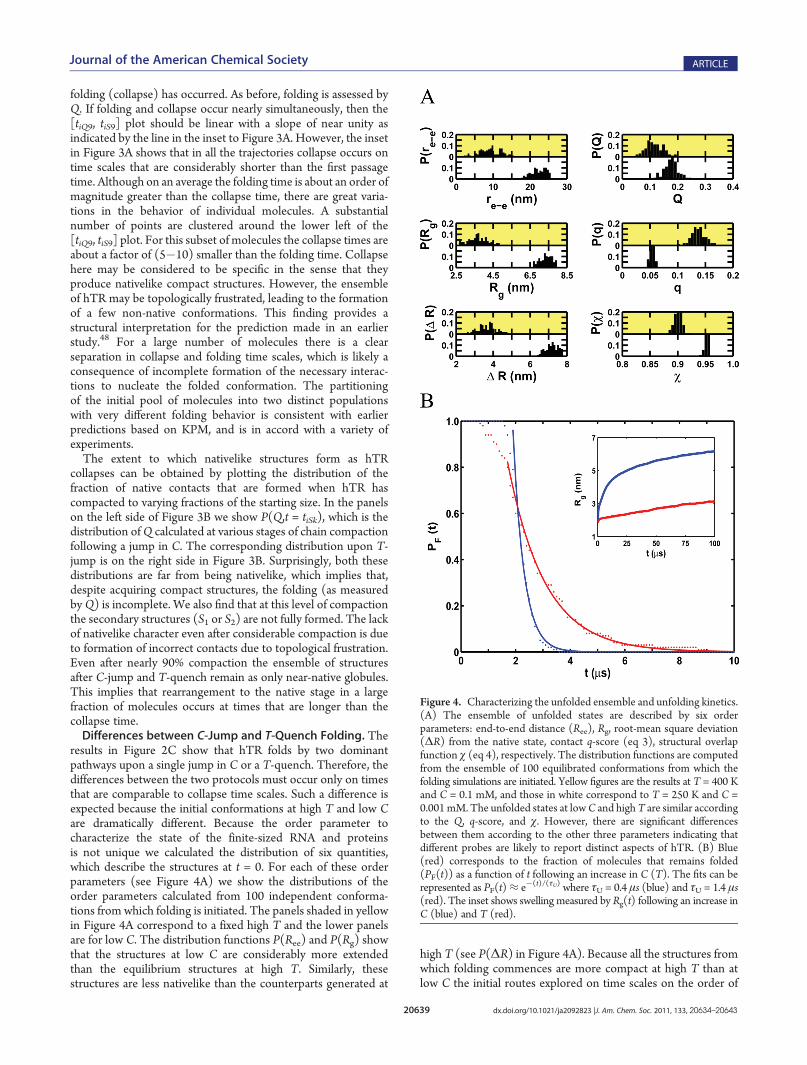
results in Figure 2C show that hTR folds by two dominantpathways upon a single jump in C or a T-quench. Therefore, thedifferences between the two protocols must occur only on timesthat are comparable to collapse time scales. Such a difference isexpected because the initial conformations at high T and low Care dramatically different. Because the order parameter tocharacterize the state of the finite-sized RNA and proteinsis not unique we calculated the distribution of six quantities,which describe the structures at t = 0. For each of these orderparameters (see Figure 4A) we show the distributions of theorder parameters calculated from 100 independent conforma-tions from which folding is initiated. The panels shaded in yellowin Figure 4A correspond to a fixed high T and the lower panelsare for low C. The distribution functions P(Ree) and P(Rg) showthat the structures at low C are considerably more extendedthan the equilibrium structures at high T. Similarly, thesestructures are less nativelike than the counterparts generated at
high T (see P(ΔR) in Figure 4A). Because all the structures fromwhich folding commences are more compact at high T than atlow C the initial routes explored on time scales on the order of
Figure 4. Characterizing the unfolded ensemble and unfolding kinetics.(A) The ensemble of unfolded states are described by six orderparameters: end-to-end distance (Ree), Rg, root-mean square deviation(ΔR) from the native state, contact q-score (eq 3), structural overlapfunction χ (eq 4), respectively. The distribution functions are computedfrom the ensemble of 100 equilibrated conformations from which thefolding simulations are initiated. Yellow figures are the results at T = 400 Kand C = 0.1 mM, and those in white correspond to T = 250 K and C =0.001 mM. The unfolded states at lowC and highT are similar accordingto the Q, q-score, and χ. However, there are significant differencesbetween them according to the other three parameters indicating thatdifferent probes are likely to report distinct aspects of hTR. (B) Blue(red) corresponds to the fraction of molecules that remains folded(PF(t)) as a function of t following an increase in C (T). The fits can berepresented as PF(t)≈ e�(t)/(τU) where τU = 0.4 μs (blue) and τU = 1.4 μs(red). The inset shows swelling measured by Rg(t) following an increase inC (blue) and T (red).
20640 dx.doi.org/10.1021/ja2092823 |J. Am. Chem. Soc. 2011, 133, 20634–20643
Journal of the American Chemical Society ARTICLE
τC are different. These differences are clearly manifested in therates of hTR collapse (see Figure 3A). The detailed structuralattributes of hTR (see the right panels in Figure 4A) clearly showthat initial structures have very little resemblance to the foldedstate. It is clear from the distribution functions in Figure 4A thatthe initial structures at low C have much less overlap with thenative state than the high temperature structures.Kinetics of hTR Unfolding. To understand how hTR unfolds
we performed simulations by decreasing the ion concentrationand by raising the temperature. In both sets of simulations theinitial 100 structures are obtained from equilibrating the con-formations in the NBA. The fraction, PF(t), of molecules thatremains folded at time t following a sudden decrease in C orincrease in T is used to quantify the unfolding kinetics. In bothcases PF(t) can be fit using an exponential function (unfolding istwo-state-like) after a transient time (Figure 4B). The unfoldingrate is greater when C is suddenly decreased compared to thethermalmelting rate. The time constant for unfolding caused by adecrease in C is ∼0.2 μs, which is about 6 times faster than thetime for thermal melting (see caption in Figure 4B). The inset inFigure 4B shows that kinetics of swelling follow either an increaseinT (red) or decrease inC (blue). The overall swelling rate is alsogreater when C is decreased compared to when T is increased.Interestingly, the swelling rate occurs at a slower rate than loss ofnative contacts (see the inset in Figure 4B).Hidden States during Folding and Unfolding. Folding
simulations following a single jump in C show that there aretwo dominant pathways (Figure 2C). To quantify if there areadditional hidden states that are sampled as hTR folds or unfoldswe performed simulations by jumping the ion concentrationsfrom a low (high) to a high (low) value and interrupting thefolding (unfolding) at predetermined values of ΔτF. This strat-egy, which is easy to execute in simulations, is similar to the use ofion�pulses employed in a recent single-molecule study of RNaseP RNA.31 Repeated cycling between high and low C carried outmultiple times for a single molecule is equivalent to generating aswarm of trajectories and interrupting their folding at predeter-mined values of ΔτF. From a computational perspective it isefficient to generate a large number of trajectories and interrupttheir folding at varying ΔτF rather than subject one molecule tomultiple ion-pulses. For ergodic systems the two methods areequivalent. To illustrate the effect of using ion pulses (Figure 1A)we carried out a few simulations by periodically altering theconcentration of ions. An example of a trajectory, which reachesthe folded state (Q ≈ 1) in a single ion jump but unfoldssubsequently (Figure 1A), illustrates the heterogeneity of hTRfolding. In this example, after the first decrease in C the moleculeremains unfolded even after about 4 cycles of increase anddecrease in ion concentration even though it is folded after thefirst ion jump. Only in the finalC-jump is the native state reached.For each ΔτF, we generated a swarm of 100 trajectories from
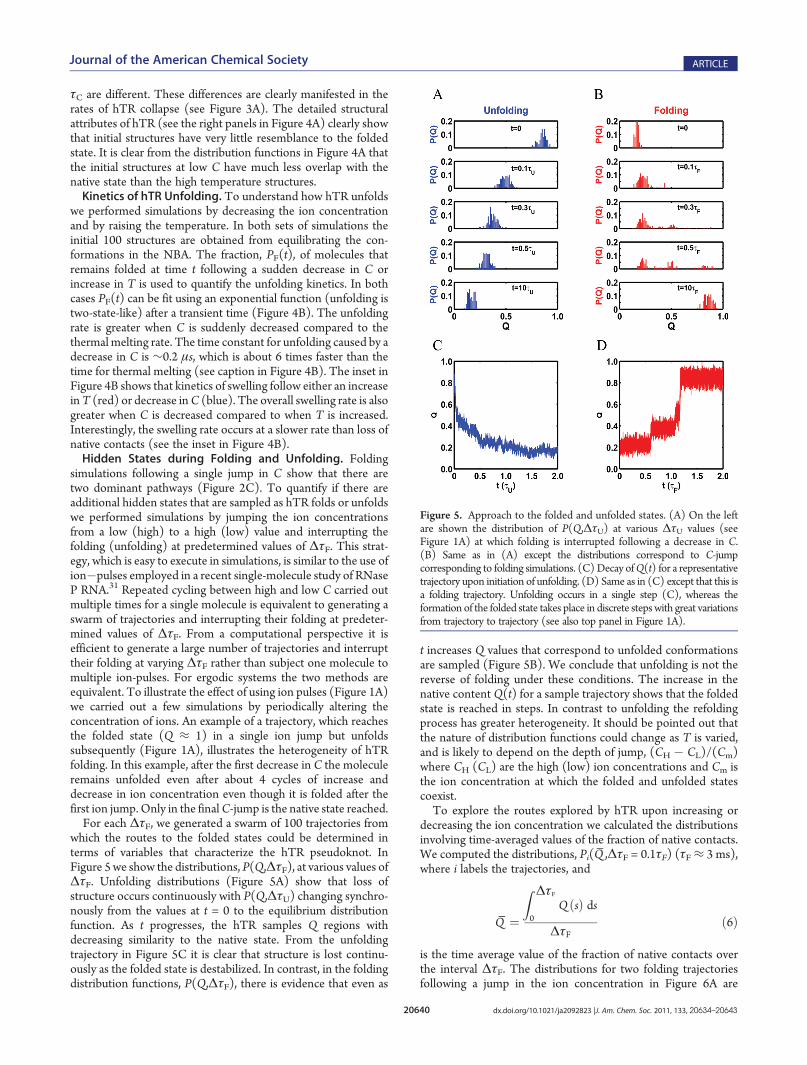
which the routes to the folded states could be determined interms of variables that characterize the hTR pseudoknot. InFigure 5we show the distributions, P(Q,ΔτF), at various values ofΔτF. Unfolding distributions (Figure 5A) show that loss ofstructure occurs continuously with P(Q,ΔτU) changing synchro-nously from the values at t = 0 to the equilibrium distributionfunction. As t progresses, the hTR samples Q regions withdecreasing similarity to the native state. From the unfoldingtrajectory in Figure 5C it is clear that structure is lost continu-ously as the folded state is destabilized. In contrast, in the foldingdistribution functions, P(Q,ΔτF), there is evidence that even as
t increases Q values that correspond to unfolded conformationsare sampled (Figure 5B). We conclude that unfolding is not thereverse of folding under these conditions. The increase in thenative content Q(t) for a sample trajectory shows that the foldedstate is reached in steps. In contrast to unfolding the refoldingprocess has greater heterogeneity. It should be pointed out thatthe nature of distribution functions could change as T is varied,and is likely to depend on the depth of jump, (CH � CL)/(Cm)where CH (CL) are the high (low) ion concentrations and Cm isthe ion concentration at which the folded and unfolded statescoexist.To explore the routes explored by hTR upon increasing or
decreasing the ion concentration we calculated the distributionsinvolving time-averaged values of the fraction of native contacts.We computed the distributions, Pi(Q̅ ,ΔτF = 0.1τF) (τF≈ 3 ms),where i labels the trajectories, and
Q̅ ¼
Z ΔτF
0Q ðsÞ ds
ΔτFð6Þ
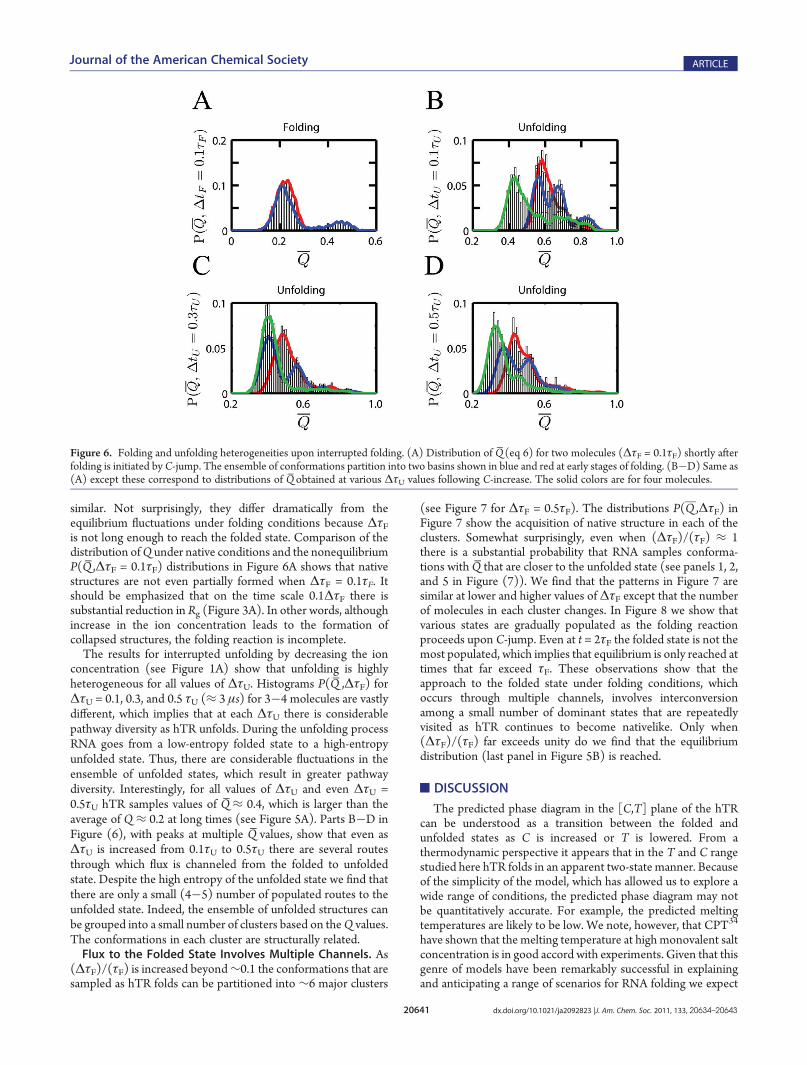
is the time average value of the fraction of native contacts overthe interval ΔτF. The distributions for two folding trajectoriesfollowing a jump in the ion concentration in Figure 6A are
Figure 5. Approach to the folded and unfolded states. (A) On the leftare shown the distribution of P(Q,ΔτU) at various ΔτU values (seeFigure 1A) at which folding is interrupted following a decrease in C.(B) Same as in (A) except the distributions correspond to C-jumpcorresponding to folding simulations. (C) Decay ofQ(t) for a representativetrajectory upon initiation of unfolding. (D) Same as in (C) except that this isa folding trajectory. Unfolding occurs in a single step (C), whereas theformation of the folded state takes place in discrete stepswith great variationsfrom trajectory to trajectory (see also top panel in Figure 1A).
20641 dx.doi.org/10.1021/ja2092823 |J. Am. Chem. Soc. 2011, 133, 20634–20643
Journal of the American Chemical Society ARTICLE
similar. Not surprisingly, they differ dramatically from theequilibrium fluctuations under folding conditions because ΔτFis not long enough to reach the folded state. Comparison of thedistribution ofQ under native conditions and the nonequilibriumP(Q̅ ,ΔτF = 0.1τF) distributions in Figure 6A shows that nativestructures are not even partially formed when ΔτF = 0.1τF. Itshould be emphasized that on the time scale 0.1ΔτF there issubstantial reduction in Rg (Figure 3A). In other words, althoughincrease in the ion concentration leads to the formation ofcollapsed structures, the folding reaction is incomplete.The results for interrupted unfolding by decreasing the ion
concentration (see Figure 1A) show that unfolding is highlyheterogeneous for all values of ΔτU. Histograms P(Q̅ ,ΔτF) forΔτU = 0.1, 0.3, and 0.5 τU (≈ 3 μs) for 3�4 molecules are vastlydifferent, which implies that at each ΔτU there is considerablepathway diversity as hTR unfolds. During the unfolding processRNA goes from a low-entropy folded state to a high-entropyunfolded state. Thus, there are considerable fluctuations in theensemble of unfolded states, which result in greater pathwaydiversity. Interestingly, for all values of ΔτU and even ΔτU =0.5τU hTR samples values of Q̅≈ 0.4, which is larger than theaverage of Q ≈ 0.2 at long times (see Figure 5A). Parts B�D inFigure (6), with peaks at multiple Q̅ values, show that even asΔτU is increased from 0.1τU to 0.5τU there are several routesthrough which flux is channeled from the folded to unfoldedstate. Despite the high entropy of the unfolded state we find thatthere are only a small (4�5) number of populated routes to theunfolded state. Indeed, the ensemble of unfolded structures canbe grouped into a small number of clusters based on theQ values.The conformations in each cluster are structurally related.Flux to the Folded State Involves Multiple Channels. As
(ΔτF)/(τF) is increased beyond∼0.1 the conformations that aresampled as hTR folds can be partitioned into ∼6 major clusters
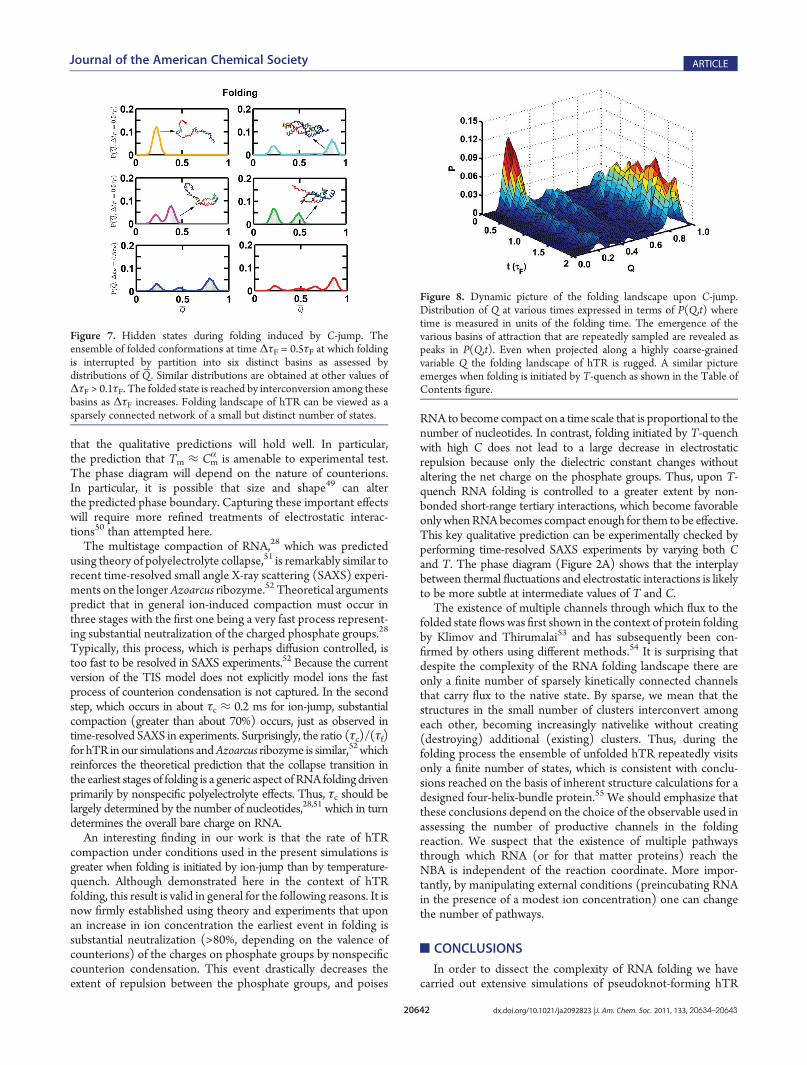
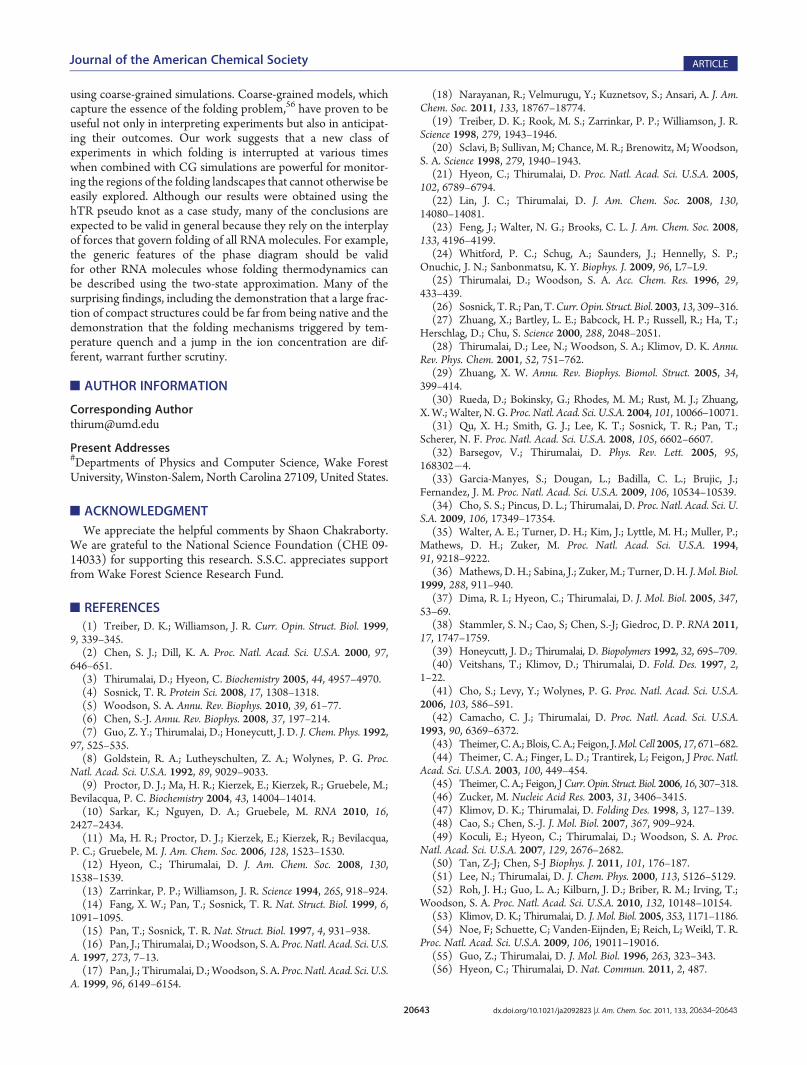
(see Figure 7 for ΔτF = 0.5τF). The distributions P(Q ,ΔτF) inFigure 7 show the acquisition of native structure in each of theclusters. Somewhat surprisingly, even when (ΔτF)/(τF) ≈ 1there is a substantial probability that RNA samples conforma-tions with Q̅ that are closer to the unfolded state (see panels 1, 2,and 5 in Figure (7)). We find that the patterns in Figure 7 aresimilar at lower and higher values ofΔτF except that the numberof molecules in each cluster changes. In Figure 8 we show thatvarious states are gradually populated as the folding reactionproceeds upon C-jump. Even at t = 2τF the folded state is not themost populated, which implies that equilibrium is only reached attimes that far exceed τF. These observations show that theapproach to the folded state under folding conditions, whichoccurs through multiple channels, involves interconversionamong a small number of dominant states that are repeatedlyvisited as hTR continues to become nativelike. Only when(ΔτF)/(τF) far exceeds unity do we find that the equilibriumdistribution (last panel in Figure 5B) is reached.
’DISCUSSION
The predicted phase diagram in the [C,T] plane of the hTRcan be understood as a transition between the folded andunfolded states as C is increased or T is lowered. From athermodynamic perspective it appears that in the T and C rangestudied here hTR folds in an apparent two-state manner. Becauseof the simplicity of the model, which has allowed us to explore awide range of conditions, the predicted phase diagram may notbe quantitatively accurate. For example, the predicted meltingtemperatures are likely to be low. We note, however, that CPT34
have shown that the melting temperature at high monovalent saltconcentration is in good accord with experiments. Given that thisgenre of models have been remarkably successful in explainingand anticipating a range of scenarios for RNA folding we expect
Figure 6. Folding and unfolding heterogeneities upon interrupted folding. (A) Distribution of Q̅(eq 6) for two molecules (ΔτF = 0.1τF) shortly afterfolding is initiated by C-jump. The ensemble of conformations partition into two basins shown in blue and red at early stages of folding. (B�D) Same as(A) except these correspond to distributions of Q̅ obtained at various ΔτU values following C-increase. The solid colors are for four molecules.
20642 dx.doi.org/10.1021/ja2092823 |J. Am. Chem. Soc. 2011, 133, 20634–20643
Journal of the American Chemical Society ARTICLE
that the qualitative predictions will hold well. In particular,the prediction that Tm ≈ Cm
α is amenable to experimental test.The phase diagram will depend on the nature of counterions.In particular, it is possible that size and shape49 can alterthe predicted phase boundary. Capturing these important effectswill require more refined treatments of electrostatic interac-tions50 than attempted here.
The multistage compaction of RNA,28 which was predictedusing theory of polyelectrolyte collapse,51 is remarkably similar torecent time-resolved small angle X-ray scattering (SAXS) experi-ments on the longerAzoarcus ribozyme.52 Theoretical argumentspredict that in general ion-induced compaction must occur inthree stages with the first one being a very fast process represent-ing substantial neutralization of the charged phosphate groups.28
Typically, this process, which is perhaps diffusion controlled, istoo fast to be resolved in SAXS experiments.52 Because the currentversion of the TIS model does not explicitly model ions the fastprocess of counterion condensation is not captured. In the secondstep, which occurs in about τc ≈ 0.2 ms for ion-jump, substantialcompaction (greater than about 70%) occurs, just as observed intime-resolved SAXS in experiments. Surprisingly, the ratio (τc)/(τf)for hTR in our simulations andAzoarcus ribozyme is similar,52whichreinforces the theoretical prediction that the collapse transition inthe earliest stages of folding is a generic aspect of RNA folding drivenprimarily by nonspecific polyelectrolyte effects. Thus, τc should belargely determined by the number of nucleotides,28,51 which in turndetermines the overall bare charge on RNA.
An interesting finding in our work is that the rate of hTRcompaction under conditions used in the present simulations isgreater when folding is initiated by ion-jump than by temperature-quench. Although demonstrated here in the context of hTRfolding, this result is valid in general for the following reasons. It isnow firmly established using theory and experiments that uponan increase in ion concentration the earliest event in folding issubstantial neutralization (>80%, depending on the valence ofcounterions) of the charges on phosphate groups by nonspecificcounterion condensation. This event drastically decreases theextent of repulsion between the phosphate groups, and poises
RNA to become compact on a time scale that is proportional to thenumber of nucleotides. In contrast, folding initiated by T-quenchwith high C does not lead to a large decrease in electrostaticrepulsion because only the dielectric constant changes withoutaltering the net charge on the phosphate groups. Thus, upon T-quench RNA folding is controlled to a greater extent by non-bonded short-range tertiary interactions, which become favorableonly whenRNAbecomes compact enough for them to be effective.This key qualitative prediction can be experimentally checked byperforming time-resolved SAXS experiments by varying both Cand T. The phase diagram (Figure 2A) shows that the interplaybetween thermal fluctuations and electrostatic interactions is likelyto be more subtle at intermediate values of T and C.
The existence of multiple channels through which flux to thefolded state flows was first shown in the context of protein foldingby Klimov and Thirumalai53 and has subsequently been con-firmed by others using different methods.54 It is surprising thatdespite the complexity of the RNA folding landscape there areonly a finite number of sparsely kinetically connected channelsthat carry flux to the native state. By sparse, we mean that thestructures in the small number of clusters interconvert amongeach other, becoming increasingly nativelike without creating(destroying) additional (existing) clusters. Thus, during thefolding process the ensemble of unfolded hTR repeatedly visitsonly a finite number of states, which is consistent with conclu-sions reached on the basis of inherent structure calculations for adesigned four-helix-bundle protein.55 We should emphasize thatthese conclusions depend on the choice of the observable used inassessing the number of productive channels in the foldingreaction. We suspect that the existence of multiple pathwaysthrough which RNA (or for that matter proteins) reach theNBA is independent of the reaction coordinate. More impor-tantly, by manipulating external conditions (preincubating RNAin the presence of a modest ion concentration) one can changethe number of pathways.
’CONCLUSIONS
In order to dissect the complexity of RNA folding we havecarried out extensive simulations of pseudoknot-forming hTR
Figure 8. Dynamic picture of the folding landscape upon C-jump.Distribution of Q at various times expressed in terms of P(Q,t) wheretime is measured in units of the folding time. The emergence of thevarious basins of attraction that are repeatedly sampled are revealed aspeaks in P(Q,t). Even when projected along a highly coarse-grainedvariable Q the folding landscape of hTR is rugged. A similar pictureemerges when folding is initiated by T-quench as shown in the Table ofContents figure.
Figure 7. Hidden states during folding induced by C-jump. Theensemble of folded conformations at time ΔτF = 0.5τF at which foldingis interrupted by partition into six distinct basins as assessed bydistributions of Q̅. Similar distributions are obtained at other values ofΔτF > 0.1τF. The folded state is reached by interconversion among thesebasins as ΔτF increases. Folding landscape of hTR can be viewed as asparsely connected network of a small but distinct number of states.
20643 dx.doi.org/10.1021/ja2092823 |J. Am. Chem. Soc. 2011, 133, 20634–20643
Journal of the American Chemical Society ARTICLE
using coarse-grained simulations. Coarse-grained models, whichcapture the essence of the folding problem,56 have proven to beuseful not only in interpreting experiments but also in anticipat-ing their outcomes. Our work suggests that a new class ofexperiments in which folding is interrupted at various timeswhen combined with CG simulations are powerful for monitor-ing the regions of the folding landscapes that cannot otherwise beeasily explored. Although our results were obtained using thehTR pseudo knot as a case study, many of the conclusions areexpected to be valid in general because they rely on the interplayof forces that govern folding of all RNA molecules. For example,the generic features of the phase diagram should be validfor other RNA molecules whose folding thermodynamics canbe described using the two-state approximation. Many of thesurprising findings, including the demonstration that a large frac-tion of compact structures could be far from being native and thedemonstration that the folding mechanisms triggered by tem-perature quench and a jump in the ion concentration are dif-ferent, warrant further scrutiny.
’AUTHOR INFORMATION
Corresponding [email protected]
Present Addresses#Departments of Physics and Computer Science, Wake ForestUniversity, Winston-Salem, North Carolina 27109, United States.
’ACKNOWLEDGMENT
We appreciate the helpful comments by Shaon Chakraborty.We are grateful to the National Science Foundation (CHE 09-14033) for supporting this research. S.S.C. appreciates supportfrom Wake Forest Science Research Fund.
’REFERENCES
(1) Treiber, D. K.; Williamson, J. R. Curr. Opin. Struct. Biol. 1999,9, 339–345.(2) Chen, S. J.; Dill, K. A. Proc. Natl. Acad. Sci. U.S.A. 2000, 97,
646–651.(3) Thirumalai, D.; Hyeon, C. Biochemistry 2005, 44, 4957–4970.(4) Sosnick, T. R. Protein Sci. 2008, 17, 1308–1318.(5) Woodson, S. A. Annu. Rev. Biophys. 2010, 39, 61–77.(6) Chen, S.-J. Annu. Rev. Biophys. 2008, 37, 197–214.(7) Guo, Z. Y.; Thirumalai, D.; Honeycutt, J. D. J. Chem. Phys. 1992,
97, 525–535.(8) Goldstein, R. A.; Lutheyschulten, Z. A.; Wolynes, P. G. Proc.
Natl. Acad. Sci. U.S.A. 1992, 89, 9029–9033.(9) Proctor, D. J.; Ma, H. R.; Kierzek, E.; Kierzek, R.; Gruebele, M.;
Bevilacqua, P. C. Biochemistry 2004, 43, 14004–14014.(10) Sarkar, K.; Nguyen, D. A.; Gruebele, M. RNA 2010, 16,
2427–2434.(11) Ma, H. R.; Proctor, D. J.; Kierzek, E.; Kierzek, R.; Bevilacqua,
P. C.; Gruebele, M. J. Am. Chem. Soc. 2006, 128, 1523–1530.(12) Hyeon, C.; Thirumalai, D. J. Am. Chem. Soc. 2008, 130,
1538–1539.(13) Zarrinkar, P. P.; Williamson, J. R. Science 1994, 265, 918–924.(14) Fang, X. W.; Pan, T.; Sosnick, T. R. Nat. Struct. Biol. 1999, 6,
1091–1095.(15) Pan, T.; Sosnick, T. R. Nat. Struct. Biol. 1997, 4, 931–938.(16) Pan, J.; Thirumalai, D.;Woodson, S. A. Proc. Natl. Acad. Sci. U.S.
A. 1997, 273, 7–13.(17) Pan, J.; Thirumalai, D.;Woodson, S. A. Proc. Natl. Acad. Sci. U.S.
A. 1999, 96, 6149–6154.
(18) Narayanan, R.; Velmurugu, Y.; Kuznetsov, S.; Ansari, A. J. Am.Chem. Soc. 2011, 133, 18767–18774.
(19) Treiber, D. K.; Rook, M. S.; Zarrinkar, P. P.; Williamson, J. R.Science 1998, 279, 1943–1946.
(20) Sclavi, B; Sullivan, M; Chance, M. R.; Brenowitz, M; Woodson,S. A. Science 1998, 279, 1940–1943.
(21) Hyeon, C.; Thirumalai, D. Proc. Natl. Acad. Sci. U.S.A. 2005,102, 6789–6794.
(22) Lin, J. C.; Thirumalai, D. J. Am. Chem. Soc. 2008, 130,14080–14081.
(23) Feng, J.; Walter, N. G.; Brooks, C. L. J. Am. Chem. Soc. 2008,133, 4196–4199.
(24) Whitford, P. C.; Schug, A.; Saunders, J.; Hennelly, S. P.;Onuchic, J. N.; Sanbonmatsu, K. Y. Biophys. J. 2009, 96, L7–L9.
(25) Thirumalai, D.; Woodson, S. A. Acc. Chem. Res. 1996, 29,433–439.
(26) Sosnick, T. R.; Pan, T.Curr. Opin. Struct. Biol. 2003, 13, 309–316.(27) Zhuang, X.; Bartley, L. E.; Babcock, H. P.; Russell, R.; Ha, T.;
Herschlag, D.; Chu, S. Science 2000, 288, 2048–2051.(28) Thirumalai, D.; Lee, N.; Woodson, S. A.; Klimov, D. K. Annu.
Rev. Phys. Chem. 2001, 52, 751–762.(29) Zhuang, X. W. Annu. Rev. Biophys. Biomol. Struct. 2005, 34,
399–414.(30) Rueda, D.; Bokinsky, G.; Rhodes, M. M.; Rust, M. J.; Zhuang,
X. W.; Walter, N. G. Proc. Natl. Acad. Sci. U.S.A. 2004, 101, 10066–10071.(31) Qu, X. H.; Smith, G. J.; Lee, K. T.; Sosnick, T. R.; Pan, T.;
Scherer, N. F. Proc. Natl. Acad. Sci. U.S.A. 2008, 105, 6602–6607.(32) Barsegov, V.; Thirumalai, D. Phys. Rev. Lett. 2005, 95,
168302�4.(33) Garcia-Manyes, S.; Dougan, L.; Badilla, C. L.; Brujic, J.;
Fernandez, J. M. Proc. Natl. Acad. Sci. U.S.A. 2009, 106, 10534–10539.(34) Cho, S. S.; Pincus, D. L.; Thirumalai, D. Proc. Natl. Acad. Sci. U.
S.A. 2009, 106, 17349–17354.(35) Walter, A. E.; Turner, D. H.; Kim, J.; Lyttle, M. H.; Muller, P.;
Mathews, D. H.; Zuker, M. Proc. Natl. Acad. Sci. U.S.A. 1994,91, 9218–9222.
(36) Mathews, D. H.; Sabina, J.; Zuker, M.; Turner, D. H. J. Mol. Biol.1999, 288, 911–940.
(37) Dima, R. I.; Hyeon, C.; Thirumalai, D. J. Mol. Biol. 2005, 347,53–69.
(38) Stammler, S. N.; Cao, S; Chen, S.-J; Giedroc, D. P. RNA 2011,17, 1747–1759.
(39) Honeycutt, J. D.; Thirumalai, D. Biopolymers 1992, 32, 695–709.(40) Veitshans, T.; Klimov, D.; Thirumalai, D. Fold. Des. 1997, 2,
1–22.(41) Cho, S.; Levy, Y.; Wolynes, P. G. Proc. Natl. Acad. Sci. U.S.A.
2006, 103, 586–591.(42) Camacho, C. J.; Thirumalai, D. Proc. Natl. Acad. Sci. U.S.A.
1993, 90, 6369–6372.(43) Theimer,C. A.; Blois, C. A.; Feigon, J.Mol. Cell2005, 17, 671–682.(44) Theimer, C. A.; Finger, L. D.; Trantirek, L; Feigon, J Proc. Natl.
Acad. Sci. U.S.A. 2003, 100, 449–454.(45) Theimer, C. A.; Feigon, JCurr. Opin. Struct. Biol. 2006, 16, 307–318.(46) Zucker, M. Nucleic Acid Res. 2003, 31, 3406–3415.(47) Klimov, D. K.; Thirumalai, D. Folding Des. 1998, 3, 127–139.(48) Cao, S.; Chen, S.-J. J. Mol. Biol. 2007, 367, 909–924.(49) Koculi, E.; Hyeon, C.; Thirumalai, D.; Woodson, S. A. Proc.
Natl. Acad. Sci. U.S.A. 2007, 129, 2676–2682.(50) Tan, Z-J; Chen, S-J Biophys. J. 2011, 101, 176–187.(51) Lee, N.; Thirumalai, D. J. Chem. Phys. 2000, 113, 5126–5129.(52) Roh, J. H.; Guo, L. A.; Kilburn, J. D.; Briber, R. M.; Irving, T.;
Woodson, S. A. Proc. Natl. Acad. Sci. U.S.A. 2010, 132, 10148–10154.(53) Klimov, D. K.; Thirumalai, D. J. Mol. Biol. 2005, 353, 1171–1186.(54) Noe, F; Schuette, C; Vanden-Eijnden, E; Reich, L; Weikl, T. R.
Proc. Natl. Acad. Sci. U.S.A. 2009, 106, 19011–19016.(55) Guo, Z.; Thirumalai, D. J. Mol. Biol. 1996, 263, 323–343.(56) Hyeon, C.; Thirumalai, D. Nat. Commun. 2011, 2, 487.