Embed Size (px)
Citation preview
©Smithers Information Ltd. 2016
287Cellular Polymers, Vol. 35, No. 6, 2016
Foamed Polyurethane Composites With Different Types of Ash – Morphological, Mechanical and Thermal Behavior Assessments
Foamed Polyurethane Composites With Different Types of Ash – Morphological, Mechanical and Thermal Behavior Assessments
Aleksander Hejna1*, Milena Kopczyńska1, Urszula Kozłowska1, Marek Klein2, Paulina Kosmela1, and Łukasz Piszczyk1
1Department of Polymer Technology, Chemical Faculty, Gdansk University of Technology, G. Narutowicza 11/12, 80-233 Gdańsk, Poland2Renewable Energy Department, The Szewalski Institute of Fluid-Flow Machinery, Polish Academy of Sciences, Fiszera 14, 80-231 Gdańsk, Poland
Received: 16 November 2015, Accepted: 1 February 2016
SummARy
Incorporation of two types of ash particles into flexible polyurethane foams has been investigated, wood ash from gasification process and fly ash resulting from coal burning in power plant. Samples were modified with 5, 10 and 15 wt% of fillers. Structure, mechanical and thermal properties of obtained foams were investigated. Incorporation of both types of ash particles resulted in materials showing satisfactory mechanical properties, simultaneously decreasing their density. Addition of fly ash inhibited noticeably thermal degradation of material, because of the thermal insulation effect of gas trapped in the spherical ash particles. Results of research show that fly ash can be successfully used as a modifier of thermal properties in polyurethane foams, enhancing the economical aspect of the production through the decrease of material’s density and incorporation of low cost filler.
Keywords: Flexible polyurethane foam, Wood ash, Fly ash, Mechanical properties, Thermal properties, Polymer-matrix composite
INTRODuCTION
Fly ash (FA) is one of the residues generated during combustion of coal in power-plants. Fine particles of ash are removed from the boiler by the stream
*Corresponding author’s e-mail address: [email protected]
288 Cellular Polymers, Vol. 35, No. 6, 2016
A. Hejna, M. Kopczyńska, U. Kozłowska, M. Klein, P. Kosmela, and Ł. Piszczyk
of flue gases and subsequently captured by electrostatic precipitators or different types of filters, before reaching the chimneys. Depending on the exact composition and source of coal subjected to combustion, composition of fly ash can vary considerably, however all types of fly ash include significant amounts of silicon dioxide (SiO2, in both amorphous and crystalline form), aluminium oxide (Al2O3), calcium oxide (CaO) and iron oxide (Fe2O3). In trace concentrations, fly ash can also contain arsenic, beryllium, boron, cadmium, chromium, cobalt, lead, manganese, mercury, molybdenum, selenium, strontium, thallium or vanadium [1].
Fly ash is considered a waste material, however its disposal can cause, harmful for humans and animal, pollution of air, land and water. That is why, there have been conducted intense research aimed to establish economically and environmentally justified methods of fly ash recycling. FA is commonly used to produce concrete, as a substitute for Portland cement. Such way significantly reduce the greenhouse gas footprint of concrete, but also may improve concrete properties, such as durability or chemical resistance [2, 3]. Other potential uses of fly ash include applications in construction industry, such as road sub-base [4] or light weight aggregate [5, 6]; synthesis of zeolites [7, 8]; or production of adsorbents for the removal of different chemical compounds such as organic gases [9], heavy metals [10, 11], dyes [12, 13], mercury [14, 15], nitrogen and sulfur oxides [16, 17] and other pollutants [18, 19]. The adsorption capacity of fly ash might be noticeably increased by the surface activation. Moreover, FA can be used as fertilizer, noticeably increasing the yield of certain crops.
Although all applications of fly ash mentioned above are becoming more and more popular, current global utilization of fly ash does not exceed 20%. Thermal power plants are the main producers of energy in many countries all over the world. Only in India, around 110 million tons of fly ash is generated annually [20]. Global production of fly ash exceeded 500 million tons at the turn of the centuries [21]. Basically, FA can be considered as the world’s fifth largest raw material resource [22]. That is why researchers are still seeking for another potential applications of fly ash. One of the possibilities is to incorporate it as a filler for polymer matrix composites, which would allow the saving of other, more expensive, fillers used nowadays in polymer industry. Fly ash particles contain well developed surface, with different polar groups attached, which creates a possibility for various modifications enhancing matrix-filler interactions and simultaneously properties of composites [20].
Fly ash has been repeatedly proven to be excellent modifier of different polymeric materials, such as thermoplastic starch [23], polyolefins [24], epoxy resins [25, 26], poly(vinyl alcohol) [27] or polyetheretherketone [28]. Other types of ash, such as rice husk ash [29, 30] or wood ash [31] have been reported as a
289Cellular Polymers, Vol. 35, No. 6, 2016
Foamed Polyurethane Composites With Different Types of Ash – Morphological, Mechanical and Thermal Behavior Assessments
modifiers for polymeric materials. Nevertheless, there are hardly any reports of incorporation of ash fillers into flexible polyurethane foams.
The following article describes the work carried out on the use of fly ash and wood ash, obtained after the gasification of wood, in flexible polyurethane foams. In the experimental study, both types of ash were characterized and incorporated into foamed PU matrix. The morphology, physical, mechanical and thermal properties of polyurethane composites containing 5, 10 and 15 wt% of two types of ash were investigated and compared.
EXPERImENTAL
Materials
Polyurethanes were synthesized from commercially available polyurethane system consisting of SPECFLEX® NF 706 polyol and SPECFLEX® NE 134 isocyanate, acquired from M. B. Market Ltd. (Poland). The densities of used components at 25°C equal 1.03 and 1.21 g/cm3 respectively, while their viscosity values at 25°C equal 1500 and 75 mPa·s. According to manufacturer, applied polyurethane system is recommended for the production of highly flexible, formed polyurethane foams.
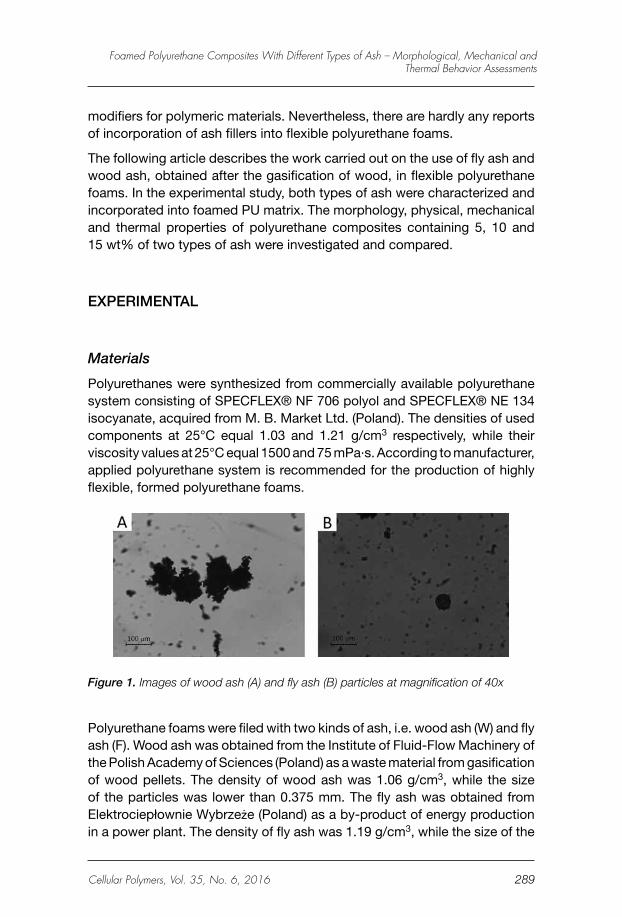
Figure 1. Images of wood ash (A) and fly ash (B) particles at magnification of 40x
Polyurethane foams were filed with two kinds of ash, i.e. wood ash (W) and fly ash (F). Wood ash was obtained from the Institute of Fluid-Flow Machinery of the Polish Academy of Sciences (Poland) as a waste material from gasification of wood pellets. The density of wood ash was 1.06 g/cm3, while the size of the particles was lower than 0.375 mm. The fly ash was obtained from Elektrociepłownie Wybrzeże (Poland) as a by-product of energy production in a power plant. The density of fly ash was 1.19 g/cm3, while the size of the
290 Cellular Polymers, Vol. 35, No. 6, 2016
A. Hejna, M. Kopczyńska, U. Kozłowska, M. Klein, P. Kosmela, and Ł. Piszczyk
particles was lower than 0.200 mm. Chemical composition of used ashes, determined by XRF analysis, is presented in Table 1. Images of used ash particles from optical microscope are shown in the Figure 1.
Table 1. Major components of wood ash and fly ashWood ash Fly ash
Component Content Component Content
CaO 25.99 % SiO2 33.91 %
K2O 20.78 % Al2O3 19.07 %
MgO 4.33 % CaO 6.31 %
SiO2 2.98 % Fe2O3 5.00 %
P2O5 2.35 % Na2O 1.33 %
MnO 2.16 % K2O 1.27 %
Fe2O3 1.55 % TiO2 1.25 %
Al2O3 0.81 % MgO 0.98 %
SrO 0.08 % SrO 0.22 %
Polyurethane Synthesis
Polyurethane foams were produced in a laboratory scale by a single-step method. Predetermined amounts of polyol and isocyanate were mixed at 100:60 mass ratio for 10 s at 1800 rpm. In case of modified foams, incorporated fillers were previously mixed with polyol component for 2 minutes at 1800 rpm. The resulting mixture was poured into closed metal mold with dimensions of 200 x 100 x 40 mm. After demolding, the samples were held at 60°C for 24 hours and conditioned at room temperature for another 24 hours. Table 2 contains the details of foam formulations.
Table 2. The composition of reaction mixturesComponent Foam symbol
P0 P1 P2 P3 P4 P5 P6
Component content, wt. %
Polyol 62.50 59.38 56.25 53.13 59.38 56.25 53.13
Isocyanate 37.50 35.62 33.75 31.87 35.62 33.75 31.87
Wood ash - 5.00 10.00 15.00 - - -
Fly ash - - - - 5.00 10.00 15.00
Characterization
After seasoning, polyurethanes were cut into samples whose properties were later determined in accordance with the standard procedures.
291Cellular Polymers, Vol. 35, No. 6, 2016
Foamed Polyurethane Composites With Different Types of Ash – Morphological, Mechanical and Thermal Behavior Assessments
FT-IR spectrophotometric analysis was performed in order to determine the structure of the produced polymers. The analysis was performed at a resolution of 4 cm-1 using a Nicolet 8700 apparatus (Thermo Electron Corporation) equipped with a snap-Gold State II which allows for making measurements in the reflection configuration mode.
The cellular morphology of polyurethanes was investigated with a Philips-FEI XL 30 Environmental Scanning Electron Microscope (ESEM) using an acceleration of 25 kV. Samples were cut at room temperature, while the observations were performed in wet mode. The morphology of applied fillers was analyzed with a Opta Tech MP-350 optical microscope with bright-field illumination. Images were analyzed with ImageJ computer software in order to measure the size of cells and filler particles.
The apparent density of samples was calculated in accordance with PN-EN ISO 845: 2000, as a ratio of the sample weight to the sample volume (g/cm3). The cube-shaped samples were measured with a slide calliper with an accuracy of 0.1 mm and weighed using electronic analytical balance with an accuracy of 0.0001 g.
The compressive strength of foams was estimated in accordance with PN–EN ISO 604:2006. The cube-shaped samples with dimensions of 50 x 50 x 50 mm were measured with a slide calliper with an accuracy of 0.1 mm. The compression test was performed on a Zwick/Roell tensile tester at a constant speed of 10 mm/min until reaching 40% deformation.
The tensile strength of microporous polyurethane elastomers was estimated in accordance with PN–EN ISO 1798. The beam-shaped samples with dimensions of 10 x 10 x 100 mm were measured with a slide calliper with an accuracy of 0.1 mm. The tensile test was performed on a Zwick/Roell tensile tester at a constant speed of 500 mm/min.
Dynamical mechanical analysis (DMA) was performed by means of a Q800 DMA instrument (TA Instruments) at a heating rate of 4ºC/min and the temperature range from -100 to 150°C. Samples were cylindrical-shaped, with thickness of 10 mm and diameter of 12 mm.
Differential scanning calorimetry (DSC) measurements were made using a DSC 204 F1 Phoenix apparatus under nitrogen atmosphere. The samples of 3-10 mg were encapsulated and heated/cooled at a rate of 20°C/min in the temperature range from -80 to 160°C.
In order to evaluate the thermal stability of materials, thermogravimetric analysis (TGA) was performed on 5 mg samples by means of a SDT Q600 apparatus (TA Instruments) under nitrogen atmosphere (100 mL/min) in the temperature range from 50 to 800°C and at a heating rate of 10°C/min.
292 Cellular Polymers, Vol. 35, No. 6, 2016
A. Hejna, M. Kopczyńska, U. Kozłowska, M. Klein, P. Kosmela, and Ł. Piszczyk
RESuLTS AND DISCuSSION
Structure and Physico-mechanical Properties
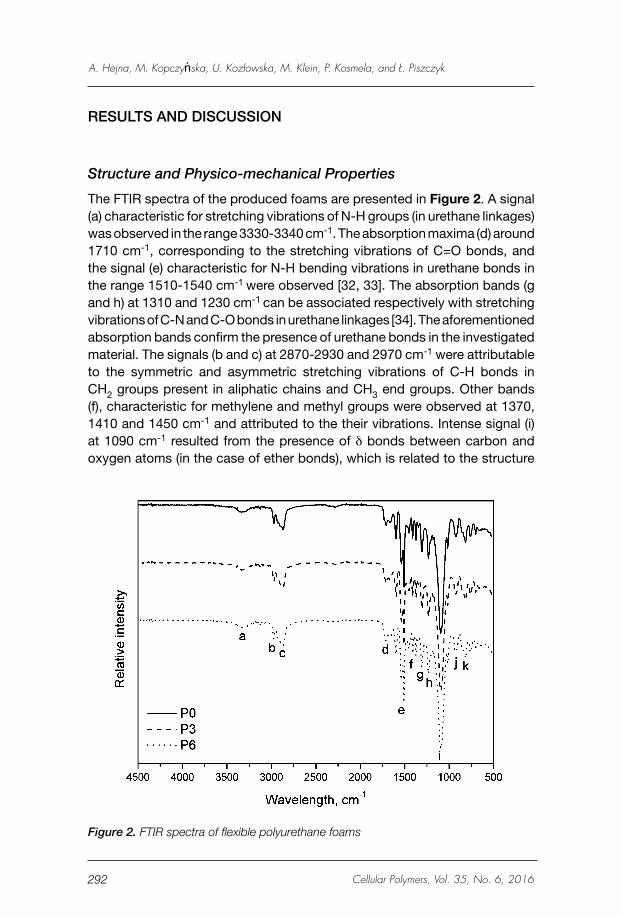
The FTIR spectra of the produced foams are presented in Figure 2. A signal (a) characteristic for stretching vibrations of N-H groups (in urethane linkages) was observed in the range 3330-3340 cm-1. The absorption maxima (d) around 1710 cm-1, corresponding to the stretching vibrations of C=O bonds, and the signal (e) characteristic for N-H bending vibrations in urethane bonds in the range 1510-1540 cm-1 were observed [32, 33]. The absorption bands (g and h) at 1310 and 1230 cm-1 can be associated respectively with stretching vibrations of C-N and C-O bonds in urethane linkages [34]. The aforementioned absorption bands confirm the presence of urethane bonds in the investigated material. The signals (b and c) at 2870-2930 and 2970 cm-1 were attributable to the symmetric and asymmetric stretching vibrations of C-H bonds in CH2 groups present in aliphatic chains and CH3 end groups. Other bands (f), characteristic for methylene and methyl groups were observed at 1370, 1410 and 1450 cm-1 and attributed to the their vibrations. Intense signal (i) at 1090 cm-1 resulted from the presence of δ bonds between carbon and oxygen atoms (in the case of ether bonds), which is related to the structure
Figure 2. FTIR spectra of flexible polyurethane foams
293Cellular Polymers, Vol. 35, No. 6, 2016
Foamed Polyurethane Composites With Different Types of Ash – Morphological, Mechanical and Thermal Behavior Assessments
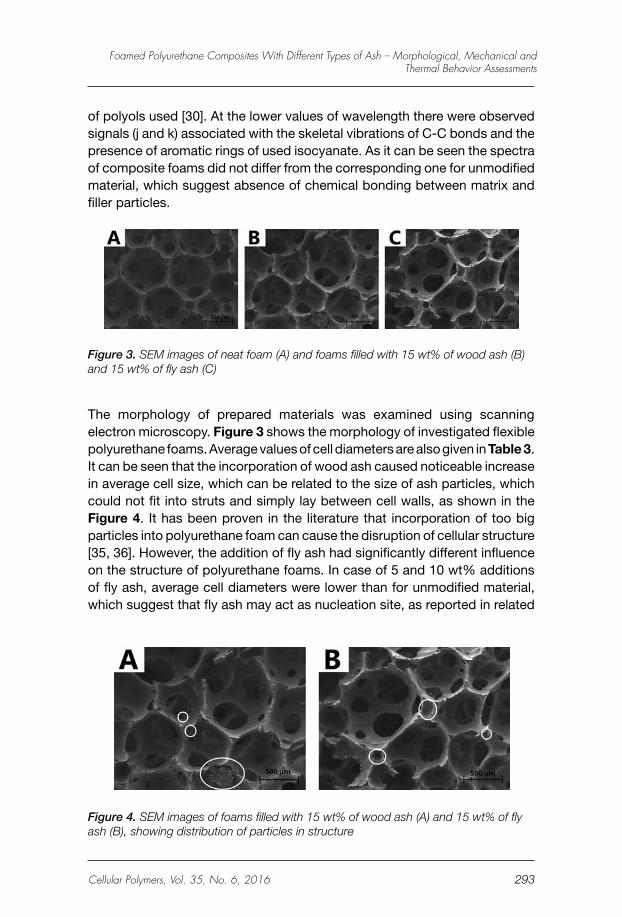
of polyols used [30]. At the lower values of wavelength there were observed signals (j and k) associated with the skeletal vibrations of C-C bonds and the presence of aromatic rings of used isocyanate. As it can be seen the spectra of composite foams did not differ from the corresponding one for unmodified material, which suggest absence of chemical bonding between matrix and filler particles.
Figure 3. SEM images of neat foam (A) and foams filled with 15 wt% of wood ash (B) and 15 wt% of fly ash (C)
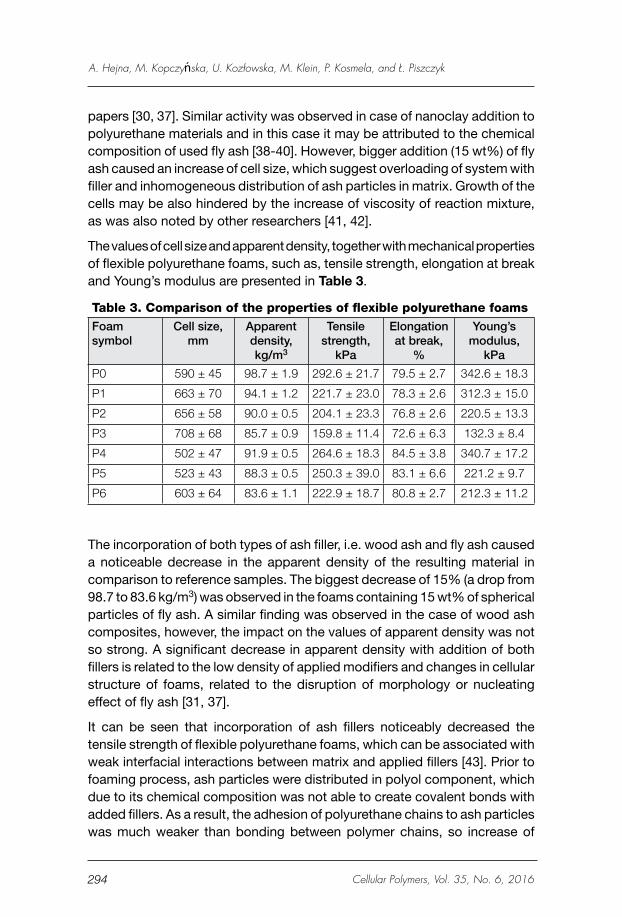
The morphology of prepared materials was examined using scanning electron microscopy. Figure 3 shows the morphology of investigated flexible polyurethane foams. Average values of cell diameters are also given in Table 3. It can be seen that the incorporation of wood ash caused noticeable increase in average cell size, which can be related to the size of ash particles, which could not fit into struts and simply lay between cell walls, as shown in the Figure 4. It has been proven in the literature that incorporation of too big particles into polyurethane foam can cause the disruption of cellular structure [35, 36]. However, the addition of fly ash had significantly different influence on the structure of polyurethane foams. In case of 5 and 10 wt% additions of fly ash, average cell diameters were lower than for unmodified material, which suggest that fly ash may act as nucleation site, as reported in related
Figure 4. SEM images of foams filled with 15 wt% of wood ash (A) and 15 wt% of fly ash (B), showing distribution of particles in structure
294 Cellular Polymers, Vol. 35, No. 6, 2016
A. Hejna, M. Kopczyńska, U. Kozłowska, M. Klein, P. Kosmela, and Ł. Piszczyk
papers [30, 37]. Similar activity was observed in case of nanoclay addition to polyurethane materials and in this case it may be attributed to the chemical composition of used fly ash [38-40]. However, bigger addition (15 wt%) of fly ash caused an increase of cell size, which suggest overloading of system with filler and inhomogeneous distribution of ash particles in matrix. Growth of the cells may be also hindered by the increase of viscosity of reaction mixture, as was also noted by other researchers [41, 42].
The values of cell size and apparent density, together with mechanical properties of flexible polyurethane foams, such as, tensile strength, elongation at break and Young’s modulus are presented in Table 3.
Table 3. Comparison of the properties of flexible polyurethane foamsFoam symbol
Cell size, mm
Apparent density, kg/m3
Tensile strength,
kPa
Elongation at break,
%
young’s modulus,
kPa
P0 590 ± 45 98.7 ± 1.9 292.6 ± 21.7 79.5 ± 2.7 342.6 ± 18.3
P1 663 ± 70 94.1 ± 1.2 221.7 ± 23.0 78.3 ± 2.6 312.3 ± 15.0
P2 656 ± 58 90.0 ± 0.5 204.1 ± 23.3 76.8 ± 2.6 220.5 ± 13.3
P3 708 ± 68 85.7 ± 0.9 159.8 ± 11.4 72.6 ± 6.3 132.3 ± 8.4
P4 502 ± 47 91.9 ± 0.5 264.6 ± 18.3 84.5 ± 3.8 340.7 ± 17.2
P5 523 ± 43 88.3 ± 0.5 250.3 ± 39.0 83.1 ± 6.6 221.2 ± 9.7
P6 603 ± 64 83.6 ± 1.1 222.9 ± 18.7 80.8 ± 2.7 212.3 ± 11.2
The incorporation of both types of ash filler, i.e. wood ash and fly ash caused a noticeable decrease in the apparent density of the resulting material in comparison to reference samples. The biggest decrease of 15% (a drop from 98.7 to 83.6 kg/m3) was observed in the foams containing 15 wt% of spherical particles of fly ash. A similar finding was observed in the case of wood ash composites, however, the impact on the values of apparent density was not so strong. A significant decrease in apparent density with addition of both fillers is related to the low density of applied modifiers and changes in cellular structure of foams, related to the disruption of morphology or nucleating effect of fly ash [31, 37].
It can be seen that incorporation of ash fillers noticeably decreased the tensile strength of flexible polyurethane foams, which can be associated with weak interfacial interactions between matrix and applied fillers [43]. Prior to foaming process, ash particles were distributed in polyol component, which due to its chemical composition was not able to create covalent bonds with added fillers. As a result, the adhesion of polyurethane chains to ash particles was much weaker than bonding between polymer chains, so increase of
295Cellular Polymers, Vol. 35, No. 6, 2016
Foamed Polyurethane Composites With Different Types of Ash – Morphological, Mechanical and Thermal Behavior Assessments
filler content caused deterioration of tensile strength, due to the increased friability of foam resulting in crack formation [44]. However, in case of foams containing fly ash, values of elongation at break were higher than for unmodified material, which can be related to the decrease of cell size in case of P4 and P5 samples. Enhanced tensile properties of composites containing fly ash in comparison to these with wood ash can be attributed to the differences in cellular structure (cell size) and stiffness of the foams, resulting from shape and chemical composition of fillers.
Values of Young’s modulus were estimated from tensile stress-strain curves. As many other materials, at low strain values, foams exhibit Hookean behavior, where stress is changing proportionally to applied deformation. Slope of the linear part of curve may be interpreted as the foam’s Young’s modulus. It can be seen that incorporation of both types of ash particles into polyurethane matrix caused noticeable decrease of the modulus, however effect was stronger in case of wood ash, which is in agreement with other mechanical parameters of investigated composites.
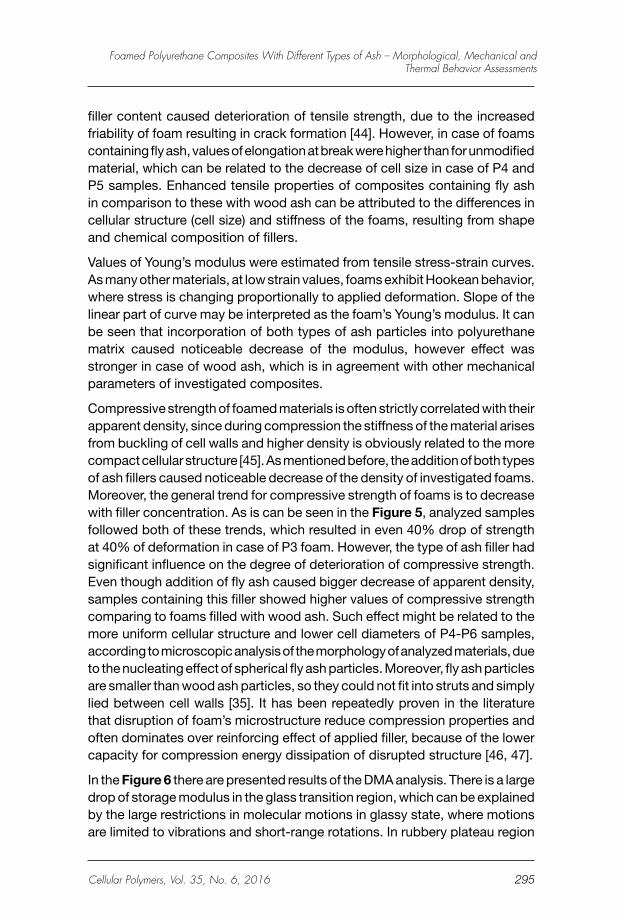
Compressive strength of foamed materials is often strictly correlated with their apparent density, since during compression the stiffness of the material arises from buckling of cell walls and higher density is obviously related to the more compact cellular structure [45]. As mentioned before, the addition of both types of ash fillers caused noticeable decrease of the density of investigated foams. Moreover, the general trend for compressive strength of foams is to decrease with filler concentration. As is can be seen in the Figure 5, analyzed samples followed both of these trends, which resulted in even 40% drop of strength at 40% of deformation in case of P3 foam. However, the type of ash filler had significant influence on the degree of deterioration of compressive strength. Even though addition of fly ash caused bigger decrease of apparent density, samples containing this filler showed higher values of compressive strength comparing to foams filled with wood ash. Such effect might be related to the more uniform cellular structure and lower cell diameters of P4-P6 samples, according to microscopic analysis of the morphology of analyzed materials, due to the nucleating effect of spherical fly ash particles. Moreover, fly ash particles are smaller than wood ash particles, so they could not fit into struts and simply lied between cell walls [35]. It has been repeatedly proven in the literature that disruption of foam’s microstructure reduce compression properties and often dominates over reinforcing effect of applied filler, because of the lower capacity for compression energy dissipation of disrupted structure [46, 47].
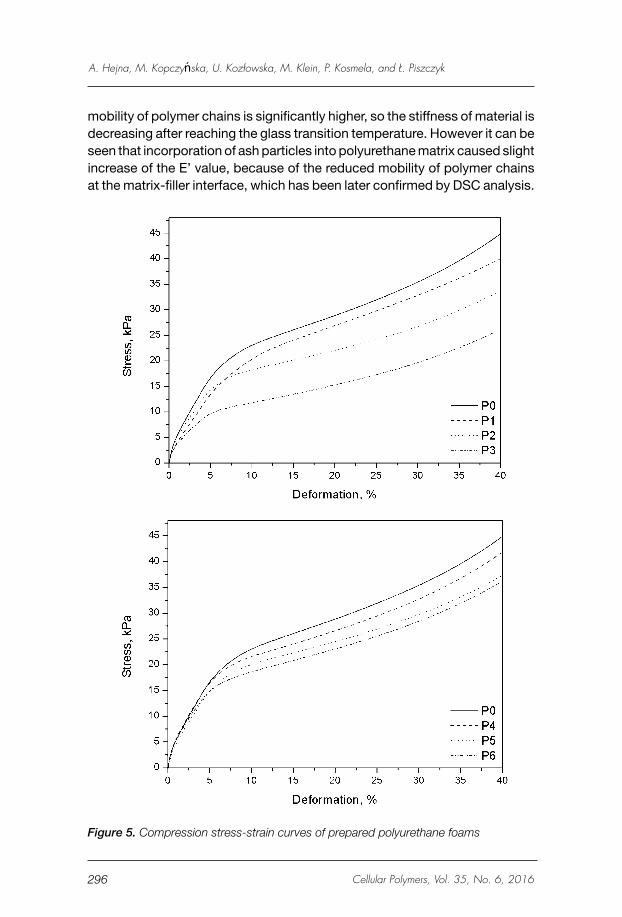
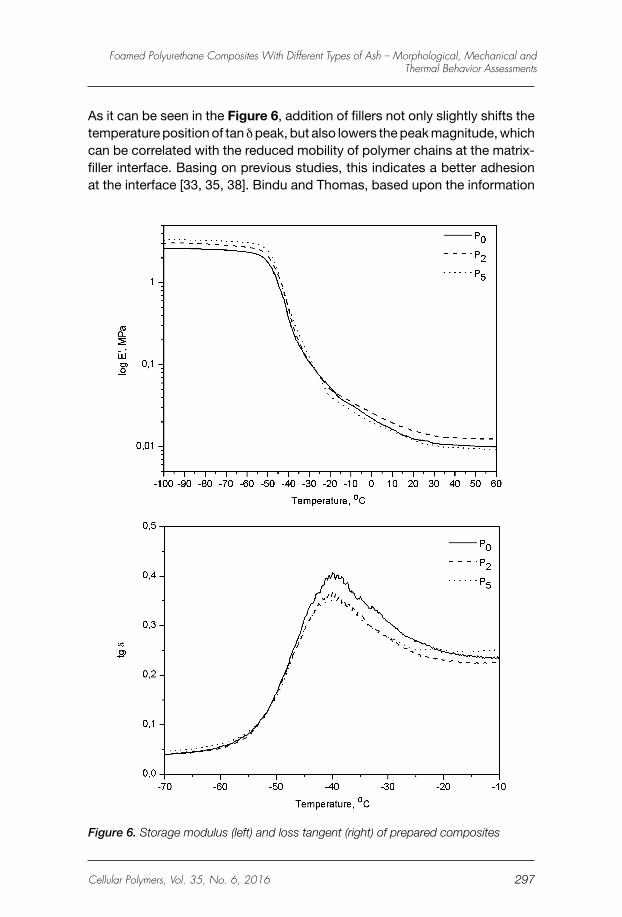
In the Figure 6 there are presented results of the DMA analysis. There is a large drop of storage modulus in the glass transition region, which can be explained by the large restrictions in molecular motions in glassy state, where motions are limited to vibrations and short-range rotations. In rubbery plateau region
296 Cellular Polymers, Vol. 35, No. 6, 2016
A. Hejna, M. Kopczyńska, U. Kozłowska, M. Klein, P. Kosmela, and Ł. Piszczyk
mobility of polymer chains is significantly higher, so the stiffness of material is decreasing after reaching the glass transition temperature. However it can be seen that incorporation of ash particles into polyurethane matrix caused slight increase of the E’ value, because of the reduced mobility of polymer chains at the matrix-filler interface, which has been later confirmed by DSC analysis.
Figure 5. Compression stress-strain curves of prepared polyurethane foams
297Cellular Polymers, Vol. 35, No. 6, 2016
Foamed Polyurethane Composites With Different Types of Ash – Morphological, Mechanical and Thermal Behavior Assessments
Figure 6. Storage modulus (left) and loss tangent (right) of prepared composites
As it can be seen in the Figure 6, addition of fillers not only slightly shifts the temperature position of tan δ peak, but also lowers the peak magnitude, which can be correlated with the reduced mobility of polymer chains at the matrix-filler interface. Basing on previous studies, this indicates a better adhesion at the interface [33, 35, 38]. Bindu and Thomas, based upon the information
298 Cellular Polymers, Vol. 35, No. 6, 2016
A. Hejna, M. Kopczyńska, U. Kozłowska, M. Klein, P. Kosmela, and Ł. Piszczyk
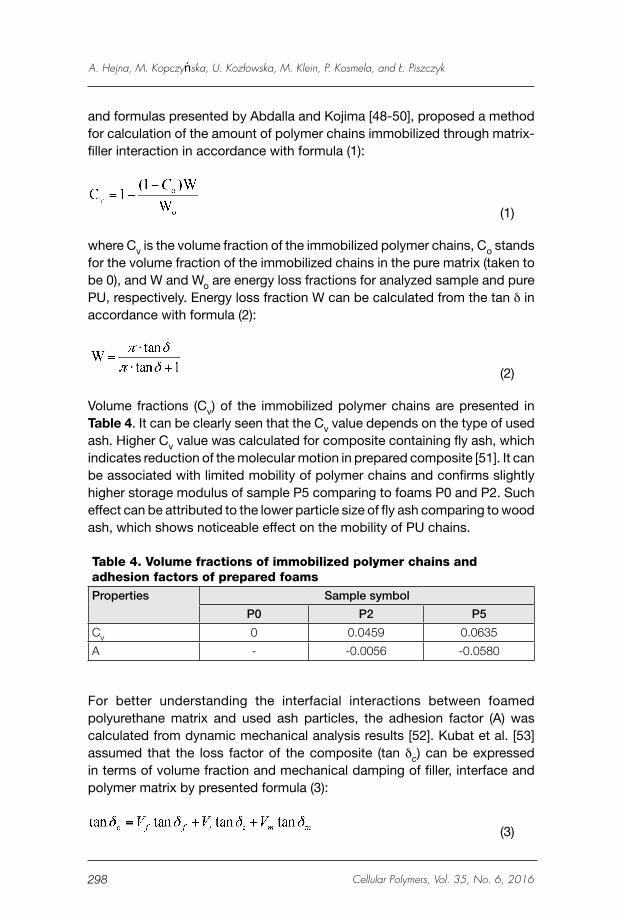
and formulas presented by Abdalla and Kojima [48-50], proposed a method for calculation of the amount of polymer chains immobilized through matrix-filler interaction in accordance with formula (1):
(1)
where Cv is the volume fraction of the immobilized polymer chains, Co stands for the volume fraction of the immobilized chains in the pure matrix (taken to be 0), and W and Wo are energy loss fractions for analyzed sample and pure PU, respectively. Energy loss fraction W can be calculated from the tan δ in accordance with formula (2):
(2)
Volume fractions (Cv) of the immobilized polymer chains are presented in Table 4. It can be clearly seen that the Cv value depends on the type of used ash. Higher Cv value was calculated for composite containing fly ash, which indicates reduction of the molecular motion in prepared composite [51]. It can be associated with limited mobility of polymer chains and confirms slightly higher storage modulus of sample P5 comparing to foams P0 and P2. Such effect can be attributed to the lower particle size of fly ash comparing to wood ash, which shows noticeable effect on the mobility of PU chains.
Table 4. Volume fractions of immobilized polymer chains and adhesion factors of prepared foamsProperties Sample symbol
P0 P2 P5
Cv 0 0.0459 0.0635
A - -0.0056 -0.0580
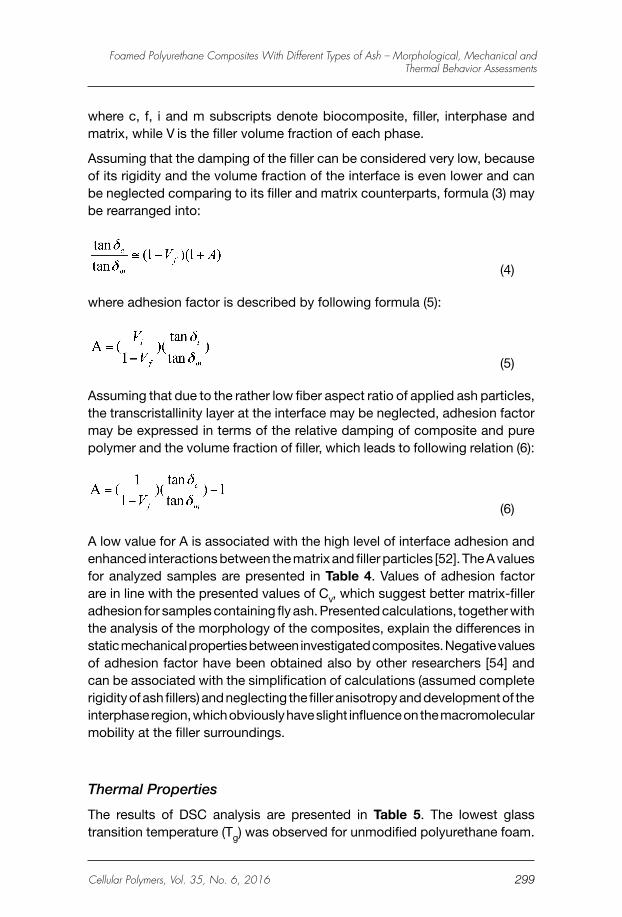
For better understanding the interfacial interactions between foamed polyurethane matrix and used ash particles, the adhesion factor (A) was calculated from dynamic mechanical analysis results [52]. Kubat et al. [53] assumed that the loss factor of the composite (tan δc) can be expressed in terms of volume fraction and mechanical damping of filler, interface and polymer matrix by presented formula (3):
(3)
299Cellular Polymers, Vol. 35, No. 6, 2016
Foamed Polyurethane Composites With Different Types of Ash – Morphological, Mechanical and Thermal Behavior Assessments
where c, f, i and m subscripts denote biocomposite, filler, interphase and matrix, while V is the filler volume fraction of each phase.
Assuming that the damping of the filler can be considered very low, because of its rigidity and the volume fraction of the interface is even lower and can be neglected comparing to its filler and matrix counterparts, formula (3) may be rearranged into:
(4)
where adhesion factor is described by following formula (5):
(5)
Assuming that due to the rather low fiber aspect ratio of applied ash particles, the transcristallinity layer at the interface may be neglected, adhesion factor may be expressed in terms of the relative damping of composite and pure polymer and the volume fraction of filler, which leads to following relation (6):
(6)
A low value for A is associated with the high level of interface adhesion and enhanced interactions between the matrix and filler particles [52]. The A values for analyzed samples are presented in Table 4. Values of adhesion factor are in line with the presented values of Cv, which suggest better matrix-filler adhesion for samples containing fly ash. Presented calculations, together with the analysis of the morphology of the composites, explain the differences in static mechanical properties between investigated composites. Negative values of adhesion factor have been obtained also by other researchers [54] and can be associated with the simplification of calculations (assumed complete rigidity of ash fillers) and neglecting the filler anisotropy and development of the interphase region, which obviously have slight influence on the macromolecular mobility at the filler surroundings.
Thermal Properties
The results of DSC analysis are presented in Table 5. The lowest glass transition temperature (Tg) was observed for unmodified polyurethane foam.
300 Cellular Polymers, Vol. 35, No. 6, 2016
A. Hejna, M. Kopczyńska, U. Kozłowska, M. Klein, P. Kosmela, and Ł. Piszczyk
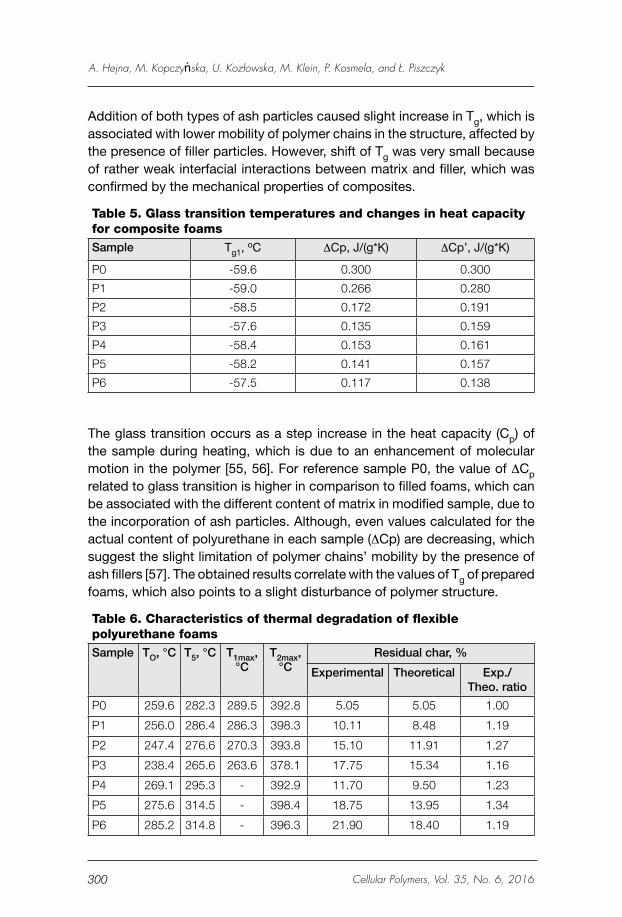
Addition of both types of ash particles caused slight increase in Tg, which is associated with lower mobility of polymer chains in the structure, affected by the presence of filler particles. However, shift of Tg was very small because of rather weak interfacial interactions between matrix and filler, which was confirmed by the mechanical properties of composites.
Table 5. Glass transition temperatures and changes in heat capacity for composite foamsSample Tg1,
oC ∆Cp, J/(g*K) ∆Cp’, J/(g*K)
P0 -59.6 0.300 0.300
P1 -59.0 0.266 0.280
P2 -58.5 0.172 0.191
P3 -57.6 0.135 0.159
P4 -58.4 0.153 0.161
P5 -58.2 0.141 0.157
P6 -57.5 0.117 0.138
The glass transition occurs as a step increase in the heat capacity (Cp) of the sample during heating, which is due to an enhancement of molecular motion in the polymer [55, 56]. For reference sample P0, the value of ∆Cp related to glass transition is higher in comparison to filled foams, which can be associated with the different content of matrix in modified sample, due to the incorporation of ash particles. Although, even values calculated for the actual content of polyurethane in each sample (∆Cp) are decreasing, which suggest the slight limitation of polymer chains’ mobility by the presence of ash fillers [57]. The obtained results correlate with the values of Tg of prepared foams, which also points to a slight disturbance of polymer structure.
Table 6. Characteristics of thermal degradation of flexible polyurethane foamsSample TO, °C T5, °C T1max,
°CT2max,
°CResidual char, %
Experimental Theoretical Exp./ Theo. ratio
P0 259.6 282.3 289.5 392.8 5.05 5.05 1.00
P1 256.0 286.4 286.3 398.3 10.11 8.48 1.19
P2 247.4 276.6 270.3 393.8 15.10 11.91 1.27
P3 238.4 265.6 263.6 378.1 17.75 15.34 1.16
P4 269.1 295.3 - 392.9 11.70 9.50 1.23
P5 275.6 314.5 - 398.4 18.75 13.95 1.34
P6 285.2 314.8 - 396.3 21.90 18.40 1.19
301Cellular Polymers, Vol. 35, No. 6, 2016
Foamed Polyurethane Composites With Different Types of Ash – Morphological, Mechanical and Thermal Behavior Assessments
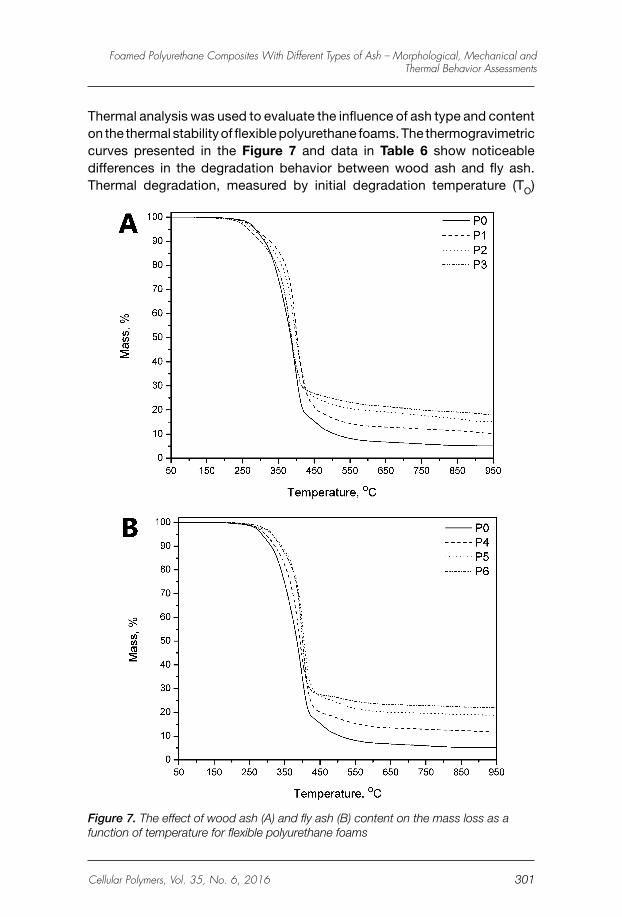
Thermal analysis was used to evaluate the influence of ash type and content on the thermal stability of flexible polyurethane foams. The thermogravimetric curves presented in the Figure 7 and data in Table 6 show noticeable differences in the degradation behavior between wood ash and fly ash. Thermal degradation, measured by initial degradation temperature (TO)
Figure 7. The effect of wood ash (A) and fly ash (B) content on the mass loss as a function of temperature for flexible polyurethane foams
302 Cellular Polymers, Vol. 35, No. 6, 2016
A. Hejna, M. Kopczyńska, U. Kozłowska, M. Klein, P. Kosmela, and Ł. Piszczyk
corresponding to 2% mass loss, was noticeably retarded by the incorporation of fly ash, whose incorporation of 10 and 15 wt% increased TO by 16.0 and 25.6°C, respectively, which confirms the results presented in other work [35]. However, the addition of wood ash worsened the thermal stability of the resulting composites even by 21.2°C for a 15 wt% admixture. Such differences between foams with two types of ash can be related to the chemical composition of both fillers (see Table 1). Fly ash shows similar composition to aluminosilicates (clays), which have been repeatedly reported as excellent modifiers enhancing the thermal stability of polyurethane foams [43, 56]. The differences in the influence of the two types of ash on the thermal stability of the produced composites might also be related to the differences in structure of the particles. In case of fly ash, spherical-shaped particles contain gas inside, which can result in thermal insulation effect, simultaneously inhibiting the diffusion of heat into the foam.
The mechanism of the thermal degradation of polyurethanes is often described as very complex, due to the complex structure of polyurethanes. Their degradation occurs in two main stages. The first stage involves dissociation of the polyol and isocyanate components, followed by thermal decomposition leading to the formation of amines, small transition components and carbon dioxide [58, 59]. The second stage is related to the decomposition of long polyether or polyester chains, depending of the structure of used polyol, and is relatively slower than the first step [60-62]. Obviously, the rate of degradation in both steps depends very strongly on the structure and arrangement of the segments. In Table 6 there are presented values of T1max and T2max, which correspond to the temperature positions of peaks on differential thermogravimetric curves. These are temperatures, when thermal degradation occurs in the most rapid manner. The incorporation of spherical fly ash particles enhanced the thermal stability of foams and shifted onset of degradation towards higher temperatures, so no peaks were observed in the first stage of degradation in case of P4-P6 foams. It means that addition of fly ash particles noticeably enhanced the thermal stability of the weakest bonds: biuret, allophanate and urethane [63]. Also, T2max was shifted towards higher temperature values. For the foams containing wood ash particles, both T1max and T2max were lower compared to the reference sample. The decrease of T2max can be related to the disturbances in structure and cutting of polymer chains by plate-shaped ash particles. Moreover, the deterioration of thermal stability in case of P1-P3 foams might be related to the reactions occurring between isocyanates present in the system and functional groups present on the surface of ash particles. It is commonly known that isocyanate index have crucial influence on the thermal stability of polyurethane foams and decrease of this parameter cause often shift of onset of degradation towards lower temperatures.
303Cellular Polymers, Vol. 35, No. 6, 2016
Foamed Polyurethane Composites With Different Types of Ash – Morphological, Mechanical and Thermal Behavior Assessments
In Table 6 there are also presented contents of residual char formed at high temperature (800°C). For both types of ash experimental values are significantly higher than predicted from theoretical calculations according to the formula (7):
(7)
where RC is the residual char and x is the mass fraction of the particular component. Subscripts c, f and a stand for composite, foam and ash, respectively.
Such behavior is associated with the barrier effect of incorporated fillers, which causes the “labyrinth effect”, simultaneously inhibiting the escape of volatile compounds and the diffusion of oxygen and heat. Similar effect related to the incorporation of ash fillers into polyurethane foams was also reported by other researchers [30, 35].
Moreover, for both applied fillers, it can be seen that in case of 15 wt% addition the influence of ash on thermal degradation was less beneficial. For samples containing wood ash, deterioration of thermal stability was significantly higher in case of P3 foam comparing to materials P1 and P2. It can be also clearly seen, that the ratio of experimental and theoretical values of mass of residual char is decreasing for 15 wt% addition of ashes, what can be related to the overloading of matrix with filler, which did not allow to obtain proper dispersion of filler.
CONCLuSIONS
The presented results demonstrate that the introduction of both, wood ash and fly ash, into the structure of flexible polyurethane foams caused deterioration of mechanical properties of material (tensile strength, compressive strength). However, in most cases, composite materials still show satisfactory mechanical characteristics, which met the requirements for the products made from flexible PU foams, such as mattresses or seats in various vehicles, such as cars or trains. Simultaneously, incorporation of low cost filler, cause the decrease of the material’s density, which can be considered very beneficial from the economical point of view. Results of differential scanning calorimetry indicate slight changes in the mobility of polymer chains caused by incorporation of ash particles, which may indicate stiffening of the material. Incorporation of fly ash enhanced thermal stability by increasing initial temperature of degradation even by more than 10°C, which was related to the excellent thermals stability of applier filler, but also to its structure. Gas trapped in the spherical particles of fly ash acted like an insulation, slowing the heat diffusion through material.
304 Cellular Polymers, Vol. 35, No. 6, 2016
A. Hejna, M. Kopczyńska, U. Kozłowska, M. Klein, P. Kosmela, and Ł. Piszczyk
Moreover, addition of both types of fillers significantly increased char residue, which means that char layer was created, which acted like an insulation. However, such layer was created in higher temperature range, which will suggest incorporation of additional modifier of thermal stability acting in the temperature range attributed to the initial temperature of degradation of polyurethane matrix.
Presented results of research show clearly that incorporation of low cost ash particles into flexible polyurethane foams can result in production of materials with satisfactory mechanical and thermal properties, simultaneously decreasing the cost of the material by the reduction of density and the cost of applied filler. Moreover, the chemical composition of investigated ash fillers creates various possibilities of its modification, e.g. with other modifiers of thermal stability or flame retardants. Addition of ash particles has also positive influence on ecological aspects of production, by use of waste materials, which currently is often stored at landfills.
REFERENCES
1. Ahmaruzzaman M., Prog. Energ. Combust., 36 (2010), 327.
2. Siddique R., Cem. Concr. Res., 34 (2004), 487.
3. Antiohos S.K., Papageorgiou A., Papadakis V.G., Tsimas S., Constr. Build. Mater., 22 (2008), 1191.
4. Lin Y.K., Compressibility, strength, and frost susceptibility of compacted fly ash. PhD thesis, University of Michigan, Michigan, 1971.
5. Lin K.L., J. Hazard. Mater. B, 137 (2006), 1810.
6. Yang J., Liu W., Zhang L., Xiao B., Constr. Build. Mater., 23 (2009), 687.
7. Moriyama R., Takeda S., Onozaki M., Katayama Y., Shiota K., Fukuda T., Sugihara H., Tani Y., Fuel, 84 (2005), 1455.
8. Chareonpanich M., Namto T., Kongkachuichay P., Limtrakul J., Fuel Process. Technol., 85 (2004), 1623.
9. Rotenberg S.J., Mettzler G., Poliner J., Bechtold W.E., Eidson A.F., Newton G.J., Environ. Sci. Technol., 25 (1991), 930.
10. Srivastava V.C., Mall I.D., Mishra I.M., Colloid Surface A, 312 (2008), 172.
11. Rahman M.H., Wasiuddin N.M., Islam M.R., Can. J. Chem. Eng., 82 (2004), 968.
12. Matheswaran M., Karunanithi T., J. Hazard. Mater., 145 (2007), 154.
305Cellular Polymers, Vol. 35, No. 6, 2016
Foamed Polyurethane Composites With Different Types of Ash – Morphological, Mechanical and Thermal Behavior Assessments
13. Lin J.X., Zhan S.L., Fang M.H., Qian X.Q., Yang H., J. Environ. Manage., 871 (2008), 193.
14. Lopez-Anton M.A., Dıaz-Somoano M., Martınez-Tarazona M.R., Ind. Eng. Chem. Res., 46 (2007), 927.
15. Suarez-Ruiz I., Hower J.C., Thomas G.A., Energy. Fuel, 21 (2007), 59.
16. Lu G.Q., Do D.D., Fuel Process. Technol., 27 (1991), 95.
17. Ngashima N., Arashi N., Kanda O., Operation results of the first commercial dry desulfurization plant in Hokkaido Electric Power Co. In: Proceedings: 1993 SO2 control symposium, Boston, USA, 24-27 Aug 1993. Washington: U.S. Environmental Protection Agency.
18. Yildiz E., Sep. Purif. Technol., 35 (2004), 241.
19. Ozturk N., Kavak D., J. Hazard. Mater., 127 (2005), 81.
20. Anandhan S., Int. J. Waste Resources, 4 (2014), 149.
21. Joshi R.C., Lothia R.P., Fly ash in concrete: production, properties and uses. In: Newman J., Choo B.S., Choo B.S. (eds) Advances in concrete technology, vol. 2. Gordon and Breach Science Publishers, 1997.
22. Mukherjee A.B., Zevenhoven R., Bhattacharya P., Sajwan K.S., Kikuchi R., Resour. Conserv. Recycl., 52 (2008) 571.
23. Ma X.F., Yu J.G., Wang N., Carbohyd. Polym., 67 (2007), 32.
24. Pardo S.G., Bernal C., Ares A., Abad M.J., Cano J., Polym. Composite., 31 (2010), 1722.
25. Ramosa D.V., da Costa H.M., Soares V.L.P., Nascimento R.S., Polym. Test., 24 (2005), 219.
26. Wu G., Gu J., Zhao X., J. Appl. Polym. Sci., 105 (2007), 1118.
27. Nath D.C.D., Bandyopadhyay S., Boughton P., Yu A., Blackburn D., White C., J. Mater. Sci., 45 (2010), 2625.
28. Parvaiz M.R., Mohanty S., Nayak S.K., Mahanwar P.A., Mater. Sci. Eng. A, 528 (2011), 4277.
29. Siriwardena S., Ismail H., Ishiaku U.S., Perera M.C.S., J. Appl. Polym. Sci., 85 (2002), 438.
30. da Silva V.R., Mosiewicki M.A., Yoshida M.I., da Silva M.C., Stefani P.M., Marcovich N.E., Polym. Test., 32 (2013), 438.
31. Hejna A., Kosmela P., Mikicka M., Danowska M., Piszczyk Ł., Polym. Composite., In press, http://dx.doi.org/10.1002/pc.23246.
306 Cellular Polymers, Vol. 35, No. 6, 2016
A. Hejna, M. Kopczyńska, U. Kozłowska, M. Klein, P. Kosmela, and Ł. Piszczyk
32. Corcuera M.A., Rueda L., Fernandez D’Arlas B., Arbelaiz A., Marieta C., Mondragon I., Eceiza A., Polym. Degrad. Stabil., 95 (2010), 2175.
33. Sormana J.L., Meredith J.C., Macromolecules, 37 (2004), 2186.
34. Fournier D., Du Prez F., Macromolecules, 41 (2008), 4622.
35. Tarakcilar A.R., J. Appl. Polym. Sci., 120 (2011), 2095.
36. Thirumal M., Singha N.K., Khastgir D., Manjunath B.S., Naik Y.P., J. Appl. Polym. Sci., 116 (2010), 2260.
37. da Silva V.R., Mosiewicki M.A., Yoshida M.I., da Silva M.C., Stefani P.M., Marcovich N.E., Polym. Test., 32 (2013), 665.
38. Cao X., Lee L.J., Widya T., Macosko C., Polymer, 46 (2005), 775.
39. Fujimoto Y., Ray S.S., Okamoto M., Ogami A., Yamada K., Ueda K., Macromol. Rapid Comm., 24 (2003), 457.
40. Lee S.Y., Chen H., Hanna M.A., Ind. Crop. Prod., 28 (2008), 95.
41. Madaleno L., Pyrz R., Crosky A., Jensen L.R., Rauhe J.C.M., Dolomanova V., de Barros Timmons A.M.M.V., Cruz Pinto J.J., Norman J., Compos. Part A-Appl. S., 44 (2013), 1.
42. Del Saz-Orozco B., Oliet M., Alonso M.V., Rojo E., Rodríguez F., Compos. Sci. Tech., 72 (2012), 667.
43. Singh H., Jain A.K., J. Appl. Polym. Sci. 111 (2009), 1115.
44. Chen M.J., Shao Z.B., Wang X.L. Chen L., Wang Y.Z., Ind. Eng. Chem. Res., 51 (2012), 9769.
45. Mosiewicki M.A., Dell’Arciprete G.A., Aranguren M.I., Marcovich N.E., J. Compos. Mater., 43 (2009), 3057.
46. Guan J., Hanna M.A., Ind. Crop. Prod. 19 (2004), 255.
47. Verdejo R., Stämpfli R., Alvarez-Lainez M., Mourad S., Rodriguez-Perez M.A., Bruhwiler P.A., Shaffer M., Compos. Sci. Technol., 69 (2009), 1564.
48. Abdalla M., Dean D., Adibempe D., Nyairo E., Robinson P., Thompson G., Polymer, 48 (2007), 5662.
49. Bindu P., Thomas S., J. Phys. Chem. B, 117 (2013), 12632.
50. Kojima Y., Usuki A., Kawasumi M., Okada A., Kurauchi T., Kamigaito O., J. Appl. Polym. Sci., 49 (1993), 1259.
51. Hejna A., Formela K., Reza Saeb M., Ind. Crop. Prod., 76 (2015), 725.
52. Wei L., Liang S., McDonald A.G., Ind. Crop. Prod., 69 (2015), 91.
307Cellular Polymers, Vol. 35, No. 6, 2016
Foamed Polyurethane Composites With Different Types of Ash – Morphological, Mechanical and Thermal Behavior Assessments
53. Kubát J., Rigdahl M., Welander M., J. Appl. Polym. Sci., 39 (1990), 1527.
54. Correa C.A., Razzino C.A., Hage Jr E., J. Thermoplast. Compos., 20 (2007), 323.
55. Hatakeyama T., Quinn F.X., Thermal Analysis: Fundamentals and Applications to Polymer Science, John Wiley & Sons, Chichester, UK (1994).
56. Tanaka R., Hirose S., Hatakeyama H., Bioresour. Technol., 99 (2008), 3810.
57. Hatakeyama T., Asano Y., Hatakeyama H., Macromol. Symp., 197 (2003), 171.
58. Seo W.J., Sung Y.T., Kim S.B., Lee Y.B., Choe K.H., Choe S.H., Sung J.Y., Kim W.N., J. Appl. Polym. Sci. 102 (2006), 3764.
59. Somania K.P., Kansaraa S.S., Patelb N.K., Rakshit A.K., Int. J. Adhes. Adhes., 23 (2003), 269.
60. Cervantes-Uc J.M., Moo Espinosa J.I., Cauich-Rodriguez J.V., Avila-Ortega A., Vazquez-Torres H., Marcos-Fernandez A., San Roman J., Polym. Degrad. Stabil., 94 (2009), 1666
61. Petrovic Z., Zavargo Z., Flynn J.H., Macknight W.J., J. Appl. Polym. Sci., 51 (1994) 1087.
62. Pawlik H., Prociak A., J. Polym. Environ., 20 (2012), 38.
63. Kurańska M., Prociak A., Kirpluks M., Cabulis U., Compos. Sci. Tech., 75 (2013), 70.

308 Cellular Polymers, Vol. 35, No. 6, 2016
A. Hejna, M. Kopczyńska, U. Kozłowska, M. Klein, P. Kosmela, and Ł. Piszczyk