Embed Size (px)
Citation preview

1
Electronic Supplementary Information (ESI)
Fluoride-assisted synthesis of bimodal microporous SSZ-13 zeolite
Xiaochun Zhu, Nikolay Kosinov, Jan P. Hofmann, Brahim Mezari, Qingyun Qian, Roderigh
Rohling, Bert M. Weckhuysen, Javier Ruiz-Martínez, and Emiel J. M. Hensen*
1Inorganic Materials Chemistry, Schuit Institute of Catalysis, Department of Chemical Engineering and Chemistry, Eindhoven University of Technology, P.O. Box 513, 5600 MB, Eindhoven, The Netherlands.2Inorganic Chemistry and Catalysis Group, Debye Institute for Nanomaterials Science, Faculty of Science, Utrecht University, Universiteitsweg 99, 3584 CG Utrecht, The Netherlands.*e-mail: [email protected]
Electronic Supplementary Material (ESI) for ChemComm.This journal is © The Royal Society of Chemistry 2016

2
Experimental Section
1. Synthesis of zeolites
Hierarchical SSZ-13 zeolites were synthesized as follows: sodium hydroxide (EMSURE, 50
wt%), TMAdaOH (SACHEM Inc. 25 wt%) were mixed in deionized water and stirred for 10
min, to the template solution aluminium hydroxide (Aldrich, reagent grade) and sodium fluoride
(EMSURE, ≥99.5 %) were added and then stirred for another 30 min. Ludox AS 40 (Aldrich,
40 wt%) was added quickly into the clear solution. The final gel has a molar composition of 20
TMAdaOH : 7.5 Na2O : 2.5 Al2O3 : 100 SiO2 : x NaF : 4400 H2O (x = 0, 5, 10, or 20). After
vigorous stirring at room temperature for 2 h, the resulting gel was transferred into a 45 mL
Teflon lined steel autoclave and crystallized at 160 °C for 10 days. The obtained solids are
denoted as SSZ-13-xF with x = 0, 5, 10, or 20. The conventional SSZ-13 was prepared from the
same gel without NaF and crystallized at 160 °C for 6 days. After crystallization, the zeolite
products were filtered, washed with distilled water and dried in air at 110 °C. The zeolites were
calcined at 550 °C for 10 h under flowing air and subsequently ion-exchanged three times with
1.0 M NH4NO3 solutions followed by calcination at 550 °C for 4 h in flowing air in order to
obtain their proton forms.
2. Characterization
Basic characterization: X-ray diffraction patterns were recorded on a Bruker D4 Endeavor
diffractometer using Cu Kα radiation in the 2θ range of 5−60°. Elemental analyses were carried
out by ICP-OES on a Spectro Ciros CCD ICP optical emission spectrometer with axial plasma
viewing, samples were digested in a mixture of HF/HNO3/H2O. Surface area and porosity of
zeolites were determined by Argon physisorption at −186 °C on a Micromeritics ASAP 2020
instrument in static mode. The samples were outgassed at 400 °C for 8 h prior to the sorption
measurements. Langmuir surface area of SSZ-13 zeolite was obtained in the relative pressure
range (p/p0) of 0.05–0.20, the total pore volume was calculated at p/p0= 0.97, the mesopore
volume and the micropore volume were calculated from the BJH method and the t-plot method
(thickness range 0.336−0.380 nm), respectively. The micropore size distribution and diameter
was calculated by the NLDFT model. Use was made of the model for Ar on oxides in cylindrical
pores at −186 °C. Regularization was not applied.

3
Electron microscopy: Scanning electron microscopy (SEM) images were taken on a FEI Quanta
200F scanning electron microscope at an accelerating voltage of 3 kV. The zeolites were coated
with gold prior to measurements. FIB-SEM measurements were performed on a Helios NanoLab
650. The samples were coated with a layer of gold prior to focused ion beam (FIB) milling. The
FIB uses gallium ions, in the rough milling step for which the accelerating voltage and the
current were set to 30 kV and 65 nA, respectively. The fine milling on the chosen crystal of SSZ-
13-0F was carried out at 30 kV and 0.43 nA. In the case of the SSZ-13-10F crystal, the settings
for polishing were 30 kV and 0.3 nA. The EDX line scan was performed with an Ametec-EDAX
EDX system. Transmission electron microscopy (TEM) images of SSZ-13 zeolite crystals were
acquired using a FEI Tecnai 20 (type Sphera) transmission electron microscope operating at
200 kV with a LaB6 filament. Prior measurement the samples were suspended in ethanol and
dispersed over a Cu grid with holey carbon film.
Thermogravimetric analysis: The carbonaceous deposits formed during MTO were analyzed
by thermogravimetric analysis (TGA) on TGA/DSC 1 STAR system of Mettler Toledo. The
temperature was increased to 850 °C at a rate of 5 °C min−1 under flowing air (50 ml min−1). The
weight loss between 300 °C and 600 °C was considered as the total carbonaceous deposit content.
To evaluate differences in diffusion in zeolites, methanol, propylene, n-butanol, i-butanol, and o-
xylene adsorption was performed on TGA apparatus at 30 °C. The samples were dehydrated at
550 °C before the exposure. For the liquid adsorbents, a He flow was led through a thermostated
saturator. The gaseous adsorbents were mixed with a He flow. The partial pressures of the
adsorbents were 2.8 mbar for methanol, 6.9 mbar for n-butanol, 4.3 mbar for i-butanol, 10 mbar
for o-xylene, 47 mbar for propylene.
FT-IR spectroscopy: FT-IR spectra of samples were recorded on a Bruker Vertex 70v
instrument. The spectra were acquired at 2 cm−1 resolution and 64 scans. The samples were
prepared as thin wafers of ~ 10 mg and placed inside a controlled environment infrared
transmission cell, capable of heating and cooling, gas dosing and evacuation. For CO adsorption,
the wafer was heated to 550 °C at a rate of 10 °C min−1 under evacuation. Subsequently, the
sample was cooled to −196 °C. CO (Praxair, 99.999 %) was introduced into the sample cell via a
sample loop (5 μL) connected to a Valco six-port valve. FT-IR spectra of propylene were
performed at 30 °C and a 10 μL sample loop was used. IR Spectra were normalized by the
weight of catalyst wafer.
4
NMR spectroscopy: Nuclear Magnetic Resonance (NMR) spectra were recorded on an 11.7
Tesla Bruker DMX500 NMR spectrometer, operating at 500 MHz for 1H, 470 MHz for 19F, 99
MHz for 29Si, and 132 MHz for 27Al measurements. 27Al MAS NMR was performed using a
Bruker 2.5 mm MAS probe head spinning at 20 kHz. The MAS NMR measurements were
carried out using a 4 mm MAS probe head with sample rotation rates of 10 kHz for 1H and 19F,
and 5-8 kHz for 29Si NMR measurements, respectively. The 1H measurement was carried out
using a 4 mm MAS probe head with sample rotation rate of 10 kHz. Quantitative 29Si NMR
spectra were recorded using a high power proton decoupling direct excitation (DE) pulse
sequence with a 54° pulse duration of 3 μs and an interscan delay of 120 s. Higher interscan
delay did not show any significant increase in signal intensity. 19F MAS NMR spectra were
recorded applying a Hahn-echo pulse sequence and a delay time of 5 s. 27Al 3QMAS NMR
spectra were recorded by use of the three-pulse sequence p1-t1-p2-τ-p3-t2 for triple-quantum
generation and zero-quantum filtering (strong pulses p1 = 3.4 μs and p2 = 1.4 μs at v1 = 100 kHz;
soft pulse p3 = 11 μs at v1 = 8 kHz; filter time τ = 20 μs; interscan delay 0.2 s). 1H NMR spectra
were recorded with a Hahn-echo pulse sequence p1-τ1-p2-τ2-aq with a 90° pulse p1 = 5 μs and a
180° p2 = 10 μs. The interscan delay was set to 120 s for quantitative spectra. 1H NMR shifts
were calibrated using tetramethylsilane (TMS) and a saturated aqueous Al(NO3)3 solution was
used for 27Al NMR shift calibration.
In-situ visible light microspectroscopy: The measurements were performed on an Olympus
BX41 upright microscope using a 50 × 0.5 NA long working distance microscope objective lens.
A 75 W tungsten lamp was used for illumination. In addition, the microscope has a 50/50 double
viewport tube, which accommodates a CCD video camera (ColorViewIIIu, Soft Imaging
Systems GmbH) and an optical fibre mount. A 200 μm core fibre connects the microscope to a
CCD Vis spectrometer (AvaSpec-2048TEC, Avantes BV). The in-situ Vis measurements were
conducted in a Linkam FT-IR 600 in-situ cell. A pinch of the zeolite crystals were placed in the
in-situ cell and exposed to a methanol containing nitrogen flow at a total flow rate of 10 ml min−1.
The reaction temperature was 350 °C. In this geometry, we cannot accurately determine the
weight hourly space velocity in this configuration, but it is expected to be much higher than in
the fixed-bed catalytic activity measurements. Before the MTO reaction, the catalysts were
heated to 550 °C in 50 ml min−1 N2 flow with a rate of 10 °C min−1 and kept for 1 h. Then the
temperature was lowered to 350 °C and methanol was introduced to the in-situ cell by leading a

5
flow of 10 ml min−1 N2 through liquid methanol kept at room temperature. The resulting spent
samples were further investigated by confocal fluorescence microscopy.
Confocal fluorescence microscopy: For the confocal fluorescence microscopy, a Nikon Eclipse
LV150 upright microscope with 50 × 0.55 NA dry objective was used for fluorescence
microscopy studies. Fluorescence microphotographs were collected using 510−700 nm excitation
light from a mercury source. Confocal images were acquired with a Nikon D-Eclipse C1 head
connected to 488, 561, and 635 nm excitation lasers. The emission was detected in the ranges
510–550 nm, 570–620 nm, and 662–737 nm, respectively. For the confocal images of SSZ-13
samples after the exposure to propylene, the excitation wavelength of the laser is 561 nm and
detection was in the 570–620 nm range. Thiophene oligomerization reactions were performed on
the heating element of a Linkam in-situ cell. The samples were heated at 120 °C for 5 min.
Subsequently, 15 μl of thiophene was added and then heating was stopped after 10 s. The
fluorescent images were taken by exciting the oligomers with a 561 nm laser and collecting the
fluorescent light in the range 570–620 nm.
3. Molecular modelling
A sorption isotherm was modelled using Materials Studio v6.0 (BIOVIA, formerly Accelrys) to
estimate the occupation of the CHA cages by Ar atoms using a periodic box consisting of 2×2×2
CHA unit cells. Charge assignment using the QEq method was combined with the use of the
Universal Forcefield and Metropolis algorithm at Fine quality. The temperature was set to −188
°C and the fugacity range was 0 to 5000 kPa. The total loading fluctuated between 48 to 49 Ar
atoms – though a loading of 49 became dominant at higher fugacity. It was found that Ar atoms
adopt an octahedral geometry in every cage. The same settings were used to create the Ar-loaded
CHA periodic structure of 2×2×2 unit cells.
The Ar-loaded model was used to calculate the distances between different Ar atoms within the
same channel – i.e. looking through the 8MR windows. For instance, the x- and y-positions were
independently determined in the xy-plane yielding the distances Δx and Δy between pairs of Ar
atoms. The Van der Waals radius of Ar (1.88 Å) was added twice to the obtained distance,
because Δx and Δy only yield core-to-core distances which would in this way significantly
underestimate the channel diameter. The procedure of measuring distances and correcting for the
Van der Waals radius of Ar was done for eight different pores – four in the xz plane and four in

6
the yz plane – yielding an average of 4.96 Å for the 16 different obtained diameters. This was all
done under the assumption that either Δz and Δx (xz-plane) or Δz and Δy (yz-plane) intersect each
other at the centre of the channel. This simplification will slightly underestimate the pore
diameter. See also Figure S11 for a schematic overview of the procedure.
4. Catalytic tests
The proton form zeolites was pressed into pellets, and then crushed and sieved to obtain particles
ranging in size from 250 to 500 μm. Catalytic activity measurements were carried out in a quartz
tubular fixed-bed reactor with 50 mg catalyst loading. The inner diameter of the quartz tube
reactor was 4 mm. The catalyst lifetime is defined as the time to reach a conversion of 50 % (t50).
Here, the time at which conversion has decreased to 98 % (t98) is also employed, as this is more
relevant to commercial practice. Before reaction, the catalysts were activated at 550 °C in
synthetic air (30 ml min−1) for 2 h. The methanol-to-olefins reaction was performed at 350 °C.
Methanol (Merck, 99 %) was introduced to the reactor by leading a flow of 30 ml min−1 of He
through a saturator kept at −17.2 °C. The resulting WHSV is 0.8 g g−1 h−1. The product effluent
was analysed online by gas chromatography (Compact GC Interscience equipped with TCD and
FID detectors with RT-Q-Bond and Al2O3/KCl columns). The reaction was followed for 24 h.
Methanol conversion is based on the inlet and outlet concentrations of methanol as determined
by GC analysis of the reactor feed before and after the reaction and the reactor effluent during
reaction. Dimethylether was considered as a reactant in these calculations.
7
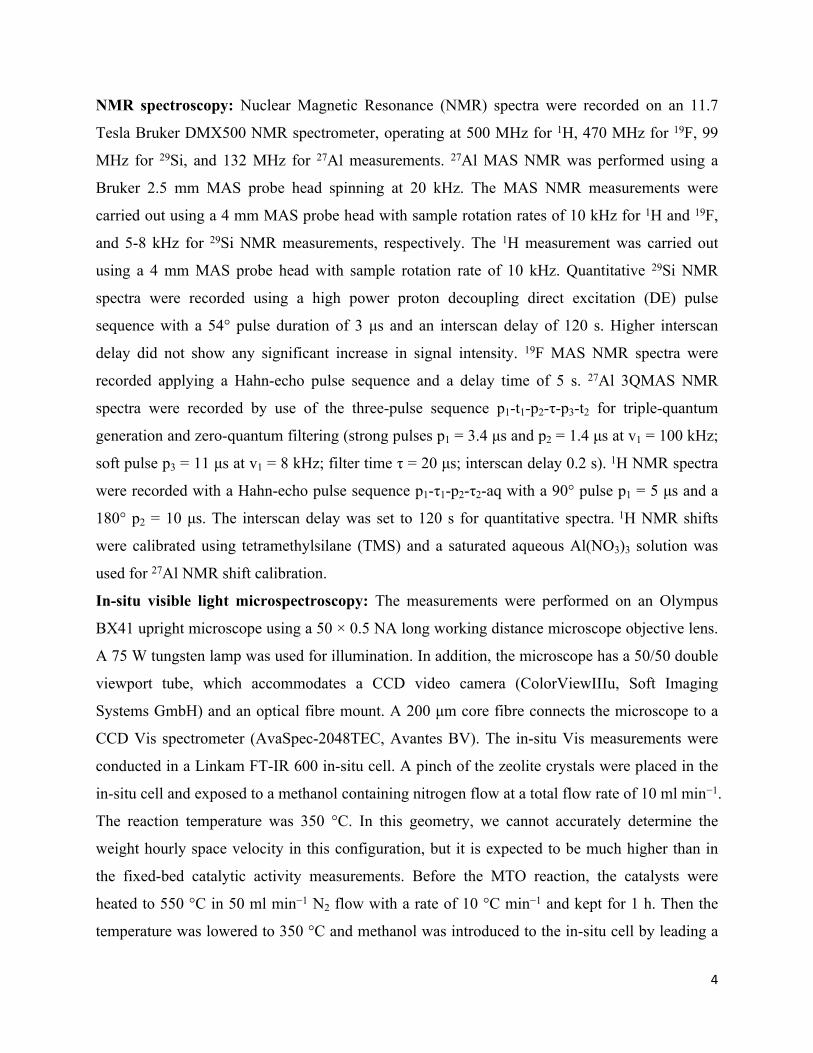
Figure S1. XRD patterns of as-synthesized (a) SSZ-13-0F, (b) SSZ-13-5F, (c) SSZ-13-10F, and (d) SSZ-
13-20F. * Impurity quartz.
8
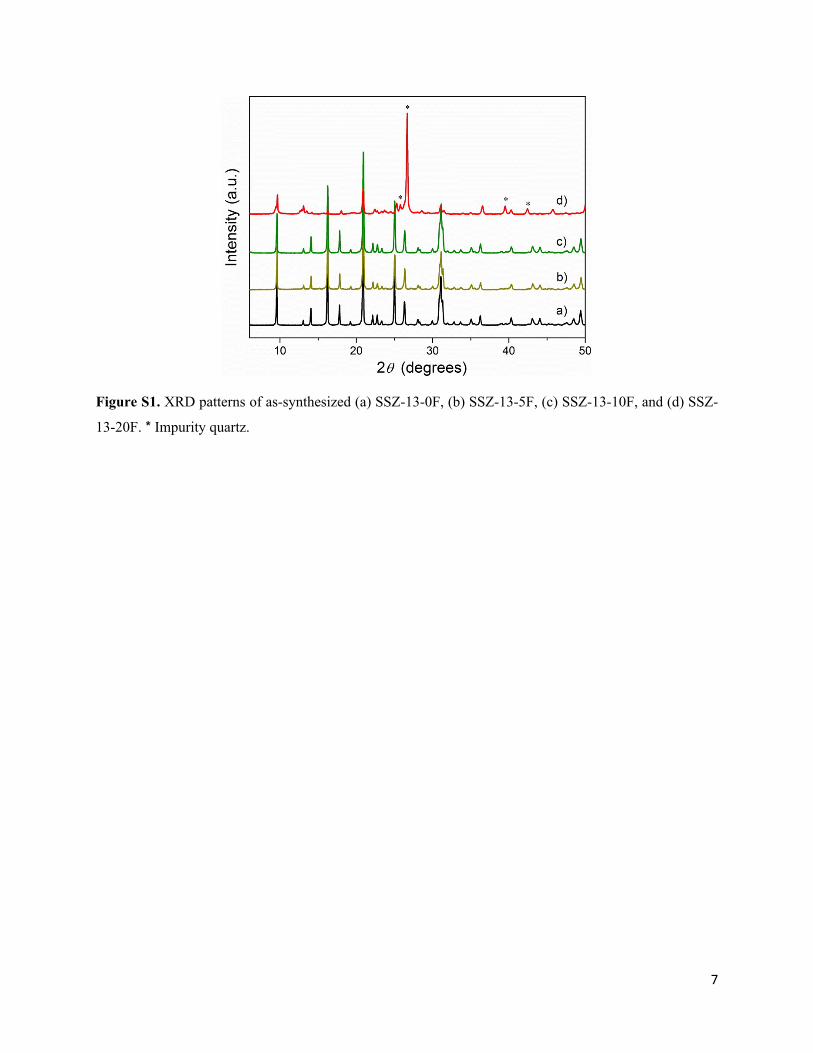
Figure S2. SEM images taken at different magnifications of (a, e, and i) SSZ-13-0F, (b, f, and j) SSZ-13-
5F, (c, g, and k) SSZ-13-10F, and (d, h, and l) SSZ-13-20F. TEM images taken at different
magnifications of (m, n) SSZ-13-R and (o, p) SSZ-13-10F.

9
Figure S3. 19F MAS NMR spectra of as-synthesized SSZ-13-10F (green) and calcined SSZ-13-10F
zeolite (black). The resonance at −63 ppm is due to F in the D6R cages of the CHA structure as reported
before for SSZ-13 synthesized with TMAda+ in the presence of fluoride at neutral pH.1 The resonance at
~ −121 ppm is due to free fluoride anions present in the zeolite. Solid NH4F and NaF give rise to a single
line at ~ −116 ppm and −126 ppm, respectively.2,3

10
Figure S4. Methanol conversion versus cumulative amount of methanol that has been converted to
hydrocarbons. Extrapolation to zero methanol conversion gives the total methanol conversion capacity for
SSZ-13-0F (■), SSZ-13-5F (▲), and SSZ-13-10F (●).

11
Figure S5. Time-resolved in-situ visible light microspectroscopy of (a, b, and c) SSZ-13-0F and (d, e, and
f) SSZ-13-10F taken during the MTO reaction at 350 °C. All time-resolved spectra were deconvoluted
into two main spectral features (b and e; the black line represents mostly polymethylated benzenes and the
red line stands for bulkier multi-ring aromatics) and the evolution of those spectral features with
increasing time on stream (c and f) by non-negative matrix factorization analysis.

12
Figure S6. 27Al MAS NMR spectra and 29Si MAS NMR spectra of SSZ-13-0F and SSZ-13-10F. The
spectra were normalized by the weight of the samples.

13
Figure S7. (a) Decomposition of the different peaks of 1H MAS NMR spectra of SSZ-13-0F. The spectra
was normalized by the weight of the catalyst. (b) Proton T2 filtered spectra of dehydrated SSZ-13-0F at
varied echo times 2t = 0.05, 2, 8, 16, 32, and 64 ms (from top to bottom). From the filtered spectra at
higher 2t times can be clearly seen that the silanol signal consists of two peaks at 2.0 and 1.8 ppm which
are assigned as internal and external silanols, respectively.

14
Figure S8. (left) Hydroxyl and (right) CO stretch regions of FTIR spectra of (a, b) SSZ-13-0F and (c, d)
SSZ-13-10F as a function of the CO coverage. The spectra were normalized by the weight of the catalysts.

15
Figure S9. EDX line scan (Si and Al signals) of FIB cuts of (a) SSZ-13-0F and (b) SSZ-13-10F.

16
Figure S10. (a) High resolution Ar physisorption isotherms of (■) SSZ-13-0F, (▲) SSZ-13-5F, and (●)
SSZ-13-10F. (b) All the samples have similar mesopore size distributions. (c) The micropore size
distribution analyzed by the NLDFT method points to additional microporosity with a size of ~ 0.5 nm.
The native micropore system of SSZ-13 zeolite that is composed of 0.92 nm supercages separated by 0.38
nm apertures gives rise to on average 0.54 nm micropores as also confirmed by molecular simulations.

17
Figure S11. Molecular modelling. Note that the CPK values of Ar have been downscaled for esthetic
reasons.
18
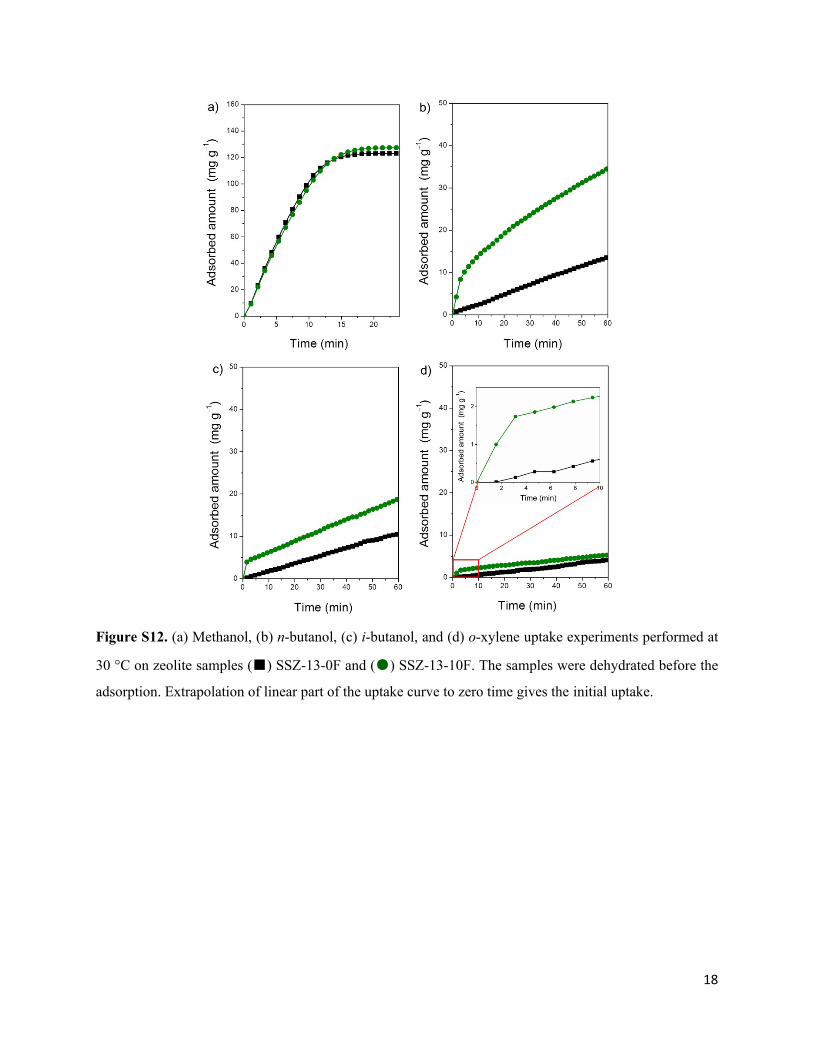
Figure S12. (a) Methanol, (b) n-butanol, (c) i-butanol, and (d) o-xylene uptake experiments performed at
30 °C on zeolite samples (■) SSZ-13-0F and (●) SSZ-13-10F. The samples were dehydrated before the
adsorption. Extrapolation of linear part of the uptake curve to zero time gives the initial uptake.

19
Figure S13. (a) Propylene uptake experiments performed at 30 °C on zeolite samples (■) SSZ-13-0F and
(●) SSZ-13-10F. The samples were dehydrated before the adsorption. (b) Infrared spectra of SSZ-13-0F
and SSZ-13-10F after prolonged propylene exposure at 30 °C (bands at 2962 cm−1, 2937 cm−1, 2871 cm−1,
1466 cm−1, and 1380 cm−1 are due to olefinic oligomers). Confocal fluorescence micro-photographs of (c)
SSZ-13-0F and (d) SSZ-13-10F crystals collected after uptake of propylene. Images c and d, in false
colours, were taken in the middle plane of single crystals. The excitation wavelength of the laser is 561
nm and detection was in the 570-620 nm range.

20
Table S1. Lifetime, product selectivity of MTO reaction after 1 h time on stream over SSZ-13 zeolites.
Selectivity (%)Zeolite
Coke (%)
t50
a
(h)t98
b
(h)TCCc (g g−1) C
1C
2= C
2C
3= C
3C
4-C
6d
SSZ-13-0F 14.1 5.1 2.1 6.8 0.8 40.6 0.2 41.0 2.7 14.7
SSZ-13-5F 18.1 7.3 3.5 8.8 0.5 42.5 0.6 38.9 1.0 16.5
SSZ-13-10F 19.7 10.1 5.2 12.5 0.7 38.2 0.4 41.7 2.2 16.8a lifetime is defined as the time to reach 50 % of methanol conversion;b lifetime is referred to the time to reach 98 % of methanol conversion;c total methanol conversion capacity.d sum of olefins and paraffins selectivity.
21
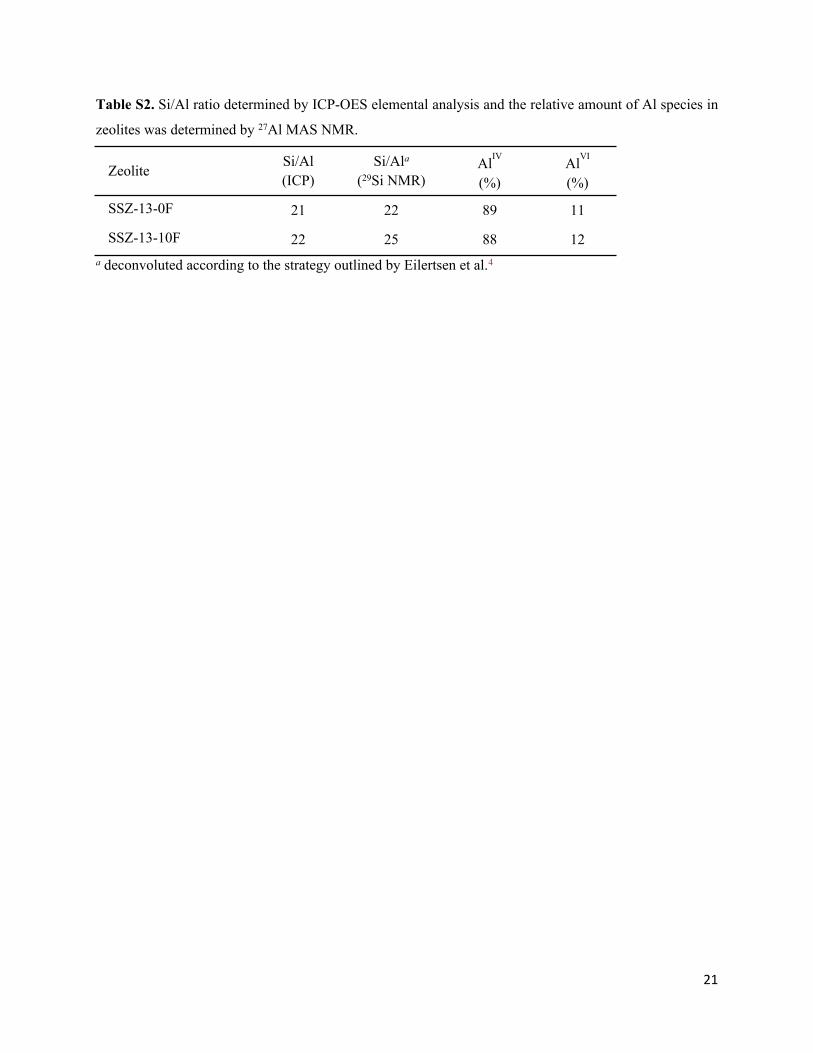
Table S2. Si/Al ratio determined by ICP-OES elemental analysis and the relative amount of Al species in
zeolites was determined by 27Al MAS NMR.
ZeoliteSi/Al (ICP)
Si/Ala (29Si NMR)
AlIV
(%)AlVI
(%)
SSZ-13-0F 21 22 89 11
SSZ-13-10F 22 25 88 12a deconvoluted according to the strategy outlined by Eilertsen et al.4
22
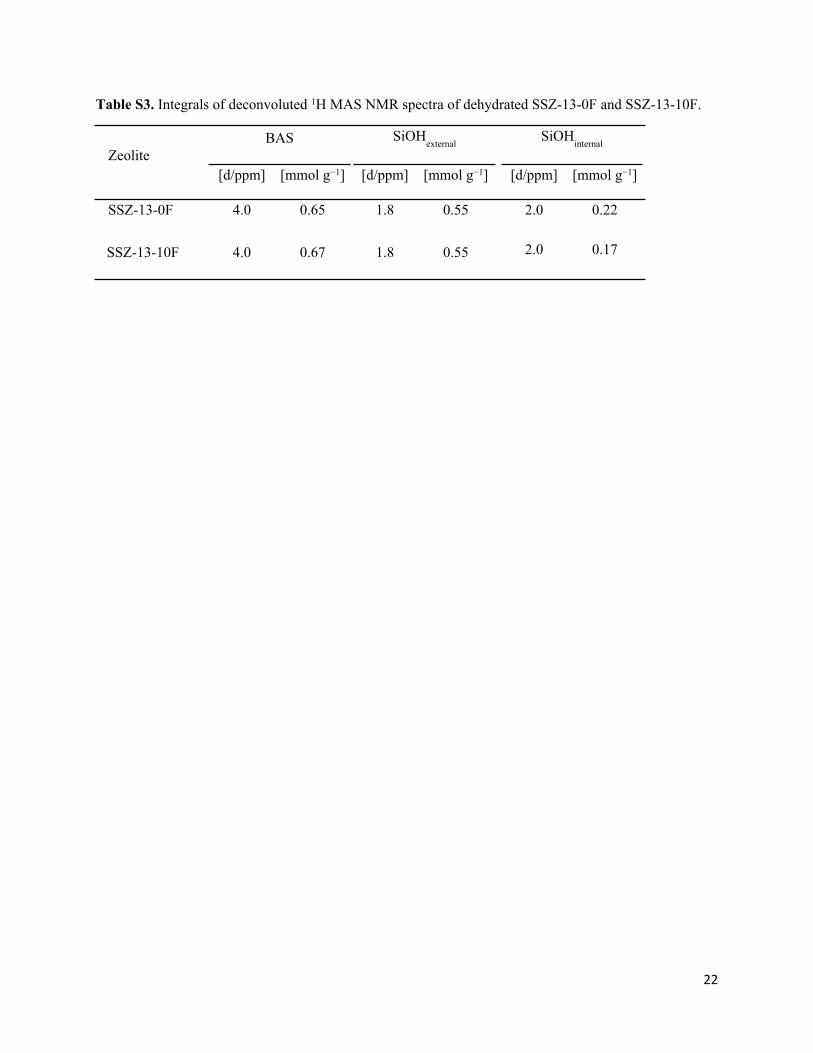
Table S3. Integrals of deconvoluted 1H MAS NMR spectra of dehydrated SSZ-13-0F and SSZ-13-10F.
BAS SiOHexternal
SiOHinternal
Zeolite[d/ppm] [mmol g−1] [d/ppm] [mmol g−1] [d/ppm] [mmol g−1]
SSZ-13-0F 4.0 0.65 1.8 0.55 2.0 0.22
SSZ-13-10F 4.0 0.67 1.8 0.55 2.0 0.17
23
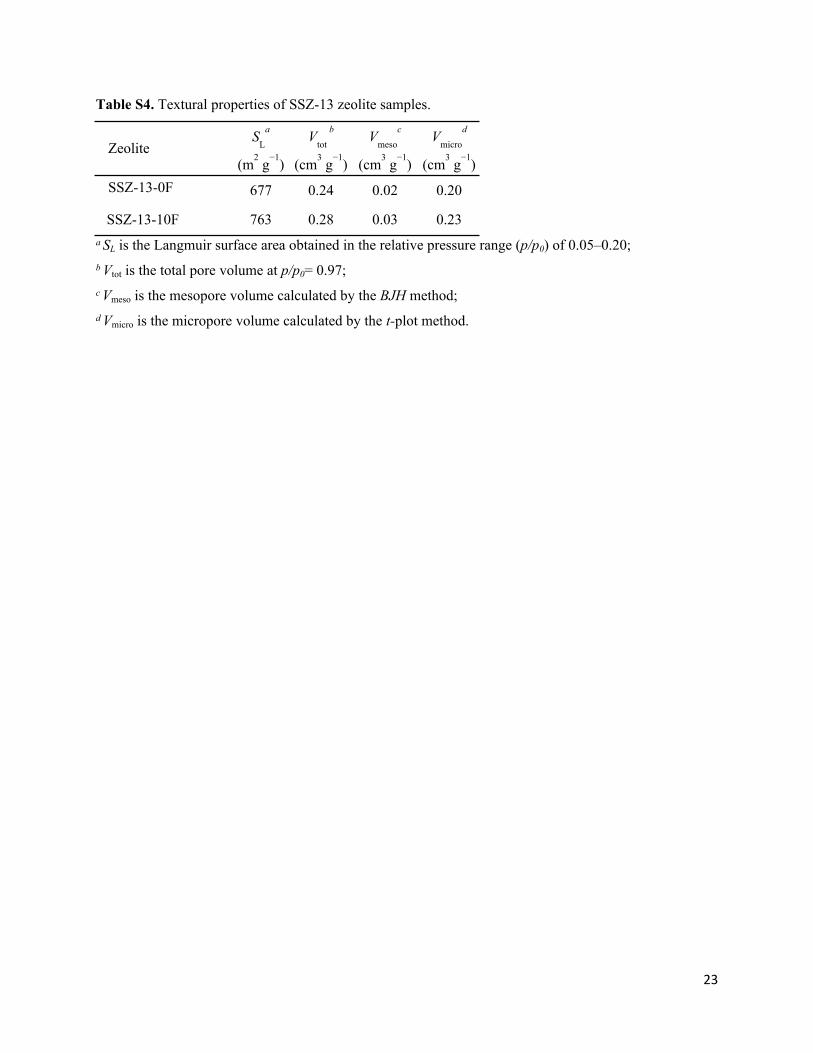
Table S4. Textural properties of SSZ-13 zeolite samples.
ZeoliteS
La
(m2 g−1)
Vtot
b
(cm3 g−1)
Vmeso
c
(cm3 g−1)
Vmicro
d
(cm3 g−1)SSZ-13-0F 677 0.24 0.02 0.20
SSZ-13-10F 763 0.28 0.03 0.23a SL is the Langmuir surface area obtained in the relative pressure range (p/p0) of 0.05–0.20; b Vtot is the total pore volume at p/p0= 0.97;c Vmeso is the mesopore volume calculated by the BJH method;d Vmicro is the micropore volume calculated by the t-plot method.
24
References
1. L.A. Villaescusa, I. Bull, P.S. Wheatley, P. Lightfoot and R.E. Morris, J. Mater. Chem., 2003, 13, 1978.
2. L. Delmotte et al., Zeolites, 1990, 10, 778.
3. J.H. Clark, E.M. Goodman, D.K. Smith, S.J. Brown and J.M. Miller, J. Chem. Soc. Chem. Commun.,
1986, 657.
4. E. A. Eilertsen, B. Arstad, S. Svelle and K. P. Lillerud, Microporous Mesoporous Mater., 2012, 153,
94.