Embed Size (px)
Citation preview
Fluorescence Techniques to StudyLipid Dynamics
Erdinc Sezgin and Petra Schwille
Biophysics Group, BIOTEC, TU Dresden, 01307 Dresden, Germany
Correspondence: [email protected]
Biological research has always tremendously benefited from the development of key meth-odology. In fact, it was the advent of microscopy that shaped our understanding of cells as thefundamental units of life. Microscopic techniques are still central to the elucidation of bio-logical units and processes, but equally important are methods that allow access to thedimension of time, to investigate the dynamics of molecular functions and interactions.Here, fluorescence spectroscopy with its sensitivity to access the single-molecule level,and its large temporal resolution, has been opening up fully new perspectives for cellbiology. Here we summarize the key fluorescent techniques used to study cellular dynamics,with the focus on lipid and membrane systems.
To elucidate cellular processes in their nativedynamic environment has been one of the
main issues in cell biology over the past decades.The lack of appropriate techniques has longbeen the main limiting step for the researchon dynamic systems, because it was impossibleto acquire real time information with thewell-known biochemical techniques. The keychallenge in dynamically observing biologicalsystems is to combine the ability to resolvemoderate to very low concentrations of mole-cules—because they are simply limited in livingcells—on relevant timescales. Relevant time-scales in cell biology can be minutes and hours,on a systemic level of cell metabolism, downto the microsecond and even nanosecondregime in which molecular and intramolecularrearrangements take place. With respect to li-pidic systems, relevant dynamics range from
the local movements of lipids by diffusion tothe mechanical transformations of whole mem-branes, spanning several orders of magnitude intime to be covered. Like for other cellular pro-cesses, the investigation of lipids and mem-branes also in general benefited greatly fromthe introduction of fluorescence microscopyand spectroscopy to biology. After the 1960s,great technological inventions based on thephenomenon of fluorescence were made, suchas confocal microscopy, fluorescence recoveryafter photobleaching (FRAP), fluorescence cor-relation spectroscopy (FCS), Forster resonanceenergy transfer (FRET), total internal reflectionfluorescence (TIRF), and two-photon micros-copy, that not only revolutionized imagingbut also yielded access to dynamics on previ-ously inaccessible timescales. Another very bigstep was certainly taken after the introduction
Editor: Kai Simons
Additional Perspectives on The Biology of Lipids available at www.cshperspectives.org
Copyright # 2011 Cold Spring Harbor Laboratory Press; all rights reserved.
Advanced Online Article. Cite this article as Cold Spring Harb Perspect Biol doi: 10.1101/cshperspect.a009803
1
on June 29, 2018 - Published by Cold Spring Harbor Laboratory Press http://cshperspectives.cshlp.org/Downloaded from
of fluorescent proteins, which again acceleratedthe use of these techniques in living cells andorganisms. Nowadays, the technical advance-ments of fluorescence-based methods allow usto explore systems as small as single moleculeswith temporal resolution down to the nanosec-onds regime. Lately, even the resolution limit ofoptical microscopy, for a long time being one ofthe fundamental barriers in elucidating cellularprocesses, has been overcome by smart applica-tions of the phenomenon of fluorescence.
This article aims at giving a short overviewon mainly fluorescence-based methods thathave in recent years propelled lipid and mem-brane research to fully new levels. We will givea short introduction to the modern fluores-cence technology in general, referring to thetechniques that allow addressing dynamics. Aparticular focus will be on fluorescence corre-lation spectroscopy, a technique that our labworks primarily on, but other important meth-ods will also be discussed, including their prom-ises, achievements, and caveats.
FLUORESCENCE TO STUDY LIPIDDYNAMICS
The attempt to visualize the “living units” hasprogressed remarkably after Hooke’s Micro-graphia. Starting from a simple light source, amechanical stage, and up to three glass lenses,microscopy nowadays culminated in so-calledsuper-resolution techniques with particle lo-calization accuracies down to the nanometerrange. Certainly, the involvement of the phe-nomenon of fluorescence is one of the biggeststeps in this long journey.
Fluorescence is such a ubiquitous phenom-enon that it is impossible to speculate about itsfirst systematic observation. The first reporteddocumentation of fluorescence is thought to beNicolas Monardes’ observation of wood extract.In 1845, John Herschel observed the fluorescentproperty of quinine sulphate which is believedto be the onset of modern fluorescence spec-troscopy. After many more observations by sev-eral light philosophers in the 19th century, it wasStokes who actually termed this phenomenon“fluorescence” in 1838. The first application in
biology was probably in 1914 Stanislav von Pro-vazek who used fluorescence as a cell stain.August Koehler and Oskar Heimstadt were re-portedly the first scientists who performed fluo-rescence microscopy in early 1900s. Today, acentury later, fluorescence imaging and micros-copy is one of the most powerful tools in thevisualization and dynamic analysis of livingstructures, especially following the discovery offluorescent proteins as cloneable markers, andthe invention and widespread use of confocalmicroscopy. Minsky, its inventor, patented theidea of confocal microscopy already in the1950s, and about 20 years later, the first commer-cial confocal microscopes appeared. Since then,many researchers and optical engineers step bystep improved the technical realization (Bra-kenhoff et al. 1979; Davidovi and Egger 1973;Egger and Petran 1967; Hamilton and Wilson1986; Sheppard and Wilson 1979). The rapiddevelopments in laser and detector technology,along with the onset of fiber optics certainlyhelped in the rapid dissemination of confocalmicroscopy into cell biology laboratories aroundthe world (Amos and White 2003).
When light interacts with matter, many pho-tophysical phenomena may occur. Some mole-cules absorb light at a particular wavelength,whereas others predominantly scatter the light.On absorption, the molecules undergo vibra-tional relaxation on timescales between 10214
and 10212 sec, and then return to ground state,either by emitting a photon at a longer wave-length after 1029 to 1027 nsec, which is calledfluorescence, or nonradiatively. Less probably,the molecules can jump to the quantum-mechanically forbidden triplet state or mole-cules transfer their energy to other molecules,by quenching or resonant energy transfer. Afterthe molecules undergo the triplet state, theyreturn to the ground state either by emittinglight in longer time ranges than fluorescence ornonradiatively.
In the following sections, we will brieflytouch on the task of fluorescently labeling lipidsto be investigated, and then discuss, one by one,the most powerful biophysical techniques tostudy lipids and membranes in real time, alongwith some of their relevant applications.
E. Sezgin and P. Schwille
2 Advanced Online Article. Cite this article as Cold Spring Harb Perspect Biol doi: 10.1101/cshperspect.a009803
on June 29, 2018 - Published by Cold Spring Harbor Laboratory Press http://cshperspectives.cshlp.org/Downloaded from
Fluorescent Probes to Study Lipid Dynamics
After the invention of green fluorescent protein(GFP) as the first truly genetic fluorescent probe,visualizing proteins in their native environmentbecame much more straightforward. From theperspective of the membrane researcher, thissignificantly improved our understanding ofmembrane proteins and their dynamics, butcould help only marginally in better elucidatingthe functional dynamics of lipids. The firstreport on labeling lipids in living cells usedazide-alkyne to label alkyne containing PA(Schultz et al. 2010). Besides this direct labeling,coupling the synthetic fluorescence molecules tolipids in vitro, and then reconstitute them to thecell membrane is getting more common in lipidfield, enforcing the use of fluorescence also inlipid biology. Synthetic dye coupling has manyadvantages compared to fluorescent proteins,which nowadays represent the main strategy inprotein labeling. First of all, one has theoreticallya large choice of organic dyes in terms of theiroptical characteristics. It is possible, for instance,to use a far red dye; however, there is not yet awell-established monomeric far red protein.Second, the quantum efficiency and brightnessof most of the organic dyes are higher thanfor fluorescent proteins. Cholesterol (Boldyrevet al. 2007; Holtta-Vuori et al. 2008; Markset al. 2008; Oreopoulos and Yip 2009), Sphingo-myelin (Marks et al. 2008; Eggeling et al. 2009;Tyteca et al. 2010), GM1 (Coban et al. 2007; Egg-eling et al. 2009; Mikhalyov et al. 2009), PC,and PE (Baumgart et al. 2007; Juhasz et al.2010) are some of the lipids that are often conju-gated to organic dyes. Additionally, fluorescentlylabeled membrane-binders, like choleratoxin,are used to label, for example, the GMs on thecell surface (Middlebrook and Dorland 1984).However, taking into account that organic fluo-rophores are in comparison much larger handi-caps to small lipid molecules than they are toproteins, and that the relatively tight packingof lipids in a membrane might be more easilydisturbed by labeled lipids than in the case ofsoluble proteins, a careful control of the possibleinfluence of labels on the functionality of lipidsis of utmost importance.
Besides fluorescent lipid conjugates, thereare some lipophilic fluorescent molecules fre-quently used to yield information on a specificlipid environment. They efficiently and selec-tively penetrate into lipid membranes, and tosome extent even reflect on their physical prop-erties, like viscosity, order, pH, or water content.DiO, DiD, DiI, Laurdan, and NAP are the lipo-philic dyes most commonly used to visualizethe lipid environment (Baumgart et al. 2007).Although the Di family of dyes is phase-prefer-ring probes preferring either liquid-ordered(Lo) phase or liquid-disordered (Ld) phase in aspecific setting, Laurdan has a different property.It partitions equally in both phases, but its emis-sion spectrum changes according to the polarityof the membrane environment. Providing thatLd phase is more aqueous than Lo phase, on exci-tation the dye consumes some of its energy toreorient the water molecules in Ld phase, whichshifts the emission to the red spectral region(emission maximum of 490 nm), whereas it ismore blue shifted in Lo region (emission maxi-mum of 440 nm). According to the ratio offluorescence intensity in the blue-shifted (Lo
phase) and the red-shifted region (Ld phase),one can calculate an order indicative value calledgeneralized polarization (GP) calculated as
GP ¼ I440 � I490
I440 þ I490, (1)
where Ix denotes the intensity at wavelength of x.In addition to generalized polarization,
fluorescence anisotropy is another importantphenomenon that can be exploited to monitorrotational diffusion of the molecules by usingthe polarization of light. Because rotational dif-fusion is very sensitive to the size of molecules,binding constants can be efficiently derivedfrom fluorescence anisotropy measurements.There have been comparative studies on the fea-sibility of several dyes for fluorescence anisot-ropy. Alexa and Oregon dyes conjugates withbiological molecules (e.g., lipids), for instance,were found to be suitable for this method (Rusi-nova et al. 2002). Additionally, NBD and DHPlipid conjugates were used for fluorescence ani-sotropy to detect rafts in living cells (Gidwaniet al. 2001). Laurdan generalized polarization
Fluorescence Techniques to Study Lipid Dynamics
Advanced Online Article. Cite this article as Cold Spring Harb Perspect Biol doi: 10.1101/cshperspect.a009803 3
on June 29, 2018 - Published by Cold Spring Harbor Laboratory Press http://cshperspectives.cshlp.org/Downloaded from
and fluorescence anisotropy were comparedelsewhere (Engelke et al. 2001).
Besides lipid probes for the plasma mem-brane, there are also some tools to probe otherlipidic environments in the cell, such as lipiddroplets (Thiele and Spandl 2008). New fluores-cent lipids were developed to visualize the intra-cellular and membrane lipids in their nativeenvironment without any external fluorescentlabels (Kuerschner et al. 2005; Spandl et al. 2009).
Confocal Microscopy
Confocal microscopy may easily be the mostwidely applied imaging technique in cell andmolecular biology field because it allows livecell imaging with high spatial and temporal res-olution, as well as optical sectioning and 3Dreconstruction of images. To start with the tech-niques for cell dynamics, confocal microscopyshould therefore be briefly mentioned becauseit forms the basis (and often the gold standard)for most of the other techniques.
The confocal concept evolved as an alter-native to wide-field microscopy. For wide-fieldmicroscopy, the so-called Koehler illuminationguarantees a homogeneous illumination of thewhole sample, which is then detected by areadetectors. In contrast to this, confocal illumina-tion occurs only at a resolution-limited point,which can then be sequentially scanned in threedimensions throughout the sample. As a tech-nical difference, coherent light sources (lasers)are usually employed in confocal microscopy,whereas incoherent lamps are still mostly usedin wide-field microscopy. However, the basicdifference between wide-field and confocal mi-croscopies is a so-called pinhole aperture whicheliminates the out-of-focus light in the imageplane, being the main source of background inwide field. The minimal size of the confocal illu-mination volume, and therefore the resolutionthat can be reached in confocal microscopy isusually determined by the so-called Rayleigh cri-terion. Here, resolution of the wide field isdefined as the shortest distance d between twooptically separable points:
d ¼ 0:61� l
NA, (2)
where l is the wavelength and NA is the numer-ical aperture of the objective. When the advan-tage of selective detection (pinhole) andselective illumination (diffraction limited spotby coherent light source) are applied, the resolu-tion reaches a better point:
d ¼ 0:4� l
NA, (3)
Taking above equation into consideration, thetheoretical resolution of a confocal system withan NA of 1.4, at a wavelength of 500 nm shouldbe �160 nm. However, all theoretical calcula-tions consider a perfect optical system and a pin-hole of a laser spot size (i.e., Airy disc size). Yet,there are many aberrations caused by imperfectoptics such as spherical aberrations, chromaticaberrations, astigmatism, comma etc. Moreover,pinhole size can never be as small as laser spotsize. The biggest problem in confocal micros-copy is, however, the large discrepancy betweenlateral (x–y) and axial resolution, resulting inimage stacks that are usually quite blurred inthe z dimension.
Axial resolution is given by
dz ¼1:4� l� n
NA2 , (4)
where n is the refractive index of the medium.The axial resolution is usually three to five timesworse than lateral resolution.
The limitation in axial resolution is a minorproblem for pure membrane systems with littleto no contribution of fluorescence light comingfrom the solution above and below the mem-brane. Thus, confocal microscopy has been par-ticularly useful on supported membranes orgiant unilamellar vesicles (GUVs) (Korlachet al. 1999). On the other hand, for the studyof cellular membranes with their rather highbackground from cellular autofluorescenceand labeled molecules that cannot easily beretained at the cell surface (e.g., because ofendocytosis), limited z resolution can be a sig-nificant technical problem in studying lipiddynamics. For this reason, other illuminationstrategies established for fluorescence micros-copy, such as total internal reflection (TIR), are
E. Sezgin and P. Schwille
4 Advanced Online Article. Cite this article as Cold Spring Harb Perspect Biol doi: 10.1101/cshperspect.a009803
on June 29, 2018 - Published by Cold Spring Harbor Laboratory Press http://cshperspectives.cshlp.org/Downloaded from
becoming increasingly popular for lipid andmembrane research.
Total Internal Reflection Fluorescence(TIRF) Microscopy
Total internal reflection is a well-known phe-nomenon in everyday life. When a light beampasses from a medium with a refractive indexn1 to the other medium with a refractive indexn2, the relationship between the angle of inci-dence a1 and the angle of refraction a2 is deter-mined by Snell’s law:
n1 sina1 ¼ n2 sina2: (5)
When n1 . n2 (e.g., when light is propagat-ing from water or glass into air), there exists acriticala1 angle that would render the refractionangle to be 908 (i.e., parallel to the interface). Atincidence angles equal to or greater than thiscritical angle, light cannot cross the boundary,and is internally reflected. This phenomenonis called total internal reflection (TIR). The crit-ical angle (ac) is determined by the refractiveindices of the media:
ac ¼ sin�1 (n2=n1): (6)
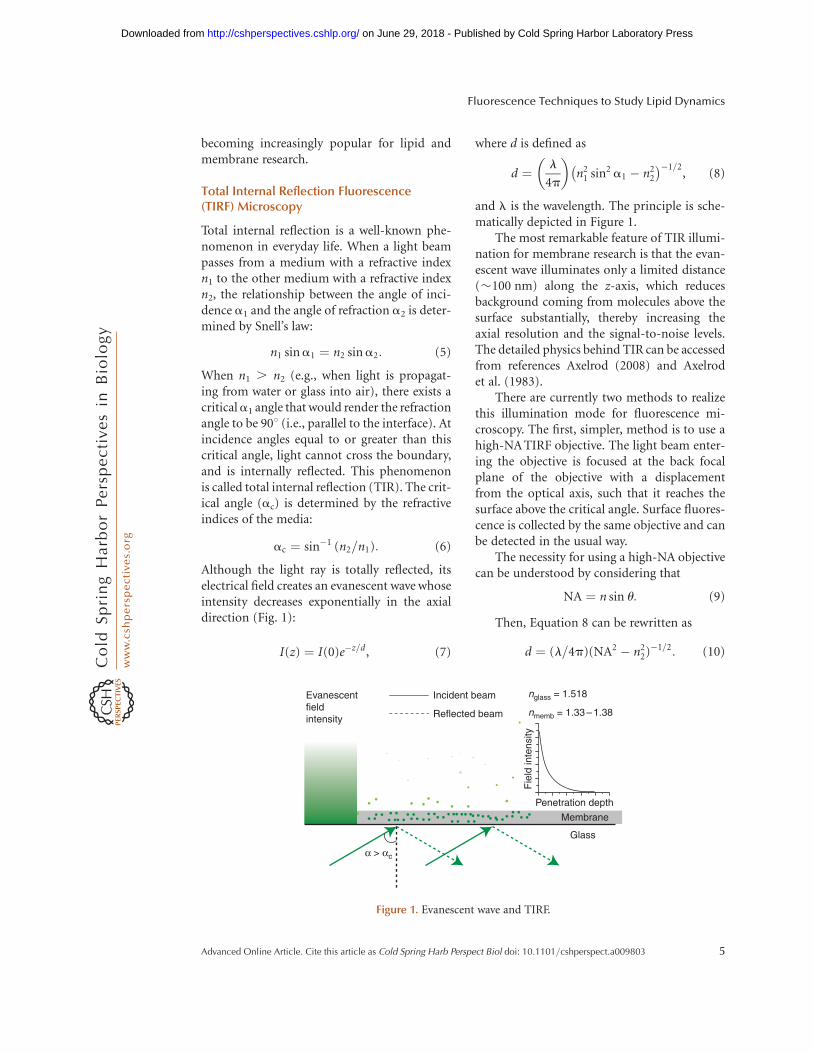
Although the light ray is totally reflected, itselectrical field creates an evanescent wave whoseintensity decreases exponentially in the axialdirection (Fig. 1):
I(z) ¼ I(0)e�z=d, (7)
where d is defined as
d ¼ l
4p
� �n2
1 sin2 a1 � n22
� ��1=2, (8)
and l is the wavelength. The principle is sche-matically depicted in Figure 1.
The most remarkable feature of TIR illumi-nation for membrane research is that the evan-escent wave illuminates only a limited distance(�100 nm) along the z-axis, which reducesbackground coming from molecules above thesurface substantially, thereby increasing theaxial resolution and the signal-to-noise levels.The detailed physics behind TIR can be accessedfrom references Axelrod (2008) and Axelrodet al. (1983).
There are currently two methods to realizethis illumination mode for fluorescence mi-croscopy. The first, simpler, method is to use ahigh-NA TIRF objective. The light beam enter-ing the objective is focused at the back focalplane of the objective with a displacementfrom the optical axis, such that it reaches thesurface above the critical angle. Surface fluores-cence is collected by the same objective and canbe detected in the usual way.
The necessity for using a high-NA objectivecan be understood by considering that
NA ¼ n sin u: (9)
Then, Equation 8 can be rewritten as
d ¼ (l=4p)(NA2 � n22)�1=2: (10)
Penetration depth
Membrane
Glass
Evanescentfieldintensity
Incident beam
α > αc
Reflected beam
nglass = 1.518
nmemb = 1.33 – 1.38
Fie
ld in
tens
ity
Figure 1. Evanescent wave and TIRF.
Fluorescence Techniques to Study Lipid Dynamics
Advanced Online Article. Cite this article as Cold Spring Harb Perspect Biol doi: 10.1101/cshperspect.a009803 5
on June 29, 2018 - Published by Cold Spring Harbor Laboratory Press http://cshperspectives.cshlp.org/Downloaded from
When NA , n2, d is imaginary, which meanslight is refracted and TIR is lost. That is whythe NA of TIRF objectives should be higherthan the refractive index of the sample medium.A living cell has a refractive index of 1.33–1.38.Many current TIRF objectives thus have a NA of1.45, which creates a penetration depth of theevanescent field of 82 nm at 488 nm excitationjust above the critical angle.
The second way to create an evanescentwave is to use a prism. In this case, the sampleis located between the prism and objective.The illumination is performed through theprism, while the objective collects the emissionand transfers the signal to the camera. Thisdecoupling of illumination and detection canbe quite useful to create large illuminationareas, but is less comfortable than objective-based TIR, which can be easily realized in anyfluorescence microscope.
Further advantages of prism-based TIR arelower background and a better control on angleand polarization. It is also easy to set up for twocolors. On the other hand, the free access to oneside of the sample, safety of lasers, ease to usewith cell culture plates can be counted as theadvantages of objective-based system.
TIRF can be coupled to other techniquesas a specific illumination mode when good zresolution is crucial. It has been combinedwith FCS, FRET, FRAP, AFM, fluorescentlifetime imaging, two-photon excitation, opti-cal traps, and interference reflection. Somecombinations of these techniques will be dis-cussed later.
Polarized TIRF
The fluorophores can be excited only if theirdipole is parallel to the excitation light dipole,which is called photoselection. A variationof TIRF called polarized TIRF uses polarizedlight perpendicular to the incidence plane(p-polarized) and parallel to the incidenceplane (s-polarized) to overcome this limit. Ifthe dipole of a fluorophore is always parallelto the membrane surface, p-polarized lightcan help to excite only the regions where themembrane is not parallel to the surface. The
investigation of membrane curvature can bean important application field for polarizedTIRF (Axelrod 2008).
TIRF Applications on Membrane Dynamics
There have been many studies to elucidatemembrane dynamics using TIRF. Recently, ithas been shown that TIRF has the capacity toshow the adsorption of proteins and peptidesto lipids in SLBs (Fox et al. 2009; Jorgensenet al. 2009). TIRF was combined with single-particle tracking to show the enrichment ofGPI-anchored proteins in sphingolipid richregions, as proposed by lipid raft theory(Pinaud et al. 2009). A new method has alsobeen applied to detect lipid rafts, called LG-TIRF (Sohn et al. 2010). Other applicationswere to elucidate the role of ceramide in mem-brane restructuring (Ira et al. 2009), the organ-ization of bacterial light harvesting complex 2(Dewa et al. 2006), the role of cholesterol inantibody binding (Yu et al. 2009), EGFR activa-tion by EGF (Sako et al. 2000; Cannon et al.2005; Teramura et al. 2006), and the phasepreference of peptides (Choucair et al. 2007).Membrane curvature, exocytosis, and endocy-tosis are some other topics in which TIRF issuccessfully applied (Merrifield et al. 2002,2005; Byrne et al. 2008; Nagamatsu andOhara-Imaizumi 2008; Joselevitch and Zenisek2009; Ohara-Imaizume et al. 2009; Aoki et al.2010; Gorg et al. 2010; Lam et al. 2010).
Two-Photon Microscopy
The theoretical basis of two-photon excitationwas laid in a study of the early 1930s (Goppert1929), although the experimental realizationtook almost three decades (Kaiser and Garrett1961). It was first used in LSM in the 1970s(Hellwarth and Christensen 1975) but a con-vincing two-photon excitation fluorescencemicroscopy was only demonstrated in 1990(Denk et al. 1990).
Two-photon microscopy, as the name im-plies, uses simultaneous absorption of twolonger wavelength photons (at l1 and l2) toexcite a fluorophore, which would be usually
E. Sezgin and P. Schwille
6 Advanced Online Article. Cite this article as Cold Spring Harb Perspect Biol doi: 10.1101/cshperspect.a009803
on June 29, 2018 - Published by Cold Spring Harbor Laboratory Press http://cshperspectives.cshlp.org/Downloaded from
excited by a single photon at a shorter wave-length (l3). The relationship between the wave-lengths is
l3 ¼1
l�11 þ l�1
2
: (11)
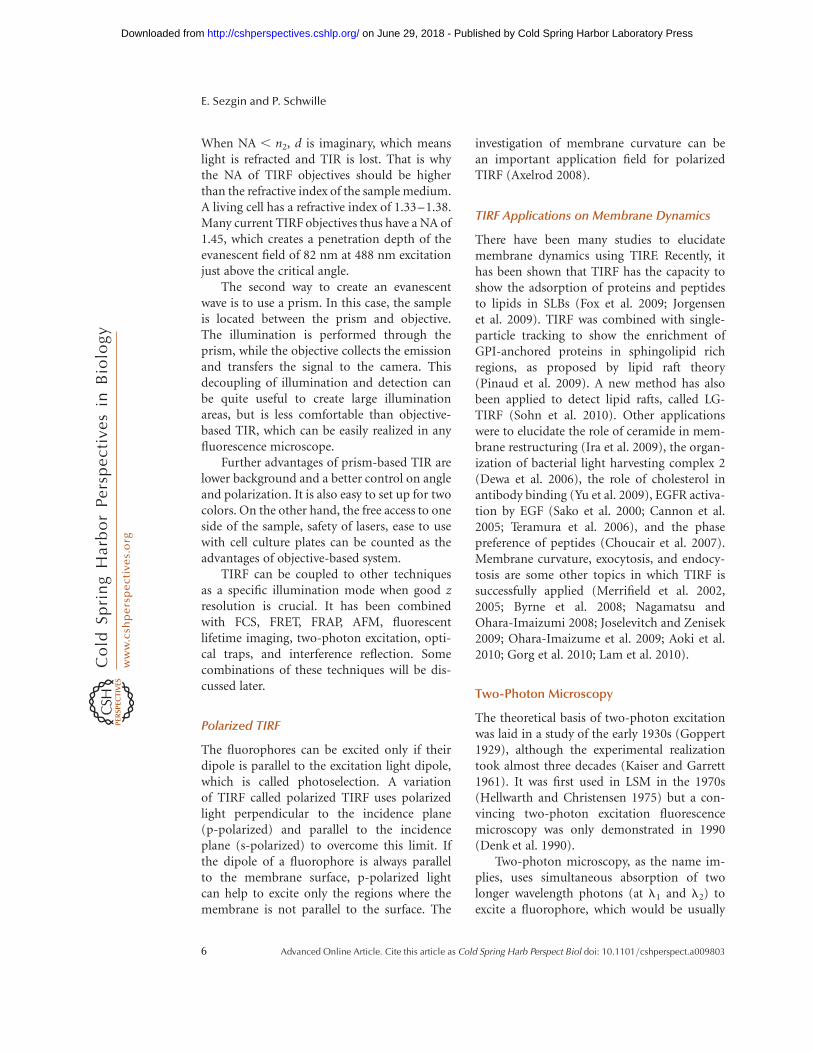
Because the two photons have to be absorbedsimultaneously to excite the fluorophore,the excitation is dependent on the square ofthe light intensity. This could be thought as anequivalent of the double selection in confocalimaging, achieved by a selective illuminationby the light source and selective detection bya pinhole. Therefore, in the two-photon illumi-nation mode, a pinhole is no longer necessary.Moreover, it minimizes the out-of-focus photo-bleaching because the excitation only occurs inthe vicinity of the focal plane (Fig. 2). Scatteringis greatly reduced with two-photon excitation,and penetration depths for the long wavelengthexcitation are increased.
Because the emission does not have to passthrough a pinhole, area detectors can be usedand no descanning of the beam is necessary,making detection quite simple.
Another advantage of two-photon micros-copy is its ability to excite fluorophores absorb-ing in the UV by two photons in visible range,which surpasses usual UV transmission prob-lems with glass lenses. In combination withthe reduced out-of-focus fluorescence, it alsoprovides a suitable tool for UV uncaging invivo without significant photo damage.
The photon density in two-photon excita-tion should be about one million times higherthan is required for single-photon excitation,because of the square dependence of theabsorption on intensity. Therefore, pulsed lasersshould be used with sufficient photon fluxin the pulses while having fairly low averagepower. Titanium-sapphire lasers are extensivelyused for two-photon microscopes because theyprovide a wide range of excitation wavelengthsbetween 700 and 1100 nm. Because of differentphotophysical selection rules, two-photon ab-sorption spectra are not identical with twicethe spectra for one-photon excitation, and havetherefore to be independently determined. Inthe same way as for TIR illumination, two-photon excitation can be combined with othersingle-molecule techniques.
Applications
Two-photon microscopy is very suitable toexcite photosensitive, easily bleachable lipidprobes in the blue to near-UV spectral range,such as Laurdan or C-Laurdan. These probeswere used to detect the membrane domains inmodel membranes, as well as in living cells, bytwo-photon microscopy (Parasassi et al. 1997;Bagatolli and Gratton 1999, 2000a,b; Dietrichet al. 2001; Bagatolli 2003; Bagatolli et al.2003; Kim et al. 2007; Kaiser et al. 2009). Theorder of different membrane systems was inves-tigated (Gasecka et al. 2009), and new probes
Figure 2. (A) Two-photon illumination and (B) single-photon illumination.
Fluorescence Techniques to Study Lipid Dynamics
Advanced Online Article. Cite this article as Cold Spring Harb Perspect Biol doi: 10.1101/cshperspect.a009803 7
on June 29, 2018 - Published by Cold Spring Harbor Laboratory Press http://cshperspectives.cshlp.org/Downloaded from
to visualize the membrane order were tested bytwo-photon microscopy (Jin et al. 2006; Kimet al. 2008; Klymchenko et al. 2009).
Fluorescence Recovery afterPhotobleaching (FRAP)
FRAP or, under its previous name, fluorescencephotobleaching recovery (FPR) was first de-scribed in the late 1970s (Axelrod et al. 1976;Koppel et al. 1976) and got very popular inthe 1990s because of the improvements in opticsand the discovery of fluorescent proteins.
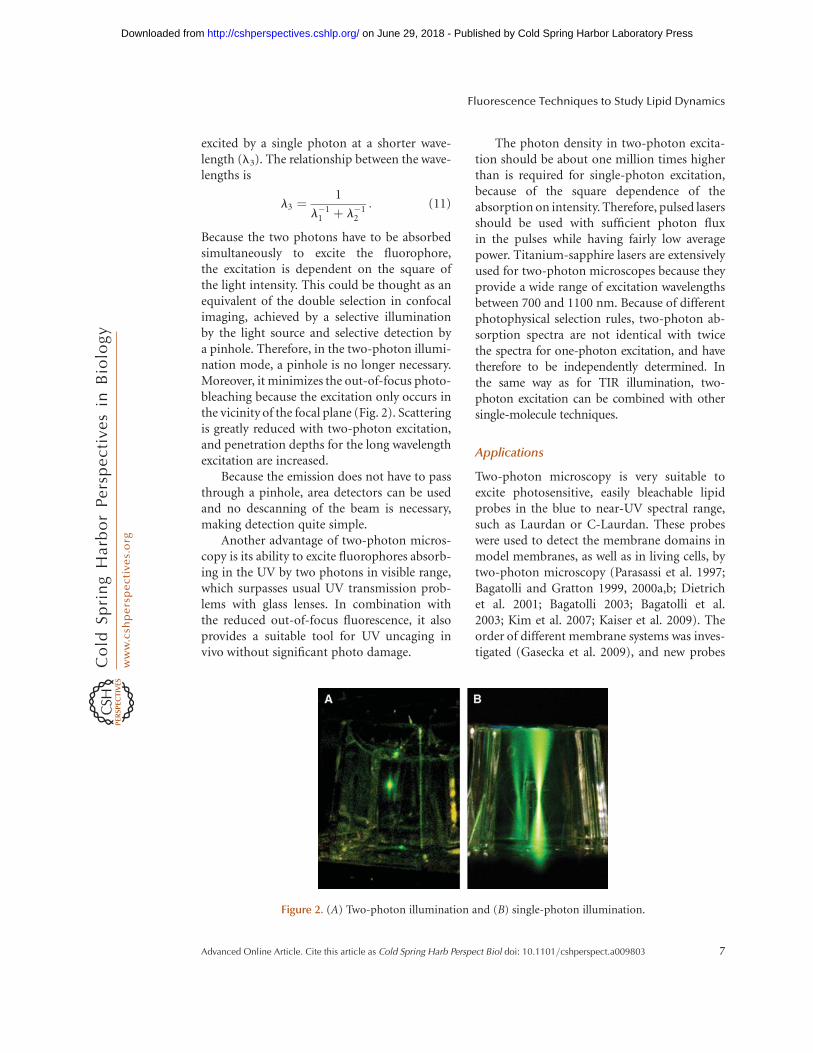
FRAP is a technique that exploits the pho-tobleaching property of fluorophores. A regionof interest (ROI) is bleached with a high laserpower. Then, the ROI is observed for fluores-cence recovery, caused by diffusion, interactionsor reactions of the surrounding fluorophores,which yields a recovery curve. This curve typi-cally looks like the one shown in Figure 3. Itsmost remarkable features are the bleachingstep, an exponential-like recovery with charac-teristic half-time, and a recovery level usuallylower than the initial level, whose offset is theso-called “immobile fraction.”
According to the steepness of the recovery,diffusion coefficients, binding rates or turnoverrates can be determined. The steeper the recov-ery is, the faster the molecules are, with diffusion
coefficients (D) determined by the Stokes–Ein-stein relationship for spherical molecules:
D ¼ kBT
6phr, (12)
where kB is the Boltzman constant, T is the abso-lute temperature, h is the viscosity, and r is thehydrodynamic radius of the spherical particles.
Because photobleaching is an irreversibleprocess, immobile molecules will not recoverat all. Therefore, one can obtain the im-mobile fraction of molecules as an additionalinformation from FRAP curves. To get accuratequantitative information, the intensity profilesof bleached ROI, as well as an unbleached pos-itive reference ROI on the same membrane, anempty ROI outside of the membrane, and thewhole cell or membrane have to be derived.Then, the recovery should be normalizedaccording to these values (Kenworthy 2007).
Normalized FRAP curves should be fittedto the appropriate models, to get the halftime which is the time required for half ofthe recovery. The simplest fitting is by a singleexponential:
f (t) ¼ A(1� e�tt): (13)
The diffusion coefficient can then be deter-mined as
D ¼ r20g
4t1=2, (14)
where r0 is 1/e2 radius of the Gaussian laserbeam, g is the parameter that depends on thephotobleaching extend varying from 1.0 to 1.2depending on ROI shape, and t1/2 is the half-time. In case of a uniform circular spot ROI,
D ¼ 0:224r2=td: (15)
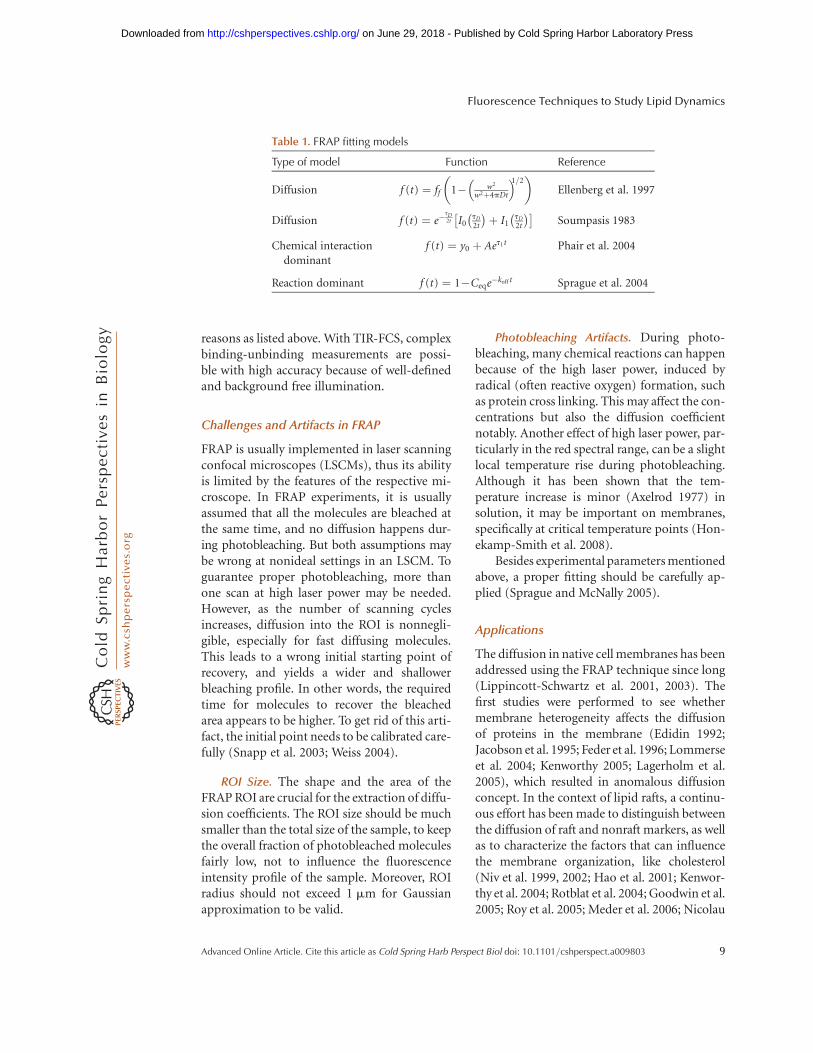
Many fitting models for diffusion, interactionand reaction have been developed recently,some of which are listed in Table 1.
TIR-FRAP
To measure the diffusion of molecules in amembrane, TIR illumination can be a betteroption than confocal microscopy for the same
Time
Inte
nsity
t1/2t0t < 0
A /2 A
1 – A
Figure 3. FRAP parameters. 0 , t is the time beforethe bleaching, t0 is the time at which bleachingoccurs, t1/2 is the half-life (i.e., the time at A/2), Ais the mobile fraction, and 1 – A is the immobilefraction.
E. Sezgin and P. Schwille
8 Advanced Online Article. Cite this article as Cold Spring Harb Perspect Biol doi: 10.1101/cshperspect.a009803
on June 29, 2018 - Published by Cold Spring Harbor Laboratory Press http://cshperspectives.cshlp.org/Downloaded from
reasons as listed above. With TIR-FCS, complexbinding-unbinding measurements are possi-ble with high accuracy because of well-definedand background free illumination.
Challenges and Artifacts in FRAP
FRAP is usually implemented in laser scanningconfocal microscopes (LSCMs), thus its abilityis limited by the features of the respective mi-croscope. In FRAP experiments, it is usuallyassumed that all the molecules are bleached atthe same time, and no diffusion happens dur-ing photobleaching. But both assumptions maybe wrong at nonideal settings in an LSCM. Toguarantee proper photobleaching, more thanone scan at high laser power may be needed.However, as the number of scanning cyclesincreases, diffusion into the ROI is nonnegli-gible, especially for fast diffusing molecules.This leads to a wrong initial starting point ofrecovery, and yields a wider and shallowerbleaching profile. In other words, the requiredtime for molecules to recover the bleachedarea appears to be higher. To get rid of this arti-fact, the initial point needs to be calibrated care-fully (Snapp et al. 2003; Weiss 2004).
ROI Size. The shape and the area of theFRAP ROI are crucial for the extraction of diffu-sion coefficients. The ROI size should be muchsmaller than the total size of the sample, to keepthe overall fraction of photobleached moleculesfairly low, not to influence the fluorescenceintensity profile of the sample. Moreover, ROIradius should not exceed 1 mm for Gaussianapproximation to be valid.
Photobleaching Artifacts. During photo-bleaching, many chemical reactions can happenbecause of the high laser power, induced byradical (often reactive oxygen) formation, suchas protein cross linking. This may affect the con-centrations but also the diffusion coefficientnotably. Another effect of high laser power, par-ticularly in the red spectral range, can be a slightlocal temperature rise during photobleaching.Although it has been shown that the tem-perature increase is minor (Axelrod 1977) insolution, it may be important on membranes,specifically at critical temperature points (Hon-ekamp-Smith et al. 2008).
Besides experimental parameters mentionedabove, a proper fitting should be carefully ap-plied (Sprague and McNally 2005).
Applications
The diffusion in native cell membranes has beenaddressed using the FRAP technique since long(Lippincott-Schwartz et al. 2001, 2003). Thefirst studies were performed to see whethermembrane heterogeneity affects the diffusionof proteins in the membrane (Edidin 1992;Jacobson et al. 1995; Feder et al. 1996; Lommerseet al. 2004; Kenworthy 2005; Lagerholm et al.2005), which resulted in anomalous diffusionconcept. In the context of lipid rafts, a continu-ous effort has been made to distinguish betweenthe diffusion of raft and nonraft markers, as wellas to characterize the factors that can influencethe membrane organization, like cholesterol(Niv et al. 1999, 2002; Hao et al. 2001; Kenwor-thy et al. 2004; Rotblat et al. 2004; Goodwin et al.2005; Roy et al. 2005; Meder et al. 2006; Nicolau
Table 1. FRAP fitting models
Type of model Function Reference
Diffusion f (t) ¼ ff 1� w2
w2þ4pDt
� �1=2� �
Ellenberg et al. 1997
Diffusion f (t) ¼ e�tD2t I0
tD
2t
� �þ I1
tD
2t
� �� Soumpasis 1983
Chemical interactiondominant
f (t) ¼ y0 þ Aet1t Phair et al. 2004
Reaction dominant f (t) ¼ 1�Ceqe�koff t Sprague et al. 2004
Fluorescence Techniques to Study Lipid Dynamics
Advanced Online Article. Cite this article as Cold Spring Harb Perspect Biol doi: 10.1101/cshperspect.a009803 9
on June 29, 2018 - Published by Cold Spring Harbor Laboratory Press http://cshperspectives.cshlp.org/Downloaded from
et al. 2006; Shvartsman et al. 2006). TIR-FRAPwas applied to calculate the rates of bindingand unbinding of hormones to and from thecell surface (Hellen and Axelrod 1991; Fulbrightand Axelrod 1993).
Fluorescence Correlation Spectroscopy (FCS)
FCS is a method that has been extensively usedand further developed by our group, beingintroduced and established as a very suitableapproach to characterize model and cellularmembranes (Schwille et al. 1999a; Bacia et al.2004). It is, in a way, a single-molecule method,but provides sufficient statistical significanceto also use it for general characterization ofmembranes, mainly through the diffusion prop-erties of their constituents. It is thus relatedto FRAP, but provides several advantages, themost crucial of which is the dramatically im-proved sensitivity, allowing to work at signif-icantly reduced fluorescence labeling densities.FCS has long been used to characterize domain-forming membranes (Korlach et al. 1999), andrecently, by combination with super resolutionillumination (Eggeling et al. 2009), was able toresolve nanometer-sized entrapment sites oflabeled raft-markers. Because of our intensiveefforts on FCS applied to membranes, this tech-nique will be discussed in more detail in thefollowing.
FCS measures small fluorescence intensityfluctuations in a defined volume. It providesaccurate information about diffusion coeffi-cients, concentrations, molecular brightness,intramolecular dynamics, and molecular inter-actions. It has been extensively used for a varietyof biological applications, because of its greatsensitivity. FCS has been combined with manydifferent imaging methods, such as laser scan-ning confocal microscopy, two-photon mi-croscopy, total internal reflection fluorescencemicroscopy, stimulated emission depletionnanoscopy, and others, making it particularlyfeasible for cell biology.
FCS was first established in the 1970s(Magde et al. 1972, 1974, 1978; Elson andMagde 1974) and technically greatly improvedin the following years (Rigler et al. 1993; Eigen
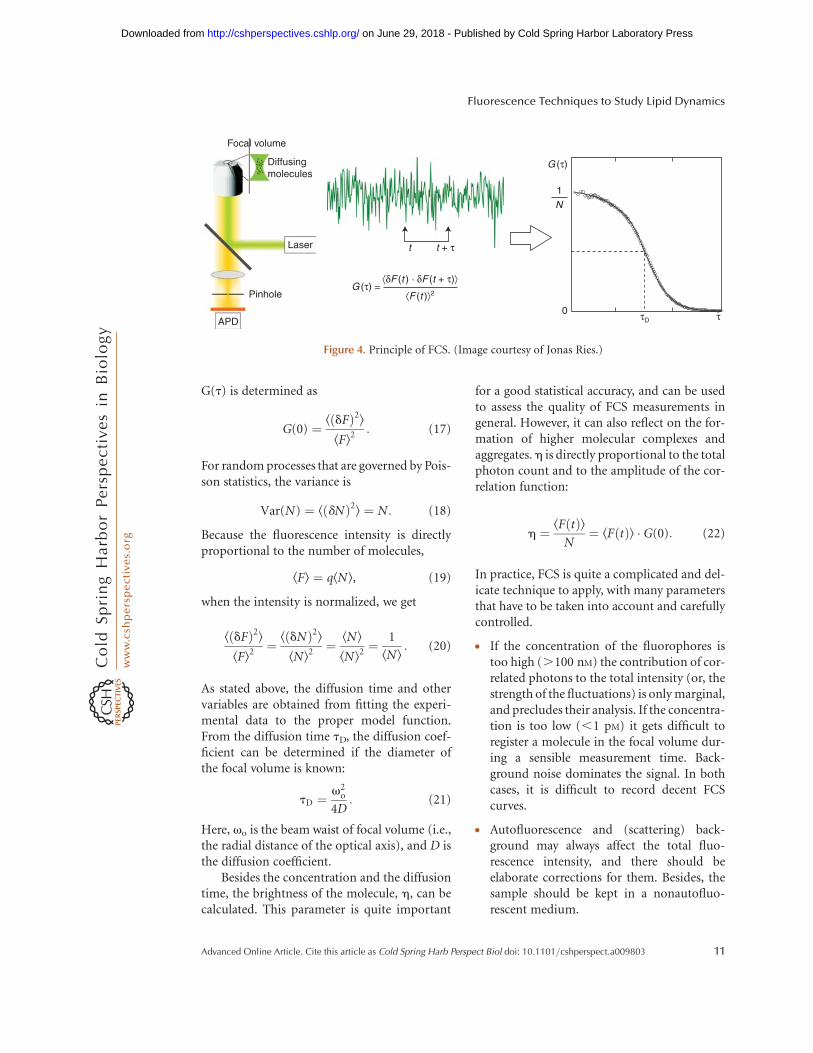
and Rigler 1994). Fluorescence intensity fluc-tuations, primarily addressed by FCS, can becaused by diffusion of the molecules throughthe observation volume, or by reversible bright-ness changes of the molecules because of somechemical or photophysical reactions (Petrovand Schwille 2007). FCS performs the statisticalanalysis of these fluctuations. In other words, itcorrelates a signal at a certain time t with thesame signal after a lag time t þ t, and takesthe temporal average. This correlation can bedescribed as self-similarity of the signal intime, which is represented by the autocorrela-tion function, a temporal decay function ofaverage fluctuations. The basic formula for thefluctuation autocorrelation function is
G tð Þ ¼ kdF tð Þ � dF t þ tð ÞlkF tð Þl2 , (16)
where dF(t) ¼ F(t) 2 kF(t)l is the fluctuationaround the average intensity and k l denotesthe temporal average; t is the lag time. Thedenominator is for normalization.
The basic steps of FCS experiments are asfollows. First, the sample is illuminated by theappropriate illumination technique. Generally,in the simplest representation of FCS, confocalillumination without beam-scanning is used.The fluorescence signal is collected by the objec-tive and detected by sensitive photodetectors,often by avalanche photodiodes (APDs). Afterdetecting the fluorescence intensity for a certaintime, a hardware correlator usually correlatesthe signal from subsequent time points ac-cording to the correlation function mentionedabove, and forms the experimental FCS curve.This correlation step can also be performed ret-rospectively, if data is recorded in small enough(,msec) time bins. Then, the correlation curveas in Equation 16 is fitted by an appropriatefitting model (some listed below) to get thenumerical values of diffusion times, concentra-tions and molecular brightness, or other pa-rameters governing fluctuation decay.
As seen in Figure 4, the amplitude of thecurve is reciprocal to the concentration. Thereason behind this is that for lag time zero,
E. Sezgin and P. Schwille
10 Advanced Online Article. Cite this article as Cold Spring Harb Perspect Biol doi: 10.1101/cshperspect.a009803
on June 29, 2018 - Published by Cold Spring Harbor Laboratory Press http://cshperspectives.cshlp.org/Downloaded from
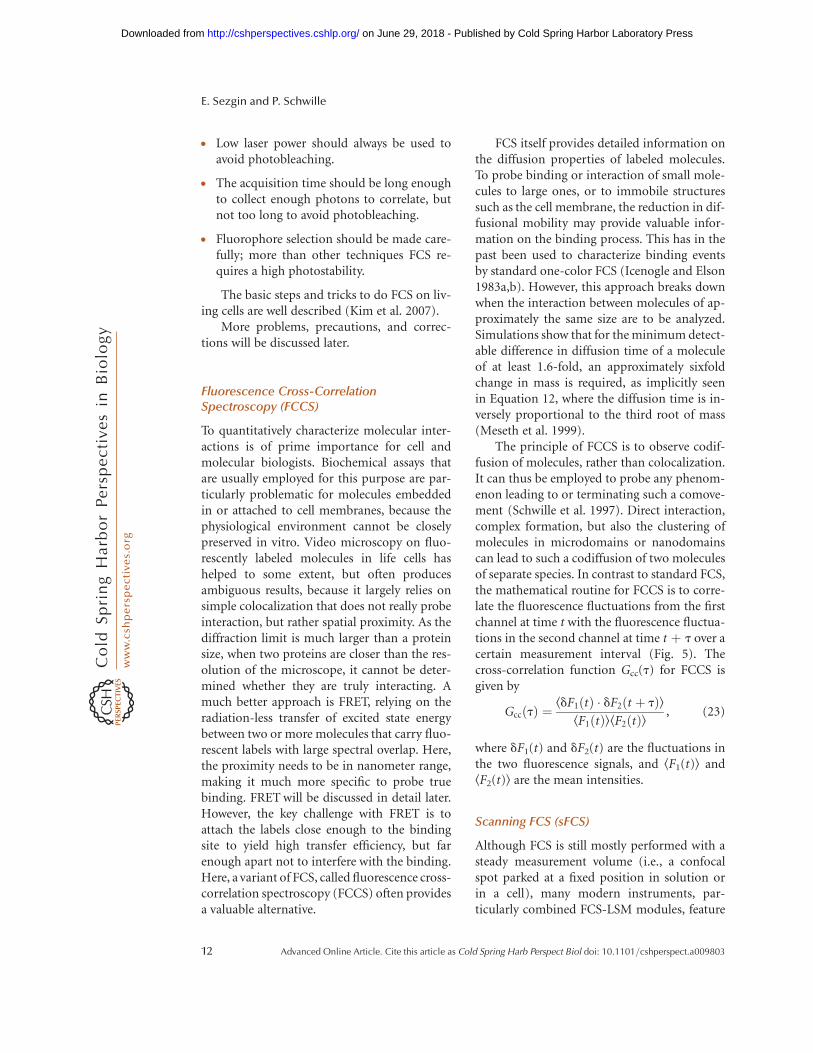
G(t) is determined as
G(0) ¼ k dFð Þ2lkFl2 : (17)
For random processes that are governed by Pois-son statistics, the variance is
Var(N) ¼ k dNð Þ2l ¼ N: (18)
Because the fluorescence intensity is directlyproportional to the number of molecules,
kFl ¼ qkNl, (19)
when the intensity is normalized, we get
k dFð Þ2lkFl2 ¼ k dNð Þ2l
kNl2 ¼ kNlkNl2 ¼
1
kNl: (20)
As stated above, the diffusion time and othervariables are obtained from fitting the experi-mental data to the proper model function.From the diffusion time tD, the diffusion coef-ficient can be determined if the diameter ofthe focal volume is known:
tD ¼v2
o
4D: (21)
Here, vo is the beam waist of focal volume (i.e.,the radial distance of the optical axis), and D isthe diffusion coefficient.
Besides the concentration and the diffusiontime, the brightness of the molecule, h, can becalculated. This parameter is quite important
for a good statistical accuracy, and can be usedto assess the quality of FCS measurements ingeneral. However, it can also reflect on the for-mation of higher molecular complexes andaggregates.h is directly proportional to the totalphoton count and to the amplitude of the cor-relation function:
h ¼ kF tð ÞlN¼ kF tð Þl � G(0): (22)
In practice, FCS is quite a complicated and del-icate technique to apply, with many parametersthat have to be taken into account and carefullycontrolled.
† If the concentration of the fluorophores istoo high (.100 nM) the contribution of cor-related photons to the total intensity (or, thestrength of the fluctuations) is only marginal,and precludes their analysis. If the concentra-tion is too low (,1 pM) it gets difficult toregister a molecule in the focal volume dur-ing a sensible measurement time. Back-ground noise dominates the signal. In bothcases, it is difficult to record decent FCScurves.
† Autofluorescence and (scattering) back-ground may always affect the total fluo-rescence intensity, and there should beelaborate corrections for them. Besides, thesample should be kept in a nonautofluo-rescent medium.
APD
Laser
1
0
Pinhole
Diffusingmolecules
Focal volume
t t + τ
τD τ
G (τ) =
G (τ)
N
⟨F (t )⟩2
⟨δF (t ) · δF (t + τ)⟩
Figure 4. Principle of FCS. (Image courtesy of Jonas Ries.)
Fluorescence Techniques to Study Lipid Dynamics
Advanced Online Article. Cite this article as Cold Spring Harb Perspect Biol doi: 10.1101/cshperspect.a009803 11
on June 29, 2018 - Published by Cold Spring Harbor Laboratory Press http://cshperspectives.cshlp.org/Downloaded from
† Low laser power should always be used toavoid photobleaching.
† The acquisition time should be long enoughto collect enough photons to correlate, butnot too long to avoid photobleaching.
† Fluorophore selection should be made care-fully; more than other techniques FCS re-quires a high photostability.
The basic steps and tricks to do FCS on liv-ing cells are well described (Kim et al. 2007).
More problems, precautions, and correc-tions will be discussed later.
Fluorescence Cross-CorrelationSpectroscopy (FCCS)
To quantitatively characterize molecular inter-actions is of prime importance for cell andmolecular biologists. Biochemical assays thatare usually employed for this purpose are par-ticularly problematic for molecules embeddedin or attached to cell membranes, because thephysiological environment cannot be closelypreserved in vitro. Video microscopy on fluo-rescently labeled molecules in life cells hashelped to some extent, but often producesambiguous results, because it largely relies onsimple colocalization that does not really probeinteraction, but rather spatial proximity. As thediffraction limit is much larger than a proteinsize, when two proteins are closer than the res-olution of the microscope, it cannot be deter-mined whether they are truly interacting. Amuch better approach is FRET, relying on theradiation-less transfer of excited state energybetween two or more molecules that carry fluo-rescent labels with large spectral overlap. Here,the proximity needs to be in nanometer range,making it much more specific to probe truebinding. FRET will be discussed in detail later.However, the key challenge with FRET is toattach the labels close enough to the bindingsite to yield high transfer efficiency, but farenough apart not to interfere with the binding.Here, a variant of FCS, called fluorescence cross-correlation spectroscopy (FCCS) often providesa valuable alternative.
FCS itself provides detailed information onthe diffusion properties of labeled molecules.To probe binding or interaction of small mole-cules to large ones, or to immobile structuressuch as the cell membrane, the reduction in dif-fusional mobility may provide valuable infor-mation on the binding process. This has in thepast been used to characterize binding eventsby standard one-color FCS (Icenogle and Elson1983a,b). However, this approach breaks downwhen the interaction between molecules of ap-proximately the same size are to be analyzed.Simulations show that for the minimum detect-able difference in diffusion time of a moleculeof at least 1.6-fold, an approximately sixfoldchange in mass is required, as implicitly seenin Equation 12, where the diffusion time is in-versely proportional to the third root of mass(Meseth et al. 1999).
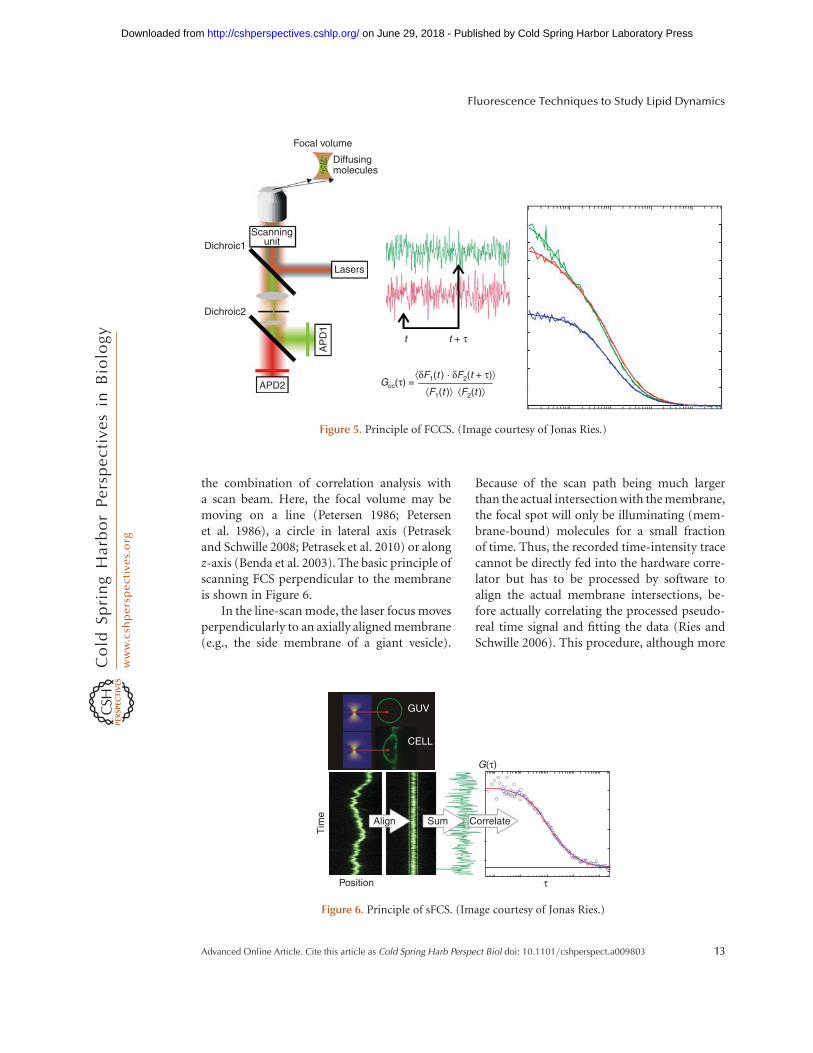
The principle of FCCS is to observe codif-fusion of molecules, rather than colocalization.It can thus be employed to probe any phenom-enon leading to or terminating such a comove-ment (Schwille et al. 1997). Direct interaction,complex formation, but also the clustering ofmolecules in microdomains or nanodomainscan lead to such a codiffusion of two moleculesof separate species. In contrast to standard FCS,the mathematical routine for FCCS is to corre-late the fluorescence fluctuations from the firstchannel at time t with the fluorescence fluctua-tions in the second channel at time t þ t over acertain measurement interval (Fig. 5). Thecross-correlation function Gcc(t) for FCCS isgiven by
Gcc tð Þ ¼ kdF1 tð Þ � dF2 t þ tð ÞlkF1 tð ÞlkF2 tð Þl , (23)
where dF1(t) and dF2(t) are the fluctuations inthe two fluorescence signals, and kF1(t)l andkF2(t)l are the mean intensities.
Scanning FCS (sFCS)
Although FCS is still mostly performed with asteady measurement volume (i.e., a confocalspot parked at a fixed position in solution orin a cell), many modern instruments, par-ticularly combined FCS-LSM modules, feature
E. Sezgin and P. Schwille
12 Advanced Online Article. Cite this article as Cold Spring Harb Perspect Biol doi: 10.1101/cshperspect.a009803
on June 29, 2018 - Published by Cold Spring Harbor Laboratory Press http://cshperspectives.cshlp.org/Downloaded from
the combination of correlation analysis witha scan beam. Here, the focal volume may bemoving on a line (Petersen 1986; Petersenet al. 1986), a circle in lateral axis (Petrasekand Schwille 2008; Petrasek et al. 2010) or alongz-axis (Benda et al. 2003). The basic principle ofscanning FCS perpendicular to the membraneis shown in Figure 6.
In the line-scan mode, the laser focus movesperpendicularly to an axially aligned membrane(e.g., the side membrane of a giant vesicle).
Because of the scan path being much largerthan the actual intersection with the membrane,the focal spot will only be illuminating (mem-brane-bound) molecules for a small fractionof time. Thus, the recorded time-intensity tracecannot be directly fed into the hardware corre-lator but has to be processed by software toalign the actual membrane intersections, be-fore actually correlating the processed pseudo-real time signal and fitting the data (Ries andSchwille 2006). This procedure, although more
CorrelateSumAlign
Tim
e
Position
CELL
G(τ)
τ
GUV
Figure 6. Principle of sFCS. (Image courtesy of Jonas Ries.)
APD2
AP
D1
Lasers
Dichroic1
Dichroic2
Diffusingmolecules
Scanningunit
Focal volume
t t + τ
Gcc(τ) =⟨F1(t )⟩ ⟨F2(t )⟩
⟨δF1(t ) · δF2(t + τ)⟩
Figure 5. Principle of FCCS. (Image courtesy of Jonas Ries.)
Fluorescence Techniques to Study Lipid Dynamics
Advanced Online Article. Cite this article as Cold Spring Harb Perspect Biol doi: 10.1101/cshperspect.a009803 13
on June 29, 2018 - Published by Cold Spring Harbor Laboratory Press http://cshperspectives.cshlp.org/Downloaded from
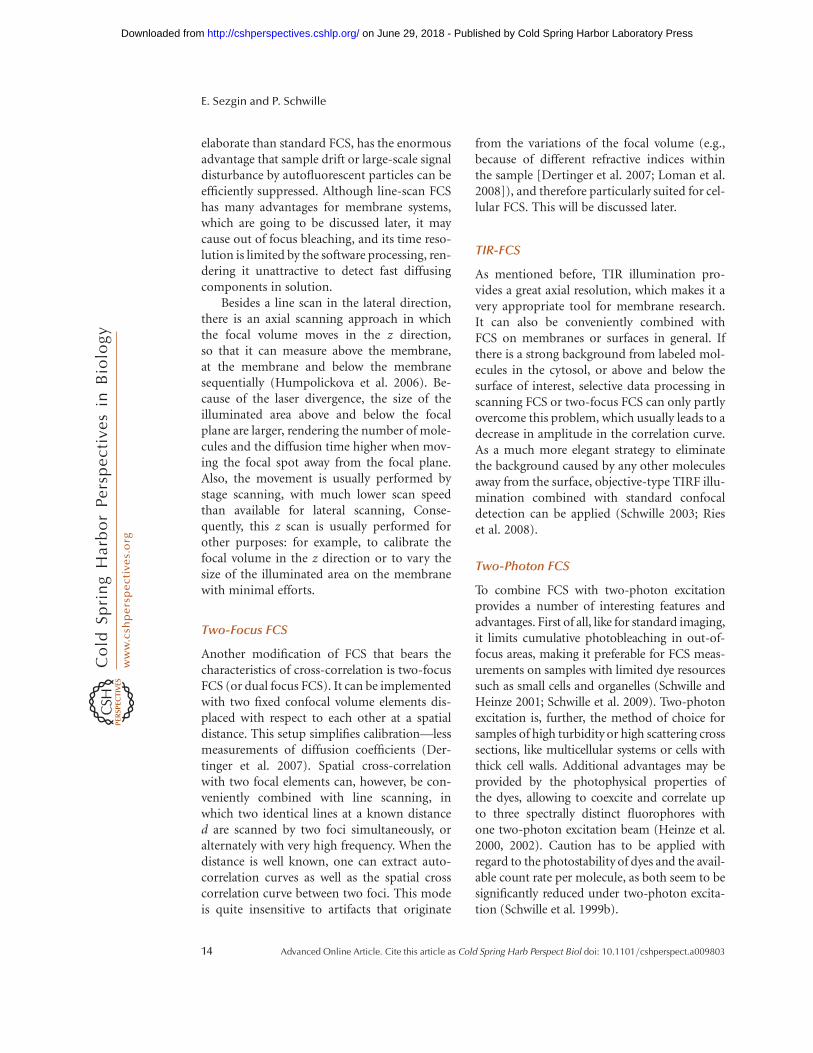
elaborate than standard FCS, has the enormousadvantage that sample drift or large-scale signaldisturbance by autofluorescent particles can beefficiently suppressed. Although line-scan FCShas many advantages for membrane systems,which are going to be discussed later, it maycause out of focus bleaching, and its time reso-lution is limited by the software processing, ren-dering it unattractive to detect fast diffusingcomponents in solution.
Besides a line scan in the lateral direction,there is an axial scanning approach in whichthe focal volume moves in the z direction,so that it can measure above the membrane,at the membrane and below the membranesequentially (Humpolickova et al. 2006). Be-cause of the laser divergence, the size of theilluminated area above and below the focalplane are larger, rendering the number of mole-cules and the diffusion time higher when mov-ing the focal spot away from the focal plane.Also, the movement is usually performed bystage scanning, with much lower scan speedthan available for lateral scanning, Conse-quently, this z scan is usually performed forother purposes: for example, to calibrate thefocal volume in the z direction or to vary thesize of the illuminated area on the membranewith minimal efforts.
Two-Focus FCS
Another modification of FCS that bears thecharacteristics of cross-correlation is two-focusFCS (or dual focus FCS). It can be implementedwith two fixed confocal volume elements dis-placed with respect to each other at a spatialdistance. This setup simplifies calibration—lessmeasurements of diffusion coefficients (Der-tinger et al. 2007). Spatial cross-correlationwith two focal elements can, however, be con-veniently combined with line scanning, inwhich two identical lines at a known distanced are scanned by two foci simultaneously, oralternately with very high frequency. When thedistance is well known, one can extract auto-correlation curves as well as the spatial crosscorrelation curve between two foci. This modeis quite insensitive to artifacts that originate
from the variations of the focal volume (e.g.,because of different refractive indices withinthe sample [Dertinger et al. 2007; Loman et al.2008]), and therefore particularly suited for cel-lular FCS. This will be discussed later.
TIR-FCS
As mentioned before, TIR illumination pro-vides a great axial resolution, which makes it avery appropriate tool for membrane research.It can also be conveniently combined withFCS on membranes or surfaces in general. Ifthere is a strong background from labeled mol-ecules in the cytosol, or above and below thesurface of interest, selective data processing inscanning FCS or two-focus FCS can only partlyovercome this problem, which usually leads to adecrease in amplitude in the correlation curve.As a much more elegant strategy to eliminatethe background caused by any other moleculesaway from the surface, objective-type TIRF illu-mination combined with standard confocaldetection can be applied (Schwille 2003; Rieset al. 2008).
Two-Photon FCS
To combine FCS with two-photon excitationprovides a number of interesting features andadvantages. First of all, like for standard imaging,it limits cumulative photobleaching in out-of-focus areas, making it preferable for FCS meas-urements on samples with limited dye resourcessuch as small cells and organelles (Schwille andHeinze 2001; Schwille et al. 2009). Two-photonexcitation is, further, the method of choice forsamples of high turbidity or high scattering crosssections, like multicellular systems or cells withthick cell walls. Additional advantages may beprovided by the photophysical properties ofthe dyes, allowing to coexcite and correlate upto three spectrally distinct fluorophores withone two-photon excitation beam (Heinze et al.2000, 2002). Caution has to be applied withregard to the photostability of dyes and the avail-able count rate per molecule, as both seem to besignificantly reduced under two-photon excita-tion (Schwille et al. 1999b).
E. Sezgin and P. Schwille
14 Advanced Online Article. Cite this article as Cold Spring Harb Perspect Biol doi: 10.1101/cshperspect.a009803
on June 29, 2018 - Published by Cold Spring Harbor Laboratory Press http://cshperspectives.cshlp.org/Downloaded from
Difficulties and Artifacts in FCS Applications
Background. Background can be caused byscattering, autofluorescence, or unwanted fluo-rophores in the sample because of nonspecificlabeling. If the background is truly randomand noncorrelated, a signal can be easilybackground-corrected after the measurementas follows (Petrasek et al. 2010):
gc tð Þ ¼ kFlkFl� B
� �2
g tð Þ, (24)
where gc(t) is corrected nonnormalized correla-tion, g(t) is measured nonnormalized correla-tion, B is background fluorescence measuredon the sample without fluorescent molecules,and kFl is the average intensity.
In case of correlating background, it has tobe added to the fitting functions as a fixed sec-ond component in a two-component modelafter being carefully calibrated.
Membrane Heterogeneities, Blinking, Trip-let, and Photobleaching. FCS usually assumesan equilibrated steady state in the focal volumearound which fluctuations occur randomly.This means that the average count rate shouldnot change over time when recording an FCScurve. In reality, this assumption is very rarelytrue. Many events, above all cumulative photo-bleaching, cause a continuous drop or otherlarge scale drift in the average count rate,
rendering the error-free recording of FCS curvesquite complicated.
In measurements on live cell membranes,membrane undulations constitute the mainproblem. As the membrane may always be mov-ing on a micron scale, the fraction of membraneoccupying the detection volume can changedrastically. This causes an increase or decreasein count rate, and results in major distortionsof the curve, leading to erroneous values forautocorrelation amplitude and diffusion time.
Another cause of severe, although bettercontrollable, distortion of FCS curves is thephotophysical phenomenon of triplet statepopulation, in which the molecules are trappedin a dark state for a few microseconds. Triplet-induced photophysical dynamics may lead towrong fitting of diffusion times, particularly ifthe triplet fraction is high and the diffusiontimes are short (Davis and Shen 2006). Yet,this phenomenon can usually be corrected forin the fitting function, as seen in Table 2. Usu-ally, triple dynamics can be easily distinguishedfrom diffusion because it is independent ofvolume size, but dependent on illuminationpower. It can be easily evidenced as an addi-tional shoulder in the FCS curve on shorttimescales.
Blinking on short timescales does not haveto be of photophysical origin. Several fluoro-phores, particularly fluorescent proteins such asGFP, exhibit excitation independent dark state-bright state transitions which may, however,
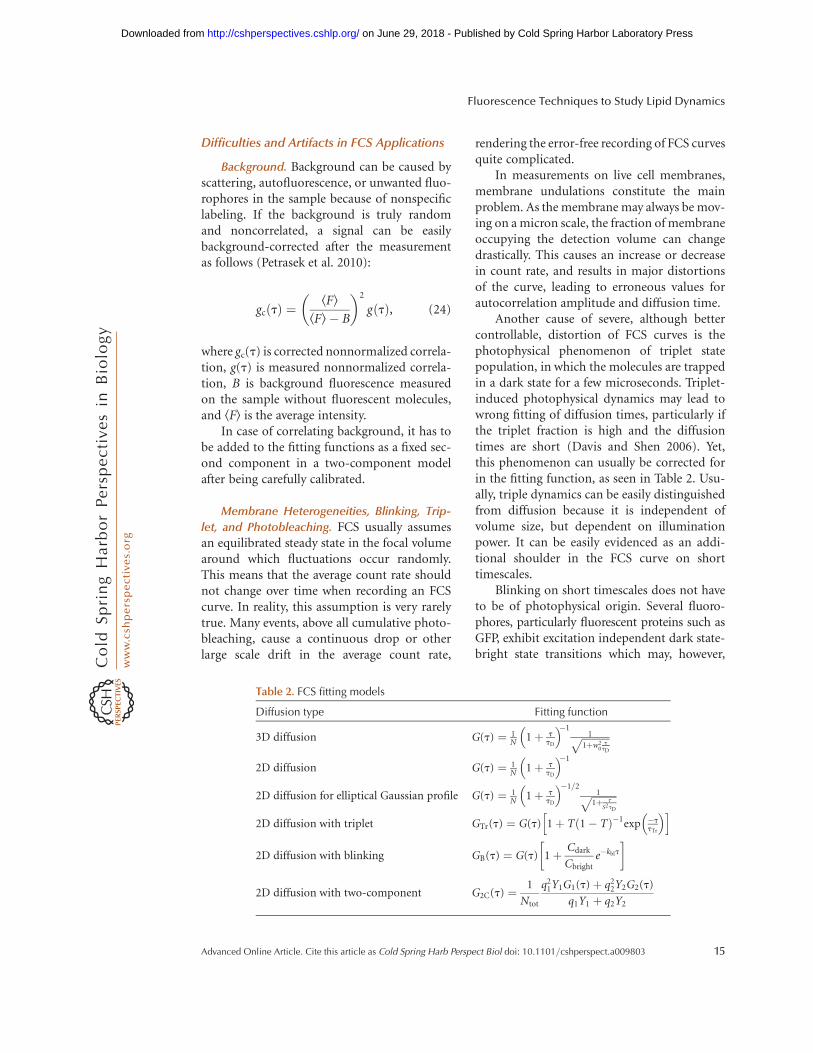
Table 2. FCS fitting models
Diffusion type Fitting function
3D diffusion G(t) ¼ 1N 1þ t
tD
� ��11ffiffiffiffiffiffiffiffiffiffiffi
1þw20
ttD
p2D diffusion G(t) ¼ 1
N 1þ ttD
� ��1
2D diffusion for elliptical Gaussian profile G(t) ¼ 1N 1þ t
tD
� ��1=21ffiffiffiffiffiffiffiffiffiffi
1þ t
S2tD
p2D diffusion with triplet GTr(t) ¼ G(t) 1þ T 1� Tð Þ�1exp �t
tTr
� �h i
2D diffusion with blinking GB(t) ¼ G(t) 1þ Cdark
Cbrighte�kblt
� �
2D diffusion with two-component G2C(t) ¼ 1
Ntot
q21Y1G1(t)þ q2
2Y2G2(t)
q1Y1 þ q2Y2
Fluorescence Techniques to Study Lipid Dynamics
Advanced Online Article. Cite this article as Cold Spring Harb Perspect Biol doi: 10.1101/cshperspect.a009803 15
on June 29, 2018 - Published by Cold Spring Harbor Laboratory Press http://cshperspectives.cshlp.org/Downloaded from
be dependent on pH or ionic strength of thesolution (Haupts et al. 1998). After carefulcalibration, this can be incorporated into thefitting function in the same way as the tripletdynamics (Table 2).
A more severe problem for FCS is dye pho-tobleaching, as it not only leads to signal loss,but also compromises the determination ofconcentrations and diffusion coefficients, thekey parameters in FCS applications. At toohigh illumination intensities, molecules willnot stay fluorescent during their full diffusionpath through the detection volume, but willbe destroyed before leaving it again, leading toerroneously low diffusion times, and an overes-timation of diffusion coefficients. In living cells,there is an additional problem with immobilefluorophores being unavoidably bleached dur-ing the measurements and leading to a drift inthe overall count rate. To prevent this effectfrom destroying the correlation curve duringreal-time recordings, a prebleaching is usuallyperformed. Although photobleaching can beusually diagnosed by decay in count rate, itseffect is not necessarily visible on first sight,because an equilibrium state may be reachedbetween bleaching and continuous supply ofnew fluorophores. To rule out photobleaching-induced artifacts in general, a laser power seriesof FCS measurements from minimum to amoderate power should be recorded. Only forpower levels that do not show a change in thecurve parameters, compared to very low powermeasurements, the intensity can be assumedsafe (Dittrich and Schwille 2001; Delon et al.2004). This “safe intensity” is, however, dramat-ically dependent on the diffusion characteristicsof the labeled molecules (lower intensitiesrequired for slower molecules), and cannot justbe inferred from pure dye measurements.
For measurements on extremely slow par-ticles, scanning FCS as explained above representsan efficient solution to avoid photobleaching-induced artifacts, because the laser is not con-tinuously exciting the same spot, reducing theinteraction time with a specific region.
Detector Dead Time and Saturation. When aphoton hits the APD detector, it creates an
avalanche of electrons to amplify the signal.Before the next photon can be registered, thereis a short interval of �100 nsec, called thedead time of the detector. Events occurring onshorter scales than the dead time cannot beresolved. Sometimes, the detection of a singlephoton triggers the APD chip to create a secondcascade during the dead time, the so-called“afterpulsing,” which is an artifactual event,but highly correlated with the first one. As aresult, a peak in the correlation curve is ob-served at very short timescales. The simplestsolution for this (usually hardware-induced)problem is to split the light into two detectionchannels and record the cross-correlation be-tween them. Cross-correlation does not includethis after-pulsing peak because it is a hardware-induced phenomenon in only one of thedetectors.
There is a photon count limit for the detec-tor that it can process at a time. Above this value,electronic saturation occurs, which has a similareffect as optical saturation in the sample. Opti-cal saturation happens when most of the mole-cules in the focal volume are not in the groundstate, instead in excited state or triplet state. Thiseffect usually leads to an enlarged focal volumeand results in a slower decay of the correlationfunction (Gregor et al. 2005; Humpolickovaet al. 2009). It should be ruled out in the sameway as for photobleaching, by recording a laserpower series and staying well below the intensityat which the curves change their shape.
Focal Volume Geometry and Positioning.The probe volume (composed of illuminationby the laser and detection via the pinhole) isusually approximated as a 3D Gaussian profile.In one photon excitation, slightly underfillingthe back aperture of the objective is a goodway to satisfy this approximation. Overfillingthe aperture to yield better excitation efficien-cies, on the other hand, will for one-photonexcitation result in diffraction fringes of theback aperture itself. This non-Gaussian volumeis prone to produce artifacts in diffusion time,which may be misunderstood and taken as asecond species or kinetics (Hess and Webb2002).
E. Sezgin and P. Schwille
16 Advanced Online Article. Cite this article as Cold Spring Harb Perspect Biol doi: 10.1101/cshperspect.a009803
on June 29, 2018 - Published by Cold Spring Harbor Laboratory Press http://cshperspectives.cshlp.org/Downloaded from
There are several additional factors, likeoptical aberrations, that distort the geometry(shape or size) of the focal volume from theGaussian profile.
Refractive index mismatch could be acommon problem when dealing with cells, inwhich refractive indices vary from 1.33 to1.38. When there is a mismatch between theimmersion liquid, glass, and the sample, aber-rations occur which cause a larger detectionvolume than assumed by the fitting model.This results in larger diffusion times and lowerdiffusion coefficients than the real values. Sim-ilar to this, displacement of the pinhole alongthe optical axis leads to larger detection vol-umes and larger diffusion times. Coverslipthickness also affects the focal volume. Objec-tives are usually designed for a certain range ofcoverslip thickness that has to be adjustedexactly. Deviations from the correct value againresult in a larger detection area and underesti-mated diffusion coefficients (Enderlein et al.2004, 2005).
Artifacts caused by refractive index mis-match, pinhole misalignment, or coverslipthickness affect the control experiments in thesame way as the measurements, such that theratio of control over sample is still correct.If absolute values are to be obtained and theoptical system cannot be easily corrected, two-focus FCS provides a good solution to avoidproblems with detection volume deformations.Two-focus FCS is insensitive to refractive indexmismatch, cover-slide thickness variation, andoptical saturation. Therefore, it happens to bea focal volume-calibration free technique foraccurate dynamics measurements (Dertingeret al. 2007; Loman et al. 2008).
Correct axial positioning of the detectionvolume is crucial for membrane analysis. Ifthe center of the focal volume is not exactly onthe membrane, the divergent laser beam illumi-nates a bigger area of the membrane, mimickinga higher concentration (through the reducedcount rate and higher occupation number) anda smaller diffusion coefficient. To minimizethis artifact, the count rate should be maxi-mized when adjusting the z position. For amore decisive solution, positioning-calibration
free FCS variants like scanning FCS or z-scanFCS should be used.
Specific Artifacts in FCCS. One of the mostcrucial tasks for dual-color cross-correlation isthe careful determination of measurement vol-umes. Because of the different wavelengths, theAiry disc sizes for the two detection channelsvary in proportion to their wavelength. Conse-quently, in most FCCS instruments, the focalvolumes do usually not completely overlap,even after eliminating all aberrations (Weide-mann et al. 2002). For quantitative FCCS, thisrequires intensive calibration measurements(Schwille et al. 1997) (e.g., by using a “gold stan-dard” of up to 100% cross-correlation [like astrong receptor-ligand or dsDNA] and compar-ing the experimental results with this reference).
One of the biggest problems in most opticalsystems featuring multicolor applications isspectral cross talk. FCCS is particularly proneto producing false positive results because ofthe cross talk induced by the leakage of the greendyes’s emission into the red dyes’ detection chan-nel. In that case, the autocorrelation between thered and green spectral parts of the green dyeresults in false positive cross correlation.
As for other artifacts, cross talk can be takencare of by careful calibration. The cross talkcoefficient of any fluorophore kx can be easilycalculated by measuring the fluorescence simul-taneously in both channels. This coefficient isspecific for a particular set of optics (dichroics,filters, etc.):
kx ¼ Fr=Fg, (25)
where Fr is the fluorescence intensity in the redchannel, and Fg is the fluorescence intensity ofthe same fluorophore in the green channel.
Cross-correlation can be corrected accord-ing to this coefficient in measurements withtwo fluorophores:
GCC tð Þ ¼FgFrGrg tð Þ � kxF2
g Gg tð ÞFg Fr � kxFg
� � : (26)
In cases where cross talk constitutes a sub-stantial portion of the fluorescence signal inthe red channel, as is the case for most
Fluorescence Techniques to Study Lipid Dynamics
Advanced Online Article. Cite this article as Cold Spring Harb Perspect Biol doi: 10.1101/cshperspect.a009803 17
on June 29, 2018 - Published by Cold Spring Harbor Laboratory Press http://cshperspectives.cshlp.org/Downloaded from
combinations using fluorescent proteins (be-cause of the limited availability of far red-emitting FPs), it may be more appropriate toeliminate cross talk already in the measure-ments, rather than correcting for it retrospec-tively. Here, alternating excitation schemeshave proven to be very powerful. The bestknown scheme for FCS is pulsed interleavedexcitation (Mueller et al. 2005; Sohn et al.2010), and alternating excitation may also easilybe combined with scanning FCS (Ries et al.2009a).
FCS Applications on Membrane Dynamics
Over the last decade, FCS has been establishedas an extremely attractive tool for in vivo (Mutzeet al. 2009) studies and on model membranesystems (Kahya and Schwille 2006a). Thus, lipidbiology has widely exploited this technique.FCS experiments have been designed andappropriate models have been developed todistinguish free diffusion from diffusion inmicrodomains and meshwork structures innative membranes (Wawrezinieck et al. 2005;Lenne et al. 2006; Wenger et al. 2007). Therehave been many studies on phase separatedmodel membranes, supported or free-standing,to determine the diffusion characteristics of lip-ids in different phases (Chiantia et al. 2008,2009; Lingwood et al. 2008; Garcıa-Saez andSchwille 2010; Garcıa-Saez et al. 2010). It hasbeen shown that the diffusion coefficient isinfluenced by environmental conditions suchas ionic strength or sugar content of themedium (Bockmann et al. 2003; Sum et al.2003; Doeven et al. 2005; van den Bogaartet al. 2007; Guo et al. 2008; Vacha et al. 2009).The role of cholesterol in membrane organiza-tion, a big issue in lipid biology, has been inten-sively addressed by FCS (Scherfeld et al. 2003;Bacia et al. 2004, 2005; Kahya and Schwile2006b). Markers for more ordered lipid envi-ronments, such as sphingomyelin and ceram-ide, were other important molecules to bestudied (Chiantia et al. 2007, 2008; Eggelinget al. 2009). Other membrane-dependent proc-esses were also successfully investigated by FCS.For instance, the interaction of morphogen Fgf8
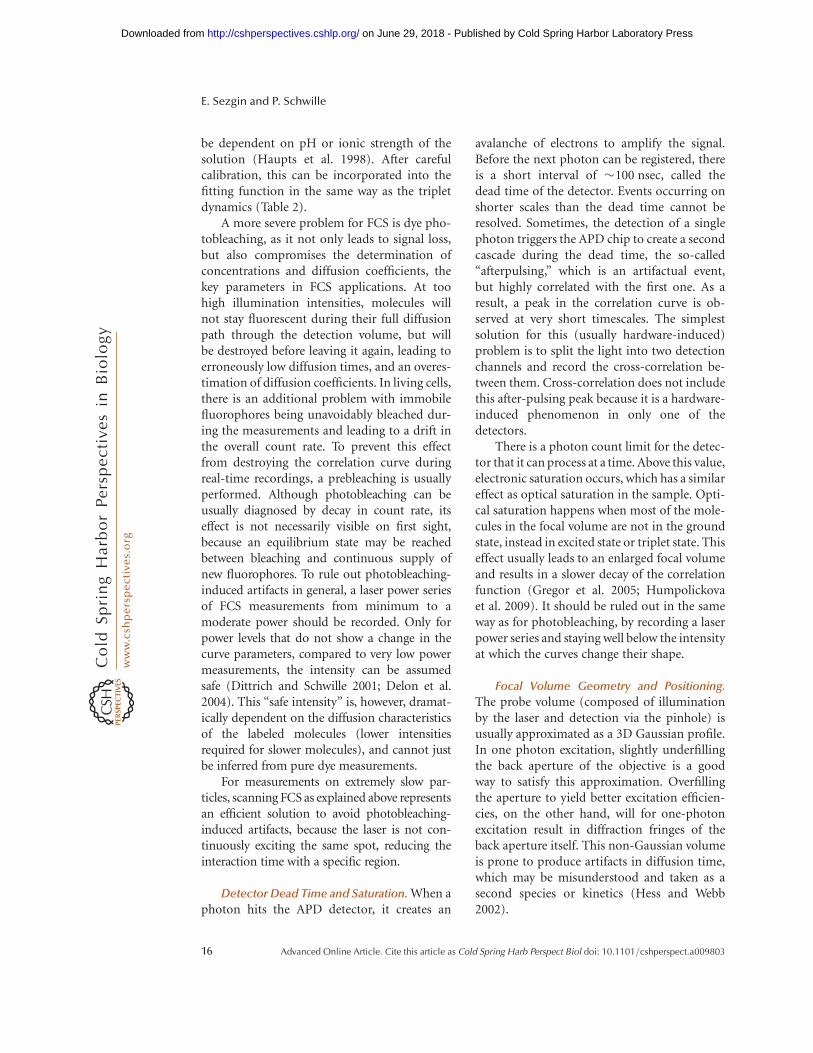
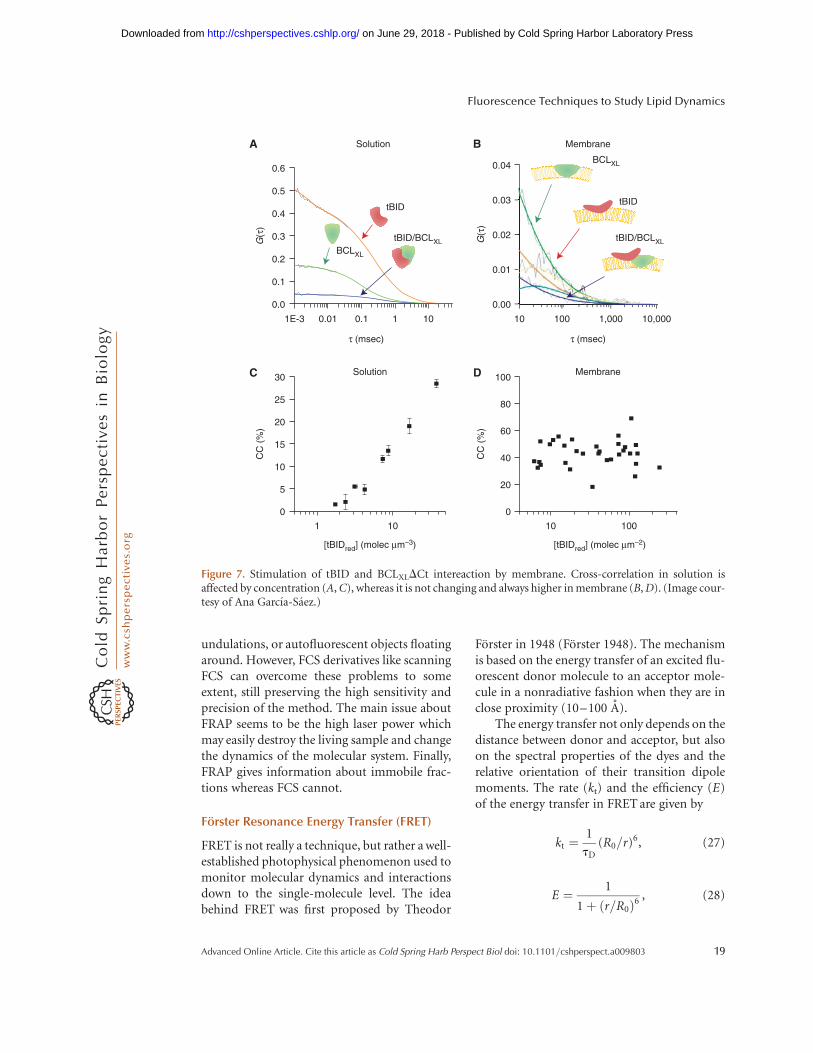
with its receptors on the cell surface in livingembryos has been quantitatively determinedby using scanning FCCS (Ries et al. 2009a; SRYu e al. 2009). Another derivative of scanningFCS–line-scan FCS–was developed to addressthe questions related to membrane dynamics(Ries et al. 2009b). Moreover, reconstituted pro-tein–protein interactions on GUV membraneswere monitored by using FCCS. For example,active tBID and BCLXLDCt proteins were foundto interact, and it was shown that membranepromotes their interaction (Fig. 7) (Garcıa-Saezet al. 2009). In another example, helix–helixinteraction was shown for trans-membrane do-mains using giant plasma membrane spheres byscanning FCCS (Worch et al. 2010).
The applications of FCS in lipid cell biologyhave been elaborately reviewed elsewhere (Mac-han and Hof 2010).
A Comparison between FRAP and FCSfor Lateral Diffusion
As seen above, FRAP and FCS are alternativemethods to measure lateral diffusion of mole-cules. Although their specific strengths andshortcomings have been briefly mentioned, adirect comparison may still be helpful forchoosing the right technique for a particularexperiment.
First, FRAP usually requires higher con-centrations than does FCS. Numerically,approximately 100 labeled molecules shouldbe on 1 mm2 to obtain a reliable FRAP curve(Wolf 1989), and with increasing concentra-tions, the signal-noise ratio can be improved.In contrast, the FCS curve deteriorates withincreasing concentration. One labeled moleculein the detection volume of 0.5 fL (which isalmost 20 times less than probed by FRAP) isusually sufficient to record a decent FCS curve.FCS has a much better temporal resolutiondown to submicroseconds, thus can resolvevery fast diffusions (Gordon et al. 1995).On the other hand, FCS is not well suited toanalyze slow diffusion, which is quite vulner-able to photobleaching. The high temporal res-olution makes FCS also much more susceptibleto sample-induced noise, such as membrane
E. Sezgin and P. Schwille
18 Advanced Online Article. Cite this article as Cold Spring Harb Perspect Biol doi: 10.1101/cshperspect.a009803
on June 29, 2018 - Published by Cold Spring Harbor Laboratory Press http://cshperspectives.cshlp.org/Downloaded from
undulations, or autofluorescent objects floatingaround. However, FCS derivatives like scanningFCS can overcome these problems to someextent, still preserving the high sensitivity andprecision of the method. The main issue aboutFRAP seems to be the high laser power whichmay easily destroy the living sample and changethe dynamics of the molecular system. Finally,FRAP gives information about immobile frac-tions whereas FCS cannot.
Forster Resonance Energy Transfer (FRET)
FRET is not really a technique, but rather a well-established photophysical phenomenon used tomonitor molecular dynamics and interactionsdown to the single-molecule level. The ideabehind FRET was first proposed by Theodor
Forster in 1948 (Forster 1948). The mechanismis based on the energy transfer of an excited flu-orescent donor molecule to an acceptor mole-cule in a nonradiative fashion when they are inclose proximity (10–100 A).
The energy transfer not only depends on thedistance between donor and acceptor, but alsoon the spectral properties of the dyes and therelative orientation of their transition dipolemoments. The rate (kt) and the efficiency (E)of the energy transfer in FRET are given by
kt ¼1
tD(R0=r)6, (27)
E ¼ 1
1þ r=R0ð Þ6, (28)
1E-3 10.1 100.01
τ (msec)
0.0
0.1
0.2
0.3
0.4
0.5
0.6
G(τ
)
tBID/BCLXLBCLXL
tBID
SolutionA B
C D
10 1,000 10,000100
τ (msec)
0.00
0.01
0.02
0.03
0.04
G(τ
)
Membrane
tBID/BCLXL
BCLXL
tBID
tBID/BCLX
tBID
100
80
60
40
20
0
CC
(%
)
10 100
[tBIDred] (molec μm–2)
Membrane
1 10
[tBIDred] (molec μm–3)
30
25
20
15
10
5
0
CC
(%
)
Solution
Figure 7. Stimulation of tBID and BCLXLDCt intereaction by membrane. Cross-correlation in solution isaffected by concentration (A, C), whereas it is not changing and always higher in membrane (B, D). (Image cour-tesy of Ana Garcıa-Saez.)
Fluorescence Techniques to Study Lipid Dynamics
Advanced Online Article. Cite this article as Cold Spring Harb Perspect Biol doi: 10.1101/cshperspect.a009803 19
on June 29, 2018 - Published by Cold Spring Harbor Laboratory Press http://cshperspectives.cshlp.org/Downloaded from
where tD is the donor lifetime in the absence ofacceptor, r is the spatial distance between donorand acceptor, and R0 is the Forster distance ofthe donor/acceptor pair, which is the distanceat which the energy transfer efficiency is 50%.As seen, FRETefficiency highly depends on R0,which is given by
R0 ¼9000QD ln 10ð Þk2J(l)
128p5n4NA
� �1=6
, (29)
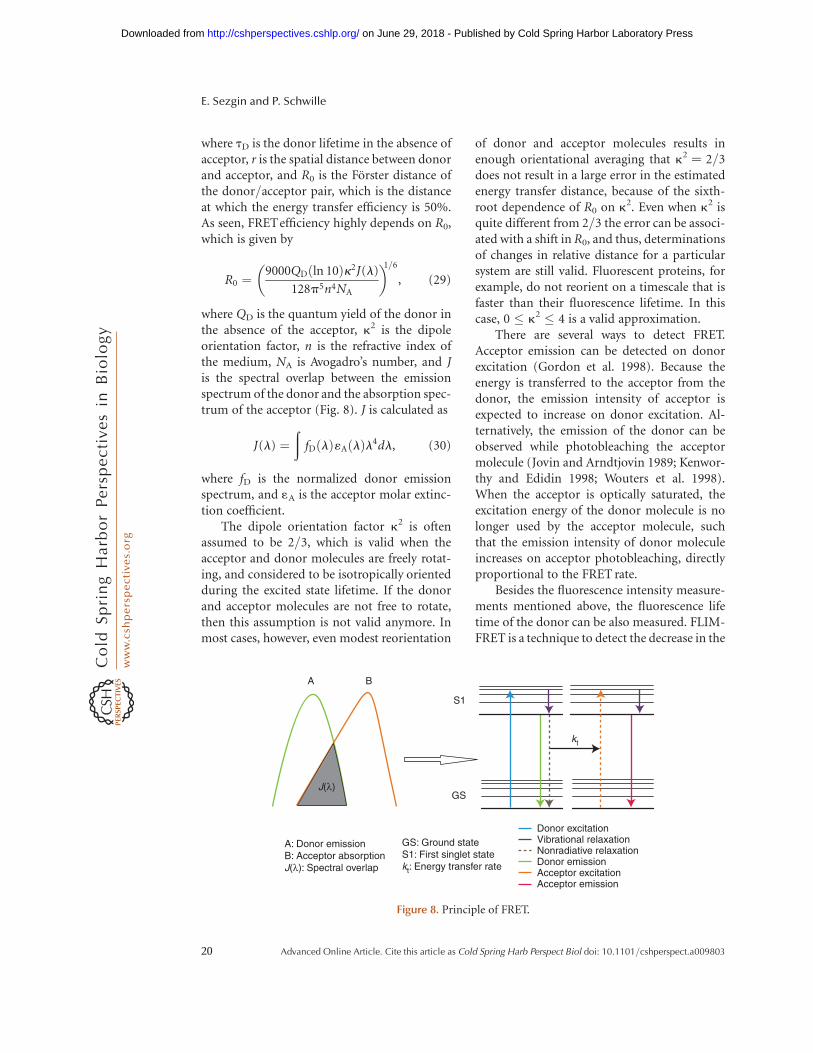
where QD is the quantum yield of the donor inthe absence of the acceptor, k2 is the dipoleorientation factor, n is the refractive index ofthe medium, NA is Avogadro’s number, and Jis the spectral overlap between the emissionspectrum of the donor and the absorption spec-trum of the acceptor (Fig. 8). J is calculated as
J(l) ¼ð
fD lð Þ1A lð Þl4dl, (30)
where fD is the normalized donor emissionspectrum, and 1A is the acceptor molar extinc-tion coefficient.
The dipole orientation factor k2 is oftenassumed to be 2/3, which is valid when theacceptor and donor molecules are freely rotat-ing, and considered to be isotropically orientedduring the excited state lifetime. If the donorand acceptor molecules are not free to rotate,then this assumption is not valid anymore. Inmost cases, however, even modest reorientation
of donor and acceptor molecules results inenough orientational averaging that k2 ¼ 2/3does not result in a large error in the estimatedenergy transfer distance, because of the sixth-root dependence of R0 on k2. Even when k2 isquite different from 2/3 the error can be associ-ated with a shift in R0, and thus, determinationsof changes in relative distance for a particularsystem are still valid. Fluorescent proteins, forexample, do not reorient on a timescale that isfaster than their fluorescence lifetime. In thiscase, 0 � k2 � 4 is a valid approximation.
There are several ways to detect FRET.Acceptor emission can be detected on donorexcitation (Gordon et al. 1998). Because theenergy is transferred to the acceptor from thedonor, the emission intensity of acceptor isexpected to increase on donor excitation. Al-ternatively, the emission of the donor can beobserved while photobleaching the acceptormolecule (Jovin and Arndtjovin 1989; Kenwor-thy and Edidin 1998; Wouters et al. 1998).When the acceptor is optically saturated, theexcitation energy of the donor molecule is nolonger used by the acceptor molecule, suchthat the emission intensity of donor moleculeincreases on acceptor photobleaching, directlyproportional to the FRET rate.
Besides the fluorescence intensity measure-ments mentioned above, the fluorescence lifetime of the donor can be also measured. FLIM-FRET is a technique to detect the decrease in the
J(λ)
A B
S1
GS
kt
GS: Ground stateS1: First singlet statekt: Energy transfer rate
A: Donor emissionB: Acceptor absorptionJ(λ): Spectral overlap
Donor excitationVibrational relaxationNonradiative relaxationDonor emissionAcceptor excitationAcceptor emission
Figure 8. Principle of FRET.
E. Sezgin and P. Schwille
20 Advanced Online Article. Cite this article as Cold Spring Harb Perspect Biol doi: 10.1101/cshperspect.a009803
on June 29, 2018 - Published by Cold Spring Harbor Laboratory Press http://cshperspectives.cshlp.org/Downloaded from
donor’s fluorescence lifetime on energy transfer(Gadella and Jovin 1995; Bastiaens and Squire1999). This method is quite insensitive tomany artifacts which are going to be discussedlater, but its main disadvantage is the moreinvolved instrumental setup required to detecton nanosecond timescales. FLIM-FRETappearsto be more vulnerable to some artifacts causedby pH, temperature, and ionic strength of themedium, as these factors modify fluorescencelifetimes. However, with the proper controls,this method seems to be the most reliable oneamong others.
Fluorescence lifetime analysis can be per-formed in two ways, in time domain and infrequency domain. In the time domainapproach, very short (picoseconds to femtosec-onds) excitation pulses are used to excite thesample, and the lifetime is measured by collect-ing the resulting photons over time between thepulses, one by one. On the other hand, sinusoi-dally modulated light is used to excite the fluo-rophores in frequency domain. The emission isalso sinusoidally modulated at the same fre-quency as the excitation, but there is a phaseshift and reduction in the modulation depth,from which the fluorescence lifetime can bederived.
FRET can also be detected by fluorescenceanisotropy (Runnels and Scarlata 1995; Gautieret al. 2001; Clayton et al. 2002; Lidke et al. 2003)which uses linearly polarized light to detect theorientation of the molecules. When there is noenergy transfer, the orientation of excited mol-ecule is highly correlated with the orientation ofthe emitting molecule. However, when there isFRET, the emitting molecules are not only theexcited donors but also the acceptors, suchthat the correlation between the orientationsof these two components will decrease remark-ably. This method has a unique property to alsodetermine FRET between identical molecules(so-called homo-FRET) which is very crucialin dimerization or oligomerization studies(Bader et al. 2009).
The FRET pair selection is an importantissue. Theoretically, pairs are selected based onthe spectral overlap criterion discussed above.The closer the spatial distance at closest
proximity is expected to be, the larger the spec-tra may vary. Clearly, detection efficiency ismaximized and cross talk minimized for spec-trally more distinct probes. The most popularFRET pairs at present are GFP-RFP, CFP-YFP,BFP-GFP, GFP-mCherry for genetically modi-fied proteins. There are also several classicalFRET pairs based on chemical dyes, such asCy3-Cy5 and Alexa488-Cy3. More FRET pairsand their properties can be found elsewhere(Sahoo et al. 2007).
Difficulties and Delicacy
In spite of its attractiveness of being a very intui-tive technique with in principle rather straight-forward experimental design and readout,FRET in praxis has many caveats to be consid-ered carefully, some which are mentioned below.
To get reliable FRET results, spectral crosstalk needs to be minimized. When the acceptorfluorescence intensity is used to assess FRETefficiency, spectral contamination always hasto be corrected to some extent. Two major sour-ces of this spectral contamination are the directexcitation of the acceptor, and the leakage ofdonor emission into the acceptor detectionchannel. As mentioned above, there is always atrade-off between minimal cross talk and agood spectral overlap factor J. The simplestway to correct for spectral contamination is totest the FRET signal in combinations of onlyacceptor, only donor and donor/acceptor com-bination, both with acceptor excitation anddonor excitation.
Photoconversion is another problem oftenencountered with fluorescent proteins. Undercertain conditions, emission spectra may changewith time (e.g., on high laser power excitation)or sometimes spontaneously as a result of pro-tein maturation. This is critical in FRET meas-urements, particularly when photobleaching isused as readout. It has been shown that on pho-tobleaching of acceptor YFP, CFP-like emissionis created without any FRET (Kirber et al. 2007).
Fluorescence lifetime-based FRET detec-tion is insensitive to many of these problemsas the life time is usually independent of ex-citation intensity. On the other hand, the big
Fluorescence Techniques to Study Lipid Dynamics
Advanced Online Article. Cite this article as Cold Spring Harb Perspect Biol doi: 10.1101/cshperspect.a009803 21
on June 29, 2018 - Published by Cold Spring Harbor Laboratory Press http://cshperspectives.cshlp.org/Downloaded from
practical advantage of FRETas a straightforwardand intuitive method to complement imaging isalso lost, and the instrumentation gets muchmore involved.
The interactions of donor or acceptor mol-ecules with other components in the mediumshould be carefully tested. If there is an un-wanted binding of one or both to other mole-cules, this can produce positive and falsenegative results. Other problems may arisefrom too complicated stoichiometry (van denBogaart et al. 2007) and the impossibility toattach fluorescent tags close enough to theinteraction region (Miyawaki and Tsien 2000).
As for other fluorescence techniques, pho-tobleaching should be avoided, as it usuallychanges the molecular ratio of donor and ac-ceptor, resulting in artifacts of FRET efficiency.The donor should be particularly photostablelong enough to transfer its energy. It shouldalso exhibit low polarization anisotropy to elim-inate the k2 deviations.
The brightness of donor and acceptorshould ideally be comparable, otherwise result-ing in saturation in one channel, or enhancednoise in the other channel due (Piston andKremers 2007).
Applications of FRET in Lipid Biology
Being such a powerful tool to detect dynamicmolecular interaction, FRET has had a strongimpact on membrane and lipid research. Partic-ularly, lipid/protein clusters in membranes areinteresting topics of study, and there are manyapplications of FRET in this context. It hasbeen shown that GPI-anchored proteins areenriched in cholesterol-dependent clusters,whereas some putative nonraft proteins arenot. Cross-linking of GPI-anchored proteinsaffects the protein distribution on the mem-brane and their endocytosis, which highlightsthe role of immobile, actin-driven nanoclustersin the membrane (Varma and Mayor 1998;Sharma et al. 2004; Goswami et al. 2008). How-ever, there are also some contradicting reportson similar systems, proposing that there areno functional clusters in the cell membrane(Kenworthy and Edidin 1999; Kenworthy et al.
2000; Glebov and Nichols 2004). FLIM-FRETwas used to detect the effect of cholesteroldepletion on lipid order (Grant et al. 2007) aswell as dynamic protein–lipid interactions inlive cells (Larijani et al. 2003). TIR-FRET wasused to visualize protein–protein interactionson cell membranes and insulin secreting cells(Lam et al. 2010; Sohn et al. 2010). Two-photonFRET was applied to visualize protein–proteincolocalization (Mills et al. 2003) and free versusclustered receptor–ligand complexes in themembrane (Wallrabe et al. 2003).
Single-Particle Tracking (SPT)
As discussed above, information on the diffu-sion of molecules in a membrane can usuallybe obtained by either FRAP or FCS. However,there are certain disadvantages to both tech-niques. The lateral resolution of both tech-niques is limited by the diffraction barrier.Additionally, both techniques have to averageover many molecular events to obtain a reliablediffusion time. This averaging, however, maskspotential heterogeneities in the diffusion char-acteristics, induced by, for example, molecularinteractions or a heterogeneous membraneenvironment. Therefore, a technique providingaccess to the randomly distributed tracks ofindividual particles is greatly desirable. Withthe possibility of resolving single molecules,the spatial precision at which lateral detectioncan be performed is only determined by thenumber of photons it takes to compute a spot-like image, which can then be fitted with apoint-spread function to determine its geomet-rical center (Toprak et al. 2007).
This approach, which has in past yearsgained tremendous impact because of the avail-ability of extremely sensitive charge-coupleddevice (CCD) cameras, is known under thename of single-particle tracking (SPT). Theunderlying idea is that single particles or evenmolecules are followed by computer-enhancedvideo microscopy with a spatial resolution oftens of nanometers and a temporal resolutionof tens of milliseconds. Thus, it is a suitabletechnique to investigate the diffusion character-istics of lipid or membrane-attached proteins,
E. Sezgin and P. Schwille
22 Advanced Online Article. Cite this article as Cold Spring Harb Perspect Biol doi: 10.1101/cshperspect.a009803
on June 29, 2018 - Published by Cold Spring Harbor Laboratory Press http://cshperspectives.cshlp.org/Downloaded from
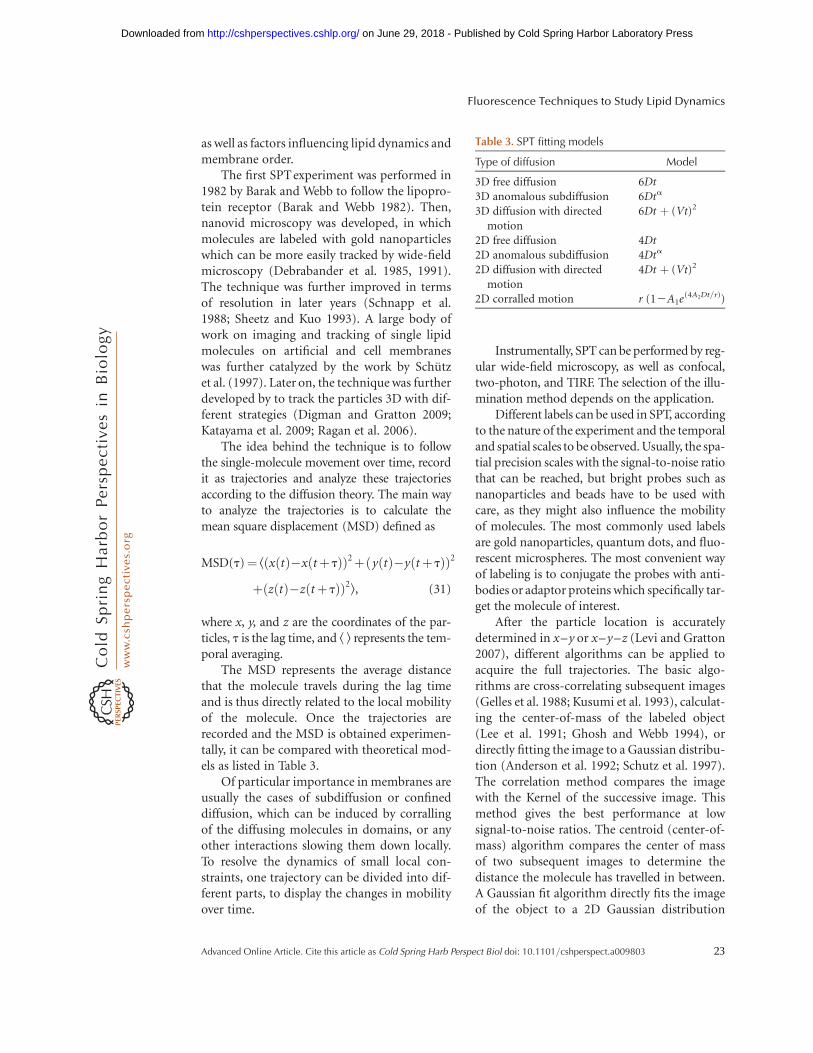
as well as factors influencing lipid dynamics andmembrane order.
The first SPT experiment was performed in1982 by Barak and Webb to follow the lipopro-tein receptor (Barak and Webb 1982). Then,nanovid microscopy was developed, in whichmolecules are labeled with gold nanoparticleswhich can be more easily tracked by wide-fieldmicroscopy (Debrabander et al. 1985, 1991).The technique was further improved in termsof resolution in later years (Schnapp et al.1988; Sheetz and Kuo 1993). A large body ofwork on imaging and tracking of single lipidmolecules on artificial and cell membraneswas further catalyzed by the work by Schutzet al. (1997). Later on, the technique was furtherdeveloped by to track the particles 3D with dif-ferent strategies (Digman and Gratton 2009;Katayama et al. 2009; Ragan et al. 2006).
The idea behind the technique is to followthe single-molecule movement over time, recordit as trajectories and analyze these trajectoriesaccording to the diffusion theory. The main wayto analyze the trajectories is to calculate themean square displacement (MSD) defined as
MSD(t)¼ k x tð Þ�x tþ tð Þð Þ2þ y tð Þ�y tþ tð Þð Þ2
þ z tð Þ�z tþ tð Þð Þ2l, (31)
where x, y, and z are the coordinates of the par-ticles, t is the lag time, and k l represents the tem-poral averaging.
The MSD represents the average distancethat the molecule travels during the lag timeand is thus directly related to the local mobilityof the molecule. Once the trajectories arerecorded and the MSD is obtained experimen-tally, it can be compared with theoretical mod-els as listed in Table 3.
Of particular importance in membranes areusually the cases of subdiffusion or confineddiffusion, which can be induced by corrallingof the diffusing molecules in domains, or anyother interactions slowing them down locally.To resolve the dynamics of small local con-straints, one trajectory can be divided into dif-ferent parts, to display the changes in mobilityover time.
Instrumentally, SPT can be performed by reg-ular wide-field microscopy, as well as confocal,two-photon, and TIRF. The selection of the illu-mination method depends on the application.
Different labels can be used in SPT, accordingto the nature of the experiment and the temporaland spatial scales to be observed. Usually, the spa-tial precision scales with the signal-to-noise ratiothat can be reached, but bright probes such asnanoparticles and beads have to be used withcare, as they might also influence the mobilityof molecules. The most commonly used labelsare gold nanoparticles, quantum dots, and fluo-rescent microspheres. The most convenient wayof labeling is to conjugate the probes with anti-bodies or adaptor proteins which specifically tar-get the molecule of interest.
After the particle location is accuratelydetermined in x–y or x–y–z (Levi and Gratton2007), different algorithms can be applied toacquire the full trajectories. The basic algo-rithms are cross-correlating subsequent images(Gelles et al. 1988; Kusumi et al. 1993), calculat-ing the center-of-mass of the labeled object(Lee et al. 1991; Ghosh and Webb 1994), ordirectly fitting the image to a Gaussian distribu-tion (Anderson et al. 1992; Schutz et al. 1997).The correlation method compares the imagewith the Kernel of the successive image. Thismethod gives the best performance at lowsignal-to-noise ratios. The centroid (center-of-mass) algorithm compares the center of massof two subsequent images to determine thedistance the molecule has travelled in between.A Gaussian fit algorithm directly fits the imageof the object to a 2D Gaussian distribution
Table 3. SPT fitting models
Type of diffusion Model
3D free diffusion 6Dt3D anomalous subdiffusion 6Dta
3D diffusion with directedmotion
6Dt þ (Vt)2
2D free diffusion 4Dt2D anomalous subdiffusion 4Dta
2D diffusion with directedmotion
4Dt þ (Vt)2
2D corralled motion r (12A1e(4A2Dt/r))
Fluorescence Techniques to Study Lipid Dynamics
Advanced Online Article. Cite this article as Cold Spring Harb Perspect Biol doi: 10.1101/cshperspect.a009803 23
on June 29, 2018 - Published by Cold Spring Harbor Laboratory Press http://cshperspectives.cshlp.org/Downloaded from
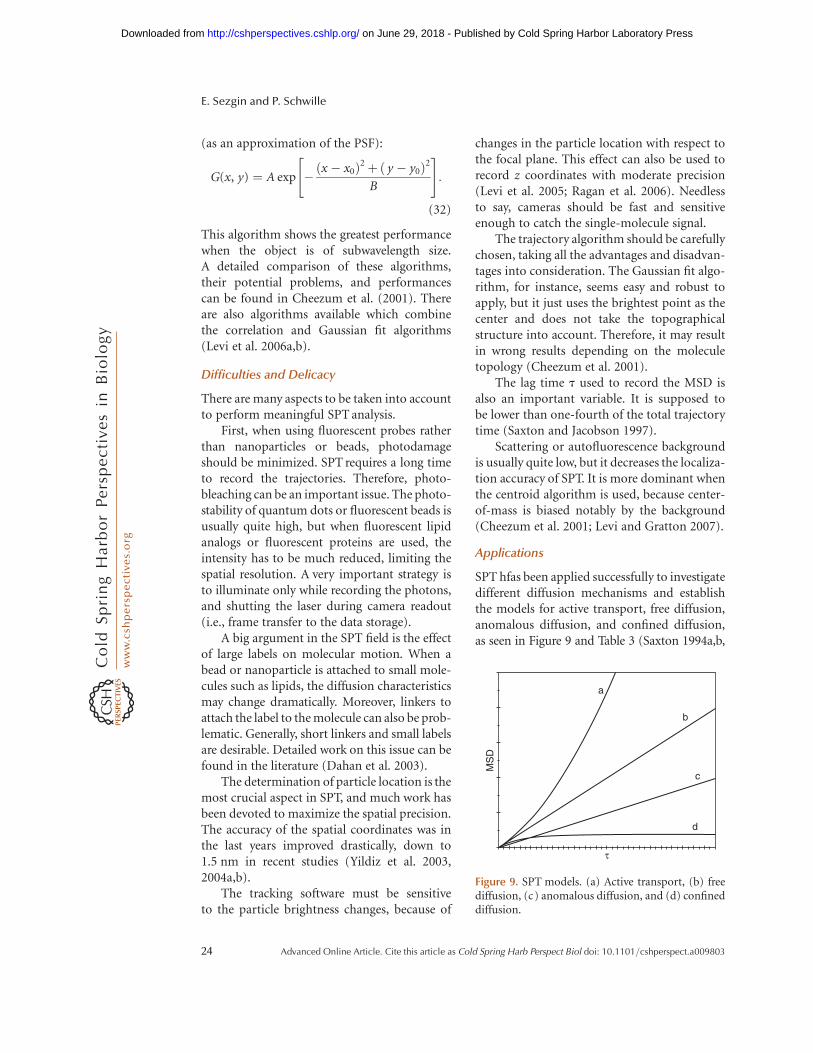
(as an approximation of the PSF):
G(x, y) ¼ A exp � x � x0ð Þ2þ y � y0ð Þ2
B
" #:
(32)
This algorithm shows the greatest performancewhen the object is of subwavelength size.A detailed comparison of these algorithms,their potential problems, and performancescan be found in Cheezum et al. (2001). Thereare also algorithms available which combinethe correlation and Gaussian fit algorithms(Levi et al. 2006a,b).
Difficulties and Delicacy
There are many aspects to be taken into accountto perform meaningful SPT analysis.
First, when using fluorescent probes ratherthan nanoparticles or beads, photodamageshould be minimized. SPT requires a long timeto record the trajectories. Therefore, photo-bleaching can be an important issue. The photo-stability of quantum dots or fluorescent beads isusually quite high, but when fluorescent lipidanalogs or fluorescent proteins are used, theintensity has to be much reduced, limiting thespatial resolution. A very important strategy isto illuminate only while recording the photons,and shutting the laser during camera readout(i.e., frame transfer to the data storage).
A big argument in the SPT field is the effectof large labels on molecular motion. When abead or nanoparticle is attached to small mole-cules such as lipids, the diffusion characteristicsmay change dramatically. Moreover, linkers toattach the label to the molecule can also be prob-lematic. Generally, short linkers and small labelsare desirable. Detailed work on this issue can befound in the literature (Dahan et al. 2003).
The determination of particle location is themost crucial aspect in SPT, and much work hasbeen devoted to maximize the spatial precision.The accuracy of the spatial coordinates was inthe last years improved drastically, down to1.5 nm in recent studies (Yildiz et al. 2003,2004a,b).
The tracking software must be sensitiveto the particle brightness changes, because of
changes in the particle location with respect tothe focal plane. This effect can also be used torecord z coordinates with moderate precision(Levi et al. 2005; Ragan et al. 2006). Needlessto say, cameras should be fast and sensitiveenough to catch the single-molecule signal.
The trajectory algorithm should be carefullychosen, taking all the advantages and disadvan-tages into consideration. The Gaussian fit algo-rithm, for instance, seems easy and robust toapply, but it just uses the brightest point as thecenter and does not take the topographicalstructure into account. Therefore, it may resultin wrong results depending on the moleculetopology (Cheezum et al. 2001).
The lag time t used to record the MSD isalso an important variable. It is supposed tobe lower than one-fourth of the total trajectorytime (Saxton and Jacobson 1997).
Scattering or autofluorescence backgroundis usually quite low, but it decreases the localiza-tion accuracy of SPT. It is more dominant whenthe centroid algorithm is used, because center-of-mass is biased notably by the background(Cheezum et al. 2001; Levi and Gratton 2007).
Applications
SPT hfas been applied successfully to investigatedifferent diffusion mechanisms and establishthe models for active transport, free diffusion,anomalous diffusion, and confined diffusion,as seen in Figure 9 and Table 3 (Saxton 1994a,b,
MS
D
a
b
c
d
τ
Figure 9. SPT models. (a) Active transport, (b) freediffusion, (c) anomalous diffusion, and (d) confineddiffusion.
E. Sezgin and P. Schwille
24 Advanced Online Article. Cite this article as Cold Spring Harb Perspect Biol doi: 10.1101/cshperspect.a009803
on June 29, 2018 - Published by Cold Spring Harbor Laboratory Press http://cshperspectives.cshlp.org/Downloaded from
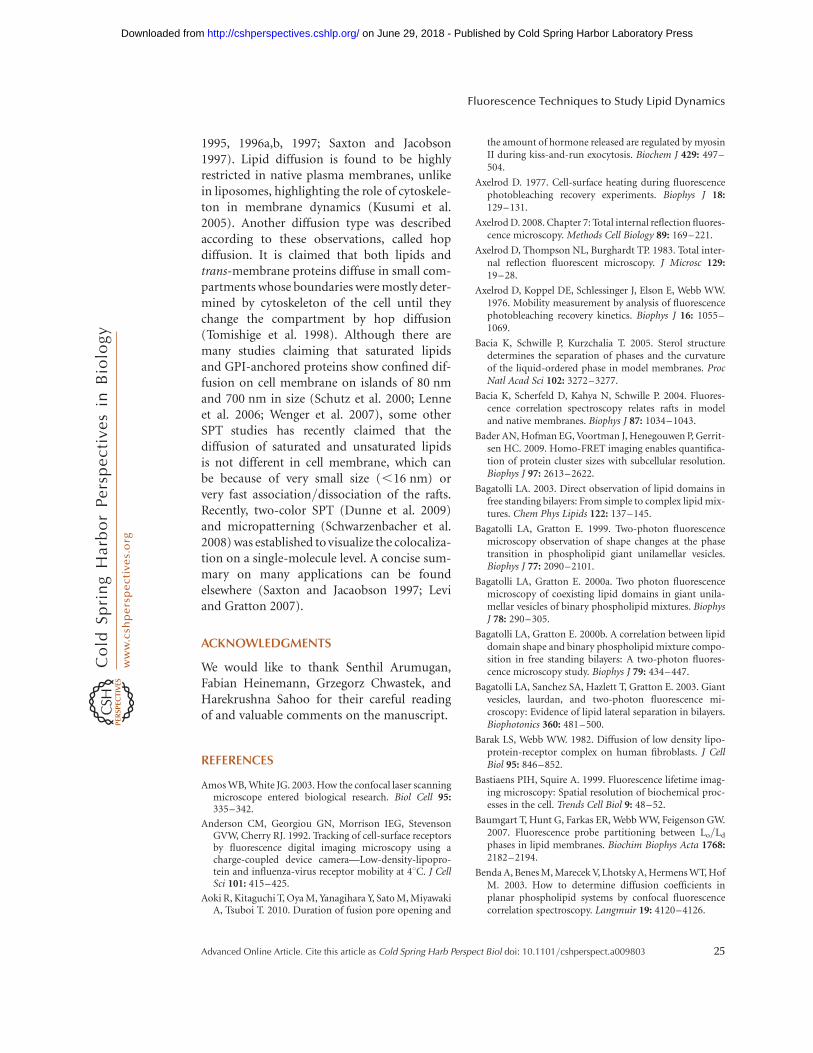
1995, 1996a,b, 1997; Saxton and Jacobson1997). Lipid diffusion is found to be highlyrestricted in native plasma membranes, unlikein liposomes, highlighting the role of cytoskele-ton in membrane dynamics (Kusumi et al.2005). Another diffusion type was describedaccording to these observations, called hopdiffusion. It is claimed that both lipids andtrans-membrane proteins diffuse in small com-partments whose boundaries were mostly deter-mined by cytoskeleton of the cell until theychange the compartment by hop diffusion(Tomishige et al. 1998). Although there aremany studies claiming that saturated lipidsand GPI-anchored proteins show confined dif-fusion on cell membrane on islands of 80 nmand 700 nm in size (Schutz et al. 2000; Lenneet al. 2006; Wenger et al. 2007), some otherSPT studies has recently claimed that thediffusion of saturated and unsaturated lipidsis not different in cell membrane, which canbe because of very small size (,16 nm) orvery fast association/dissociation of the rafts.Recently, two-color SPT (Dunne et al. 2009)and micropatterning (Schwarzenbacher et al.2008) was established to visualize the colocaliza-tion on a single-molecule level. A concise sum-mary on many applications can be foundelsewhere (Saxton and Jacaobson 1997; Leviand Gratton 2007).
ACKNOWLEDGMENTS
We would like to thank Senthil Arumugan,Fabian Heinemann, Grzegorz Chwastek, andHarekrushna Sahoo for their careful readingof and valuable comments on the manuscript.
REFERENCES
Amos WB, White JG. 2003. How the confocal laser scanningmicroscope entered biological research. Biol Cell 95:335–342.
Anderson CM, Georgiou GN, Morrison IEG, StevensonGVW, Cherry RJ. 1992. Tracking of cell-surface receptorsby fluorescence digital imaging microscopy using acharge-coupled device camera—Low-density-lipopro-tein and influenza-virus receptor mobility at 48C. J CellSci 101: 415–425.
Aoki R, Kitaguchi T, Oya M, Yanagihara Y, Sato M, MiyawakiA, Tsuboi T. 2010. Duration of fusion pore opening and
the amount of hormone released are regulated by myosinII during kiss-and-run exocytosis. Biochem J 429: 497–504.
Axelrod D. 1977. Cell-surface heating during fluorescencephotobleaching recovery experiments. Biophys J 18:129–131.
Axelrod D. 2008. Chapter 7: Total internal reflection fluores-cence microscopy. Methods Cell Biology 89: 169–221.
Axelrod D, Thompson NL, Burghardt TP. 1983. Total inter-nal reflection fluorescent microscopy. J Microsc 129:19–28.
Axelrod D, Koppel DE, Schlessinger J, Elson E, Webb WW.1976. Mobility measurement by analysis of fluorescencephotobleaching recovery kinetics. Biophys J 16: 1055–1069.
Bacia K, Schwille P, Kurzchalia T. 2005. Sterol structuredetermines the separation of phases and the curvatureof the liquid-ordered phase in model membranes. ProcNatl Acad Sci 102: 3272–3277.
Bacia K, Scherfeld D, Kahya N, Schwille P. 2004. Fluores-cence correlation spectroscopy relates rafts in modeland native membranes. Biophys J 87: 1034–1043.
Bader AN, Hofman EG, Voortman J, Henegouwen P, Gerrit-sen HC. 2009. Homo-FRET imaging enables quantifica-tion of protein cluster sizes with subcellular resolution.Biophys J 97: 2613–2622.
Bagatolli LA. 2003. Direct observation of lipid domains infree standing bilayers: From simple to complex lipid mix-tures. Chem Phys Lipids 122: 137–145.
Bagatolli LA, Gratton E. 1999. Two-photon fluorescencemicroscopy observation of shape changes at the phasetransition in phospholipid giant unilamellar vesicles.Biophys J 77: 2090–2101.
Bagatolli LA, Gratton E. 2000a. Two photon fluorescencemicroscopy of coexisting lipid domains in giant unila-mellar vesicles of binary phospholipid mixtures. BiophysJ 78: 290–305.
Bagatolli LA, Gratton E. 2000b. A correlation between lipiddomain shape and binary phospholipid mixture compo-sition in free standing bilayers: A two-photon fluores-cence microscopy study. Biophys J 79: 434–447.
Bagatolli LA, Sanchez SA, Hazlett T, Gratton E. 2003. Giantvesicles, laurdan, and two-photon fluorescence mi-croscopy: Evidence of lipid lateral separation in bilayers.Biophotonics 360: 481–500.
Barak LS, Webb WW. 1982. Diffusion of low density lipo-protein-receptor complex on human fibroblasts. J CellBiol 95: 846–852.
Bastiaens PIH, Squire A. 1999. Fluorescence lifetime imag-ing microscopy: Spatial resolution of biochemical proc-esses in the cell. Trends Cell Biol 9: 48–52.
Baumgart T, Hunt G, Farkas ER, Webb WW, Feigenson GW.2007. Fluorescence probe partitioning between Lo/Ld
phases in lipid membranes. Biochim Biophys Acta 1768:2182–2194.
Benda A, Benes M, Marecek V, Lhotsky A, Hermens WT, HofM. 2003. How to determine diffusion coefficients inplanar phospholipid systems by confocal fluorescencecorrelation spectroscopy. Langmuir 19: 4120–4126.
Fluorescence Techniques to Study Lipid Dynamics
Advanced Online Article. Cite this article as Cold Spring Harb Perspect Biol doi: 10.1101/cshperspect.a009803 25
on June 29, 2018 - Published by Cold Spring Harbor Laboratory Press http://cshperspectives.cshlp.org/Downloaded from
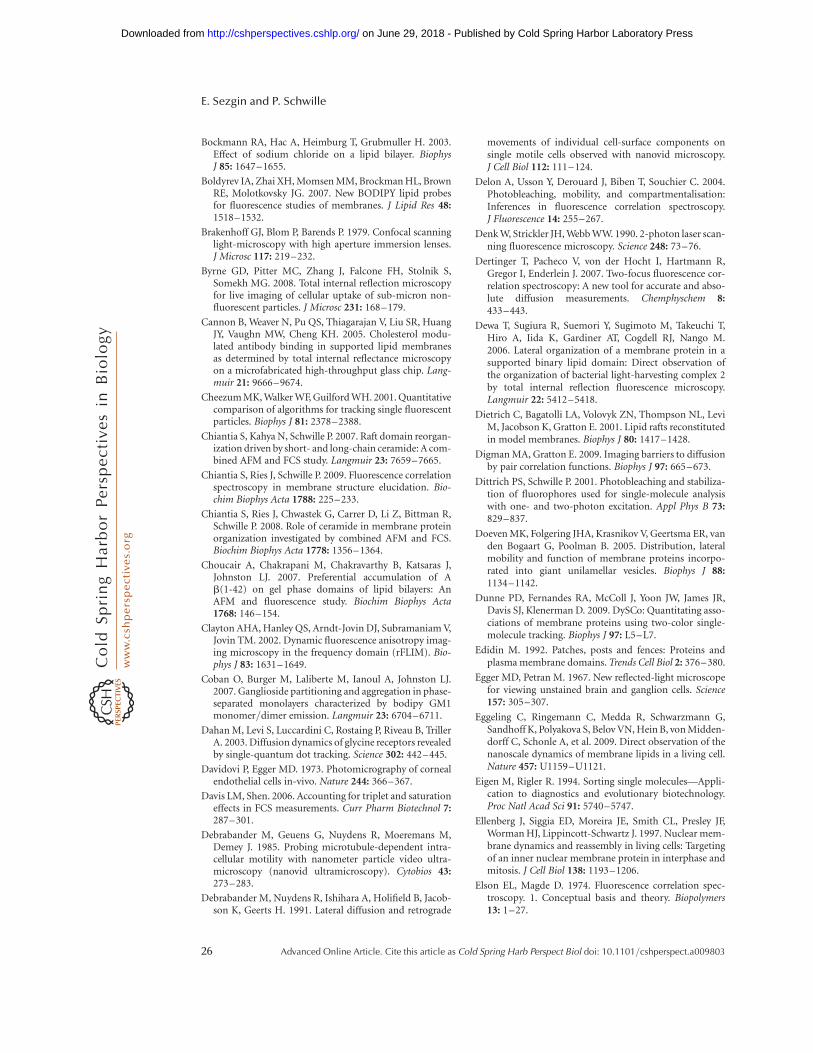
Bockmann RA, Hac A, Heimburg T, Grubmuller H. 2003.Effect of sodium chloride on a lipid bilayer. BiophysJ 85: 1647–1655.
Boldyrev IA, Zhai XH, Momsen MM, Brockman HL, BrownRE, Molotkovsky JG. 2007. New BODIPY lipid probesfor fluorescence studies of membranes. J Lipid Res 48:1518–1532.
Brakenhoff GJ, Blom P, Barends P. 1979. Confocal scanninglight-microscopy with high aperture immersion lenses.J Microsc 117: 219–232.
Byrne GD, Pitter MC, Zhang J, Falcone FH, Stolnik S,Somekh MG. 2008. Total internal reflection microscopyfor live imaging of cellular uptake of sub-micron non-fluorescent particles. J Microsc 231: 168–179.
Cannon B, Weaver N, Pu QS, Thiagarajan V, Liu SR, HuangJY, Vaughn MW, Cheng KH. 2005. Cholesterol modu-lated antibody binding in supported lipid membranesas determined by total internal reflectance microscopyon a microfabricated high-throughput glass chip. Lang-muir 21: 9666–9674.
Cheezum MK, Walker WF, Guilford WH. 2001. Quantitativecomparison of algorithms for tracking single fluorescentparticles. Biophys J 81: 2378–2388.
Chiantia S, Kahya N, Schwille P. 2007. Raft domain reorgan-ization driven by short- and long-chain ceramide: A com-bined AFM and FCS study. Langmuir 23: 7659–7665.
Chiantia S, Ries J, Schwille P. 2009. Fluorescence correlationspectroscopy in membrane structure elucidation. Bio-chim Biophys Acta 1788: 225–233.
Chiantia S, Ries J, Chwastek G, Carrer D, Li Z, Bittman R,Schwille P. 2008. Role of ceramide in membrane proteinorganization investigated by combined AFM and FCS.Biochim Biophys Acta 1778: 1356–1364.
Choucair A, Chakrapani M, Chakravarthy B, Katsaras J,Johnston LJ. 2007. Preferential accumulation of Ab(1-42) on gel phase domains of lipid bilayers: AnAFM and fluorescence study. Biochim Biophys Acta1768: 146–154.
Clayton AHA, Hanley QS, Arndt-Jovin DJ, Subramaniam V,Jovin TM. 2002. Dynamic fluorescence anisotropy imag-ing microscopy in the frequency domain (rFLIM). Bio-phys J 83: 1631–1649.
Coban O, Burger M, Laliberte M, Ianoul A, Johnston LJ.2007. Ganglioside partitioning and aggregation in phase-separated monolayers characterized by bodipy GM1monomer/dimer emission. Langmuir 23: 6704–6711.
Dahan M, Levi S, Luccardini C, Rostaing P, Riveau B, TrillerA. 2003. Diffusion dynamics of glycine receptors revealedby single-quantum dot tracking. Science 302: 442–445.
Davidovi P, Egger MD. 1973. Photomicrography of cornealendothelial cells in-vivo. Nature 244: 366–367.
Davis LM, Shen. 2006. Accounting for triplet and saturationeffects in FCS measurements. Curr Pharm Biotechnol 7:287–301.
Debrabander M, Geuens G, Nuydens R, Moeremans M,Demey J. 1985. Probing microtubule-dependent intra-cellular motility with nanometer particle video ultra-microscopy (nanovid ultramicroscopy). Cytobios 43:273–283.
Debrabander M, Nuydens R, Ishihara A, Holifield B, Jacob-son K, Geerts H. 1991. Lateral diffusion and retrograde
movements of individual cell-surface components onsingle motile cells observed with nanovid microscopy.J Cell Biol 112: 111–124.
Delon A, Usson Y, Derouard J, Biben T, Souchier C. 2004.Photobleaching, mobility, and compartmentalisation:Inferences in fluorescence correlation spectroscopy.J Fluorescence 14: 255–267.
Denk W, Strickler JH, Webb WW. 1990. 2-photon laser scan-ning fluorescence microscopy. Science 248: 73–76.
Dertinger T, Pacheco V, von der Hocht I, Hartmann R,Gregor I, Enderlein J. 2007. Two-focus fluorescence cor-relation spectroscopy: A new tool for accurate and abso-lute diffusion measurements. Chemphyschem 8:433–443.
Dewa T, Sugiura R, Suemori Y, Sugimoto M, Takeuchi T,Hiro A, Iida K, Gardiner AT, Cogdell RJ, Nango M.2006. Lateral organization of a membrane protein in asupported binary lipid domain: Direct observation ofthe organization of bacterial light-harvesting complex 2by total internal reflection fluorescence microscopy.Langmuir 22: 5412–5418.
Dietrich C, Bagatolli LA, Volovyk ZN, Thompson NL, LeviM, Jacobson K, Gratton E. 2001. Lipid rafts reconstitutedin model membranes. Biophys J 80: 1417–1428.
Digman MA, Gratton E. 2009. Imaging barriers to diffusionby pair correlation functions. Biophys J 97: 665–673.
Dittrich PS, Schwille P. 2001. Photobleaching and stabiliza-tion of fluorophores used for single-molecule analysiswith one- and two-photon excitation. Appl Phys B 73:829–837.
Doeven MK, Folgering JHA, Krasnikov V, Geertsma ER, vanden Bogaart G, Poolman B. 2005. Distribution, lateralmobility and function of membrane proteins incorpo-rated into giant unilamellar vesicles. Biophys J 88:1134–1142.
Dunne PD, Fernandes RA, McColl J, Yoon JW, James JR,Davis SJ, Klenerman D. 2009. DySCo: Quantitating asso-ciations of membrane proteins using two-color single-molecule tracking. Biophys J 97: L5–L7.
Edidin M. 1992. Patches, posts and fences: Proteins andplasma membrane domains. Trends Cell Biol 2: 376–380.
Egger MD, Petran M. 1967. New reflected-light microscopefor viewing unstained brain and ganglion cells. Science157: 305–307.
Eggeling C, Ringemann C, Medda R, Schwarzmann G,Sandhoff K, Polyakova S, Belov VN, Hein B, von Midden-dorff C, Schonle A, et al. 2009. Direct observation of thenanoscale dynamics of membrane lipids in a living cell.Nature 457: U1159–U1121.
Eigen M, Rigler R. 1994. Sorting single molecules—Appli-cation to diagnostics and evolutionary biotechnology.Proc Natl Acad Sci 91: 5740–5747.
Ellenberg J, Siggia ED, Moreira JE, Smith CL, Presley JF,Worman HJ, Lippincott-Schwartz J. 1997. Nuclear mem-brane dynamics and reassembly in living cells: Targetingof an inner nuclear membrane protein in interphase andmitosis. J Cell Biol 138: 1193–1206.
Elson EL, Magde D. 1974. Fluorescence correlation spec-troscopy. 1. Conceptual basis and theory. Biopolymers13: 1–27.
E. Sezgin and P. Schwille
26 Advanced Online Article. Cite this article as Cold Spring Harb Perspect Biol doi: 10.1101/cshperspect.a009803
on June 29, 2018 - Published by Cold Spring Harbor Laboratory Press http://cshperspectives.cshlp.org/Downloaded from
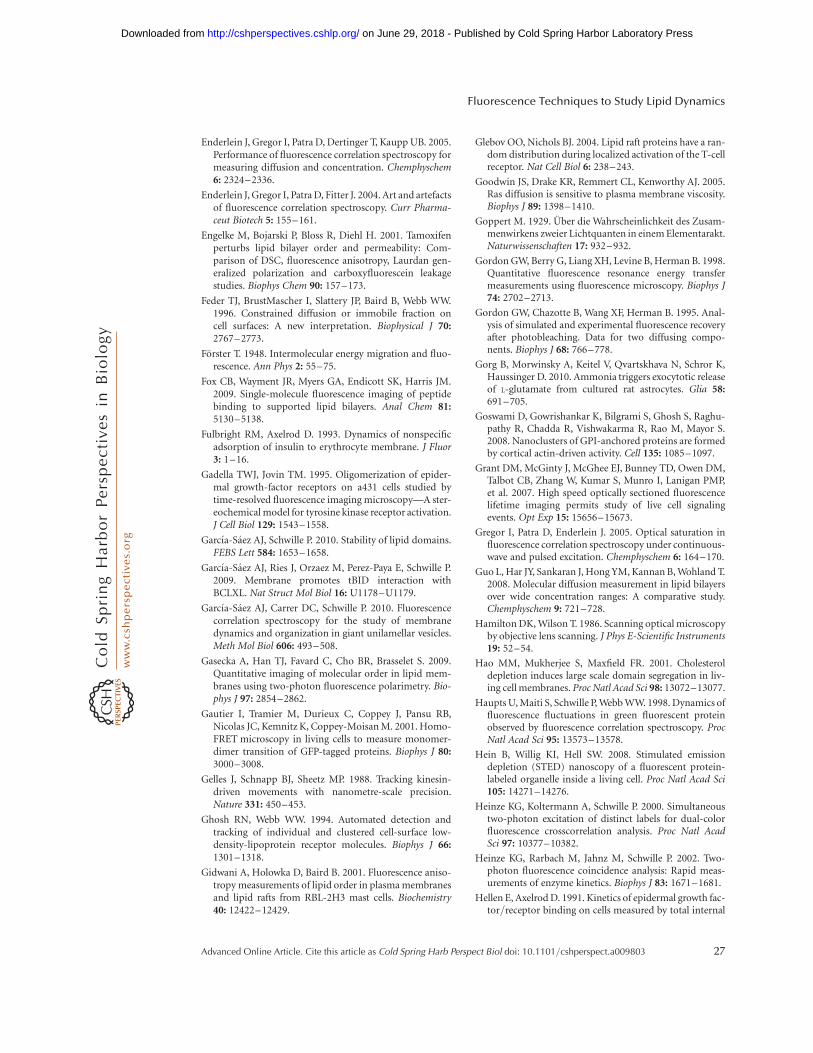
Enderlein J, Gregor I, Patra D, Dertinger T, Kaupp UB. 2005.Performance of fluorescence correlation spectroscopy formeasuring diffusion and concentration. Chemphyschem6: 2324–2336.
Enderlein J, Gregor I, Patra D, Fitter J. 2004. Art and artefactsof fluorescence correlation spectroscopy. Curr Pharma-ceut Biotech 5: 155–161.
Engelke M, Bojarski P, Bloss R, Diehl H. 2001. Tamoxifenperturbs lipid bilayer order and permeability: Com-parison of DSC, fluorescence anisotropy, Laurdan gen-eralized polarization and carboxyfluorescein leakagestudies. Biophys Chem 90: 157–173.
Feder TJ, BrustMascher I, Slattery JP, Baird B, Webb WW.1996. Constrained diffusion or immobile fraction oncell surfaces: A new interpretation. Biophysical J 70:2767–2773.
Forster T. 1948. Intermolecular energy migration and fluo-rescence. Ann Phys 2: 55–75.
Fox CB, Wayment JR, Myers GA, Endicott SK, Harris JM.2009. Single-molecule fluorescence imaging of peptidebinding to supported lipid bilayers. Anal Chem 81:5130–5138.
Fulbright RM, Axelrod D. 1993. Dynamics of nonspecificadsorption of insulin to erythrocyte membrane. J Fluor3: 1–16.
Gadella TWJ, Jovin TM. 1995. Oligomerization of epider-mal growth-factor receptors on a431 cells studied bytime-resolved fluorescence imaging microscopy—A ster-eochemical model for tyrosine kinase receptor activation.J Cell Biol 129: 1543–1558.
Garcıa-Saez AJ, Schwille P. 2010. Stability of lipid domains.FEBS Lett 584: 1653–1658.
Garcıa-Saez AJ, Ries J, Orzaez M, Perez-Paya E, Schwille P.2009. Membrane promotes tBID interaction withBCLXL. Nat Struct Mol Biol 16: U1178–U1179.
Garcıa-Saez AJ, Carrer DC, Schwille P. 2010. Fluorescencecorrelation spectroscopy for the study of membranedynamics and organization in giant unilamellar vesicles.Meth Mol Biol 606: 493–508.
Gasecka A, Han TJ, Favard C, Cho BR, Brasselet S. 2009.Quantitative imaging of molecular order in lipid mem-branes using two-photon fluorescence polarimetry. Bio-phys J 97: 2854–2862.
Gautier I, Tramier M, Durieux C, Coppey J, Pansu RB,Nicolas JC, Kemnitz K, Coppey-Moisan M. 2001. Homo-FRET microscopy in living cells to measure monomer-dimer transition of GFP-tagged proteins. Biophys J 80:3000–3008.
Gelles J, Schnapp BJ, Sheetz MP. 1988. Tracking kinesin-driven movements with nanometre-scale precision.Nature 331: 450–453.
Ghosh RN, Webb WW. 1994. Automated detection andtracking of individual and clustered cell-surface low-density-lipoprotein receptor molecules. Biophys J 66:1301–1318.
Gidwani A, Holowka D, Baird B. 2001. Fluorescence aniso-tropy measurements of lipid order in plasma membranesand lipid rafts from RBL-2H3 mast cells. Biochemistry40: 12422–12429.
Glebov OO, Nichols BJ. 2004. Lipid raft proteins have a ran-dom distribution during localized activation of the T-cellreceptor. Nat Cell Biol 6: 238–243.
Goodwin JS, Drake KR, Remmert CL, Kenworthy AJ. 2005.Ras diffusion is sensitive to plasma membrane viscosity.Biophys J 89: 1398–1410.
Goppert M. 1929. Uber die Wahrscheinlichkeit des Zusam-menwirkens zweier Lichtquanten in einem Elementarakt.Naturwissenschaften 17: 932–932.
Gordon GW, Berry G, Liang XH, Levine B, Herman B. 1998.Quantitative fluorescence resonance energy transfermeasurements using fluorescence microscopy. Biophys J74: 2702–2713.
Gordon GW, Chazotte B, Wang XF, Herman B. 1995. Anal-ysis of simulated and experimental fluorescence recoveryafter photobleaching. Data for two diffusing compo-nents. Biophys J 68: 766–778.
Gorg B, Morwinsky A, Keitel V, Qvartskhava N, Schror K,Haussinger D. 2010. Ammonia triggers exocytotic releaseof L-glutamate from cultured rat astrocytes. Glia 58:691–705.
Goswami D, Gowrishankar K, Bilgrami S, Ghosh S, Raghu-pathy R, Chadda R, Vishwakarma R, Rao M, Mayor S.2008. Nanoclusters of GPI-anchored proteins are formedby cortical actin-driven activity. Cell 135: 1085–1097.
Grant DM, McGinty J, McGhee EJ, Bunney TD, Owen DM,Talbot CB, Zhang W, Kumar S, Munro I, Lanigan PMP,et al. 2007. High speed optically sectioned fluorescencelifetime imaging permits study of live cell signalingevents. Opt Exp 15: 15656–15673.
Gregor I, Patra D, Enderlein J. 2005. Optical saturation influorescence correlation spectroscopy under continuous-wave and pulsed excitation. Chemphyschem 6: 164–170.
Guo L, Har JY, Sankaran J, Hong YM, Kannan B, Wohland T.2008. Molecular diffusion measurement in lipid bilayersover wide concentration ranges: A comparative study.Chemphyschem 9: 721–728.
Hamilton DK, Wilson T. 1986. Scanning optical microscopyby objective lens scanning. J Phys E-Scientific Instruments19: 52–54.
Hao MM, Mukherjee S, Maxfield FR. 2001. Cholesteroldepletion induces large scale domain segregation in liv-ing cell membranes. Proc Natl Acad Sci 98: 13072–13077.
Haupts U, Maiti S, Schwille P, Webb WW. 1998. Dynamics offluorescence fluctuations in green fluorescent proteinobserved by fluorescence correlation spectroscopy. ProcNatl Acad Sci 95: 13573–13578.
Hein B, Willig KI, Hell SW. 2008. Stimulated emissiondepletion (STED) nanoscopy of a fluorescent protein-labeled organelle inside a living cell. Proc Natl Acad Sci105: 14271–14276.
Heinze KG, Koltermann A, Schwille P. 2000. Simultaneoustwo-photon excitation of distinct labels for dual-colorfluorescence crosscorrelation analysis. Proc Natl AcadSci 97: 10377–10382.
Heinze KG, Rarbach M, Jahnz M, Schwille P. 2002. Two-photon fluorescence coincidence analysis: Rapid meas-urements of enzyme kinetics. Biophys J 83: 1671–1681.
Hellen E, Axelrod D. 1991. Kinetics of epidermal growth fac-tor/receptor binding on cells measured by total internal
Fluorescence Techniques to Study Lipid Dynamics
Advanced Online Article. Cite this article as Cold Spring Harb Perspect Biol doi: 10.1101/cshperspect.a009803 27
on June 29, 2018 - Published by Cold Spring Harbor Laboratory Press http://cshperspectives.cshlp.org/Downloaded from
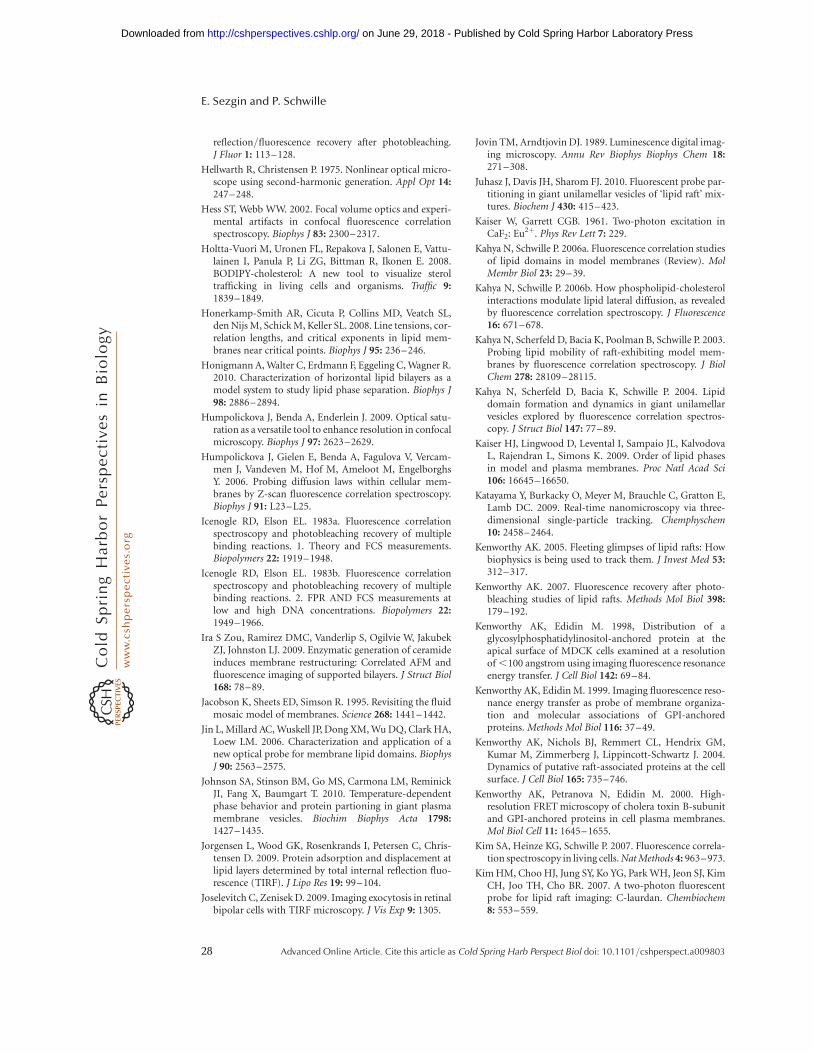
reflection/fluorescence recovery after photobleaching.J Fluor 1: 113–128.
Hellwarth R, Christensen P. 1975. Nonlinear optical micro-scope using second-harmonic generation. Appl Opt 14:247–248.
Hess ST, Webb WW. 2002. Focal volume optics and experi-mental artifacts in confocal fluorescence correlationspectroscopy. Biophys J 83: 2300–2317.
Holtta-Vuori M, Uronen FL, Repakova J, Salonen E, Vattu-lainen I, Panula P, Li ZG, Bittman R, Ikonen E. 2008.BODIPY-cholesterol: A new tool to visualize steroltrafficking in living cells and organisms. Traffic 9:1839–1849.
Honerkamp-Smith AR, Cicuta P, Collins MD, Veatch SL,den Nijs M, Schick M, Keller SL. 2008. Line tensions, cor-relation lengths, and critical exponents in lipid mem-branes near critical points. Biophys J 95: 236–246.
Honigmann A, Walter C, Erdmann F, Eggeling C, Wagner R.2010. Characterization of horizontal lipid bilayers as amodel system to study lipid phase separation. Biophys J98: 2886–2894.
Humpolickova J, Benda A, Enderlein J. 2009. Optical satu-ration as a versatile tool to enhance resolution in confocalmicroscopy. Biophys J 97: 2623–2629.
Humpolickova J, Gielen E, Benda A, Fagulova V, Vercam-men J, Vandeven M, Hof M, Ameloot M, EngelborghsY. 2006. Probing diffusion laws within cellular mem-branes by Z-scan fluorescence correlation spectroscopy.Biophys J 91: L23–L25.
Icenogle RD, Elson EL. 1983a. Fluorescence correlationspectroscopy and photobleaching recovery of multiplebinding reactions. 1. Theory and FCS measurements.Biopolymers 22: 1919–1948.
Icenogle RD, Elson EL. 1983b. Fluorescence correlationspectroscopy and photobleaching recovery of multiplebinding reactions. 2. FPR AND FCS measurements atlow and high DNA concentrations. Biopolymers 22:1949–1966.
Ira S Zou, Ramirez DMC, Vanderlip S, Ogilvie W, JakubekZJ, Johnston LJ. 2009. Enzymatic generation of ceramideinduces membrane restructuring: Correlated AFM andfluorescence imaging of supported bilayers. J Struct Biol168: 78–89.
Jacobson K, Sheets ED, Simson R. 1995. Revisiting the fluidmosaic model of membranes. Science 268: 1441–1442.
Jin L, Millard AC, Wuskell JP, Dong XM, Wu DQ, Clark HA,Loew LM. 2006. Characterization and application of anew optical probe for membrane lipid domains. BiophysJ 90: 2563–2575.
Johnson SA, Stinson BM, Go MS, Carmona LM, ReminickJI, Fang X, Baumgart T. 2010. Temperature-dependentphase behavior and protein partioning in giant plasmamembrane vesicles. Biochim Biophys Acta 1798:1427–1435.
Jorgensen L, Wood GK, Rosenkrands I, Petersen C, Chris-tensen D. 2009. Protein adsorption and displacement atlipid layers determined by total internal reflection fluo-rescence (TIRF). J Lipo Res 19: 99–104.
Joselevitch C, Zenisek D. 2009. Imaging exocytosis in retinalbipolar cells with TIRF microscopy. J Vis Exp 9: 1305.
Jovin TM, Arndtjovin DJ. 1989. Luminescence digital imag-ing microscopy. Annu Rev Biophys Biophys Chem 18:271–308.
Juhasz J, Davis JH, Sharom FJ. 2010. Fluorescent probe par-titioning in giant unilamellar vesicles of ‘lipid raft’ mix-tures. Biochem J 430: 415–423.
Kaiser W, Garrett CGB. 1961. Two-photon excitation inCaF2: Eu2þ. Phys Rev Lett 7: 229.
Kahya N, Schwille P. 2006a. Fluorescence correlation studiesof lipid domains in model membranes (Review). MolMembr Biol 23: 29–39.
Kahya N, Schwille P. 2006b. How phospholipid-cholesterolinteractions modulate lipid lateral diffusion, as revealedby fluorescence correlation spectroscopy. J Fluorescence16: 671–678.
Kahya N, Scherfeld D, Bacia K, Poolman B, Schwille P. 2003.Probing lipid mobility of raft-exhibiting model mem-branes by fluorescence correlation spectroscopy. J BiolChem 278: 28109–28115.
Kahya N, Scherfeld D, Bacia K, Schwille P. 2004. Lipiddomain formation and dynamics in giant unilamellarvesicles explored by fluorescence correlation spectros-copy. J Struct Biol 147: 77–89.
Kaiser HJ, Lingwood D, Levental I, Sampaio JL, KalvodovaL, Rajendran L, Simons K. 2009. Order of lipid phasesin model and plasma membranes. Proc Natl Acad Sci106: 16645–16650.
Katayama Y, Burkacky O, Meyer M, Brauchle C, Gratton E,Lamb DC. 2009. Real-time nanomicroscopy via three-dimensional single-particle tracking. Chemphyschem10: 2458–2464.
Kenworthy AK. 2005. Fleeting glimpses of lipid rafts: Howbiophysics is being used to track them. J Invest Med 53:312–317.
Kenworthy AK. 2007. Fluorescence recovery after photo-bleaching studies of lipid rafts. Methods Mol Biol 398:179–192.
Kenworthy AK, Edidin M. 1998, Distribution of aglycosylphosphatidylinositol-anchored protein at theapical surface of MDCK cells examined at a resolutionof ,100 angstrom using imaging fluorescence resonanceenergy transfer. J Cell Biol 142: 69–84.
Kenworthy AK, Edidin M. 1999. Imaging fluorescence reso-nance energy transfer as probe of membrane organiza-tion and molecular associations of GPI-anchoredproteins. Methods Mol Biol 116: 37–49.
Kenworthy AK, Nichols BJ, Remmert CL, Hendrix GM,Kumar M, Zimmerberg J, Lippincott-Schwartz J. 2004.Dynamics of putative raft-associated proteins at the cellsurface. J Cell Biol 165: 735–746.
Kenworthy AK, Petranova N, Edidin M. 2000. High-resolution FRET microscopy of cholera toxin B-subunitand GPI-anchored proteins in cell plasma membranes.Mol Biol Cell 11: 1645–1655.
Kim SA, Heinze KG, Schwille P. 2007. Fluorescence correla-tion spectroscopy in living cells. Nat Methods 4: 963–973.
Kim HM, Choo HJ, Jung SY, Ko YG, Park WH, Jeon SJ, KimCH, Joo TH, Cho BR. 2007. A two-photon fluorescentprobe for lipid raft imaging: C-laurdan. Chembiochem8: 553–559.
E. Sezgin and P. Schwille
28 Advanced Online Article. Cite this article as Cold Spring Harb Perspect Biol doi: 10.1101/cshperspect.a009803
on June 29, 2018 - Published by Cold Spring Harbor Laboratory Press http://cshperspectives.cshlp.org/Downloaded from
Kim HM, Jeong BH, Hyon JY, An MJ, Seo MS, Hong JH, LeeKJ, Kim CH, Joo TH, Hong SC, et al. 2008. Two-photonfluorescent turn-on probe for lipid rafts in live cell andtissue. J Am Chem Soc 130: 4246–4247.
Kirber MT, Chen K, Keaney JF. 2007. YFP photoconversionrevisited: Confirmation of the CFP-like species. NatMethods 4: 767–768.
Koppel DE, Axelrod D, Schlessinger J, Elson EL, Webb WW.1976. Dynamics of fluorescence marker concentration asa probe of mobility. Biophys J 16: 1315–1329.
Korlach J, Schwille P, Webb WW, Feigenson GW. 1999. Char-acterization of lipid bilayer phases by confocal micros-copy and fluorescence correlation spectroscopy. ProcNatl Acad Sci 96: 8461–8466.
Kuerschner L, Ejsing CS, Ekroos K, Shevchenko A, Ander-son KI, Thiele C.2005. Polyene-lipids: A new tool toimage lipids. Nat Methods 2: 39–45.
Klymchenko AS, Oncul S, Didier P, Schaub E, Bagatolli L,Duportail G, Mely Y. 2009. Visualization of lipid domainsin giant unilamellar vesicles using an environment-sensi-tive membrane probe based on 3-hydroxyflavone.Biochim Biophys Acta 1788: 495–499.
Kusumi A, Sako Y, Yamamoto M. 1993. Confined lateral dif-fusion of membrane-receptors as studied by single-particle tracking (NANOVID microscopy)—Effects ofcalcium-induced differentiation in cultured epithelial-cells. Biophys J 65: 2021–2040.
Kusumi A, Nakada C, Ritchie K, Murase K, Suzuki K, Mur-akoshi H, Kasai RS, Kondo J, Fujiwara T. 2005. Paradigmshift of the plasma membrane concept from the two-dimensional continuum fluid to the partitioned fluid:High-speed single-molecule tracking of membrane mol-ecules. Annu Rev Biophys Biomol Struct 34: U351–U354.
Lagerholm BC, Weinreb GE, Jacobson K, Thompson NL.2005. Detecting microdomains in intact cell membranes.Annu Rev Phys Chem 56: 309–336.
Lam AD, Ismail S, Wu R, Yizhar O, Passmore DR, Ernst SA,Stuenkel EL. 2010. Mapping dynamic protein interac-tions to insulin secretory granule behavior with TIRF-FRET. Biophys J 99: 1311–1320.
Larijani B, Allen-Baume V, Morgan CP, Li M, Cockcroft S.2003. EGF regulation of PITP dynamics is blocked byinhibitors of phospholipase C and of the Ras-MAP kin-ase pathway. Curr Biol 13: 78–84.
Lee GM, Ishihara A, Jacobson KA. 1991. Direct observationof Brownian-motion of lipids in a membrane. Proc NatlAcad Sci 88: 6274–6278.
Lenne PF, Wawrezinieck L, Conchonaud F, Wurtz O, BonedA, Guo XJ, Rigneault H, He HT, Marguet D. 2006.Dynamic molecular confinement in the plasma mem-brane by microdomains and the cytoskeleton meshwork.EMBO J 25: 3245–3256.
Levi V, Gratton E. 2007. Exploring dynamics in living cellsby tracking single particles. Cell Biochem Biophys 48:1–15.
Levi V, Ruan QQ, Gratton E. 2005. 3-D particle tracking in atwo-photon microscope: Application to the study ofmolecular dynamics in cells, Biophys J 88: 2919–2928.
Levi V, Gelfand VI, Serpinskaya AS, Gratton E. 2006a. Mel-anosomes transported by myosin-V in Xenopus melano-phores perform slow 35 nm steps. Biophys J 90: L7–L9.
Levi V, Serpinskaya AS, Gratton E, Gelfand V. 2006b. Organ-elle transport along microtubules in Xenopus melano-phores: Evidence for cooperation between multiplemotors. Biophys J 90: 318–327.
Lidke DS, Nagy P, Barisas BG, Heintzmann R, Post JN, LidkeKA, Clayton AHA, Arndt-Jovin DJ, Jovin TM. 2003.Imaging molecular interactions in cells by dynamic andstatic fluorescence anisotropy (rFLIM and emFRET).Biochem Soc Trans 31: 1020–1027.
Lingwood D, Ries J, Schwille P, Simons K. 2008. Plasmamembranes are poised for activation of raft phase coales-cence at physiological temperature. Proc Natl Acad Sci105: 10005–10010.
Lippincott-Schwartz J, Snapp E, Kenworthy A. 2001. Study-ing protein dynamics in living cells. Nat Cell Biol 2:444–456.
Lippincott-Schwartz J, Altan-Bonnet N, Patterson GH.2003. Photobleaching and photoactivation: Followingprotein dynamics in living cells. Nat Cell Biol Suppl:S7–S14.
Loman A, Dertinger T, Koberling F, Enderlein J. 2008. Com-parison of optical saturation effects in conventional anddual-focus fluorescence correlation spectroscopy. ChemPhys Lett 459: 18–21.
Lommerse PHM, Spaink HP, Schmidt T. 2004. In vivoplasma membrane organization: Results of biophysicalapproaches. Biochim Biophys Acta 1664: 119–131.
Machan R, Hof M. 2010. Lipid diffusion in planar mem-branes investigated by fluorescence correlation spectros-copy. Biochim Biophys Acta 1798: 1377–1391.
Magde D, Elson EL, Webb WW. 1974. Fluorescence correla-tion spectroscopy. 2. Experimental realization. Biopoly-mers 13: 29–61.
Magde D, Webb WW, Elson E. 1972. Thermodynamic fluc-tuations in a reacting system—Measurement by fluores-cence correlation spectroscopy. Phys Rev Lett 29: 705.
Magde D, Webb WW, Elson EL. 1978. Fluorescence correla-tion spectroscopy. 3. Uniform translation and laminar-flow. Biopolymers 17: 361–376.
Marks DL, Bittman R, Pagano RE. 2008. Use of Bodipy-labeled sphingolipid and cholesterol analogs to examinemembrane microdomains in cells. Histochem Cell Biol130: 819–832.
Meder D, Moreno MJ, Verkade P, Vaz WLC, Simons K. 2006.Phase coexistence and connectivity in the apical mem-brane of polarized epithelial cells. Proc Natl Acad Sci103: 329–334.
Merrifield CJ, Perrais D, Zenisek D. 2005. Coupling betweenclathrin-coated-pit invagination, cortactin recruitment,and membrane scission observed in live cells. Cell 121:593–606.
Merrifield CJ, Feldman ME, Wan L, Almers W. 2002. Imag-ing actin and dynamin recruitment during invaginationof single clathrin-coated pits. Nat Cell Biol 4: 691–698.
Meseth U, Wohland T, Rigler R, Vogel H. 1999. Resolutionof fluorescence correlation measurements. Biophys J 76:1619–1631.
Middlebrook JL, Dorland RB. 1984. Bacterial toxins—Cel-lular mechanisms of action. Microbiological Rev 48:199–221.
Fluorescence Techniques to Study Lipid Dynamics
Advanced Online Article. Cite this article as Cold Spring Harb Perspect Biol doi: 10.1101/cshperspect.a009803 29
on June 29, 2018 - Published by Cold Spring Harbor Laboratory Press http://cshperspectives.cshlp.org/Downloaded from
Mikhalyov I, Gretskaya N, Johansson LBA. 2009. Fluores-cent BODIPY-labelled GM1 gangliosides designed forexploring lipid membrane properties and specific mem-brane–target interactions. Chem Phys Lipids 159: 38–44.
Mills JD, Stone JR, Rubin DG, Melon DE, Okonkwo DO,Periasamy A, Helm GA. 2003. Illuminating protein inter-actions in tissue using confocal and two-photon excita-tion fluorescent resonance energy transfer microscopy.J Biomed Opt 8: 347–356.
Miyawaki A, Tsien RY. 2000. Monitoring protein conforma-tions and interactions by fluorescence resonance energytransfer between mutants of green fluorescent protein.Appl Chim Genes Hybrid Prot Pt B 327: 472–500.
Mueller BK, Zaychikov E, Brauchle C, Lamb DC. 2005.Pulsed interleaved excitation. Biophys J 89: 3508–3522.
Mutze J, Ohrt T, Schwille P. 2011. Fluorescence correlationspectroscopy in vivo. Laser Photon Rev 5: 52–67.
Nagamatsu S, Ohara-Imaizumi M. 2008. Imaging exocyto-sis of single insulin secretory granules with TIRF mi-croscopy. Methods Mol Biol 440: 259–268.
Nicolau DV, Burrage K, Parton RG, Hancock JF. 2006. Iden-tifying optimal lipid raft characteristics required to pro-mote nanoscale protein–protein interactions on theplasma membrane. Mol Cell Biol 26: 313–323.
Niv H, Gutman O, Henis YI, Kloog Y. 1999. Membraneinteractions of a constitutively active GFP-Ki-Ras 4Band their role in signaling—Evidence from lateral mo-bility studies. J Biol Chem 274: 1606–1613.
Niv H, Gutman O, Kloog Y, Henis YI. 2002. Activated K-Rasand H-Ras display different interactions with saturablenonraft sites at the surface of live cells. J Cell Biol 157:865–872.
Ohara-Imaizumi M, Aoyagi K, Akimoto Y, Nakamichi Y,Nishiwaki C, Kawakami H, Nagamatsu S. 2009. Imagingexocytosis of single glucagon-like peptide-1 containinggranules in a murine enteroendocrine cell line with totalinternal reflection fluorescent microscopy. Biochem Bio-phys Res Comm 390: 16–20.
Oreopoulos J, Yip CM. 2009. Probing membrane order andtopography in supported lipid bilayers by combinedpolarized total internal reflection fluorescence–atomicforce microscopy. Biophys J 96: 1970–1984.
Parasassi T, Gratton E, Yu WM, Wilson P, Levi M. 1997. Two-photon fluorescence microscopy of Laurdan generalizedpolarization domains in model and natural membranes.Biophys J 72: 2413–2429.
Petersen NO. 1986. Scanning fluorescence correlationspectroscopy. 1. Theory and simulation of aggregationmeasurements. Biophys J 49: 809–815.
Petersen NO, Johnson DC, Schlesinger MJ. 1986. Scanningfluorescence correlation spectroscopy. 2. Application tovirus glycoprotein aggregation. Biophys J 49: 817–820.
Petrasek Z, Schwille P. 2008. Precise measurement of diffu-sion coefficients using scanning fluorescence correlationspectroscopy. Biophys J 94: 1437–1448.
Petrasek Z, Ries J, Schwille P. 2010. Scanning FCS for thecharacterization of protein dynamics in live cells. MethEnzymol 472: 317–343.
Petrov E, Schwille P. 2007. State of the art and novel trends influorescence correlation spectroscopy. In Standardization
and quality assurance in fluorescence measurements II (ed.Resch-Genger U), pp. 145–197. Springer-Verlag, Berlin.
Phair RD, Gorski SA, Misteli T. 2004. Measurement ofdynamic protein binding to chromatin in vivo, usingphotobleaching microscopy. Methods Enzymol 375:393–414.
Pinaud F, Michalet X, Iyer G, Margeat E, Moore HP, Weiss S.2009. Dynamic partitioning of a glycosyl-phosphatidyli-nositol-anchored protein in glycosphingolipid-richmicrodomains imaged by single-quantum dot tracking.Traffic 10: 691–712.
Piston DW, Kremers GJ. 2007. Fluorescent protein FRET:The good, the bad and the ugly. Trends Biochem Sci 32:407–414.
Ragan T, Huang HD, So P, Gratton E. 2006. 3D particletracking on a two-photon microscope. J Fluorescence16: 325–336.
Ries J, Schwille P. 2006. Studying slow membrane dynamicswith continuous wave scanning fluorescence correlationspectroscopy. Biophys J 91: 1915–1924.
Ries J, Chiantia S, Schwille P. 2009b. Accurate determinationof membrane dynamics with line-scan FCS. Biophys J 96:1999–2008.
Ries J, Petrov EP, Schwille P. 2008. Total internal reflectionfluorescence correlation spectroscopy: Effects of lateraldiffusion and surface-generated fluorescence. Biophys J95: 390–399.
Ries J, Yu SR, Burkhardt M, Brand M, Schwille P. 2009a.Modular scanning FCS quantifies receptor-ligand inter-actions in living multicellular organisms. Nat Methods6: U643–U631.
Rigler R, Mets U, Widengren J, Kask P. 1993. Fluorescencecorrelation spectroscopy with high count rate and low-background—Analysis of translational diffusion. EuroBiophys J Biophys Lett 22: 169–175.
Rotblat B, Prior IA, Muncke C, Parton RG, Kloog Y, HenisYI, Hancock JF. 2004. Three separable domains regulateGTP-dependent association of H-ras with the plasmamembrane. Mol Cell Biol 24: 6799–6810.
Roy S, Plowman S, Rotblat B, Prior IA, Muncke C, GraingerS, Parton RG, Henis YI, Kloog Y, Hancock JF. 2005. Indi-vidual palmitoyl residues serve distinct roles in H-rastrafficking, microlocalization, and signaling. Mol CellBiol 25: 6722–6733.
Runnels LW, Scarlata SF. 1995. Theory and application offluorescence homotransfer to melittin oligomerization.Biophys J 69: 1569–1583.
Rusinova E, Tretyachenko-Ladokhina V, Vele OE, Senear DF,Ross JBA. 2002. Alexa and Oregon Green dyes as fluores-cence anisotropy probes for measuring protein–proteinand protein–nucleic acid interactions. Anal Biochem308: 18–25.
Sahoo H, Roccatano D, Hennig A, Nau WM. 2007. A10-angstrom spectroscopic ruler applied to short poly-prolines. J Am Chem Soc 129: 9762–9772.
Sako Y, Minoghchi S, Yanagida T. 2000. Single-moleculeimaging of EGFR signalling on the surface of living cells.Nat Cell Biol 2: 168–172.
Saxton MJ. 1994a. Anomalous diffusion due to obstacles—A Monte Carlo study. Biophys J 66: 394–401.
E. Sezgin and P. Schwille
30 Advanced Online Article. Cite this article as Cold Spring Harb Perspect Biol doi: 10.1101/cshperspect.a009803
on June 29, 2018 - Published by Cold Spring Harbor Laboratory Press http://cshperspectives.cshlp.org/Downloaded from
Saxton MJ. 1994b. Single-particle tracking—Models ofdirected transport. Biophys J 67: 2110–2119.
Saxton MJ. 1995. Single-tracking-effects of corrals. Biophys J69: 389–398.
Saxton MJ. 1996a. Anomalous diffusion due to binding: AMonte Carlo study, Biophys J 70: 1250–1262.
Saxton MJ. 1996b. Single-particle tracking: New methods ofdata analysis, Biophys J 70: TU415–TU415.
Saxton MJ. 1997. Single-particle tracking: The distributionof diffusion coefficients. Biophys J 72: 1744–1753.
Saxton MJ, Jacobson K. 1997. Single-particle tracking:Applications to membrane dynamics. Annu Rev BiophysBiomol Struct 26: 373–399.
Scherfeld D, Kahya N, Schwille P. 2003. Lipid dynamics anddomain formation in model membranes composed ofternary mixtures of unsaturated and saturated phos-phatidylcholines and cholesterol. Biophys J 85: 3758–3768.
Schnapp BJ, Gelles J, Sheetz MP. 1988. Nanometer-scalemeasurements using video light-microscopy. Cell Motil-ity Cytoskeleton 10: 47–53.
Schultz C, Neef AB, Gadella TW Jr, Goedhart J. 2010. Imag-ing lipids in living cells. Cold Spring Harb Protoc doi:101101/pdbtop83.
Schutz GJ, Schindler H, Schmidt T. 1997. Single-moleculemicroscopy on model membranes reveals anomalous dif-fusion. Biophys J 73: 1073–1080.
Schutz GJ, Kada G, Pastushenko VP, Schindler H. 2000.Properties of lipid microdomains in a muscle cell mem-brane visualized by single molecule microscopy. EMBO J19: 892–901.
Schwarzenbacher M, Kaltenbrunner M, Brameshuber M,Hesch C, Paster W, Weghuber J, Heise B, Sonnleitner A,Stockinger H, Schutz GJ. 2008. Micropatterning forquantitative analysis of protein–protein interactions inliving cells. Nat Methods 5: 1053–1060.
Schwille P. 2003. TIR-FCS: Staying on the surface can some-times be better. Biophys J 85: 2783–2784.
Schwille P, Heinze KG. 2001. Two-photon fluorescencecross-correlation spectroscopy. Chemphyschem 2: 269–272.
Schwille P, Korlach J, Webb WW. 1999a. Fluorescencecorrelation spectroscopy with single-molecule sen-sitivity on cell and model membranes. Cytometry 36:176–182.
Schwille P, MeyerAlmes FJ, Rigler R. 1997. Dual-colorfluorescence cross-correlation spectroscopy for multi-component diffusional analysis in solution. Biophys J72: 1878–1886.
Schwille P, Haupts U, Maiti S, Webb WW. 1999b. Moleculardynamics in living cells observed by fluorescence correla-tion spectroscopy with one- and two-photon excitation.Biophys J 77: 2251–2265.
Schwille P, Heinze K, Dittrich P, Haustein E. 2009.Two-photon fluorescence correlation spectroscopy. InBiomedical optical imaging (ed. Fujimoto JG, Farkas D).Oxford University Press, Oxford.
Sharma P, Varma R, Sarasij RC, Ira K, Gousset G, Krishna-moorthy M, Rao S, Mayor S. 2004. Nanoscale organiza-tion of multiple GPI-anchored proteins in living cellmembranes. Cell 116: 577–589.
Sheetz MP, Kuo SC. 1993. Tracking nanometer movementsof single motor molecules. Meth Cell Biol 39: 129–136.
Sheppard CJR, Wilson T.1979. Effect of spherical-aberrationon the imaging properties of scanning optical micro-scopes. Appl Opt 18: 1058–1063.
Shvartsman DE, Gutman O, Tietz A, Henis. 2006. Cyclodex-trins but not compactin inhibit the lateral diffusion ofmembrane proteins independent of cholesterol. Traffic7: 917–926.
Snapp EL, Altan N, Lippincott-Schwartz J. 2003. Measuringprotein mobility by photobleaching GFP chimeras in liv-ing cells. Curr Protoc Cell Biol 21: 2121.
Sohn HW, Tolar P, Brzostowski J, Pierce SK. 2010. A methodfor analyzing protein–protein interactions in the plasmamembrane of live B cells by fluorescence resonanceenergy transfer imaging as acquired by total internalreflection fluorescence microscopy. Methods Mol Biol591: 159–183.
Soumpasis DM. 1983. Theoretical analysis of fluorescencephotobleaching recovery experiments. Biophysical J 41:95–97.
Spandl J, White DJ, Peychl J, Thiele C. 2009. Live cell multi-color imaging of lipid droplets with a new dye, LD540.Traffic 10: 1579–1584.
Sprague BL, Pego RL, Stavreva DA, McNally JG. 2004. Anal-ysis of binding reactions by fluorescence recovery afterphotobleaching. Biophys J 86: 3473–3495.
Sprague BL, McNally JG. 2005. FRAP analysis of binding:Proper and fitting. Trends in Cell Biol 15: 84–91.
Sum AK, Faller R, de Pablo JJ. 2003. Molecular simulationstudy of phospholipid bilayers and insights of the interac-tions with disaccharides. Biophys J 85: 2830–2844.
Teramura Y, Ichinose J, Takagi H, Nishida K, Yanagida T,Sako Y. 2006. Single-molecule analysis of epidermalgrowth factor binding on the surface of living cells.EMBO J 25: 4215–4222.
Thiele C, Spandl J. 2008. Cell biology of lipid droplets. CurrOpin Cell Biol 20: 378–385.
Tomishige M, Sako Y, Kusumi A. 1998. Regulation mecha-nism of the lateral diffusion of band 3 in erythrocytemembranes by the membrane skeleton. J Cell Biol 142:989–1000.
Toprak E, Balci H, Blehm BH, Selvin PR. 2007. Three-dimensional particle tracking via bifocal imaging. NanoLett 7: 2043–2045.
Tyteca D, D’Auria L, Van Der Smissen P, Medts T, CarpentierS, Monbaliu JC, de Diesbach P, Courtoy PJ. 2010. Threeunrelated sphingomyelin analogs spontaneously clusterinto plasma membrane micrometric domains. BiochimBiophys Acta 1798: 909–927.
Vacha R, Siu SWI, Petrov M, Bockmann RA, Barucha-Kras-zewska J, Jurkiewicz P, Hof M, Berkowitz ML, JungwirthP. 2009. Effects of alkali cations and halide anions onthe DOPC lipid membrane. J Phys Chem A 113:7235–7243.
van den Bogaart G, Hermans N, Krasnikov V, de Vries AH,Poolman B. 2007. On the decrease in lateral mobility ofphospholipids by sugars. Biophys J 92: 1598–1605.
Varma R, Mayor S. 1998. GPI-anchored proteins are organ-ized in submicron domains at the cell surface. Nature 394:798–801.
Fluorescence Techniques to Study Lipid Dynamics
Advanced Online Article. Cite this article as Cold Spring Harb Perspect Biol doi: 10.1101/cshperspect.a009803 31
on June 29, 2018 - Published by Cold Spring Harbor Laboratory Press http://cshperspectives.cshlp.org/Downloaded from
Veatch SL, Keller SL. 2002. Organization in lipid membranescontaining cholesterol. Phys Rev Lett 89: 268101–268104.
Veatch SL, Keller SL. 2003. Separation of liquid phases ingiant vesicles of ternary mixtures of phospholipids andcholesterol. Biophys J 85: 3074–3083.
Wallrabe H, Stanley M, Periasamy A, Barroso M. 2003. One-and two-photon fluorescence resonance energy transfermicroscopy to establish a clustered distribution ofreceptor-ligand complexes in endocytic membranes.J Biomed Opt 8: 339–346.
Wawrezinieck L, Rigneault H, Marguet D, Lenne PF. 2005.Fluorescence correlation spectroscopy diffusion laws toprobe the submicron cell membrane organization. Bio-phys J 89: 4029–4042.
Weidemann T, Wachsmuth M, Tewes M, Rippe K, Langow-ski J. 2002. Analysis of ligand binding by two-colourfluorescence cross-correlation spectroscopy. Single Mol3: 49–61.
Weiss M. 2004. Challenges and artifacts in quantitative pho-tobleaching experiments. Traffic 5: 662–671.
Wenger J, Conchonaud F, Dintinger J, Wawrezinieck L,Ebbesen TW, Rigneault H, Marguet D, Lenne PF. 2007.Diffusion analysis within single nanometric aperturesreveals the ultrafine cell membrane organization. BiophysJ 92: 913–919.
Wolf DE. 1989. Designing, building, and using a fluores-cence recovery after photobleaching instrument. InMethods in cell biology (ed. Taylor DL, Wang Y-L), pp.271–332. Academic Press, New York.
Worch R, Bokel C, Hofinger S, Schwille P, Weidemann T.2010. Focus on composition and interaction potentialof single-pass transmembrane domains. Proteomics 10:4196–4208.
Wouters FS, Bastiaens PIH, Wirtz KWA, Jovin TM. 1998.FRET microscopy demonstrates molecular associationof non-specific lipid transfer protein (nsL-TP) with fattyacid oxidation enzymes in peroxisomes. EMBO J 17:7179–7189.
Yildiz A, Forkey JN, McKinney SA, Ha T, Goldman YE,Selvin PR. 2003. Myosin V walks hand-over-hand: Singlefluorophore imaging with 1.5-nm localization. Science300: 2061–2065.
Yildiz A, Park H, Safer D, Yang ZH, Chen LQ, Selvin PR,Sweeney HL. 2004a. Myosin VI steps via a hand-over-hand mechanism with its lever arm undergoingfluctuations when attached to actin. J Biol Chem 279:37223–37226.
Yildiz A, Tomishige M, Vale RD, Selvin PR. 2004b. Kinesinwalks hand-over-hand. Science 303: 676–678.
Yu CX, Hale J, Ritchie K, Prasad NK, Irudayaraj J. 2009.Receptor overexpression or inhibition alters cell surfacedynamics of EGF-EGFR interaction: New insights fromreal-time single molecule analysis. Biochem Biophys ResCommun 378: 376–382.
Yu SR, Burkhardt M, Nowak M, Ries J, Petrasek Z, ScholppS, Schwille P, Brand M. 2009. Fgf8 morphogen gradientforms by a source-sink mechanism with freely diffusingmolecules. Nature 461: U533–U100.
E. Sezgin and P. Schwille
32 Advanced Online Article. Cite this article as Cold Spring Harb Perspect Biol doi: 10.1101/cshperspect.a009803
on June 29, 2018 - Published by Cold Spring Harbor Laboratory Press http://cshperspectives.cshlp.org/Downloaded from
published online June 13, 2011Cold Spring Harb Perspect Biol Erdinc Sezgin and Petra Schwille Fluorescence Techniques to Study Lipid Dynamics
Subject Collection The Biology of Lipids
Role of Lipids in Virus ReplicationMaier Lorizate and Hans-Georg Kräusslich
Membrane Organization and Lipid RaftsKai Simons and Julio L. Sampaio
Model Answers to Lipid Membrane QuestionsOle G. Mouritsen Spectrometers
Shotgun Lipidomics on High Resolution Mass
Herzog, et al.Dominik Schwudke, Kai Schuhmann, Ronny
Glycosphingolipid FunctionsClifford A. Lingwood
Glycosphingolipid FunctionsClifford A. Lingwood
SynthesisRegulation of Cholesterol and Fatty Acid
Jin Ye and Russell A. DeBose-Boyd
Phosphoinositides in Cell Architecture
MostovAnnette Shewan, Dennis J. Eastburn and Keith
Lipid-Mediated EndocytosisHelge Ewers and Ari Helenius Membrane Lipids
Synthesis and Biosynthetic Trafficking of
Tomas Blom, Pentti Somerharju and Elina Ikonen
DynamicsFluorescence Techniques to Study Lipid
Erdinc Sezgin and Petra Schwille
Lipid Polymorphisms and Membrane Shape
ZimmerbergVadim A. Frolov, Anna V. Shnyrova and Joshua
Lysosomal Lipid Storage DiseasesHeike Schulze and Konrad Sandhoff Interactions
Lipid−Specificity of Intramembrane Protein
Felix Wieland, et al.Francesc-Xabier Contreras, Andreas Max Ernst,
SphingolipidsDistribution and Functions of Sterols and
Howard RiezmanJ. Thomas Hannich, Kyohei Umebayashi and
Dynamic Transbilayer Lipid AsymmetryGerrit van Meer
http://cshperspectives.cshlp.org/cgi/collection/ For additional articles in this collection, see
Copyright © 2011 Cold Spring Harbor Laboratory Press; all rights reserved
on June 29, 2018 - Published by Cold Spring Harbor Laboratory Press http://cshperspectives.cshlp.org/Downloaded from