Embed Size (px)
Citation preview
©2005, 2010, and 2011 Integrated DNA Technologies. All rights reserved. 1
Fluorescence and Fluorescence Applications
Contents
1. Introduction ................................................................................................................................ 1
2. Principles of Fluorescence .......................................................................................................... 1
3. Fluorescence Spectra .................................................................................................................. 3
4. Fluorescence Resonance Energy Transfer (FRET) ....................................................................... 5
5. Dark Quenchers .......................................................................................................................... 7
6. Proximal G-base Quenching ........................................................................................................ 8
7. Intercalating Dyes ..................................................................................................................... 10
8. Dual-labeled Probes .................................................................................................................. 10
8.1 Hydrolysis Probes for the 5’ Nuclease Assay ...................................................................... 10
8.2 Molecular Beacons .............................................................................................................. 11
8.3 Hybridization/FRET probes ................................................................................................. 11
8.4 ScorpionsTM probes ............................................................................................................. 12
9. Summary ................................................................................................................................... 12
10. References .............................................................................................................................. 12
1. Introduction
Since the introduction of the polymerase chain reaction in the early 1980s fluorescence has had a tremendous impact on molecular biology. Fluorescence-labeled oligonucleotides and dideoxynucleotide DNA sequencing terminators have opened a vast range of applications in PCR, DNA sequencing, microarrays, and in situ hybridization and have done so with enhanced sensitivity and increased laboratory safety. In this report we present an overview of fluorescence and discuss a number of issues related to applications of fluorescence and fluorescence-labeled oligonucleotides.
2. Principles of Fluorescence
First, it is important to distinguish fluorescence from luminescence. Luminescence is the production of light through excitation by means other than increasing temperature. These include chemical means (chemiluminescence), electrical discharges (electro-luminescence), or crushing (triboluminescence). Fluorescence is a short-lived type of luminescence created by electromagnetic excitation. That is, fluorescence is generated when a substance absorbs light
©2005, 2010, and 2011 Integrated DNA Technologies. All rights reserved. 2
SO
S1’
S1
hνex hνem
1
2
3
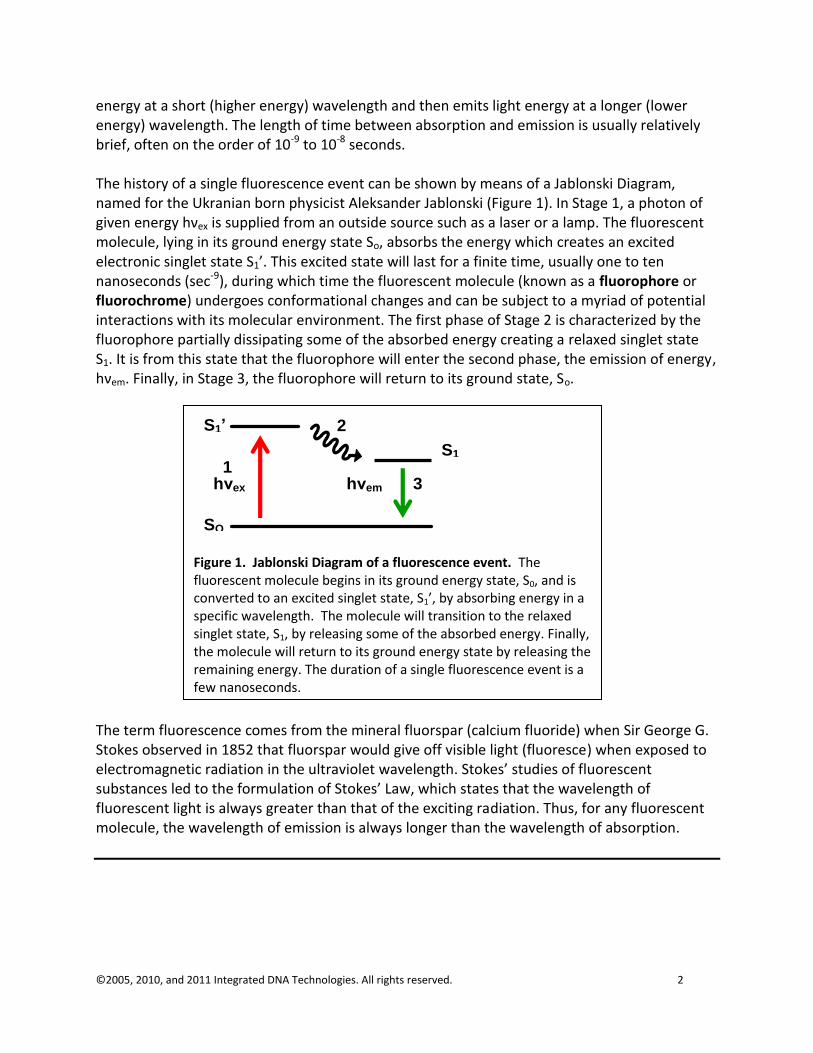
Figure 1. Jablonski Diagram of a fluorescence event. The fluorescent molecule begins in its ground energy state, S0, and is converted to an excited singlet state, S1’, by absorbing energy in a specific wavelength. The molecule will transition to the relaxed singlet state, S1, by releasing some of the absorbed energy. Finally, the molecule will return to its ground energy state by releasing the remaining energy. The duration of a single fluorescence event is a few nanoseconds.
energy at a short (higher energy) wavelength and then emits light energy at a longer (lower energy) wavelength. The length of time between absorption and emission is usually relatively brief, often on the order of 10-9 to 10-8 seconds. The history of a single fluorescence event can be shown by means of a Jablonski Diagram, named for the Ukranian born physicist Aleksander Jablonski (Figure 1). In Stage 1, a photon of given energy hνex is supplied from an outside source such as a laser or a lamp. The fluorescent molecule, lying in its ground energy state So, absorbs the energy which creates an excited electronic singlet state S1’. This excited state will last for a finite time, usually one to ten nanoseconds (sec-9), during which time the fluorescent molecule (known as a fluorophore or fluorochrome) undergoes conformational changes and can be subject to a myriad of potential interactions with its molecular environment. The first phase of Stage 2 is characterized by the fluorophore partially dissipating some of the absorbed energy creating a relaxed singlet state S1. It is from this state that the fluorophore will enter the second phase, the emission of energy, hνem. Finally, in Stage 3, the fluorophore will return to its ground state, So.
The term fluorescence comes from the mineral fluorspar (calcium fluoride) when Sir George G. Stokes observed in 1852 that fluorspar would give off visible light (fluoresce) when exposed to electromagnetic radiation in the ultraviolet wavelength. Stokes’ studies of fluorescent substances led to the formulation of Stokes’ Law, which states that the wavelength of fluorescent light is always greater than that of the exciting radiation. Thus, for any fluorescent molecule, the wavelength of emission is always longer than the wavelength of absorption.
©2005, 2010, and 2011 Integrated DNA Technologies. All rights reserved. 3
Wavelength (nm)
Peak
Emission
Peak
Absorbance
Stokes Shift
Fluorescein
(492/520)
Cy3
(552/570)
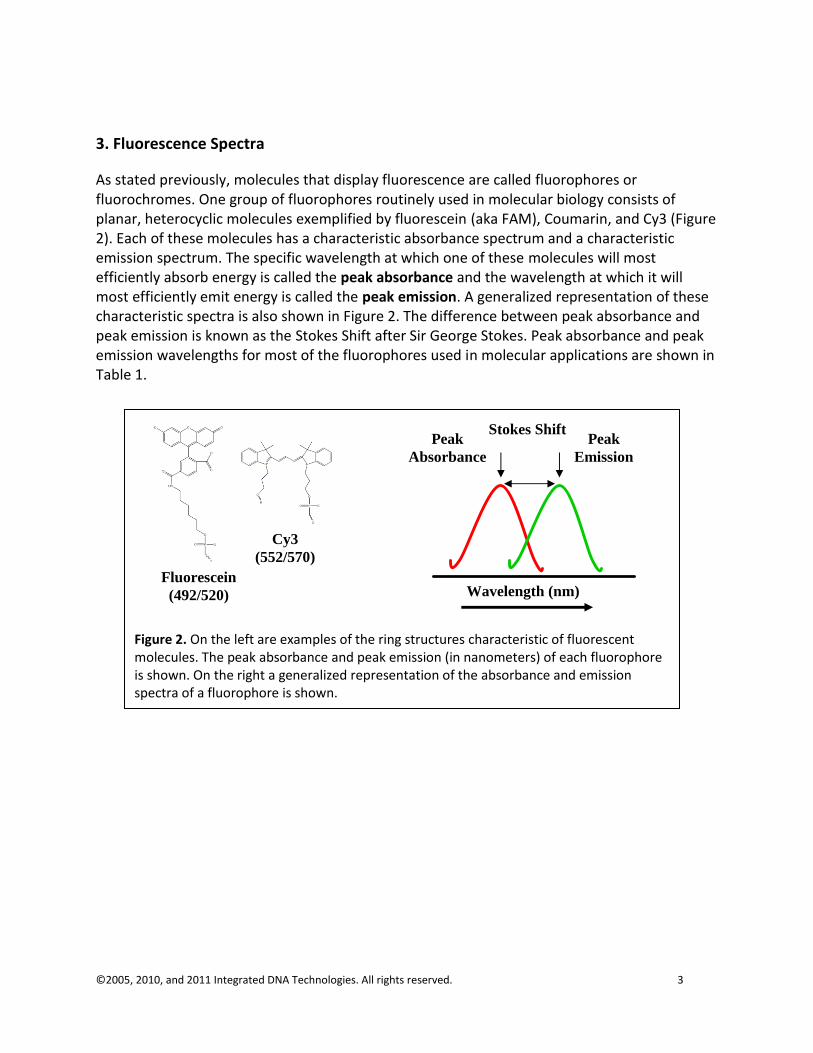
Figure 2. On the left are examples of the ring structures characteristic of fluorescent molecules. The peak absorbance and peak emission (in nanometers) of each fluorophore is shown. On the right a generalized representation of the absorbance and emission spectra of a fluorophore is shown.
3. Fluorescence Spectra
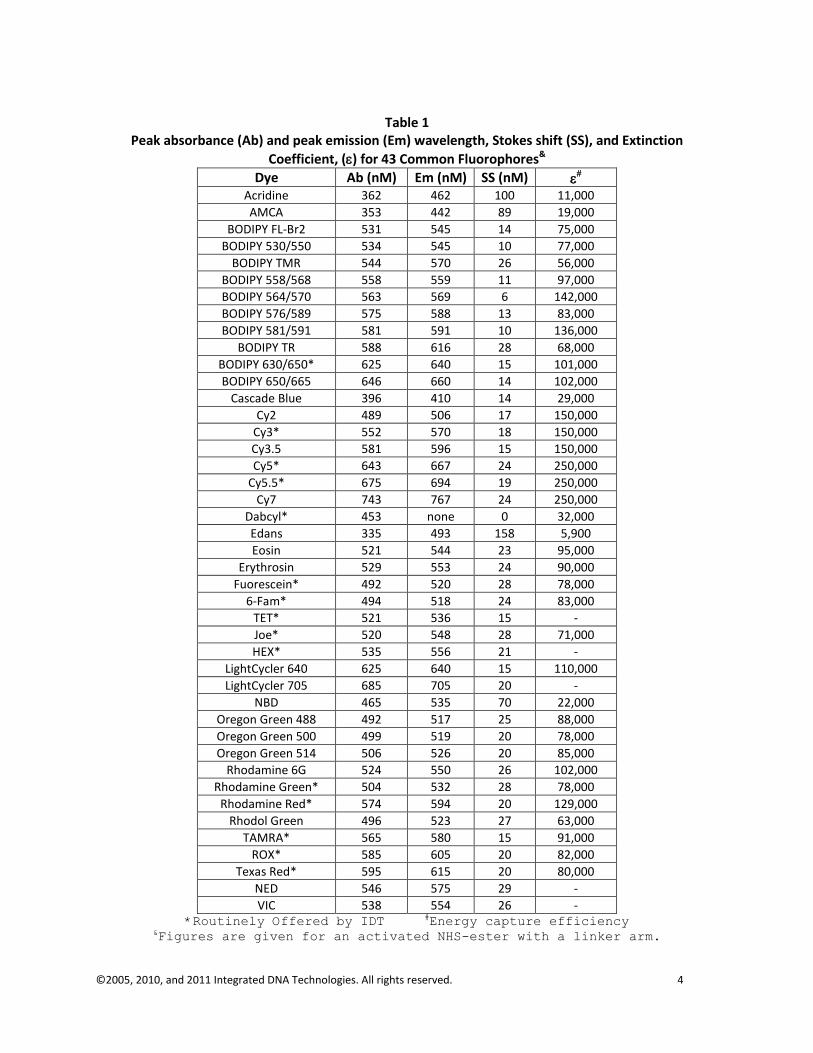
As stated previously, molecules that display fluorescence are called fluorophores or fluorochromes. One group of fluorophores routinely used in molecular biology consists of planar, heterocyclic molecules exemplified by fluorescein (aka FAM), Coumarin, and Cy3 (Figure 2). Each of these molecules has a characteristic absorbance spectrum and a characteristic emission spectrum. The specific wavelength at which one of these molecules will most efficiently absorb energy is called the peak absorbance and the wavelength at which it will most efficiently emit energy is called the peak emission. A generalized representation of these characteristic spectra is also shown in Figure 2. The difference between peak absorbance and peak emission is known as the Stokes Shift after Sir George Stokes. Peak absorbance and peak emission wavelengths for most of the fluorophores used in molecular applications are shown in Table 1.
©2005, 2010, and 2011 Integrated DNA Technologies. All rights reserved. 4
Table 1
Peak absorbance (Ab) and peak emission (Em) wavelength, Stokes shift (SS), and Extinction
Coefficient, () for 43 Common Fluorophores&
Dye Ab (nM) Em (nM) SS (nM)
Acridine 362 462 100 11,000
AMCA 353 442 89 19,000
BODIPY FL-Br2 531 545 14 75,000
BODIPY 530/550 534 545 10 77,000
BODIPY TMR 544 570 26 56,000
BODIPY 558/568 558 559 11 97,000
BODIPY 564/570 563 569 6 142,000
BODIPY 576/589 575 588 13 83,000
BODIPY 581/591 581 591 10 136,000
BODIPY TR 588 616 28 68,000
BODIPY 630/650* 625 640 15 101,000
BODIPY 650/665 646 660 14 102,000
Cascade Blue 396 410 14 29,000
Cy2 489 506 17 150,000
Cy3* 552 570 18 150,000
Cy3.5 581 596 15 150,000
Cy5* 643 667 24 250,000
Cy5.5* 675 694 19 250,000
Cy7 743 767 24 250,000
Dabcyl* 453 none 0 32,000
Edans 335 493 158 5,900
Eosin 521 544 23 95,000
Erythrosin 529 553 24 90,000
Fuorescein* 492 520 28 78,000
6-Fam* 494 518 24 83,000
TET* 521 536 15 -
Joe* 520 548 28 71,000
HEX* 535 556 21 -
LightCycler 640 625 640 15 110,000
LightCycler 705 685 705 20 -
NBD 465 535 70 22,000
Oregon Green 488 492 517 25 88,000
Oregon Green 500 499 519 20 78,000
Oregon Green 514 506 526 20 85,000
Rhodamine 6G 524 550 26 102,000
Rhodamine Green* 504 532 28 78,000
Rhodamine Red* 574 594 20 129,000
Rhodol Green 496 523 27 63,000
TAMRA* 565 580 15 91,000
ROX* 585 605 20 82,000
Texas Red* 595 615 20 80,000
NED 546 575 29 -
VIC 538 554 26 - *Routinely Offered by IDT #Energy capture efficiency
&Figures are given for an activated NHS-ester with a linker arm.
©2005, 2010, and 2011 Integrated DNA Technologies. All rights reserved. 5
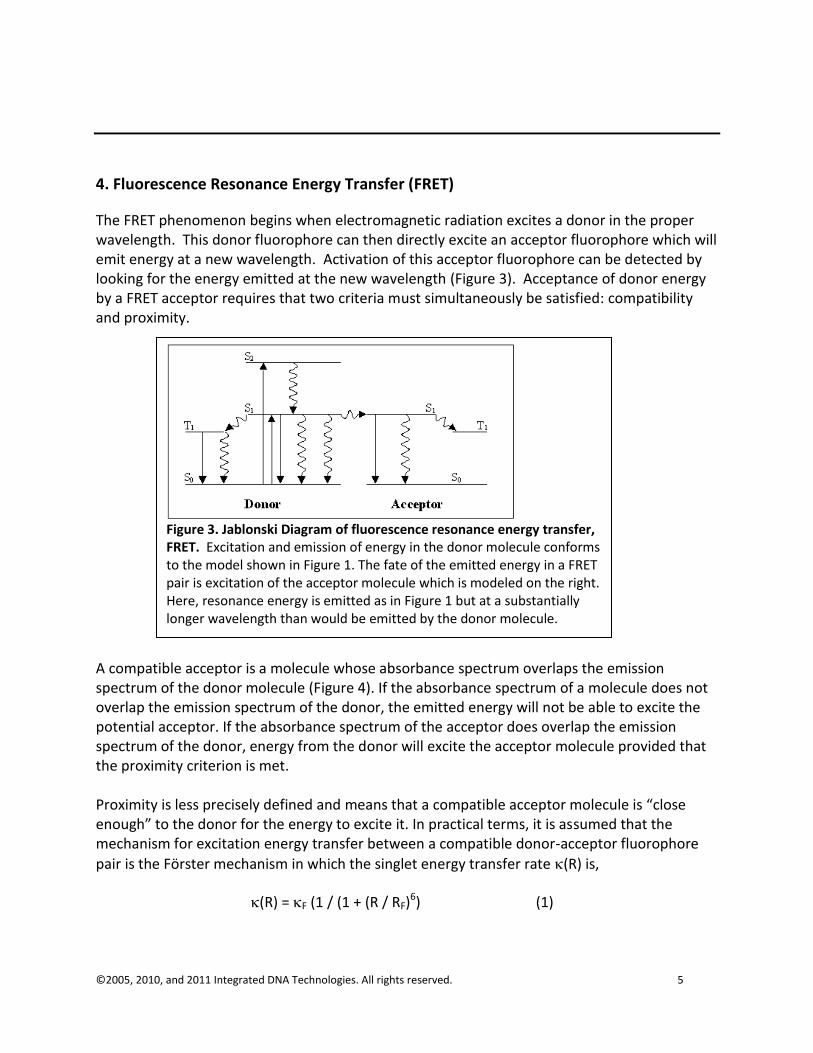
Figure 3. Jablonski Diagram of fluorescence resonance energy transfer, FRET. Excitation and emission of energy in the donor molecule conforms to the model shown in Figure 1. The fate of the emitted energy in a FRET pair is excitation of the acceptor molecule which is modeled on the right. Here, resonance energy is emitted as in Figure 1 but at a substantially longer wavelength than would be emitted by the donor molecule.
4. Fluorescence Resonance Energy Transfer (FRET)
The FRET phenomenon begins when electromagnetic radiation excites a donor in the proper wavelength. This donor fluorophore can then directly excite an acceptor fluorophore which will emit energy at a new wavelength. Activation of this acceptor fluorophore can be detected by looking for the energy emitted at the new wavelength (Figure 3). Acceptance of donor energy by a FRET acceptor requires that two criteria must simultaneously be satisfied: compatibility and proximity.
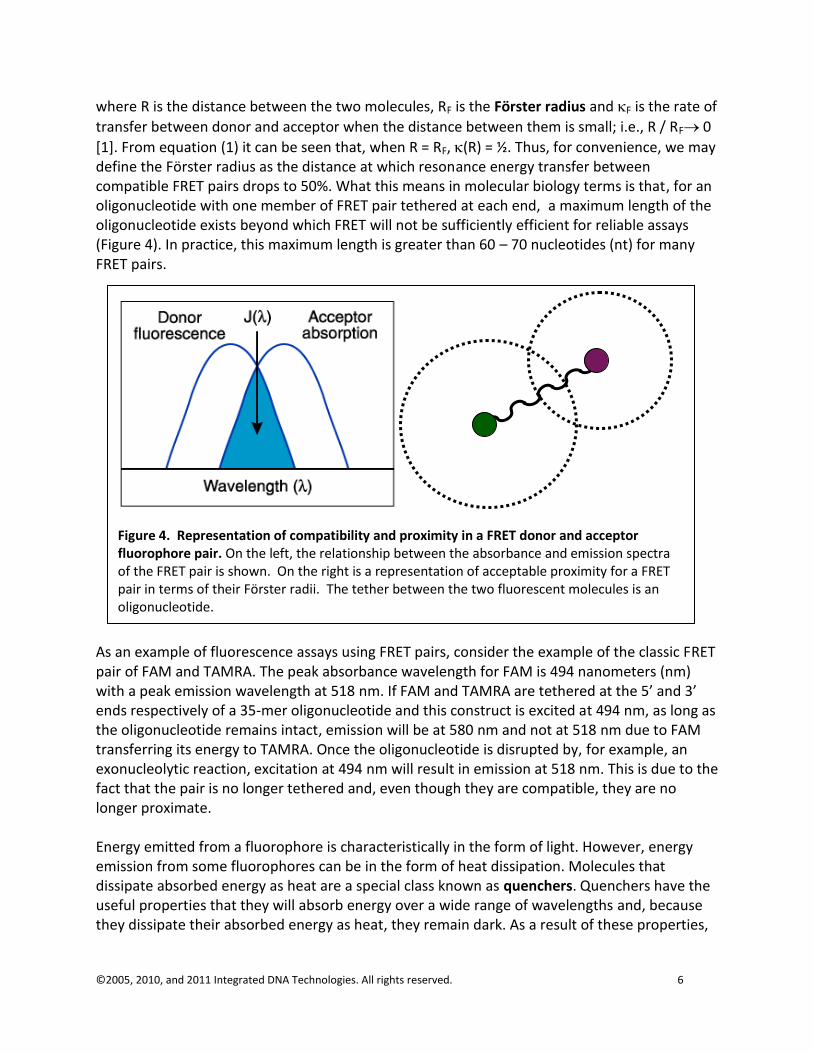
A compatible acceptor is a molecule whose absorbance spectrum overlaps the emission spectrum of the donor molecule (Figure 4). If the absorbance spectrum of a molecule does not overlap the emission spectrum of the donor, the emitted energy will not be able to excite the potential acceptor. If the absorbance spectrum of the acceptor does overlap the emission spectrum of the donor, energy from the donor will excite the acceptor molecule provided that the proximity criterion is met. Proximity is less precisely defined and means that a compatible acceptor molecule is “close enough” to the donor for the energy to excite it. In practical terms, it is assumed that the mechanism for excitation energy transfer between a compatible donor-acceptor fluorophore
pair is the Förster mechanism in which the singlet energy transfer rate (R) is,
(R) = F (1 / (1 + (R / RF)6) (1)
©2005, 2010, and 2011 Integrated DNA Technologies. All rights reserved. 6
where R is the distance between the two molecules, RF is the Förster radius and F is the rate of
transfer between donor and acceptor when the distance between them is small; i.e., R / RF 0
[1]. From equation (1) it can be seen that, when R = RF, (R) = ½. Thus, for convenience, we may define the Förster radius as the distance at which resonance energy transfer between compatible FRET pairs drops to 50%. What this means in molecular biology terms is that, for an oligonucleotide with one member of FRET pair tethered at each end, a maximum length of the oligonucleotide exists beyond which FRET will not be sufficiently efficient for reliable assays (Figure 4). In practice, this maximum length is greater than 60 – 70 nucleotides (nt) for many FRET pairs.
As an example of fluorescence assays using FRET pairs, consider the example of the classic FRET pair of FAM and TAMRA. The peak absorbance wavelength for FAM is 494 nanometers (nm) with a peak emission wavelength at 518 nm. If FAM and TAMRA are tethered at the 5’ and 3’ ends respectively of a 35-mer oligonucleotide and this construct is excited at 494 nm, as long as the oligonucleotide remains intact, emission will be at 580 nm and not at 518 nm due to FAM transferring its energy to TAMRA. Once the oligonucleotide is disrupted by, for example, an exonucleolytic reaction, excitation at 494 nm will result in emission at 518 nm. This is due to the fact that the pair is no longer tethered and, even though they are compatible, they are no longer proximate. Energy emitted from a fluorophore is characteristically in the form of light. However, energy emission from some fluorophores can be in the form of heat dissipation. Molecules that dissipate absorbed energy as heat are a special class known as quenchers. Quenchers have the useful properties that they will absorb energy over a wide range of wavelengths and, because they dissipate their absorbed energy as heat, they remain dark. As a result of these properties,
Figure 4. Representation of compatibility and proximity in a FRET donor and acceptor fluorophore pair. On the left, the relationship between the absorbance and emission spectra of the FRET pair is shown. On the right is a representation of acceptable proximity for a FRET pair in terms of their Förster radii. The tether between the two fluorescent molecules is an oligonucleotide.
©2005, 2010, and 2011 Integrated DNA Technologies. All rights reserved. 7
quenchers have become very useful as energy acceptors in fluorescent resonance energy transfer (FRET) pairs.
5. Dark Quenchers
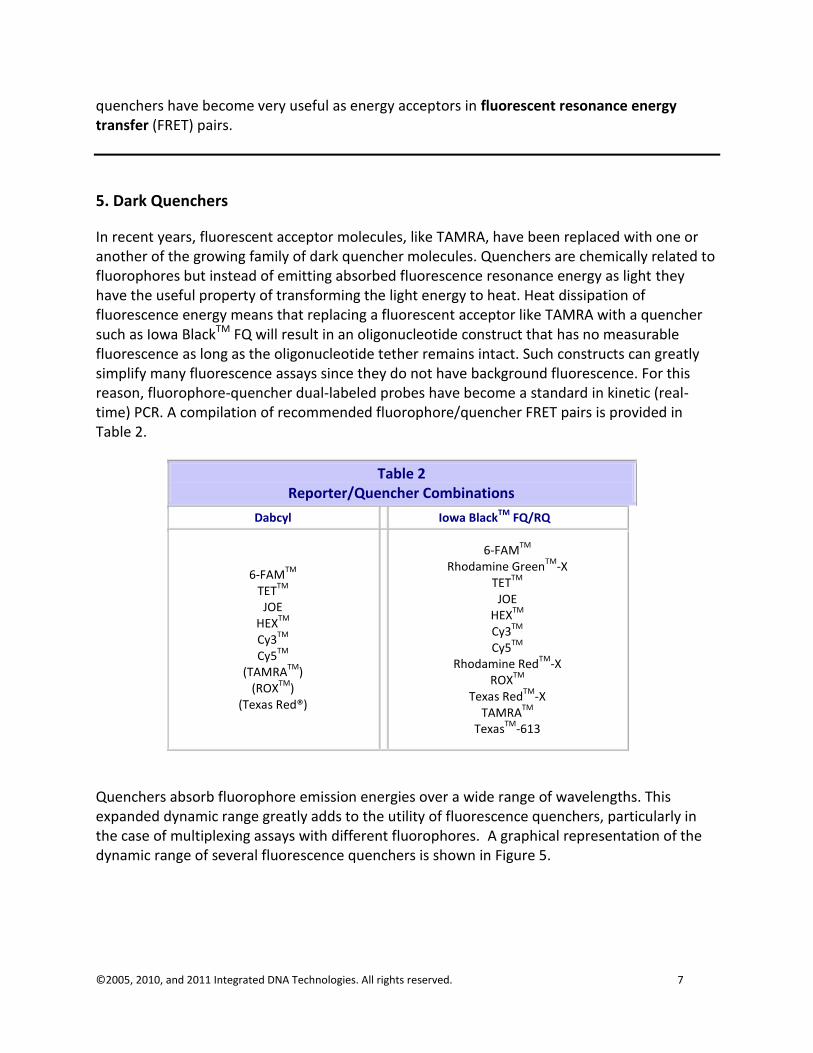
In recent years, fluorescent acceptor molecules, like TAMRA, have been replaced with one or another of the growing family of dark quencher molecules. Quenchers are chemically related to fluorophores but instead of emitting absorbed fluorescence resonance energy as light they have the useful property of transforming the light energy to heat. Heat dissipation of fluorescence energy means that replacing a fluorescent acceptor like TAMRA with a quencher such as Iowa BlackTM FQ will result in an oligonucleotide construct that has no measurable fluorescence as long as the oligonucleotide tether remains intact. Such constructs can greatly simplify many fluorescence assays since they do not have background fluorescence. For this reason, fluorophore-quencher dual-labeled probes have become a standard in kinetic (real-time) PCR. A compilation of recommended fluorophore/quencher FRET pairs is provided in Table 2.
Table 2 Reporter/Quencher Combinations
Dabcyl Iowa BlackTM
FQ/RQ
6-FAMTM
TET
TM
JOE HEX
TM
Cy3TM
Cy5
TM
(TAMRATM
) (ROX
TM)
(Texas Red®)
6-FAMTM
Rhodamine Green
TM-X
TETTM
JOE
HEXTM
Cy3
TM
Cy5TM
Rhodamine Red
TM-X
ROXTM
Texas Red
TM-X
TAMRATM
Texas
TM-613
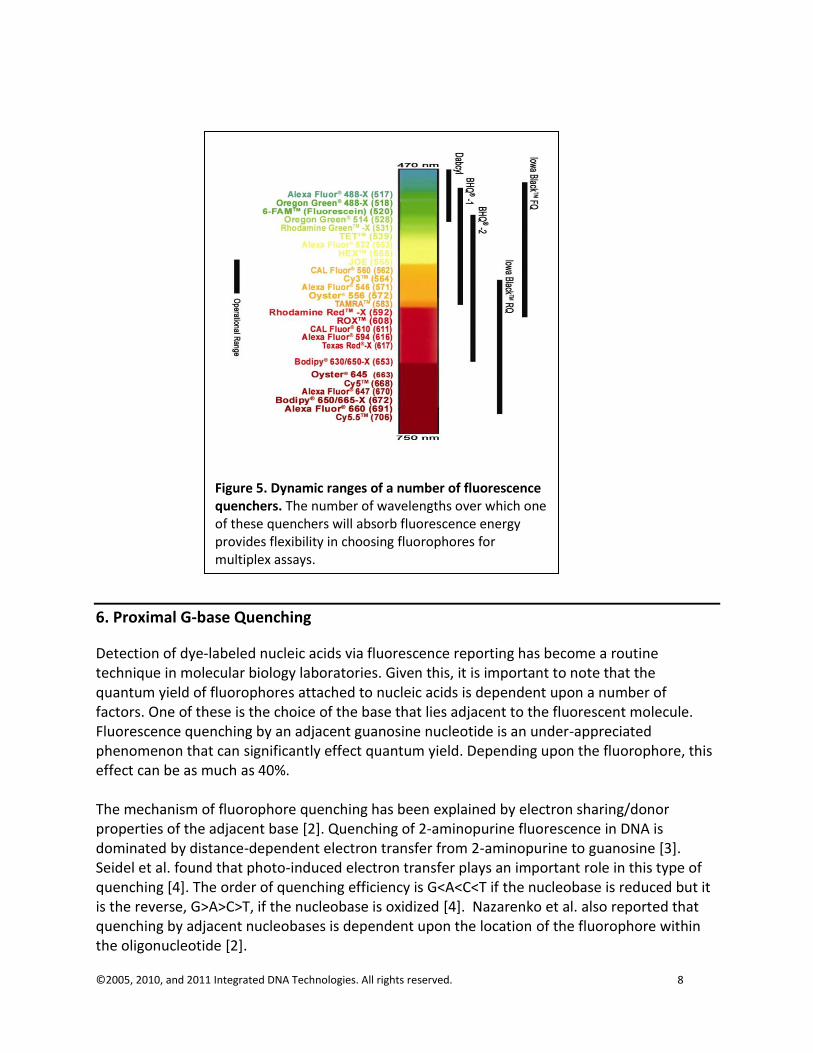
Quenchers absorb fluorophore emission energies over a wide range of wavelengths. This expanded dynamic range greatly adds to the utility of fluorescence quenchers, particularly in the case of multiplexing assays with different fluorophores. A graphical representation of the dynamic range of several fluorescence quenchers is shown in Figure 5.
©2005, 2010, and 2011 Integrated DNA Technologies. All rights reserved. 8
Figure 5. Dynamic ranges of a number of fluorescence quenchers. The number of wavelengths over which one of these quenchers will absorb fluorescence energy provides flexibility in choosing fluorophores for multiplex assays.
6. Proximal G-base Quenching
Detection of dye-labeled nucleic acids via fluorescence reporting has become a routine technique in molecular biology laboratories. Given this, it is important to note that the quantum yield of fluorophores attached to nucleic acids is dependent upon a number of factors. One of these is the choice of the base that lies adjacent to the fluorescent molecule. Fluorescence quenching by an adjacent guanosine nucleotide is an under-appreciated phenomenon that can significantly effect quantum yield. Depending upon the fluorophore, this effect can be as much as 40%. The mechanism of fluorophore quenching has been explained by electron sharing/donor properties of the adjacent base [2]. Quenching of 2-aminopurine fluorescence in DNA is dominated by distance-dependent electron transfer from 2-aminopurine to guanosine [3]. Seidel et al. found that photo-induced electron transfer plays an important role in this type of quenching [4]. The order of quenching efficiency is G<A<C<T if the nucleobase is reduced but it is the reverse, G>A>C>T, if the nucleobase is oxidized [4]. Nazarenko et al. also reported that quenching by adjacent nucleobases is dependent upon the location of the fluorophore within the oligonucleotide [2].
©2005, 2010, and 2011 Integrated DNA Technologies. All rights reserved. 9
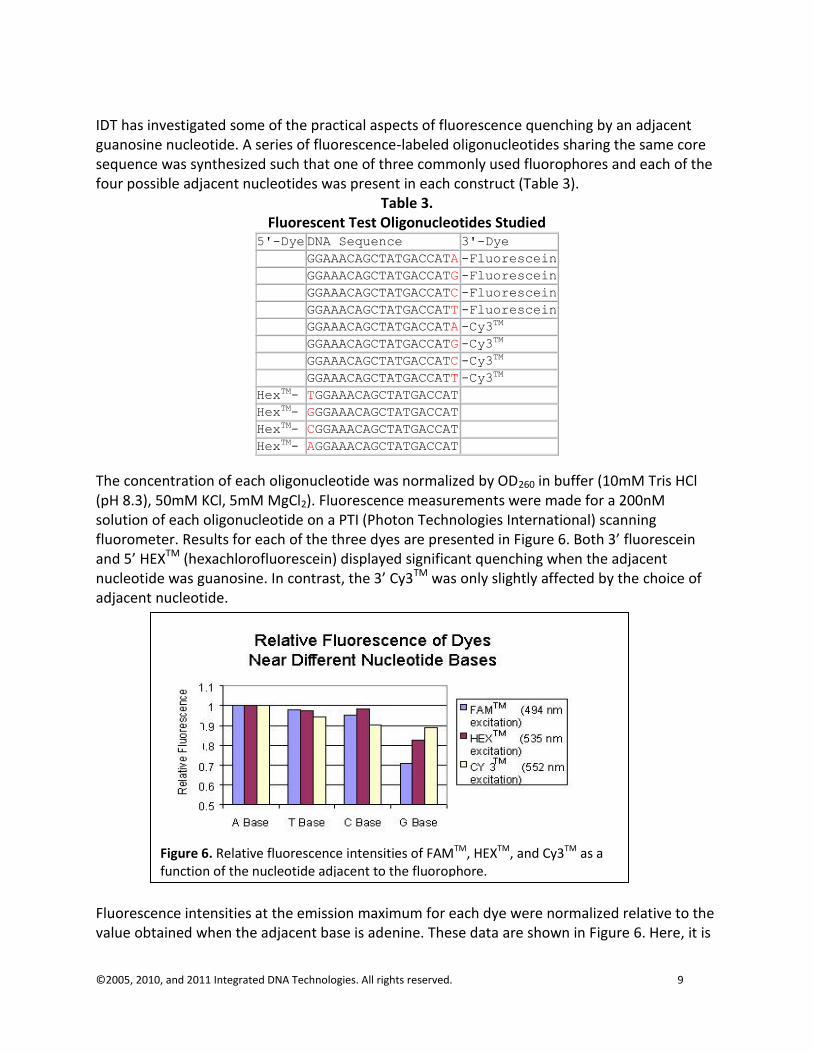
Figure 6. Relative fluorescence intensities of FAMTM, HEXTM, and Cy3TM as a function of the nucleotide adjacent to the fluorophore.
IDT has investigated some of the practical aspects of fluorescence quenching by an adjacent guanosine nucleotide. A series of fluorescence-labeled oligonucleotides sharing the same core sequence was synthesized such that one of three commonly used fluorophores and each of the four possible adjacent nucleotides was present in each construct (Table 3).
Table 3. Fluorescent Test Oligonucleotides Studied
5'-Dye DNA Sequence 3'-Dye
GGAAACAGCTATGACCATA -Fluorescein
GGAAACAGCTATGACCATG -Fluorescein
GGAAACAGCTATGACCATC -Fluorescein
GGAAACAGCTATGACCATT -Fluorescein
GGAAACAGCTATGACCATA -Cy3TM
GGAAACAGCTATGACCATG -Cy3TM
GGAAACAGCTATGACCATC -Cy3TM
GGAAACAGCTATGACCATT -Cy3TM
HexTM- TGGAAACAGCTATGACCAT
HexTM- GGGAAACAGCTATGACCAT
HexTM- CGGAAACAGCTATGACCAT
HexTM- AGGAAACAGCTATGACCAT
The concentration of each oligonucleotide was normalized by OD260 in buffer (10mM Tris HCl (pH 8.3), 50mM KCl, 5mM MgCl2). Fluorescence measurements were made for a 200nM solution of each oligonucleotide on a PTI (Photon Technologies International) scanning fluorometer. Results for each of the three dyes are presented in Figure 6. Both 3’ fluorescein and 5’ HEXTM (hexachlorofluorescein) displayed significant quenching when the adjacent nucleotide was guanosine. In contrast, the 3’ Cy3TM was only slightly affected by the choice of adjacent nucleotide.
Fluorescence intensities at the emission maximum for each dye were normalized relative to the value obtained when the adjacent base is adenine. These data are shown in Figure 6. Here, it is
©2005, 2010, and 2011 Integrated DNA Technologies. All rights reserved. 10
clear that an adjacent guanosine has the greatest affect on all three fluorophores even though it is minimal for Cy3. These results suggest that adjacent guanosine nucleotides should be avoided when designing oligonucleotides that contain a fluorescent reporter molecule.
7. Intercalating Dyes
Intercalating dyes are non-sequence-specific fluorescent dyes that exhibit a large increase in fluorescence emission when they bind into double-stranded DNA. Examples include SYBR© Green I, the Cyto family of dyes, EvaGreen©, and LC dyes [5, 6]. During the PCR reaction, the primers will amplify the target sequence and multiple molecules of the dye will bind to the double-stranded product and will fluoresce. Intercalating fluorescent dyes are not specific to a particular sequence; thus, they are both inexpensive and versatile because they do not require a dye-labeled probe. However, as they can bind to any double-stranded sequence, they will also bind to primer-dimer artifacts or incorrect amplification products [7]. In addition, these types of dyes cannot be used for multiplexed analyses as the different products would be indistinguishable. Finally, because multiple molecules bind, the amount of fluorescent signal detectable is dependent on the mass of the amplified product. Thus, assuming both amplify with the same efficiency, a longer product will generate more signal than a shorter product [8]. In contrast, probes are both specific to a particular sequence and will only emit energy from a single fluorophore no matter the length of the amplified product. This will create a 1:1 ratio between a cleaved probe and an amplicon and allows for more accurate quantification of the number of copies amplified.
8. Dual-labeled Probes
8.1 Hydrolysis Probes for the 5’ Nuclease Assay The 5’ hydrolysis chemistry utilizes two primers, a probe, and the exonuclease activity of Taq DNA polymerase [9]. The DNA probe is non-extendable and labeled with both a fluorescent reporter and a quencher which are maintained in close proximity to each other as long as the probe is intact. Fluorescence-resonance energy transfer (FRET) from the reporter to the quencher keeps the reporter molecule from fluorescing. Once the primers and probe hybridize to the target and the primers begin extension, the exonuclease activity of the polymerase during extension will cause hydrolysis of the probe and the connection between the reporter and quencher will be broken; this allows the reporter to fluoresce [8]. The fluorescence produced during each cycle is measured during the extension phase of the PCR reaction. Because all three components, the two primers and one probe, must all hybridize to the target, this approach leads to greater accuracy and specificity in the PCR product amplified. In addition, different probes can have different fluorophores which will allow multiple transcripts to be simultaneously detected in a single reaction [10, 11].
©2005, 2010, and 2011 Integrated DNA Technologies. All rights reserved. 11
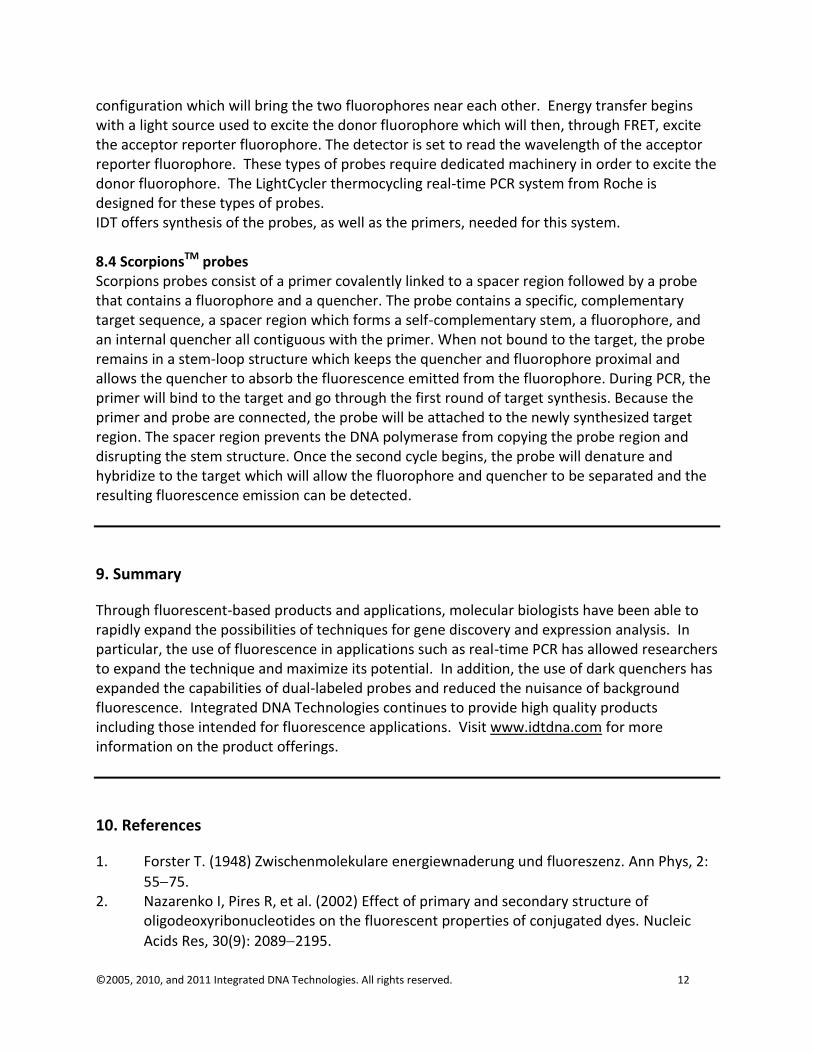
Figure 7. The classic model of a molecular beacon as first presented by Kramer and colleagues.
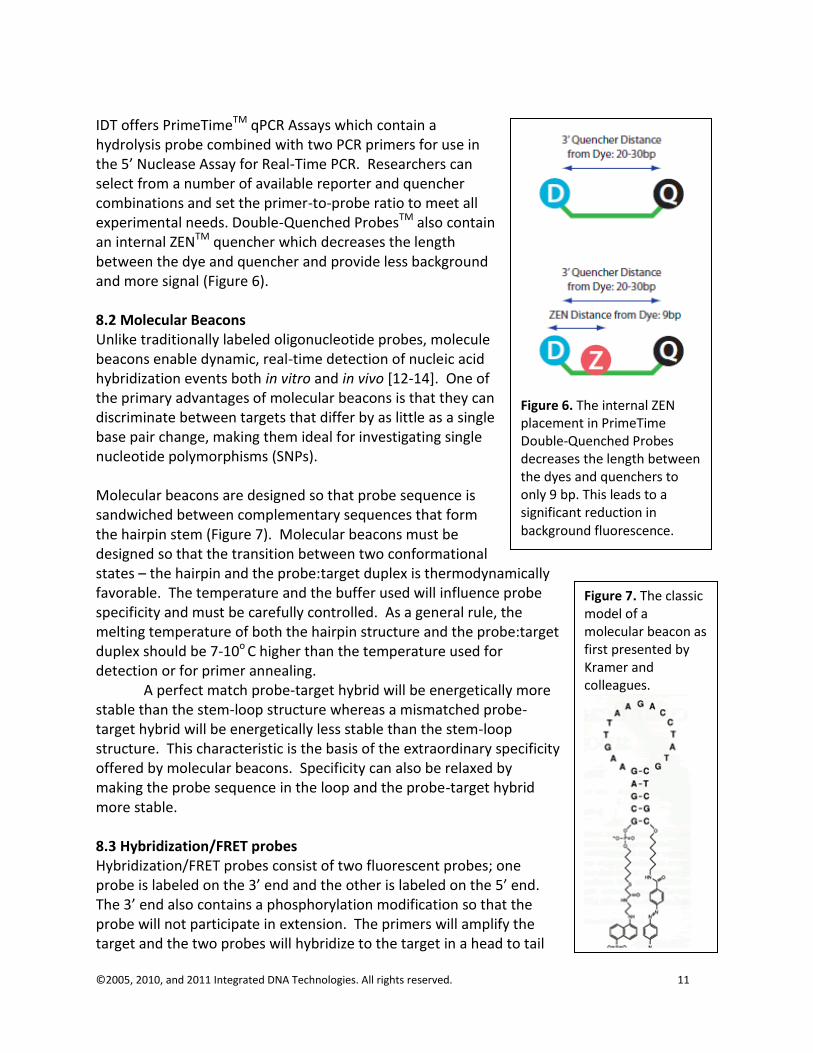
Figure 6. The internal ZEN placement in PrimeTime Double-Quenched Probes decreases the length between the dyes and quenchers to only 9 bp. This leads to a significant reduction in background fluorescence.
IDT offers PrimeTimeTM qPCR Assays which contain a hydrolysis probe combined with two PCR primers for use in the 5’ Nuclease Assay for Real-Time PCR. Researchers can select from a number of available reporter and quencher combinations and set the primer-to-probe ratio to meet all experimental needs. Double-Quenched ProbesTM also contain an internal ZENTM quencher which decreases the length between the dye and quencher and provide less background and more signal (Figure 6). 8.2 Molecular Beacons Unlike traditionally labeled oligonucleotide probes, molecule beacons enable dynamic, real-time detection of nucleic acid hybridization events both in vitro and in vivo [12-14]. One of the primary advantages of molecular beacons is that they can discriminate between targets that differ by as little as a single base pair change, making them ideal for investigating single nucleotide polymorphisms (SNPs). Molecular beacons are designed so that probe sequence is sandwiched between complementary sequences that form the hairpin stem (Figure 7). Molecular beacons must be designed so that the transition between two conformational states – the hairpin and the probe:target duplex is thermodynamically favorable. The temperature and the buffer used will influence probe specificity and must be carefully controlled. As a general rule, the melting temperature of both the hairpin structure and the probe:target duplex should be 7-10o C higher than the temperature used for detection or for primer annealing. A perfect match probe-target hybrid will be energetically more stable than the stem-loop structure whereas a mismatched probe-target hybrid will be energetically less stable than the stem-loop structure. This characteristic is the basis of the extraordinary specificity offered by molecular beacons. Specificity can also be relaxed by making the probe sequence in the loop and the probe-target hybrid more stable. 8.3 Hybridization/FRET probes Hybridization/FRET probes consist of two fluorescent probes; one probe is labeled on the 3’ end and the other is labeled on the 5’ end. The 3’ end also contains a phosphorylation modification so that the probe will not participate in extension. The primers will amplify the target and the two probes will hybridize to the target in a head to tail
©2005, 2010, and 2011 Integrated DNA Technologies. All rights reserved. 12
configuration which will bring the two fluorophores near each other. Energy transfer begins with a light source used to excite the donor fluorophore which will then, through FRET, excite the acceptor reporter fluorophore. The detector is set to read the wavelength of the acceptor reporter fluorophore. These types of probes require dedicated machinery in order to excite the donor fluorophore. The LightCycler thermocycling real-time PCR system from Roche is designed for these types of probes. IDT offers synthesis of the probes, as well as the primers, needed for this system. 8.4 ScorpionsTM probes Scorpions probes consist of a primer covalently linked to a spacer region followed by a probe that contains a fluorophore and a quencher. The probe contains a specific, complementary target sequence, a spacer region which forms a self-complementary stem, a fluorophore, and an internal quencher all contiguous with the primer. When not bound to the target, the probe remains in a stem-loop structure which keeps the quencher and fluorophore proximal and allows the quencher to absorb the fluorescence emitted from the fluorophore. During PCR, the primer will bind to the target and go through the first round of target synthesis. Because the primer and probe are connected, the probe will be attached to the newly synthesized target region. The spacer region prevents the DNA polymerase from copying the probe region and disrupting the stem structure. Once the second cycle begins, the probe will denature and hybridize to the target which will allow the fluorophore and quencher to be separated and the resulting fluorescence emission can be detected.
9. Summary
Through fluorescent-based products and applications, molecular biologists have been able to rapidly expand the possibilities of techniques for gene discovery and expression analysis. In particular, the use of fluorescence in applications such as real-time PCR has allowed researchers to expand the technique and maximize its potential. In addition, the use of dark quenchers has expanded the capabilities of dual-labeled probes and reduced the nuisance of background fluorescence. Integrated DNA Technologies continues to provide high quality products including those intended for fluorescence applications. Visit www.idtdna.com for more information on the product offerings.
10. References
1. Forster T. (1948) Zwischenmolekulare energiewnaderung und fluoreszenz. Ann Phys, 2:
5575. 2. Nazarenko I, Pires R, et al. (2002) Effect of primary and secondary structure of
oligodeoxyribonucleotides on the fluorescent properties of conjugated dyes. Nucleic
Acids Res, 30(9): 20892195.
©2005, 2010, and 2011 Integrated DNA Technologies. All rights reserved. 13
3. Kelley SO and Barton JK. (1999) Electron transfer between bases in double helical DNA.
Science, 283(5400): 375381. 4. Seidel CAM, Schulz A, and Sauer MHM. (1996) Nucleobase-Specific Quenching of
Fluorescent Dyes. 1. Nucleobase One-Electron Redox Potentials and Their Correlation
with Statis and Dynamic Quenching Efficiencies. J. Phys. Chem., 100: 55415553. 5. Gudnason H, Dufva M, et al. (2007) Comparison of multiple DNA dyes for real-time PCR:
effects of dye concentration and sequence composition on DNA amplification and melting temperature. Nucleic Acids Res, 35(19): e127.
6. Sang F and Ren J. (2006) Capillary electrophoresis of double-stranded DNA fragments
using a new fluorescence intercalating dye EvaGreen. J Sep Sci, 29(9): 12751280. 7. Zipper H, Brunner H, et al. (2004) Investigations on DNA intercalation and surface
binding by SYBR Green I, its structure determination and methodological implications. Nucleic Acids Res, 32(12): e103.
8. VanGuilder HD, Vrana KE, and Freeman WM. (2008) Twenty-five years of quantitative
PCR for gene expression analysis. Biotechniques, 44(5): 619626. 9. Heid CA, Stevens J, et al. (1996) Real time quantitative PCR. Genome Res, 6(10):
986994. 10. Hindiyeh M, Levy V, et al. (2005) Evaluation of a multiplex real-time reverse
transcriptase PCR assay for detection and differentiation of influenza viruses A and B
during the 2001-2002 influenza season in Israel. J Clin Microbiol, 43(2): 589595. 11. Thiel CT, Kraus C, et al. (2003) A new quantitative PCR multiplex assay for rapid analysis
of chromosome 17p11.2-12 duplications and deletions leading to HMSN/HNPP. Eur J
Hum Genet, 11(2): 170178. 12. Tyagi S and Kramer FR. (1996) Molecular beacons: probes that fluoresce upon
hybridization. Nat Biotechnol, 14(3): 303308. 13. Kostrikis LG, Tyagi S, et al. Spectral genotyping of human alleles. Science, 279:
12281229. 14. Tyagi S, Bratu DP, and Kramer FR. (1998) Multicolor molecular beacons for allele
discrimination. Nat Biotechnol, 16(1): 49-53.