Embed Size (px)
Citation preview

"AN L-85-35y:
- 9/c54
FLUID FORCES ON TWO CIRCULAR CYLINDERS
IN CROSSFLOW
by
J. A. Jendrzejczyk and S. S. Chen
BASE TECHNOLOGY
,ONAt
o 0
ARGONNE NATIONAL LABORATORY, ARGONNE, ILLINOIS
Operated by THE UNIVERSITY OF CHICAGO
for the U. S. DEPARTMENT OF ENERGY
under Contract W-31-109-Eng-38
AN L-85-35
aseae s U1WOP HS CUMEIS sUNLt

Argonne National Laboratory, with facilities in the states of Illinois and Idaho, is
owned by the United States government, and operated by The University of Chicagounder the provisions of a contract with the Department of Energy.
DISCLAIMER
This report was prepared as an account of work sponsored by anagency of the United States Government. Neither the UnitedStates Government nor any agency thereof, nor any of theiremployees, makes any warranty, expressed or implied, orassumes any legal liability or responsibility for the accuracy,completeness, or usefulness of any information, apparatus,product, or process disclosed, or represents that its use wouldnot infringe privately owned rights. Reference herein to anyspecific commercial product, process, or service by trade name,trademark, manufacturer, or otherwise, does not necessarilycuistitute or imply its endorsement, recommendation, or favor-ing by the United States Government or any agency thereof. Theviews and opinions of authors expressed herein do not neces-sarily state or reflect those of the United States Government orany agency thereof.
Printed in the United States of AmericaAvailable from
National Technical Information ServiceU. S. Department of Commerce5285 Port Royal RoadSpringfield, VA 22161
NTIS price codesPrinted copy: A04Microfiche copy: A01

Distribution Category:LMFBR--Components: Base
Technology (UC-79k)
ANL-85-35ANL--85-
3 5
DE85 014294
ARGONNE NATIONAL LABORATORY9700 South Cass Avenue
Argonne, Illinois 60439
FLUID FORCES ON TWO CIRCULAR CYLINDERSIN CROSSFLOW
by
J. A. Jendrzejczyk and S. S. Chen
Components Technology Division
June 1985
MASTER
USTInItITWN r TS ocueir IS VIL1

3
CONTENTS
Pae
2IG RE EXPERIMENTAL ... ... ... ... SETUP.... . .... ....*. *.. e*. ea .a***. a.*.a.*.*.*.*. * * *.a.*.*. * * * . 13FIGUTEST..................T.......................................... 18
4. EXERIMEN. RESULT. * e........ .................. ..... ..... .*. . .. 21
2. EXPERIMENTAL SETUP.......... ..................................... 13
3. TEST PROCEDURES AND DATA ANALYSIS ................................ 18
4. EXPERIMENTAL RESULTS ............................................. 21
4.1 An Isolated Cylinder ........................................ 21
4.2 Two Tubes Normal to Flow.................................... 21
4.3 Two Tubes in Tandem......................................... 25
5. CONCLUDING REMARKS............................................... 54
ACKNOWLEDGMEN"&S ...................................................... 57
REFERENCES ........................................................... 58

4
FIGURES
Page
1 Two Circular Cylinders in Crossflow.......................... 10
2 Test Section................................................. 14
3 CylindersInstalled in the Test Section...................... 16
4 Tube Arrangements. ........................................... 19
5 Data Acquisition and Analysis................................ 20
6 Strouhal Number, and RMS Lift and Drag Coefficients.......... 22
7 Fluctuating Lift and Drag Forces on One of the Cylindersfor Two Cylinders Normal to Flow with T/D = 2.7.............. 23
8 Frequency Spectra of the Lift and Drag Forces for Two
Cylinders Normal to Flow for T/D = 2.7 with Grid C.......... 24
9 Strouhal Numbers for Two Cylinders Normal to Flow........... 26
10 Fluctuating Drag and Lift Coefficients for T/D = 1.35 andGrid B ....................................................... 27
11 Fluctuating Drag and Lift Coefficients for T/D = 1.35 andGrid C......................................... 28
12 Fluctuating Drag and Lift Coefficients for T/D = 2.7 andGrid B ....................................................... 29
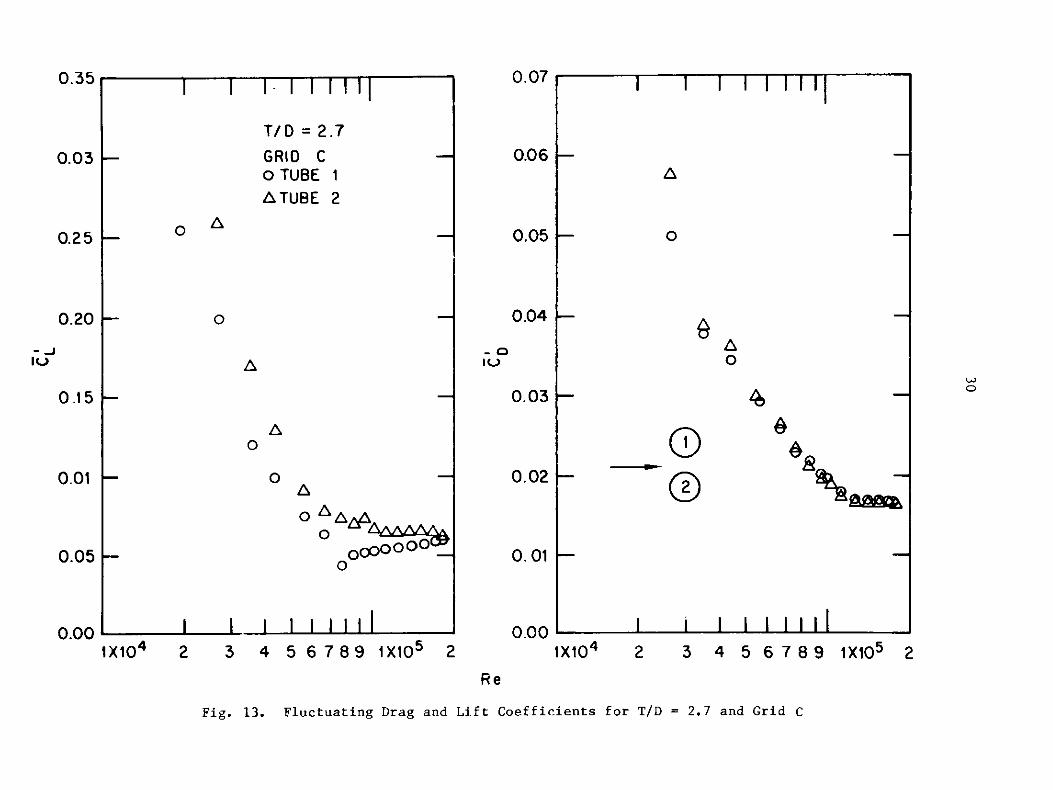
13 Fluctuating Drag and Lift Coefficients for T/D = 2.7 andGrid C....................................................... 30
14 Lift Forces on Two Cylinders in Tandem for P/D = 1.35 andGrid A............... .................. ...................... 31
15 Lift and Drag Forces on Two Cylinders in Tandem for P/D =
2.7 and Grid A ............................................... 32
16 Frequency Spectra of the Lift Forces for Two Cylinders inTandem for P/D = 1.35 and Grid A............................. 33
17 Frequency Spectra of the Lift and Drag Forces Acting on theDownstream Cylinder for Two Cylinders in Tandem forP/ D = 2 .7 a nd G rid A .... . .. ... .. .. . ... .. .. .. .. . .. .. ... .. . .. .. 3 4
18 Strouhal Number for Two Cylinders in Tandem.................. 37
19 Strouhal Number for the Upstream Cylinder for Two Cylindersin Tandem .................................................... 39

5
20 Comparison of Strouhal Number for Two Cylinders in Tandem.... 40
21 StrouhalNumber for a Single Cylinder...... ..................41
22 Fluctuating Lift Coefficient for Two Cylinders in Tandem(Upstream Tube, Grid A)...................................... 42
23 Fluctuating Lift Coefficient for Two Cylinders in Tandem(Downstream Tube, Grid A)............... ..................... 43
24 Fluctuating Drag Coefficient for Two Cylinders in Tandem(Upstream Tube, Grid A)..................................... . 44
25 Fluctuating Drag Coefficient for Two Cylinders in Tandem(Downstream Tube, Grid A). . . . . . . . . . . . . . . . . . . . . . . . . . . . . . . . . . . . 45
26 Fluctuating Lift Coefficient for Two Cylinders in Tandem(Upstream Tube, Grid B)...................................... 46
27 Fluctuating Lift Coefficient for Two Cylinders in Tandem(Downstream Tube, Grid B). .................................. 47
28 Fluctuating Drag Coefficient for Two Cylinders in Tandem(Upstream Tube, Grid B)...................................... 48
29 Fluctuating Drag Coefficient for Two Cylinders in Tandem(Downstream Tube, Grid B).................................... 49
30 Fluctuating Lift Coefficient for Two Cylinders in Tandem(Upstream Tube, Grid C)...................................... 50
31 Fluctuating Lift Coefficient for Two Cylinders in Tandem(Downstream Tube, Grid C).................................... 51
32 Fluctuating Drag Coefficient for Two Cylinders in Tandem(Upstream Tube, Grid C)...................................... 52
33 Fluctuating Drag Coefficient for Two Cylinders in Tandem(Downstream Tube, Grid C).................................... 53
34 Fluctuating5Drag and Lift Coefficients as a Function of P/Dfor Re = 10 ................................................. 55
35 Fluctuating Lift Coefficients for Different TurbulenceIntensities for Two Cylinders in Tandem...................... 56

6
TABLES
Page
1 Summary of Published Experimental Data for Two Cylinders inCrossflow........... ......................................... 12
2 Grid and Turbulence Characteristics.......................... 15
3 Tube Locatiois*............................................... 17
4 Frequency Spectra Characteristics for Two Cylinders inTandmd .......................................................... 00 36 0 0 0 00 .. 0 3

7
NOMENCLATU RE

8
CDj (CLj)
CAj (CL)
C' (C'.)Dj Lj
D
f
g.
g'
h.J
hJ
P
St
T
TI
u.
U
Ug
v.
.k' Rk' 3k' TkJk jk j' jk
jk jk jk' jk
Jk' jk' jk' jk
p
GDj M)
Subscripts
D (L)
j,k
NOMENCLATURE
Steady drag (lift) coefficient) for jth cylinder
Periodic fluctuating drag (lift) coefficient for jthcylinder
RMS fluctuating drag (lift) coefficient for jth cylinder
Diameter of a cylinder
Oscillation frequency
Fluid-force component in the x direction of jth cylinder
Fluctuating fluid-force component in the x direction ofjth cylinder due to turbulence buffeting
Fluid-force component in the y direction of jth cylinder
Fluctuating fluid-force component in the y direction ofjth cylinder due to turbulence guffeting
Longitudinal pitch
Strouhal number
Transverse pitch
Turbulence intensity
Cylinder displacement of jth cylinder in the x direction
Flow speed
Gap flow speed
Cylinder displacement of jth cylinder in the y direction
Added mass matrices
Fluid damping matrices
Fluid stiffness matrices
Fluid density
Circular frequency associated with parameter in the drag(lift) direction
Phase angle associated with parameter in the drag (lift)direction
Denote drag (lift) direction
Denote cylinder number jk (j,k - 1 to 2)

9
FLUID FORCES ON TWO CIRCULAR CYLINDERSIN CROSSFLOW
by
J. A. Jendrzejczyk and S. S. Chen
ABSTRACT
Fluid excitation forces are measured in a water loop for
two circular cylinders arranged in tandem and normal to flow.
The Strouhal number and fluctuating drag and lift coefficients
for both cylinders are presented for various spacings and
incoming flow conditions. The results show the effects of
Reynolds number, pitch ratio, and upstream turbulence on the
fluid excitation forces.
1. INTRODUCTION
Multiple circular cylinders are employed in breeder reactor system
components. Examples range from fuel bundles to steam generator tube
banks. As in the case of an isolated cylinder, each cylinder is subjected
to steady fluid forces and unsteady fluid forces. It is important to under-
stand the interaction of multiple cylinders in flow to avoid detrimental
vibration. Two circular cylinders represents the simplest case which
possesses the general characteristics of an array of cylinders. This report
presents parts of the results to characterize the interaction of multiple
cylinders in flow.
Consider two cylinders (1 and 2; see Fig. 1) subjected to crossflow.
Fluid-force components acting on the two cylinders are g1 and g2 in the drag
direction and h1 and h2 in the lift direction. If the cylinders are rigid,
these fluid-force components can be written
g = PU 2DCDj + pU2DC' sin( + )Dj + g' ,
and (1)
h -IpU DCL + ZpU DCLsin( + 0Lj) + h,
j - 1, 2 ,

10
P
V2 , h 2
2 U 2 92
VI, h
U, ,
Fig. 1. Two Circular Cylinders in Crossflow
U
Ta

11
where p is fluid density, U is flow velocity, D is cylinder diameter, CDj
(CLj) is the steady drag (lift) coefficient of cylinder j (j = 1, 2), C'
(CL'i) is the sinusoidal drag (lift) fluid coefficient, and gj and h are
fluid forces due to turbulence buffeting.
The fluid-force components given in Eq. 1 are fluid excitnt tou
forces. If the cylinders are movable, additional fluid-force components
will result from cylinder oscillations. These are the motion-dependent
fluid forces, which are given as follows:
2 2 2 ~_ a2g _ uk - auk - au _ +avk -,,v-
_1 Jk 2 +jk 2 + jk at jk at +jkuk+jkkk-i at atand (2)
2 22 a uk - uk - auk + -, avk -,,v-,
h.= (tjka2 +Sj 2 + tjk at + L k at + Tjkuk + ajkvk 'k-1 at at
where uk and vk (k = 1, 2) are the displacement components in the drag and
lift directions of the cylinder kk, a.' jk Tjk, and jk are added mass
matrices, ajk' ok', Tk, and Sjk are fluid damping matrices, and ak,;'k, T' , f3' are fluid stiffness matrices.k Jk ]k
Fluid-force components are needed in the design and assessment of
various system components. The purpose of the work reported here is to
study the unsteady fluid forces for two rigid cylinders in tandem or side byside for different values of pitch ratios, P/D and T/D.
The flow field around a pair of rigid circular cylinders is very
complex and has been studied extensively. The objectives of these studies
have been, among other things, to measure the fluid force and/or pressure
distribution acting on each cylinder, flow velocity profile, and vortex
shedding, and to understand the result of flow patterns. An excellent
review was published by Zdravkovich [1].
In contrast to an isolated circular cylinder, data are very limited on
the unsteady fluid forces acting on a pair of cylinders. Table 1 summarizes
the published data on the fluctuating fluid forces acting on two cylinders
[2,3,4]. It is evident that there is an urgent need to obtain additional
data on fluctuating fluid forces.

Table 1. Summary of Published Experimental Data for Two Cylinders in Crossflow
Turbulence Measurement Measured
Reference P/D T/D Re x 10~4 Intensity, Fluid Technique Quantities% (see Eqs. 3 and 4)
Jendrzejczyk 1.5 0 2.3 Forceand Chen 1.75 0 2.5 to 5 7.0 Water transducer C', C', and St
(1982) [2] 0 1.5 7.70 1.75
Arie et al. Pressure
(1983) [3] 2, 3, 4 0 15.7 0.3 Air taps CD, C'
Savkar 1.2 to Load(1984) [4] 6.0 0 2 to 20 8.5 Air cells C' and St

13
2. EXPERIMENTAL SETUP
The experiment was performed in the Flow Induced Vibration Test
Facility (FIVTF). The primary system of the loop is filled with
demineralized water and consists of four pumps arranged in parallel, feeding
a closed accumulator of 30 m3 (8000 gal). The flowrates of the four pumps
are 0.032, 0.063, 0.16, and 0.25 m3/s (500, 1000, 2500, 4000 gpm) at 1.0 MPa
(150 psig) discharge pressure. The pumps discharge individually through
their own control and by-pass valves, flowmeters, and piping to the closed
accumulator. Thus, by using a combination of pumps and valves, the flowrate
can be controlled from ~-0.003 m3/s (50 gpm) to a maximum of 0.5 m3 /s (8000gpm). From the closed accumulator, water is valved to one of the several
test leg branches and returned to a common supply tank of 38 m3 (10,000
gal). The quality of the water is maintained using water conditioning
equipment installed in the supply tank.
The test section, shown in Fig. 2, is a square flow channel with a flow
area of 30 cm x 30 cm (11-3/4 in. x 11-3/4 in.) connected to one of the test
leg branches, which is a 46 cm (18.1 in.) pipe. A 30 cm (11./5 in.) square
liner is inserted in the pipe to form a square flow channel upstream and
downstream of the test section. The diameter of the circular cylinders for
all tests is 2.54 cm (1 in.), yielding a geometric blockage of 8.5% for a
single cylinder and two cylinders in tandem and 17% for two cylinders normal
to the flow. The minimum Reynolds number based on the gap flow velocity is
"1.5 x 10⁴. With a maximum flow velocity, a Reynolds number of ~1.5 x 10⁵
can be reached. For all measurements, the cylinders with a diameter of
2.54 cm (1 in.) and a length of 29.85 cm (11.75 in.) are used.
Fluid-force components depend on the upstream turbulence. Different
grids were placed upstream to vary the flow field. Tests are conducted for
three grids: (1) Grid A, (2) Grid B, and (3) Grid C. Grid A is a per-
forated plate 0.159 cm (0.0625 in.) thick with 0.476 cm (0.1875 in.)
diameter holes. Grids B and C were constructed by drilling holes uniformly
in a closely-packed array through 2.86 cm (1-1/8 in.) thick plates. The
grid and turbulence characteristics are given in Table 2.
To measure fluctuating fluid forces, two piezoelectric three-axial
transducers (one at each end of the test cylinder) were used (Fig. 3). The
diameter of the test cylinders is 2.54 cm (1 in.) and the active length is
the channel width 30 cm (11.75 in.). The locations of the test cylinders in
the test section for various tests are described in Table 3. Position 5 was
an oversize penetration and was not used for force measurements.

TURBULENCEGENERATOR
[A\
EXPANSION JOINT
046m
1.52 m
5.33 m
6.17 m
TESTSECTION
BACK PR ESSU REVALVE
E X PANS IONJOINT
I 7x,
___17
1O.23 m
F LOW
I3I1 STORAGETANK
30.5 cm RECTANGULARFLOW LINE
46 cm I.D.SS PIPE
18 in. DIA. SS PIPE
SECTION A-A
Fig. 2. Test Section
ACCUMULATOR
/ VA LVE
-4ma
I
s
I
9.35 rn'
I

15
Table 2. Grid and Turbulence Characteristics*
Grid Xm, TI, L, a, b,cm % cm cm %
A 42.3 1-3 4-8.5 0.476 49
B 42.3 4-5 1.2-1.4 1.7' 58
C 42.3 10-11 2.3-2.7 2.67 75
From Re:. 5.
is the distance between downstream surface of the gridand the centerline of the center tube of the test section,
a is the hole diameter,b is the blockage ratio,TI is the turbulence intensity, andL is the length scale.

WESTFORCETRANSDUCER
TOPEASTFORCETRANSDUCER
/
42.3 cm
POSITIONNUMBER
(a@0@@@®0
TURBULENCEGENERATOR
FLOW
Fig. 3. Cylinders Installed in the Test Section
I

17
Table 3. Tube Locations
Position
Arrangement T/D P/D Tube 1 Tube 2
Single tube -- -- A B
Two tubes 1.35 - A Bnormal
2.7 - B C
- 1.35 1 2
- 2.7 1 3
Two tubes - 4.05 1 4In tandem
- 5.4 2 6
- 6.75 1 6
- 8.1 1 7
- 10.8 1 9
*T/D is transverse pitch; P/D is ingitudinal pitch.

18
3. TEST PROCEDURES AND DATA ANALYSES
A series of single and twin tubes were tested under three turbulence
intensities (see Fig. 4): (1) A single tube, (2) two tubes normal to flow
with T/D = 1.35 and 2.7; and (3) two tubes in tandem with P/D = 1.35, 2.7,
4.05, 5.4, 6.75, 8.1, and 10.8.
In each test, fluid pressure, flow velocity, and fluid forces acting on
the tubes are measured. The total flowrate is measured by turbine
flowmeters. The mean flow velocity is obtained by dividing the flowrate by
the flow area. All calculations are based on the gap flow velocity.
In each test run, the flow velocity is increased at small intervals.
At each flow velocity, the fluid force components in the lift and drag
directions are recorded on a magnetic tape for several minutes for
subsequent analysis. A fast Fourier transform analyzer is used to determine
fluid force characteristics (see Fig. 5). The low-pass filters are used to
filter out the transducer tube resonant frequency (fR > 120 Hz).
Fluid excitation forces acting on the tubes are given in Eq. 1. In
presentation of the data, RMS fluctuating drag and lift coefficients are
given:
2 1/2
C' = <C'.sin( . + .) + 2 g >1/2Dj Dj jpU D
and (3)
2 1/2C'. = <CLjsin(j + .Lj + 2 h! > ,
pU U
where < > denotes mean square value of the argument.
The Strouhal number is evaluated from the frequency spectra of fluid
force components in the lift direction:
St - D ,9(4)U
where f is the frequency peaks.

1 9
FLOW
FLOW
OlD
0
0
FLOW KDO0
T/0 =1.35 ,2.7
P/D =1.35,2.7,4.05, 5.4
6.75, 8.1 , 10.8
Fig. 4. Tube Arrangements

FORCETRANSDUCER
I II I
II
CHARGEAMPLIFIER
FMTAPE
RECORDER
TIME CODE
0-85 HzLOW PASSFILTER
RMSFORCES
FORCEP S D'S
Fig. 5. Data Acquisition and Analysis
FASTFOURIERANALYZER
ANN.

21
4. EXPERIMENTAL RESULTS
The measurements were taken from subcritical to transition regions
1.5 x 10⁴ < Re < 1.5 x 10⁵. The gap flow velocity is -O.6 m/s
(1.97 ft/sec) < U < 8 m/s (26.2 ft/sec). The results are presented based
on the gap flow velocity.
4.1 AN ISOLATED CYLINDER
In Fig. 6, the Strouhal number (St) and rms values of fluctuating lift
and drag coefficients (CL and C') are plotted against Reynolds number Re.
In general, the results match the measurements by So and Savkar [6], Schewe
[7], Cheung and Melbourne [8], and Mulcahy [5].
The Strouhal numbers were obtained from the power spectra of the lift
fluctuations. At low flow velocities, typical spectra are narrow-band, with
a sharp peak at the Strouhal frequency. At higher flow velocities, the
spectra become broad-band with no frequency peaks.
The fluctuating lift and drag coefficients given in Fig. 6 appear to be
lower than those by some other measurements [6]. This is attributed to the
relatively large length-to-diameter ratio of the tube. Since the
correlation length of vortex shedding for a single rigid cylinder is ~0.5 D
to 6D [9], the span length of the cylinder of about 12D in this case results
in smaller fluctuating fluid-force coefficients.
The decrease in fluctuating lift and drag in the critical flow regime
is shown to occur at lower Reynolds numbers for larger turbulence. This is
consistent with other reuslts, e.g., the data by Cheung and Melbourne [8].
4.2 TWO TUBES NORMAL TO FLOW
The fluctuating lift and drag forces depend on tube pitch, Reynolds
number, and incoming flow conditions. Figure 7 shows the fluctuating lift
and drag forces for T/D = 2.7 with Grid C and for four representative Re to
illustrate the changing nature of the force. At Re = 1.93 x 10⁴, the
fluctuating lift is periodic and the drag fcrce is very small. With the
increase of Re, the lift force changes from highly organized to more
random. The organized nature of the lift force is indicative of the orderly
alternate vortex shedding. At higher Re, the shed vortices would no longer
have a distinct frequency. These characteristics are basically the same as
those for an isolated cylinder.
The characteristics of the fluctuating lift and drag can also be noted
from the frequency spectra given in Fig. 8. At low Re, there is only one
distinct peak in the spectra and the vortex shedding frequencies can be

22
0.30 1111-1
A GRID B0.25 o GRID A
V)
0.20
0.15
0.2
IV)
0.1
0.0
0.06
0.05
0.04
-0Iu 0.03
0.02-
0.01
0.00 4I5 --l-1X10⁴ 2 3 4 5 6 789 1X10 5 5X10 5 106
ReFig. 6. Strouhal Number, and RMS Lift and Drag Coefficients

23
(a)
LIFT FORCE
Re= 1.93 x 10⁴
3.53
5.63
9.46
(b)
DRAG FORCE
Re=1.93 x 10Q
3.53
5.63
9.46
Fig. 7. Fluctuating Lift and Drag Forces on One of the Cylinders forTwo Cylinders Normal to Flow with T/D = 2.7

DRAG FORCE
1.74 x ox 5
1.41
I.36
1.19 x 10⁵
..... 9.40 x I0
7.75
5.63
4.39
3.53
2.70
1.93
1.48 x 10⁴__
0 10 20 30 40 50 60 70 80 90 0 10 20 30 40 50FREQUENCY, Hz
Fig. 8. Frequency Spectra of the Lift and Drag Forces for Two Cylinders Normal to Flow
with Grid C
L--
ELECTRICAL NOISE
I
60 70
for T/D
80
= 2.7
90
LIFT FORCE

25
determined without ambiguity, As Re is increased, the frequency peak
becomes less distinct, resulting in no identifiable peak at high Re.
Figure 9 shows the Strouhal number for two cylinders normal to flow.
For T/D = 2.7, the Strouhal number is the same as that for a single
cylinder. For T/D = 1.35, in some range of Re, two vortex frequencies are
noted. This agrees with previous investigations [1,3,10].
Figures 10 to 13 show the rms values of fluctuating lift and drag as a
function of Re for T/D = 1.35 and 2.7 and Grids B and C.
For two cylinders normal to flow with 1.2 ( T/D < 2.0, the gap flow is
biased to one side [10]. Consequently, wide and narrow wakes are formed
behind the cylinders. Apparently, the biased flow pattern does not affect
the fluctuating drag and lift; these force components measured from the two
cylinders are about the same for both T/D = 1.35 and 2.7.
The general trend of the variation of drag with Re is similar to that
of lift. In the subcritical region, the drag coefficient is ~20-25% of the
lift coefficient. In the transition region, CD/CL may be as large as 0.5.
The pitch ratio plays an important role. In the subcritical Re, LL and
CD are larger for T/D = 2.70. However, in the transition region, both CL
and C are approximately the same for T/D = 2.7 and 1.35. In addition, the
transition region for T/D = 2.7 occurs at lower Re.
The effect of the upstream turbulence is similar to that of an isolated
cylinder; it reduces the effective Re for the transition region.
4.3 TWO TUBES IN TANDEM
Figures 14 and 15 show the time histories of the lift forces for two
tubes in tandem with P/D = 1.35 and 2.7 and Grid A. The general trend is
similar to that of two tubes normal to flow. At Re = 3.45 x 10⁴, both lift
forces exhibit very orderly oscillations. At higher Re, the lift force on
Tube 2 is more orderly than on Tube 1.
Typical frequency spectra of the lift and drag forces for two tubes in
tandem are given in Figs. 16 and 17.
Figure 16 shows the frequency spectra of lift force for two tubes in
tandem with P/D - 1.35 and Grid A. The frequency peak for Tube 2 is the
usual Strouhal frequency, with St varying from 0.14 to 0.16 for Re from 104
to 1.5 x 10⁵. For Tube 1, in addition to the Strouhal frequency, there is
another frequency peak with its frequency equal to approximately one third
of the Strouhal frequency. At higher Re, the response associated with the
higher frequency decreases with flow, while that associated with the lower

0.4
0.3
0.2
0.1
0.0
0.3
0.2
0.1
0.0
0.2
0.1
0.01
0 0 0
I I
- "0 "0 "
GRID A
2 3 4
Fig.
T/D = 1.350
00
"
II I iii
0 00e. -
I I I -
,.0. 1 GRID B
. 0.01
0.4
0.3- . .. e.
0.2
" " . .
0.1GRID A
0.0I5 6 7 8 9 1X10⁵ 2 1X10⁴ 2 3 4 5
Re
9. Strouhal Numbers for Two Cylinders Normal to Flow
T/D = 2.7
GRID C
6 7 8 9 1X10⁵
0.4
0.3
0.2
G
GRID B
0
0 "* "*
x10 4 2
v I
I

0.35 0.01 I
0BN-1 I I ! I I
T/D = 1.35
GRID B
O TUBE 1
A TUBE 2
0.06
0.05
0.04
I I I II I I I 10.35
A0
0
I II I I I I Ii1X104 2 3 4 5 6 789 1X10⁵
IV)
0.03
0.02
Op
O O_
O
. -
0
OA
O
0
0.01 1-
0.002
I II I I I I It1X104 2 3 4 5 6 7 8 9 1X10⁵
Re
Fig. 10. Fluctuating Drag and Lift Coefficients for T/D = 1.35 and Grid B
0.30
0.25 I-
0.20 1-
lo
0.1 5
0.10
0.05
0.002
0.07
H
fl
o a,

0.30 1-
- I I I I I i i 1-
0.06 [-
0.35
T/D = 1.35
GRID Co TUBE IO TUBE 2
4-A
I I I II -i
00oo
A 0
AP
0.20
0.15
0.10
0.05
0.002 3 4 5 6789 1X10 5 2 1X10 4 2 3 4 56789
Re
Fig. 11. Fluctuating Drag and Lift Coefficients for T/D = 1.35 and Grid C
0.05
0.04
0.03
0.25 F-
dmmlmmp I I I I I I ild
N
1X10⁴ 1X10⁵ 2
0.02 -
0.07 1
0.01
0.00

O I 11111
A
0
A
0
0
0.08
0.07
0.06 F-
0.05 -
0.40
0
iv 0.20
T/D =2.7
GRID B
o TUBEI1A TUBE 2
iL) 0.04
0.03
0.02
0.01
A O
00ow
_
I I I I II1 1 112 3 4 5 6789 1X10⁵ 2
0.00 1__t__.!L111L1X10 4 2 3 4 5 6789 1X10⁵
ReFig. 12. Fluctuating Drag and Lift Coefficients for T/D = 2.7 and Grid B
0
0.35 F-
0.30 -0
0.25
A
0
0.15 -
0.10
0.05
0
0
A
0
0.001X10⁴ 2
I
0.35 0.07 I I I I I I 1 11I I- I Ililt
T/D = 2.7
GRID Co TUBE 1AOTUBE 2
A
0
0.06 1-
0.05 .-
A
0
0.04 1-
A
0
o AAA0
I iiin
1 -61
iXio4 2 3 4 5 67 89 1X10 5 2
_DIV)
0.03
0.02
0.01
0.00
A0
00
I ! I I I I 1iii
1X10 4 2 3 4 5 6 7 8 9 1X10⁵
Re
Fig. 13. Fluctuating Drag and Lift Coefficients for T/D = 2.7 and Grid C
0.03 -
0.25 E-0
0.20 H-
0.15 E-
0
0.01 F-
0.05 [-
0.00
0
2
0.070.35
6 B
-

31
(a)
TUBE 1
Re= 3.45 x 10⁴
5.80
6.47
(b)
TUBE 2
Re= 3.45 x 10⁴
5.80
6.47
n .03 x105
Fig. 14. Lift Forces on Two Cylinders in Tandem for P/D = 1.35 and Grid A

32
TUBE 2 P/D = 2.7
GRID ALIFT FORCE
Re= 4.26 x 10⁴
6.02
9.52
DRAG FORCE
Re= 4.26 x 10⁴
6.02
9.52
TUBE 1
LIFT FORCE
Re=4.26 x 10⁴
6.02
9.52
Fig. 15, Lift and Drag Forces on Two Cylinders in Tandem for P/D = 2.7 andGrid A

33
TUBE 1 TUBE 2
7.94
1.55 x 05
1.49
.44
.39
1.33
1.03 x 10⁵
9.56 x I04
9.04
8.56
7.94
7.25
6.47.
5.81
5.06
4.10
3.45
2.47 x le4
0 10 20 30 40 50 60 0 10 20 30 40 50 60FREQUENCY, Hz
Fig. 16. Frequency Spectra of the Lift Forces for Two Cylinders in Tandemfor P/D = 1.35 and Grid A

34
LIFT FORCE DRAG FORCE
Re =
1.55 x 10⁵
1.49
1.43
1.37
... 1.32
1.24
1.17
., , 1.07
.01 x 15
9.52
8.24
7.48
6.77
6.02
5.40
4.71
4.26
3.55
2.86
2.31
.78
.19 x 104l' i i i i iT T -i i
0 10 20 30 40 50 60 70 0 10 20 30 40 50 60 70
FREQUENCY, Hz
Fig. 17. Frequency Spectra of the Lift and Drag Forces Acting on theDownstream Cylinder for Two Cylinders in Tandem for P/D = 2.7and Grid A

35
frequency peak becomes dominant. The cause of the lower frequency peak is
unknown.
The frequency spectra change from those with a shard) peak to a broad-
band spectrum at high Re. This is similar to those of an Isolated tube in
crossflow and other published results. However, in the literature, it is
reported that no vortex shedding is detected behind the front tube [1]; the
results of these tests show clearly that there is a resultant fluctuating
lift force on the front tube.
Figure 17 shows the frequency spectra of drag and lift for Tube 2 for
P/D = 2.7 and Grid A. The Strouhal frequency in the lift direction is
easily recognized. In the drag direction, there is a frequency peak
occurring at twice the Strouhal frequency. This, too, is similar to that uf
an isolated tube.
Based on the frequency spectra, the general characteristics of the lift
and drag for different cases are summarized in Table 4. The characteristics
fall into three categories:
(1) The frequency spectra of the lift or drag force do not exhibit
dominant frequency peaks.
(2) At low Re, there is a frequency peak associated with the vortex
shedding and at high Re, there are no dominant frequency peaks in the
spectra.
(3) At low Re, there are two frequency peaks, one at the Strouhal
frequency and the other at twice the Strouhal frequency. At high Re, there
are no dominant frequency peaks.
Based on the frequency spectra, some general conclusions are noted on the
Strouhal frequency:
" CLi - Except at P/D = 1.35 with Grid C, there exists a Strouhal
frequency at subcritical Re.
" CD1 - Except at large P/D (6.75 to 10.8) with low turbulence, there
are no frequency peaks.
" CL2 - Except at P/D = 1.35 with Grid C, there exists a Strouhal
frequency at subcritical Re.
" CD2 - At large P/D ( 5.4), there are frequency peaks at the
Strouhal frequency and twice the Strouhal frequency.
The Strouhal numbers are given in Fig. 18 for both tubes. Tube 2 is a
greater distance from the turbulence grid; therefore, it experiences less
turbulence from the incoming flow. The Strouhal frequency at higher flow
velocity for Tube 2 is much more well defined.

36
Table 4. Frequency Spectra Characteristics for Two Cylinders in Tandem
Grid Tube Force P/D
No. Component 1.35 2.7 4.05 5.4 6.75 8.1 10.8
Drag y x x x o o o1
Lift 0 0 " "S" "A
Drag x x x o o o o
2Lift 0 0 " "0" "
Drag x x x x x x o
1
Lift 0 0 0 0
B
Drag x x x o o o o2
Lift 0 0 0 0 0 0 0
Drag x x x x x x x
1Lift x 0 0 0 0 0 0
C
Drag x x x o o o2
Lift x 0 0 0 0 0""
x No dominant frequency peaks.
0 One frequency peak associated with the vortex shedding at low Re and nodominant frequency peaks at high Re.
o Two frequency peaks, one at the Strouhal frequency and the other attwice the Strouhal frequency at low Re, and no dominant frequency peaks
at high Re.

0.5
0.4
0.3
0.2
0.1
0.0
0.2
0.1
0.3
0.2
0.1
0.3
0.2
0.1
0.3
0.2
0.1
0.3
0.2
0.1
0.3
0.2
0.1
4.05 -
0 o P
5.40 0 -1O 0AA
6.75 0 0 -0 Ap
00^%^* ^ * ** -I0 0 A AAA "0
8.10 -18100AAA 00000AQ Q o
0 00Ap SK " ". .[*** -i"
- 10.8 .A -0 A
00 O A A .00"ap , , ^" ,..*"-. Ae .*. . * .00 -
1X14
r
I
0.12 3 4 5 6 789 1X10 5 2
Re
P/D =1.35
TUBE 1
0 *e e**0
1 2
2.70 0 0 0
- 0 0 0 A -I
. . . . I I I I I
IX104 2 3 4 5 6'T 89 1X10⁵ 2
Fig. 18. Strouhal Number for Two Cylinders in Tandem
37
0.5
0.4
0.3
0.2
0.1
0.0
0.2
0.1
0.3
0.2
0.1
0.3
0.2
0.1
0.3
0.2
0.1
0.3
0.2
0.1
0.3
0.2
A-0
I I I I I I 1i 1
-o 0"A 0 A0 A 00 000
A H ***
I- -A
00Ao
"
OO 000 e
[00 0 *"
0 *.0000"
AAAA
oo ""
A p0 A0 ""P"K Ap AAA
- Us """e*
A 0000. 3
A -
. o 1 0e * 101 e
- -.*ii
TUBE 2
* GRID A
A GRID B
o GRID C
" "0"".A A""

38
The effect of turbulence on Strouhal number can be noted from
Fig. 19. At lower turbulence intensities (Grid A), the transition region
occurs at larger Re. In addition, in the transition region, St increases
more rapidly with Re to a larger value. At higher turbulence intensities
(Grid C), the increase of St with Re is more gradual and the value of St in
the transition region is smaller.
Figure 20 compares St among this study and the data by Bokaian and
Geoola [11] and Kiya et al. [12] at the subcritical Re. Both Bokaian and
Geoola and Kiya et al. used a hot-wire anemometer placed in the wake of the
cylinder to measure the velocity fluctuation. The results from three tests
agree reasonably well. The vortex shedding behind the upstream tube is
suppressed up to P/D = 3. Kiya et al. noted weak spectrum peaks in the
velocity fluctuation induced behind the upstream tube by the periodic vortex
shedding from the downstream tube. The results of this study show clear
frequency peaks for P/D = 1.35 and 2.7. This suggests that even though no
distinct vortices were found behind the upstream tube, the fluctuating lift
of the upstream cylinder does not depend on the distinct vortices.
For two cubes in tandem, the critical spacing (P/D) is approximately
between 3.0 and 3.8. For P/D < 3.0, Kiya et al. found no distinct vortex
shedding behind the upstream tube, and St for the downstream tube increases
with decreasing P/D. For P/D > 3.8, St behind the upstream tube increases
with P/D for up to about 6 ~ 7 and then approaches to that of an isolated
tube at P/D ~ 10. St for the downstream tube obtained by Kiya et al. shows
a jump at P/D = 3 to 3.8; however, St obtained by Bokaian and Geoola shows
no discontinuity.
The Strouhal number for two tubes in tandem can be used to evaluate the
Strouhal number' for a single cylinder. When P/D is large, the Strouhal
number for the upstream cylinder is the same as that for a single tube.
Based on the results presented in this report--in particular, Fig. 19--the
Strouhal number in the transition region can be sketched as shown in
Fig. 21. The values of St depend on the upstream TI; the higher the TI,
the smnller the St. This is one of the reasons that there is a great
scattering in this region.
RMS values of fluctuating lift and drag forces are given in Figs. 22
through 33. Some general characteristics are noted.
" UCL and C'1 are dependent on the pitch ratio for P/D < 4.05. For
P/D > 4.05, CL, and Z;, are not affected appreciably by P/D.
L CL2 is dependent on P/D for 1.35 and 2.7. For P/D = 4.05 to 10.8,there -re variations.

39
p
GRID AA 0
0o
A o "A@. AP o'n 0 $ "g
I I I Ii i iI XO4 2 3 4 5 6 7 8 9 1X10⁵
Refor the Upstream Cylinder for Two CylindersFig. 19. Strouhal Number
in Tandem
0.4
GRID C
a o 0 0 0
.A * AP/D
" O y10.8
c3 6.75
0.3H
0.2H
0.1
0.4
0.3 F-
(!)
0.2
GRID B Aoe AA
S-o
-II I I I iiil
v
0.1
0.3
0.2
0.1
0.0'
2
- t I

40
TUBE 2
A BOKAIAN AND GEO0LA (1984),Re=5.6 X10³
o KIYA et al. (1980), Re =1.58 X 10⁴
" PRESENT RESULT , Re = 1.5 X 10⁴
' nn bo
iIIIIII I I
'r I I I I I I I
TUBE 1
0 S
0.3 -
0 X0~At 4 0 0 0tRo
0 0
- nL
II I I I I I I I I I1 2 3 4 5 6
P/D7 8 9 10 11 12
Fig. 20. Comparison of Strouhal Number for Two Cylinders in Tandem
0.6
0.5
0.4
0.2
0.1
0.0
0.4Cr
0
0.1
0.0
.p 01 0

0.60
0.50
::0.40
0.30
0.20
1__L111I I I I 1 111
102
I I 1l 111 I I I I 11 111
W
- I-
- 2 z
wZ
W2 cr.1Z0
wJ c- 20
2 w REGION OF TURBULENT VORTEX TRAIL. I 55 LAMINAR BOUNDARY LAYER ON CYLINDER
C x > c
---Il
REGION IN
SHEDDING
- BE DEFINE
DOMINANA SPECTR
00000
N WHICH EDDYr FREQUENCY CANED AS THET FR EQUENCY IN
lum
III I iI I103 o60
WJ(W
Zmy).
O L.
ccI I gI
101
REYNOLDS NUMBER (Re)
Fig. 21. Strouhal Number for a Single Cylinder
LOW TI
LII
MEDIUM TI
HIGH TI
rI
U,
W
ZJ
O
0.10
40
- - - -..- --.---
104

II I I I I I I~
" P/D = 10.8
0
0.4
0.3
0.2
0.1
0.0
0.0
--. 0.1
0.0
0.0
0.1
A 0A
Aa
6.750
0
0
0
A****
00.0
n n L-
A 5.4
4.050.
0"
00.
2.70pAA
A AAAAA0
1.35.
e 0*t.* .0.9%,
II II I I I 1 I I1X104 2 3 4 5 6 7 8 9 1X10 5
Re2
Fig. 22. Fluctuating Lift Coefficient for Two Cylinders in Tandem(Upstream Tube, Grid A)
42
0
0
0
*
*.0
0 0
A
0
v.
0.1
0.0
0.1
0.0
_JI
-

43
0.5
0.4
0.3
0.2
0.1
0.01
0.0
0.2-
0.1
'U0.0
0.1 -
0.0
0.1 -
0.0
0.2
0.1
0.0
0.0IX104
Fig. 23. Fluctuating(Downstream
P/D =10.8.
0
A 8 1 *
A "
6.75 A 00 A B"
A
A "5.
05.40
40.05
. A
0" A
A
.
."
2.70
1.350 0
0 . -A eeA..
AA
0*0.
0
o -
0000
**.
AAAA
00 .
*"."
---
I I I I I I iiil2 3 4 5 6789 1X10⁵ 2
ReLift Coefficient for Two CylindersTube, Grid A)
in Tandem
i

44
I II I I i
0 g
0.1
0.05
8.1AAA
0 0 6.750 0.
S 5.4
00
Aoo
0.00
0.00
0.00
0.00
0.05
0.00
0.05
0
0 0
- I
1x10 4 2
1.35 0,0.e. .0.00
t II I I -I i I3 4 5 6 7 89 1x10 5
Re
Fig. 24. Fluctuating Drag Coefficient(Upstream Tube, Grid A)
for Two Cylinders in Tandem
00
A
P/D = 10.80
"0 -00
0.
00000.
0 9X 4.05
0..
A o 2.70A AAAA
L 0
0 0
A A A
A
0.00
0.05
0.002
T i
A A A
0

45
I I I I I II I
0.05
0.00
0.00
-o 0.00
0.00
0.05
0.00
0.10
0.05
.
0
P/D = 10.80
0S
00
AA QA.l
A0 9
A
0
0 *0
" 6.75
a .00
A 5 .4
Ae
0
0 0" 4.05
* 0
-
I - I I I I I I Ii1X10 4 2 3 4 5 6 7 8 9 1X10⁵ 2
ReFig. 25. Fluctuating Drag Coefficient for Two Cylinders in Tandem
(Downstream Tube, Grid A)
0.05
0.10
0.00
0.00
T 5 w I I I I T I
- - - EOW -
L-
L
I
*0
A 2.70
1.35
. * 0 ********e**, -

46
I I I I I I Il
P/ D = 10.80
S
0.5
0.4
0.3
0.2
0.1
0
A
6.756
A 0
0.0L
0.0
0.0 -
0.0
0.1
A
5.4A
0",
AA AALAA^^
"S009
4.05
2.7A.
A ""
A " "000909099
1 .35. . . .
A^^AvAA
D - -.......
I - II I I I Iti2 3 4 5 6 789
Re
1X 1Q5
Fig. 26. Fluctuating Lift Coefficient for Two Cylinders in Tandem(Upstream Tube, Grid B)
8.1A
A
0
I-
0.0'
o.
U.U
1X10⁴ 2
9 N N N z w 9 v N
_
I

47
0.5
0.4
0.3
0.2
0.1
0.0
0.1
0.0 '.
0.0
0.1
0.0
0.0
0.01 X10
0 * *P/D=10.8
-
A
8.1A
6.75 A0
0
*g
S
5.4" A
0" A
. A
0
4.05 A0
0
A2.7A 0
A "A 0
W00g0
A
ALc\
SS
AJ
A0 0.0
0 1.350 " .
"*.........
I I I I I i i i il2 3 4 5 6 7 8 9 1X10⁵
Re
Fig. 27. Fluctuating Lift Coefficient for Two Cylinders in Tandem(Downstream Tube, Grid B)
- JIV)
2
I

I I I I I II I
P/D = .10.8
A A
00
000
0.00
0.00
0.05
A
2.7
AAIn
0.00 L
0.00i X i04
0 0 1.35
0000..
2 3 4 5 6 789 1X10⁵ 2
ReFig. 28. Fluctuating Drag Coefficient for Two Cylinders in Tandem
(Upstream Tube, Grid B)
48
0.10
0.050 0 0
AA A
6.75.. *
0 *...0 090000.0.
A 5.4
*" 4.05000000.
A
L- 0
0
Iv. 00
0.00
0.00
0.00
0.10-
0.05
0 a 5 ff a 2 N I I
I
DA
I

0 * P/D=10.80
0
0 * 0*0
0
...s....
000
S..
* 8.1
*"" 6.75
".0.4
0.,. 4
SS 4.05
.0000.. 0
0 0
00
*, 2.7**@00..,,
-135 -LLI .35
1 0 00
I I1X10 4 2 3 4 5 6 7 89 1X10⁵ 2
ReFig. 29. Fluctuating Drag Coefficient for Two Cylinders in Tandem
(Downstream Tube, Grid B)
49
0.10
0.05
OI
0
0
0
0
0.00
0.00
0.00
0.00.
0 0
0
0.05
0.00
0.10
0.05
0.00
0.00

50
0.3
0.2
0.I
0
0.0
0.0
. _p 0.0
0.0
0.0
0.I
P/D= 10.80 00A .
0
0
0
0
0
8.1
6 .7 5
5.4A0
AA A iVxA
4.05
2.7A AAAAAAAAA
0.0 !
0.I
0.0
0
I.35.
I I I I I I Ii1x104 2 3 4 5 6 7 8 9 IX10 5 2
ReFig. 30. Fluctuating Lift Coefficient for Two Cylinders in Tandem
(Upstream Tube, Grid C)
9 1 1 1 T -9 - I I I
L
I

51
I I I I I IItt
. P/D = 10.80
0.3
0.2
0.I
0.0
0.I
0 .*........A
A 8.10
06.75 AL
AAW
A
0-. 0.0IL)
0.0
0.0
0.0
0.0
0. 0 -
0
.@.
A 5.4A
0
* 4.050
0
w Goo*
2.7
1.35
I I I I I I I II
IX104 2 3 4 5 67891X10 5 2Re
Fig. 31. Fluctuating Lift Coefficient for Two Cylinders in Tandem(Downstream Tube, Grid C)
I
0
v
AhI

52
P/D = 10.8
0
0. ..". . . ..
A
8.1 -
0 . , 6.75
AAA 5.
AAAa AAAAAm
* . 4.05
AA2.A A 2.
0" 1.35
@0.
I I I I I Ii3 4 5 6 7 89
Re
Fig. 32. Fluctuating Drag Coefficient(Upstream Tube, Grid C)
for Two Cylinders in Tandem
0.I
0.05
0.00
0.00
0.
0.00
0
-oIL) 0.00
0.05 .
0.00 '
0.05
0.00 L
0.00 I
1x10 4 2 IXI05 2
i 1
I----
I
J
I

53
I I I I I I Il
P/D=I0.80 0
0.00 1
0.00
0.00[
- 0 0.00K'
0.05
0.00
0
.
AA
A 8.100
6.75
5.4A A
0
0.
@000....
A AAAAAL\166"
..
4.050
00. @0,
O
A 2.7Op
0.05 -AA
1.350 * .@0
0 0
I I I I I I Ii1x104 2 3 4 5 6789 IX105 2
Re
Fig. 33. Fluctuating Drag Coefficient for Two Cylinders in Tandem
(Downstream Tube, Grid C)
0.I
0050 0
A
0.00
0.00 l 1 1
I
Q
)

54
* CD2 varies significantly with P/D for 1.35, 2.7 and 4.05, and for
P/D > 5.4, there is little change.
The rms lift and drag coefficients are functions of Reynolds number,
pitch ratio, and turbulence. Figure 34 shows the rms C and CD as a
function of P/D for Re = 105. In general, the rms lift and drag for the
downstream cylinder are larger than the upstream one for smaller spacing.
However, at high turbulence and very small P/D, the upstream will experience
larger CL because of the incoming flow. For larger P/D, they approach those
of an isolated cylinder. Similar results are obtained by Aire et al. [3]
for subcritical Re.
Figure 35 shows the fluctuating lift with P/D = 4.05 and 10.8 and
Grids B and C. The effects of turbulent intensity are to shift the
transition region to a low Re range. Similar characteristics are noted for
the downstream tube. In addition, the fluctuating force components are
reduced with increasing turbulence in the subcritical Re.
5. CONCLUDING REMARKS
This report describes the fluctuating drag and lift forces acting on a
pair of cylinders side by side or in tandem. The fluid forces are measured
at a Reynolds number from about 1.5 x 10⁴ to 1.5 x 10⁵ for several
turbulence intensities in the incoming flow.
Two cylinders in crossflow have application to breeder reactor system
components as well as having many other engineering applications. The
characterization of the fluid forces is an integrated part of understanding
the dynamic response of such a system. Extensive measurements have been
reported on steady-state fluid-force components; however, very limited
information is available for fluctuating fluid-force components, in
particular, at high Reynolds numbers. The information presented in this
report provides some of this necessary data for two tubes in crossflow.
A complete characterization of a two-tube system in crossflow requires
not only fluid excitation force components, as presented in this report, but
motion-dependent fluid forces, as well. Measurements of motion-dependent
fluid force will require measurements of fluid forces acting on moving
cylinders. Technique to measure these forces are being developed.
The study of a single cylinder in crossflow has a history of more than
a hundred years; however, a complete analysis in terms of the fundamental
principles of fluid mechanics remains under development, and some of the
features of the vibration of a single cylinder in crossflow remain not well

55
0.1
0.05
0.0
-loK)
Fig. 34. Fluctfor F
0 2 4 6 8P/D
tuating Drag and Lift Coefficientse = 105
10 12
as a Function of P/D
SI I I I
GRID B * TUBE IA TUBE 2
Re = 105
A-0-
GRID C
A A
0 0
0 * .AA 0 A A A
GRID B
AA
A A A
00
. . * . .
GRID C
A
* .
A A
- , -
0.1
0.05
0.0
0.3
0.2
0.1
I00.0
0.3
0.2
0.1
00W.W

56
0.4F-
1X10⁴ 2 3 4 5 6 7 8 9 1X10 5 2
ReFig. 35. Fluctuating Lift Coefficients for Different Turbulence
Intensities for Two Cylinders in Tandem
0.5 SI I I fI i
P/D = 4.05
GRID B
A "*GRID C
* A0 . ** e.@@@.es"A
co
I I I II Hoi
0.3
0.2 -
0.1
0.0
0.5
0.4
0.3
0.2
0.1
0.0
P/D = 10.8A
A
A
. . .. ".......
AA
I I I I I I ti! 1
__1

57
understood. For two cylinders, there are infinite numbers of arrangements;
therefore, since it is much more complicated, it is that much more difficult
to provide a complete description of the two-tube system. It is expected
that research in this problem will continue steadily.
ACKNOWLEDGMENTS
This work was performed under the sponsorship of the Office of BreederReactor Technology, U. S. Department of Energy.

58
REFERENCES
1. Zdravkovich, M. M., "Review of Flow Interference Between Two Circular
Cylinders in Various Arrangements," J. Fluids Eng. 99, 6181-633 (1977).
2. Jendrzejczyk, J. A., and Chen, S. S., "Fluid Forces Acting on CircularCylinders in Liquid Cross Flow," Flow-Induced Vibration of Circular
Cylindrical Structures, ASME Publication PVP v. 63, pp. 31-44 (1982).
3. Arie, M., Kiya, M., Moriya, M., and Mori, H., "Pressure Fluctuations on
the Surface of Two Circular Cylinders in Tandem Arrangement," J. ofFluids Eng. 105, 161-167 (1983).
4. Savkar, S. D., "Buffeting of Cylindrical Arrays in Cross Flow," Symp.on Flow-Induced Vibration, Vol. 2, ASME Publication, pp. 195-210(1984).
5. Mulcahy, T. M., "Fluid Forces on a Rigid Cylinder in TurbulentCrossflow," ASME Sym. on Flow-Induced Vibrations, Vol. 1, pp. 15-28(1984).
6. So, R. M. C., and Savkar, S. D., "Buffeting Forces on Rigid CircularCylinders in Cross Flows," J. Fluid Mech. 105, 397-425 (1981).
7. Schewe, G., "On the Force Fluctuations Acting on a Circular Cylinder inCrossflow from Subcritical up to Transitional Reynolds Numbers," J.Fluid Mech. 133, 265-285 (1983).
8. Cheung, J. C. K., and Melbourne, W. H., "Turbulence Effects on SomeAerodynamic Parameters of a Circular Cylinder at Supercritical
Reynolds Numbers," J. Wind Engineering and Industrial Aerodynamics 14,399-410 (1983).
9. King, R., "A Review of Vortex Shedding Research and Its Application,"Ocean Eng. 4, 141-171 (1977).
10. Bearman, P. W., and Wadcock, A. J., "The Interaction Between a Pair ofCircular Cylinders Normal to a Stream," J. Fluid Mech. 61, 499-511(1973).
11. Bokaian, A., and Geoola, F., "Wake-Induced Galloping of Two InterferingCircular Cylinders," J. Fluid Mech. 146, 383-415 (1984).
12. Kiya, M., Aire, M., Tamura, H., and Mori, H., "Vortex Shedding from TwoCircular Cylinders in Staggered Arrangement," J. of Fluids Eng. 102,102-173 (1980).

59
Distribution for ANL-85-35
Internal:
C. E. TillR. S. ZenoP. R. HuebotterM. W. Wambsganss (5)S. S. Chen (10)H. HalleJ. A. Jendrzejczyk (10)T. M. Mulcahy
S. K. ZussmanR. A. ValentinS. H. FistedisANL Patent Dept.ANL Contract FileANL Libraries (2)TIS Files (6)
External:
DOE-TIC, for distribution per UC-79k (121)Manager, Chicago Operations Office, DOEDirector, Technology Management Div., DOE-CHE. Gallagher, DOE-CHComponents Technology Division Review Committee:
P. Alexander, Flopetrol Johnston Schlumberger, HoustonD. J. Anthony, General Electric Co., San JoseA. A. Bishop, U. PittsburghB. A. Boley, Northwestern U.F. W. Buckman, Delian Corp., Monroeville, PAR. Cohen, Purdue U.J. Weisman, U. Cincinnati