Embed Size (px)
Citation preview

15th International Conference on Fluid Control, Measurements and Visualization
27-30 May 2019, Naples, Italy
Paper ID:203 1
Usteady Characteristics of Aerodynamic Forces on Circular cylinders in the
Critical Reynolds Number Range
Wenyong Ma1,2,*, Bocheng Huang2, Qingkuan Liu1, Deqian Zheng3
1 Innovation Center for Wind Engineering and Wind Energy Technology of Hebei Province, Hebei, 050043, China
2 School of Civil Engineering, Shijiazhuang Tiedao University, Hebei, 050043, China 3 School of Civil Engineering and Architecture, Henan University of Technology, Henan province, 450001,China
*corresponding author: [email protected]
Abstract The excitation mechanism of vibrations of circular cylinders in the critical Reynolds number range
remains unclear. It is related to the complicated aerodynamic force in the critical regimes, in which the three-
dimensional and unsteady characteristics are worthy of studying. In the present study, the wind pressure on a
circular cylinder in the entire critical Reynolds number range is measured. Aerodynamic force and wind pressure
distribution along the length of the cylinder and on circumference are discussed to reflect the three dimensional
characteristics. Meanwhile, the unsteadiness also revealed by variation of aerodynamic force and pressure in time.
Keywords: Circular cylinder, Critical Reynolds number, Wind tunnel test, Aerodynamic forces, Unsteadiness
characteristics
1 Introduction
In wind engineering, dry galloping was reported as a large amplitude vibration for a cable in cable-stay bridge
in dry condition[1]. The phenomena have been reproduced in wind tunnel tests by different research groups[2-
8], and they believe these vibrations strongly depend on the specific flow state in the critical Reynolds number
range.
The flow around a circular cylinder in the critical Reynolds number range is complicated due to the sensitivity
of the flow state to small disturbances or uncertainties[9]. In the critical range, the precritical regime (TrBL0),
one-bubble regime (TrBL1) and two-bubble regime successively occur in a narrow Reynolds number range.
Therefore, the transition of the flow states significantly influence the variation of aerodynamic forces in time
and space[10]. Moreover, the prediction of aerodynamic forces on the imperfect circular cylinder is very
difficult because the flow in the critical regime is very sensitive to even the subtle disturbances[11-13].
In the present study, the wind pressure on a circular cylinder in the critical Reynolds number range is measured
by a rigid sectional model in a wind tunnel to reveal the three-dimensional unsteady characteristics of
aerodynamic forces. The pressure distribution along the length of the cylinder and on the circumference are
discussed to show its three-dimensionalities. The variation of aerodynamic forces and stagnation point with
time are also presented to illustrate the unsteadiness of the flow state.
2 Experimental setup
Tests were carried out in a wind tunnel with a working section of 5 m (length) × 2.2 m (width)×2 m (height). The wind
velocity was up to 80 m/s in the working section. When the wind velocity is approximately 63 m/s, the turbulence intensity
was lower than 0.5%, and the difference in the wind velocity distribution over the section is less than 1%.
In the present study, the circular cylinder model was a custom-made plexiglass pipe with a length L=2 m and diameter
D=150 mm, as shown in Fig. 1 (a),. The blockage ratio was approximately 7.5%. A total of 312 pressure taps were
arranged in four lines along the length and on five rings around the circumference. As shown in Fig. 1 (b), the five rings
were termed A, B, C, D and E. Ring C was in the middle of the cylinder, and rings B and D were 300 mm and 150 mm
from ring C on both sides. Rings A and E were 270 mm and 300 mm from ring B and ring D, respectively. On each ring,
40 pressure taps were uniformly distributed, and each tap was indicated by the angular position θ, as shown in Fig. 1
(c). The four lines were at θ=0°, 90°, 180°, and 270°, respectively. Twenty-eight pressure taps were arranged to start from
28 mm from the end of the cylinder and uniformly distributed with a spacing of 72 mm.
To reduce the free end effects on the flow state, a circular end plate was used at the two ends at distances of 1910mm.

15th International Conference on Fluid Control, Measurements and Visualization
27-30 May 2019, Naples, Italy
Paper ID:203 2
The aspect ratio is approximately 12.73. The diameter of the end plate was chosen as 600 mm, four times the diameter of
the cylinder, De=4D.
The approaching wind faced the pressure tap with θ=0°. The wind velocity varied from 4.55 m/s to 49.02 m/s at various
intervals, corresponding to Reynolds numbers Re=0.47×10⁵-5.07×10⁵ which cover the entire range of the critical
Reynolds numbers. The wind pressure was measured instantaneously by pressure sensors (ESP-64Hd, Measurement
Specialties (formerly PSI), Hampton, VA, USA), which were located inside of the cylinder to reduce the length of the
pressure tubes. In the present study, the tubes were 530mm, 780mm, 930mm, 790mm and 620mm in length for rings A,
B, C, D and E, and 930mm in length for the pressure taps along the four lines. The recorded wind pressure was corrected
by the theoretical frequency response function of each tube to eliminate the distortion induced by the pressure tube
systems. In the present study, the aerodynamic forces were estimated by integrating the wind pressures.
Fig. 1 Schematics of the wind tunnel arrangement and the model with the main parameters indicated: (a) model and
pressure tap arrangement, (b) the definition of parameters.
3 Results
3.1 Variation of aerodynamic forces with Reynolds number
To clarify the flow states, the variation of average drag and lift coefficients at the middle of the cylinder (Ring
C) with Reynolds number are shown in Fig.2 (a) and (b). The shadow in Fig.2 also shows a range of mean
value plus and minus the standard deviation, which reflects the fluctuation. As can be seen in Fig.2 (a), the
drag coefficients decrease with the increasing Reynolds number until a plateau from Re=4.0×10⁵, which
presents the flow reattaches as both sides of the cylinder. More clearly, when flow reattachs at one side of the
cylinder (TrBL1 regime), an average non-zero lift coefficient occurs, as shown in Fig.2 (b) from Re=2.6×10⁵-
4.0×10⁵. The variation of average aerodynamic force coefficients with Reynolds number indicates clearly that
the flow experience sub-critical (TrSL), pre-critical (TrBL0),one-bubble (TrBL1) and two-bubble (TrBL2)
regimes. Fig.2 (a) and (b) also show the fluctuation of drag and lift coefficients reduce with increasing
Reynolds number except at the beginning of TrBL1.
Fig 2. (c) shows the variation of base pressure coefficients at leeward of Ring C (θ=180°). The increases of
base pressure coefficient with Reynolds number reflect that the wake becomes weaker at higher Reynolds
number. The motion of stagnation point varies with flow states. Average, maximum and minimum position of
stagnation point in 60 seconds is shown in Fig. 2 (d) at various Reynolds number to show the influence of flow
states on stagnation point. As expected, the average stagnation points move approximately 3° non-reattach side
in TrBL1 regime. This means that that flow keeps asymmetric from windward to leeward in TrBL1 regime.
Fig.2 (d) also reflects that stagnation points swings in larger range from approximately -6° to 6° in the subcritical regime and narrower range from around -2° to 1° in TrBL2 regime.
2.2m
2m
Le=1.91m
L=2m
1m
570mm
A B C D E
Wind tunnel Walls
End plate De=4DModel D=150mm
Pressure taps
θ
θ =0º
θ =90º
θ =180º
θ =270º
CD
CL
40 pressure taps at each ring for ring A, B, C, D and E
28 pressure taps at each line at θ =0º, 90º, 180º and 270º
(b) (a)

15th International Conference on Fluid Control, Measurements and Visualization
27-30 May 2019, Naples, Italy
Paper ID:203 3
Fig. 2 Effects of Reynolds number on (a) drag coefficients, (b) lift coefficients, (c) Base pressure coefficients, and (d)
stagnation points.
3.2 Pressure distribution in space
Mean wind pressure distribution along the length of the cylinder at four lines, θ=0°(windward), 90°(downside), 180° (leeward) and 270°(upside), are shown in Fig.3. Meanwhile, the wind pressure distribution on the circumference at different rings at various Reynolds numbers are shown in Fig. 4, in which the shadow represents mean pressure coefficients plus and minus the standard deviation. In the subcritical Reynolds number, as shown in Fig.3 (a) at Re=2.01×10⁵, pressure coefficients at four lines are
uniformly distributed along the length of the cylinder except for approximately 0.05L next to the end plates. This
implies a two-dimensional flow state in the subcritical regime. The corresponding wind pressure distribution on
circumferences at ring C is shown in Fig.4, first at first line. With the increase of the Reynolds number, the difference
of wind pressure along the length of the cylinder at both sides (θ=90° and 270°) occurs, as shown in Fig. 3 (b). The
onset of stronger negative pressure at θ=90°or 270° in certain ranges reveals that flow in these ranges may enter TrBL1 regime. An example is shown in Fig.4, second at first line. The flow reattachs at one side of the cylinder and creates a strong negative pressure on this side. With a further increase in Reynolds number, the reattachment occurs at more locations, as shown in Fig. 3 (c). Interestingly, as shown in Fig. 3 (d) and corresponding wind pressure coefficients distribution at ring A and D, the reattachments occur at different sides of the cylinder along the length of the cylinder, such as separation bubble on downside at ring A and upside at ring D. This illustrates strong three-dimensional characteristics of the flow in the critical regime. This may be induced by the difference of oncoming flow or surface condition of the model itself, but we believe it is more likely to be attributed to the unsteadiness of the flow state in the specific regime. The similar phenomena also occur at Re=3.79×10⁵,
as shown in Fig. 3 (e) and Fig. 4 at ring C and E. Once the flow reattaches at both sides for the entire cylinder,
the wind pressure coefficients distribution is like Fig. 3 (f) along the length and Fig.4 at ring A and C. It should
be highlighted that in this regime, the flow is also three dimensional.
1.0 1.5 2.0 2.5 3.0 3.5 4.0 4.5 5.00.0
0.2
0.4
0.6
0.8
1.0
1.2
1.4
1.6
CD
CDr
CD
Dra
g c
oef
fici
ents
Re(105)
1.0 1.5 2.0 2.5 3.0 3.5 4.0 4.5 5.0-1.0
-0.8
-0.6
-0.4
-0.2
0.0
0.2
0.4
0.6
0.8
1.0
Lif
t co
effi
cien
ts
Re(105)
CL
CLr
CL
1.0 1.5 2.0 2.5 3.0 3.5 4.0 4.5 5.0-2.0
-1.8
-1.6
-1.4
-1.2
-1.0
-0.8
-0.6
-0.4
-0.2
Bas
e p
ress
ure
co
effi
cien
ts
Re(105)
CPB
CPBr
CPB
1.0 1.5 2.0 2.5 3.0 3.5 4.0 4.5 5.0-8
-6
-4
-2
0
2
4
6
8
0 ()
Re (105)
Average Maximum Minimum
(a) (b)
(c) (d)

15th International Conference on Fluid Control, Measurements and Visualization
27-30 May 2019, Naples, Italy
Paper ID:203 4
Fig. 3 Mean wind pressure coefficient distribution along the length of the cylinder at Re= (a) 2.01×10⁵, (b) 3.30×10⁵,
(c) 3.38×10⁵, (d) 3.54×10⁵, (e) 3.79×10⁵, and (f) 4.04×10⁵.
-0.5 -0.4 -0.3 -0.2 -0.1 0.0 0.1 0.2 0.3 0.4 0.5-3.5
-3.0
-2.5
-2.0
-1.5
-1.0
-0.5
0.0
0.5
1.0
Rings: EDCBA End plate
CP
x/L
Anglar position 0 90 180 270
End plate
-0.5 -0.4 -0.3 -0.2 -0.1 0.0 0.1 0.2 0.3 0.4 0.5-3.5
-3.0
-2.5
-2.0
-1.5
-1.0
-0.5
0.0
0.5
1.0
CP
x/L
End plate Rings: A B C D E End plate
Anglar position 0 90 180 270
-0.5 -0.4 -0.3 -0.2 -0.1 0.0 0.1 0.2 0.3 0.4 0.5-3.5
-3.0
-2.5
-2.0
-1.5
-1.0
-0.5
0.0
0.5
1.0
CP
x/L
Rings: EDCBA End plate
Anglar position 0 90 180 270
End plate
-0.5 -0.4 -0.3 -0.2 -0.1 0.0 0.1 0.2 0.3 0.4 0.5-3.5
-3.0
-2.5
-2.0
-1.5
-1.0
-0.5
0.0
0.5
1.0
CP
x/L
Rings: EDCBA End plate
CP
Anglar position 0 90 180 270
End plate
-0.5 -0.4 -0.3 -0.2 -0.1 0.0 0.1 0.2 0.3 0.4 0.5-3.5
-3.0
-2.5
-2.0
-1.5
-1.0
-0.5
0.0
0.5
1.0
CP
x/L
Rings: EDCBA End plate
Anglar position 0 90 180 270
End plate
-0.5 -0.4 -0.3 -0.2 -0.1 0.0 0.1 0.2 0.3 0.4 0.5-3.5
-3.0
-2.5
-2.0
-1.5
-1.0
-0.5
0.0
0.5
1.0
CP
x/L
Rings: EDCBA End plate
Anglar position 0 90 180 270
End plate
Ring C
Re=2.01×10⁵Ring C
Re=3.30×10⁵
Ring A
Re=3.54×10⁵
Ring D
Re=3.54×10⁵
Ring C
Re=3.79×10⁵Ring E
Re=3.79×10⁵
Ring A
Re=4.04×10⁵
Ring C
Re=4.04×10⁵
(a) (b)
(c) (d)
(e) (f)

15th International Conference on Fluid Control, Measurements and Visualization
27-30 May 2019, Naples, Italy
Paper ID:203 5
Fig. 4 Wind pressure coefficient distribution on circumference at different rings at various Reynonls number.
3.3 Variation of aerodynamics in time
Fig. 5 shows the time history of lift coefficient (Fig.5 (a) and (c)) at ring C at Re=2.71×10⁵ and the
corresponding Morlet wavelets (Fig.5 (b)) and instantanouse wind pressure coefficients distribution (Fig. 5
(d)).
Fig. 5 Variation of aerodynamic at ring C at Re=2.71×10⁵ in time for (a) lift coefficient in 60 seconds, (b) Complex
Morlet wavelets of lift coefficient, (c) lift coefficients in 10 seconds and (d) instantanous pressure coefficients
distribution at nine time points.
In Fig. 5 (a), the lift coefficients sudden change with them. These jumps reflect a quick change of the flow
states. In this case, the non-zero mean lift coefficients from 0s to 12.6s present at reattachment at the upside of
(a)
(b)
(c)
(d)
15th International Conference on Fluid Control, Measurements and Visualization
27-30 May 2019, Naples, Italy
Paper ID:203 6
the cylinder. The return of lift coefficients to zero implies the disattachement. These sudden change of flow
state also can be revealed in Fig. 5 (b) by Morler wavelets. As can be seen, dominate reduced frequency induced
by vortex shedding becomes weak when the flow reattaches because the reattachment stops the communication
of separated flow at both sides of the cylinder in the wake. Fig. 5 (c) and (d) show the details of the change in
lift coefficient in 19.6s to 20.6s. The wind pressure changes on the whole circumference when the flow is
controlled by vortex shedding, as shown in t1, t2, and t3. Once the flow reattaches the pressure fluctuates at
the separation region instead of the whole circumference.
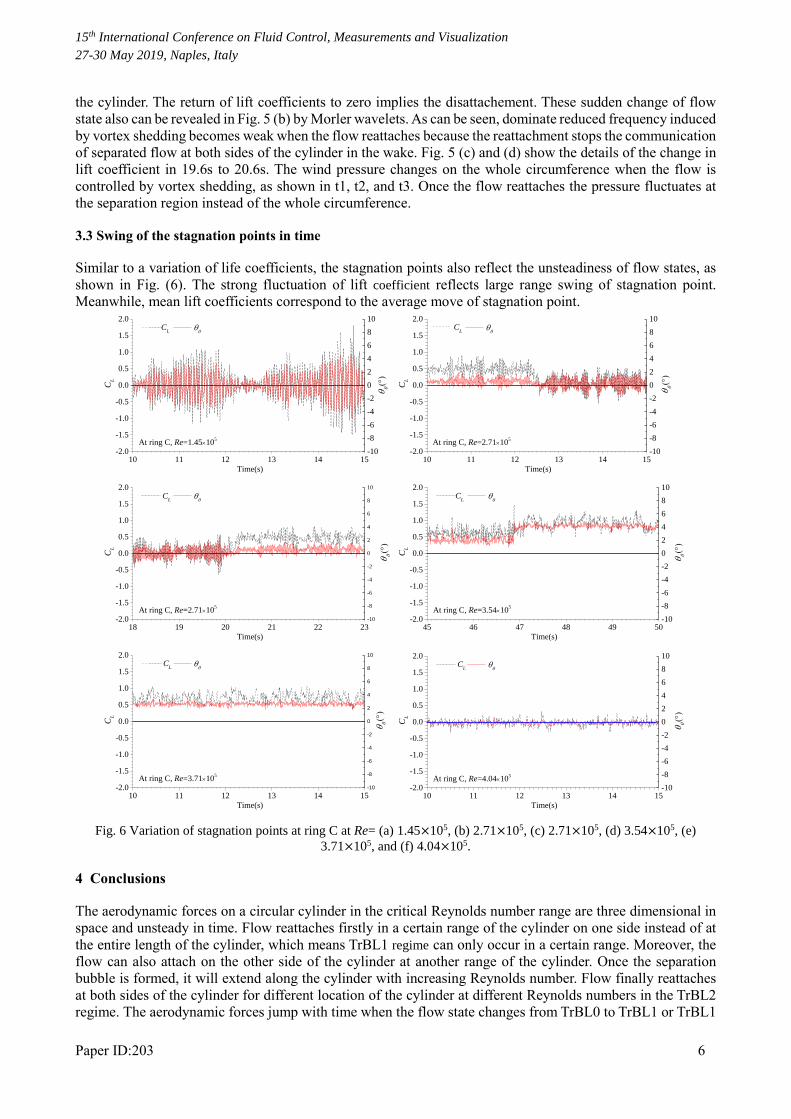
3.3 Swing of the stagnation points in time
Similar to a variation of life coefficients, the stagnation points also reflect the unsteadiness of flow states, as
shown in Fig. (6). The strong fluctuation of lift coefficient reflects large range swing of stagnation point.
Meanwhile, mean lift coefficients correspond to the average move of stagnation point.
Fig. 6 Variation of stagnation points at ring C at Re= (a) 1.45×10⁵, (b) 2.71×10⁵, (c) 2.71×10⁵, (d) 3.54×10⁵, (e)
3.71×10⁵, and (f) 4.04×10⁵.
4 Conclusions
The aerodynamic forces on a circular cylinder in the critical Reynolds number range are three dimensional in
space and unsteady in time. Flow reattaches firstly in a certain range of the cylinder on one side instead of at
the entire length of the cylinder, which means TrBL1 regime can only occur in a certain range. Moreover, the
flow can also attach on the other side of the cylinder at another range of the cylinder. Once the separation
bubble is formed, it will extend along the cylinder with increasing Reynolds number. Flow finally reattaches
at both sides of the cylinder for different location of the cylinder at different Reynolds numbers in the TrBL2
regime. The aerodynamic forces jump with time when the flow state changes from TrBL0 to TrBL1 or TrBL1
10 11 12 13 14 15-2.0
-1.5
-1.0
-0.5
0.0
0.5
1.0
1.5
2.0
CL
Time(s)
CL
At ring C, Re=1.45105
-10
-8
-6
-4
-2
0
2
4
6
8
10
()
10 11 12 13 14 15-2.0
-1.5
-1.0
-0.5
0.0
0.5
1.0
1.5
2.0
CL
Time(s)
CL
-10
-8
-6
-4
-2
0
2
4
6
8
10
()
At ring C, Re=2.71105
18 19 20 21 22 23-2.0
-1.5
-1.0
-0.5
0.0
0.5
1.0
1.5
2.0
CL
Time(s)
CL
-10
-8
-6
-4
-2
0
2
4
6
8
10
()
At ring C, Re=2.71105
45 46 47 48 49 50-2.0
-1.5
-1.0
-0.5
0.0
0.5
1.0
1.5
2.0
CL
Time(s)
CL
-10
-8
-6
-4
-2
0
2
4
6
8
10
()
At ring C, Re=3.54105
10 11 12 13 14 15-2.0
-1.5
-1.0
-0.5
0.0
0.5
1.0
1.5
2.0
CL
Time(s)
CL
-10
-8
-6
-4
-2
0
2
4
6
8
10
()
At ring C, Re=3.71105
10 11 12 13 14 15-2.0
-1.5
-1.0
-0.5
0.0
0.5
1.0
1.5
2.0
CL
Time(s)
CL
-10
-8
-6
-4
-2
0
2
4
6
8
10
At ring C, Re=4.04105
()

15th International Conference on Fluid Control, Measurements and Visualization
27-30 May 2019, Naples, Italy
Paper ID:203 7
to TrBL2 which correspond to the formation of two separation bubbles. These jumps reflect strong
unsteadiness in aerodynamic forces because the reattachments are intermittent during the formation of a stable
separation bubble.
Acknowledgments
The authors gratefully acknowledge the support of the National Natural Science Foundation of China (Grant
No. 51778381 and 51408196), Natural Science Foundation of Hebei Province (Grant No. E2017210107 and
ZD2018063) and Collaborative Innovation Centre of Preventing Disasters and Reducing Damages for Large
Infrastructures in Hebei Province.
References
[1] Matsumoto, M., T. Yagi, H. Hatsuda, T. Shima, M. Tanaka,H. Naito (2010), Dry galloping characteristics
and its mechanism of inclined/yawed cables. Journal of Wind Engineering and Industrial Aerodynamics.
vol. 98 pp 317-327.
[2] Ma, W., Q. Liu,M. Matsumoto (2019), Excitation of the large-amplitude vibrations of a circular cylinder
under normal wind conditions in the critical Reynolds number range. Journal of fluids and structures. vol.
84 pp 318-328.
[3] Nikitas, N.,J.H.G. Macdonald (2015), Aerodynamic Forcing Characteristics of Dry Cable Galloping at
Critical Reynolds Number. European Journal of Mechanics - B/Fluids. vol. 49 pp 243-249.
[4] Nikitas, N., J.H.G. Macdonald, J.B. Jakobsen,T.L. Andersen (2012), Critical Reynolds number and
galloping instabilities: experiments on circular cylinders. Exp Fluids. vol. 52 pp 1295-1306.
[5] Jakobsen, J.B., T.L. Andersen, J.H.G. Macdonald, N. Nikitas, G.L. Larose, M.G. Savage,B.R. McAuliffe
(2012), Wind-induced response and excitation characteristics of an inclined cable model in the critical
Reynolds number range. Journal of Wind Engineering and Industrial Aerodynamics. vol. 110 pp 100-112.
[6] Zuo, D.,N.P. Jones (2009), Wind tunnel testing of yawed and inclined circular cylinders in the context of
field observations of stay-cable vibrations. Journal of Wind Engineering and Industrial Aerodynamics.
vol. 97 pp 219-227.
[7] Cheng, S., G.L. Larose, M.G. Savage, H. Tanaka,P.A. Irwin (2008), Experimental study on the wind-
induced vibration of a dry inclined cable Part I: Phenomena. Journal of Wind Engineering and Industrial
Aerodynamics. vol. 96 pp 2231-2253.
[8] Cheng, S., P.A. Irwin,H. Tanaka (2008), Experimental study on the wind-induced vibration of a dry
inclined cable Part II: Proposed mechanisms. Journal of Wind Engineering and Industrial Aerodynamics.
vol. 96 pp 2254-2272.
[9] Ma, W., Q. Liu, J.H.G. Macdonald, X. Yan,Y. Zheng (2019), The effect of surface roughness on
aerodynamic forces and vibrations for a circular cylinder in the critical Reynolds number range. Journal
of Wind Engineering & Industrial Aerodynamics. vol. 187 pp 61-72.
[10] Zdravkovich, M.M. (1997), Flow Around Circular Cylinders Vol 1: Fundamentals[M]. Vol. I., New York:
Oxford University Press.
[11] Bearman, P.W. (1969), On vortex shedding from a circular cylinder in the critical Reynolds number
region. Journal of fluid Mechanics. vol. 37 pp 577-587.
[12] Matteoni, G.,C.T. Georgakis (2012), Effects of bridge cable surface roughness and cross-sectional
distortion on aerodynamic force coefficients. Journal of Wind Engineering and Industrial Aerodynamics.
vol. 104–106 pp 176-187.
[13] Matteoni, G.,C.T. Georgakis (2015), Effects of surface roughness and cross-sectional distortion on the
wind-induced response of bridge cables in dry conditions. Journal of Wind Engineering and Industrial
Aerodynamics. vol. 136 pp 89-100.