Embed Size (px)
Citation preview
Flow Measurement and Instrumentation 17 (2006) 225–235www.elsevier.com/locate/flowmeasinst
icity anda
nd vortexlocity are
Flow structure in thedownstream of square and circular cylinders
Muammer Ozgoren∗
Selcuk University, Faculty of Engineering and Architecture, Department of Mechanical Engineering, 42070, Konya, Turkey
Received 10 March 2005; received in revised form 18 July 2005; accepted 21 November 2005
Abstract
In this experimental work, a technique of digital particle image velocimetry (DPIV) is employed to characterize instantaneous vorttime-averaged velocity, vorticity, root mean square (rms) velocities, Reynolds stress correlationsand phase-averaged contours in the downstremof circular, sharp-edged square and 45◦ orientated square cylinders in a uniform flow. Strouhal numbers for 550≤ Re≤ 3400 are calculated fromwake flow patterns. Shear layers surrounding the recirculation bubble region behind the cylinder are discussed in terms of flow physics aformation lengths of large-scale K´arman vortices. Enhancement levels of Reynolds stress correlations associated with cross-stream veclarified. Finally, flow structuresdepending on the cylinder geometry and Reynolds number are interpreted with quantitative representations.c© 2005 Elsevier Ltd. All rights reserved.
Keywords: Square cylinder; Circular cylinder; DPIV; Vortex shedding;Wake region; Strouhal number
tioontas,unelhewncryer
wT
old
24
esult
derear-larnderduectionovever,m
e
ser
rs.he
wedhenngee of
1. Introduction
The motion of fluid passing circular or square cross-seccylinders is encountered in numerous industrial applicatias well as offshore and environmental settings, includingbuildings and structures such as bridges, chimneys, trash rackcooling towers, heat exchangers, etc. When fluid flows aroany bluff body, the vortices are alternatively shed and a wknown Karman vortex street is formed in the wake of tcylinder. The oscillating wake rolls up into two staggered roof vortices with opposite senses of rotation. The frequeof vorticity pairs is a function of velocity, cylinder diameteand Reynolds number [1]. The vortex shedding frequencof the circular cylinder is normalized by Strouhal numbSt = fsD/U∞, where fs is the dominant vortex-sheddingfrequency,D is the cylinder diameter andU∞ is the freestreamflow velocity. The vortex shedding frequencies and floconfigurations are major issues for the design of structures.flow in the near-wake region behind the cylinder, incorporatingthe vortex formation region,plays an important role indetermining the steady and unsteady forces acting on the bPeriodic vortex shedding patterns and fluctuating velocity fie
∗ Tel.: +90 332 223 1912 or cell phone: +90 555 451 70 80; fax: +90 33206 35 or +90 332 241 06 51.
E-mail addresses:[email protected], [email protected].
0955-5986/$ - see front matterc© 2005 Elsevier Ltd. All rights reserved.doi:10.1016/j.flowmeasinst.2005.11.005
ns,ll
dl-
sy
,
he
dy.s
1
behind the bluff bodies can cause structural damage as a rof periodic surface loading, acoustic noise and drag forces [1,2].Most work has been done on the flow passing a circular cylin(CC) rather than a square cylinder (SC). Even though their nwake flow structures are expected to be topologically simito one another, the reasons for flow separation on the cylisurfaces are totally different. That is, flow separation occursto an adverse pressure gradient in the downstream direfor the CC and the separation points on the CC surface mback and forth depending on the Reynolds number. Howethe locations of the separation points are fixed at the upstreacorners of the SC due to the abrupt geometrical changes.
Relevant investigations for the SC and the CC include thosof Okajima [3], Obasaju [4], Durao et al. [5], Lyn et al. [6],Saha et al. [7], Dutta et al. [8], Chen et al. [9], Sarioglu andYavuz [10] and Roshko [11] using measurement techniquesuchas dye visualization, point-wise hot-wire/film and lasDoppler velocimetry (LDV) for various Reynolds numbeOkajima [3] carried out an experimental study of flow past tSCas well as the rectangular cylinder for 70≤ Re≤ 20,000 todetermine the vortex shedding frequencies. The results shothat there was an abrupt change in Strouhal number wthe aspect ratio of the cylinder was reduced to the ra2–3. Strouhal numbers for the SC with an increasing anglincidence from 0◦ to 45◦ were examined using ahot-wire probein a closed circuit wind-tunnel forRe= 10,000 by Obasaju [4].
226 M. Ozgoren / Flow Measurement and Instrumentation 17 (2006) 225–235
in
s os ogyityor
ldsrio
atonoucieerslmtinebeThrewefo
be
rein
ofrtet a
the
acf a
ofomanln2
nagheeblethallyokxe
d
tionavepts,luff
etionhot-s,r-
nsratedated
ctsr toofline
rootare
s ofeenare
ke,beenCC.onencal
ee-
sityrom
.isct
nneltoTheas
lass
heetera
rdasat ace,
LDV measurements were conducted for flow past the SCwater tunnel forRe = 14,000 andRe = 21,400 [5,6]. Duraoet al. [5] separated the periodic and random componentvelocity fluctuations around the SC. The experiment resultLyn et al. [6] showed a relationship between the flow topoloand turbulence distribution. They clearly distinguished vorticsaddles and streamline saddles. Measurements were repof two components of velocity in the wake for Reynonumbers of the SC such as 1340, 4990 and 9980 for vainclinations such as 0◦, 22.5◦, 30◦, 45◦, and60◦ by using smokevisualization and a hot-wire anemometer [7,8]. Saha et al. [7]stated that, though the overall flow past the SC resembled ththe CC, there were major differences in terms of the separatimechanism and the related integral parameters such as Strnumber, lift and drag-coefficient. Vortex-shedding frequenand surface pressures of the SC, CC and rectangular cylinda wind tunnel were investigated experimentally using hot-fimeasurement techniques [9,10]. They determined the dominanpeak location of the vortex shedding frequency and obtaStrouhal numbers in the range of various Reynolds numfor the CC, SC and oriented square cylinder (OSC).various aspects of the quasi two-dimensional (2-D) and thdimensional (3-D) structures of the shear layer vortices, asas the correlation of their frequency with Reynolds numberthe SC, were alsogiven by Roshko [11].
In recent decades, flow structures around CC hasinvestigated quantitatively by Lin et al. [12]. They employedthe film based particle image velocimetry technique at thvalues ofRe = 1000, 5000 and 10,000 for the CC to obtainstantaneous flow patterns. Theystated that representationsvelocity, vorticity and streamlines showed a decrease in voformation length with increasing Reynolds number. Noca e[13] accomplished an investigation on the concept of vortexformation length in the wake of the CC by measuringlocation of some easily identifiable flow features for 300<Re< 4000 and different aspect ratios. An alternative approwas to interpret the vortex formation length on the basis ocharacteristic velocity fluctuation in the streamwise directiongiven first by Bloor and Gerrard [14] and Szepessy andBearman [15]. The large variation in the formation lengthKarman vortices over the range of Reynolds number fr5000 to 40,000 was observed qualitatively by SchillerLinke [16]. Balachandar et al. [17] applied direct numericasimulations at the lowerRenumber and large-eddy simulatioat the higher Reynolds number over several differentD bluff bodies for 250 ≤ Re ≤ 140,000. They alsoperformed experiments to support their numerical solutioThey investigated properties of the time- and phase-avermean wake recirculation region in the separated flows. Texplained the distribution of Reynolds stress and pressurrelation to the mean wake recirculation region (wake buband vortex formation length. The response of the SCwas free to rotate in a uniform flow was solved numericausing the 2-D incompressible time dependent Navier–Stequation, which was also examined experimentally on fiand freely rotating cylinders for 1000≤ Re ≤ 10,000 byZaki et al. [18]. In order to obtain flow characteristics an
a
ff
ted
us
of
halsin
drsee-llr
en
e
xl.
h
d
-
s.edyin)t
esd
develop reliable computational methods, numerical simulastudies of 2-D and 3-D unsteady flows around the SC hbeen addressed [19–24]. Reviews and assessments of concenumerical simulations, and experimental observations for bbodies are given by Williamson [1], Ahlborn et al. [25],Knisely [26] and King [27]. Although many of the abovinvestigations are experimental and based on flow visualizaand/or point-wise measurement techniques such as LDV orwire anemometry to obtain instantaneous flow characteristica few issues have remained unresolved for this class of neawake flows. Specifically, none of the foregoing investigatioattempted to measure quantitatively the details of the sepashear layers and the overall properties of the flow in separregions for the SC using DPIV.
The purpose of this study is to investigate the effeof the cross-section of the vertical cylinder perpendiculathe oncoming flow and the Reynolds number in termsinstantaneous and time-averaged velocity, vorticity, streamtopology, and Reynolds stress correlations along withmean square (rms) velocity. First of all, Strouhal numberscalculated for the sake of comparison. The physical originloading coefficients and flow-structure interactions have binterpreted. Phase-averaged vorticity and velocity patternsexamined. Moreover, the turbulence properties of the wamost importantly the Reynolds stress correlations, haveaddressed in relation to Reynolds numbers for the SC andFinally, interpretation of the effect of the Reynolds numberthe vortex formation length and width of the wake size has bedetermined quantitatively. Informative data for both numerisimulations and designers have been provided.
2. Experimental system and technique
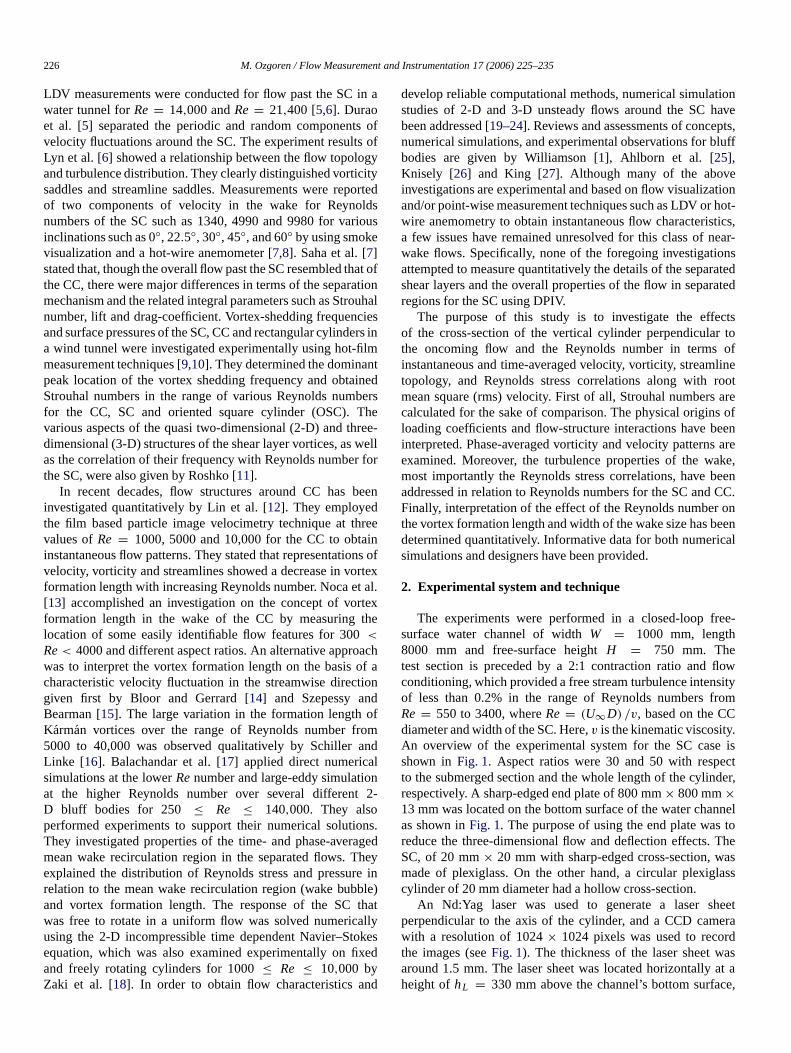
The experiments were performed in a closed-loop frsurface water channel of widthW = 1000 mm, length8000 mm and free-surface heightH = 750 mm. Thetest section is preceded by a 2:1 contraction ratio and flowconditioning, which provided a free stream turbulence intenof less than 0.2% in the range of Reynolds numbers fRe = 550 to 3400, whereRe = (U∞D) /v, based on the CCdiameter and width of the SC. Here,v is the kinematic viscosityAn overview of theexperimental system for the SC caseshown in Fig. 1. Aspect ratios were 30 and 50 with respeto the submerged section and the whole length of the cylinder,respectively. A sharp-edged end plate of 800 mm× 800 mm×13 mm was located on the bottom surface of the water chaas shown inFig. 1. Thepurpose of using the end plate wasreduce the three-dimensional flow and deflection effects.SC, of 20 mm× 20 mm with sharp-edged cross-section, wmade of plexiglass. On the other hand, a circular plexigcylinder of 20 mm diameter had a hollow cross-section.
An Nd:Yag laser was used to generate a laser sperpendicular to the axis of the cylinder, and a CCD camwith a resolution of 1024× 1024 pixels was used to recothe images (seeFig. 1). The thickness of the laser sheet waround 1.5 mm. The laser sheet was located horizontallyheight ofhL = 330 mm above the channel’s bottom surfa
M. Ozgoren / Flow Measurement and Instrumentation 17 (2006) 225–235 227
ete
elase.1h
orsu
therdh-
eoforng
lua),
ineewa
e. Tteld,byagizeto
int
ngap,n
andthe
of
IV
was
ing
ar-
ls inin
astf
heber
nedoustofor
ssandantand
ricalFTcted
ere,ted,ion
In1,Thepperareely.
C isons
Fig. 1. Schematic of the experimental system and definition of the paramfor the square cylinder.
while the water height washW = 600 mm in all cases. Thseeding particles in the flow were silver-coated hollow gspheres with a diameter of 15µm. The specific gravity of thseeding particles, provided by Potters Industries Inc., was 1The densities of the particles and water were close enougthat the distribution of particles in suspension remained uniffor several hours. A Dantec DPIV system was used to meavelocity vectors. In image processing, a spot size of 32× 32pixels was used to allow effective interrogation. Duringinterrogation process, an overlap of 50% was employed in oto satisfy the Nyquist criterion. Furthermore, to satisfy the higimage-density criterion, the interrogation window typicallycontained 20–30 particles per image. Finally, 200 instantanvelocity vector fields were collected at the rate of 15 Hzeach Reynolds number. The time delay between pulses rafrom 1 ms to 12 ms. In-house software was used to evaand remove inappropriate displacement vectors (less than 1%caused by shadows, reflections, or laser sheet distortionsflow field and replaced by using bilinear interpolation betwsurrounding vectors in the post-processing step. The fieldthen smoothed by a Gaussian weighted averaging techniquminimize distortion of the velocity field, a smoothing parameof σ = 1.3 was chosen. After producing the vector fiethe vorticity patterns of the wake flow were determinedusing a finite difference scheme. For all the experiments, immagnification was 1:5.91, which yielded an effective grid sof 2.75 mm× 2.75 mm in the physical plane of the laser shecorresponding to 3844 velocity vectors. The overall fieldview was 171 mm× 171 mm (8.5D × 8.5D) in all cylinders.
Adrian [28] and Westerweel [29] provided very detailedinformation about particle image velocimetry. The uncerta
rs
s
0.somre
er
us
edte
thenso
r
ee,f
y
factors for velocity measurement and vorticity calculationin the DPIV method mainly comprised of the seediparticle size, non-uniform particle distribution, particle overlunmatched particlecorrelations, out of laser plane motio(bias and random errors), interrogation window size,electronic and optical imaging noise. The details ofeffects of these factors can be found in the studiesAdrian [28], Westerweel [29], Keane and Adrian [30],Fouras and Soria [31], and Hart [32]. Factors contributingto uncertainty in the velocity measurement using the DPtechnique were critically assessed, Westerweel [29] concludingthat uncertainty estimation in the velocity measurementless than 2%.
3. Results and discussion
3.1. Spectral analysis and calculation of vortex sheddfrequency
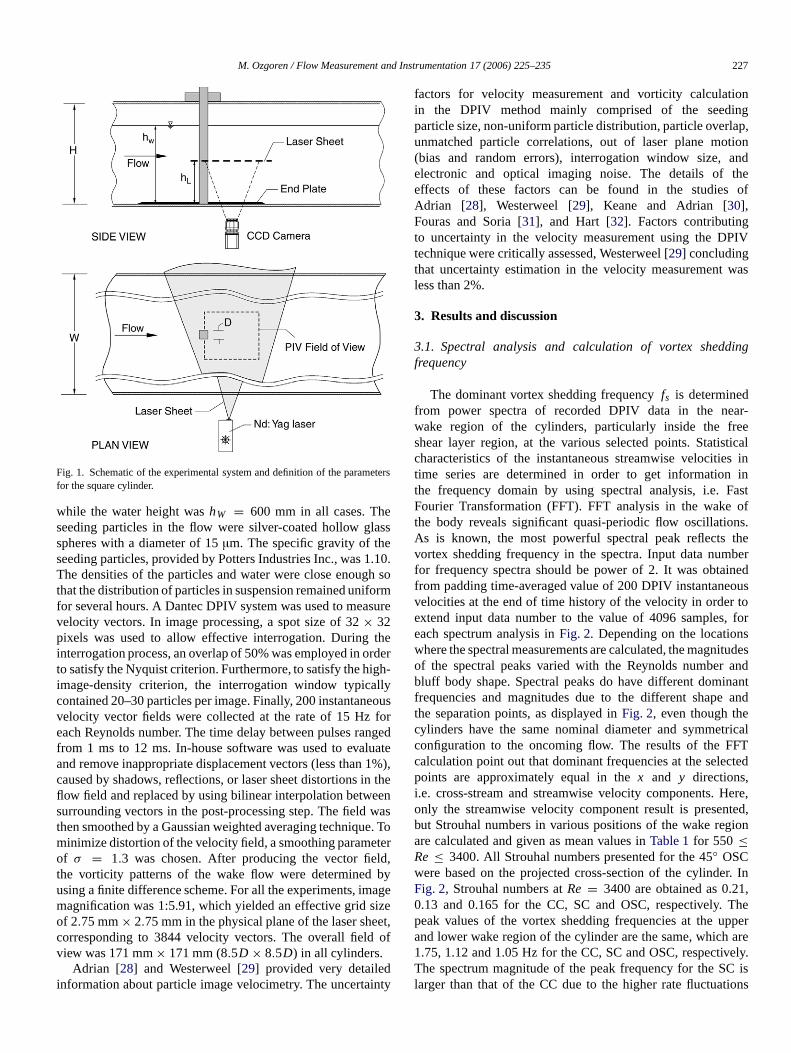
The dominant vortex shedding frequencyfs is determinedfrom power spectra of recorded DPIV data in the newake region of the cylinders, particularly inside the freeshear layer region, at the variousselected points. Statisticacharacteristics of the instantaneous streamwise velocitietime series are determined in order to get informationthe frequency domain by using spectral analysis, i.e. FFourier Transformation (FFT).FFT analysis in the wake othe body reveals significant quasi-periodic flow oscillations.As is known, the most powerful spectral peak reflects tvortex shedding frequency in the spectra. Input data numfor frequency spectra should be power of 2. It was obtaifrom padding time-averaged value of 200 DPIV instantanevelocities at the end of time history of the velocity in orderextend input data number to the value of 4096 samples,each spectrum analysis inFig. 2. Depending on the locationwhere the spectral measurements arecalculated, the magnitudeof the spectral peaks varied with the Reynolds numberbluff body shape. Spectral peaks do have different dominfrequencies and magnitudes due to the different shapethe separation points, as displayed inFig. 2, even though thecylinders have the same nominal diameter and symmetconfiguration to the oncoming flow. The results of the Fcalculation point out that dominant frequencies at the selepoints are approximately equal in thex and y directions,i.e. cross-stream and streamwise velocity components. Honly the streamwise velocity component result is presenbut Strouhal numbers in various positions of the wake regare calculated and given as mean values inTable 1for 550 ≤Re ≤ 3400. All Strouhal numbers presented for the 45◦ OSCwere based on the projected cross-section of the cylinder.Fig. 2, Strouhal numbers atRe = 3400 are obtained as 0.20.13 and 0.165 for the CC, SC and OSC, respectively.peak values of the vortex shedding frequencies at the uand lower wake region of the cylinder are the same, which1.75, 1.12 and 1.05 Hz for the CC, SC and OSC, respectivThe spectrum magnitude of the peak frequency for the Slarger than that of the CC due to the higher rate fluctuati
228 M. Ozgoren / Flow Measurement and Instrumentation 17 (2006) 225–235
t).
s
tf tersthal
moTh
%
orthained
renceent
entalthe
and
reboutrms
ions
e
erne
tices
isederear
the
earhisfromders
ofts
ointseam
fakethichorce.ke
beries
e in
Fig. 2. Time history of instantaneous streamwise velocity componentu (mm/s)against timet (s) and spectrum analysisSu at denoted point with black donuon the small image atRe= 3400 for CC (top), SC (middle) and OSC (bottom
originating from sharp-edged corners, as displayed inFig. 2.The difference between theSt values for theCC, SC and theOSC might be explained by the different nature of their flowFor the SC atan angle of incidence (0◦ and 45◦) to the flowand for the CC, the Strouhal numbers given inTable 1weremeasured by a number of authors.Table 1clearly indicates thathe present results are in close agreement with most oprevious experimental and numerical results for all cylindThe results of the present work for the SC agree well withresults of [3,9,22]. King [27] reported that the non-dimensionwake Strouhal number for the CC wasSt ≈ 0.21 over a widerange of Reynolds numbers, for example 102 < Re< 105. Inthe present study, Strouhal numbers obtained for the CC almatched the value of 0.21 generally found in the literature.Strouhal number atRe = 3400 for the CC is around 38
.
he.e
ste
and 19% higher than the SC and OSC, respectively. It is wnothing that there are some discrepancies between the obtresults and some of the previous studies, as seen inTable 1.Possible sources of these discrepancies could be the diffein Reynolds number among the various results, a differblockage ratio, the aspect ratios of the model, the experimsetup, surface roughness, wind tunnel or water channel,turbulence intensity of the free-stream flow, end conditions,tiny nonparallel effects [3,11,22,33,23,34]. Strouhal numbersgiven in Fig. 2 and Table 1 for the present investigation abased on evaluations of a spectral frequency interval, of a0.004 Hz, corresponding to a resolution of about 3% in teof the dominant vortex shedding.
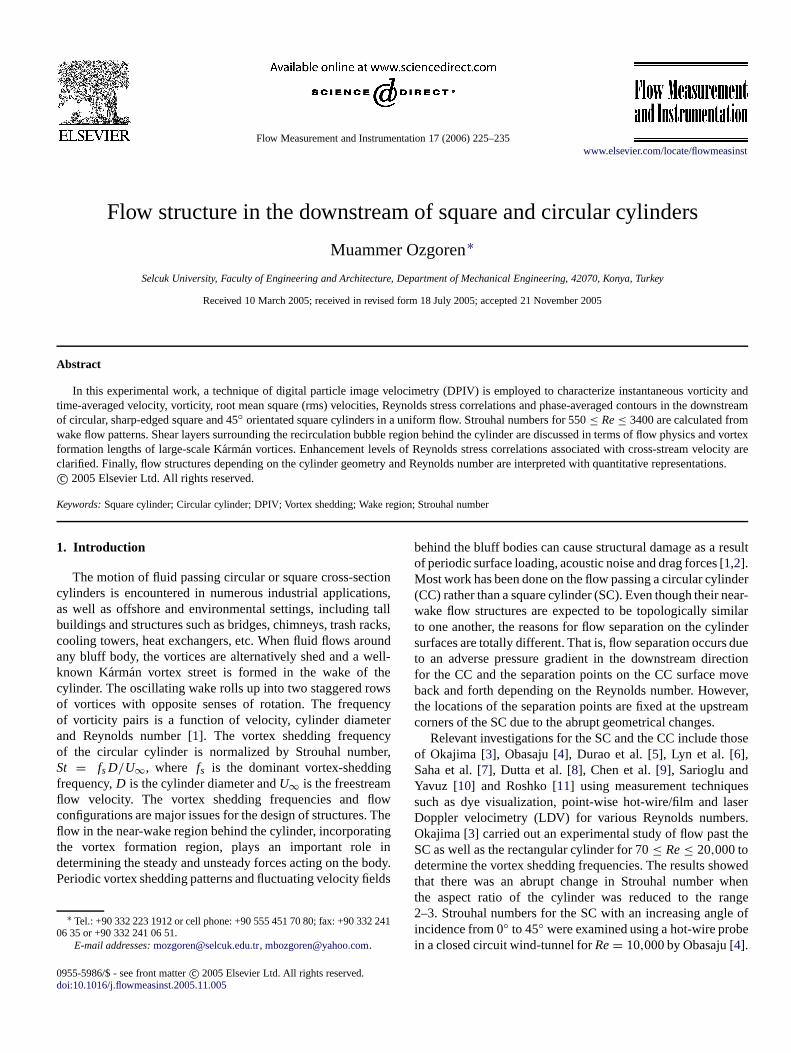
3.2. Instantaneous and time-averaged flow patterns
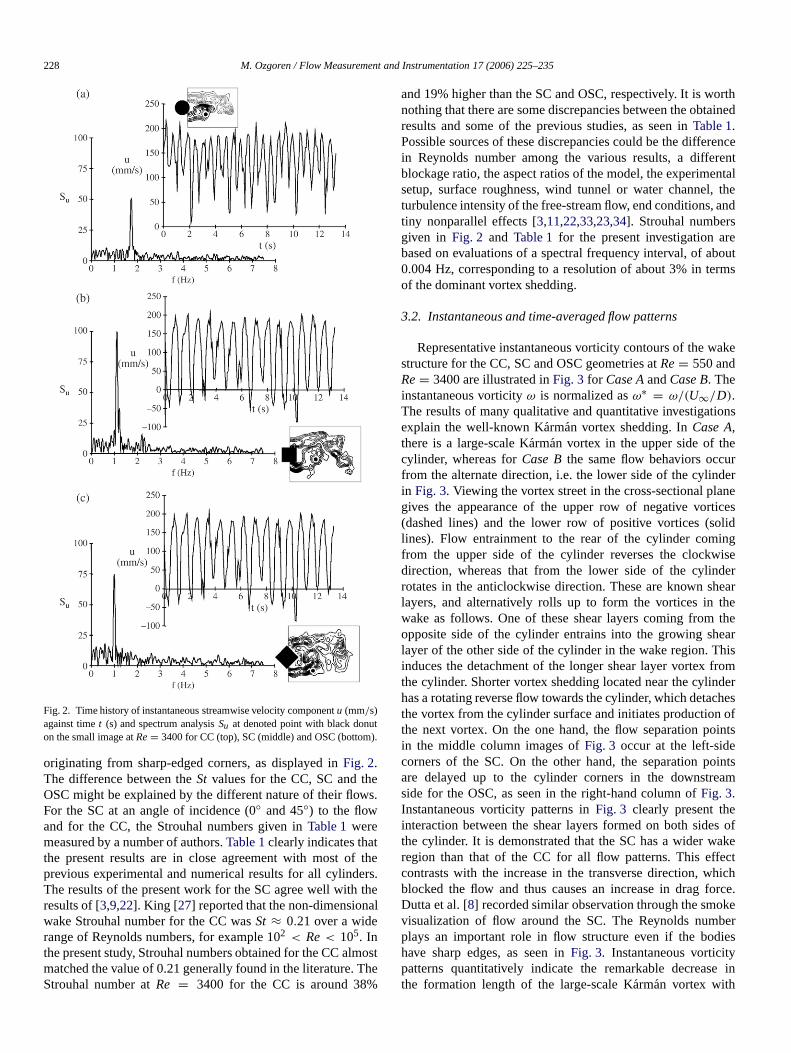
Representative instantaneousvorticity contours of the wakestructure for the CC, SC and OSC geometries atRe= 550 andRe= 3400 are illustrated inFig. 3 for Case AandCase B. Theinstantaneous vorticityω is normalized asω∗ = ω/(U∞/D).The results of many qualitative and quantitative investigatexplain the well-known Karman vortex shedding. InCase A,there is a large-scale K´arman vortex in the upper side of thcylinder, whereas forCase Bthe same flow behaviors occurfrom the alternate direction, i.e. the lower side of the cylindin Fig. 3. Viewing the vortex street in the cross-sectional plagives the appearance of the upper row of negative vor(dashed lines) and the lower row of positive vortices (solidlines). Flow entrainment to therear of the cylinder comingfrom the upper side of the cylinder reverses the clockwdirection, whereas that from the lower side of the cylinrotates in the anticlockwise direction. These are known shlayers, and alternatively rolls up to form the vortices inwake as follows. One of these shearlayers coming from theopposite side of the cylinder entrains into the growing shlayer of the other side of the cylinder in the wake region. Tinduces the detachment of the longer shear layer vortexthe cylinder. Shorter vortex shedding located near the cylinhas a rotating reverse flow towards the cylinder, which detachethe vortex from the cylinder surface and initiates productionthe next vortex. Onthe one hand, the flow separation poinin the middle column images ofFig. 3 occur at the left-sidecorners of the SC. On the other hand, the separation pare delayed up to the cylinder corners in the downstrside for the OSC, as seen in the right-hand column ofFig. 3.Instantaneous vorticity patterns inFig. 3 clearly present theinteraction between the shearlayersformed on both sides othe cylinder. It is demonstrated that the SC has a wider wregion than that of the CC forall flow patterns. This effeccontrasts with the increase in the transverse direction, wblocked the flow and thus causes an increase in drag fDutta et al. [8] recorded similar observation through the smovisualization of flow around the SC. The Reynolds numplays an important role in flow structure even if the bodhave sharp edges, as seen inFig. 3. Instantaneousvorticitypatterns quantitatively indicate the remarkable decreasthe formation length of the large-scale Karman vortex with
M. Ozgoren / Flow Measurement and Instrumentation 17 (2006) 225–235 229
.212
Table 1Comparison of Strouhal numbers
Authors Re SC OSC CC
Present study 550 to 3400 0.120 to 0.134 0.165 to 0.174 0.204 to 0Okajima [3] 500 to 3400 0.121 to 0.128Saha etal. [7] 500 0.135Dutta et al. [8] 1340 0.142 0.191Chen and Liu [9] 2000 to 3400 0.125 0.172Zaki etal. [18] 1790 and 2450 0.120 and 0.122 0.156 and 0.161Saha etal. [19] 500 0.120Sohankar et al. [21] 500 0.122Hwang and Sue [22] 500 and 1000 0.125 and 0.137Davis et al. [23] 500 and 1000 0.140 and 0.150Kim et al. [24] 500 and 3000 0.120 and 0.125Knisely [26] 2200 0.125 0.160Norberg [35] 550 to 3400 0.21Nakagawa et al. [36] 3000 0.130
th
Fig. 3. Comparison of patterns of dimensionless instantaneous vorticityω∗ for Re = 550 (top two rows) andRe = 3400 (bottom two rows) is presented. Bominimum and incremental contour levels of positive (solid line) and negative (dashed line) dimensionless instantaneous vortices in all images are 0.5.tha
akicow
mo
eren
gre
e
Linlarinto
increasing Reynolds number. The vortices produced atcorners of the SC have a tendency to displace in the inwdirection because of lower pressures prevailing within the wThis is counter-balanced by the growing wake size, whshifted the vortex centerline outwards. It is evident that the flcharacteristics in the downstream of the SC and OSC arecomplicated than the CC. In fact, atRe= 3400 for the OSC, thelarge-scale clusters of vortices induce negative vorticity laythat are immediately adjacent to the base of the cylinder as sein the right-hand column ofFigs. 3and5, as displayed forCase
erde.h
re
s
A and time-averaged vorticity〈ω∗〉. Regarding the onset anddevelopment of small-scale vortical structures in the separatinshear layer, regions of low-level vorticity concentration adiscernible in the pattern of instantaneous vorticity forRe =550 andRe = 3400 in Fig. 3. Large-scale Karman vorticesfor the SC and OSC form in the near-wake region due to thabrupt coalescence of small-scale shear-layer vortices in theseparating shear layers that are similar to the CC work ofet al. [12]. Instantaneous vorticity patterns showed the irreguvorticity shapes, and the shear layers tend to break up easily
230 M. Ozgoren / Flow Measurement and Instrumentation 17 (2006) 225–235
age.
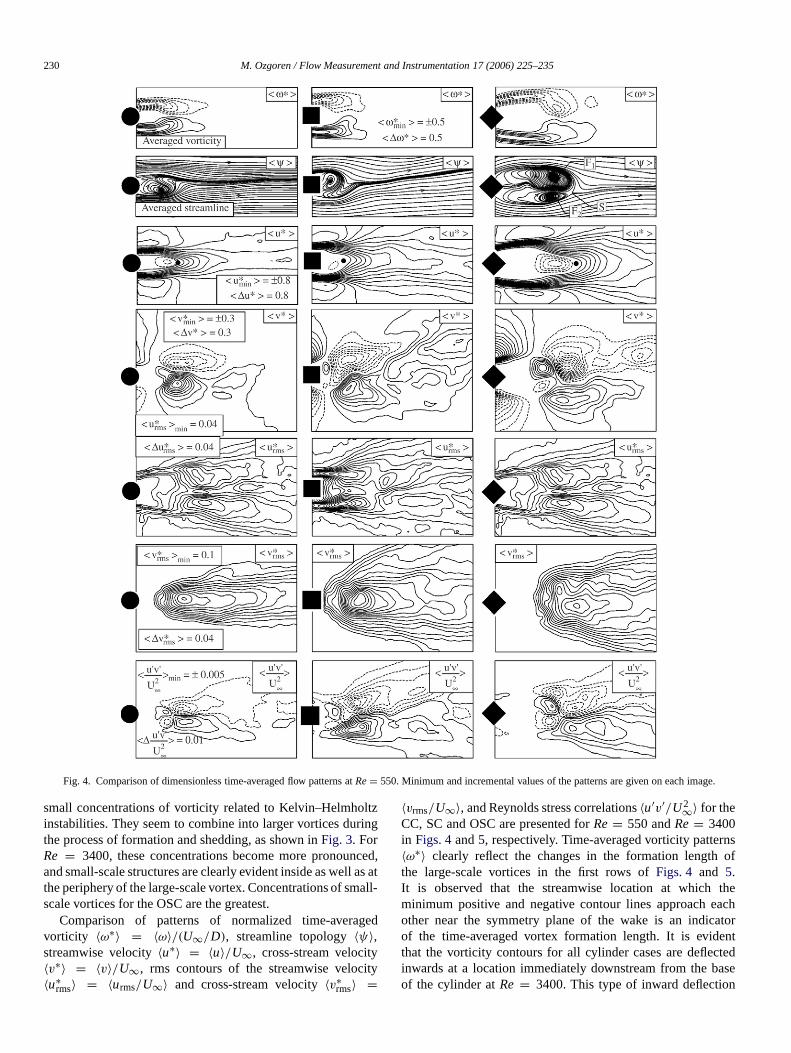
Fig. 4. Comparison of dimensionless time-averaged flow patterns atRe= 550. Minimum and incremental values of the patterns are given on each imltzin
cetll-
d
y
sof
theachator
tedasen
small concentrations of vorticity related to Kelvin–Helmhoinstabilities. They seem to combine into larger vortices durthe process of formation and shedding, as shown inFig. 3. ForRe = 3400, these concentrations become more pronounand small-scale structures are clearly evident inside as well as athe peripheryof the large-scale vortex. Concentrations of smascale vortices for the OSC are the greatest.
Comparison of patterns of normalized time-averagevorticity 〈ω∗〉 = 〈ω〉/(U∞/D), streamline topology〈ψ〉,streamwise velocity〈u∗〉 = 〈u〉/U∞, cross-stream velocity〈v∗〉 = 〈v〉/U∞, rms contours of the streamwise velocit〈u∗
rms〉 = 〈urms/U∞〉 and cross-stream velocity〈v∗rms〉 =
g
d,
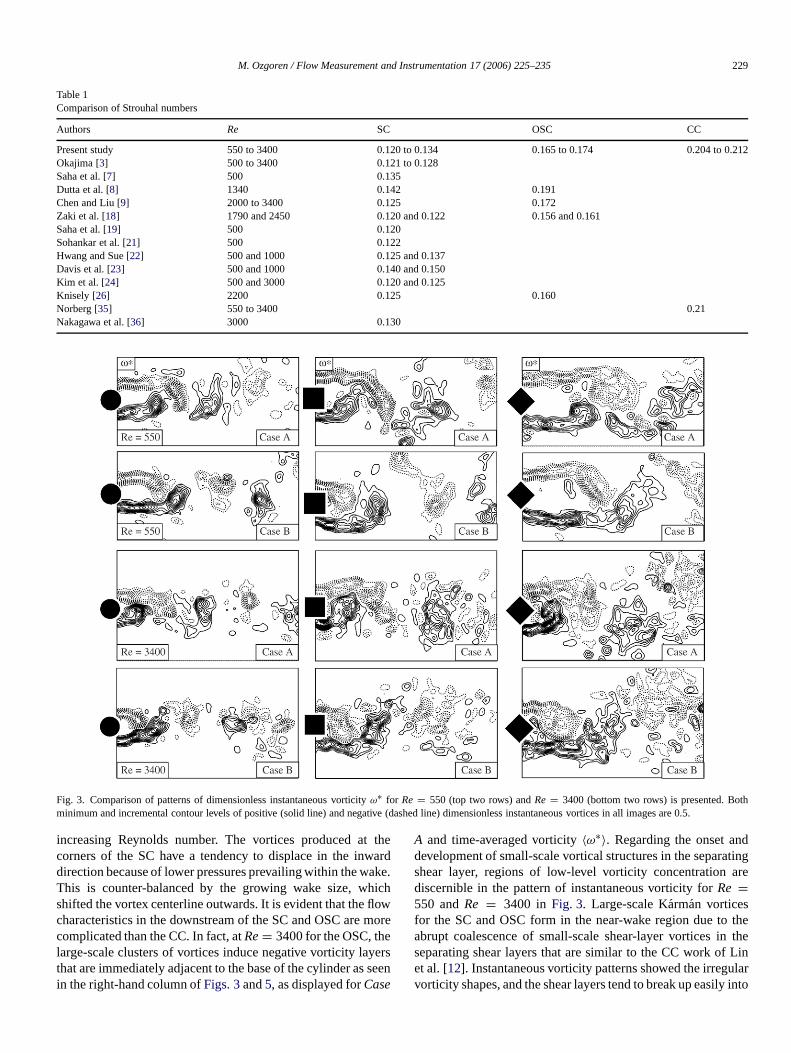
〈vrms/U∞〉, and Reynolds stress correlations〈u′v′/U2∞〉 for theCC, SC and OSC are presented forRe= 550 andRe= 3400in Figs. 4and5, respectively. Time-averaged vorticity pattern〈ω∗〉 clearly reflect the changes in the formation lengththe large-scale vortices in the first rows ofFigs. 4 and 5.It is observed that the streamwise location at whichminimum positive and negative contour lines approach eother near the symmetry plane of the wake is an indicof the time-averaged vortex formation length.It is evidentthat the vorticity contours for all cylinder cases are deflecinwards at a location immediately downstream from the bof the cylinder atRe = 3400. This type of inward deflectio
M. Ozgoren / Flow Measurement and Instrumentation 17 (2006) 225–235 231
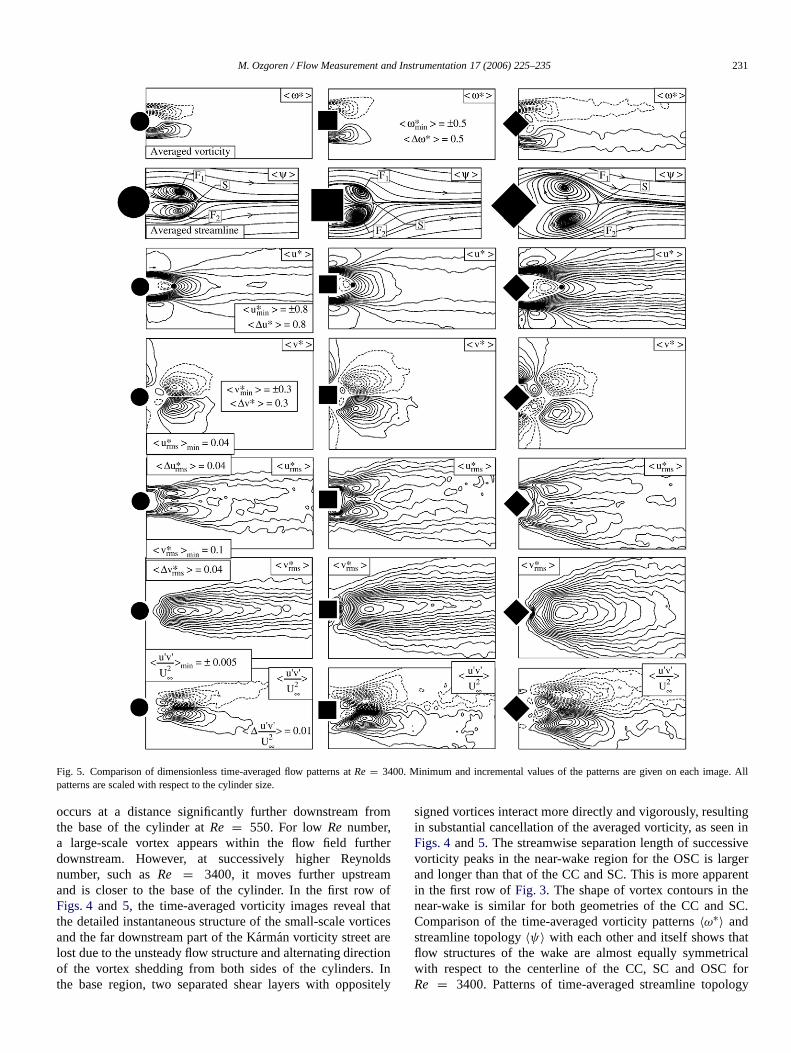
e. All
Fig. 5. Comparison of dimensionless time-averaged flow patterns atRe = 3400. Minimum and incremental values of the patterns are given on each imagpatterns are scaled with respect to the cylinder size.om
eroldm
ots
tioIn
ite
tingn inivegerrent
.
aticalfor
ogy
occurs at a distance significantly further downstream frthe base of thecylinder atRe = 550. For lowRe number,a large-scale vortex appears within the flow field furthdownstream. However, at successively higher Reynnumber, such asRe = 3400, it moves further upstreaand is closer to the base of the cylinder. In the first rowFigs. 4 and 5, the time-averaged vorticity images reveal thathe detailed instantaneous structure of the small-scale vorticeand the far downstream part of the K´arman vorticity street arelost due to the unsteady flow structure and alternating direcof the vortex shedding from both sides of the cylinders.the base region, two separated shear layers with oppos
s
f
n
ly
signed vortices interact more directly and vigorously, resulin substantial cancellation of the averaged vorticity, as seeFigs. 4and5. The streamwise separation length of successvorticity peaks in the near-wake region for the OSC is larand longer than that of the CC and SC. This is more appain the first row ofFig. 3. The shape of vortex contours in thenear-wake is similar for both geometries of the CC and SCComparison of the time-averaged vorticity patterns〈ω∗〉 andstreamline topology〈ψ〉 with each other and itself shows thflow structures of the wake are almost equally symmetrwith respect to the centerline of the CC, SC and OSCRe = 3400. Patterns of time-averaged streamline topol
232 M. Ozgoren / Flow Measurement and Instrumentation 17 (2006) 225–235
ci
ho
Cseth
enthlohasenek
nae
log3sS
fw
althhtio
odly,
nofCyeee
trethkera
to
, a-
tnalin
nale at
allyass. Athe
seen
tions
essity
reasrn
SCwiseksthe
es
ison
ith
C
omlds
terseionsgionultms
〈ψ〉 identify the major changes of the near-wake behind thecylinders. They exhibit well-defined critical points, e.g. fo(centers of vortices) designated as F1 and F2 and saddle points(apparent intersections of streamlines) denoted as S, as sin the second row ofFig. 4 for the OSC, and symmetrical flowstructures for the CC, SC and OSC in the second row ofFig. 5.From the averaged streamline patterns inFig. 4, the streamlineshapes extending upstream to the near-base region of theand SC are elliptical and have a limited spiral cycle focuvery close to the upper side of the downstream boundary ofSC and the lower side boundary of the CC due to insufficicapture time and data numbers. It is worth emphasizingcomputer controlled data acquisition systems could not alcapturing and processing DPIV data numbering more t200. Specifically forRe = 3400, whole-field representationof streamline patterns, along with the identification of thlocations of these types of critical points, could provide ainsight into the effective formation length of large-scale vorticand the degree of symmetry of either side of the near-waStreamline saddles in the near-wake similarly correspondthe time-averaged zero vorticity contour. The non-dimensiowake lengths (L/D) measured from the center point of thcylinder to the saddle point in the averaged streamline topo〈ψ〉 for Re = 3400 in Fig. 5 are approximately 1.65, 1.2and 2.20 for the CC, SC and OSC, respectively. These valuebecome around 2.75, 1.92 and 4.0 for the CC, SC and Orespectively, forRe= 550, as seen in the second row ofFig. 4.
Representations of the streamwise velocity component〈u∗〉over the entire field of view are also given in the third row oFigs. 4 and 5. Substantial regions of negative (reverse) floare evident atRe = 550 andRe = 3400 for minimumand incremental contour levels. From these images, it ispossible to define the location of a stagnation point aroundwake symmetry plane, which is designated by a black dot. Tdistances from the center point of the cylinders to the stagnapoint atRe= 550 inFig. 4are approximately 2.4D, 1.9D and4.3D for the CC, SC and OSC, respectively. The locationsthe stagnation points atRe = 3400, which become aroun1.7D, 1.2D and 2.2D for the CC, SC and OSC, respectivemove upstream, as seen in the third row ofFig. 5. Viewing thepatterns ofFigs. 4and5 as a whole, the effect of orientatioof the OSC substantially increases the streamwise lengththe separated vorticity layers relative to the case for theand the SC. Then, the growth of the separated shear lafrom the cylinder shoulders is associated with an increasthe wake size for the OSC. Another important parameter of thwake is that the non-dimensional width(W/D) of the wakecan be defined as the cross-stream distance between exof the time-averaged vorticity layers on opposite sides ofwake. For example, quantitative interpretations of the wawidth from the time-averaged vorticity, corresponding to latedistances passing through maximum and minimum convaluesin the top row ofFig. 5, arerespectively 0.95D,1.48Dand 1.76D for theCC, SC and OSC atRe= 3400. On the otherhand, these values forRe= 550 are 1.21D,1.54D and 2.17Dfor the CC, SC and OSC, respectively. At these locationswell as at locations downstream, local bulges of the cross
wn
Cdetatwn
se.tol
y
C,
soe
en
f
Crs
in
mae
lur
s
sectional patterns of the wake are evident; they are consistenwith regions of abrupt wake widening observed in the sectiopatterns of the flow structure for the SC and OSC, as seenFigs. 3–5.
Patterns of time-averagedcross-stream velocity〈v∗〉 aregiven in the fourth row ofFigs. 4 and 5. The patterns ofcross-stream velocity are detectable near the interface betweethe separating shear layers. Moreover, it is accompanied bydecrease in the streamwise extent of the separation bubbRe = 3400 relative to the bubble length atRe = 550. Thecontours of constant cross-stream velocity〈v∗〉 close to the baseof the cylinder have relatively larger values forRe = 3400.A largeamplitude of cross-stream velocity〈v∗〉 at Re= 3400might indicate that the developing shear layers which originseparatefrom the CC, SC and OSC entrained a significant mflow in the base region through both sides of the cylinderpossible explanation for this phenomenon is an increase inlevel of Reynolds stress in the separating shear layer, asin the bottom rows of Figs. 4 and 5. It might be concludedfrom pattern concentrations that Reynolds stress correlahave considerably enhanced values atRe = 3400 with regardto Re= 550.
The time-averaged contours of the Reynolds strcorrelation〈u′v′/U2∞〉 associated with rms streamwise veloc〈u∗
rms〉 and the cross-stream velocity component〈v∗rms〉 are
shown in thebottom three rows ofFigs. 4 and 5. The rmsflow patterns display similar behaviors,not only for differentReynolds numbers but also for the CC, SC and OSC, whethey havediscrepancies from the points of the flow patteconcentrations and vortex formation lengths. AtRe= 3400, thefluctuations and irregularities are greater for the SC and Othan the CC in the separating shear layer. The rms streamvelocity patterns〈u∗
rms〉 have easily detectable double peaat almost equal locations in the upper and lower sides ofcylinder centerline for all cylinders presented inFig. 5, whichare placed around 1.6D,1.5D and 1.8D for Re = 3400 forthe CC, SC, and OSC, respectively. The maximumcontourvalues of〈v∗
rms〉 for Re = 550 in the centerline of the wakoccur at nearly 3.1D,2.5D and 4.3D, whereas these distancefor Re = 3400 decrease to approximately 2.5D,2.2D and4.1D for the CC, SC and OSC, respectively. Cross comparof the results reveals double peaks for〈u∗
rms〉, while a singlepeak is observed in〈v∗
rms〉 with a maximum occurring along thecenterline axis of the vortex near to a location coincident wthe stagnation point in the downstream of the cylinders.
Reynolds stress correlations〈u′v′/U2∞〉 depict a set ofextrema on either side of the wake centerline for the CC, Sand OSC in the bottom rows ofFigs. 4and5, which provide adirect comparison of patterns for two Reynolds numbers frthe point of momentum transfer. The patterns in the Reynostress correlations consist of both small-scale clusters located inthe vicinity of the base of the cylinder and large-scale cluslocated just downstream from thesmall-scale clusters. Thwell-defined Reynolds stress patterns due to the fluctuatin the shear layers produce a weaker Reynolds stress revery close to the base of the cylinder which occurs as a resof the flow entrainment into the wake region. The basic for
M. Ozgoren / Flow Measurement and Instrumentation 17 (2006) 225–235 233
e
,usges ff
ese
eoion
rsrg
olecns
owdegtyallasth
ismin
nt
ngthe
ao
ag
ardis
d
ive
eeoue
f
x-ively.eousively.ocityes
thetywisece
eachicity
withgesosenandg
ively.large-as ansese
derion.its
e
rnsit isethe
gingtity
idetherr
esfor
theocity
ature
of these patterns persist forRe = 550 andRe = 3400. Theextrema of thelarge-scale contours forRe= 3400 are displaceddownstream by distances of nearly 2.1D,1.8D and 2.4D withregard to the center of the CC, SC and OSC, respectivHowever, these distances have larger values atRe = 550and reach 2.8D,2.3D and 4.1D for the CC, SC and OSCrespectively. The upstream extension of each large-scale clof 〈u′v′/U2∞〉 migrates further upstream and the tip of the larscale clusters is located closer to the base of the cylinderRe= 3400 inFig. 5. As clearly displayed in the bottom row oFigs. 4and5, this large-scale cluster migration is the greatfor the OSC. This trend is in accord with the earlier appearancof the confined small-scale concentrations of vorticity in theshear layer, as indicated in the corresponding instantanimages in Fig. 3. Same-signed Reynolds stress correlatpatterns〈u′v′/U2∞〉 and cross-stream velocity components〈v∗〉extendone side of the centerline to the other for all cylindeThe patterns of Reynolds stress correlations occur over a laextent across the wake for the OSC. Peak values of Reynstress correlations increase in the base region and then dsharply in the wake region, as seen from the concentratioof the flow structure. Reynolds stress correlation〈u′v′/U2∞〉 iszero around the cylinder axis as a result of symmetrical flstructure for Re = 3400 and attains its greatest magnituin the upper and lower regions of the centerline, althoupeak values of〈v∗
rms〉 occurred at the axis itself. Thus, velocifluctuations penetrate deeper into the outer flow and fincause an increase in the drag coefficient as a result of increwake size. The Reynolds stress correlations in and aroundmean wake recirculation region are primarily due to the time-dependent nature of the vortex shedding. In this limit, itobserved that the Reynolds stress correlation is relatively sin the outermostregion of the flow patterns, as displayedthe bottom images ofFigs. 4 and 5. Despite the significantdifferences in the geometry of the bluff body, the distributioof Reynolds stress patterns around the wake bubble forSC and OSC are quantitatively similar to the CC in the ra550 ≤ Re ≤ 3400. However, the measured values ofpeak Reynolds stresses are somewhat higher for the SCOSC than those of the CC. Furthermore, the peak valuesnormalized Reynolds stresses〈u′v′/U2∞〉 for the CC, SC andOSC are 0.08, 0.12 and 0.14 forRe= 3400, respectively.
3.3. Comparison of phase-averaged and instantaneous im
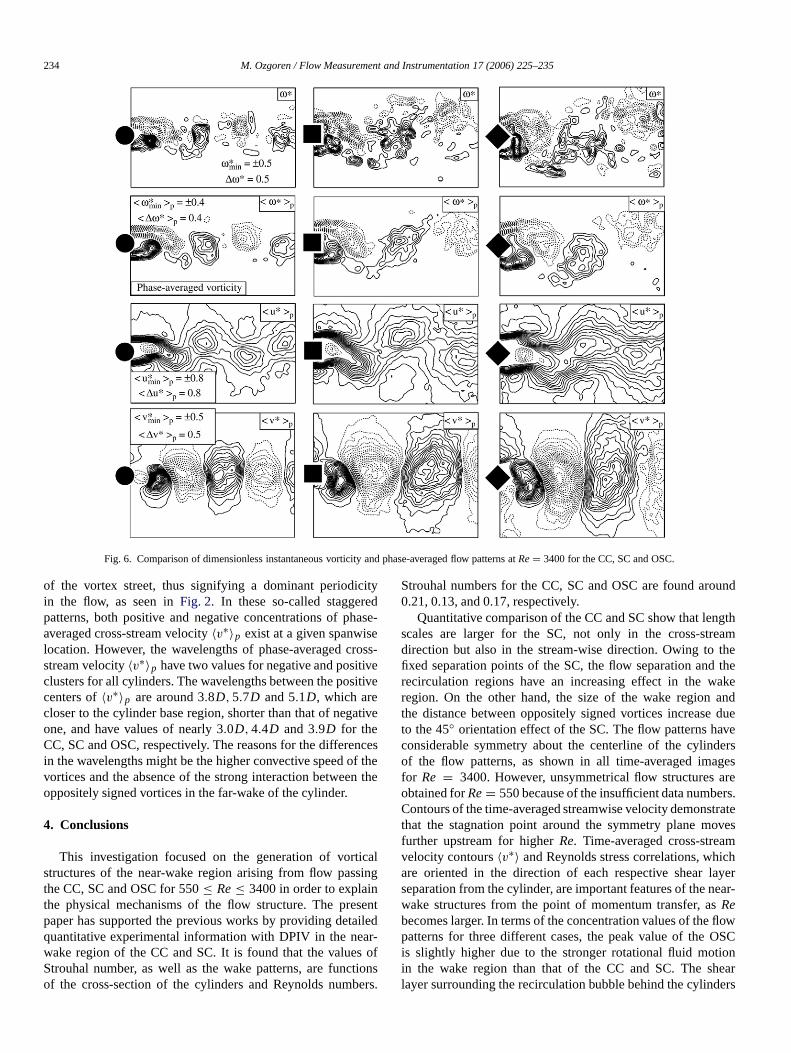
In addition to time-averaging, phase-averaging images hbeen pursued. In cases where a periodic signal is recoalong with the DPIV images, it is possible to employ thsignal as a phase-reference, provided that the timingDPIV images is known. Patterns of normalized phase-averagevorticity 〈ω∗〉p = 〈ω〉p/(U∞/D), streamwise velocity〈u∗〉p =〈u〉/U∞ and cross-stream velocity〈v∗〉p = 〈v〉/U∞ for theCC, SC and OSC atRe= 3400, corresponding to representatinstantaneous patterns of vorticityω∗, are given inFig. 6.
Calculations of phase-averaged flow patterns have baccomplished as follows. First of all, a movie of instantanevorticity patterns is created by using cinema in a sequenc
ly.
ter-or
t
us
.er
dsay
h
yede
all
shee
ndf
es
veed
of
nsof
200 instantaneous vortices. As seen from the time history othe streamwise velocity componentu at any point in the fieldof view shown inFig. 2, there are around 14 and 25 vorteshedding cycles (periods) of the SC and CC cases, respectEach period includes approximately 7 and 15 instantanimages in sequence for the CC, SC and OSC, respectSecond, according to the instantaneous streamwise velcomponentu, anypoint in the wake region of 7 or 15 imagcaptured during the vortex shedding period is chosen forCC, SC and the OSC as areference frame. Third, this velocicomponent is compared with the instantaneous streamvelocity componentu of other periods of images in a sequenat the same location. Fourth, when they are close toother within the accepted experimental accuracy, the vortpatterns of these two instantaneous images are comparedeach other by superposition. Finally, the most similar 11 imaof each respective phase of the vortex shedding cycle are chto obtain phase-averaged flow patterns for the SC, OSCCC, separately. Average relativeerrors of the phase-averaginmethod between instantaneous velocity componentu∗ andphase-averaged velocity component〈u∗〉p, which are obtainedfrom point to point in the field of interest shown inFig. 6, areless than 4%, 8% and 9% for the CC, SC and OSC, respectThese phase-averaged images, which emphasize thescale repetitive vortical structures, are intended to serveguide for the interpretation of instantaneous vorticity patterω∗. Formation of the large-scale vorticity clusters of vorticand von Karman-like vorticity is barely discernible in thpatterns of instantaneous vorticesω∗ for all cylinders inFig. 6.Furthermore, large-scale concentrations of vorticity are clearlyevident in both the upper and lower side layers of the cylinfor phase-averaged vorticity, as well as the further wake regThe upper layer is deflected substantially downwards fromshedding location, while the lower layer acts in the reversdirection. Viewing the patterns of phase-referenced〈ω∗〉p
and instantaneous vorticityω∗ as a whole, similar vorticitylayers are obviously obtained from phase-averaged pattefor all cylinders. For the cases of the CC, SC and OSC,evident that small-scale vorticity concentrations occur in thseparated shear layer for all cases, as is clearly seen frominstantaneous vorticity patterns shown inFigs. 3and6. Thesesmall-scale concentrations invorticity probably come from the3-D nature of the separated flow. However, phase-averacancels out these vorticity layers, while preserving the idenof large-scale K´arman vortices. In the third row ofFig. 6 forall cylinders, phase-averaged streamwise velocity〈u∗〉p showsthat rolled up flow originally starting from the upstream sof the SC, OSC and CC is conveyed downstream togewith the corresponding K´arman vortex; they form a counterotating flow pair. Hence, the cylinder wake greatly enhancthe mixing process of the flow. The wake region of the OSCphase-averaged streamwise velocity〈u∗〉p is the widest. Thewavelengths from one pocket center to other, placed aroundsame lateral location for phase-averaged streamwise vel〈u∗〉p, are approximately 3.8D,3.2D and 2.6D for theCC, SCand OSC, respectively.In viewing all images inFig. 6, phase-averaged flow patterns reveal the alternate staggered n
234 M. Ozgoren / Flow Measurement and Instrumentation 17 (2006) 225–235
.
Fig. 6. Comparison of dimensionless instantaneous vorticity and phase-averaged flow patterns atRe= 3400 for the CC, SC and OSCity
as
s-veitiv
ti
eshe
t
caing
eniler-o
ioer
und
gthame
heakeanddueveers
srers.
trateves
chayerar-
flowSC
on
ers
of the vortex street, thus signifying a dominant periodicin the flow, as seen inFig. 2. In theseso-called staggeredpatterns, both positive and negative concentrations of phaveraged cross-stream velocity〈v∗〉p exist at a given spanwiselocation. However, the wavelengths of phase-averaged crosstream velocity〈v∗〉p have two values for negative and positiclusters for all cylinders. The wavelengths between the poscenters of〈v∗〉p are around 3.8D,5.7D and 5.1D, which arecloser to the cylinder base region, shorter than that of negaone, and have values of nearly 3.0D,4.4D and 3.9D for theCC, SC and OSC, respectively. The reasons for the differencin the wavelengths might be the higher convective speed of tvortices and the absence of the strong interaction betweenoppositely signed vortices in the far-wake of the cylinder.
4. Conclusions
This investigation focused on the generation of vortistructures of the near-wake region arising from flow passthe CC, SC and OSC for 550≤ Re≤ 3400 in order to explainthe physical mechanisms of the flow structure. The prespaper has supported the previous works by providing detaquantitative experimental information with DPIV in the neawake region of the CC and SC. It is found that the valuesStrouhal number, as well as the wake patterns, are functof the cross-section of the cylinders and Reynolds numb
e-
e
ve
he
l
td
fnss.
Strouhal numbers for the CC, SC and OSC are found aro0.21, 0.13, and 0.17, respectively.
Quantitative comparison of the CC and SC show that lenscales are larger for the SC, not only in the cross-stredirection but also in the stream-wise direction. Owing to thfixed separationpoints of the SC, the flow separation and trecirculation regions have an increasing effect in the wregion. On the other hand, the size of the wake regionthe distance between oppositely signed vortices increaseto the 45◦ orientation effect of the SC. The flow patterns haconsiderable symmetry about the centerline of the cylindof the flow patterns, as shown in alltime-averaged imagefor Re = 3400. However, unsymmetrical flow structures aobtained forRe= 550 because of the insufficient data numbeContours of the time-averaged streamwise velocity demonsthat the stagnation point around the symmetry plane mofurther upstream for higherRe. Time-averaged cross-streamvelocity contours〈v∗〉 and Reynolds stress correlations, whiare oriented in the direction of each respective shear lseparationfrom the cylinder, are important features of the newake structures from the point of momentum transfer, asRebecomes larger. In terms of the concentration values of thepatterns for three different cases, the peak value of the Ois slightly higher due to the stronger rotational fluid motiin the wake region than that of the CC and SC. The shearlayer surrounding the recirculation bubble behind the cylind
M. Ozgoren / Flow Measurement and Instrumentation 17 (2006) 225–235 235
oons,sesd-ef t
ast rthetio
ingrryb
rch
id
g
h
w
d;
dyqua
t a.a
are99;
;
In
ake5;9
er
p.
der
rtex
i
laluly
tion97;
ct
t;
g
s
;
f.w;
ex-
a
ean
s.
n.
pt
nts
ureluid
theech
lar
ady
has a region of intense velocity fluctuation with high valuesReynolds stress correlation because of the vortex interactiPatterns of〈u∗
rms〉, and〈u′v′/U2∞〉 have indicated double peakwhereas that of〈v∗
rms〉 showsonly a single peak. The vorticeshedfrom both sides of the cylinder are the source of thtwo minima in the flow contours. It is physically confirmethat the predominant features ofthe instantaneous and phaseaveraged vortices are closely correlated, thereby reaffirming thuse of instantaneous vorticity patterns as representations oflow.
In general, vortex formation lengths decrease with increing Reynolds number for all the patterns presented. Presensults can provide sufficient information about the details offoregoing flow features to develop a strategy for the validaof numerical models in the future.
Acknowledgments
It is a pleasure to thank the Mechanical EngineerDepartment of Cukurova University, Turkey for letting me caout the present experimental work. This work is supportedthe Coordinatorship of Selcuk University’s Scientific ReseaProject, No. 2004/131.
References
[1] Williamson CHK. Vortex dynamics in a cylinder wake. Annu Rev FluMech 1996;28:477–539.
[2] Naudaschser E, Rockwell D. Flow-induced vibrations: an engineeringuide. Rotterdam: A. A. Balkema Press; 1994.
[3] Okajima A. Strouhal numbers of rectangular cylinders. J Fluid Mec1982;123:379–98.
[4] Obasaju ED. An investigation of the effects of incidence on the floaround a square section cylinder. Aeronaut Q 1983;34:243–59.
[5] Durao DFG, Heitor MV, Pereira JCF. Measurements of turbulent anperiodic flows around a square cross-section cylinder. Exp Fluids 19886:298–304.
[6] Lyn DA, Einav S, Rodi W, Park JH. A laser-Doppler velocimetry stuof ensemble-averaged characteristics of turbulent near-wake of a scylinder. J Fluid Mech 1995;304:285–319.
[7] Saha AK, Muralidhar K, Biswas G. Experimental study of flow passquare cylinder at high Reynoldsnumbers. Exp Fluids 2000;29:553–63
[8] Dutta S, Muralidhar K, Panigrahi PK. Influence of the orientation ofsquare cylinder on the wake properties. Exp Fluids 2003;34:16–23.
[9] Chen JM, Liu CH. Vortex sheddingand surface pressures on a squcylinder at incidence to a uniform air stream. Int J Heat Fluid Flow 1920:592–7.
[10] Sarioglu M, Yavuz T. Subcritical flow around bluff bodies. AIAA J 200240(7):1257–68.
[11] Roshko AJ. Perspectives on bluff-body aerodynamics. J Wind EngAero 1993;49:79–100.
[12] Lin J-C, Towfighi J, Rockwell D. Instantaneous structure of near-wof a cylinder: on the effect of Reynolds number. J Fluids Struct 199409–18.
[13] Noca F, Park HG, Gharib M. Vortex formation length of a circular cylind
fs.
e
he
-e-
n
y
re
d
:
(300< Re< 4000) using PIV. In: Proceedings of FEDSM’98. 1998,1–7.
[14] Bloor MG, Gerrard JH. Measurements of turbulent vortices in a cylinwake. Proc R Soc London, Ser A 1966;294:319–42.
[15] Szepessy S, Bearman PW. Aspect ratio and end plate effects on voshedding from a circular cylinder. J Fluid Mech 1992;234:191–217.
[16] Schiller L, Linke W. Druck- und Reibungswiderstand des Zylinders beReynoldsschenzahlen 5000 bis 40,000,Z. Flugtech. und Motorluftschif-fahrt 24 (7) 193–198. English translation entitled Pressure and frictionaresistance of a cylinder at Reynolds numbers 5000 to 40,000, in NationAdvisory Committee Aeronautics, Technical Memorandum No. 715, J1933.
[17] Balachandar S, Mittal R, Najjar FM. Properties of the mean recircularegion in the wakes of two-dimensional bluff bodies. J Fluid Mech 19351:167–99.
[18] Zaki TG, Sen M, Gad-el-HakM. Numerical and experimentalinvestigation of flow past a freely rotable square cylinders. J Fluids Stru1994;8:555–82.
[19] Saha AK, Biswas G, Muralidhar K. Three-dimensional study of flow pasa square cylinder at low Reynolds numbers. Int J Heat Fluid Flow 200324:54–66.
[20] Davis RW, Moore EF, Purtell LP.A numerical study of vortex sheddinfrom rectangles. J Fluid Mech 1982;116:476–506.
[21] Sohankar A, Norberg C, DavidsonL. Simulation of three-dimensionalflow around a square cylinder at moderate Reynolds numbers. Phys Fluid1999;11(2):288–306.
[22] Hwang RR, Sue YC. Numerical simulation of shear effect on vortexshedding behind a square cylinder. Int J Numer Methods Fluids 199725:1409–20.
[23] Davis RW, Moore EF, Purtell LP.A numerical-experimental study oconfined flow around rectangular cylinders. Phys Fluids 1984;23:46–59
[24] Kim Do-H, Yang KS, Senda M. Large eddy simulation of turbulent flopast a square cylinder confined in achannel. Computers & Fluids 200433:81–96.
[25] Ahlborn B, Seto ML, Noack BR. On drag, Strouhal number and vortstreet structure. Fluid Dynam Res 2002;30:379–99.
[26] Knisely CW. Strouhal numbers of rectangular cylinders at incidence:review and new data. J Fluids Struct 1990;4:371–93.
[27] King R. A review of vortex shedding research and its application. OcEng 1977;4:141–71.
[28] Adrian RJ. Particle-imaging techniques for experimental fluid mechanicAnnu Rev Fluid Mech 1991;23:261–304.
[29] Westerweel J. Digital particle image velocimetry, theory and applicatioDelft University Press; 1993.
[30] Keane RD, Adrian RJ. Optimization of particle image velocimeters. OMethods Flow Particle Diagnostics 1989;68:139–59. 1404 on attached.
[31] Fouras A, Soria J. Accuracy of out-of-plane vorticity measuremederived from in-plane velocityfield data. Exp Fluids 1998;25:409–30.
[32] Hart DP. PIV error correction. Exp Fluids 2000;29:13–22.[33] Bearman PW, Obasaju ED. An experimental study of press
fluctuations on fixed and oscillating square-section cylinders. J FMech 1982;119:297–321.
[34] Kolar V, Lyn DA, Rodi W. Ensemble-averaged measurements inturbulent near wake of two side-by-side square cylinders. J Fluid M1997;346:201–37.
[35] Norberg C. An experimental investigation of the flow around a circucylinder: influence of aspect ratio. J Fluid Mech 1994;258:287–316.
[36] Nakagawa S, Nitta K, Senda M. An experimental study on unsteturbulent near wake of a rectangularcylinder in channel flow. Exp Fluids1999;27:284–94.