Embed Size (px)
Citation preview

EEN-E1040 Measurement and Control of Energy Systems / Fall 2016 / v. 05 / TP / 7.9.2016
Flow measurement
Instructions
2
Contents
Contents .............................................................................................................................................. 2
1 Objectives ........................................................................................................................................ 3
2 Measurement setup ........................................................................................................................ 3
2.1 Location ................................................................................................................................... 3
2.2 Flow system ............................................................................................................................. 4
2.3 Measurement devices .............................................................................................................. 6
2.3.1 Ambient conditions .......................................................................................................... 6
2.3.2 Flow measurements ......................................................................................................... 6
3 Measurements ................................................................................................................................ 9
3.1 Start up .................................................................................................................................... 9
3.1.1 Record the conditions ....................................................................................................... 9
3.1.2 Start the system ............................................................................................................... 9
3.2 Test point 1 .............................................................................................................................. 9
3.3 Test point 2 .............................................................................................................................. 9
3.4 Shutting down .......................................................................................................................... 9
4 Reporting ....................................................................................................................................... 10
4.1 Presentation of the results ..................................................................................................... 10
4.2 Uncertainty analysis ............................................................................................................... 10
4.3 Discussion .............................................................................................................................. 10
4.4 Conclusions ............................................................................................................................ 10
5 Literature....................................................................................................................................... 11
6 Appendixes .................................................................................................................................... 12
Appendix 1 GENERAL STRUCTURE OF A SCIENTIFIC REPORT ................................................................ 13
Appendix 2 MEASURING RING CHARACTERISTICS ............................................................................... 14
3
FLOW MEASUREMENTS 1 Objectives
The objectives of the exercise are:
1. to get to know some methods for flow rate measurement;
2. to gain practical experience of flow rate measurement;
3. to get an idea of uncertainties and possible sources of error in flow rate measurements;
4. and to gain experience in analyzing and reporting of the results.
2 Measurement setup
2.1 Location The test rig has been built in the Laboratory for Heating, Ventilating and Air-Conditioning, which is located in Building K4 of the Aalto University School of Engineering. The room number is 2.18.
The easiest way to get to the laboratory is:
Entrance at Sähkömiehentie 4 J 2 ½ floors up Walk to the end of the corridor

4
2.2 Flow system The flow system mostly utilizes standard components of the ventilation systems of buildings. The system is built of ducts with a circular cross-section and an inner diameter of 160 mm. A schematic diagram of the flow system is shown in Figure 1 and photographs of the system are shown in Figures 2–4.
Figure 1. A schematic diagram of the flow system.
Figure 2. A photograph of the flow system. The left-hand side part of the system shown in Figure 1 is seen in the photo.

5
Figure 3. The fan and the frequency converter used for controlling the fan.
Figure 4. A photograph of the flow system. The right-hand side part of the system shown in Figure 1 is seen in the photo.
6
2.3 Measurement devices 2.3.1 Ambient conditions Barometric pressure and air temperature are measured with DeltaOhm HD2114B.2. Relative humidity of air is measured with TSI AXD 560.
2.3.2 Flow measurements The system is equipped with two specific devices for the measurement of air flow rate in the duct. They are the vortex shedding flow meter and the measuring ring. In addition to these devices, the control damper can also be used as a flow measuring device (although we should not expect high accuracy from such measurement). Finally, the duct is provided with openings which can be used for pitot tube measurements.
Vortex shedding flow meter
The operating principles of the vortex shedding flow meter have been explained by, e.g., Benard (1988 pp. 91–96), Sirén (1995 pp. 248–250), Mattingly (1996 p. 320) and Rathakrishnan (2007 pp. 418–419).
The vortex shedding flow meter used in the flow system in our laboratory has been manufactured by Bopp & Reuther and is of the type WZ 100 Ag61/F2. A link to the manufacturer’s web site is
http://www.bopp-reuther.de/en/products/vortex-meter.html
Our flow meter is from the 1980s and the information at the web site mostly deals with newer types, but you may nevertheless find the web site interesting.
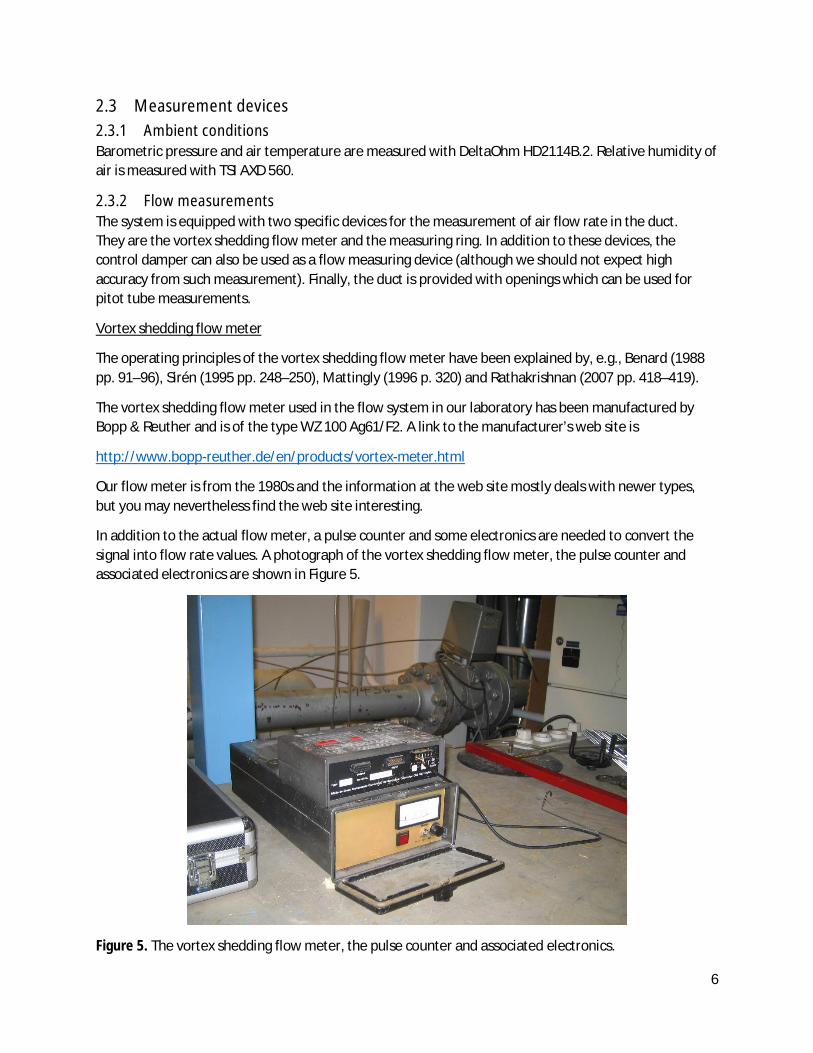
In addition to the actual flow meter, a pulse counter and some electronics are needed to convert the signal into flow rate values. A photograph of the vortex shedding flow meter, the pulse counter and associated electronics are shown in Figure 5.
Figure 5. The vortex shedding flow meter, the pulse counter and associated electronics.
7
Measuring ring
Measuring ring belongs to a large group of devices utilizing the pressure drop flow metering technique. The more common devices of this type are the orifice plate flow meter, the flow nozzle, and the venturi nozzle. The latter types are normally described in all fluid mechanics textbooks; see, e.g., Munson et al. (2004 pp. 91–93). They have also been descibed by Benard (1988 pp. 113–133) , Sirén (1995 pp. 218–232), Mattingly (1996 p. 304–310) and Rathakrishnan (2007 pp. 402–413). The measuring ring has been described by Sirén (1995 pp. 248–250).
The pressure drop flow metering devices often cause a significant permanent pressure drop and a corresponding energy loss in the flow. This is often a disadvantage since the same amount of energy must be supplied into the flow by a pump or a fan. The idea of the measuring ring is to use a device with a smaller pressure drop for a given flow rate. Various such devices have been developed over the years by different manufacturers. Not all of them are ring-shaped; many are more like pipes or wings in ap-pearance. One such device is called the averaging pitot and is described by Benard (1988 pp. 131–133).
The measuring ring used in the flow system in our laboratory has been manufactured by Fläkt Woods and is of the type MR-160. A link to the manufacturer’s web site is
http://www.flaktwoods.com/products/air-management-/dampers/air-flow-measuring-dampers/mr/
However, a word of caution. Although there are plenty of interesting information at the web site, there is a crucial deviation. The information at the web site is for current models, which apparently are somehow different from the measuring ring used in our laboratory. Thus, the pressure drop – flow rate curves found at the web site cannot be used. The appropriate curve is given as an appendix of this document.
Control damper
A damper always causes a pressure loss, even at the fully open position. The manufacturers of dampers have carried out measurements to find out the relationship between the pressure drop and flow rate for different positions of the damper. This information is mainly intended to be used in system design and possibly for diagnostic and troubleshooting purposes, but can also be used as a rough measurement.
The control damper in the flow system in our laboratory has been manufactured by Halton and is of the type PRA-160. The full name in its entirety is “Halton PRA-160 Airflow balancing, adjustment and measurement unit”. A link to the manufacturer’s web site is
https://www.halton.com/dh/CQDNHuGkc7MFD5AxEzrCRttXN8qQ1XjAH7OYZeMnMe4NRTSKgvjEJIO9-sH1stT_JjwOP_FJq7Gc74u1hL2J01c6kli0ICxZhmmKcIs/Halton_PRA_-_gb.pdf
At the web site, information are available on the relationship between the pressure drop and flow rate for PRA-160.
Pitot tube measurements
Pitot tube (also called pitot static tube) is a device for the measurement of flow velocity at a point in the flow field. The theory of the pitot tube is normally described in all fluid mechanics textbooks; see, e.g., Munson et al. (2004 pp. 81–82). Pitot tube has also been descibed by Benard (1988 pp. 157–163), Sirén (1995 pp. 175–179), Mattingly (1996 p. 310–312) and Rathakrishnan (2007 pp. 280–297).

8
Table 1. Pitot tube measuring points.
Point Distance from tube inner wall generally for a tube with an
inner diameter of 160 mm
1 0.032D 5 mm 2 0.135D 22 mm 3 0.321D 51 mm 4 0.679D 109 mm 5 0.865D 138 mm 6 0.968D 155 mm
As the flow velocity is normally expected to vary at different points of the cross-section of the flow conduit, it is normal practice to carry out measurements at several points. In this exercise, the duct is traversed both vertically and horizontally using a six-point scheme explained in Table 1.
The pressure difference between the static and total pressure is measured with a Swema-3000 micromanometer. The pitot tube and the micromanometer are shown in Figure 6.
Figure 6. A pitot tube and a micromanometer.

9
3 Measurements
3.1 Start up 3.1.1 Record the conditions Measure the barometric pressure and air temperature and relative humidity in the lab.
Write down in your notebook the settings of all adjustable components in the system.
3.1.2 Start the system Switch on the fan and the pulse counter of the vortex shedding flowmeter. Adjust the Intelecsa frequency converter at 220 V.
Let the system run for a few minutes to stabilize itself and observe the operation. Be prepared to take the necessary actions in case of any malfunctioning or suspicious behavior of any part of the system.
3.2 Test point 1 Write down the reading of the vortex shedding flowmeter.
Measure the pressure difference across the PRA-160 Unit.
Measure the pressure difference across the MR-160 Measuring Ring.
Measure the horizontal and vertical velocity profiles using the pitot tube. Take 10 readings at each point and use the average in subsequent calculations.
After both profiles have been measured, you are ready to check if any drift has occurred in the system. This is done by repeating the steps which were done before the profile measurements:
Write down the reading of the vortex shedding flowmeter.
Measure the pressure difference across the PRA-160 Unit.
Measure the pressure difference across the MR-160 Measuring Ring.
Check the voltage of the Intelecsa frequency converter.
Check the barometric pressure and air temperature and relative humidity in the lab.
Check the settings of all adjustable components in the system.
3.3 Test point 2 Change some of the settings of your test point 1 and repeat the measurements described in the previous section. Try to choose the settings to be changed in such a way that the experiment becomes as interesting as possible. During reporting, you will need to explain what you changed and why.
3.4 Shutting down Switch off the Intelecsa frequency converter and the pulse counter of the vortex shedding flowmeter.
Switch off all portable measurement instruments and put them back into their cases.

10
4 Reporting
4.1 Presentation of the results
Present the following information:
Description of the test rig and and its operational settings during the work. Explain the difference between your test points 1 and 2 and why you selected such points.
Description of ambient conditions during the test.
For each of your test points, show the following results:
flow rate as measured with the vortex shedding flow meter; flow rate as measured with the measuring ring; flow rate as estimated from the pressure drop measurement at PRA-160 Unit; flow rate as estimated based on pitot tube measurements; and plots of measured velocity profiles.
4.2 Uncertainty analysis
For this exercise, a mathematically rigorous uncertainty analysis is not required. However, you are requested to try to estimate how much uncertainty there might be in your final answers.
4.3 Discussion
Here you should analyze anything that you consider to be of interest or importance. Divide the section into subsections if necessary.
Examples of possible topics:
Any problems during the work, such as broken or malfunctioning equipment, unexpected changes in test conditions, inability to reach the desired conditions, suspicious events, etc.
Suggestions for the improvement of the equipment or test procedure (by adding more equipment, improving the performance of existing equipment, choosing more relevant or a wider range of test conditions, etc.).
Discussion of possible sources of errors and uncertainty, possibly with suggestions on how to improve the situation. Note that this item will not be very interesting unless you can include some quantitative considerations in your analysis.
Observations of general significance, possibly beyond the original objectives.
4.4 Conclusions
You should state your best estimates of the flow rates at your test points 1 and 2 and of the associated uncertainties.
State also any other conclusions that you deem to be feasible.

11
5 Literature
Benard, C. J. (1988), Handbook of fluid flowmetering, 1st ed. The Trade & Technical Press Limited, Morden. ISBN 0-85461-120-7.
Mattingly, G. E. (1996), Volume flow measurements. In: R. J. Goldstein (ed.), Fluid mechanics measurements, 2nd ed., pp. 301–366. Taylor & Francis, Washington. ISBN 1-56032-306-X.
Rathakrishnan, E. (2007), Instrumentation, measurements, and experiments in fluids. CRC Press, Boca Raton. ISBN 0-8493-0759-1.
Sirén, K. (1995), Ilmastointitekniikan mittaukset. Tietonova, Espoo, ISBN 951-22-2421-6.
Young, D. F., Munson, B. R. & Okiishi, T. O. (2004), A brief introduction to fluid mechanics. John Wiley & Sons, Hoboken. ISBN 0-471-45757-4.

12
6 Appendixes

13
Appendix 1 GENERAL STRUCTURE OF A SCIENTIFIC REPORT
1 Cover which includes
o name and date of the exercise o students participating in the exercise o a contact person whom feedback and possible remarks should be directed to
2 Contents with page numbering 3 A short description of the exercise 4 Description of the measurement setup and the instruments used in the measurement 5 Step-by-step workflow of the exercise 6 Analysis of the measurement results
o applying calibration corrections (if known) o statistical processing of repeated measurements (averages, standard deviations) o values of quantities calculated based on the results o possible theoretical comparison calculations o comparing results with each other
7 Error analysis
o calculation of error margins for the results o i) based on repeated measurements if there are enough o ii) based on the performance of the instruments (law of combining errors) o final results with error margins
8 Conclusions
o conclusions from the results themselves o conclusions from the studied phenomena etc.
9 Sources 10 Appendices
o logger data o extensive tables o program codes etc.

14
Appendix 2 MEASURING RING CHARACTERISTICS
Volume flow rate
(air density 1.2 kg/m3)
Pressure
difference