Embed Size (px)
Citation preview

1
FLORAL FRAGRANCE PRODUCTION IS A SPECIALIZED PROCESS
By
THOMAS ANGUS COLQUHOUN
A DISSERTATION PRESENTED TO THE GRADUATE SCHOOL OF THE UNIVERSITY OF FLORIDA IN PARTIAL
FULFILLMENT OF THE REQUIREMENTS FOR THE DEGREE OF DOCTOR OF PHILOSOPHY
UNIVERSITY OF FLORIDA
2009

2
© 2009 Thomas Angus Colquhoun

3
To everyone who believed this work possible

4
ACKNOWLEDGEMENTS
I would like to thank my Ph.D. Committee for their patience and guidance. Special
appreciation goes to my advisor, Dr. David Clark, for his ability to see past an occasional display
of youthful exuberance. Dr. Harry Klee is recognized for his critical reviews of written work
prior to peer-reviewed journal submissions. Additionally, unique gratitude goes to Dr. Kenneth
Cline for his interest in and assistance with a particular section of study presented in this work.

5
TABLE OF CONTENTS page
ACKNOWLEDGEMENTS ................................................................................................ 4
LIST OF TABLES ............................................................................................................. 7
LIST OF FIGURES ........................................................................................................... 8
CHAPTER
1 INTRODUCTION AND LITERATURE REVIEW ...................................................... 12
Introduction .............................................................................................................. 12 Floral Fragrance ........................................................................................................ 13 Chemical Composition of Floral Fragrance .................................................................. 15 Petunia x hybrida cv “Mitchell Diploid” ...................................................................... 16 MD FVBPs ............................................................................................................... 17 Regulation of FVBP Emission in MD .......................................................................... 18 Ethylene Signaling Pathway ....................................................................................... 18 FVBP Genetics and Biochemistry ............................................................................... 21 CHORISMATE MUTASE ......................................................................................... 24 R2R3-MYB Transcriptional Regulators ....................................................................... 26 Research Objectives .................................................................................................. 27
2 PETUNIA FLORAL VOLATILE BENZENOID/PHENYLPROPANOID GENES ARE REGULATED IN A SIMILAR MANNER .................................................................. 29
Preface ..................................................................................................................... 29 Introduction .............................................................................................................. 29 Results ..................................................................................................................... 32
Spatial FVBP Gene Expression Analysis in MD Plants ........................................... 32 Developmental FVBP Gene Expression Analysis in MD and 44568 Flowers ............ 33 Volatile Emission throughout Development From MD and 44568 Flowers ............... 34 Ethylene Dependent Down-Regulation of FVBP Gene Expression ........................... 35 Volatile Emission after Exogenous Ethylene Treatment .......................................... 35 Rhythmic Regulation of FVBP Gene Expression in MD Flowers ............................. 36 PhPAAS Activity in MD Flowers ......................................................................... 37
Discussion ................................................................................................................ 37 Experimental Procedures ............................................................................................ 42
Plant Materials.................................................................................................... 42 Expression Series Construction ............................................................................ 43 Gene Expression Analysis.................................................................................... 44 Floral Volatile Experiments and Emitted Volatile Quantification ............................. 45 Determination of PAAS Activity in Limb Crude Protein Extract .............................. 46 Floral Longevity Subsequent to Ethylene Application in MD and 44568 Flowers ...... 47

6
Acknowledgements ................................................................................................... 47
3 A SPECIALIZED CHORISMATE MUTASE IN THE FLOWER OF PETUNIA X HYBRIDA ............................................................................................................... 57
Preface ..................................................................................................................... 57 Introduction .............................................................................................................. 57 Results ..................................................................................................................... 59
Identification of Two Distinct CM cDNAs ............................................................ 59 Chloroplast Import Assay .................................................................................... 60 PhCM1 and PhCM2 Transcript Abundance Analysis .............................................. 61 Total CM Activity in Petunia Flowers ................................................................... 62 Functional Complementation and Recombinant Enzyme Activity of PhCM1 and
PhCM2 ........................................................................................................... 62 Suppression of PhCM1 by RNAi .......................................................................... 63
Discussion ................................................................................................................ 65 Experimental Procedures ............................................................................................ 69
Plant Materials.................................................................................................... 69 cDNA Isolation................................................................................................... 69 Transcript Accumulation Analysis ........................................................................ 70 Protein Extraction, Overproduction, and Purification .............................................. 71 Chorismate Mutase Enzyme Activity Assays ......................................................... 72 Chloroplast Import Assay .................................................................................... 72 Volatile Emission ................................................................................................ 73 Generation of PhCM1 RNAi Transgenic Petunia .................................................... 73
Acknowledgements ................................................................................................... 73
4 PhMYB5D8 EFFECTS PhC4H TRANSCRIPTION IN THE PETUNIA COROLLA ....... 88
Introduction .............................................................................................................. 88 Results ..................................................................................................................... 90
Identification of PhMYB5d8 ................................................................................. 90 PhMYB5d8 Transcript Abundance Analysis .......................................................... 91 Suppression of PhMYB5d8 by RNAi ..................................................................... 92
Discussion ................................................................................................................ 93 Experimental Procedures ............................................................................................ 96
Plant Materials.................................................................................................... 96 Generation of PhMYB5d8 RNAi Transgenic Petunia .............................................. 96 Transcript Accumulation Analysis ........................................................................ 96 Volatile Emission ................................................................................................ 98
Acknowledgements ................................................................................................... 98
LIST OF REFERENCES ................................................................................................ 104
BIOGRAPHICAL SKETCH ........................................................................................... 113

7
LIST OF TABLES
Table page 3-1 Functional complementation of CM-deficient E. coli KA12/pKIMP-UAUC.. .................75
3-2 Gene specific primers used for the transcript accumulation analyses. ..............................76

8
LIST OF FIGURES
Figure page 1-1 The floral volatile benzenoid/phenylpropanoid pathway.. ................................................28
2-1 Tissue specific transcript accumulation analysis of seven FVBP genes in MD. ...............48
2-2 Picture of floral stages used for the developmental studies in MD and 44568.. ................49
2-3 Developmental transcript accumulation analysis of seven FVBP genes in MD and 44568..................................................................................................................................50
2-4 qRT-PCR transcript accumulation analysis of PhPAAS and PhCFAT in petunia.. ...........51
2-5 Developmental floral emission analysis of major volatile compounds from MD and 44568 flowers.....................................................................................................................53
2-6 Transcript accumulation analysis of seven FVBP genes in MD flowers and 44568 flowers................................................................................................................................53
2-7 Picture of MD and 44568 flowers 32 hours after the initial treatments of ethylene. .........54
2-8 Emission analysis of major volatile compounds from MD and 44568 flowers subsequent to differential durations of ethylene exposure .................................................55
2-9 Rhythmic transcript accumulation analysis of seven FVBP genes in MD.. ......................56
2-10 Rhythmic analysis of PhPAAS activity in corolla limb tissue of MD flowers. .................56
3-1 Aromatic amino acid biosynthesis pathway. .....................................................................77
3-2 PhCM1 and PhCM2 CDS alignment .................................................................................78
3-3 Predicted peptide sequence alignment and an unrooted neighbor-joining phylogenetic tree of CM proteins from various species.. ..................................................79
3-4 Plastid import assay. ..........................................................................................................80
3-5 sqRT-PCR transcript accumulation analysis of PhCM1 and PhCM2 in petunia.. .............81
3-6 qRT-PCR transcript accumulation analysis of PhCM1 and PhCM2 in petunia. ...............82
3-7 Total CM activity in desalted crude protein extracts from MD whole corollas ................83
3-8 Enzyme activity of and effects of aromatic amino acids on petunia CMs. ........................83
3-9 Schematic representation and nucleotide comparison of RNAi region used for the production of petunia PhCM1 RNAi transgenic lines.. .....................................................83

9
3-10 sqRT-PCR transcript accumulation analysis in floral tissues of three independent T1 PhCM1 RNAi lines. ...........................................................................................................84
3-11 Floral volatile emission analysis from three independent T1 PhCM1 RNAi lines ............85
3-12 sqRT-PCR transcript accumulation analysis in floral tissues of two independent, homozygous T2 PhCM1 RNAi lines. .................................................................................85
3-13 Comparative transcript analysis and total CM activity between MD and representative individuals from independent homozygous T2 PhCM1 RNAi lines ..........86
3-14 Physiological comparison between MD and representative independent T2 PhCM1 homozygous RNAi lines ....................................................................................................87
3-15 Stem cross-sections (between 7-8 node from apical meristem) from 9 week old petunias stained with Phlorogucinol.. ................................................................................87
4-1 Predicted peptide sequence alignment of homologous R2R3-MYB proteins from various species. ..................................................................................................................99
4-2 An unrooted neighbor-joining phylogenetic tree of homologous R2R3-MYB proteins from various species.. ......................................................................................................100
4-3 PhMYB5d8 transcript accumulation analysis (sqRT-PCR).. ...........................................101
4-4 PhMYB5d8 cDNA model with the RNAi region used for the production of petunia PhMYB5d8 RNAi transgenic lines.. .................................................................................101
4-5 sqRT-PCR transcript accumulation analysis in floral tissues of independent T0 PhMYB5d8-RNAi lines and MD plants. ..........................................................................101
4-6 Floral volatile emission analysis from five independent T0 PhMYB5d8 RNAi lines .....102
4-7 Schematic model of the FVBP pathway in petunia. ........................................................103

10
Abstract of Dissertation Presented to the Graduate School of the University of Florida in Partial Fulfillment of the Requirements for
the Degree of Doctor of Philosophy
FLORAL FRAGRANCE PRODUCTION IS A SPECIALIZED PROCESS
By
Thomas Angus Colquhoun
December 2009
Chair: David G. Clark Major: Plant Molecular and Cellular Biology (PMCB) Floral fragrance is an integral factor for many angiosperm species interacting with an
environment. Individual fragrant flowering species emit specific mixtures and combinations of
volatile organic compounds, which can function in various aspects of plant biology. Petunia x
hybrida cv “Mitchell Diploid” (MD) has large white flowers that emit floral volatile
benzenoid/phenylpropanoid (FVBP) compounds in a controlled manner. FVBP emission is
confined to the corolla limb tissue, from anthesis to senescence, in a rhythmic pattern where peak
FVBP emission is nocturnal. The object of this study was to investigate molecular, biochemical,
and metabolic aspects of regulation committed to FVBP production in petunia. Therefore, seven
MD genes previously identified as necessary for differential aspects of FVBP production were
assayed for coordinate transcriptional regulation. The transcript accumulation assay resulted in
similar transcript accumulation profiles for all FVBP genes examined in three out of four
categories. Together with previous characterizations, these results indicate that the FVBP genes
are a part of a specific group, which is involved in a specific enterprise. Utilizing the transcript
accumulation screen and focusing further research on candidate genes whose transcript profiles
were similar to known FVBP profiles, PhCM1 and PhMYB5d8 were identified. PhCM1 encodes
a plastid localized CHORISMATE MUTASE (CM) isoform that catalyzes the initial committed

11
step in phenylalanine biosynthesis and is the major CM isoform involved in FVBP production.
While characterizing PhCM1, PhCM2 was identified as a cytosolic CM isoform, but the
transcript accumulation profile was not consistent with FVBP gene profiles and the cytosolic
localization separated PhCM2 from pathway proteins and metabolites. Lastly, PhMYB5d8
encodes an R2R3-MYB transcriptional regulator that contains a C-terminal EAR-domain. A
reverse genetic approach suggests that PhMYB5d8 negatively regulates CINNAMATE-4-
HYDROXYLASE transcript accumulation in the corollas of open petunia flowers.
In short, a simple and cost-effective molecular screen was designed to assay candidate
genes for a possible involvement in FVBP production. Two genes were identified and
empirically shown to be involved in FVBP production. That is, a biosynthetic enzyme which
directs metabolite flux to phenylalanine production and a transcriptional regulator managing
transcript levels of a biosynthetic enzyme “downstream” of phenylalanine.

12
CHAPTER 1 INTRODUCTION AND LITERATURE REVIEW
Introduction
Floral fragrance is a mixture of volatile organic compounds (VOCs) synthesized and
emitted by many angiosperm species. The precise composition of volatile compounds emitted is
particular to an individual species and is commonly referred to as a scent bouquet. Floral volatile
compounds serve multiple roles in the reproductive strategy of many angiosperms. Many
fragrant angiosperm species commit to large metabolic expenditures in the production of floral
volatile compounds; thus, a specific and complex regulation imparted upon overall volatile
production may be common. Therefore, the fundamental goal of this research was to achieve a
deeper understanding of the regulation imparted upon the production of FVBPs in order to aid in
the successful genetic engineering of a favorable floral fragrance for the commercial market.
Here we examined the detailed transcript accumulation profiles of known petunia floral
volatile benzenoid/phenylpropanoid (FVBP) genes, which allowed the grouping of these genes
into a floral volatile network based on similar transcript accumulation profiles and related protein
functions. For example, the effect of ethylene on transcript accumulation of the FVBP gene
network was coordinate and reversible in a time-dependent manner. We then utilized the similar
transcript profiles of the FVBP genes to compare and infer possible functions of unknown
petunia genes, which resulted in two candidate genes with similar transcript accumulation
profiles, PhCM1 and PhMYB5d8. Through molecular, biochemical, and metabolic approaches
data was generated that suggest both novel petunia genes are involved in FVBP production.
PhCM1 encodes a plastid localized CHORISMATE MUTASE (CM) isoform that catalyzes the
initial committed step in phenylalanine biosynthesis. PhCM1 is the principal CM involved in
FVBP synthesis in petunia flowers. PhMYB5d8 encodes an R2R3-MYB transcriptional regulator

13
that contains a C-terminal EAR-domain and is highly similar to AtMYB4. PhMYB5d8
negatively regulates CINNAMATE-4-HYDROXYLASE transcript abundance and indirectly
regulates a subset of FVBP emission in petunia. In conclusion, this study produced a transcript
accumulation screen for new petunia genes possibly involved in FVBP synthesis and/or
regulation, the identification of two novel genes involved in FVBP production, and numerous
insights into FVBP biosynthesis regulation in conjunction with new aspects of regulatory control
capable of genetic manipulation.
Floral Fragrance
In a natural environment, all of biology is governed by selective pressures to maximize
reproductive successes. Floral VOCs can serve multiple and diverse roles in the reproductive
strategy of many angiosperms; such as, antifeedant, antimicrobial, antifungal, and pollinator
attraction (reviewed in Dudareva et al., 2006). The latter role (pollinator attraction) can consist of
a signal (floral fragrance) and a reward (nectar and/or pollen), and is an attribute of a pollination
syndrome. A pollination syndrome is characterized in part by flower morphology, color,
fragrance, and nectar production with a result in an increased specialization of the floral
phenotype aimed at the attraction of potential pollinators (Fenster et al., 2004). Thus, a
mechanism to attract a functional pollinator can equip a sessile plant species with a means to
improve the non-self pollen grain to stigma interaction in the appropriate environment. The
pollination syndrome does not imply a specific species of pollinator exclusively visits a specific
species of plant; instead, pollinators are divided into functional groups or types such as by size,
mode of nectar intake, and/or activity. Therefore, the perpetual evolution of the pollination
syndrome can be molded by those pollinators that visit the flower most frequently and effectively
in a region where the plant is evolving (Fenster et al., 2004).

14
As a straightforward example, Petunia axillaris and Petunia integrifolia flower
morphology and biochemistry are consistent with a pollination syndrome hypothesis. P. axillaris
has slender, white flowers and initiates the production of floral VOCs at dusk coinciding with the
visitation of hawk moths (Manduca sexta) during the night (Hoballah et al., 2005). In contrast, P.
integrifolia has broad-based, purple flowers, which do not produce floral volatiles, and are
visited throughout the day primarily by bees. Meanwhile, they grow together in nature yet
generally do not produce hybrids even though they are fully cross-compatible (Ando et al.,
2001).
In contrast to the simple example above, pollinator attraction by floral fragrance can be a
complex associative process. Numerous variables underlie the association between a signal and a
reward, to reference a few: distance, temporal factors, competitors, perception of the signal,
quantity of signal produced, quality of signal, impact of reward, and availability of reward.
Therefore, until basic science can empirically test all attributes of pollinator attraction
individually, additively, and across numerous genetic backgrounds the general focus will remain
identifying a single feature of pollinator attraction.
However, floral fragrance is not only important to biological organisms in a natural
environment, but flowers themselves are treasured by humans for the beautiful colors, structures,
and fragrances. In fact for 2005, wholesale value of floriculture crops topped 5.4 billion US
dollars in 36 states surveyed (USDA-NASS, 2006: www.nass.usda.gov). Floriculture crops
comprise cut flowers, cut cultivated greens, foliage plants, bedding and garden plants, flowering
plants, and propagative materials. Societal examples of the demand for flowering plants and their
VOCs are perfumes (e.g. Coco Chanel, Bvlgari, and Versace) and the many psychological

15
effects of receiving bouquet of flowers as a present (e.g. a dozen cut red roses for Valentine’s
Day or a mix of carnations, lilies, and daisies for an anniversary).
As solitary compounds the phenylpropanoids, eugenol and isoeugenol significantly limit
colony forming abilities of a number of bacteria including Campylobacter jejuni, Escherichia
coli, Listeria monocytogenes, Salmonella enteric, Salmonella typhimurium (Friedman et al.,
2002). At relatively low concentrations, eugenol added to medium reduced fungal growth of
Botrytis fabae by approximately 73 % (Oxenham et al., 2005). Multiple floral VOCs have been
implicated in plant defense; however, the biological importance of these compounds with respect
to plant defense is still unclear since a direct relationship has yet to be established between a
volatile compound emitted from floral tissue and a reduction of microorganismal growth on
floral tissue. For a short review refer to Pichersky and Gershenzon, 2002.
Chemical Composition of Floral Fragrance
Fragrance is defined as the quality of having a sweet and pleasant scent
(www.dictionary.com). The classic example is that of a rose. By typing “scent AND rose” into
the Google™ search engine, over five million results are available. Conceptualizing fragrance
may be relatively easy, but when each aspect of fragrance is investigated further, a very complex
and dynamic association is revealed. Fragrant angiosperm species may emit from one to 100
individual VOCs (Knudsen and Gershenzon, 2006). To begin, floral fragrance is composed of
VOCs, which are generally lipophilic liquids with high vapor pressures and low molecular
weights (Pichersky and Dudareva, 2000). When no barriers to diffusion exist, non-conjugated
forms of VOCs can cross biological membranes freely (Dudareva et al., 2004). The floral VOCs
are commonly separated into three main categories: benzenoids/phenylpropanoids, fatty-acid
derivatives, and terpenoids. Additionally, carotenoid derivative, nitrogen containing and sulfur
containing floral VOCs have been identified (Knudsen et al., 1993; Simkin et al., 2004).

16
Phenylpropanoids represent the largest pool of secondary metabolites (Peters, 2007), and
more than 7000 phenylpropanoid compounds have been documented in plants (Wink, 2003). For
obvious reasons, FVBP compounds define a large class of structurally diverse VOCs (ex. methyl
benzoate and isoeugenol). FVBP compounds are putatively derived from the aromatic amino
acid L-phenylalanine (Phe) [Boatright et al., 2004], which is synthesized in the plastid from
metabolites originating in the shikimate pathway (Rippert et al., 2009). The characteristic
benzene ring (derived from Phe) can be modified and adorned with multiple and varying side-
groups. Specifically, benzenoids and phenylpropanoids have carbon side chains consisting of one
to three carbon molecules (C6-C1, C6-C2, and C6-C3).
Fatty-acid derived VOCs are saturated and unsaturated hydrocarbons. Volatile fatty-acid
derivatives are produced from the breakdown of C18 unsaturated fatty acids, primarily linolenic
and linoleic acids, and include an assorted group of volatiles including green leaf volatiles and
methyl jasmonate (Wasternack et al., 2002; Matsui, 2006). Fatty-acid derived VOCs appear to be
synthesized in membranous structures of plant cells (Hudak and Thompson, 1997).
Terpenoids are derived from isopentyl diphosphate and dimethylallyl diphosphate.
Terpenoids are produced through two alternative pathways, the cytosolic mevalonic acid
pathway and the plastidic methyl-erythritol pathway (Newman and Chappell, 1999; Rohmer et
al., 1999). Terpenoids are subdivided into five classes based on structure: hemiterpenes (C5),
monoterpenes (C10), sesquiterpenes (C15), homoterpenes (C11-C16), and diterpenes (C20).
Petunia x hybrida cv “Mitchell Diploid”
Petunia is a Solanaceae family member and the genus consists of approximately 30
species. Petunia has been used as a model system for a number of varying topics, like flavonoid
synthesis, floral development, transposons, epigenetics, VOCs, and senescence (Gerats and
Vandenbussche, 2005). Within the last decade, P. x hybrida cv “Mitchell Diploid” (MD) has
17
become an indispensable model system for floral volatile studies. MD was identified from an
individual haploid plant with high regeneration potential derived from a plant selected among the
progeny of a P. axillaris x (P. axillaris x P. hybrida “Rose du Ciel”) backcross (Mitchell et al.,
1980). When this haploid plant was grown in tissue culture, doubling of the chromosomes was
observed and resulted in a fertile, homozygous diploid line with no variation observed between
the two sets of chromosomes (Griesbach and Kamo, 1996). MD was used in many of the
fundamental experiments in plant transformation (Fraley et al., 1983; Horsch et al., 1985;
Deroles and Gardner, 1988a, b) and subsequently, a well established transformation protocol
exists (Jorgenson et al., 1996). Additionally, MD has a relatively short lifecycle, produces large
quantities of floral VOCs, develops numerous large flowers per plant, has a vigorous growth
habit, participates in ethylene-induced floral senescence, and an ethylene-insensitive transgenic
petunia line 44568 (CaMV 35S:etr1-1) is available (Wilkinson et al., 1997).
MD FVBPs
Benzenoids and phenylpropanoids constitute the majority of the VOCs emitted by the
MD flower (Kolosova et al., 2001a; Verdonk et al., 2003; Boatright et al., 2004; Underwood et
al., 2005; Verdonk et al., 2005; Koeduka et al., 2006). In MD the FVBP compounds are
putatively synthesized de novo (Pare and Tumlinson, 1997; Verdonk et al., 2003; Pichersky et
al., 2006), and subsequent to synthesis, these compounds are emitted from epidermal cells of the
corolla limb (Kolosova et al., 2001b; Underwood et al., 2005; Verdonk et al., 2005). MD flowers
predominantly emit 13 FVBPs: benzaldehyde (Bald), benzyl acetate (BeAc), benzyl alcohol
(BOH), benzyl benzoate (BeBA), methyl benzoate (MeBA), methyl salicylate (MeSA),
phenylacetaldehyde (PAA), 2-phenylethyl acetate (2-PhAc), phenylethyl alcohol (2-POH),
phenylethyl benzoate (PhBA), eugenol (EG), isoeugenol (IE), and vanillin (Figure 1-1)
[Kolosova et al., 2001a; Verdonk et al., 2003; Boatright et al., 2004; Verdonk et al., 2005;

18
Koeduka et al., 2006]. Minor components of MD total floral VOCs include two sesquiterpenes
(germacene D and cadina-3,9-diene), two aliphatic aldehydes (decanal and dodecanal), an
apocarotenoid (β-ionone), and two fatty-acid derivatives (cis-3-hexenal and trans-2-hexanal)
[Verdonk et al., 2003; Boatright et al., 2004; Simkin et al., 2004].
Regulation of FVBP Emission in MD
The production of floral VOCs could be a metabolically expensive enterprise for
angiosperm species. The biosynthesis of FVBP compounds requires proteins, metabolites,
energy, and multiple cofactors. Therefore, a complex regulation imparted upon FVBP
production, to possibly optimize the ratio between physical cost and reproductive benefit, is
evolutionarily straightforward. Substantial emission of MD FVBPs is confined to the corolla
limb tissue during open flower stages of development, which coincides with the presentation of
the reproductive organs (Verdonk et al., 2003; Underwood et al., 2005). MD FVBP internal
metabolite pool accumulation and emission is nocturnal with the highest level detected between
22:00 and 1:00 h (Kolosova et al., 2001a; Verdonk et al., 2003; Underwood et al., 2005; Verdonk
et al., 2005; Orlova et al., 2006). FVBP emission is greatly reduced following a successful
pollination/fertilization event or exogenous treatment with ethylene (Hoekstra and Weges, 1986;
Negre et al., 2003; Underwood et al., 2005). In short, four dimensions of regulation have been
identified: tissue type, floral development, daily time-course, and hormone action.
Ethylene Signaling Pathway
Of the classic phytohormones, ethylene has been empirically shown to have a regulatory
role in the production of floral VOCs in petunia (Negre et al., 2003; Underwood et al., 2005;
Dexter et al., 2007; Dexter et al., 2008). For example, exposure to exogenous ethylene for 10 h
results in a large reduction in FVBP emission, and a successful pollination and fertilization
event, which generates endogenous ethylene, results in a severe reduction in FVBPs after 36 to

19
48 h, all in MD (Negre et al., 2003; Underwood et al., 2005). Subsequent to fertilization, the
biological function of the petunia floral organ shifts from pollinator attractant to seed
development. Therefore, a reduction in pollinator attractions such as floral fragrance is
biologically efficient.
The gaseous phytohormone ethylene regulates an assortment of developmental processes
and stress responses such as: germination, cell elongation, sex determination, flower & leaf
senescence, and fruit ripening. Endogenous ethylene synthesis and the ethylene signal
transduction pathway has been investigated extensively with a significant proportion identified in
Arabidopsis thaliana through mutant analysis (reviewed in Chen et al., 2005). Ethylene is an
unsaturated hydrocarbon with the chemical formula C2H4 and is the simplest alkene. The
biosynthesis of ethylene begins with conversion of the amino acid methionine to S-adenosyl-L-
methionine (SAM) by the enzyme SAM SYNTHETASE (Bleeker and Kende, 2000). SAM is
then converted to 1-aminocyclopropane-1-carboxylic-acid (ACC) by the enzyme ACC
SYNTHASE (ACS). The activity of ACS is the rate-limiting step in ethylene production, and
therefore, regulation of ACS is crucial for ethylene biosynthesis. Oxygen is required for the last
step, which involves the action of the enzyme ACC OXIDASE (ACO) [Wang et al., 2002].
Subsequent to synthesis, ethylene is distributed by way of a gaseous state and perceived through
the ethylene signaling pathway. Additionally, ethylene biosynthesis can be induced by
endogenous or exogenous ethylene and is therefore autocatalytic (Guo and Ecker, 2004).
The ethylene signaling pathway can involve a transmembrane protein dimer complex
(receptor), a kinase cascade (signal transduction), membrane bound intermediate proteins
(mediator), and transcriptional regulators (response factors). The first gene encoding an ethylene
receptor was cloned from Arabidopsis thaliana (AtETR1) [Chang et al., 1993], followed by a

20
cloned gene in Solanum lycopersicum, NEVER-RIPE (Wilkinson et al., 1995). In Arabidopsis the
ethylene signal is perceived by a small family of five proteins, comprised of AtETR1, AtETR2,
AtEIN4, AtERS1 and AtERS2 (Schaller and Bleecker, 1995; Hua and Meyerowitz, 1998; Hua et
al., 1998; Sakai et al., 1998; Hall et al., 2000), while the tomato ethylene receptor family of
proteins consists of at least six individuals. AtETR1 can form a dimer complex through a
disulfide linkage between the respective monomers (Schaller et al., 1995). AtETR1 has an
ethylene-binding domain in the three N-terminal hydrophobic trans-membrane domains
(Schaller and Bleecker, 1995). The chemical element, copper can act as a cofactor to enhance
AtETR1 and ethylene binding activity (Rodriguez et al., 1999).
The C-terminus of AtETR1 displays high similarity to bacterial two-component
regulators, which contain a histidine kinase domain and a receiver domain (Chang et al., 1993).
The histidine kinase domain putatively interacts with the N-terminus of a Raf1-like kinase,
AtCTR1 (Clark et al., 1998). Without ethylene bound to the AtETR1 receptor, AtCTR1 is in an
activated form and suppresses ethylene signaling transduction. However, when ethylene is bound
to the AtETR1 receptor, AtCTR1 is in an inactive form and suppression on downstream
signaling components is relieved (reviewed in Zhu and Guo, 2008).
AtEIN3 is a plant-specific transcriptional regulator that functions downstream of the
signaling pathway leading from AtCTR1 (Chao et al., 1997; Alonso et al., 1999). AtEIN3 binds
to the promoter and induces transcription of AtERF1 (Solano et al., 1998). AtERF1 is part of a
large protein family called ethylene responsive element-binding proteins (EREBPs). EREBPs
bind to a conserved promoter element, a GCC box (Solano et al., 1998).
In planta, ethylene synthesis is promoted by numerous environmental stimuli including
pollination and fertilization. Pollination followed by increased ethylene production precede floral

21
senescence as the flower transitions from being a pollinator attractor to supporting seed
development in petunia (Hoekstra and Weges, 1986; Negre et al., 2003; Underwood et al., 2005).
Upon pollination of the MD flower, ethylene is rapidly produced in the stigma and style resulting
in an increased ethylene production around 12 hours after pollination and peaking after
approximately 24 hours in the ovary (Tang and Woodson, 1996). Subsequently, ethylene
production is induced in the corolla tissue between 24 and 36 hours after pollination (Jones et al.,
2003).The ethylene production in the corolla tissue is presumed to induce corolla senescence
(Hoekstra and Weges, 1986).
The creation of the ethylene-insensitive (CaMV 35S::etr1-1) transgenic petunia line,
44568 (Wilkinson et al., 1997) has been indispensible for comparative ethylene studies such as
adventitious root formation (Clark et al., 1999) and floral VOC production (Negre et al., 2003;
Underwood et al., 2005; Dexter et al., 2007; Dexter et al., 2008). In short, the Arabidopsis etr1-1
mutant is a missense mutation in the ethylene-binding domain of the protein. The missense
mutation generates a protein that is unable to perceive ethylene that results in a constitutively
suppressed ethylene signal transduction (Schaller and Bleeker, 1995). Heterologous expression
of Atetr1-1 under a constitutive promoter in the MD genetic background resulted in a single
homozygous transgenic line (44568) with severely reduced ethylene perception (Wilkinson et al.,
1997; Shibuya et al., 2004).
FVBP Genetics and Biochemistry
FVBP compounds are derived from the aromatic amino acid L-phenylalanine (Phe). Phe
is derived from metabolites originating from primary metabolism (shikimate pathway). The
plastid localized shikimate pathway begins with the condensation of erythrose-4-phosphate and
phosphoenolpyruvate, and ends in the formation of chorismic acid (CA) through a total of seven
enzymatic reactions (reviewed in Herrmann and Weaver, 1999). CA can be enzymatically
22
rearranged to prephenic acid by a protein called CHORISMATE MUTASE. Prephenic acid can
then be dehydrated to pheylpyruvic acid by an enzyme called PREPHENATE
DEHYDRATASE. Phenylpyruvic acid is transaminated to produce Phe. Phe is presumed to be
exported from the plastid into the cytosol where the phenylpropanoid pathway is localized
(Achnine et al., 2004). As the gateway to secondary metabolism, the phenylpropanoid pathway
begins with the deamination of Phe by PHENYLALANINE AMMONIA-LYASE (PAL) to form
trans-cinnamic acid (reviewed in Boudet, 2007). Next, trans-cinnamic acid is converted to para-
coumaric acid through hydroxylation by an endomembrane bound enzyme, CINNAMATE-4-
HYDROXYLASE (C4H) [Achnine et al., 2004]. A series of reactions can convert para-
coumaric acid to ferulic acid through multiple enzymatic steps (reviewed in Yu and Jez, 2008).
Metabolites for FVBP synthesis branch from the phenylpropanoid pathway at Phe, trans-
cinnamic acid, and ferulic acid (Figure 1-1).
To date, seven genes involved in the direct biosynthesis of FVBP compounds or
intermediate metabolites have been emperically identified in petunia: S-ADENOSYL-L-
METHIONINE:BENZOIC ACID/SALICYLIC ACID CARBOXYL METHYLTRANSFERASE 1
and 2 (PhBSMT1 and PhBSMT2) [AY233465 and AY233466], BENZOYL-COA:BENZYL
ALCOHOL/PHENYLETHANOL BENZOYLTRANSFERASE (PhBPBT) [AY611496],
PHENYLACETALDEHYDE SYNTHASE (PhPAAS) [DQ243784], CONIFERYL ALCOHOL
ACYLTRANSFERASE (PhCFAT) [DQ767969], EUGENOL SYNTHASE 1 (PhEGS1)
[EF467241], and ISOEUGENOL SYNTHASE 1 (PhIGS1) [DQ372813]; Figure 1-1. PhBSMT1
and PhBSMT2 encode enzymes that catalyze the synthesis of MeBA and MeSA from benzoic
acid and salicylic acid respectively (Negre et al., 2003; Underwood et al., 2005). PhBPBT
encodes an enzyme that catalyzes synthesis of BeBA and PhBA from benzoyl-CoA and BOH or

23
2-POH respectively (Boatright et al., 2004; Orlova et al., 2006; Dexter et al., 2008). PhIGS1
encodes an enzyme that catalyzes the formation of IE from coniferyl acetate (Koeduka et al.,
2006), while PhEGS1 encodes an enzyme responsible for the conversion of coniferyl acetate to
eugenol (Koeduka et al., 2008). PhPAAS encodes a bifunctional decarboxylase/amine oxidase
that catalyzes synthesis of PAA from phenylalanine (Kaminaga et al., 2006). PhCFAT encodes
an enzyme that catalyzes the formation of coniferyl acetate (substrate for PhIGS1) from
coniferyl alcohol and acetyl CoA (Dexter et al., 2007).
The seven petunia genes mentioned above have all been characterized in different ways,
but a common transcript accumulation profile seems to be emerging. PhBSMT1 and PhBSMT2
mRNA transcripts accumulate to high levels in petunia corolla limb tissue, peak transcript
accumulation is detected at mid-day, and transcript accumulation is greatly reduced after a
successful pollination/fertilization event and/or exogenous ethylene exposure (Negre et al., 2003;
Underwood et al., 2005). PhBPBT transcripts accumulate to high levels in petunia corolla limb
tissue, peak transcript accumulation is detected at mid-day, and PhBPBT transcript accumulation
is reduced after a successful pollination/fertilization event and/or exposure to exogenous
ethylene (Boatright et al., 2004; Dexter et al., 2008). PhIGS1 transcripts accumulate to high
levels in both corolla tube and limb tissues of petunia (Koeduka et al., 2006). PhEGS1 transcript
accumulation is relatively high in corolla limb tissue, but PhEGS1 transcripts accumulate to
approximately 33 % of PhIGS1 transcript accumulation in petunia corolla limb tissue (Koeduka
et al., 2008). PhPAAS transcript accumulation is relatively high in corolla limb and ovary tissue
of the petunia flower. PhPAAS transcript accumulation is only observed post-anthesis and peak
transcript accumulation is detected at mid-day (Orlova et al., 2006). PhCFAT transcript
accumulation is relatively high in the corolla limb tissue post-anthesis and peak transcript

24
abundance appears in the evening. Additionally, PhCFAT transcript accumulation is greatly
reduced after a successful pollination/fertilization event and/or exogenous ethylene exposure
(Dexter et al., 2007). To summarize, none of the previously reported MD FVBP genes have been
transcriptionally profiled alike, however, high levels of all these gene transcripts seem to be
confined to the petunia corolla limb tissue, which corresponds to the spatial location of FVBP
emission.
A single transcriptional regulator involved in the production of FVBPs has been
identified from petunia. ODORANT 1 (PhODO1) [AY705977] is a R2R3-MYB transcriptional
regulator that functions to regulate gene expression in the shikimate pathway (Verdonk et al.,
2005). The accumulation of the shikimate pathway gene transcripts upon anthesis elevates levels
of precursors, as deduced from benzoic acid levels, available for the FVBP biosynthesis
pathways. PhODO1 transcript accumulation is relatively high in the corolla limb tissue from
anthesis to senescence, and peak transcript abundance is observed in the evening (Verdonk et al.,
2005).
CHORISMATE MUTASE
CA is the last primary metabolite shared for production of the phenylpropanoid
secondary metabolites. CM is the initial committed step in Phe biosynthesis in plants.
Specifically, CM catalyzes an intramolecular, [3,3]-sigmatropic rearrangement of chorismic acid
to prephenic acid, formerly a Claisen rearrangement (Haslem, 1993). Three CM genes have been
identified in Arabidopsis thaliana, and each gene encodes a different isoform of the CM protein.
All AtCMs have been cloned, transcriptionally profiled, and biochemically characterized in
selected Arabidopsis tissue, but all the conclusions regarding subcellular localization are putative
concepts based upon predicted amino acid sequence features (chloroplast transit peptide, cTP)
and have not been tested directly. AtCM1 and AtCM3 are predicted to be plastid localized

25
isoforms, respective transcripts accumulate differentially, and AtCM1 is induced upon pathogen
attack (Eberhard et al., 1993; Eberhard et al., 1996b; Mobley et al., 1999). In addition, both
isoforms are allosterically up-regulated by tryptophan and down-regulated by Phe and tyrosine.
Of the two putative plastidic CM isoforms, recombinant AtCM3 has the lowest apparent Km
value for CA when expressed in a eukaryotic system (Mobley et al., 1999). AtCM2 predicted
localization is the cytosol due to a lack of a cTP, it has the lowest apparent Km value for
chorismic acid of all three isoforms, and is allosterically unaffected by the three aromatic amino
acids (Eberhard et al., 1996b; Mobley et al., 1999).
The identification and characterization of all three CM isoforms in Arabidopsis consisted
of multiple manuscripts culminating in the authors of the final manuscript to speculate that the
differential properties of AtCMs suggested each isoform fulfilled distinct physiological roles.
Additionally, the authors point out that a loss-of-function mutation for each CM gene was
required to clearly define any specific roles each isoform may have (Mobley et al., 1999). To
date, loss-of-function mutations for any of the higher plant CM family members have not been
reported. The majority of the upstream and downstream pathway proteins have been empirically
tested for subcellular localization and all pathway proteins close to the CM step have been
localized to the plastid in Arabidopsis leaf tissue (Herrmann and Weaver, 1999; Rippert et al.,
2009). Therefore, the function of the Arabidopsis cytosolic isoform remains unclear, due to the
separation from pathway proteins and substrate. Interestingly, a Solanum lycopersicum CM was
cloned by one of the same labs that reported on the AtCMs, and it appears to be located in the
cytosol because the predicted protein sequence lacks a cTP (Eberhard et al., 1996a).
Additionally, activity of two CM isoforms from Papaver somniferum have been reported and
differential centrifugation resulted in a plastidic and cytosolic isoform (Benesova and Bode,
26
1992). The question remains, why do multiple genetic backgrounds contain a CM sequence
encoding for a protein that is unable to participate in a very specific enzymatic reaction? Has a
new function evolved (broad substrate specificity), or maybe the biological separation between
cytosol and plastid is dynamic and all variables have not been tested.
R2R3-MYB Transcriptional Regulators
Transcription is the biosynthesis of ribonucleic acid (RNA) chains under the direction of
deoxyribonucleic acid (DNA) templates. Multiple factors are necessary for the process of
transcription including DNA unwinding and/or remodeling, the RNA polymerase complex, and
many other proteins involved in the pre-initiation complex. Additionally, other factors can
control the transcription rate. Regulation of the transcription rate increases the versatility and
adaptability of an organism by controlling when and where a protein is expressed. Proteins that
recognize and bind DNA in a sequence specific manner in order to regulate the rate of initiation
of transcription are called transcriptional regulators. These proteins can be activators, repressors,
or both and have been classified into families based upon similarity of DNA binding domains
(reviewed in Pabo and Sauer, 1992). Of these proteins, MYB transcriptional regulators comprise
one of the largest families in the plant kingdom (Riechmann et al., 2000).
The oncogene v-MYB from the avian myeloblastosis virus was the first MYB
transcriptional regulator identified (Klempnauer et al., 1982). MYB genes have since been
identified from insects, plants, fungi, and slime molds (Lipsick, 1996). The MYB proteins are
further classified into subfamilies based on the composition of the DNA binding domain, which
is generally comprised of three imperfect repeats: R1, R2, and R3 (Ogata et al., 1992). In plants,
R2R3-MYB transcriptional regulators contain two imperfect repeats and this subfamily consists
of approximately 125 individual genes in Arabidopsis thaliana. Protein functions of these 125

27
genes vary from controlling cellular proliferation and differentiation to controlling
phenylpropanoid metabolism (reviewed in Stracke et al., 2001).
Research Objectives
The object of this study was to investigate molecular, biochemical, and metabolic aspects
of regulation committed to FVBP production in petunia. Therefore, MD genes previously
identified as necessary for differential aspects of FVBP production were assayed for coordinate
transcriptional regulation. Employing the transcript accumulation screen we focused further
research on candidate genes whose transcript profiles were similar to known FVBP profiles. The
identification of PhCM1 and PhMYB5d8 enabled an examination of metabolite control and flux
through the phenylpropanoid pathway and ultimately to FVBP synthesis in petunia.

28
Figure 1-1. The floral volatile benzenoid/phenylpropanoid pathway. The shikimate pathway
(dark grey) concludes with the formation of chorismate. CHORISMATE MUTASE catalyzes the rearrangement of chorismate to prephenate, directing the flux of metabolites to the production of phenylalanine and tyrosine. From the phenylpropanoid backbone (light grey), FVBP production consists of three main branch-points; phenylalanine, trans-cinnamic acid, and ferulic acid. Floral volatile compounds derived from each branch-point are highlighted in pink and known FVBP genes are abbreviated at the appropriate enzymatic positions. Enzymes are in red. Solid red arrows indicate established biochemical reactions. Multiple arrows indicate multiple biochemical steps. Dashed arrows indicate possible biochemical reactions.
29
CHAPTER 2 PETUNIA FLORAL VOLATILE BENZENOID/PHENYLPROPANOID GENES ARE
REGULATED IN A SIMILAR MANNER
Preface
This work has been submitted to and accepted in modified form at the journal
Phytochemistry for publication (Thomas A. Colquhoun, Julian C. Verdonk, Bernardus C.J.
Schimmel, Denise M. Tieman, Beverly A. Underwood, and David G. Clark. [2009] Petunia
Floral Volatile Benzenoid/Phenylpropanoid Genes are Regulated in a Similar Manner.
Phytochemistry, [In Press])
Introduction
Floral volatile compounds serve multiple roles in the reproductive strategy of many
angiosperms, functioning in antifeedant, antimicrobial, antifungal, and pollinator attractant roles
(reviewed in Dudareva et al., 2006). The relatively large metabolic cost for scent production in
many species underscores the importance of this enterprise. Many aspects regarding the
regulation of the floral volatile system as a whole remain unclear; for example, are all the genes
involved in the biosynthesis of floral volatiles a part of a transcriptionally regulated network?
Petunia x hybrida cv ‘Mitchell Diploid’ (MD) is an excellent model system for the study
of floral volatiles. Benzenoids and phenylpropanoids constitute the majority of the volatile
organic compounds emitted by the petunia flower (Kolosova et al., 2001a; Verdonk et al., 2003;
Boatright et al., 2004; Underwood et al., 2005; Verdonk et al., 2005; Koeduka et al., 2006).
These low molecular weight compounds have high vapor pressures and are putatively
synthesized de novo (Pare and Tumlinson, 1997; Verdonk et al., 2003; Pichersky et al., 2006).
Subsequent to synthesis, these compounds are emitted from epidermal cells of the corolla limb
(Kolosova et al., 2001b; Underwood et al., 2005; Verdonk et al., 2005). MD flowers emit 13

30
benzenoids/phenylpropanoids; benzaldehyde (Bald), benzyl acetate (BeAc), benzyl alcohol
(BOH), benzyl benzoate (BeBA), methyl benzoate (MeBA), methyl salicylate (MeSA),
phenylacetaldehyde (PAA), 2-phenylethyl acetate (2-PhAc), phenylethyl alcohol (2-POH),
phenylethyl benzoate (PhBA), eugenol (EG), isoeugenol (IE), and vanillin (Figure 1-1, Kolosova
et al., 2001a; Verdonk et al., 2003; Boatright et al., 2004; Verdonk et al., 2005; Koeduka et al.,
2006). Beginning at anthesis (flower opening) these volatile compounds are synthesized and
emitted in a rhythmic pattern with a maximum emission at night (Kolosova et al., 2001a;
Verdonk et al., 2003; Underwood et al., 2005; Verdonk et al., 2005).
In petunia, seven floral volatile benzenoid/phenylpropanoid (FVBP) biosynthetic genes
have been identified: S-ADENOSYL-L-METHIONINE:BENZOIC ACID/SALICYLIC ACID
CARBOXYL METHYLTRANSFERASE 1 and 2 (PhBSMT1 and PhBSMT2), BENZOYL-
COA:BENZYL ALCOHOL/PHENYLETHANOL BENZOYLTRANSFERASE (PhBPBT),
PHENYLACETALDEHYDE SYNTHASE (PhPAAS), CONIFERYL ALCOHOL
ACYLTRANSFERASE (PhCFAT), ISOEUGENOL SYNTHASE 1 (PhIGS1), and EUGENOL
SYNTHASE1 (PhEGS1) [Figure 1-1]. PhBSMT1 and PhBSMT2 encode enzymes that catalyze the
synthesis of MeBA and MeSA from benzoic acid and salicylic acid respectively (Negre et al.,
2003; Underwood et al., 2005). PhBPBT encodes an enzyme that catalyzes synthesis of BeBA
and PhBA from benzoyl-CoA and BOH or 2-POH respectively (Boatright et al., 2004; Orlova et
al., 2006; Dexter et al., 2008). PhIGS1 encodes an enzyme that catalyzes the formation of IE
from coniferyl acetate (Koeduka et al., 2006). PhPAAS encodes a bifunctional
decarboxylase/amine oxidase that catalyzes synthesis of PAA from phenylalanine (Kaminaga et
al., 2006). PhCFAT encodes an enzyme that catalyzes the formation of coniferyl acetate
(substrate for PhIGS1) from coniferyl alcohol and acetyl CoA (Dexter et al., 2007). Most

31
recently PhEGS1 was shown to produce eugenol from coniferyl acetate (Koeduka et la., 2008;
Koeduka et al., 2009a), but because the current work was started prior to these publications
PhEGS1 was unfortunately not included.
To date, a single transcriptional regulator involved in the production of floral volatile
benzenoids/phenylpropanoids has been identified from petunia. ODORANT 1 (PhODO1) is a
R2R3-MYB transcriptional regulator that functions to regulate gene expression in the shikimate
pathway (Verdonk et al., 2005). The shikimate pathway couples metabolism of carbohydrates to
formation of aromatic amino acids (Figure 1-1) [Herrmann and Weaver, 1999]. The
transcriptional up-regulation of the shikimate pathway genes upon anthesis elevates levels of
precursors, as deduced from benzoic acid levels, available for the floral volatile
benzenoid/phenylpropanoid biosynthesis pathways (Verdonk et al., 2005).
In petunia, pollination followed by increased ethylene production precede floral
senescence as the flower transitions from being a pollinator attractor to supporting seed
development (Hoekstra and Weges, 1986; Negre et al., 2003; Underwood et al., 2005). Upon
pollination of the MD flower, ethylene is rapidly produced in the stigma and style resulting in
increased ethylene production around 12 hours after pollination and peaking after approximately
24 hours in the ovary (Tang and Woodson, 1996). Subsequently, ethylene production is induced
in the corolla tissue between 24 and 36 hours after pollination (Jones et al., 2003). Thirty-six
hours after pollination, volatile benzenoid/phenylpropanoid emissions and transcript levels of
PhBSMT1 and PhBSMT2 are significantly reduced when compared to unpollinated MD flowers
or pollinated flowers of an ethylene-insensitive (CaMV 35S::etr1-1) transgenic petunia line,
44568 (Wilkinson et al., 1997; Negre et al., 2003; Underwood et al., 2005).

32
Since the petunia genes involved in the production of floral volatiles have been
characterized in various ways and in large part one gene at a time, conceptualizing these genes
into a specific group is difficult. Focusing at a molecular level, a spatial PhIGS1 transcript
accumulation profile has been reported (Koeduka et al., 2006), but a PhPAAS transcript
accumulation profile for a spatial, floral development, and daily time-course has been reported
(Orlova et al., 2006), while a spatial, daily time-course, and ethylene treated PhCFAT transcript
accumulation profile has been reported (Dexter et al., 2007). Therefore, the statement that the
genes involved in the production of floral volatiles share similar transcript accumulation profiles
throughout a spatial, floral development, daily time-course, and ethylene treatment is a putative
concept and requires further examination. We hypothesized the seven genes analyzed in this
study would share similar transcript accumulation profiles because the corresponding floral
volatile compounds share similar emission profiles. To test this hypothesis, we used four
transcript accumulation criteria (spatial, flower development, ethylene regulated and rhythmic)
and analyzed these seven FVBP gene transcript accumulation profiles in MD and 44568 plants.
The results show similar transcript accumulation profiles of the FVBP genes in three out of four
criteria examined. The FVBP gene group can be separated into two general rhythmic transcript
accumulation patterns. Finally, ethylene studies suggest a reversible mechanism to the ethylene-
dependent reduction of FVBP gene transcript levels.
Results
Spatial FVBP Gene Expression Analysis in MD Plants
The spatial transcript accumulation profiles for the floral volatile
benzenoid/phenylpropanoid (FVBP) genes PhBSMT1, PhBSMT2, PhBPBT, PhPAAS, PhIGS1,
PhCFAT, and PhODO1, were examined by semi-quantitative (sq)RT-PCR and quantitative
(q)RT-PCR. Root, stem, stigma, anther, leaf, petal tube, petal limb, and sepal tissues of MD

33
plants were harvested at 16:00 h. Compared to the other plant tissues examined, the highest
levels of FVBP gene transcripts were detected in the petal limbs of MD flowers (Figures 2-1 and
2-4A). PhBSMT1 mRNA was detected in the petal tube and limb. PhBSMT2 and PhIGS1
transcripts were detected in the stigma, anther, petal tube, and petal limb. Only PhBPBT mRNA
was detected in the petal limb and also weakly in leaf tissue. PhPAAS and PhCFAT transcripts
were only detected in petal limb, and PhODO1 mRNA was primarily detected in the petal limb
with lower levels observed in the petal tube, stem, and stigma. Combined, these results not only
corroborate the current literature (Negre et al., 2003; Boatright et al., 2004; Verdonk et al., 2005;
Underwood et al., 2005; Koeduka et al., 2006; Kaminaga et al., 2006; Dexter et al., 2007; Dexter
et al., 2008), but clearly illustrate coordinated transcription accumulation profiles for the seven
FVBP genes in floral limb tissue.
Developmental FVBP Gene Expression Analysis in MD and 44568 Flowers
To identify FVBP transcript accumulation profiles during floral development, whole
flowers were collected at eleven consecutive developmental stages of the MD and the ethylene-
insensitive 44568 flower lifecycle (Figure 2-2) and transcript levels were analyzed by sqRT-PCR
and qRT-PCR. This analysis revealed a common developmental transcript accumulation profile
for all genes examined (Figures 2-3 and 2-4B). In both MD and 44568 flowers, FVBP gene
transcripts were detected at relatively low levels throughout floral bud stages (1-5). In MD
flowers, high levels of FVBP gene transcripts were detected at anthesis (stage 6) and remained
high through the open flower stages (7-10), until transcript levels decreased upon senescence
(stage 11) [Figures 2-3A and 2-4B]. In 44568 flowers, FVBP gene transcripts were detected in a
similar developmental pattern through open flower stages as in MD flowers. However, FVBP
gene transcripts were more abundant in observably senescing 44568 flowers (Figure 2-3B) than
MD flowers at the same stage (11). The present analysis supports the existence of a concerted

34
system of transcriptional regulation with regard to these seven genes during the development of a
petunia flower.
Volatile Emission throughout Development from MD and 44568 Flowers
In order to compare the developmental transcript accumulation analysis (Figures 2-3 and
2-4B) to developmental volatile benzenoid/phenylpropanoid emission in petunia flowers; excised
whole buds and flowers from MD and 44568 plants at specific stages were analyzed for volatile
benzenoid/phenylpropanoid emission (Figure 2-5). Benzyl alcohol (BOH), benzyl benzoate
(BeBA), benzaldehyde (Bald), methyl benzoate (MeBA), methyl salicylate (MeSA), phenylethyl
benzoate (PhBA), phenylacetaldehyde (PAA), phenylethylalcohol (2-POH), eugenol (EG) and
isoeugenol (IE) emissions were measured at all floral developmental stages. All volatile
compounds analyzed in MD and 44568 flowers were either at the detection limit or below
detection in bud stages of floral development prior to stage 5. The initial detection of most
volatiles was at anthesis (stage 6). High amounts of all volatiles were detected throughout open
flower stages (stages 7-10) and markedly lower amounts of most volatiles were detected in
senescing tissue (stage 11) of MD flowers but not 44568 flowers (Figure 2-5). These data
coincide with the FVBP gene transcript results (Figures 2-3 and 2-4B). That is, FVBP gene
transcripts and FVBP emissions are low or not detected in floral bud stages (1-5). The initial
detection of substantial levels of both FVBP gene transcripts and emissions are at anthesis (stage
6) and high levels of both are detected throughout open flower stages (7-10). In addition,
comparison of MD and 44568 FVBP transcript abundance and volatile emissions in senescing
floral tissues (stage 11) supports the association further. Low levels of FVBP gene transcripts
and emissions are found in MD flowers, but relatively higher amounts of FVBP gene transcripts
and emissions are found in 44568 flowers (Figures 2-3 and 2-5).

35
Ethylene Dependent Down-Regulation of FVBP Gene Expression
Comparison between MD and 44568 FVBP gene transcript levels at developmental stage
11 (Figure 2-3) suggests transcription of all seven FVBP genes is affected by ethylene. To test
this hypothesis, excised MD and 44568 flowers were treated with air or ethylene for 0, 1, 2, 4,
and 8 hrs and gene transcript accumulation was analyzed by sqRT-PCR and qRT-PCR. All
FVBP genes examined showed a reduction of transcript levels in MD flowers treated with
ethylene compared to those treated with air (Figures 2-6 and 2-4C). In contrast, no reduction of
expression was observed for any of the FVBP genes in 44568 flowers treated with ethylene or
air.
PhBSMT1, PhBSMT2, and PhCFAT transcripts were reduced in MD flowers after two
hours of ethylene exposure (Figure 2-6), which agreed with previously published data (Negre et
al., 2003; Underwood et al., 2005; Dexter et al., 2007). PhPAAS and PhODO1 transcript levels
were also reduced after two hours of ethylene treatment in MD flowers. PhBPBT and PhIGS1
transcript levels were reduced after four hours of ethylene treatment. These data show that two to
four hours of exogenously applied ethylene is sufficient to reduce transcript levels of all seven
FVBP genes examined in MD flowers.
Volatile Emission after Exogenous Ethylene Treatment
Ten hours of exogenous ethylene treatment has been shown to accelerate floral
senescence and permanently reduce volatile emission in petunia flowers (Underwood et al.,
2005). Two hours of ethylene treatment is sufficient to reduce transcript accumulation from
many of the FVBP genes (Figure 2-6) without accelerating senescence (Figure 2-7). Therefore,
MD and 44568 flowers were excised and treated with ethylene for 0, 2, and 10 h starting at 20:00
h of day 1 to determine if short term ethylene exposure that does not lead to senescence would
lead to a permanent reduction in floral volatile benzenoid/phenylpropanoid synthesis. Individual

36
volatiles emitted from 44568 flowers the day after air and ethylene treatments were similar.
Twenty four hours after the start of treatments, volatiles emitted from MD flowers treated with
ethylene for 10 hours were greatly reduced. However, volatiles from MD flowers treated with
ethylene for two hours were comparable to volatile levels of air treated MD flowers (Figure 2-8).
Therefore, a relatively short exposure (two hours) to ethylene that did not accelerate senescence
did not reduce volatile emissions, whereas a longer exposure (ten hours) to ethylene that did
accelerate senescence (Figure 2-7) reduced volatile emissions. These results suggest a reversible
component of ethylene in the regulation of floral volatile benzenoid/phenylpropanoid production
in MD flowers, which is dependent on the exposure duration.
Rhythmic Regulation of FVBP Gene Expression in MD Flowers
Since emission of FVBPs is rhythmic and peaks around 1:00 h (Verdonk et al., 2005),
FVBP gene transcript accumulation was analyzed by sqRT-PCR from stage 9 corollas every
three hours over a 36 hour time period to achieve comparable, daily expression profiles in MD
flowers. In general PhBSMT1, PhBSMT2, PhBPBT, PhPAAS, and PhIGS1 (genes responsible for
the direct formation of emitted volatile compounds) transcripts were detected at high levels
during the light period (6:00 to 21:00 h), and lowest mRNA levels detected during the dark
period, 24:00 to 6:00 h (Figure 2-9). PhCFAT and PhODO1 (genes responsible for the
availability of precursors and direct substrates for the above mentioned genes) transcripts were
detected at high levels late in the light period and into the dark period (15:00 to 3:00 h).
PhODO1 and PhCFAT transcript accumulation profiles demonstrate an obvious shift towards the
dark period as compared to the other FVBP transcript profiles examined These data indicate the
presence of at least two transcriptional regulatory systems controlling rhythmicity of FVBP gene
transcript accumulation in MD flowers.
37
PhPAAS Activity in MD Flowers
Transcript levels for the FVBP genes and volatile emission are rhythmic in petunia
(Figure 8; Verdonk et al., 2005). To determine if protein activity contributes to rhythmic volatile
emission, PhPAAS activity was examined in MD limb tissue from developmentally identical
flowers (stage 8) at four time-points. Over the course of a 24 h experiment with time-points
every six hours, PhPAAS activity was not significantly different from sample to sample (Figure
2-10). These data along with the data in figure 8 suggest that as is the case for PhBSMT activity
(Kolosova et al., 2001a), rhythmic phenylacetaldehyde emission is not limited by enzyme
activity levels, but rather the availability of substrate for PhPAAS.
Discussion
Through the efficient transcript accumulation analysis of the seven floral volatile
benzenoid/phenylpropanoid (FVBP) genes investigated here, it is now clear the FVBP genes are
spatially, developmentally, and ethylene regulated at the transcriptional level as a coordinated
group. Compared to the other plant tissues examined, the highest levels of FVBP gene transcripts
are in the petal limbs of MD flowers (Figure 2-1). This is in accordance with the specific floral
tissue where the majority of volatile benzenoid/phenylpropanoid compounds are detected in the
MD flower (Verdonk et al., 2003; Underwood et al., 2005; Dexter et al., 2007). Thus, an organ
specific biological association between floral volatile benzenoid/phenylpropanoid production and
gene regulation is apparent. These observations suggest a potential reproductive advantage for a
fragrant flower with this level of spatial regulation by attracting a pollinator to the specific area
where the best opportunity lies to come in contact with the receptacle for the male gametes and
access the nectary (reward for the pollinator).
In order to better understand the regulation of floral volatile emission, we have examined
a large set of FVBP genes in developmentally staged tissues. The resolution and standardization

38
of the petunia floral developmental stages (Figure 2-2) shows a tightly regulated subset of genes
prior to and after anthesis in both MD and 44568 flowers. Transcripts from all FVBP genes
examined are detected at the fully elongated bud stage (stage 5), followed by a substantial
increase in transcript levels as the flower begins to open and becomes receptive to pollination
(Figures 2-3 and 2-4B). Essentially, stages 1-5 of development can be termed “Box 1” of flower
development in petunia. Box 1 is characterized with corolla tube elongation, pigment production
in colored cultivars, a minimum level of FVBP gene transcripts (Figures 2-3 and 2-4B) and a
minimum level of volatile emissions detected in MD (Figure 2-5) [Weiss et al., 1995; Ben-
Nissan and Weiss, 1996; Moalem-Beno et al., 1997; Verdonk et al., 2003]. In short, Box 1 is a
growth and maturation stage of development in a petunia flower. The next major developmental
stage, anthesis (stage 6), is the transitionary stage (TS) between Box 1 and “Box 2” of flower
development where the flower function shifts from growth and maturation to pollinator attraction
and fertilization. The TS is characterized by slowed elongation of the corolla tube tissue, the
incipient opening of the corolla limb, and up-regulation of the FVBP genes (Figures 2-3 and 2-
4B). Box 2 encompasses the functional reproductive stage of flower development (open flowers)
and is defined by volatile benzenoid/phenylpropanoid synthesis and emission (Figures 2-3, 2-4B,
and 2-5). In a MD flower, anthers dehisce to disperse the male gametes (Wang and Kumar,
2007), and upon pollination and successful fertilization is followed by an ethylene mediated
senescence of the corolla tissue (Negre et al., 2003; Underwood et al., 2005). This stage of
flower development requires a large commitment of energy and resources in the synthesis of
fragrance to facilitate reproduction. Therefore, the high level of FVBP gene transcription only
when the flower is receptive to pollination is an excellent means to efficiently utilize metabolites.

39
We hypothesized that benzenoid/phenylpropanoid emission from developing MD and
44568 flowers would be similar from stage 1 to stage 10 of flower development, due to the
similarity in FVBP gene expression between MD and 44568 flowers (Figure 2-3). In general, this
is the case up to stage 11. The difference in volatile emission between MD and 44568 flowers at
stage 11 can be explained by relatively higher levels of FVBP transcripts detected in observably
senescing 44568 flowers when compared to transcript levels in MD flowers at the same stage
(Figures 2-3 and 2-5). Stage 11 is accompanied by endogenous ethylene production mediating
senescence in MD; however, in 44568 the ethylene is not perceived and results in a longer floral
lifespan and presumably continued transcription of the FVBP genes with concomitant FVBP
emission. Therefore, the developmental gene expression and emission observations suggest a
developmentally direct relationship between FVBP gene transcript abundance and FVBP
emissions.
We then tested all seven FVBP genes for any transcriptional effect subsequent to
exogenously applied ethylene. Indeed, as indicated from the developmental FVBP gene
expression comparison between MD and 44568 (Figure 2-3), where transcripts examined are still
detected at substantial levels in observably senescing 44568 flowers when compared to MD
flowers, ethylene treatment for two to four hours was sufficient to reduce transcript levels of the
FVBP genes in MD flowers, but not in 44568 flowers (Figures 2-4C and 2-6). Thus, it is now
evident that all seven of these FVBP genes are transcriptionally affected by ethylene exposure in
a similar manner suggesting that there are transcriptional regulators common to all the FVBP
genes examined here.
Since either pollination or 10 hours of exogenous ethylene treatment induces senescence
in MD flowers (Wilkinson et al., 1997; Underwood et al., 2005) we postulated that the system-
40
wide repression of transcription for the FVBP genes by ethylene was due to an irreversible
senescence program. While two hours of ethylene treatment is sufficient to reduce transcript
levels of PhBSMT1, PhBSMT2, PhPAAS, PhCFAT, and PhODO1 (Figure 2-6), this treatment
does not accelerate floral senescence in MD flowers (Figure 2-7). Therefore we tested if two
hours of ethylene treatment causes a long-term reduction of floral volatile emission in MD
flowers. After two hours of ethylene treatment, flowers emitted levels of volatile
benzenoids/phenylpropanoids equivalent to those of untreated flowers. In contrast, MD flowers
treated with ethylene for 10 hours emitted greatly reduced levels of volatiles (Figure 2-8) and
senesced earlier (Figure 2-7) than air treated flowers. These observations indicate MD flowers
can tolerate a short burst of ethylene without entering into senescence and with no effect on
floral volatile emission (reversible component), but a longer and sustained exposure to ethylene
triggers a senescence program and long term reduction in volatile emission (irreversible
component).
While a single molecular mechanism was not elucidated through the ethylene studies
shown here, together these data along with previous findings (ethylene effect on PhBSMT
activity (Negre et al., 2003)) clearly support a role for ethylene at the transcriptional and post-
transcriptional levels in the regulation of floral volatile benzenoid/phenylpropanoid production in
petunia flowers. Thus, the ethylene regulation imparted upon floral volatile production is
multifaceted and may consist of more than one molecular action.
The rhythmic emission of floral volatile benzenoids/phenylpropanoids peaks around 1:00
h (Verdonk et al., 2005), which corresponds to when nocturnal moths, suspected petunia
pollinators, are active (Hoballah et al., 2005). However, PhBSMT1, PhBSMT2, PhBPBT,
PhPAAS, and PhIGS1 transcript accumulation peaks around 15:00 h (Figure 2-9) [Negre et al.,

41
2003; Boatright et al., 2004; Underwood et al., 2005; Kaminaga et al., 2006; Koeduka et al.,
2006; Orlova et al., 2006; Dexter et al., 2008], while PhODO1 and PhCFAT transcript
accumulation peaks around 21:00 h (Figure 2-9) [Verdonk et al., 2005; Dexter et al., 2007]. In
addition, the internal substrate pools of benzoic acid and cinnamic acid are relatively low
(around 4 and 0.04 µg gfw-1 respectively) at 10:00 h and are at high levels (around 24 and 0.4 µg
gfw-1 respectively) at 22:00 h (Boatright et al., 2004; Underwood et al., 2005; Orlova et al.,
2006). Therefore, PhODO1 (regulating shikimate genes) and PhCFAT (responsible for the
formation of the substrate for PhIGS1) transcript accumulation, internal substrate pool
accumulation, and floral volatile benzenoid/phenylpropanoid emission demonstrate concurrent
timing. In contrast, peak transcript levels of the genes responsible for the direct formation of
emitted floral benzenoid/phenylpropanoid compounds (PhBSMT1, PhBSMT2, PhBPBT,
PhPAAS, and PhIGS1) precedes volatile emission by approximately six hours, while PhBSMT
and PhPAAS activity (Kolosova et al., 2001 and Figure 2-10, respectively) do not reflect a
rhythmic nature required for control over the rhythmic emission of floral volatiles in flowers.
Thus, the rhythmic transcript accumulation of at least the FVBP genes PhBSMT1, PhBSMT2,
and PhPAAS are not the determining factor for rhythmic emission of the floral volatiles. In
contrast, oscillations of precursor pools and the rhythmic transcript accumulation of PhODO1
suggest the regulation controlling the rhythmic emission of floral fragrance is upstream in the
floral volatile benzenoid/phenylpropanoid biosynthetic pathway, perhaps at the first committed
step in phenylalanine biosynthesis.
The transcript accumulation analyses in this study illustrate four criteria with multiple
categories therein, which can be used to standardize the characterization of any FVBP genes
identified in the future. The seven FVBP genes examined here, are likely a part of a common

42
transcriptionally regulated network throughout three expression criteria (spatial, developmental,
and ethylene regulated). Interestingly, two distinct rhythmic transcript accumulation profiles are
clear, while the volatile emission profile has a single peak. Together, these observations suggest
the rhythmic production and emission of volatile benzenoids/phenylpropanoids from the MD
flower is controlled by the availability of substrates for the enzymes responsible (example:
PhBSMT and PhPAAS) for the direct formation of the emitted volatile compounds. However,
the regulatory mechanism depicting the level of corresponding transcripts to enzyme activity is
not known. Furthermore, the regulatory role of ethylene may be more complex than merely a
protagonist to floral senescence in the flower of Petunia hybrida cv. ‘Mitchell Diploid’.
Experimental Procedures
Plant Materials
Inbred Petunia x hybrida cv ‘Mitchell Diploid’ (MD) plants were utilized as a ‘wild-type’
control in all experiments. The ethylene-insensitive CaMV 35S:etr1-1 line 44568, generated in
the MD genetic background (Wilkinson et al., 1997), was utilized as a negative control for
ethylene sensitivity where applicable. MD and 44568 plants were grown as previously described
(Underwood et al., 2005; Dexter et al., 2007). A growth chamber (Environmental Growth
Cambers, model TC-1, Chagrin Falls, OH, USA) was utilized for experiments to determine
rhythmic regulation of the FVBP genes. The chamber was programmed for 16 hrs light
(approximately 400 µmol m-2 s-1) and 8 hrs dark with a temperature of 24oC. Four MD plants
were acclimated in the growth chamber for two weeks prior to the start of the experimental
collection. For exogenous application of ethylene experiments, excised MD and 44568 flowers
from greenhouse grown plants were placed in 40 L glass tanks located in a climate controlled
(23oC) room with 10 µmol m-2 s-1 of fluorescent light. All exogenous ethylene treatments used
two µL L-1 of ethylene with air treatments for controls.

43
Expression Series Construction
All expression experiments were conducted multiple times with equivalent results
observed, and in all cases, total RNA was extracted as previously described (Verdonk et al.,
2003). To determine the spatial regulation of all the FVBP genes in MD plants total RNA was
isolated from root, stem stigma, anther, leaf, petal tube, petal limb, and sepal tissues of three
individual plants at 16:00 h. To examine the developmental regulation of all FVBP genes, MD
and 44568 floral tissue was collected at eleven different stages; floral bud < 0.5 cm, bud 0.5 <
1.5 cm, bud 1.5 < 3.0 cm, bud 3.0 < 5.0 cm, bud fully elongated 5.0 < 6.5 cm, flower opening 0 <
2 cm limb diameter (anthesis), flower fully open day 0, day 1, day 2, day 3, and observably
senescing flower (flower opening day 7 for MD and flower opening day 13 for 44568 [due to the
delayed senescence phenotype of 44568 flowers]). All tissues were collected at 16:00 h on the
same day, and total RNA was isolated from all samples collected. To determine rhythmic
regulation of the FVBP genes, on day 1 of tissue collection, five randomly selected corollas per
stage were collected at 6:00 h and every three hours thereafter for a total of 36 hours. Samples
were frozen in liquid N2 and stored at -80°C. Total RNA was then isolated from all samples
including multiple biological replicates. To investigate the effects of exogenous ethylene on the
FVBP gene transcription, excised MD and 44568 fully open day 2 flowers (placed in tap water)
from greenhouse grown plants were acclimated to treatment conditions for four hours prior to
treatment. All excised flowers were placed into eight tanks, four for ethylene treatments and four
for air treatments. Air and ethylene treatments were conducted for 0, 1, 2, 4, and 8 hours starting
at 12:00 h. Individual samples consisted of three flowers. Immediately following treatment, each
of the flower samples were collected, stored at -80oC, and then total RNA was isolated from all
corolla tissues once all samples had been collected.
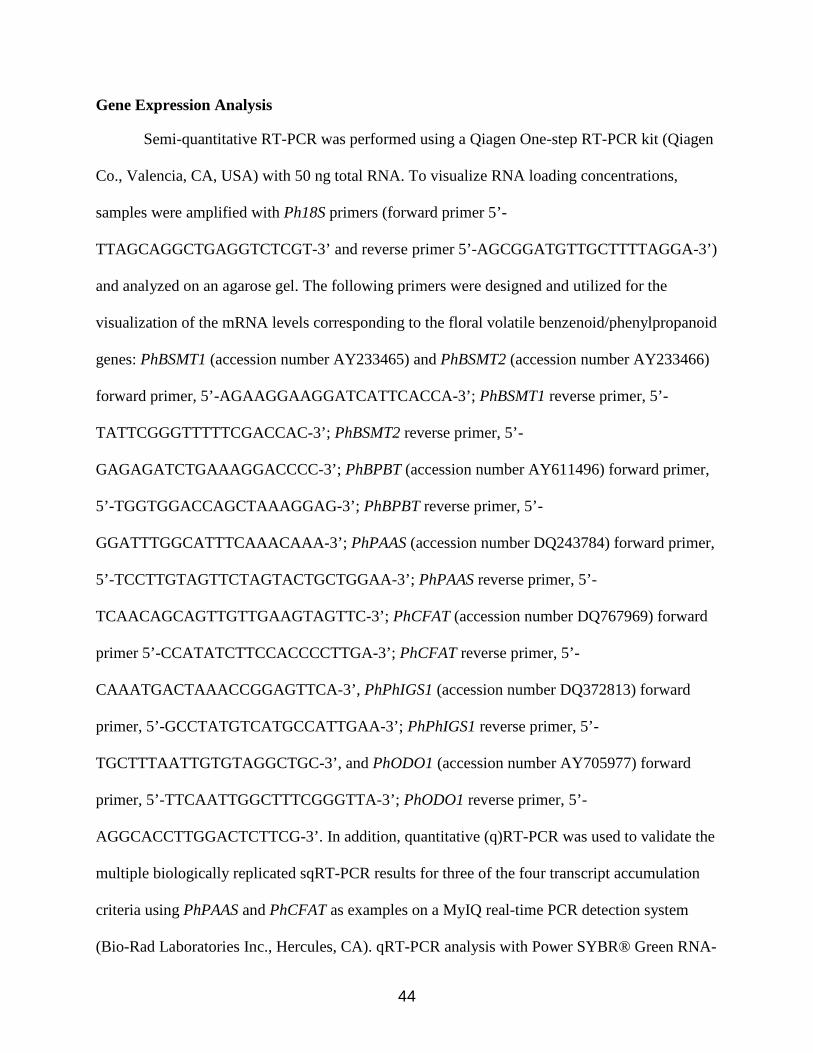
44
Gene Expression Analysis
Semi-quantitative RT-PCR was performed using a Qiagen One-step RT-PCR kit (Qiagen
Co., Valencia, CA, USA) with 50 ng total RNA. To visualize RNA loading concentrations,
samples were amplified with Ph18S primers (forward primer 5’-
TTAGCAGGCTGAGGTCTCGT-3’ and reverse primer 5’-AGCGGATGTTGCTTTTAGGA-3’)
and analyzed on an agarose gel. The following primers were designed and utilized for the
visualization of the mRNA levels corresponding to the floral volatile benzenoid/phenylpropanoid
genes: PhBSMT1 (accession number AY233465) and PhBSMT2 (accession number AY233466)
forward primer, 5’-AGAAGGAAGGATCATTCACCA-3’; PhBSMT1 reverse primer, 5’-
TATTCGGGTTTTTCGACCAC-3’; PhBSMT2 reverse primer, 5’-
GAGAGATCTGAAAGGACCCC-3’; PhBPBT (accession number AY611496) forward primer,
5’-TGGTGGACCAGCTAAAGGAG-3’; PhBPBT reverse primer, 5’-
GGATTTGGCATTTCAAACAAA-3’; PhPAAS (accession number DQ243784) forward primer,
5’-TCCTTGTAGTTCTAGTACTGCTGGAA-3’; PhPAAS reverse primer, 5’-
TCAACAGCAGTTGTTGAAGTAGTTC-3’; PhCFAT (accession number DQ767969) forward
primer 5’-CCATATCTTCCACCCCTTGA-3’; PhCFAT reverse primer, 5’-
CAAATGACTAAACCGGAGTTCA-3’, PhPhIGS1 (accession number DQ372813) forward
primer, 5’-GCCTATGTCATGCCATTGAA-3’; PhPhIGS1 reverse primer, 5’-
TGCTTTAATTGTGTAGGCTGC-3’, and PhODO1 (accession number AY705977) forward
primer, 5’-TTCAATTGGCTTTCGGGTTA-3’; PhODO1 reverse primer, 5’-
AGGCACCTTGGACTCTTCG-3’. In addition, quantitative (q)RT-PCR was used to validate the
multiple biologically replicated sqRT-PCR results for three of the four transcript accumulation
criteria using PhPAAS and PhCFAT as examples on a MyIQ real-time PCR detection system
(Bio-Rad Laboratories Inc., Hercules, CA). qRT-PCR analysis with Power SYBR® Green RNA-

45
to-Ct™ 1-Step Kit (Applied Biosystems, Foster City, CA) was used to amplify and detect
resulting products following the manufacturer’s protocol. The following qRT-PCR primers were
constructed in Primer Express® software v2.0 (Applied Biosystems, Foster City, CA) and
demonstrated gene specificity during melt curve analysis and then optimized: PhPAAS forward
primer, 5’-CCAACCCGAACCAATTGAGA-3’; PhPAAS reverse primer, 5’-
CCTGGGAAAATATCGCTTCGA-3’; PhCFAT forward primer, 5’-
AGGCAACTCGCAATGGAAGT-3’; PhCFAT reverse primer, 5’-
AGGCGCTGAAACACTCCAAT-3’; PhFBP1 (M91190) forward primer, 5’-
TGCGCCAACTTGAGATAGCA-3’; PhFBP1 reverse primer, 5’-
TGCTGAAACACTTCGCCAATT-3’; Pa18S (AJ236020) forward primer, 5’-
TGCAACAAACCCCGACTTCT-3’; Pa18S reverse primer, 5’-
AGCCCGCGTCAACCTTTTAT-3’.
Floral Volatile Experiments and Emitted Volatile Quantification
For all volatile emission experiments, emitted floral volatiles from excised flowers were
collected and quantified as previously described (Underwood et al., 2005; Dexter et al., 2007).
For the developmental volatile emission experiment, flowers from MD and 44568 plants were
analyzed for levels of emitted volatile compounds at each stage shown in figure 3. All flowers
were tagged at stage 6 and allowed to reach the desired age as judged by days after this stage.
Volatile collections were performed on three flowers for each developmental stage at 19:00 h,
and each sample was replicated three times.
For volatile emission analysis from MD and 44568 flowers after ethylene treatment, open
flowers at comparable stages of development were excised and used after a four hour acclimation
period. Treatments started at 20:00 h of day 1 and lasted two and ten hours respectively with air
treatments as controls. After all treatments, flowers were placed in ambient air conditions in the

46
same climate controlled room until 20:00 h of day 2. Therefore 24 hours after the start of all
treatments floral volatiles were collected and quantified. All treatments consisted of three
flowers per sample and six replicates for each sample.
Determination of PAAS Activity in Limb Crude Protein Extract
Limb tissue from developmentally identical flowers (beginning at flower open day 1,
stage 8) were collected at 18:00 h, 0:00 h, 6:00 h, and 12:00 h from MD plants grown as
previously described (Underwood et al., 2005; Dexter et al., 2007). Frozen limb tissue from nine
flowers per sample was disrupted with liquid nitrogen in mortar and pestles. Chilled extraction
buffer (50 mM Tris pH 8.5, 10 mM β-mercaptoethanol, 5 mM Na2S2O5, 0.2 mM pyridoxal 5′-
phosphate, 1% polyvinylpyrrolidone MW 360,000, 1mM phenylmethanesulphonylfluoride, and
10% glycerol) was added to the ground tissue and further disrupted until the material was liquid.
Samples were centrifuged at 12,000 x g for 15 minutes. The supernatant was desalted and
concentrated with centrifugal filters (Millipore) designed to eliminate compounds < 30,000
daltons. Phenylacetaldehyde synthase (PhPAAS) activity was measured through the production
of 14C-CO2 in reactions containing 30 µM L-[U-14C] phenylalanine (Amersham), 50 mM Tris pH
8.5, 0.2 mM pyridoxal 5′-phosphate, 0.1 mM EDTA, and 20 µL protein extract. 14C-CO2 was
collected on filter paper infused with 2N KOH as described by Tieman et al., 2006. Reactions
were incubated at room temperature for 30 minutes. Captured 14C-CO2 was quantified by
scintillation counting. Activity in the extracts was determined against background activity in
assays with boiled protein and reactions without protein. Results were averaged from three
replicate assays per sample and two sets of duplicate tissues per time-point. Production of
phenylacetaldehyde was verified by GC-MS from separate reactions containing 12C-
phenylalanine and otherwise identical reaction conditions.

47
Floral Longevity Subsequent to Ethylene Application in MD and 44568 Flowers
Excised MD and 44568 flowers were placed in water and treated with ethylene for 0, 2,
and 10 hours (Fig S1). After all treatments the flowers were allowed ambient air conditions and
monitored for signs of senescence for an experimental total of 32 h. Four flowers per genetic
background were used for each time-point and the experiment was replicated three times.
Acknowledgements
The authors wish to thank Becky Hamilton and Joshua Bodenweiser for their excellent
care of the petunia plants. This work was supported by grants from the USDA Nursery and
Floral Crops Initiative, the Fred C. Gloeckner Foundation, and the Florida Agricultural
Experiment Station.

48
Figure 2-1. Tissue specific transcript accumulation analysis of seven FVBP genes in MD. Root,
stem, stigma, anther, leaf, petal tube, petal limb, and sepal tissues were collected and total RNA was isolated from three MD plants at 16:00 h. Primers specific for PhBSMT1, PhBSMT2, PhBPBT, PhPAAS, PhIGS1, PhCFAT, and PhODO1 with Ph18S as a loading control were used for semi-quantitative RT-PCR. The number of cycles used for amplification of each gene is shown on the right.

49
Figure 2-2. Picture of floral stages used for the developmental studies in MD and 44568. Floral
tissues were collected at 11 different developmental stages; bud < 0.5 cm (1), bud 0.5 <1.5 cm (2), bud 1.5 < 3 cm (3), bud 3 < 5 cm (4), fully elongated bud 5 < 6.5 cm (5), flower opening [limb diameter 0 < 2 cm] (6), flower open day 0 (7), flower open day 1 (8), flower open day 2 (9), flower open day 3 (10), and observably senescing flower [flower open day 7 for MD and flower open day 13 for 44568] (11).

50
Figure 2-3. Developmental transcript accumulation analysis of seven FVBP genes in MD (A)
and 44568 (B). Floral tissues were collected at 11 different developmental stages as shown in figure 3. Primers specific for PhBSMT1, PhBSMT2, PhBPBT, PhPAAS, PhIGS1, PhCFAT, and PhODO1 with Ph18S as a loading control were used for semi-quantitative RT-PCR. The number of cycles used for amplification of each gene is shown on the right.

51
Figure 2-4. qRT-PCR transcript accumulation analysis of PhPAAS and PhCFAT in petunia.
Spatial analysis used root, stem, stigma, anther, leaf, petal tube, petal limb, and sepal tissues of MD harvested at 16:00 h (A) The spatial experiment consisted of one biological replicate used for sqRT-PCR and one separate biological replicate with two technical replicates per biological replicate. Floral developmental analysis used MD flowers from 11 sequential stages at 16:00 h (B) The MD developmental analysis consisted of one biological replicate separate from the biological replicates used for the sqRT-PCR with three technical replicates. Ethylene treatment (two µL L-1) analysis used excised MD and 44568 whole flowers treated for 0, 1, 2, 4, and 8 hours (C) The ethylene treated series consisted of one biological replicate used in the sqRT-PCR with two technical replicates. PhFBP1 and Ph18S were used as references throughout these experiments.

52

53
Figure 2-5. Developmental floral emission analysis of major volatile compounds from MD and 44568 flowers (mean ± se; n = 3). Each graph shows the concentration (ng g-1 fw hr-1) of individual volatile compounds emitted from excised MD (black bars) and 44568 (gray bars) flowers over the course of eleven floral developmental stages as depicted in figure 3. Volatile collection was performed on whole flowers at 19:00 h.
Figure 2-6. Transcript accumulation analysis of seven FVBP genes in MD flowers and 44568
flowers. MD and 44568 flowers were treated with ethylene (two µL L-1) and air for 0, 1, 2, 4, and 8 hours. Corolla limbs were collected immediately after each time-point and total RNA was isolated. Primers specific for the floral volatile genes PhBSMT1, PhBSMT2, PhBPBT, PhPAAS, PhIGS1, PhCFAT, and PhODO1 with Ph18S as a loading control were used for semi-quantitative RT-PCR. The number of cycles used for amplification of each gene is shown on the right.

54
Figure 2-7. Picture of MD and 44568 flowers 32 hours after the initial treatments of ethylene for
0, 2, 4, 8, and 10 hours. MD is the left column and 44568 is the right column.

55
Figure 2-8. Emission analysis of major volatile compounds from MD and 44568 flowers
subsequent to differential durations of ethylene exposure (mean ± se; n = 6). Excised MD and 44568 flowers were treated with ethylene (two µL L-1) for 0, 2, and 10 hours beginning at 20:00 h on day 1. Upon completion of treatments, flowers were allowed ambient air conditions until 20:00 h on day 2 when volatile emissions were collected and quantified. Each graph shows the concentration (ng g-1 fw hr-1) of individual volatile compounds emitted from MD and 44568 flowers.
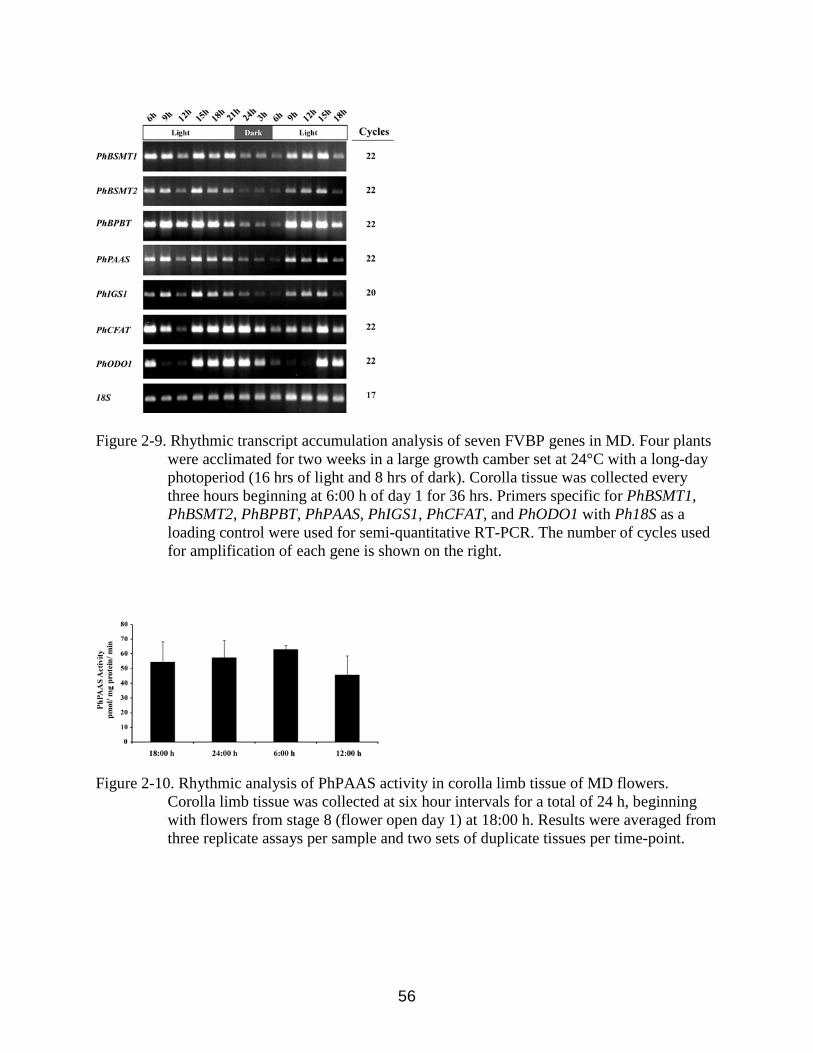
56
Figure 2-9. Rhythmic transcript accumulation analysis of seven FVBP genes in MD. Four plants
were acclimated for two weeks in a large growth camber set at 24°C with a long-day photoperiod (16 hrs of light and 8 hrs of dark). Corolla tissue was collected every three hours beginning at 6:00 h of day 1 for 36 hrs. Primers specific for PhBSMT1, PhBSMT2, PhBPBT, PhPAAS, PhIGS1, PhCFAT, and PhODO1 with Ph18S as a loading control were used for semi-quantitative RT-PCR. The number of cycles used for amplification of each gene is shown on the right.
Figure 2-10. Rhythmic analysis of PhPAAS activity in corolla limb tissue of MD flowers.
Corolla limb tissue was collected at six hour intervals for a total of 24 h, beginning with flowers from stage 8 (flower open day 1) at 18:00 h. Results were averaged from three replicate assays per sample and two sets of duplicate tissues per time-point.

57
CHAPTER 3 A SPECIALIZED CHORISMATE MUTASE IN THE FLOWER OF PETUNIA X HYBRIDA
Preface
This work has been submitted to and accepted in modified form at The Plant Journal for
publication (Thomas A. Colquhoun, Bernardus C.J. Schimmel, Joo Young Kim, Didier
Reinhardt, Kenneth Cline and David G. Clark. [2009] A petunia chorismate mutase specialized
for the production of floral volatiles. Plant J. [In Press])
Introduction
Flowering plant species have developed several mechanisms for attracting pollinating
organisms. Flower shape, color, and fragrance all contribute to an increased specialization of the
floral phenotype aimed at the attraction of a pollinator (Fenster et al., 2004). Floral fragrance
consists of an assortment of volatile organic molecules, which are commonly referred to as a
scent bouquet. These volatile organic compounds are not only involved in plant reproductive
processes, but also in plant-plant interactions, defense, and abiotic stress responses (Dudareva et
al., 2006). The majority of volatile compounds are lipophilic liquids with high vapor pressures,
which cross biological membranes freely in the epidermal cells of the petal (Pichersky et al.,
2006). Floral volatiles are generally differentiated into three main groups;
benzenoids/phenylpropanoids, terpenoids, and fatty acid derivatives.
Petunia (Petunia x hybrida cv ‘Mitchell Diploid’ [MD]) synthesizes and emits 13 known
floral volatile benzenoid/phenylpropanoid (FVBP) compounds (Kolosova et al., 2001; Verdonk
et al., 2003; Boatright et al., 2004; Verdonk et al., 2005; Koeduka et al., 2006) [Figure 1-1]. The
majority of FVBP compounds are putatively derived from the aromatic amino acid phenylalanine
(Boatright et al., 2004; Schuurink et al., 2006). Eight genes that are known to participate in
FVBP synthesis have been isolated from petunia: PhBSMT1, PhBSMT2, PhBPBT, PhPAAS,

58
PhIGS1, PhEGS1, PhCFAT, and PhODO1 (Negre et al., 2003; Boatright et al., 2004;
Underwood et al., 2005; Verdonk et al., 2005; Kaminaga et al., 2006; Koeduka et al., 2006;
Orlova et al., 2006; Dexter et al., 2007; Dexter et al., 2008; Koeduka et al., 2008) [Figure 1-1].
All of these gene products are involved in the direct formation of a FVBP compound except
PhODO1 (Verdonk et al., 2005), which is a transcriptional regulator, and PhCFAT (Dexter et al.,
2007), which produces substrate for PhIGS1 and PhEGS1.
Regulation of the petunia FVBP system is complex and very specific. Substantial
emission of MD FVBPs is confined to the corolla limb tissue during open flower stages of
development, which coincides with the presentation of the reproductive organs (Verdonk et al.,
2003). MD FVBP internal substrate pool accumulation and emission is diurnal with the highest
level detected during the dark period (Kolosova et al., 2001; Verdonk et al., 2003; Underwood et
al., 2005; Verdonk et al., 2005). FVBP synthesis and emission, FVBP gene transcript
accumulation, and PhBSMT activity are greatly reduced following a successful
pollination/fertilization event or exogenous treatment with ethylene (Hoekstra and Weges, 1986;
Negre et al., 2003; Underwood et al., 2005). Subsequent to a successful fertilization event, the
corolla tissue senesces as the petunia flower shifts from pollinator attraction to supporting seed
set.
The shikimate pathway couples metabolism of carbohydrates to the formation of
aromatic amino acids (Figure 3-1) [Herrmann and Weaver, 1999]. CHORISMATE MUTASE
(CM) catalyzes an intramolecular, [3,3]-sigmatropic rearrangement of chorismic acid to
prephenic acid, the initial committed step in phenylalanine and tyrosine biosynthesis (Haslem,
1993). In Arabidopsis thaliana, three CM genes have been identified and characterized: AtCM1,
AtCM2, and AtCM3 (Eberhard et al., 1996b; Mobley et al., 1999). AtCM1 and AtCM3 encode

59
putatively plastid localized CM isoforms, which are allosterically down-regulated by
phenylalanine and tyrosine, but up-regulated by tryptophan. AtCM2 encodes a CM isoform not
regulated by aromatic amino acids and appears to be located in the cytosol.
The majority of floral volatile studies in petunia have focused on identification of gene
products involved in the formation of individual, emitted FVBP compounds (i.e. genes at the end
of the FVBP pathway). Since the FVBPs are putatively derived from phenylalanine and CM is
the first committed step in phenylalanine biosynthesis, we identified and characterized two
petunia CM cDNAs (PhCM1 and PhCM2). Additionally, we identify the principal CM
responsible for the production of FVBP compounds in petunia.
Results
Identification of Two Distinct CM cDNAs
To identify putative CM genes, we searched a publicly available petunia EST database
(http://www.sgn.cornell.edu) and a petunia root EST collection (courtesy of Dr. Didier Reinhardt
at the University of Fribourg) for sequences with homology to any of the three CM genes from
Arabidopsis thaliana. The in silico analysis identified two partial ESTs whose full-length
sequences were recovered by 5’ and 3’ RACE technology. These two sequences exhibited high
similarity to AtCMs and were subsequently renamed CHORISMATE MUTASE1 (PhCM1) and
CHORISMATE MUTASE2 (PhCM2), which were deposited in GenBank under accession
numbers, EU751616 and EU751617, respectively (Figure 3-2).
The predicted PhCM1 and PhCM2 proteins were 324 and 263 amino acids in length,
respectively. PhCM1 contains a predicted N-terminal chloroplast transit peptide (cTP) of 56
amino acids (ChloroP 1.1) and is therefore predicted to be plastid localized (Predator v. 1.03),
while PhCM2 is likely located in the cytosol (Benesova and Bode, 1992). The predicted mature
PhCM1 and PhCM2 share 46.7 % amino acid identity. When aligned with CM amino acid

60
sequences from Arabidopsis thaliana, Fagus sylvatica, Solanum lycopersicum, Nicotiana
tabacum, Oryza sativa, Vitis vinifera, Zea mays, and Saccharomyces cerevisiae common
sequence features including a CM_2 superfamily domain in the N-terminal half of the predicted
proteins and a conserved C-terminal domain of 19 amino acids were observed (Figure 3-3A).
Additionally, an allosteric regulatory site (GS marked by red box) was present in PhCM1, but
not PhCM2, which would be consistent with aromatic amino acid regulation of the putative
plastidic PhCM1. Phylogenetic analysis demonstrated that the three solanaceous cytosolic CMs
closely associate in an unrooted neighbor-joining tree (Figure 3-3B). PhCM1 associates with
CMs from multiple species containing both a predicted cTP and the allosteric regulatory site.
PhCM1 shares 62.2 % identity with AtCM1.
Chloroplast Import Assay
To test the predicted subcellular localization of PhCM1 and PhCM2, both full length
coding sequences were cloned into a pGEM®-T Easy vector, in vitro transcribed and translated.
The radiolabeled translation product was incubated with isolated chloroplasts (Pisum sativum) in
a protein import assay (Figure 3-4). The radiolabeled PhCM2 translation product associated with
the chloroplast fraction was equal in size to the original translation product and unprotected from
the thermolysin protease treatment, indicating that PhCM2 did not enter the plastid. However,
the PhCM1 translation product associated with the chloroplast fraction was processed to a
smaller size and was protected from the thermolysin treatment, indicating PhCM1 is imported
into the plastid and processed to a mature size. Furthermore, the radiolabeled PhCM1 was
associated with the stromal fraction of separated chloroplasts. Together with primary amino acid
sequence features, these results demonstrate PhCM1 is localized to the chloroplast stroma, while
PhCM2 is most likely not located in the chloroplast.

61
PhCM1 and PhCM2 Transcript Abundance Analysis
Because of the large drain on the free phenylalanine pool by the FVBP synthesis
pathway, we hypothesized that a CM gene would be transcriptionally co-regulated with known
FVBP genes. Three criteria of transcript accumulation spatial, flower development, and ethylene
treated were chosen for analysis by semi-quantitative reverse transcriptase polymerase chain
reaction (sqRT-PCR) and validated by quantitative (q)RT-PCR (Figures 3-5 and 3-6). The spatial
analysis consisted of root, stem, stigma, anther, leaf, petal tube, petal limb, and sepal tissues
(Figures 3-5A and 3-6A). PhCM1 transcripts were detected at high levels in the petal limb and
tube, and to a much lesser extent in the sexual organs, stem, and root. PhCM2 transcripts were
detected in all tissues examined with relatively high levels in the petal tube and stem tissues. The
MD flower development series consisted of whole flowers collected at 11 consecutive stages
beginning from a small bud to floral senescence (Figures 3-5B and 3-6B). PhCM1 transcripts
were detected at relatively low levels throughout the closed bud stages of development (stages 1-
5). Relatively high levels of PhCM1 transcripts were detected at anthesis (stage 6) and
throughout all open flower stages of development examined (stage 7-10). PhCM1 transcripts
were detected at the lowest level in observably senescing flower tissue (stage 11). PhCM2
transcripts were detected at similar levels throughout all stages examined except for stage 11
(Figures 3-5B and 3-6B). The ethylene study used excised whole flowers from MD and an
ethylene-insensitive (CaMV 35S::etr1-1) transgenic petunia line, 44568 (Wilkinson et al., 1997).
All flowers were treated with air or ethylene (2 µL L-1) for 0, 1, 2, 4, and 8 hours beginning at
12:00 h with an experimental end time of 20:00 h (Figures 3-5C and 3-6C). PhCM1 transcripts
were reduced in MD flowers after four hours of ethylene treatment compared to air treatments,
while no change in PhCM1 transcript level was observed in experiments using 44568. In
contrast, PhCM2 transcript levels were unchanged throughout the treatment conditions in both

62
genetic backgrounds. Together, these results indicate the transcript accumulation profile for
PhCM1 is similar to that of known FVBP genes and is therefore sufficient for FVBP production.
Total CM Activity in Petunia Flowers
To investigate whether CM activity contributes to daily substrate pool oscillations
(Underwood et al., 2005; Orlova et al., 2006) and concomitant rhythmic emission of FVBPs in
MD (Verdonk et al., 2005), we developmentally staged MD flowers and collected whole
corollas at three time points over the course of 24 h. Desalted crude protein extracts were
obtained, and total CM activity was assayed for each time-point with close attention paid to non-
enzymatic chorismic acid breakdown (Figure 3-7). Throughout the three daily time-points, total
CM activity was unchanged with an approximate specific activity average of 0.07 nkat mg-1. Not
discounting the presence of a regulatory molecule in vivo, which may be lost through the
extraction process, total CM activity in crude protein extracts from stage 9 and 10 MD corollas,
did not parallel that of FVBP emission profiles.
Functional Complementation and Recombinant Enzyme Activity of PhCM1 and PhCM2
In spite of the high homology to other CMs at the amino acid level, it was necessary to
test the biochemical function of both PhCM1 and PhCM2. The mature coding sequences for both
genes were cloned into a pET-32 vector and transformed into the CM-deficient E. coli
transformant KA12/pKIMP-UAUC, which was provided by Dr. Peter Kast at the Swiss Federal
Institute of Technology Zurich. The KA12/pKIMP-UAUC system requires the complementation
of both phenylalanine and tyrosine auxotrophies while under a double antibiotic selection and
has been well characterized (Kast et al., 1996; Kast et al., 2000). Both pET-32-PhCM1 and pET-
32-PhCM2 complemented KA12/pKIMP-UAUC when grown on minimal media without the
addition of phenylalanine and tyrosine as compared to all controls (Table 3-1). This result

63
indicates both PhCM1 and PhCM2 encode proteins that are sufficient for the enzymatic,
intramolecular conversion of chorismic acid to prephenic acid.
We then utilized the pET-32-CM vectors to transform E. coli strain BL21(DE3)pLysS
with the aim of generating recombinant proteins for PhCM1 and PhCM2. PhCM1 and PhCM2
proteins were purified by Ni2+ affinity chromatography and assayed for CM activity with and
without the addition of the aromatic amino acids (Figure 3-8). PhCM2 had a specific activity of
approximately 5.0 nkat mg-1 and was not affected by the presence of aromatic amino acids.
However, PhCM1 specific activity was close to 2.2 nkat mg-1 and increased approximately three-
fold in the presence of tryptophan. As is the case in Arabidopsis, opium poppy, and tomato
(Benesova and Bode, 1992; Eberhard et al., 1996a; Eberhard et al., 1996b; Mobley et al., 1999),
the cytosolic PhCM2 is not allosterically regulated by the aromatic amino acids. In contrast to
allosteric regulation patterns found for plastidic CMs in Arabidopsis and poppy, phenylalanine
and tyrosine had no effect on PhCM1 enzymatic activity, but tryptophan regulation is similar in
magnitude to AtCM1 (Eberhard et al., 1996b).
Suppression of PhCM1 by RNAi
Because the transcript accumulation profile for PhCM1 is similar to known FVBP genes
(Figures 3-5 and 3-6) and the subcellular location for PhCM1 is in the plastidial stroma (Figures
3-3A and 3-4), PhCM1 was chosen for RNAi mediated gene silencing. A 213 bp fragment at the
3’ end of the PhCM1 coding sequence was used for the RNAi inducing fragment (Figure 3-9).
Since the PhCM1 RNAi fragment was less than 60 % homologous to the corresponding region of
PhCM2, we hypothesized PhCM2 expression and possibly any other gene family members
would be unaffected by the PhCM1 silencing construct driven by a constitutive promoter
(pFMV).

64
Fifty independent PhCM1 RNAi (CM1R) plants were generated by leaf disc
transformation, and analyzed for reduced levels of PhCM1 transcripts when compared to MD by
sqRT-PCR. Eight plants were chosen for further analysis and self-pollinated to produce T1 seeds.
Five transgenic T1 CM1R lines segregated in an expected 3:1 manner for the transgene, and these
lines were more extensively studied for gene transcript accumulation and FVBP emission
differences compared to MD. Representative individuals from three independent T1 CM1R lines
(2-4, 24-9, and 33-9) showed reduced PhCM1 transcript levels, but PhCM2 transcript levels were
unchanged (Figure 3-10). Additionally, when transcript levels of multiple other genes in the
shikimate, phenylpropanoid, and FVBP pathways were analyzed, no differences were observed.
All three selected T1 CM1R lines showed similar FVBP emission profiles. Using MD
FVBP emission levels as a reference, phenylacetaldehyde was reduced 85 to 89 % in the CM1R
lines (Figure 3-11). The emissions of three volatile compounds derived from trans-cinnamic acid
(benzaldehyde, benzyl benzoate, and methyl benzoate) were reduced by 73 to 84 %, 62 to 75 %,
and 50 to 68 %; respectively. Isoeugenol emission was modestly lower in the CM1R lines when
compared to MD (14 to 28 %), but was not reduced as much as the rest of the major FVBPs
analyzed here. Total FVBP emissions were abated by 33.5 to 40.9 % in the T1 CM1R lines as
compared to MD (Figure 3-11). Taken together, these data suggest the lower level of PhCM1
transcripts in the CM1R lines resulted in lower levels of prephenic acid available for
phenylalanine synthesis, and thus, concomitant FVBP emission.
All T1 CM1R lines were self-pollinated and T2 generation plants were screened for
homozygosity. The screen resulted in two homozygous T2 CM1R lines, termed 24-9 and 33-8
(Figure 3-12). Whole corollas from stage 9 MD, 24-9, and 33-8 plants were used for quantitative
transcript accumulation and quantitative total CM activity assays (Figure 3-13). Compared to

65
MD, transcript accumulation for PhCM1 was reduced in 24-9 and 33-8 by 80 to 85 %, while
PhCM2 transcript accumulation was unaffected (Figure 3-13A). Total CM specific activity from
desalted crude extracts from 24-9 and 33-8 was reduced by 81 to 84 % compared to MD (Figure
3-13B). Together, these results indicate the reduction of PhCM1 transcript and subsequent total
CM activity are sufficient for the reduction in total FVBP emission in the CM1R lines compared
to MD.
24-9 and 33-8 were grown side-by-side with MD numerous times and no observable
phenotypic differences were observed. There were no significant differences between MD, 24-9,
and 33-8 in seed germination, nor in fresh weight, number of true leaves, aerial height (of nine
week old plants), or stem lignin content (Figures 3-14 and 3-15).
Discussion
CHORISMATE MUTASE (CM) has been extensively studied in prokaryotes and fungi,
but comparatively less is known about CM in higher plants. The enzymatic reaction of CM is the
initial committed step in synthesis of the aromatic amino acids phenylalanine and tyrosine
(Haslem, 1993), and MD corollas synthesize and emit large quantities of volatile
benzenoid/phenylpropanoid compounds, which are putatively derived from phenylalanine
(Boatright et al., 2004). Therefore, we chose to investigate CM in petunia flowers through
reverse genetic, molecular, biochemical, and metabolic approaches. The results indicate that
PhCM1 has a major role in the production of FVBPs in petunia flowers.
In petunia, two CM cDNAs have been isolated. PhCM1 is plastid localized based on a
putative cTP sequence and a chloroplast import assay (ChloroP 1.1; Zybailov et al., 2008)
[Figure 3-4]. Of the two putative plastidic Arabidopsis CMs, PhCM1 shares the highest identity
to AtCM1 (Figure 3-3B). Transcript accumulation suggests that AtCM1 possesses a distinct role
in the supply of phenylalanine and tyrosine under stressed conditions, while AtCM3 activity can

66
produce requisite levels of prephenic acid under non-stressed growing conditions (Eberhard et
al., 1996b; Mobley et al., 1999). PhCM2 is likely to be located in the cytosol due to the lack of a
signal peptide (Figure 3-3A), inability to be imported into a chloroplast (Figure 3-4), and the lack
of allosteric amino acid regulation (Figures 3-3A and 3-8) similar to the cytosolic isoforms in
Arabidopsis, tomato, and poppy (AtCM2, LeCM1, and CM2 from poppy) [Benesova and Bode,
1992; Eberhard et al., 1996a; and Eberhard et al., 1996b]. Recently, a subcellular localization
study in Arabidopsis leaf tissue with all six arogenate dehydratases and two arogenate
dehydrogenases showed these proteins, which are responsible for the ultimate production of
phenylalanine and tyrosine (respectively), are plastidic proteins. Furthermore, pathway
intermediates are confined to the plastid (Rippert et al., 2009). This indicates cytosolic isoforms
of CM are separated from substrate and other pathway proteins under normal growing
conditions. Therefore, PhCM2 most likely does not have a major role in the production of
prephenic acid during non-stressed growing conditions, as proposed for AtCM3. We searched
extensively for additional CM sequences in petunia, but did not isolate a potential PhCM3. That
said, two lines of evidence support the existence of other plastidic CM family members in non
floral tissues of petunia and at the same time illustrate the biological specificity of PhCM1. (1)
The CM1R RNAi transgenic plants are not observably impaired in vegetative growth compared
to MD plants (Figures 3-14 and 3-15), but show a specific FVBP phenotype (Figures 3-11). (2)
Relative transcript accumulation for PhCM1 is extremely low in all tissues examined except the
corolla (Figures 3-5A and 3-6A). However, production of the aromatic amino acids
phenylalanine and tyrosine are essential for cellular processes throughout the plant.
The PhCM1 transcript accumulation profile is congruent with several other known FVBP
genes in petunia. High levels of transcripts are detected in corollas from anthesis to senescence,

67
and are reduced by ethylene exposure, which mimics the pollination event (Figure 3-5 and 3-6).
PhCM2 transcript accumulation follows a more constitutive profile with a noticeable exception
in senescing floral tissue of MD (stage 11) where transcript accumulates to relatively high levels
(Figures 3-5B and 3-6B). However, PhCM2 transcript accumulation does not appear to be
affected by exogenous ethylene exposure (Figures 3-5C and 3-6C). This result implies that an
increase in PhCM2 transcript abundance during senescence is not a direct effect of ethylene
perceived at that developmental stage, and may provide a favorable situation to examine the
biological function of cytosolic CM isoforms in planta.
Since FVBP emission is rhythmic, transcript accumulation from FVBP biosynthetic
genes are rhythmic, and intermediate substrate pools in the FVBP pathway oscillate from low to
high in the evening (Underwood et al., 2005; Verdonk et al., 2005; Orlova et al., 2006), it is
reasonable to hypothesize enzyme activity of one or more proteins in the FVBP pathway
oscillate on a daily cycle. However, like PhBSMT activity (Kolosova et al., 2001) total CM
activity is not significantly changed from morning to night in desalted crude extracts (Figure 3-
7). Recombinant PhCM1 activity is increased in the presence of tryptophan (Figure 3-8), and so
oscillations in the free tryptophan pool in vivo cannot be discounted as a regulatory mechanism
affecting rhythmic FVBP emission.
AtCM1 and AtCM3 activities are allosterically down-regulated by phenylalanine and
tyrosine (Eberhard et al., 1996b; Mobley et al., 1999), but recombinant PhCM1 is unaffected by
these aromatic amino acids (Figure 3-8). Petunia corolla limb tissue accumulates a large free
phenylalanine pool in the evening with a calculated concentration of 5.5 mM (Kaminaga et al.,
2006). Therefore, PhCM1 is sufficient to direct the flux of chorismic acid to the production of
phenylalanine without feedback inhibition in the petunia flower. However, it must be noted that
68
the phenylalanine concentration reported in petunia flowers is a whole tissue measurement, and
compartmentalization of the free phenylalanine pool and PhCM1 at a subcellular level remains a
plausible mechanism allowing for the large phenylalanine pool. That said, Arabidopsis thaliana
tissues may not have a biological need for such a large phenylalanine pool, and it would be of
interest to assay allosteric regulation of CMs from Arabidopsis lyrata ssp. Petraea, an
outcrossing perennial, which emits relatively high levels of benzaldehyde and
phenylacetaldehyde from floral tissues (Abel et al., 2009).
RNAi mediated gene silencing produced transgenic petunia plants (CM1R) reduced in
PhCM1 transcript, but not PhCM2 (Figure 3-10 and 3-13A), and total CM enzyme activity
(Figure 3-13B) with a concomitant reduction of FVBP emission (Figure 3-11). Therefore,
PhCM1 has a central role in the production of FVBPs in a petunia flower. Interestingly, total
FVPB emission is reduced in CM1R lines to about 40 % compared to MD and recombinant
PhCM1 activity is increased over two fold in the presence of tryptophan (Figure 3-8). Therefore
it is plausible the 20 % total CM activity would be increased in vivo by a presumably higher level
of tryptophan in the flowers of the RNAi lines.
Metabolic analysis of the PhCM1 RNAi lines (Figure 3-11) may illustrate the “demand”
for substrate at each branch of the FVBP pathway. FVBPs derived directly from phenylalanine
are the most affected by limiting substrate conditions, while the benzenoids formed from trans-
cinnamic acid are affected significantly but to a lesser extent (Figure 3-11). In contrast, the
phenylpropanoids derived from coniferyl acetate are the FVBPs least affected in the CM1R lines.
However, too many variables may exist in the regulation at each branch point of the pathway,
and therefore we can only speculate. PhCM1 RNAi lines in conjugation with metabolite labeling
experiments may aid in delineating the flux through the FVBP pathway in the future.

69
Experimental Procedures
Plant Materials
Inbred Petunia x hybrida cv ‘Mitchell Diploid’ (MD) plants were utilized as a ‘wild-type’
control in all experiments. The ethylene-insensitive CaMV 35S:etr1-1 line 44568, generated in
the MD genetic background (Wilkinson et al., 1997), was utilized as a negative control for
ethylene sensitivity where applicable. MD, 44568, and PhCM1 RNAi plants were grown as
previously described (Dexter et al., 2007). Ethylene treatments used two µL L-1 of ethylene with
air treatments for controls.
cDNA Isolation
Partial sequences from the SGN (http://www.sgn.cornell.edu) petunia EST database
(Unigene: SGN-U208050) and from a petunia root EST collection (EST ID:
dr001P0018N07_F.ab1), courtesy of Didier Reinhardt at the University of Fribourg, were used
as references to obtain full-length cDNAs by 5’ and 3’ race with the SMART™ RACE cDNA
Amplification Kit (Clontech Laboratories, Inc., Mountain View, CA) as per manufacturer’s
protocol. A resulting 1257 bp cDNA had a 975 bp coding sequence (GenBank accession number:
EU751616) for a predicted 324 amino acid protein and was termed PhCM1, while another 913
bp cDNA had a 792 bp coding sequence (EU751617) for a predicted 263 amino acid protein
termed PhCM2. Both PhCM1 and PhCM2 coding sequences were amplified by Phusion™ Hot
Start High-Fidelity DNA Polymerase (New England Biolabs, Inc., Ipswich, MA) and were
cloned into a pGEM®T-EASY vector (Promega Corp., Madison, WI), which were extensively
sequenced and checked for errors. These constructs were used as template to clone the predicted
mature PhCM1 and PhCM2 coding sequences into a pET-32 EK/LIC vector (Novagen,
Gibbstown, NJ).

70
Transcript accumulation analysis
All experiments were conducted with at least two biological replicates with equivalent
results observed. In all cases, total RNA was extracted as previously described (Verdonk et al.,
2003) and subjected to TURBO™ DNase treatment (Ambion Inc., Austin, TX) followed by total
RNA purification with RNeasy® Mini protocol for RNA cleanup (Qiagen, Valencia, CA). Total
RNA was then quantified on a NanoDrop™ 1000 spectrophotometer (Thermo Scientific,
Wilmington, DE) and 50 ng/µl dilutions were prepared and stored at -20oC.
Semi-quantitative (sq)RT-PCR was performed on a Veriti™ 96-well thermal cycler
(Applied Biosystems, Foster City, CA). All sqRT-PCR reactions used a Qiagen One-step RT-
PCR kit with 50 ng total RNA template. To visualize RNA loading concentrations, samples were
amplified with Ph18S primers and analyzed on an agarose gel. Gene specific primers were
designed and utilized for the visualization of the relative transcript accumulation levels (Table 3-
2).
The spatial transcript accumulation series consisted of total RNA isolated from root, stem
stigma, anther, leaf, petal tube, petal limb, and sepal tissues of three individual MD plants at
16:00 h on multiple occasions over the course of a year. The developmental transcript
accumulation series consisted of MD floral tissue collected at eleven different stages; floral bud
< 0.5 cm (stage 1), bud 0.5 < 1.5 cm (2), bud 1.5 < 3.0 cm (3), bud 3.0 < 5.0 cm (4), bud fully
elongated 5.0 < 6.5 cm (5), flower opening 0 < 2 cm limb diameter (anthesis) [6], flower fully
open day 0 (7), day 1 (8), day 2 (9), day 3 (10), and observably senescing flower (flower open
day 7 for MD), stage 11. All tissues were collected at 16:00 h on the same day, and total RNA
was isolated from all samples collected. The developmental tissue collections were conducted
multiple times over the course of a year. The exogenous ethylene series consisted of excised MD
and 44568 stage 9 flowers (placed in tap water) placed into eight tanks, four for ethylene

71
treatments and four for air treatments. Air and ethylene treatments were conducted for 0, 1, 2, 4,
and 8 hours starting at 12:00 h. Immediately following treatment, each of the flower samples
were collected, stored at -80oC, and total RNA was isolated from all corolla tissues once all
samples had been collected. The ethylene treatment experiment consisted of two biological
replicates and was conducted twice. For all tissue collections individual samples consisted of
three flowers.
Quantitative (q)RT-PCR was performed and analyzed on a MyIQ real-time PCR
detection system (Bio-Rad Laboratories Inc., Hercules, CA). Stage 9, whole corolla tissue was
collected from MD and two independent homozygous T2 PhCM1 RNAi lines at 16:00 h. Total
RNA was isolated from all samples as described earlier and transcript accumulation was initially
analyzed by sqRT-PCR. For subsequent qRT-PCR analysis the Power SYBR® Green RNA-to-
Ct™ 1-Step Kit (Applied Biosystems, Foster City, CA) was used to amplify and detect resulting
products following the manufacturer’s protocol. qRT-PCR primers (Table S2) were constructed
with Primer Express® software v2.0 (Applied Biosystems, Foster City, CA), demonstrated gene
specificity during melt curve analysis, and then optimized.
Protein Extraction, Overproduction, and Purification
Desalted crude protein extracts were obtained from whole corolla tissue by grinding in a
mortar and pestle with liquid Nitrogen until a fine powder, addition of chilled extraction buffer
(50 mM Bis Tris HCl pH 6.9, 10 mM B-mercaptoethanol, 5 mM Na2S2O5, 1 % PVP, 1:100
protease inhibitor cocktail [Sigma, P9599], and 10 % glycerol), centrifugation at 4oC (Beckman
Coulter™, Avanti™ J-25) to separate cellular debris, and further separation of low molecular
weight substances with a PD-10 desalting column (GE Healthcare, Piscataway, NJ). Total crude
protein concentration was determined by the Bradford method using BSA as a standard (Rio-
Rad).

72
Biologically active pET-32-PhCM1 and pET-32-PhCM2 were expressed in E. coli
BL21(DE3)/pLysS with an induction of 1 mM IPTG overnight at 37oC. Induction was analyzed
from crude cellular extracts on a 10 % polyacrylamide, Tris-HCl Ready Gel (Bio-Rad). Soluble
protein was obtained from induced cells lysed with BugBuster® protein extract reagent and
affinity purified with His-Band® resin chromatography (Novagen). The resulting recombinant
proteins were then separated from any low molecular weight compounds and concentrated with
30,000 NMWL Amicon® Ultra-4 centrifugal filter devices (Millipore, Billerica, MA).
Recombinant protein concentration was determined by the Bradford method using BSA as a
standard.
CHORISMATE MUTASE Enzyme Activity Assays
Specific activities in vitro were resolved by carefully following the absorbance of
chorismic acid spectrophotometrically (Bio-Rad, SmartSpec™ 3000) at 274 nm (ε = 2630 M-1
cm-1) (Gilchrist and Connelly, 1987; Kast et al., 1996). All assays were conducted at 30oC with
0.5 mM chorismic acid (> 90 %, Sigma, C1761) in 50 mM KPO4 buffer, pH 7.6. Where stated,
50 µM phenylalanine, tyrosine, and tryptophan (Sigma: P2126, T3754, and T0254; respectively)
were used to assay for allosteric regulation of enzyme activity. Non-enzymatic chorismic acid
breakdown along with inactive protein controls were used to normalize all data generated.
Additionally, no activity was detected when purified tag fusion proteins from the empty pET-32
vector were used. Multiple biological replicates and corresponding technical replicates were used
to generate all data shown.
Chloroplast Import Assay
Full-length coding sequences for PhCM1 and PhCM2 were cloned into a pGEM®-T
Easy (Promega, Madison, WI) vector in the SP6 orientation. The chloroplast import assay was
conducted as described previously (Martin et al., 2009). Briefly, in vitro transcription and

73
translation with wheat germ TNT (Promega, Madison, WI) resulted in radiolabeled PhCM1,
PhCM2, and PsOE23, which were individually incubated with isolated pea chloroplasts for 15
min. After import, the isolated chloroplasts were treated with 100 µg ml-1 thermolysin for 40 min
at 4oC as depicted in the figure. Proteolysis was terminated by the addition of EDTA to a final
concentration of 10 mM, and the intact chloroplasts were then repurified by centrifugation
through 35 % Percoll. Chloroplasts were washed, lysed, and fractionated into total membranes
and stromal extracts by centrifugation for 18 min at 15,000 x g. The translation products,
chloroplasts, thermolysin treated chloroplasts, stromal extracts, and total membranes were
analyzed with SDS-PAGE and fluorography. In figure 3-4, PhCM2 and PsOE23 are from a 20
hour exposure. PhCM1 is from a 4 day exposure. These are from two different gels of the same
samples loaded the same. The panels have been cropped and contrast adjusted, but no other
modifications.
Volatile Emission
For all volatile emission experiments, emitted floral volatiles from excised flowers were
collected at 17:00 h and quantified as previously described (Underwood et al., 2005; Dexter et
al., 2007).
Generation of PhCM1 RNAi Transgenic Petunia
The generation of PhCM1 RNAi transgenic plants was as describe earlier (Dexter et al.,
2007), but with two fragments of the PhCM1 cDNA (Figure S3) amplified and ligated end to end
in a sense/antisense orientation with additional sequence information used for an inter-fragment
intron (hairpin).
Acknowledgements
This work was supported by grants from the USDA Nursery and Floral Crops Initiative
(grant #: 00058029), the Fred C. Gloeckner Foundation (grant #: 00070429), Florida Agricultural
74
Experiment Station (grant #: 00079097), and in part by National Institutes of Health (grant #:
R01 GM46951 to KC). The authors wish to thank Dr. Harry Klee (Horticultural Sciences
Department, University of Florida) for critically reviewing the manuscript and Dr. Peter Kast
(Swiss Federal Institute of Technology Zurich, Switzerland) for providing the CM-deficient E.
coli transformant KA12/pKIMP-UAUC.

75
Table 3-1. Functional complementation of CM-deficient E. coli KA12/pKIMP-UAUC. M9c minimal media was used for all experiments and supplemented with 20 µg/ml of L-phenylalanine and L-tyrosine where stated. Antibiotics used were chloramphenicol [Ch] (30 µg/ml) for selection of the pKIMP plasmid and carbenicillin [Ca] (100 µg/ml) for selection of the pET-32 plasmid. KA12/pKIMP-UAUC is not a λDE3 lysogenic E. coli, so bacteriophage CE6 (Novagen, cat# 69390) infection was used to induce transcription from the pET-32 T7 promoter where stated and no CE6 administered (NA) where stated. Transformants were incubated at 37oC for two days, and growth was scored as a plus (+) or minus (-). A sample of positive colonies was picked and colony PCR was performed for confirmation of pET-32-CM1 or pET-32-CM2 plasmids.

76
Table 3-2. Gene specific primers used for the transcript accumulation analyses throughout this study.

77
Figure 3-1. Aromatic amino acid biosynthesis pathway. CHORISMATE MUTASE directs the
flux of metabolites from the shikimate pathway into the phenylpropanoid pathway by catalyzing a [3,3]-sigmatropic rearrangement of chorismate to prephenate. Phenylalanine is thought to be the precursor for the majority of the volatile benzenoids/phenylpropanoids emitted by a petunia flower.

78
Figure 3-2. PhCM1 and PhCM2 CDS alignment using the Align X program in Vector NTI
advance 10.3.0 software package (Invitrogen; Carlsbad, CA). PhCM1 and PhCM2 share 46.1 % identity at the nucleotide level.

79
Figure 3-3. Predicted peptide sequence alignment and an unrooted neighbor-joining phylogenetic
tree of CM proteins from various species. Sequences represented are from Arabidopsis thaliana (accession: NP_566846, NP_196648, and NP_177096), Fagus sylvatica (ABA54871), Solanum lycopersicum (AAD48923), Nicotiana tabacum (BAD26595), Oryza sativa (NP_001061910), Petunia x hybrida (EU751616, EU751617), Vitis vinifera (CAO15322), Zea mays (AY103806), and Saccharomyces cerevisiae (NP_015385). (a) Sequences were aligned using the AlignX program of the Vector NTI Advance 10.3.0 software (Invitrogen). Residues highlighted in: blue represent consensus residues derived from a block of similar residues at a given position, green represent consensus residues derived from the occurrence of greater than 50 % of a single residue at a given position, and yellow represent consensus residues derived from a completely conserved residue at a given position. Petunia sequences are highlighted in red to the left, a red vertical bar represents the beginning of the mature protein sequence used for PhCM1, and a red box indicates an allosteric regulatory site (GS). (b) TREEVIEW software with the nearest-joining method was used to create the resulting tree. Scale bar represents distance as the number of substitutions per site (i.e., 0.1 amino acid substitutions per site).

80
Figure 3-4. Plastid import assay. Radiolabeled PhCM1, PhCM2, and PsOE23 were individually
incubated with isolated pea chloroplasts. After import, the isolated chloroplasts were treated with thermolysin as depicted in the figure. Proteolysis was terminated and the intact chloroplasts were then repurified, washed, lysed, and fractionated. PsOE23 is a thylakoid lumen protein with a stromal intermediate, which was used as a positive control. The translation products (tp), chloroplasts (Cp), thermolysin treated chloroplasts (Cp*), stromal extracts (SE), and total membranes (M) were analyzed with SDS-PAGE and fluorography. Positions of the molecular weight marker are depicted on the left.

81
Figure 3-5. sqRT-PCR transcript accumulation analysis of PhCM1 and PhCM2 in petunia.
Spatial analysis used root, stem, stigma, anther, leaf, petal tube, petal limb, and sepal tissues of MD harvested at 16:00 h (A). Floral developmental analysis used MD flowers from 11 sequential stages at 16:00 h (B). Ethylene treatment (two µL L-1) analysis used excised MD and 44568 whole flowers treated for 0, 1, 2, 4, and 8 hours (C).The number of cycles used for amplification of each transcript is shown on the right. Ph18S was used as a loading control in all cases.

82
Figure 3-6. qRT-PCR transcript accumulation analysis of PhCM1 and PhCM2 in petunia. Spatial
analysis used root, stem, stigma, anther, leaf, petal tube, petal limb, and sepal tissues of MD harvested at 16:00 h (A). The spatial experiment consisted of one biological replicate used for sqRT-PCR and one separate biological replicate with two technical replicates per biological replicate. Floral developmental analysis used MD flowers from 11 sequential stages at 16:00 h (B). The developmental analysis consisted of two biological replicates separate from the biological replicates used for the sqRT-PCR with three technical replicates. Ethylene treatment (two µL L-1) analysis used excised MD and 44568 whole flowers treated for 0, 1, 2, 4, and 8 hours (C). The ethylene treated series consisted of one biological replicate used in the sqRT-PCR with two technical replicates per biological replicate. PhFBP1 and Ph18S were used as references throughout these experiments.

83
Figure 3-7. Total CM activity in desalted crude protein extracts from MD whole corollas starting
at 9 h of stage 9 in flower development. (mean ± se; n = 6)
Figure 3-8. Enzyme activity of and effects of aromatic amino acids on petunia CMs.
Recombinant protein was assayed for enzymatic activity in 50 mM KPO4 buffer pH 7.6 with 0.5 mM chorismic acid (CA) as a substrate and 50 µM phenylalanine (Phe), tyrosine (Tyr), and tryptophan (Trp) as allosteric effectors. (mean ± se; n = 4)
Figure 3-9. Schematic representation and nucleotide comparison of RNAi region used for the
production of petunia PhCM1 RNAi transgenic lines. 213 bases at the 3’ end of the coding sequence of PhCM1 were chosen for the RNAi construct. This region shared 58.2 % identity with the corresponding nucleotide region from PhCM2.
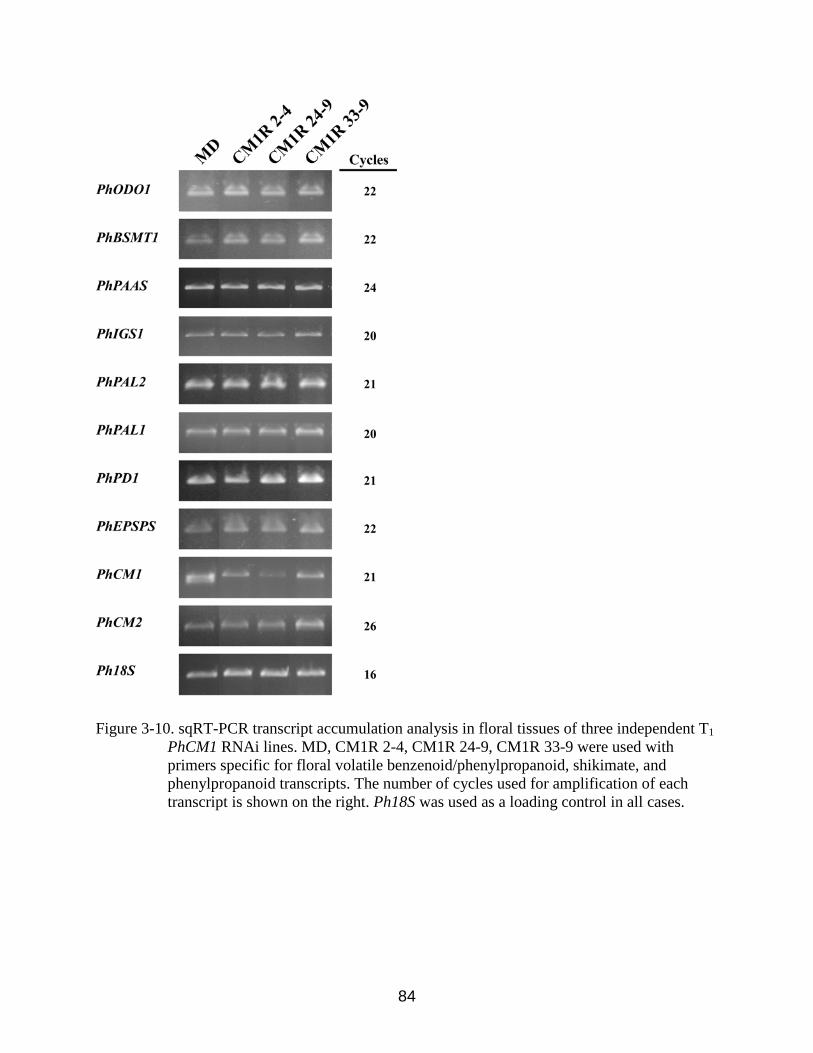
84
Figure 3-10. sqRT-PCR transcript accumulation analysis in floral tissues of three independent T1
PhCM1 RNAi lines. MD, CM1R 2-4, CM1R 24-9, CM1R 33-9 were used with primers specific for floral volatile benzenoid/phenylpropanoid, shikimate, and phenylpropanoid transcripts. The number of cycles used for amplification of each transcript is shown on the right. Ph18S was used as a loading control in all cases.

85
Figure 3-11. Floral volatile emission analysis from three independent T1 PhCM1 RNAi lines
(mean ± se; n = 3). Major volatile compounds shown from MD, CM1R 2-4, CM1R 24-9, CM1R 33-9 flowers.
Figure 3-12. sqRT-PCR transcript accumulation analysis in floral tissues of two independent,
homozygous T2 PhCM1 RNAi lines. Individuals and biological replicates from MD, 24-9, 33-8 were used with primers specific for PhCM1. The number of cycles used for amplification of each transcript is shown on the right. Ph18S was used as a loading control.
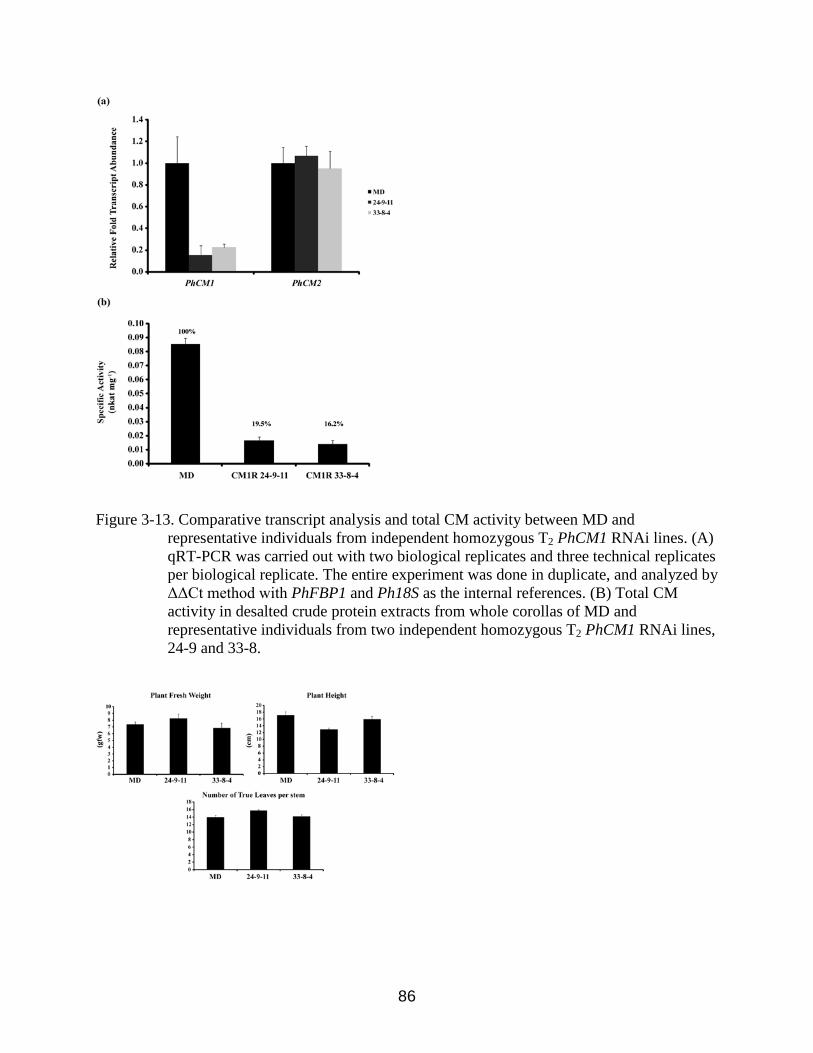
86
Figure 3-13. Comparative transcript analysis and total CM activity between MD and
representative individuals from independent homozygous T2 PhCM1 RNAi lines. (A) qRT-PCR was carried out with two biological replicates and three technical replicates per biological replicate. The entire experiment was done in duplicate, and analyzed by ΔΔCt method with PhFBP1 and Ph18S as the internal references. (B) Total CM activity in desalted crude protein extracts from whole corollas of MD and representative individuals from two independent homozygous T2 PhCM1 RNAi lines, 24-9 and 33-8.

87
Figure 3-14. Physiological comparison between MD and representative independent T2 PhCM1 homozygous RNAi lines 24-9 and 33-8 in 9 week old petunia seedlings (mean ± se; n = 5).
Figure 3-15. Stem cross-sections (between 7-8 node from apical meristem) from 9 week old
petunias stained with Phlorogucinol. Shown are MD and representative individuals from two independent PhCM1 homozygous T2 RNAi lines, 24-9 and 33-8. Pictures are from light microscopy at 4X on a Leica MZ 16F and are representative of three biological replicates.

88
CHAPTER 4 PHMYB5D8 EFFECTS PHC4H TRANSCRIPTION IN THE PETUNIA COROLLA
Introduction
Floral fragrance consists of an array of volatile organic compounds. These volatile
compounds are generally lipophilic liquids with high vapor pressures and putatively cross
biological membranes by passive diffusion in the absence of a barrier (Pichersky et al., 2006).
Many angiosperm species produce floral fragrance and each species produces a unique blend of
volatile organic compounds, which facilitate environmental interaction (reviewed in Dudareva et
al., 2006). The emission of floral volatiles can reach between 30 and 150 µg h-1 for some species
(Knudsen and Gershenzon, 2006; personal calculation). Therefore, the complexity and
stringency of regulation imparted upon floral volatile production is not surprising.
Petunia x hybrida cv “Mitchell Diploid” (MD) has been used as a model system for floral
volatile compound studies for nearly a decade. MD has relatively large, white flowers that
produce large amounts of floral volatile compounds. Volatile benzenoid and phenylpropanoid
compounds dominate the floral mixture of volatile compounds emitted by the MD flower
(Schuurink et al., 2006) [Figure 1-1]. In MD, floral volatile benzenoid/phenylpropanoid (FVBP)
production is confined to the corolla limb tissue subsequent to anthesis and until senescence, and
high levels of emission peak during the dark period (Kolosova et al., 2001a; Verdonk et al.,
2003; Underwood et al., 2005; Verdonk et al., 2005). Additionally, FVBP production and
emission is severely reduced after a successful pollination and fertilization event or 10 h of
exogenous ethylene exposure in petunia (Figures 2-6 and 2-8; Negre et al., 2003; Underwood et
al., 2005; Dexter et al., 2007; Dexter et al., 2008).
In petunia, FVBPs are all putatively derived from the aromatic amino acid phenylalanine
(Boatright et al., 2004) and the production of individual FVBP compounds stems from the
89
phenylpropanoid pathway at phenylalanine, trans-cinnamic acid, and ferulic acid (Figure 1-1).
Numerous proteins must be involved in the production of FVBPs from the shikimate pathway to
the end biochemical steps resulting in the direct formation of volatile compounds. To date, nine
genes have been identified to encode proteins associated with the production of FVBPs in
petunia: PhBSMT1, PhBSMT2, PhBPBT, PhPAAS, PhIGS1, PhEGS1, PhCFAT, PhCM1, and
PhODO1 (Negre et al., 2003; Boatright et al., 2004; Underwood et al., 2005; Verdonk et al.,
2005; Kaminaga et al., 2006; Koeduka et al., 2006; Orlova et al., 2006; Dexter et al., 2007;
Dexter et al., 2008; Koeduka et al., 2008; Chapter 3) [Figure 1-1]. The first six petunia genes
listed are involved in the direct formation of FVBP compound, while PhCFAT and PhCM1 are
associated with the production of intermediate metabolites. PhODO1 is an R2R3-MYB
transcriptional regulator that is involved in the transcriptional control of shikimate and
phenylpropanoid pathway genes, hence metabolite production.
All the FVBP genes are coordinately, transcriptionally regulated concomitant to FVBP
emission (Chapters 2 and 3). That is, high levels of transcript accumulation from the FVBP
genes is confined to the corolla limb, after anthesis and to senescence, each transcript has a peak
accumulation through a daily cycle, and transcript accumulation is greatly reduced after a
successful pollination/fertilization event or exposure to ethylene. The regulation of FVBP gene
transcription is tightly controlled as appears to be a direct relationship with FVBP emission in a
spatial, developmental, and hormone interaction context (Verdonk et al., 2003, Underwood et al.,
2005; Verdonk et al., 2005; Chapter 2).
Since all the identified petunia genes involved in FVBP production display similar
transcript accumulation profiles, we hypothesized that at least a subset of genes involved in the
regulation of FVBP gene transcript accumulation would share similar transcript accumulation

90
profiles. Additionally, because a single R2R3-MYB transcriptional regulator has been previous
identified as a FVBP metabolite regulator, and multiple R2R3-MYBs have been shown to
function in a single pathway; we hypothesized that multiple R2R3-MYB transcriptional
regulators are responsible for the overall level of regulation imparted upon the FVBP pathway.
Therefore, we examined multiple sequences homologous to R2R3-MYBs through a transcript
accumulation screen, which produced a candidate with a similar transcript accumulation profile
as the FVBP genes, PhMYB5d8. A reverse genetic approach to test gene function generated
transgenic petunia plants with elevated levels of isoeugenol and eugenol emission. The following
results indicate multiple transcriptional regulators are responsible for the precise production and
subsequent emission of FVBP in petunia.
Results
Identification of PhMYB5d8
We were interested in the regulation of the FVBP gene network; therefore, we searched a
publicly available petunia EST database (http://www.sgn.cornell.edu) for sequences with high
similarity to the conserved R2R3 domain of Arabidopsis R2R3-MYB proteins. This search
produced multiple results, but one Unigene sequence was chosen for further investigation, SGN-
U208628. Through a long standing collaboration with Dr. Robert Schuurink (University of
Amsterdam), the full-length CDS sequence was obtained with the named PhMYB5d8. The
predicted PhMYB5d8 amino acid sequence was 257 amino acids in length and predicted to be
nuclear localized (WoLFPSORT). When aligned with highly similar amino acid sequences from
varying species (Figure 4-1) three main features were observed: an N-terminal R2R3 domain,
C1-motif (LLSRGIDPTTHXI), and a MYB subgroup 4 EAR-domain (PDLNLELKISPP).
Phylogenetic analysis demonstrated that the two solanaceous MYB proteins (LeTH27 and
PhMYB5d8) closely associate in an unrooted neighbor-joining tree (Figure 4-2). PhMYB5d8

91
shares 66.1 and 55.9 % identity with LeTH27 and AtMYB4, respectively. Of these two potential
orthologs, AtMYB4 is best characterized in the literature with a supported function as a
transcriptional repressor of CINNAMATE-4-HYDROXYLASE (C4H) [Jin et al., 2000].
PhMYB5d8 transcript abundance analysis
Four criteria of transcript accumulation spatial, flower development, daily time-course,
and ethylene treated were chosen for analysis by semi-quantitative reverse transcriptase
polymerase chain reaction (sqRT-PCR) [Figure 4-3]. The spatial analysis consisted of root, stem,
stigma, anther, leaf, petal tube, petal limb, and sepal tissues (Figure 4-3A). PhMYB5d8
transcripts were detected at relatively high levels in the petal limb, petal tube, anthers, stigma,
and to a lesser extent in stem tissue. The MD and 44568 flower developmental series consisted
of whole flowers collected at 11 consecutive stages beginning from a small bud to floral
senescence (pictured in Figure 2-2). PhMYB5d8 transcripts were detected at relatively low levels
throughout the closed bud stages of development in both genetic backgrounds (Figure 4-3B).
Relatively high levels of PhMYB5d8 transcripts were detected at anthesis (stage 6) and
throughout all open flower stages of development examined in both MD and 44568 (stage 7-10).
PhMYB5d8 transcripts were detected at the lowest level in observably senescing MD flower
tissue (stage 11). In contrast, PhMYB5d8 transcripts were detected at relatively high levels in
observably senescing 44568 floral tissue, suggesting ethylene sensitivity is required to reduce
transcript levels as observed in MD tissue at the same stage (Figure 4-3B). The daily time-course
analysis used MD plants acclimated in a growth chamber with a long day photoperiod and
samples collected every three hours for a total of 36 hours (Figure 4-3C). PhMYB5d8 transcripts
were detected at relatively high levels between 15:00 and 24:00 h, which is similar to PhODO1
transcript accumulation pattern throughout a daily time-course analysis (Figure 2-9; Verdonk et
al., 2005). The ethylene study used excised whole flowers from MD and an ethylene-insensitive

92
(CaMV 35S::etr1-1) transgenic petunia line, 44568 (Wilkinson et al., 1997). All flowers were
treated with air or ethylene (2 µL L-1) for 0, 1, 2, 4, and 8 hours beginning at 12:00 h with an
experimental end time of 20:00 h (Figure 4-3D). PhMYB5d8 transcripts were reduced in MD
flowers after eight hours of ethylene treatment compared to air treatments, while no change in
PhMYB5d8 transcript level was observed in experiments using 44568. Together, these results
indicate the transcript accumulation profile for PhMYB5d8 is similar to that of known FVBP
genes and suggests PhMYB5d8 may be involved in FVBP production in petunia.
Suppression of PhMYB5d8 by RNAi
The transcript accumulation profile for PhMYB5d8 is similar to known FVBP genes
(Figures 4-3, 2-1, 2-3, 2-9, and 3-5); therefore, PhMYB5d8 was chosen for RNAi mediated gene
silencing. A 200 bp fragment at the 3’ end of the PhMYB5d8 coding sequence was used for the
RNAi inducing fragment (Figure 4-4). Fifty independent PhMYB5d8 RNAi (PhMYB5d8-R)
plants were generated by leaf disc transformation, and analyzed for reduced levels of PhMYB5d8
transcripts by sqRT-PCR (Figure 4-5). PhMYB5d8 transcript accumulation from at least nine
individual T0 PhMYB5d8-R plants was detected at relatively low levels compared to MD
samples, while PhMYB5d8 transcript accumulation from three representative PhMYB5d8-R
plants was detected at similar levels as MD. Due to the previously reported function for AtMYB4
(Jin et al., 2000), PhC4H transcript accumulation was also assayed (Figure 4-5). PhC4H
transcript accumulation was detected at relatively higher levels in all 9 PhMYB5d8-R plants with
reduced levels of PhMYB5d8 transcripts. PhC4H transcript accumulation was detected at similar
levels in MD and the representative PhMYB5d8-R plants with wildtype levels of PhMYB5d8
transcripts. Additionally, when transcript levels of multiple other genes in the shikimate,
phenylpropanoid, and FVBP pathways were analyzed, no differences were observed between

93
MD, PhMYB5d8-R with the expected reduced transcript levels of PhMYB5d8, and the transgenic
control plants (data not shown).
Multiple, independent T0 PhMYB5d8-R plants displayed a reduced level of PhMYB5d8
transcripts, and an elevated level of PhC4H transcripts (Figure 4-5). The C6-C3 FVBP
compounds, isoeugenol and eugenol, are downstream of C4H in the biosynthesis pathway
(Figure 1-1). Therefore, we hypothesized elevated levels of PhC4H transcripts would increase
C4H activity with a concomitant increase of metabolites directed to the production of isoeugenol
and eugenol; thus, high levels of emission for these C6-C3 compounds in PhMYB5d8-R flowers
compared to wildtype flowers. Six of the major FVBP compounds were analyzed from stage 9
(Figure 2-2) corollas of MD and PhMYB5d8-R plants (Figure 4-6). Benzaldehyde and benzyl
benzoate were detected at similar levels throughout all samples. Methyl benzoate and
phenylacetaldehyde were detected at lower levels in the PhMYB5d8-R corollas with reduced
levels of PhMYB5d8 transcript when compared to MD and PhMYB5d8-R 34 (wildtype levels of
PhMYB5d8 transcript). Isoeugenol and eugenol emission was detected at higher levels in the
PhMYB5d8-R corollas with reduced levels of PhMYB5d8 transcript, while MD and PhMYB5d8-
R 34 corollas emitted comparable levels of isoeugenol and eugenol (Figure 4-6). These results
suggest that a reduction of PhMYB5d8 transcript elevates PhC4H transcript levels and emission
of isoeugenol and eugenol.
Discussion
In petunia, floral volatile benzenoid/phenylpropanoid production and emission is both
complex and controlled. Gene regulation is a key aspect of control, which appears coordinate
through multiple categories that can be utilized to screen candidate genes possibly involved in
the production of FVBPs (Chapter 2). Employing this similarity screen by sqRT-PCR provided a
cost-effective and efficient method for the isolation of multiple genes involved in FVBP

94
production like PhMYB5d8. PhMYB5d8 predicted amino acid sequence is highly similar to a
family of proteins called R2R3-MYB transcriptional regulators (Figure 4-1) [Stracke et al.,
2001]. A small conserved domain (EAR-domain) in the C-terminal half of the protein,
LNL(E/D)L, puts PhMYB5d8 into subgroup 4 and supports a repression function (Ohta et al.,
2001). Additionally, the most similar Arabidopsis R2R3-MYB is AtMYB4 (Figure 4-2).
AtMYB4 represses the transcription of the phenylpropanoid pathway gene, CINNAMATE-4-
HYDROXYLASE (C4H) [Jin et al., 2000].
PhMYB5d8 transcripts accumulate to the highest levels in corolla tissue from anthesis to
senescence (Figure 4-3A, B). PhMYB5d8 transcript accumulation oscillates through a daily cycle
similar to PhODO1 (Figures 4-3C and 2-9), and transcript accumulation appears to be reduced
after eight hours of ethylene exposure (Figure 4-3D). In short, PhMYB5d8 transcripts are present
in the tissue responsible for FVBP production, at the same developmental stages when FVBP are
emitted, in a rhythmic pattern similar to the only other transcriptional regulator shown to be
involved in FVBP production, and is affected by hormone exposure. The PhMYB5d8 transcript
analysis and function of AtMYB4 suggests PhMYB5d8 may be involved in the regulation of
FVBP production in petunia.
To test the gene function of PhMYB5d8 directly, we generated transgenic PhMYB5d8-
RNAi petunia plants by using a 200 bp sequences at the 3’ end of the coding sequence as an
RNAi trigger (Figure 4-4). At least nine independent T0 PhMYB5d8-RNAi plants had reduced
levels of the desired PhMYB5d8 transcripts (Figure 4-5). Similar to what was found in
Arabidopsis with a dSpm insertion Atmyb4 line (Jin et al., 2000), PhC4H transcripts accumulate
to higher levels in the PhMYB5d8-RNAi plants compared to MD and transgenic controls (Figure
4-5). These results suggest that PhMYB5d8 negatively regulates PhC4H transcript accumulation.

95
However, it must be clear; we examined the transcript accumulation of specific genes and not a
comprehensive set such as used in a microarray. In addition, we did not perform any direct
assays to test for protein promoter interactions. Both microarray and protein-promoter assays
will be conducted in the near future.
Because PhC4H transcript accumulation was increased in the PhMYB5d8-RNAi plants
(Figure 4-5) and three FVBP compounds are “downstream” of C4H (Figure 1-1), we analyzed
the emission of only major FVBP compounds (Figure 4-6). Four independent PhMYB5d8-RNAi
plants emitted 3 to 4 fold higher levels of isoeugenol and eugenol compared to all controls.
Emission of benzaldehyde, methyl benzoate, and phenylacetaldehyde were varied among the
PhMYB5d8-RNAi plants compared to the controls, but the magnitude of difference was much
smaller than observed for isoeugenol and eugenol (Figure 4-6). Together the transcript
accumulation and FVBP emission analyses of the PhMYB5d8-RNAi plants indicate higher levels
of PhC4H transcript results in higher levels of emitted FVBP compounds downstream of C4H.
FVBP production is highly regulated in petunia and likely consists of multiple
interconnected factors. We found a cDNA that is highly similar to R2R3-MYB transcriptional
regulators, and contains an EAR domain, which has a repression function. The transcript
accumulation profile of the PhMYB5d8 is highly similar to other known FVBP genes. A
reduction of PhMYB5d8 transcript accumulation results in an increase of PhC4H transcript
accumulation, and an increase in emission of isoeugenol and eugenol. The data presented here
suggests that PhMYB5d8 negatively regulates PhC4H transcript abundance (Figure 4-7)
coinciding with the temporal, spatial, and developmental production of FVBP compounds in
petunia. Further experimentation is required to confirm the above conclusion, however, the exact
composition of the petunia floral volatile bouquet may be determined by an exact ratio of

96
specific proteins to substrates and PhMYB5d8 may be involved in the regulation of the exact
ratio.
Experimental Procedures
Plant Materials
Inbred Petunia x hybrida cv ‘Mitchell Diploid’ (MD) plants were utilized as a ‘wild-type’
control in all experiments. The ethylene-insensitive CaMV 35S:etr1-1 line 44568, generated in
the MD genetic background (Wilkinson et al., 1997), was utilized as a negative control for
ethylene sensitivity where applicable. MD, 44568, and PhMYB5d8 RNAi plants were grown as
previously described (Dexter et al., 2007). Ethylene treatments used two µL L-1 of ethylene with
air treatments for controls.
Generation of PhMYB5d8 RNAi Transgenic Petunia
The generation of PhMYB5d8 RNAi transgenic plants was as describe earlier (Dexter et
al., 2007), but with two fragments (3’ of the R2R3 domain) of the PhMYB5d8 cDNA amplified
and ligated end to end in a sense/antisense orientation with additional sequence information used
for an inter-fragment intron (hairpin).
Transcript accumulation analysis
All experiments were conducted with at least two biological replicates with equivalent
results observed. In all cases, total RNA was extracted as previously described (Verdonk et al.,
2003) and subjected to TURBO™ DNase treatment (Ambion Inc., Austin, TX) followed by total
RNA purification with RNeasy® Mini protocol for RNA cleanup (Qiagen, Valencia, CA). Total
RNA was then quantified on a NanoDrop™ 1000 spectrophotometer (Thermo Scientific,
Wilmington, DE) and 50 ng/µl dilutions were prepared and stored at -20oC.
Semi-quantitative (sq)RT-PCR was performed on a Veriti™ 96-well thermal cycler
(Applied Biosystems, Foster City, CA). All sqRT-PCR reactions used a Qiagen One-step RT-

97
PCR kit with 50 ng total RNA template. To visualize RNA loading concentrations, samples were
amplified with Ph18S primers (forward primer 5’-TTAGCAGGCTGAGGTCTCGT-3’ and
reverse primer 5’-AGCGGATGTTGCTTTTAGGA-3’) and analyzed on an agarose gel. Gene
specific primers were designed and utilized for the visualization of the relative transcript
accumulation levels for PhMYB5d8 (forward primer 5’-TTTTGCTGCTGGAATGAAGA-3’
and reverse primer 5’-TTCCTGCTACAACTGCAACCT-3’) and PhC4H [SGN-U210924]
(forward primer 5’-CTTGGACCAGGAGTGCAAAT-3’ and reverse primer 5’-
GCTCCTCCTACCAACACCAA-3’).
The spatial transcript accumulation series consisted of total RNA isolated from root, stem
stigma, anther, leaf, petal tube, petal limb, and sepal tissues of three individual MD plants at
16:00 h on multiple occasions over the course of a year. The developmental transcript
accumulation series consisted of MD floral tissue collected at eleven different stages; floral bud
< 0.5 cm (stage 1), bud 0.5 < 1.5 cm (2), bud 1.5 < 3.0 cm (3), bud 3.0 < 5.0 cm (4), bud fully
elongated 5.0 < 6.5 cm (5), flower opening 0 < 2 cm limb diameter (anthesis) [6], flower fully
open day 0 (7), day 1 (8), day 2 (9), day 3 (10), and observably senescing flower (flower open
day 7 for MD), stage 11. All tissues were collected at 16:00 h on the same day, and total RNA
was isolated from all samples collected. The developmental tissue collections were conducted
multiple times over the course of a year. The exogenous ethylene series consisted of excised MD
and 44568 stage 9 flowers (placed in tap water) placed into eight tanks, four for ethylene
treatments and four for air treatments. Air and ethylene treatments were conducted for 0, 1, 2, 4,
and 8 hours starting at 12:00 h. Immediately following treatment, each of the flower samples
were collected, stored at -80oC, and total RNA was isolated from all corolla tissues once all
samples had been collected. The ethylene treatment experiment consisted of two biological

98
replicates and was conducted twice. For all tissue collections individual samples consisted of
three flowers.
Volatile Emission
For all volatile emission experiments, emitted floral volatiles from excised flowers were
collected at 18:00 h and quantified as previously described (Underwood et al., 2005; Dexter et
al., 2007).
Acknowledgements
Dr. Rob Schuurink is acknowledged for his contribution of the PhMYB5d8 coding
sequence.

99
Figure 4-1. Predicted peptide sequence alignment of homologous R2R3-MYB proteins from
various species. Sequences represented are from Arabidopsis thaliana (accession: NM_119665 [MYB32] and AY070100 [MYB4]), Eucalyptus gunnii (AJ576024), Gossypium hirsutum (AF336286), Vitis vinifera (EF113078), Humulus lupulus (AB292244), Solanum lycopersicum (X95296), and Petunia x hybrida (EB175095). Sequences were aligned using the AlignX program of the Vector NTI Advance 10.3.0 software (Invitrogen). Residues highlighted in: blue represent consensus residues derived from a block of similar residues at a given position, green represent consensus residues derived from the occurrence of greater than 50 % of a single residue at a given position, and yellow represent consensus residues derived from a completely conserved residue at a given position. Petunia sequences are highlighted in red to the left.
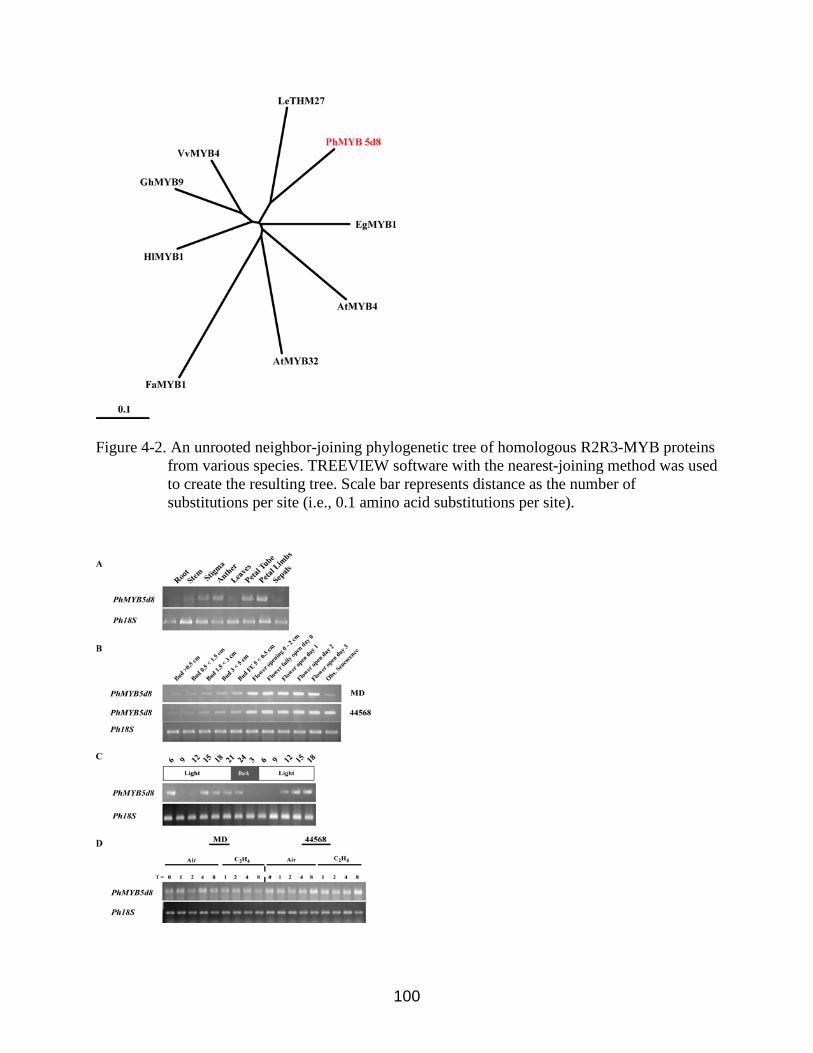
100
Figure 4-2. An unrooted neighbor-joining phylogenetic tree of homologous R2R3-MYB proteins
from various species. TREEVIEW software with the nearest-joining method was used to create the resulting tree. Scale bar represents distance as the number of substitutions per site (i.e., 0.1 amino acid substitutions per site).

101
Figure 4-3. PhMYB5d8 transcript accumulation analysis (sqRT-PCR). Spatial analysis used root, stem, stigma, anther, leaf, petal tube, petal limb, and sepal tissues of MD harvested at 16:00 h (A). Floral developmental analysis used MD flowers from 11 sequential stages at 16:00 h (B). Rhythmic analysis used MD plants acclimated in a growth chamber with a long day photoperiod and samples collected every three hours for a total of 36 hours (C). Ethylene treatment (two µL L-1) analysis used excised MD and 44568 whole flowers treated for 0, 1, 2, 4, and 8 hours (D).The number of cycles used for amplification of each transcript is shown on the right. Ph18S was used as a loading control in all cases.
Figure 4-4. PhMYB5d8 cDNA model with the RNAi region used for the production of petunia
PhMYB5d8 RNAi transgenic lines. 200 bases at the 3’ end of the coding sequence of PhMYB5d8 were chosen for the RNAi construct (between RNAi-F and RNAi-R primers).
Figure 4-5. sqRT-PCR transcript accumulation analysis in floral tissues of independent T0
PhMYB5d8-RNAi lines and MD plants. Gene specific primers for PhMYB5d8 and PhC4H were used. The number of cycles used for amplification of each transcript is shown on the right. Ph18S was used as a loading control.

102
Figure 4-6. Floral volatile emission analysis from five independent T0 PhMYB5d8 RNAi lines
(mean ± sd; n = 2). Only major volatile compounds are shown.

103
Figure 4-7. Schematic model of the FVBP pathway in petunia. FVBP production consists of
three main branch-points; phenylalanine, trans-cinnamic acid, and ferulic acid. Floral volatile compounds derived from each branch-point are highlighted in pink and proteins are in red. Solid red arrows indicate established biochemical reactions. Multiple arrows indicate multiple biochemical steps. Dashed arrows indicate possible biochemical reactions.

104
LIST OF REFERENCES
Abel, C., Clauss, M., Schaub, A., Gershenzon, J., and Tholl, D. (2009). Floral and insect-induced volatile formation in Arabidopsis lyrata ssp. petraea , a perennial, outcrossing relative of A. thaliana. Planta 10, 921-927.
Achnine, L., Blancaflor, E.B., Rasmussen, S., and Dixon, R.A. (2004). Colocalization of L-
PHENYLALANINE AMMONIA-LYASE and CINNAMATE 4-HYDROXYLASE for metabolic channeling in phenylpropanoid biosynthesis. Plant Cell 16, 3098-3109.
Alonso, J.M., Hirayama, T., Roman, G., Nourizadeh, S., and Ecker, J.R. (1999). EIN2, a
bifunctional transducer of ethylene and stress responses in Arabidopsis. Science 284, 2148-2152.
Ando, T., Nomura, M., Tsukahara, J., Watanabe, H., Kokubun, H., Tsukamoto, T., Hashimoto,
G., Marchesi, E., and Kitching, I.J. (2001). Reproductive isolation in a native population of Petunia sensu Jussieu (Solanaceae). Ann. Bot. 88, 403-413.
Benesova, M., and Bode, R. (1992). CHORISMATE MUTASE isoforms from seeds and
seedlings of Papaver somniferum. Phytochemistry 31, 2983-2987. Ben-Nissan, G., and Weiss, D. (1996). The petunia homologue of tomato GAST1: transcript
accumulation coincides with gibberellin-induced corolla cell elongation. Plant Mol. Biol. 32, 1067-1074.
Bleecker, A.B., and Kende, H. (2000). Ethylene: a gaseous signal molecule in plants. Annu. Rev.
Cell Dev. Biol. 16, 1-18. Boudet, A.M. (2007). Evolution and current status of research in phenolic compounds.
Phytochemistry 68, 2722-2735. Boatright, J., Negre, F., Chen, X., Kish, C.M., Wood, B., Peel, G., Orlova, I., Gang, D., Rhodes,
D., and Dudareva, N. (2004). Understanding in vivo benzenoid metabolism in petunia petal tissue. Plant Physiol. 135, 1993-2011.
Chang, C., Kwok, S.F., Bleecker, A.B., and Meyerowitz, E.M. (1993). Arabidopsis ethylene-
response gene ETR1 - similarity of product to 2-component regulators. Science 262, 539-544.
Chao, Q.M., Rothenberg, M., Solano, R., Roman, G., Terzaghi, W., and Ecker, J.R. (1997).
Activation of the ethylene gas response pathway in Arabidopsis by the nuclear protein ETHYLENE-INSENSITIVE3 and related proteins. Cell 89, 1133-1144.
Chen, Y.F., Etheridge, N., and Schaller, G.E. (2005). Ethylene signal transduction. Ann. Bot. 95,
901-915.

105
Clark, D.G., Gubrium, E.K., Barrett, J.E., Nell, T.A., and Klee, H.J. (1999). Root formation in ethylene-insensitive plants. Plant Physiol. 121, 53-59.
Clark, K.L., Larsen, P.B., Wang, X.X., and Chang, C. (1998). Association of the Arabidopsis
CTR1 Raf-like kinase with the ETR1 and ERS ethylene receptors. Proc. Natl. Acad. Sci. U. S. A. 95, 5401-5406.
Deroles, S.C., and Gardner, R.C. (1988a). Expression and inheritance of kanamycin resistance in
a large number of transgenic petunias generated by Agrobacterium-mediated transformation. Plant Mol. Biol. 11, 355-364.
Deroles, S.C., and Gardner, R.C. (1988b). Analysis of the T-DNA structure in a large number of
transgenic petunias generated by Agrobacterium-mediated transformation. Plant Mol. Biol. 11, 365-377.
Dexter, R., Qualley, A., Kish, C.M., Ma, C.J., Koeduka, T., Nagegowda, D.A., Dudareva, N.,
Pichersky, E., and Clark, D. (2007). Characterization of a petunia acetyltransferase involved in the biosynthesis of the floral volatile isoeugenol. Plant J. 49, 265-275.
Dexter, R.J., Verdonk, J.C., Underwood, B.A., Shibuya, K., Schmeltz, E.A., and Clark, D.G.
(2008). Tissue-specific PHBPBT expression is differentially regulated in response to endogenous ethylene. J. Exp. Bot. 59, 609-618.
Dudareva, N., Negre, F., Nagegowda, D., and Orlova, I. (2006). Plant volatiles: recent advances
and future perspectives. Crit. Rev. Plant Sci. 25, 417-440. Dudareva, N., and Pichersky, E. (2000). Biochemical and molecular genetic aspects of floral
scents. Plant Physiol. 122, 627-633. Dudareva, N., Pichersky, E., and Gershenzon, J. (2004). Biochemistry of plant volatiles. Plant
Physiol. 135, 1893-1902. Eberhard, J., Raesecke, H.R., Schmid, J., and Amrhein, N. (1993). Cloning and expression in
yeast of a higher plant CHORISMATE MUTASE. Molecular cloning, sequencing of the cDNA and characterization of the Arabidopsis thaliana enzyme expressed in yeast. FEBS Lett. 15, 233-236.
Eberhard, J., Bischoff, M., Raesecke, H.R., Amrhein, N., and Schmid, J. (1996a). Isolation of a
cDNA from tomato coding for an unregulated, cytosolic CHORISMATE MUTASE. Plant Mol. Biol. 31, 917-922.
Eberhard, J., Ehrler, T.T., Epple, P., Felix, G., Raesecke, H.R., Amrhein, N., and Schmid, J.
(1996b). Cytosolic and plastidic CHORISMATE MUTASE isozymes from Arabidopsis thaliana: molecular characterization and enzymatic properties. Plant J. 10, 815-821.
106
Fenster, C., Armbruster, W., Wilson, P., Dudash, M., and Thomson, J. (2004). Pollination syndromes and floral specialization. Annu. Rev. Ecol. Evol. S. 35, 375-403.
Fraley, R.T., Rogers, S.G., and Horsch, R.B. (1983). In vitro plant transformation by bacterial
co-cultivation and expression of foreign genes in plant-cells. In Vitro Cell Dev. B. 19, 284-284.
Friedman, M., Henika, P.R., and Mandrell, R.E. (2002). Bactericidal activities of plant essential
oils and some of their isolated constituents against Campylobacter jejuni, Escherichia coli, Listeria monocytogenes, and Salmonella enterica. J. Food Prot. 65, 1545-1560.
Gerats, T., and Vandenbussche, M. (2005). A model system for comparative research: petunia.
Trends Plant Sci. 10, 251-256. Gilchrist, D.G., and Connelly, J.A. (1987). CHORISMATE MUTASE from Mung Bean and
Sorghum. Methods Enzymol. 142, 450-463. Griesbach, R.J., and Kamo, K.K. (1996). The effect of induced polyploidy on the flavonols of
petunia 'Mitchell'. Phytochemistry 42, 361-363. Guo, H.W., and Ecker, J.R. (2004). The ethylene signaling pathway: new insights. Curr. Opin.
Plant Biol. 7, 40-49. Hall, A.E., Findell, J.L., Schaller, G.E., Sisler, E.C., and Bleecker, A.B. (2000). Ethylene
perception by the ERS1 protein in Arabidopsis. Plant Physiol. 123, 1449-1457. Haslam, E. (1993). Shikimic acid: metabolism and metabolites. Chichester, Wiley. Herrmann, K.M., and Weaver, L.M. (1999). The shikimate pathway. Annu. Rev. Plant Physiol.
Plant Mol. Biol. 50, 473-503. Hoballah, M.E., Stuurman, J., Turlings, T.C., Guerin, P.M., Connetable, S., Kuhlemeier, C.
(2005). The composition and timing of flower odour emission by wild Petunia axillaris coincide with the antennal perception and nocturnal activity of the pollinator Manduca sexta. Planta 222, 141-150.
Hoekstra, F., and Weges, R. (1986). Lack of control by early pistillate ethylene of the accelerated
wilting of Petunia hybrida flowers. Plant Physiology 80, 403-408. Horsch, R.B., Fry, J.E., Hoffmann, N.L., Eichholtz, D., Rogers, S.G., and Fraley, R.T. (1985). A
simple and general method for transferring genes into plants. Science 227, 1229-1231. Hua, J., and Meyerowitz, E.M. (1998). Ethylene responses are negatively regulated by a receptor
gene family in Arabidopsis thaliana. Cell 94, 261-271.

107
Hua, J., Sakai, H., Nourizadeh, S., Chen, Q.H.G., Bleecker, A.B., Ecker, J.R., and Meyerowitz, E.M. (1998). EIN4 and ERS2 are members of the putative ethylene receptor gene family in Arabidopsis. Plant Cell 10, 1321-1332.
Hudak, K.A., and Thompson, J.E. (1997). Subcellular localization of secondary lipid metabolites
including fragrance volatiles in carnation petals. Plant Physiol. 114, 705-713. Jin, H., Cominelli, E., Bailey, P., Parr, A., Mehrtens, F., Jones, J., Tonelli, C., Weisshaar, B., and
Martin, C. (2000). Transcriptional repression by AtMYB4 controls production of UV-protecting sunscreens in Arabidopsis. EMBO J. 19, 6150-6161.
Jones, M.L., Langston, B.J., and Johnson, F. (2003). Pollination-induced senescence of ethylene
sensitive and insensitive petunias, in: Vendrell, M., Klee, H., Pech, J.C., Romotaro, F. (Eds.), Biology and Biotechnology of the Plant Hormone Ethylene III. IOS Press, Amsterdam, pp. 324-327.
Jorgensen, R.A., Cluster, P.D., English, J., Que, Q.D., and Napoli, C.A. (1996). CHALCONE
SYNTHASE cosuppression phenotypes in petunia flowers: comparison of sense vs antisense constructs and single-copy vs complex T-DNA sequences. Plant Mol. Biol. 31, 957-973.
Kaminaga, Y., Schnepp, J., Peel, G., Kish, C.M., Ben-Nissan, G., Weiss, D., Orlova, I., Lavie,
O., Rhodes, D., Wood, K., Porterfield, D.M., Cooper, A.J., Schloss, J.V., Pichersky, E., Vainstein, A., and Dudareva, N. (2006). Plant PHENYLACETALDEHYDE SYNTHASE is a bifunctional homotetrameric enzyme that catalyzes phenylalanine decarboxylation and oxidation. J. Biol. Chem. 281, 23357-23366.
Kast, P., Asif-Ullah, M., Jiang, N., and Hilvert, D. (1996). Exploring the active site of
CHORISMATE MUTASE by combinatorial mutagenesis and selection: the importance of electrostatic catalysis. Proc. Natl. Acad. Sci. U. S. A. 93, 5043-5048.
Kast, P., Grisostomi, C., Chen, I.A., Li, S., Krengel, U., Xue, Y., and Hilvert, D. (2000). A
strategically positioned cation is crucial for efficient catalysis by CHORISMATE MUTASE. J. Biol. Chem. 275, 36832-36838.
Klempnauer, K.H., Gonda, T.J., and Bishop, J.M. (1982). nucleotide-sequence of the retroviral
leukemia gene V-MYB and its cellular progenitor C-MYB - the architecture of a transduced oncogene. Cell 31, 453-463.
Knudsen, J.T., Eriksson, R., Gershenzon, J., and Stahl, B. (2006). Diversity and distribution of
floral scent. Bot. Rev. 72, 1-120. Knudsen, J., Tollsten, L., and Berstrom, L. (1993). Floral scents - a checklist of volatile
compounds isolated by headspace techniques. Phytochemistry 33, 253-280.

108
Koeduka, T., Fridman, E., Gang, D.R., Vassao, D.G., Jackson, B.L., Kish, C.M., Orlova, I., Spassova, S.M., Lewis, N.G., Noel, J.P., Baiga, T.J., Dudareva, N., and Pichersky, E. (2006). Eugenol and isoeugenol, characteristic aromatic constituents of spices, are biosynthesized via reduction of a coniferyl alcohol ester. Proc. Natl. Acad. Sci. U. S. A. 103, 10128-10133.
Koeduka, T., Louie, G.V., Orlova, I., Kish, C.M., Ibdah, M., Wilkerson, C.G., Bowman, M.E.,
Baiga, T.J., Noel, J.P., Dudareva, N., and Pichersky, E. (2008). The multiple PHENYLPROPENE SYNTHASES in both Clarkia breweri and Petunia hybrida represent two distinct protein lineages. Plant J. 54, 362-374.
Kolosova, N., Gorenstein, N., Kish, C.M., and Dudareva, N. (2001a). Regulation of circadian
methyl benzoate emission in diurnally and nocturnally emitting plants. Plant Cell 13, 2333-2347.
Kolosova, N., Sherman, D., Karlson, D., and Dudareva, N. (2001b). Cellular and subcellular
localization of S-ADENOSYL-L- METHIONINE:BENZOIC ACID CARBOXYL METHYLTRANSFERASE, the enzyme responsible for biosynthesis of the volatile ester methylbenzoate in snapdragon flowers. Plant Physiology 126, 956-964.
Lipsick, J.S. (1996). One billion years of MYB. Oncogene 13, 223-235. Martin, J.R., Harwood, J.H., McCaffery, M., Fernandez, D, E., and Cline, K. (2009).
Localization and integration of thylakoid protein translocase subunit cpTatC. Plant J. 58, 831-842.
Matsui, K. (2006). Green leaf volatiles: hydroperoxide lyase pathway of oxylipin metabolism.
Curr. Opin. Plant Biol. 9, 274-280. Mitchell, A.Z., Hanson, M.R., Skvirsky, R.C., and Ausubel, F.M. (1980). Anther culture of
petunia - genotypes with high-frequency of callus, root, or plantlet formation. Z Pflanzenphysiol 100, 131-146.
Moalem-Beno, D., Tamari, G., Leitner-Dagan, Y., Borochov, A., and Weiss, D. (1997). Sugar-
dependent gibberellin-induced CHALCONE SYNTHASE gene expression in petunia corollas. Plant Physiol. 113, 419-424.
Mobley, E.M., Kunkel, B.N., and Keith, B. (1999). Identification, characterization and
comparative analysis of a novel CHORISMATE MUTASE gene in Arabidopsis thaliana. Gene 240, 115-123.
Negre, F., Kish, C.M., Boatright, J., Underwood, B., Shibuya, K., Wagner, C., Clark, D.G., and
Dudareva, N. (2003). Regulation of methylbenzoate emission after pollination in snapdragon and petunia flowers. Plant Cell 15, 2992-3006.

109
Newman, J.D., and Chappell, J. (1999). Isoprenoid biosynthesis in plants: carbon partitioning within the cytoplasmic pathway. Crit. Rev. Biochem. Mol. Biol. 34, 95-106.
Ogata, K., Hojo, H., Aimoto, S., Nakai, T., Nakamura, H., Sarai, A., Ishii, S., and Nishimura, Y.
(1992). Solution structure of a DNA-binding unit of MYB - a helix turn helix-related motif with conserved tryptophans forming a hydrophobic core. Proc. Natl. Acad. Sci. U. S. A. 89, 6428-6432.
Ohta, M., Matsui, K., Hiratsu, K., Shinshi, H., and Ohme-Takagi, M. (2001). Repression
domains of class II ERF transcriptional repressors share an essential motif for active repression. Plant Cell 13, 1959-1968.
Orlova, I., Marshall-Colon, A., Schnepp, J., Wood, B., Varbanova, M., Fridman, E., Blakeslee,
J.J., Peer, W.A., Murphy, A.S., Rhodes, D., Pichersky, E., and Dudareva, N. (2006). Reduction of benzenoid synthesis in petunia flowers reveals multiple pathways to benzoic acid and enhancement in auxin transport. Plant Cell 18, 3458-3475.
Oxenham, S.K., Svoboda, K.P., and Walters, D.R. (2005). Altered growth and polyamine
catabolism following exposure of the chocolate spot pathogen Botrytis fabae to the essential oil of Ocimum basilicum. Mycologia 97, 576-579.
Pabo, C.O., and Sauer, R.T. (1992). Transcription factors - structural families and principles of
DNA recognition. Annu. Rev. Biochem. 61, 1053-1095. Pare, P.W., and Tumlinson, J.H. (1997). De novo biosynthesis of volatiles induced by insect
herbivory in cotton plants. Plant Physiol. 114, 1161-1167. Peters, D. (2007). Raw materials. Adv. Biochem. Eng. Biot. 105, 1-30. Pichersky, E., Noel, J.P., and Dudarev,a N. (2006). Biosynthesis of plant volatiles: nature's
diversity and ingenuity. Science 311, 808-811. Pichersky, E., and Gang, D.R. (2000). Genetcs and biochemistry of secondary metabolites in
plants: an evolutionary perspective. Trends Plant Sci. 5, 439-445. Pichersky, E., and Gershenzon, J. (2002). The formation and function of plant volatiles:
perfumes for pollinator attraction and defense. Curr. Opin. Plant Biol. 5, 237-243. Riechmann, J.L., and Ratcliffe, O.J. (2000). A genomic perspective on plant transcription
factors. Curr. Opin. Plant Biol. 3, 423-434. Rippert, P., Puyaubert, J., Grisollet, D., Derrier, L., and Matringe, M. (2009). Tyrosine and
phenylalanine are synthesized within the plastids in Arabidopsis. Plant Physiol. 149, 1251-1260.
110
Rodriguez, F.I., Esch, J.J., Hall, A.E., Binder, B.M., Schaller, G.E., and Bleecker, A.B. (1999). A copper cofactor for the ethylene receptor ETR1 from Arabidopsis. Science 283, 996-998.
Rohmer, M. (1999). The discovery of a mevalonate-independent pathway for isoprenoid
biosynthesis in bacteria, algae and higher plants. Nat. Prod. Rep. 16, 565-574. Sakai, H., Hua, J., Chen, Q.H.G., Chang, C.R., Medrano, L.J., Bleecker, A.B., and Meyerowitz,
E.M. (1998). ETR2 is an ETR1-like gene involved in ethylene signaling in Arabidopsis. Proc. Natl. Acad. Sci. U. S. A. 95, 5812-5817.
Schaller, G.E., and Bleecker, A.B. (1995). Ethylene-binding sites generated in yeast expressing
the Arabidopsis ETR1 gene. Science 270, 1809-1811. Schaller, G.E., Ladd, A.N., Lanahan, M.B., Spanbauer, J.M., and Bleecker, A.B. (1995). The
ethylene response mediator ETR1 from Arabidopsis forms a disulfide-linked dimer. J. Biol. Chem. 270, 12526-12530.
Schuurink, R.C., Haring, M.A., and Clark, D.G. (2006). Regulation of volatile benzenoid
biosynthesis in petunia flowers. Trends Plant Sci. 11, 20-25. Shibuya, K., Barry, K.G., Ciardi, J.A., Loucas, H.M., Underwood, B.A., Nourizadeh, S., Ecker,
J.R., Klee, H.J., and Clark, D.G. (2004). The central role of PhEIN2 in ethylene responses throughout plant development in petunia. Plant Physiol. 136, 2900-2912.
Simkin, A.J., Underwood, B.A., Auldridge, M., Loucas, H.M., Shibuya, K., Schmelz, E., Clark,
D.G., and Klee, H.J. (2004). Circadian regulation of the PhCCD1 carotenoid cleavage dioxygenase controls emission of beta-ionone, a fragrance volatile of petunia flowers. Plant Physiol. 136, 3504-3514.
Solano, R., Stepanova, A., Chao, Q.M., and Ecker, J.R. (1998). Nuclear events in ethylene
signaling: a transcriptional cascade mediated by ETHYLENE-INSENSITIVE3 and ETHYLENE-RESPONSE-FACTOR1. Gene Dev. 12, 3703-3714.
Stracke, R., Werber, M., and Weisshaar, B. (2001). The R2R3-MYB gene family in Arabidopsis
thaliana. Curr. Opin. Plant Biol. 4, 447-456. Tang, X., and Woodson, W.R. (1996). Temporal and spatial expression of 1-
AMINOCYCLOPROPANE-1-CARBOXYLATE OXIDASE mRNA following pollination of immature and mature petunia flowers. Plant Physiol. 112, 503-511.
Tieman, D.M., Taylor, M., Schaurer, N., Fernie, A.R., Hanson, A.D., and Klee, H.J. (2006).
Tomato aromatic amino acid decarboxylases participate in synthesis of the flavor volatiles 2-phenylethanol and 2-phenylacetaldehyde. Proc. Natl. Acad. Sci. U. S. A. 103, 8287-8292.

111
Underwood, B.A., Tieman, D.M., Shibuya, K., Dexter, R.J., Loucas, H.M., Simkin, A.J., Sims, C.A., Schmelz, E.A., Klee, H.J., and Clark, D.G. (2005). Ethylene-regulated floral volatile synthesis in petunia corollas. Plant Physiol. 138, 255-266.
Verdonk, J.C., Haring, M.A., Van Tunen, A.J., and Schuurink, R.C. (2005). ODORANT1
regulates fragrance biosynthesis in petunia flowers. Plant Cell 17, 1612-1624. Verdonk, J.C., Ric De Vos, C.H., Verhoeven, H.A., Haring, M.A., Van Tunen, A.J., and
Schuurink, R.C. (2003). Regulation of floral scent production in petunia revealed by targeted metabolomics. Phytochemistry 62, 997-1008.
Wang, K.L.C., Li, H., and Ecker, J.R. (2002). Ethylene biosynthesis and signaling networks.
Plant Cell 14, S131-S151. Wang, Y., and Kumar, P.P. (2007). Characterization of two ethylene receptors PHERS1 and
PHETR2 from petunia: PHETR2 regulates timing of anther dehiscence. J. Exp. Bot. 58, 533-544.
Weiss, D., Van Der Luit, A., Knegt, E., Vermeer, E., Mol, J., and Kooter, J.M. (1995).
Identification of endogenous gibberellins in petunia flowers (induction of anthocyanin biosynthetic gene expression and the antagonistic effect of abscisic acid). Plant Physiol. 107, 695-702.
Wasternack, C., and Hause, B. (2002). Jasmonates and octadecanoids: signals in plant stress
responses and development. Prog. Nucleic Acid Res. Mol. Biol. 72, 165-221. Wasternack, C., Stenzel, I., Hause, B., Hause, G., Kutter, C., Maucher, H., Neumerkel, J.,
Feussner, I., and Miersch, O. (2006). The wound response in tomato--role of jasmonic acid. J. Plant Physiol. 163, 297-306.
Wilkinson, J.Q., Lanahan, M.B., Clark, D.G., Bleecker, A.B., Chang, C., Meyerowitz, E.M., and
Klee, H.J. (1997). A dominant mutant receptor from Arabidopsis confers ethylene insensitivity in heterologous plants. Nat. Biotechnol. 15, 444-447.
Wilkinson, J.Q., Lanahan, M.B., Yen, H.C., Giovannoni, J.J., and Klee, H.J. (1995). An
ethylene-inducible component of signal-transduction encoded by NEVER-RIPE. Science 270, 1807-1809.
Wink, M. (2003). Evolution of secondary metabolites from an ecological and molecular
phylogenetic perspective. Phytochemistry 64, 3-19. Yu, O., and Jez, J.M. (2008). Nature's assembly line: biosynthesis of simple phenylpropanoids
and polyketides. Plant J. 54, 750-762. Zhu, Z., and Guo, H. (2008). Genetic basis of ethylene perception and signal transduction in
Arabidopsis. J. Integr. Plant Biol. 50, 808-815.

112
Zybailov, B., Rutschow, H., Friso, G., Rudella, A., Emanuelsson, O., Sun, Q., and van Wijk, K.J.
(2008). Sorting signals, N-terminal modifications and abundance of the chloroplast proteome. PLoS ONE 3, e1994.

BIOGRAPHICAL SKETCH
Thomas Angus Colquhoun was born in Fargo, North Dakota. He was raised by Linda
Lou Colquhoun and Thomas E. Colquhoun along with two older sisters, Tesa D. Larson and
Christann Schmid. After graduating from Fargo South High School, Thomas attended Coastal
Carolina University, South Carolina for his freshmen year, and then transferred to Minnesota
State University of Moorhead (MSUM) for the remainder of his undergraduate career. During his
undergraduate career, Thomas met and married the love of his life, Cynthia M. Colquhoun.
Additionally, at MSUM Thomas worked in Dr. Chris Chastain’s lab helping to characterize a
pyruvate, orthophosphate dikinase in developing rice (Oryza sativa) seeds (Chastain et al., 2006).
Dr. Chastain had a profound effect on Thomas and his education, for it was through Dr.
Chastain’s mentorship that Thomas found his interest in basic research and plants in general.
University of Florida and the Plant Molecular and Cellular Biology Program was the next
appointment for Thomas, and Dr. David G. Clark was his Ph.D. advisor. Dr. Clark was Thomas’
second intellectual mentor and advisor, although Dr. Clark also actively participated in personal
mentorship with Thomas. It was through Dr. Clark that Thomas gained a deeper understanding
of biology and science as a whole, which led Thomas into a never ending form of question and
answer with nature.