Embed Size (px)
Citation preview
Lessons from Massive Floods of 2006 in Surat City: A framework for Application of MS/OR Techniques to Improve Dam
Management to Prevent Flood
Dileep Mavalankar Amit Kumar Srivastava
W.P. No. 2008-07-06 July 2008
The main objective of the working paper series of the IIMA is to help faculty members,
research staff and doctoral students to speedily share their research findings with professional colleagues and test their research findings at the pre-publication stage. IIMA is committed to maintain academic freedom. The opinion(s), view(s) and conclusion(s)
expressed in the working paper are those of the authors and not that of IIMA.
INDIAN INSTITUTE OF MANAGEMENT AHMEDABAD INDIA
Research and Publications
INDIAN INSTITUTE OF MANAGEMENT AHMEDABAD-380 015
INDIA
IIMA INDIA Research and Publications
Lessons from Massive Floods of 2006 in Surat City: A framework for Application of MS/OR Techniques to Improve Dam
Management to Prevent Flood
Dileep Mavalankar Amit Kumar Srivastava
Public Systems Group
Indian Institute of Management, Ahmedabad
Abstract In the month of August 2006, a massive flood in the city of Surat caused major human tragedy and property damage estimated at Rs 22,000 crore. Floods also lead to loss of human and animal life and threat of epidemic. The flood of 2006 was the 3rd major flood since 1994, when plague epidemic broke out in Surat after similar flood. Given the repeated floods in Surat policy makers, administrators, experts and people have to rethink about how to improve dam management to reduce the risk floods. With global warming the risks of extreme weather events will also increase. Given this situation we have tried to analyse the available literature and evidence, including ‘People’s Committee on Gujarat Flood 2006: A Report’, about how Ukai dam was managed during the flood of August 2006 in Surat. This analysis shows that Ukai dam is still being managed using static “Rule Book” originally developed in the 1970s. No modern OR/MS techniques or computer based modeling is used in dam management to reduce risk of flooding. Based on this analysis of the floods and dam management practices we develop a conceptual framework for a Decision Support System using simple modeling of Tapi River and Ukai dam using basic of MS/OR techniques. We have identified more than 18 parameters which should be used for such DSS to minimize risks of flooding and risk of lack of irrigation water in summer. Given that India is a world leader in computer software it should not be difficult or expensive to develop a computerized model of the dam system which will enhance the capacity to balance various risks involved in the dam management. We discuss what needs to be done in public management to develop and apply such DSS in major dams in rivers. Key Words: Flood, Surat, OR/MS, DSS, Dam Management Paper presented at: Third National Conference on Management Science and Practices (MSP) 2008 held at IIM Ahmedabad, organized by ORSI Ahmedabad Chapter, Dated March 22-24, 2008.
W.P. No. 2008-07-06 Page No. 2
IIMA INDIA Research and Publications
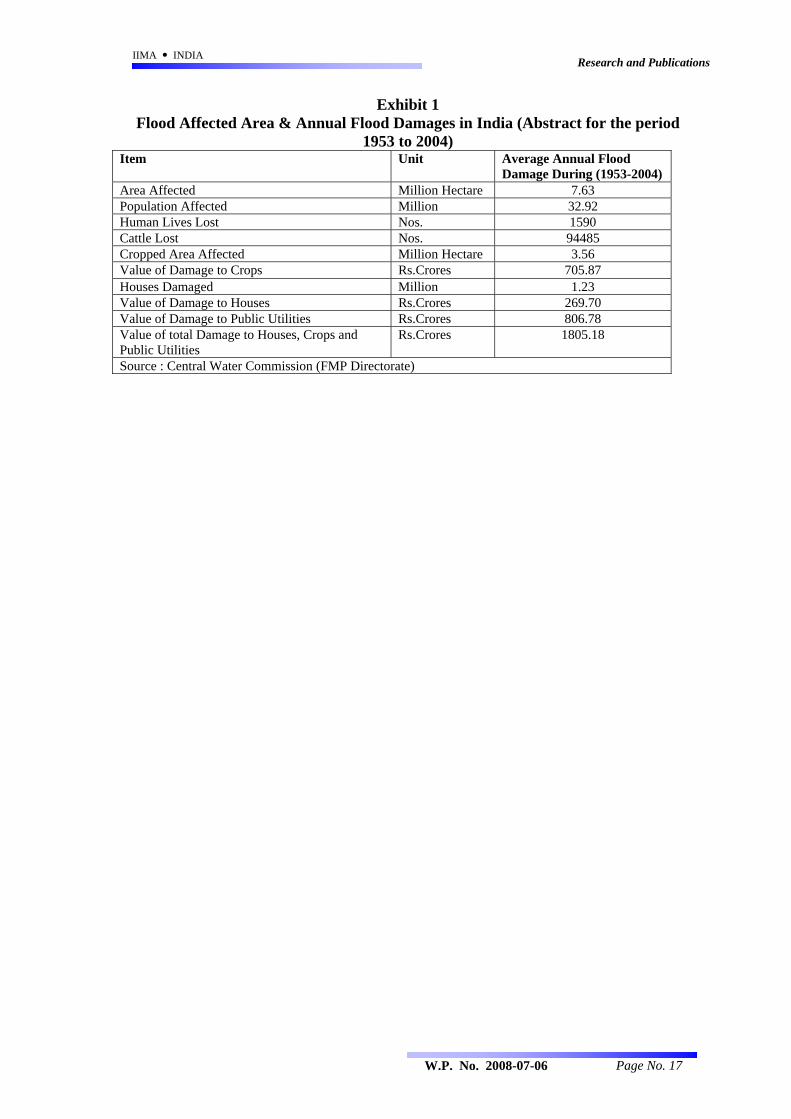
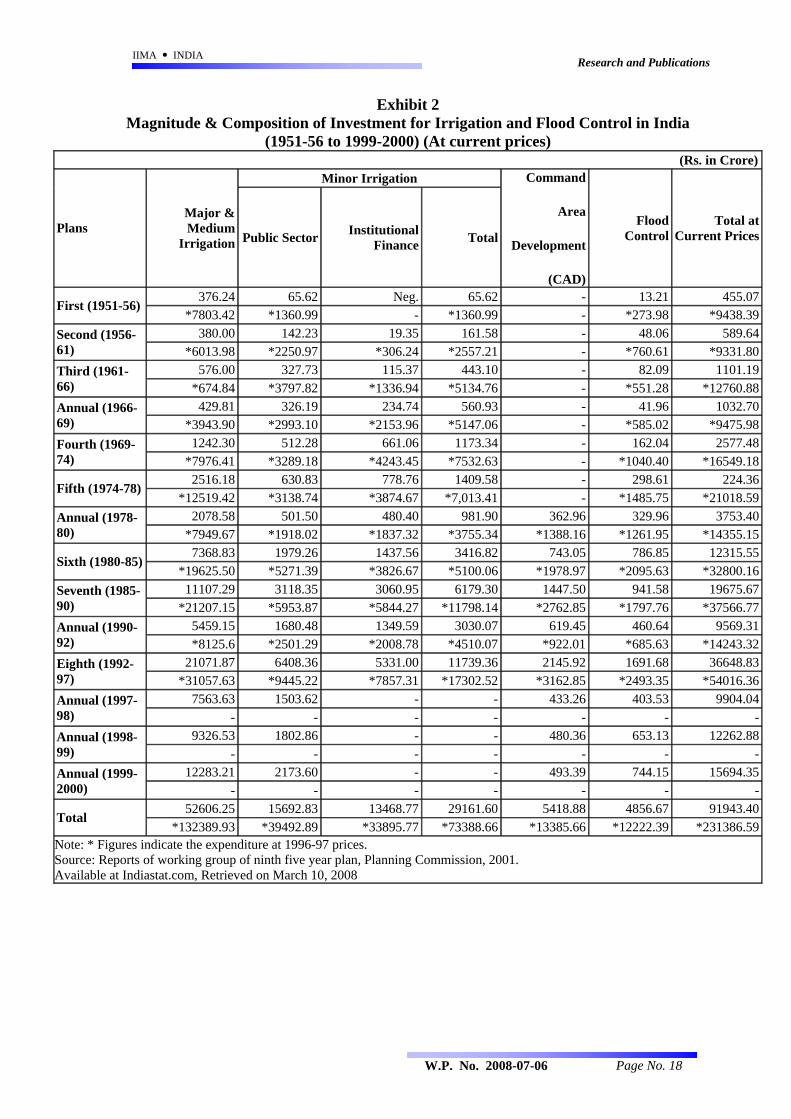
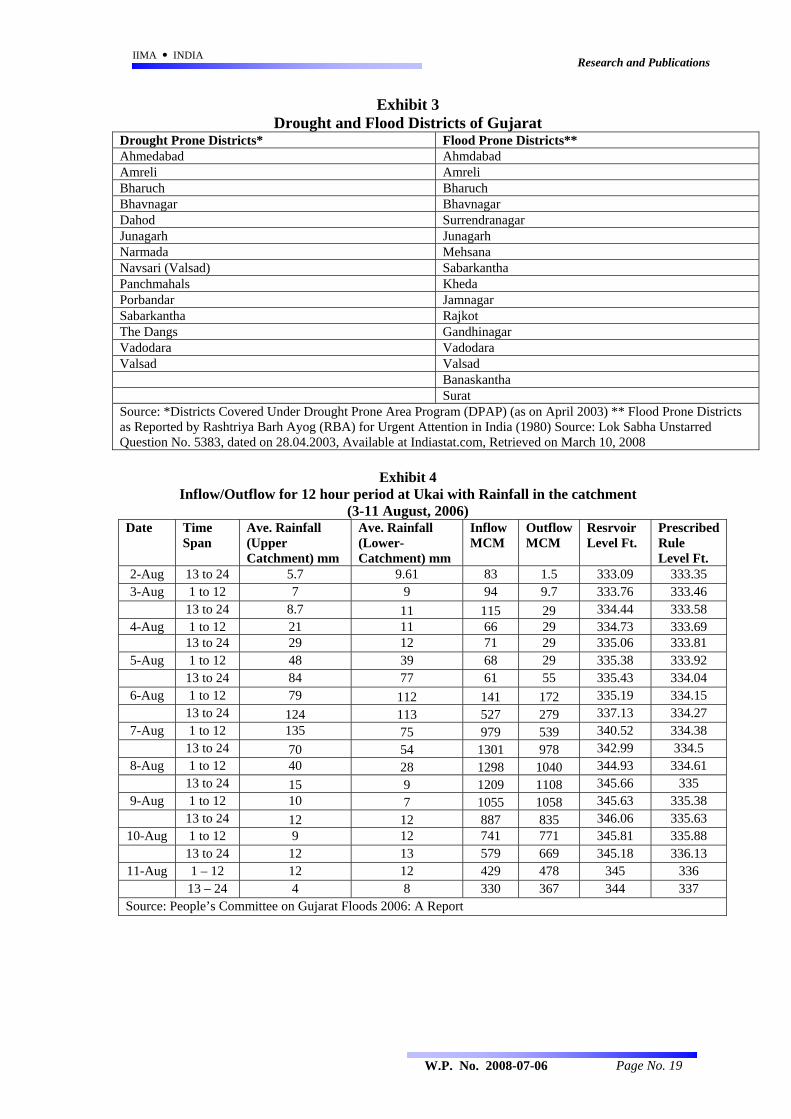
Introduction: Flooding constitutes the most prevalent and costly natural disaster in the world (Kyu-Cheoul Shim et. al 2002). India too has been suffering heavily due to flood (Exhibit 1). Though, Government of India (GOI) has been spending large amount of money on flood control, its main focus is on irrigation (Exhibit 2). GOI has launched ‘National Flood Control Programme’ in 1954 and set up the “Rashtriya Barh Ayog” (RBA), “National Flood Commission”, in 1976 to evolve a coordinated, integrated and scientific approach to the flood control problems in the country and to draw out a national plan fixing priorities for implementation in the future. The RBA in its report in 1980 identified flood prone districts in India including Surat in the state of Gujarat (Exhibit 3). It is interesting to note that some of the districts of Gujarat are also drought prone covered under Drought Prone Area Program (Exhibit 3). Despite these efforts, India is still repeatedly witnessing massive flood such as one seen in Surat in 2006. Dams in India and any where else are made for different purposes including power generation, irrigation, flood prevention, land reclamation, and water diversion. Given the multiple objectives of dams, dam management and food control involves different stakeholders with different interests and responsibilities, which makes the flood control related decision making a complex process. With advances in the field of MS/OR and information technology, various researchers have identified that one of the new trends of solving water management conflicts is to use a decision support system (Davies et al. 1991; Fredericks et al. 1998). Decision Support System (DSS) is a tool that allows decision makers to combine personal judgment with computer support, in a user-machine interface, to produce meaningful information for support in a decision making process (Simonovic 1996). DSS is extensively used in business and management and its application can be extended to any field. Decision Support System for Flood Control: In various part of world Decision Support Systems are being used in water-related decisions making addressing different challenges (Table 1). From the perspective of scientist and researcher, the role of mathematical modeling is to contribute to the better understanding of real world processes. From the perspective of decision maker-dam manager, the role of modeling is to give quantitative information to support optimal decision-making and reduce risk of wrong decisions about water release. Kyu-Cheoul Shim et. al, 2002, emphasise that the development of integrated operational strategies for flood control and multipurpose projects is crucial during real-time flood events and emergency conditions. Modeling of flood dynamics is performed not only to provide a warning system as a technical way to reduce flood risks but also assist in managing reservoir operation particularly during the drought periods (Muhammad Aqil, Ichiro Kita, Akira Yano, and Nishiyama Soichi 2006). Thus, it is clear that a decision support system can be developed in Indian context to balance the water storage and water release decisions to prevent lack of water in summer and flood in rainy seasons. Though India has invested money to prevent flood and drought through construction of large dams for last 50 years, it has failed to use scientific and modern Decision Support Systems to take right decision at right time for dam management. The central water commission (CWC), the apex body of water management in India, has developed the system to collect data on various parameters of water management such as rains, irrigation, and floods.
W.P. No. 2008-07-06 Page No. 3
IIMA INDIA Research and Publications
However, it does not seem to have developed and used mathematical models for an intelligent decision-making for dam operation. It seems that the poor dam operation in India, using “Rule Book” to take decisions on water release and water storage, leads to huge economic and social losses due to preventable floods. Here we analyze a case of repeated flood in Tapti river, which has Ukai dam built in year 1972, to show how use of modern OR/MS approaches can reduce risk of floods.
Table 1: Some of the examples of DSS used to take decision related with water management & Flood Control
Model Researcher River Basin/Country Objective Discrete-time Linear-Quadratic-Gaussian (LQG) model
Wasimi and Kitanidis (1983)
Des Moines River Basin, Iowa, USA
Optimal daily flood control
Basin Runoff and Streamflow Simulation model
Colon and McMahon (1987)
Savannah River Basin of Georgia, USA
Flood Control
Linear Programming model with a Preemptive Goal Programming model
Can and Houck (1984) Green River Basin, Indiana, USA
Hourly flood control
Optimization model Needham et al. (2000) Iowa and Des Moines River Basins, USA
Flood control
Database Management System with specialized versions of the HEC-1 and HEC-5 river basin simulation models
Ford and Killen (1995) Trinity River Basin, Texas, USA
Flood control
Objective of the paper and methodology: Given the repeated floods in India and Surat, both policy makers and executers need to rethink about how to improve dam management to reduce the risk of floods. With global warming the risks of extreme weather events will also increase. Our objective to study Surat Flood 2006 is to understand the reasons for flood and how it could be prevented using DSS based on OR/MS and its tools. We have heavily used information from ‘People Committee on Gujarat Flood 2006: A Report’, newspaper report of the flood and information from internet. Based on our understanding of Ukai dam operation and Surat floods we develop a conceptual framework for a Decision Support System (DSS) using simple modeling of Tapi River and Ukai dam. We have identified more than 18 parameters which should be used for such DSS to minimize risks of flooding and risk of lack of irrigation water in summer. We draw out a road map of how to develop such a model for river/dam system and which stakeholders can help in this. Surat on Tapti: Tapti is one of the large perennial rivers in western India. It is 724 km long originating from Multai in Betul district of Madhya Pradesh. It meets Arabic see near Surat. Total catchment area of the Tapti river basin is 65,145 kms2 including about 79%, 15%, and 6% in Maharastra, MP, and Gujarat respectively. The city of Surat, located on the western part of India in the state of Gujarat on the River Tapi, is an important historical trade centre and trade link between India and many other countries. The city has one of the highest proposed investments and almost zero percent unemployment. It is one of the fastest growing cities in India. In the catchment area of Tapi river the monsoon generally starts during the third week of June and there are occasional heavy rainstorms from the beginning of August to the end of September. The mean annual rainfall in the basin is estimated to be about 758 mm. and the average monsoon rainfall from 1988 to 1998 was 897 mm. The maximum annual rainfall (1168 mm) and the minimum of (257 mm) were recorded in 1944 and 1899. Most of the floods in Tapti occurred during August.
W.P. No. 2008-07-06 Page No. 4
IIMA INDIA Research and Publications
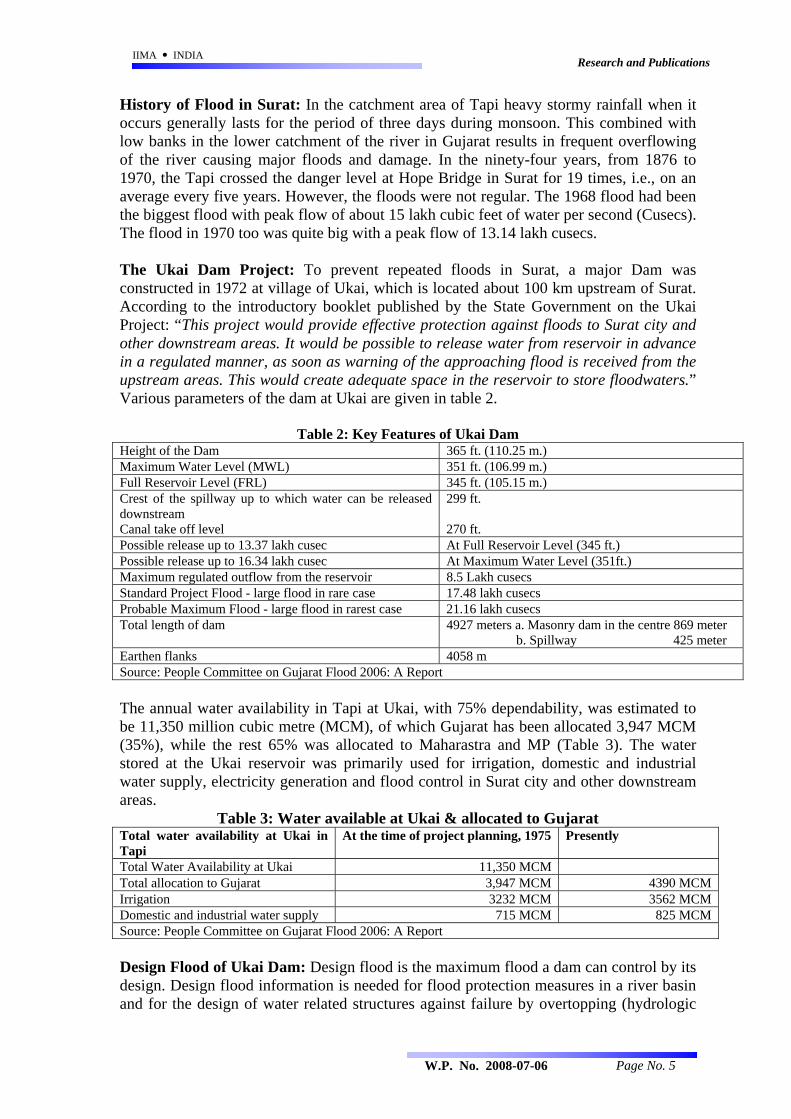
History of Flood in Surat: In the catchment area of Tapi heavy stormy rainfall when it occurs generally lasts for the period of three days during monsoon. This combined with low banks in the lower catchment of the river in Gujarat results in frequent overflowing of the river causing major floods and damage. In the ninety-four years, from 1876 to 1970, the Tapi crossed the danger level at Hope Bridge in Surat for 19 times, i.e., on an average every five years. However, the floods were not regular. The 1968 flood had been the biggest flood with peak flow of about 15 lakh cubic feet of water per second (Cusecs). The flood in 1970 too was quite big with a peak flow of 13.14 lakh cusecs. The Ukai Dam Project: To prevent repeated floods in Surat, a major Dam was constructed in 1972 at village of Ukai, which is located about 100 km upstream of Surat. According to the introductory booklet published by the State Government on the Ukai Project: “This project would provide effective protection against floods to Surat city and other downstream areas. It would be possible to release water from reservoir in advance in a regulated manner, as soon as warning of the approaching flood is received from the upstream areas. This would create adequate space in the reservoir to store floodwaters.” Various parameters of the dam at Ukai are given in table 2.
Table 2: Key Features of Ukai Dam Height of the Dam 365 ft. (110.25 m.) Maximum Water Level (MWL) 351 ft. (106.99 m.) Full Reservoir Level (FRL) 345 ft. (105.15 m.) Crest of the spillway up to which water can be released downstream Canal take off level
299 ft. 270 ft.
Possible release up to 13.37 lakh cusec At Full Reservoir Level (345 ft.) Possible release up to 16.34 lakh cusec At Maximum Water Level (351ft.) Maximum regulated outflow from the reservoir 8.5 Lakh cusecs Standard Project Flood - large flood in rare case 17.48 lakh cusecs Probable Maximum Flood - large flood in rarest case 21.16 lakh cusecs Total length of dam 4927 meters a. Masonry dam in the centre 869 meter
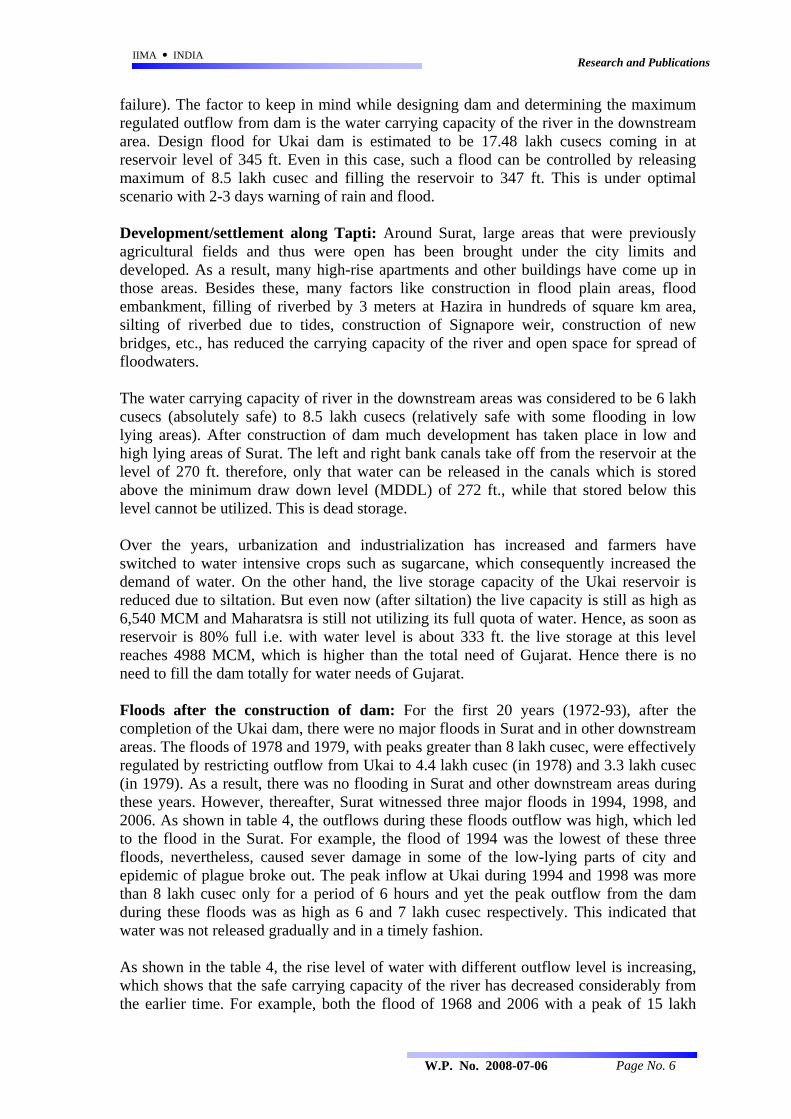
b. Spillway 425 meter Earthen flanks 4058 m Source: People Committee on Gujarat Flood 2006: A Report The annual water availability in Tapi at Ukai, with 75% dependability, was estimated to be 11,350 million cubic metre (MCM), of which Gujarat has been allocated 3,947 MCM (35%), while the rest 65% was allocated to Maharastra and MP (Table 3). The water stored at the Ukai reservoir was primarily used for irrigation, domestic and industrial water supply, electricity generation and flood control in Surat city and other downstream areas.
Table 3: Water available at Ukai & allocated to Gujarat Total water availability at Ukai in Tapi
At the time of project planning, 1975 Presently
Total Water Availability at Ukai 11,350 MCM Total allocation to Gujarat 3,947 MCM 4390 MCM Irrigation 3232 MCM 3562 MCM Domestic and industrial water supply 715 MCM 825 MCM Source: People Committee on Gujarat Flood 2006: A Report Design Flood of Ukai Dam: Design flood is the maximum flood a dam can control by its design. Design flood information is needed for flood protection measures in a river basin and for the design of water related structures against failure by overtopping (hydrologic
W.P. No. 2008-07-06 Page No. 5
IIMA INDIA Research and Publications
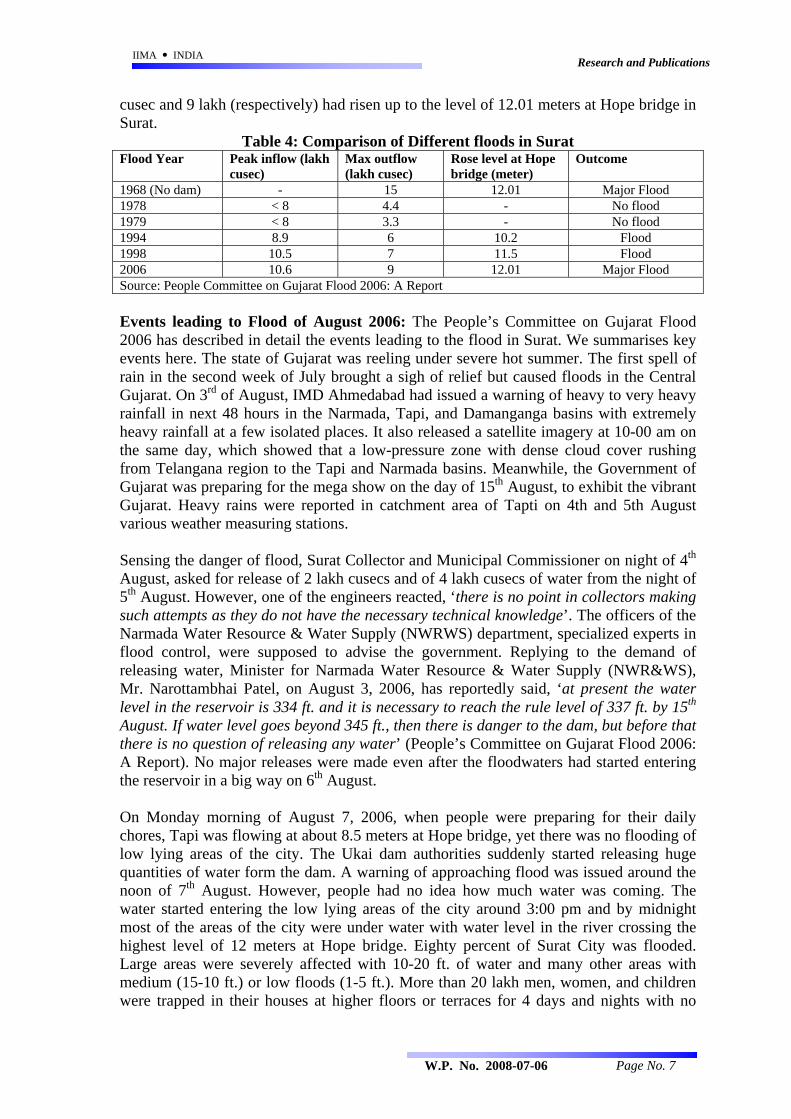
failure). The factor to keep in mind while designing dam and determining the maximum regulated outflow from dam is the water carrying capacity of the river in the downstream area. Design flood for Ukai dam is estimated to be 17.48 lakh cusecs coming in at reservoir level of 345 ft. Even in this case, such a flood can be controlled by releasing maximum of 8.5 lakh cusec and filling the reservoir to 347 ft. This is under optimal scenario with 2-3 days warning of rain and flood. Development/settlement along Tapti: Around Surat, large areas that were previously agricultural fields and thus were open has been brought under the city limits and developed. As a result, many high-rise apartments and other buildings have come up in those areas. Besides these, many factors like construction in flood plain areas, flood embankment, filling of riverbed by 3 meters at Hazira in hundreds of square km area, silting of riverbed due to tides, construction of Signapore weir, construction of new bridges, etc., has reduced the carrying capacity of the river and open space for spread of floodwaters. The water carrying capacity of river in the downstream areas was considered to be 6 lakh cusecs (absolutely safe) to 8.5 lakh cusecs (relatively safe with some flooding in low lying areas). After construction of dam much development has taken place in low and high lying areas of Surat. The left and right bank canals take off from the reservoir at the level of 270 ft. therefore, only that water can be released in the canals which is stored above the minimum draw down level (MDDL) of 272 ft., while that stored below this level cannot be utilized. This is dead storage. Over the years, urbanization and industrialization has increased and farmers have switched to water intensive crops such as sugarcane, which consequently increased the demand of water. On the other hand, the live storage capacity of the Ukai reservoir is reduced due to siltation. But even now (after siltation) the live capacity is still as high as 6,540 MCM and Maharatsra is still not utilizing its full quota of water. Hence, as soon as reservoir is 80% full i.e. with water level is about 333 ft. the live storage at this level reaches 4988 MCM, which is higher than the total need of Gujarat. Hence there is no need to fill the dam totally for water needs of Gujarat. Floods after the construction of dam: For the first 20 years (1972-93), after the completion of the Ukai dam, there were no major floods in Surat and in other downstream areas. The floods of 1978 and 1979, with peaks greater than 8 lakh cusec, were effectively regulated by restricting outflow from Ukai to 4.4 lakh cusec (in 1978) and 3.3 lakh cusec (in 1979). As a result, there was no flooding in Surat and other downstream areas during these years. However, thereafter, Surat witnessed three major floods in 1994, 1998, and 2006. As shown in table 4, the outflows during these floods outflow was high, which led to the flood in the Surat. For example, the flood of 1994 was the lowest of these three floods, nevertheless, caused sever damage in some of the low-lying parts of city and epidemic of plague broke out. The peak inflow at Ukai during 1994 and 1998 was more than 8 lakh cusec only for a period of 6 hours and yet the peak outflow from the dam during these floods was as high as 6 and 7 lakh cusec respectively. This indicated that water was not released gradually and in a timely fashion. As shown in the table 4, the rise level of water with different outflow level is increasing, which shows that the safe carrying capacity of the river has decreased considerably from the earlier time. For example, both the flood of 1968 and 2006 with a peak of 15 lakh
W.P. No. 2008-07-06 Page No. 6
IIMA INDIA Research and Publications
cusec and 9 lakh (respectively) had risen up to the level of 12.01 meters at Hope bridge in Surat.
Table 4: Comparison of Different floods in Surat Flood Year Peak inflow (lakh
cusec) Max outflow (lakh cusec)
Rose level at Hope bridge (meter)
Outcome
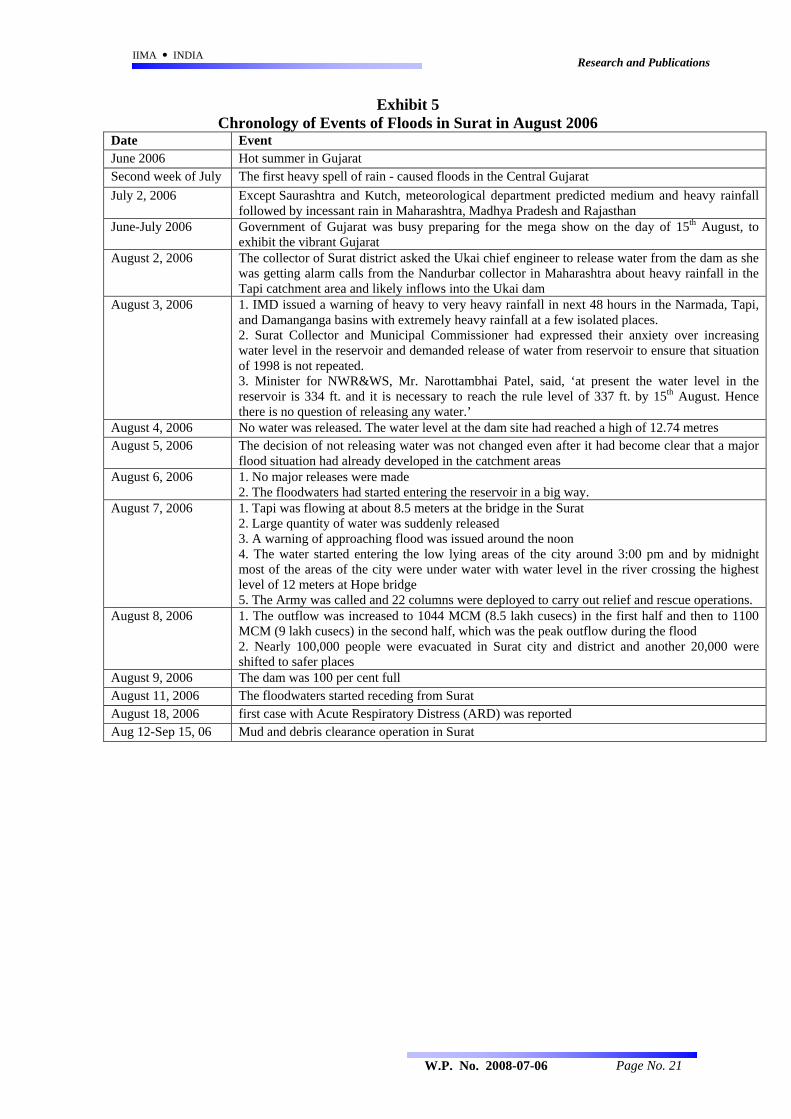
1968 (No dam) - 15 12.01 Major Flood 1978 < 8 4.4 - No flood 1979 < 8 3.3 - No flood 1994 8.9 6 10.2 Flood 1998 10.5 7 11.5 Flood 2006 10.6 9 12.01 Major Flood Source: People Committee on Gujarat Flood 2006: A Report Events leading to Flood of August 2006: The People’s Committee on Gujarat Flood 2006 has described in detail the events leading to the flood in Surat. We summarises key events here. The state of Gujarat was reeling under severe hot summer. The first spell of rain in the second week of July brought a sigh of relief but caused floods in the Central Gujarat. On 3rd of August, IMD Ahmedabad had issued a warning of heavy to very heavy rainfall in next 48 hours in the Narmada, Tapi, and Damanganga basins with extremely heavy rainfall at a few isolated places. It also released a satellite imagery at 10-00 am on the same day, which showed that a low-pressure zone with dense cloud cover rushing from Telangana region to the Tapi and Narmada basins. Meanwhile, the Government of Gujarat was preparing for the mega show on the day of 15th August, to exhibit the vibrant Gujarat. Heavy rains were reported in catchment area of Tapti on 4th and 5th August various weather measuring stations. Sensing the danger of flood, Surat Collector and Municipal Commissioner on night of 4th August, asked for release of 2 lakh cusecs and of 4 lakh cusecs of water from the night of 5th August. However, one of the engineers reacted, ‘there is no point in collectors making such attempts as they do not have the necessary technical knowledge’. The officers of the Narmada Water Resource & Water Supply (NWRWS) department, specialized experts in flood control, were supposed to advise the government. Replying to the demand of releasing water, Minister for Narmada Water Resource & Water Supply (NWR&WS), Mr. Narottambhai Patel, on August 3, 2006, has reportedly said, ‘at present the water level in the reservoir is 334 ft. and it is necessary to reach the rule level of 337 ft. by 15th August. If water level goes beyond 345 ft., then there is danger to the dam, but before that there is no question of releasing any water’ (People’s Committee on Gujarat Flood 2006: A Report). No major releases were made even after the floodwaters had started entering the reservoir in a big way on 6th August. On Monday morning of August 7, 2006, when people were preparing for their daily chores, Tapi was flowing at about 8.5 meters at Hope bridge, yet there was no flooding of low lying areas of the city. The Ukai dam authorities suddenly started releasing huge quantities of water form the dam. A warning of approaching flood was issued around the noon of 7th August. However, people had no idea how much water was coming. The water started entering the low lying areas of the city around 3:00 pm and by midnight most of the areas of the city were under water with water level in the river crossing the highest level of 12 meters at Hope bridge. Eighty percent of Surat City was flooded. Large areas were severely affected with 10-20 ft. of water and many other areas with medium (15-10 ft.) or low floods (1-5 ft.). More than 20 lakh men, women, and children were trapped in their houses at higher floors or terraces for 4 days and nights with no
W.P. No. 2008-07-06 Page No. 7
IIMA INDIA Research and Publications
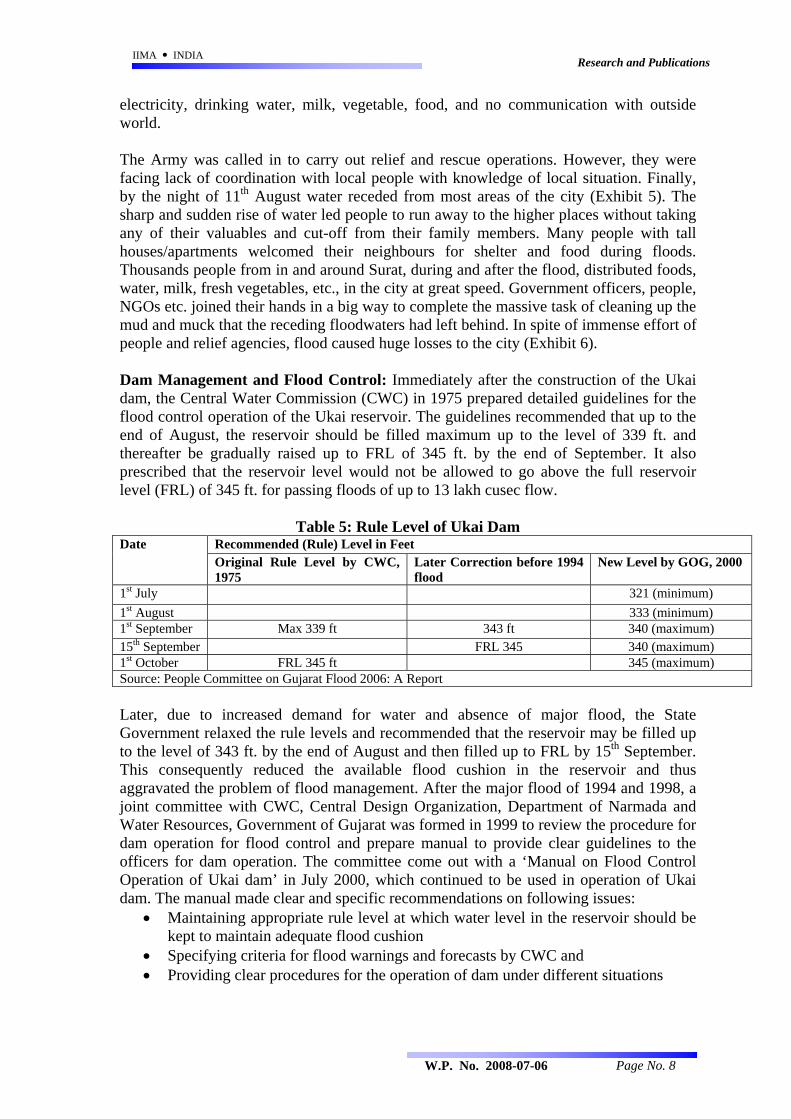
electricity, drinking water, milk, vegetable, food, and no communication with outside world. The Army was called in to carry out relief and rescue operations. However, they were facing lack of coordination with local people with knowledge of local situation. Finally, by the night of 11th August water receded from most areas of the city (Exhibit 5). The sharp and sudden rise of water led people to run away to the higher places without taking any of their valuables and cut-off from their family members. Many people with tall houses/apartments welcomed their neighbours for shelter and food during floods. Thousands people from in and around Surat, during and after the flood, distributed foods, water, milk, fresh vegetables, etc., in the city at great speed. Government officers, people, NGOs etc. joined their hands in a big way to complete the massive task of cleaning up the mud and muck that the receding floodwaters had left behind. In spite of immense effort of people and relief agencies, flood caused huge losses to the city (Exhibit 6). Dam Management and Flood Control: Immediately after the construction of the Ukai dam, the Central Water Commission (CWC) in 1975 prepared detailed guidelines for the flood control operation of the Ukai reservoir. The guidelines recommended that up to the end of August, the reservoir should be filled maximum up to the level of 339 ft. and thereafter be gradually raised up to FRL of 345 ft. by the end of September. It also prescribed that the reservoir level would not be allowed to go above the full reservoir level (FRL) of 345 ft. for passing floods of up to 13 lakh cusec flow.
Table 5: Rule Level of Ukai Dam Recommended (Rule) Level in Feet Date Original Rule Level by CWC, 1975
Later Correction before 1994 flood
New Level by GOG, 2000
1st July 321 (minimum) 1st August 333 (minimum) 1st September Max 339 ft 343 ft 340 (maximum) 15th September FRL 345 340 (maximum) 1st October FRL 345 ft 345 (maximum) Source: People Committee on Gujarat Flood 2006: A Report Later, due to increased demand for water and absence of major flood, the State Government relaxed the rule levels and recommended that the reservoir may be filled up to the level of 343 ft. by the end of August and then filled up to FRL by 15th September. This consequently reduced the available flood cushion in the reservoir and thus aggravated the problem of flood management. After the major flood of 1994 and 1998, a joint committee with CWC, Central Design Organization, Department of Narmada and Water Resources, Government of Gujarat was formed in 1999 to review the procedure for dam operation for flood control and prepare manual to provide clear guidelines to the officers for dam operation. The committee come out with a ‘Manual on Flood Control Operation of Ukai dam’ in July 2000, which continued to be used in operation of Ukai dam. The manual made clear and specific recommendations on following issues:
• Maintaining appropriate rule level at which water level in the reservoir should be kept to maintain adequate flood cushion
• Specifying criteria for flood warnings and forecasts by CWC and • Providing clear procedures for the operation of dam under different situations
W.P. No. 2008-07-06 Page No. 8
IIMA INDIA Research and Publications
Water release Vs Water storage: In 1975 the restricted outflow at Ukai was 8.5 lakh cusec and water was not allowed to go above the Full Reservoir Level (FRL) of 345 ft for passing flood up to 13 lakh cusec magnitude. It was required to balance the need for storing necessary water and leaving adequate empty space (flood cushion) in the reservoir for absorbing sudden influx of water during floods following heavy rains in cathement area. The manual had examined those conflicting needs, storing necessary water and leaving adequate empty space in the dam, and fixed the rule levels and dam operation procedures for different situations for four monsoon months (Exhibit 7). Under normal situation as defined in the manual, all additional inflow of water up to (5 lakh cusec) should be released downstream, once the water level in the reservoir has reached the prescribed rule level for the day. It is critical to maintain adequate flood cushion in the reservoir during Augusts and September, as the major flood in Tapi usually occur during these two months. However, it seems that the irrigation department’s main concern was to keep the dam reservoir as full as possible to make maximum water for irrigation in summer months. This is seen in exhibit 4 where water level was maintained above the rule level even when heavy rains were predicted on 3rd August. This consideration may have led to delay in the release of water during 4-6th August 2006. The irrigation department has not even followed the Rule Book for releasing the water and undue delay happened in releasing water in the first week of August 2006 from Ukai Dam. Prediction of Flood: The Tapi division of Central Water Commission (CWC) has a system of 18 rainfall monitoring stations spread across the entire river basin, 9 discharge monitoring stations, and 7 gauge stations equipped with wireless communication facility for collecting and transmitting the hydrological data to the flood control room at Surat. Rainfall, water level, discharge and other parameters are continuously monitored at these stations and data is transmitted to the CWC division office at Surat through a wireless network. But even in year 2000 no thought was given to computerise the management of dam using OR/MS tools. In addition, daily rainfall of some key rain gauge stations and heavy rainfall warning are also received by telegram/teleprinter from Indian Meteorological Department (IMD). These data is transmitted to the control room at Surat, which then issues flood warnings and inflow forecasts for Ukai dam and Surat city and passes this information to various agencies of the State Government. According to criteria set in manual of Ukai dam operation, CWC shall issue regular 12 hourly inflow forecast for Ukai dam for all floods with a peak discharge of more than 35000 cusec, irrespective of the water level in the Ukai reservoir. These forecasts were based on the hydrological data from the base station at Gidhede in Maharatra and available information for the intermediate catchment. Gidhade is about 130 km upstream of Ukai and travel time for water from there to Ukai is about 12 hrs. Apart from the inflow in the next 12 hours, these forecasts also provide additional information like inflow in 06 hours, in 12-24 hours, and after 24 hours. As per the manual, the forecasts are continuously monitored during the period and revised, if necessary, after 6 hrs. Advisory flood warnings for expected high flood are also issued when the reservoir level was above 333 ft. There were three types of forecasts and their conditions namely, normal, high alert, and emergency situation see Exhibit 7 for details. The first condition for issuing high alert or emergency situation was that the water level in the reservoir has to be 336 ft. or more. Moreover, the rainfall to be taken into account
W.P. No. 2008-07-06 Page No. 9
IIMA INDIA Research and Publications
was only the one - recorded up to 8:30 am in the morning for previous 24 hours. It was perhaps because of theses peculiar conditions in the manual that no high alert or emergency warning were issued before the flood of 2006, although more than 65 mm of rainfall had already fallen in both upper and lower catchment by 8:30 pm on 5th August. On 6th morning, the water level in the reservoir was only 335 ft. and so no warning was issued even though heavy rains had already fallen in catchment areas. Suppose even if 100 mm or 150 mm rain had fallen in the same period no warning would be issued as reservoir was below 336 ft. cut off level prescribed in the manual. On 7th August Ukai authorities had realized that a major emergency has arisen and as such there was no need for any such warnings. Thus specifications in the manual precluded giving warning in time on 6th as reservoir level was low. The Surat staffs of CWC were simultaneously engaged in providing forecasts for three major floods (Damanganga, Tapi, and Narmada) during this period. Moreover, from 7th August their office itself was under more than 10 ft. of water with no electricity, water, and food. This also shows wrong selection of office location in flood prone area in Surat. Closure of CWC office in Surat would mean disruption of forecasts for Narmada and Daman ganga river also. Improving Flood Management through Decision Science When the Ukai and other major dam were planned and built in the 1960-70s “Decision Science” such as operation research, management sciences, computer science and weather prediction, Geographical Information System (GIS) etc. were not so well developed as today. Then India was a poor country, with very low science and technology base. Technology Institutes such as Indian Institute of Technology (IITs) and Management Institutes such as Indian Institute of Management (IIMs) were in their infancy. Hence, dams were operated by simple thumb rules, developed by civil engineers, codified in “Rule Books” for release of water based on dam level and date of the calendar, without taking into account various other relevant parameters and without use of sophisticated mathematical models. Even though CWC give forecast of flood situation and warnings they are also based on certain static decision rules as seen above in Tapi/Surat Flood of 2006. Historically many human settlements were along the rivers but people chose the highest possible points thus minimizing chance of floods. But with increasing population of the cities, settlements had to occur at lower and lower levels and closer to river thus increasing chances for floods. This had happened in Surat also. At the time when dam was built perhaps rivers (Tapi) had good carrying capacity down stream as Surat city’s encroachments on the river banks was minimal. By 2006, things have changed in the world. Technology has much advanced in many fields – India is globally recognized as a power of computer software technology and technical competence in engineering and management. India has its own satellites, many research and higher education institutions such as ISRO, IITs and IIMs with very capable scientific and technological expertise in many fields. Foreign exchange reserves are booming so that country can buy any needed technology and expertise. India is already buying $13 billion of military hardware over next five-seven years. But still we cannot control devastating floods in Tapti and other rivers in spite of big dams because of non application of modern scientific techniques. Millions have suffered in Surat and many
W.P. No. 2008-07-06 Page No. 10
IIMA INDIA Research and Publications
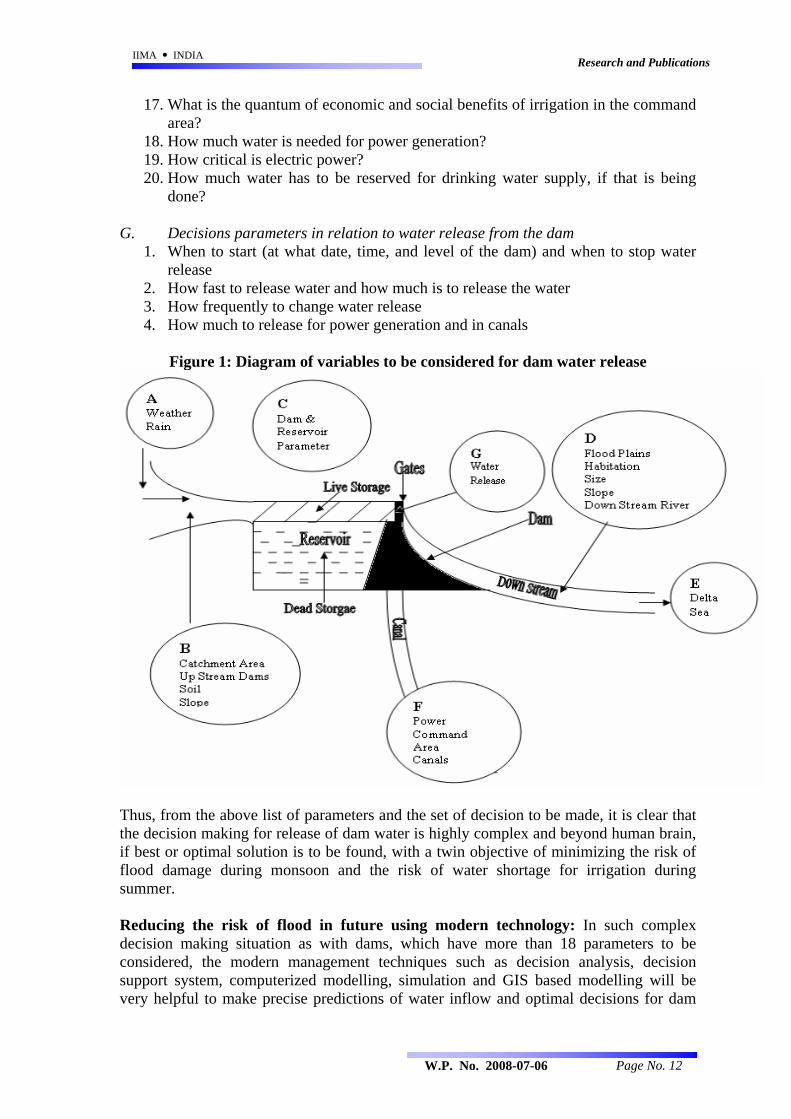
parts of Gujarat and other states due to floods. This state of affair is not acceptable in any modern country. A Conceptual Framework of Decision Support System for Flood Control: The water level management at a dam require critical and urgent decision-making under complex and uncertain environment, especially when heavy rains are predicted in catchment areas. Water release, required before flood water approaches the dam, has to depend on multiple parameters – many of which have associated “uncertainties” or lack of data. Especially in impending flood situation following heavy rains in catchment areas dam managers must make quick decisions to deplete water level to create adequate ‘Flood Cusion”. For such decision making many parameters have to be considered. We have grouped them in six groups based on aspects of river where they operate (Figure 1). These parameters are: A. Weather prediction and Rain fall related parameters
1. How much rain is going to fall in catchment area in near future (say 1 – 3 days)? 2. How many more days are left in the rainy season? 3. What is the overall (long-term) monsoon prediction (normal, moderate, scanty…)
for the year? B. Catchment area parameters
4. What is the nature of catchment area - size, parts, slope, absorption capacity of soil, forest density etc.
5. Any small or medium dams in the catchment area 6. If it rains are predicted, how much water will reach in the dam and at what time
and date after seepage and evaporation losses? C. Dam & Reservoir parameter
7. Various parameters of the dam including height of the dam (maximum water level, full reservoir level, level of the spill ways, and canal off take level, rates of release of water possible from the dam, design flood size etc)
8. What is the water holding capacity (live capacity) of the dam and has it changed over the years?
D&E. Down stream and river delta parameter
9. What is the water carrying capacity of the river down stream at various critical places?
10. What is the settlement pattern (legal and illegal) around the river down stream? 11. What is the situation of embankments along the river? 12. What is the situation of rains and tributaries down stream which will add water to
the river besides dam release? 13. What is the quantum of economic and social damage likely to happen due to
floods down stream? 14. What is the tide situation of the sea when the flood water will reach it (high tide or
low tide - this will determine the clearance of the water in the sea) F. Command area parameter - Social and Economic impact of water release
15. What is the irrigation and cropping pattern and is it possible to change that based that based on water availability?
16. Are there alternate sources of water available in the command area of the canals of the dam?
W.P. No. 2008-07-06 Page No. 11
IIMA INDIA Research and Publications
17. What is the quantum of economic and social benefits of irrigation in the command area?
18. How much water is needed for power generation? 19. How critical is electric power? 20. How much water has to be reserved for drinking water supply, if that is being
done? G. Decisions parameters in relation to water release from the dam
1. When to start (at what date, time, and level of the dam) and when to stop water release
2. How fast to release water and how much is to release the water 3. How frequently to change water release 4. How much to release for power generation and in canals
Figure 1: Diagram of variables to be considered for dam water release
Thus, from the above list of parameters and the set of decision to be made, it is clear that the decision making for release of dam water is highly complex and beyond human brain, if best or optimal solution is to be found, with a twin objective of minimizing the risk of flood damage during monsoon and the risk of water shortage for irrigation during summer. Reducing the risk of flood in future using modern technology: In such complex decision making situation as with dams, which have more than 18 parameters to be considered, the modern management techniques such as decision analysis, decision support system, computerized modelling, simulation and GIS based modelling will be very helpful to make precise predictions of water inflow and optimal decisions for dam
W.P. No. 2008-07-06 Page No. 12
IIMA INDIA Research and Publications
water release to minimize both risks of flooding and risk of less water for summer. For this following suggestion are made for Tapti basin and Ukai Dam
1. Develop a systematic “data base” of information related to key parameters listed above with as historical data as possible. For example, with certain rain in the catchment how much water comes to the dam. With certain release of water how much flood happens in Surat.
2. Develop a computerised model for this river system with catchment area reservoir & down stream area.
3. Develop methods to link short term and long-term weather prediction data from Indian Meteorology Department (IMD) and national sources including satellite images from ISRO to such a computerized river system model so that the dam model can predict how much water will come to the dam based on weather prediction for next seven days. This model connecting weather prediction to actual rain received should be tested and validated using historical data on various parameters.
4. Increase the number of weather stations in the catchment area from current 18-19 to about 75 to 100, or more, for better estimate of weather and rain fall as the catchment area of Ukai dam is very large (62225 km2). If required, install Weather Radars at key positions in the catchment area to have better local prediction of weather. Install or increase the number of flow measuring devices and level measuring devices at the key locations on tributaries to Tapti in Maharastra to get “real time” data on how much water is flowing in to Tapti from various tributaries at different points. There are “automatic rain gauges” available that continuously measures rain and send the data by mobile phone to a central office1. This will provide real time advance data for estimation of water inflows in the dam.
5. There should be re-assessment of carrying capacity of Tapti on the down stream side and re-assessment of change in capacity of the live storage of the Ukai reservoir to see if siltation has made any major impact on this capacity. The reservoir and down stream geography and settlement should be mapped in detail and put on GIS system on powerful computers so that effect of various level of water release on flooding can be assessed accurately and people can be warned. There should be reassessment of what is the total water available in Tapi; how much water Maharastra and MP are using and how much is available to Gujarat; how much is needed for Gujarat; and at what dam water level this water is available.
6. The water distribution system of Ukai canals should be re-evaluated to see how much water is really needed for irrigation, and if it can be reduced using drip irrigation instead of open irrigation. When dam was designed, it was done assuming open irrigation. If drip irrigation system is used much less water should needed to be stored in the dam for the same command area for irrigation. It should also be assessed if cropping pattern can be changed to crops needing less water rather than sugarcane and rice, which needs more water.
7. The measure taken by Surat Municipal Corporation and urban development authority etc to prevent further encroachment on the river bank should be reviewed. The possibility of building wall or Dykes along the river to prevent flooding of the city and villages should be explored. This is done regularly in The Netherlands and in Bangladesh where floods are common.
8. Unauthorized encroachment in the river should be removed.
1 This devise was reported in Business Today some years ago.
W.P. No. 2008-07-06 Page No. 13
IIMA INDIA Research and Publications
9. River should be desilted and channel deepened where possible to increase carrying capacity.
It is reported that a simple general model is developed by Central Water Commission (CWC) and it is in use in Hirakund dam and some other dams. It seems that Gujarat government has not adopted this computerized dam management model developed by CWC. This should be immediately done and government should study other dams where such model is used.
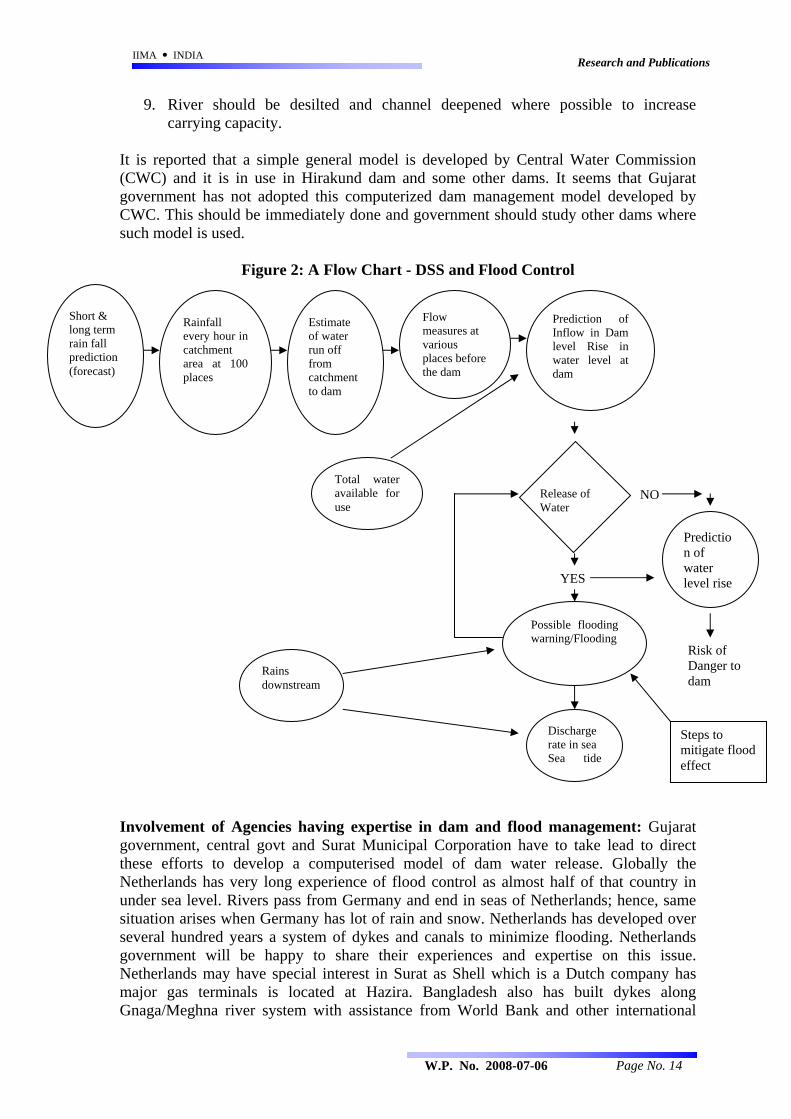
Figure 2: A Flow Chart - DSS and Flood Control
Involvement of Agencies having expertise in dam and flood management: Gujarat government, central govt and Surat Municipal Corporation have to take lead to direct these efforts to develop a computerised model of dam water release. Globally the Netherlands has very long experience of flood control as almost half of that country in under sea level. Rivers pass from Germany and end in seas of Netherlands; hence, same situation arises when Germany has lot of rain and snow. Netherlands has developed over several hundred years a system of dykes and canals to minimize flooding. Netherlands government will be happy to share their experiences and expertise on this issue. Netherlands may have special interest in Surat as Shell which is a Dutch company has major gas terminals is located at Hazira. Bangladesh also has built dykes along Gnaga/Meghna river system with assistance from World Bank and other international
Discharge rate in sea Sea tide
Possible flooding warning/Flooding
Prediction of Inflow in Dam level Rise in water level at dam
Estimate of water run off from catchment to dam
Rainfall every hour in catchment area at 100 places
Rains downstream
Total water available for use
Flow measures at various places before the dam
Release of Water
NO
YES
Prediction of water level rise
Risk of Danger to dam
Short & long term rain fall prediction (forecast)
Steps to mitigate flood effect
W.P. No. 2008-07-06 Page No. 14
IIMA INDIA Research and Publications
donors to prevent flooding of large areas. There may be other countries with such experiences and expertise. Within India, there were various technical agencies, institutes such as IITs, Engineering Colleges, IIMs, Irrigation research institutes, central water commission, government departments, ISRO, Indian Meteorology dept (IMD), computer software companies like Inforsys, Wipro, Satyam, TCS etc., major engineering companies such as L&T, Jaypee, HCC, Gamman India who construct major dams, all these can help in development of software for such computerized model and Decision Support System (DSS) for dam/flood control. Others stakeholders including Surat based industries e.g. Diamond and textile companies and Hazira based companies that are directly affected may also contribute to this effort in terms of money or technical expertise. Surat Municipal Corporation and District Panchayat should also help in the effort. Benefits of computerized dam management system: Such computerized dam management using DSS will help reduce the risk of flooding of Surat and surrounding villages at the same time it will ensure adequate water for irrigation in the summer. The risk reduction will happen due to better prediction of how much water is going to come to the dam in next 24 to 72 hours based on weather prediction, rainfall data, water flow data and better modeling of the dam system. Based on this the irrigation department will be able to release water from the dam early and swiftly taking into account present carrying capacity of the river down stream. This will prevent heavy releases leading to flood. For example, when the IMD predicts “heavy to very heavy rains” in catchment area the computerised model will indicate/predict how much rain will fall in what part of the catchment area based on IMD prediction, satellite pictures, and past data base. For example, the prediction could be 10 cm of rain will fall in 50% of catchment area of Tapti in next 36 hours with 60% certainty, the computer model will further predict how much water is likely to come to the dam after 36 or 72 hours, at what rate and how much the water level will go up at the dam. The model will also indicate the uncertainty associated with this prediction. Such prediction is not possible by human judgement in spite of long experience or expertise. Based on this information the computer model will indicate to the irrigation dept how much water can be released without danger of floods and without risk of inadequate irrigation water in the summer. These calculations can be updated every hour as more data comes in on rain and flow in upper areas of river. It should also be possible to computerise the opening and closing of the dam gates and the down stream warning system so that exact amount of water is released as needed and when needed automatically. Of course, there will be possibility of manual over ride of the automatic system of the dam control. The benefits to the irrigation dept will be that they can release water more accurately without risk of being blamed for flood or lack of water in the summer. The political wing will be spared the responsibility of charges of delay in water release and consequent flooding, as has happened in current floods. Thirdly, the risk of flood will go down substantially, and even if it happens much better prediction of level of flooding and warning can be given to people. With help of GIS exact contour maps could be developed to predict which areas will have how much flooding based on amount of water released. Indicative cost-benefit calculations of such computerized dam management system: Very rough calculation of the monetary benefit of the computerised dam management
W.P. No. 2008-07-06 Page No. 15
IIMA INDIA Research and Publications
system (CDMS) is as follows. Say flood damage in Surat happens once every 10 years and it costs Rs. 20,000 crores. If the CDMS helps reduce this risk by 30% - which is a conservative estimate – the expected benefit will be 30% of Rs. 20,000 or Rs. 6,000 crore over 10 years. This is equal to Rs. 600 crores of cost saved per year. If risk reduction is 50% then the befit will be Rs. 1,000 crore per year. Very rough estimate of one time development cost of such CDMS cannot be more than Rs. 20 crore including additional weather stations needed, one time surveys, data collection etc. The annual recurring cost could be about Rs. 5 crore including computer system staff etc. Thus, the cost benefit ratio of any such system will be very favourable- about Rs. 5 crore of cost versus benefits of Rs. 600 core every year! Conclusion: India has invested substantial amount of money in developing large and medium size dam for irrigation and flood control. Inspite of this repeated floods are observed in the country. Mathematical modelling and decision support systems using computer technology has been developed and used in several countries to manage water in reservoirs and ensure better flood control. Our study of floods in Surat 2006 based on People Committee on Gujarat Flood 2006 shows that the traditional “Rule Book” based management of dam reservoir has led to avoidable floods and consequent economic, social, and human losses. This analysis of Surat flood and international practices of dam management shows that the modern OR/MS techniques or computer based modeling can considerably help in reducing the risk of flooding. We are proposing a conceptual framework for Decision Support System, which has to take into account more than 18 parameters of the river hydrology, climate, and urban settlements downstream for optimal management of Ukai dam. Such a mathematical model using MS/OR techniques will be useful in balancing decisions related with water release from the reservoir in order to minimize risks of flooding during monsoon and risk of lack of irrigation water in summer. If developed, such a model will not only be useful in Ukai dam, but also in all other dams in India, as computer models can be easily adopted with change in parameters and data to suit to each river system. With emergence of India as a world leader in computer software it would not be difficult or expensive to develop such computerized model of the dam and the river system. The IT firms and scientists will also be exited to develop such a model as it will be scientifically challenging task and will save lot of economic damage and human misery. Institutes like IIM and IIT can contribute to such computerized dam management system as they have multi-disciplinary faculty needed for such work. We recommend that the central water commission and the planning commission take up this task urgently. _____________________________________________________________________
W.P. No. 2008-07-06 Page No. 16
IIMA INDIA Research and Publications
Exhibit 1 Flood Affected Area & Annual Flood Damages in India (Abstract for the period
1953 to 2004) Item Unit Average Annual Flood
Damage During (1953-2004) Area Affected Million Hectare 7.63 Population Affected Million 32.92 Human Lives Lost Nos. 1590 Cattle Lost Nos. 94485 Cropped Area Affected Million Hectare 3.56 Value of Damage to Crops Rs.Crores 705.87 Houses Damaged Million 1.23 Value of Damage to Houses Rs.Crores 269.70 Value of Damage to Public Utilities Rs.Crores 806.78 Value of total Damage to Houses, Crops and Public Utilities
Rs.Crores 1805.18
Source : Central Water Commission (FMP Directorate)
W.P. No. 2008-07-06 Page No. 17
IIMA INDIA Research and Publications
Exhibit 2 Magnitude & Composition of Investment for Irrigation and Flood Control in India
(1951-56 to 1999-2000) (At current prices) (Rs. in Crore)
Minor Irrigation
Plans Major & Medium
Irrigation Public Sector Institutional Finance Total
Command
Area
Development
(CAD)
Flood Control
Total at Current Prices
376.24 65.62 Neg. 65.62 - 13.21 455.07First (1951-56)
*7803.42 *1360.99 - *1360.99 - *273.98 *9438.39380.00 142.23 19.35 161.58 - 48.06 589.64Second (1956-
61) *6013.98 *2250.97 *306.24 *2557.21 - *760.61 *9331.80576.00 327.73 115.37 443.10 - 82.09 1101.19Third (1961-
66) *674.84 *3797.82 *1336.94 *5134.76 - *551.28 *12760.88429.81 326.19 234.74 560.93 - 41.96 1032.70Annual (1966-
69) *3943.90 *2993.10 *2153.96 *5147.06 - *585.02 *9475.981242.30 512.28 661.06 1173.34 - 162.04 2577.48Fourth (1969-
74) *7976.41 *3289.18 *4243.45 *7532.63 - *1040.40 *16549.182516.18 630.83 778.76 1409.58 - 298.61 224.36
Fifth (1974-78) *12519.42 *3138.74 *3874.67 *7,013.41 - *1485.75 *21018.59
2078.58 501.50 480.40 981.90 362.96 329.96 3753.40Annual (1978-80) *7949.67 *1918.02 *1837.32 *3755.34 *1388.16 *1261.95 *14355.15
7368.83 1979.26 1437.56 3416.82 743.05 786.85 12315.55Sixth (1980-85)
*19625.50 *5271.39 *3826.67 *5100.06 *1978.97 *2095.63 *32800.1611107.29 3118.35 3060.95 6179.30 1447.50 941.58 19675.67Seventh (1985-
90) *21207.15 *5953.87 *5844.27 *11798.14 *2762.85 *1797.76 *37566.775459.15 1680.48 1349.59 3030.07 619.45 460.64 9569.31Annual (1990-
92) *8125.6 *2501.29 *2008.78 *4510.07 *922.01 *685.63 *14243.3221071.87 6408.36 5331.00 11739.36 2145.92 1691.68 36648.83Eighth (1992-
97) *31057.63 *9445.22 *7857.31 *17302.52 *3162.85 *2493.35 *54016.367563.63 1503.62 - - 433.26 403.53 9904.04Annual (1997-
98) - - - - - - -9326.53 1802.86 - - 480.36 653.13 12262.88Annual (1998-
99) - - - - - - -12283.21 2173.60 - - 493.39 744.15 15694.35Annual (1999-
2000) - - - - - - -52606.25 15692.83 13468.77 29161.60 5418.88 4856.67 91943.40
Total *132389.93 *39492.89 *33895.77 *73388.66 *13385.66 *12222.39 *231386.59
Note: * Figures indicate the expenditure at 1996-97 prices. Source: Reports of working group of ninth five year plan, Planning Commission, 2001. Available at Indiastat.com, Retrieved on March 10, 2008
W.P. No. 2008-07-06 Page No. 18
IIMA INDIA Research and Publications
Exhibit 3 Drought and Flood Districts of Gujarat
Drought Prone Districts* Flood Prone Districts** Ahmedabad Ahmdabad Amreli Amreli Bharuch Bharuch Bhavnagar Bhavnagar Dahod Surrendranagar Junagarh Junagarh Narmada Mehsana Navsari (Valsad) Sabarkantha Panchmahals Kheda Porbandar Jamnagar Sabarkantha Rajkot The Dangs Gandhinagar Vadodara Vadodara Valsad Valsad Banaskantha Surat Source: *Districts Covered Under Drought Prone Area Program (DPAP) (as on April 2003) ** Flood Prone Districts as Reported by Rashtriya Barh Ayog (RBA) for Urgent Attention in India (1980) Source: Lok Sabha Unstarred Question No. 5383, dated on 28.04.2003, Available at Indiastat.com, Retrieved on March 10, 2008
Exhibit 4 Inflow/Outflow for 12 hour period at Ukai with Rainfall in the catchment
(3-11 August, 2006) Date Time
Span Ave. Rainfall (Upper Catchment) mm
Ave. Rainfall (Lower-Catchment) mm
Inflow MCM
Outflow MCM
Resrvoir Level Ft.
Prescribed Rule Level Ft.
2-Aug 13 to 24 5.7 9.61 83 1.5 333.09 333.35 3-Aug 1 to 12 7 9 94 9.7 333.76 333.46
13 to 24 8.7 11 115 29 334.44 333.58 4-Aug 1 to 12 21 11 66 29 334.73 333.69
13 to 24 29 12 71 29 335.06 333.81 5-Aug 1 to 12 48 39 68 29 335.38 333.92
13 to 24 84 77 61 55 335.43 334.04 6-Aug 1 to 12 79 112 141 172 335.19 334.15
13 to 24 124 113 527 279 337.13 334.27 7-Aug 1 to 12 135 75 979 539 340.52 334.38
13 to 24 70 54 1301 978 342.99 334.5 8-Aug 1 to 12 40 28 1298 1040 344.93 334.61
13 to 24 15 9 1209 1108 345.66 335 9-Aug 1 to 12 10 7 1055 1058 345.63 335.38
13 to 24 12 12 887 835 346.06 335.63 10-Aug 1 to 12 9 12 741 771 345.81 335.88
13 to 24 12 13 579 669 345.18 336.13 11-Aug 1 – 12 12 12 429 478 345 336 13 – 24 4 8 330 367 344 337 Source: People’s Committee on Gujarat Floods 2006: A Report
W.P. No. 2008-07-06 Page No. 19

IIMA INDIA Research and Publications
Water inflow / outflow at Ukai (3-11 August, 2006)
0
200
400
600
800
1000
1200
1400
13 to24
1 to12
13 to24
1 to12
13 to24
1 to12
13 to24
1 to12
13 to24
1 to12
13 to24
1 to12
13 to24
1 to12
13 to24
1 to12
13 to24
1 –12
13 –24
2-Aug
3-Aug 4-Aug 5-Aug 6-Aug 7-Aug 8-Aug 9-Aug 10-Aug 11-Aug
Inflow MCM Outflow MCM
Actual Level of Reservoir and what is prescribed by the Rule Book in Feet (3-11 August, 2006)
325
330
335
340
345
350
13 to24
1 to12
13 to24
1 to12
13 to24
1 to12
13 to24
1 to12
13 to24
1 to12
13 to24
1 to12
13 to24
1 to12
13 to24
1 to12
13 to24
1 –12
13 –24
2-Aug 3-Aug 4-Aug 5-Aug 6-Aug 7-Aug 8-Aug 9-Aug 10-Aug 11-Aug
Resrvoir Level Ft. Prescribed Level Ft.
W.P. No. 2008-07-06 Page No. 20
IIMA INDIA Research and Publications
Exhibit 5 Chronology of Events of Floods in Surat in August 2006
Date Event June 2006 Hot summer in Gujarat Second week of July The first heavy spell of rain - caused floods in the Central Gujarat July 2, 2006 Except Saurashtra and Kutch, meteorological department predicted medium and heavy rainfall
followed by incessant rain in Maharashtra, Madhya Pradesh and Rajasthan June-July 2006 Government of Gujarat was busy preparing for the mega show on the day of 15th August, to
exhibit the vibrant Gujarat August 2, 2006 The collector of Surat district asked the Ukai chief engineer to release water from the dam as she
was getting alarm calls from the Nandurbar collector in Maharashtra about heavy rainfall in the Tapi catchment area and likely inflows into the Ukai dam
August 3, 2006 1. IMD issued a warning of heavy to very heavy rainfall in next 48 hours in the Narmada, Tapi, and Damanganga basins with extremely heavy rainfall at a few isolated places. 2. Surat Collector and Municipal Commissioner had expressed their anxiety over increasing water level in the reservoir and demanded release of water from reservoir to ensure that situation of 1998 is not repeated. 3. Minister for NWR&WS, Mr. Narottambhai Patel, said, ‘at present the water level in the reservoir is 334 ft. and it is necessary to reach the rule level of 337 ft. by 15th August. Hence there is no question of releasing any water.’
August 4, 2006 No water was released. The water level at the dam site had reached a high of 12.74 metres August 5, 2006 The decision of not releasing water was not changed even after it had become clear that a major
flood situation had already developed in the catchment areas August 6, 2006 1. No major releases were made
2. The floodwaters had started entering the reservoir in a big way. August 7, 2006 1. Tapi was flowing at about 8.5 meters at the bridge in the Surat
2. Large quantity of water was suddenly released 3. A warning of approaching flood was issued around the noon 4. The water started entering the low lying areas of the city around 3:00 pm and by midnight most of the areas of the city were under water with water level in the river crossing the highest level of 12 meters at Hope bridge 5. The Army was called and 22 columns were deployed to carry out relief and rescue operations.
August 8, 2006 1. The outflow was increased to 1044 MCM (8.5 lakh cusecs) in the first half and then to 1100 MCM (9 lakh cusecs) in the second half, which was the peak outflow during the flood 2. Nearly 100,000 people were evacuated in Surat city and district and another 20,000 were shifted to safer places
August 9, 2006 The dam was 100 per cent full August 11, 2006 The floodwaters started receding from Surat August 18, 2006 first case with Acute Respiratory Distress (ARD) was reported Aug 12-Sep 15, 06 Mud and debris clearance operation in Surat
W.P. No. 2008-07-06 Page No. 21
IIMA INDIA Research and Publications
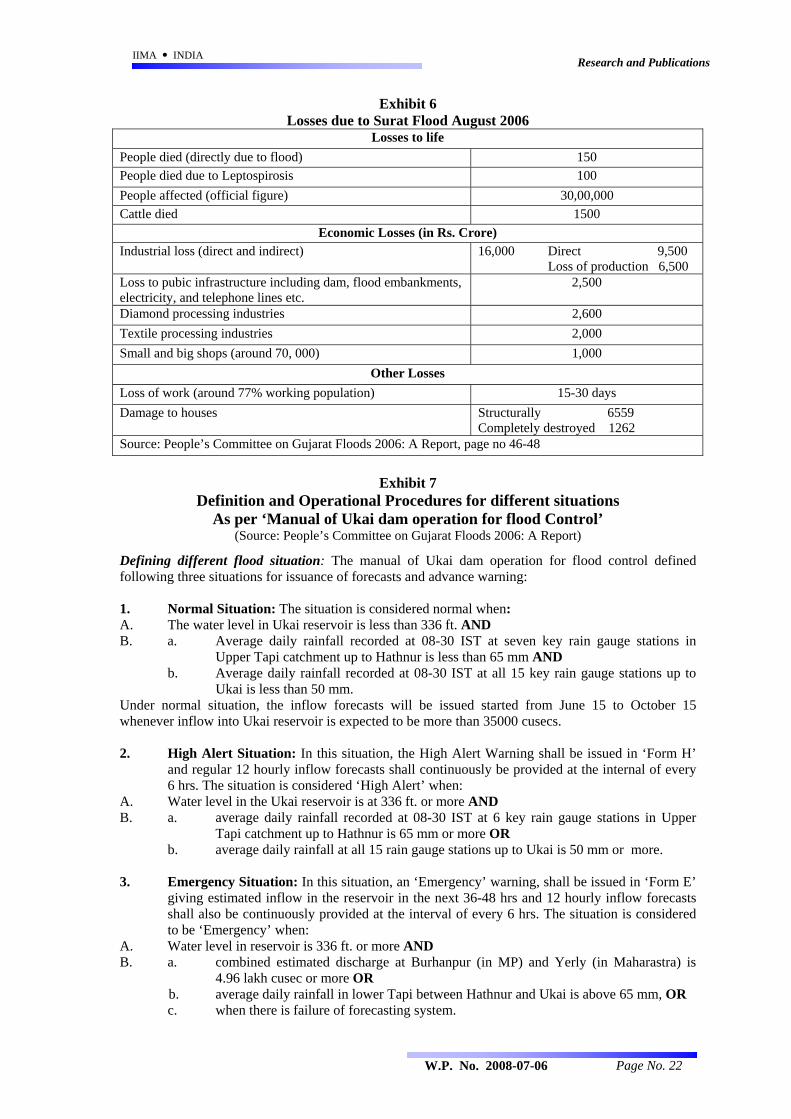
Exhibit 6 Losses due to Surat Flood August 2006
Losses to life People died (directly due to flood) 150 People died due to Leptospirosis 100 People affected (official figure) 30,00,000 Cattle died 1500
Economic Losses (in Rs. Crore) Industrial loss (direct and indirect) 16,000 Direct 9,500
Loss of production 6,500 Loss to pubic infrastructure including dam, flood embankments, electricity, and telephone lines etc.
2,500
Diamond processing industries 2,600 Textile processing industries 2,000 Small and big shops (around 70, 000) 1,000
Other Losses Loss of work (around 77% working population) 15-30 days Damage to houses Structurally 6559
Completely destroyed 1262 Source: People’s Committee on Gujarat Floods 2006: A Report, page no 46-48
Exhibit 7
Definition and Operational Procedures for different situations As per ‘Manual of Ukai dam operation for flood Control’
(Source: People’s Committee on Gujarat Floods 2006: A Report)
Defining different flood situation: The manual of Ukai dam operation for flood control defined following three situations for issuance of forecasts and advance warning: 1. Normal Situation: The situation is considered normal when: A. The water level in Ukai reservoir is less than 336 ft. AND B. a. Average daily rainfall recorded at 08-30 IST at seven key rain gauge stations in
Upper Tapi catchment up to Hathnur is less than 65 mm AND b. Average daily rainfall recorded at 08-30 IST at all 15 key rain gauge stations up to
Ukai is less than 50 mm. Under normal situation, the inflow forecasts will be issued started from June 15 to October 15 whenever inflow into Ukai reservoir is expected to be more than 35000 cusecs. 2. High Alert Situation: In this situation, the High Alert Warning shall be issued in ‘Form H’
and regular 12 hourly inflow forecasts shall continuously be provided at the internal of every 6 hrs. The situation is considered ‘High Alert’ when:
A. Water level in the Ukai reservoir is at 336 ft. or more AND B. a. average daily rainfall recorded at 08-30 IST at 6 key rain gauge stations in Upper
Tapi catchment up to Hathnur is 65 mm or more OR b. average daily rainfall at all 15 rain gauge stations up to Ukai is 50 mm or more.
3. Emergency Situation: In this situation, an ‘Emergency’ warning, shall be issued in ‘Form E’
giving estimated inflow in the reservoir in the next 36-48 hrs and 12 hourly inflow forecasts shall also be continuously provided at the interval of every 6 hrs. The situation is considered to be ‘Emergency’ when:
A. Water level in reservoir is 336 ft. or more AND B. a. combined estimated discharge at Burhanpur (in MP) and Yerly (in Maharastra) is
4.96 lakh cusec or more OR b. average daily rainfall in lower Tapi between Hathnur and Ukai is above 65 mm, OR c. when there is failure of forecasting system.
W.P. No. 2008-07-06 Page No. 22
IIMA INDIA Research and Publications
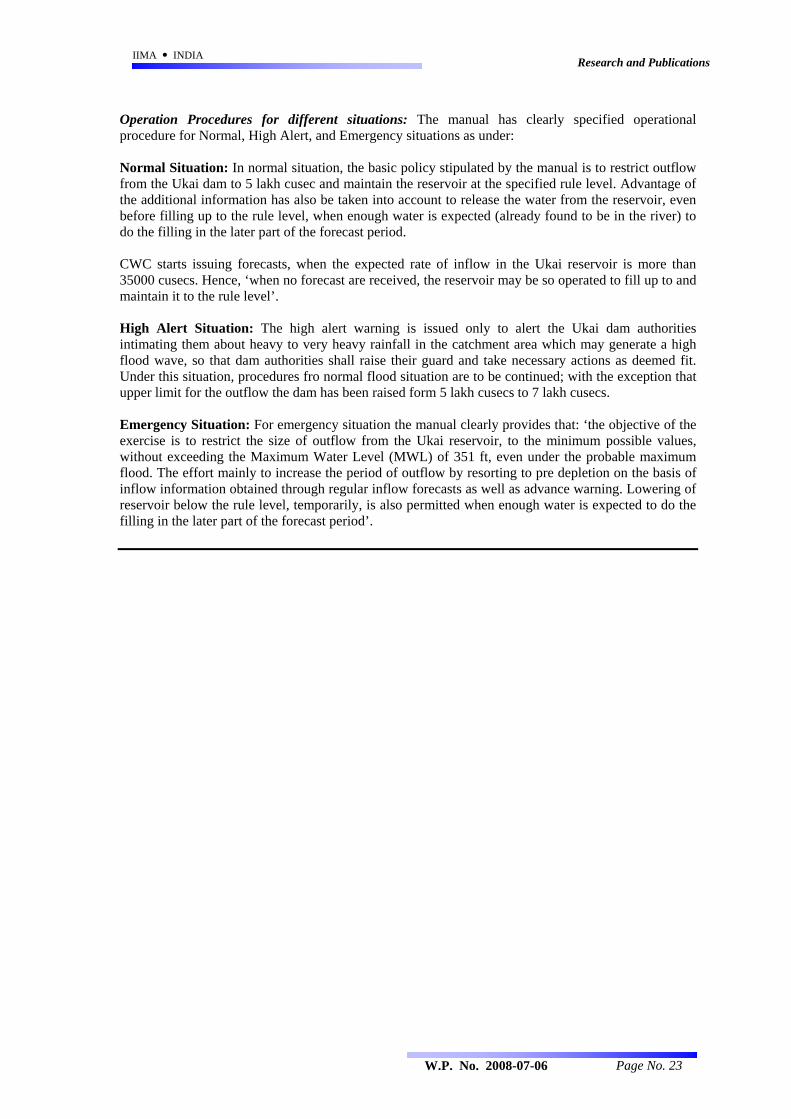
Operation Procedures for different situations: The manual has clearly specified operational procedure for Normal, High Alert, and Emergency situations as under: Normal Situation: In normal situation, the basic policy stipulated by the manual is to restrict outflow from the Ukai dam to 5 lakh cusec and maintain the reservoir at the specified rule level. Advantage of the additional information has also be taken into account to release the water from the reservoir, even before filling up to the rule level, when enough water is expected (already found to be in the river) to do the filling in the later part of the forecast period. CWC starts issuing forecasts, when the expected rate of inflow in the Ukai reservoir is more than 35000 cusecs. Hence, ‘when no forecast are received, the reservoir may be so operated to fill up to and maintain it to the rule level’. High Alert Situation: The high alert warning is issued only to alert the Ukai dam authorities intimating them about heavy to very heavy rainfall in the catchment area which may generate a high flood wave, so that dam authorities shall raise their guard and take necessary actions as deemed fit. Under this situation, procedures fro normal flood situation are to be continued; with the exception that upper limit for the outflow the dam has been raised form 5 lakh cusecs to 7 lakh cusecs. Emergency Situation: For emergency situation the manual clearly provides that: ‘the objective of the exercise is to restrict the size of outflow from the Ukai reservoir, to the minimum possible values, without exceeding the Maximum Water Level (MWL) of 351 ft, even under the probable maximum flood. The effort mainly to increase the period of outflow by resorting to pre depletion on the basis of inflow information obtained through regular inflow forecasts as well as advance warning. Lowering of reservoir below the rule level, temporarily, is also permitted when enough water is expected to do the filling in the later part of the forecast period’.
W.P. No. 2008-07-06 Page No. 23
IIMA INDIA Research and Publications
Reference: Can, E., and Houck, M. (1984). ‘‘Real-time Reservoir Operation by Goal Programming,’’ Journal of Water Resour. Plan. Manage., Vol. 110 (3), pp. 297–309. Colon, R., and McMahon, M. (1987). ‘‘BRASS Model: Application to Savannah River System Reservoirs,’’ Journal of Water Resour. Plan. Manage., 113 (2), pp. 177–190. Davis, J. R., Nanninga, P. M., Biggins, J., and Laut, P. (1991). “Prototype decision Support System for Analyzing Impact of Catchment Policies,” J. Water Resour. Plan. Manage., 117 (4), 399–414. Ford, D. T., and Killen, J. R. (1995). “PC-Based Decision Support System for Trinity, Texas,” J. Water Resour. Plan. Manage., 121(5), 375–381. Fredericks, J. W., Labadie, J. W., and Altenhofen, J. M. (1998). “Decision Support System for Conjunctive Stream-Aquifer Management,” J. Water Resour. Plan. Manage, 124(2), 69–78. Kyu-Cheoul Shim; Darrell G. Fontane, M.ASCE; and John W. Labadie, M.ASCE (2002). “Spatial Decision Support System for Integrated River Basin Flood Control,” Journal of Water Resources Planning And Management, May/June 2002, pp 190 Muhammad Aqil, Ichiro Kita, Akira Yano, and Nishiyama Soichi (2006). “Decision Support System for Flood Crisis Management using Artificial Neural Network,” International Journal of Intelligent Technology, Vol. 1, Number 1, 2006, ISSN 1305-6417) Needham, J., Watkins, D., Lund, J., and Nanda, S. (2000). ‘‘Linear programming for flood control on the Iowa and Des Moines Rivers,’’ J. Water Resour. Plan. Manage., 126 (3), 118–127. People’s Committee on Gujarat Floods 2006: A Report Simonovic, S. P. (1996). “Decision Support y Stems for Sustainable Management of Water Resources: 1. General principles,” Water Int., 21(4), 223–232. Wasimi, S. A., and Kitanidis, P. K. (1983). ‘‘Real-time Forecasting and Daily Operation of a Multireservoir System During Floods by Linear Quadratic Gaussian Control,’’ Water Resour. Res., 19, 1511–1522.
W.P. No. 2008-07-06 Page No. 24