Embed Size (px)
Citation preview
Flip side of the pollution haven: do export
destinations matter?∗
Svetlana Batrakova†
First Draft: August 2010This Version: August 2011
Abstract
This paper looks at a reverse side of the pollution haven effect by focusing on
whether destination, rather than source countries matter. The study utilises a firm-
level dataset with aggregate export destinations of Europe and rest of the world
(ROW) and finds that firms in the most polluting industries tend to significantly
improve their energy intensity when starting to export to Europe, compared with
non-exporters, and this effect is not present when firms in the most polluting indus-
tries decide to start exporting to the rest of the world. Such energy improvement
of export starters to Europe appears not to be driven by overall efficiency im-
provements or by energy intensity of the polluting industries. Recent innovations
survey data suggest firms might be reacting to existing or expected environmental
regulations.
Keywords: Export destinations, Energy use, Firm level data, Pollution haven, Regu-
lations
JEL Classification: F18, Q56, L23, C23
∗This paper uses confidential micro datasets of the Central Statistics Office Ireland (CSO). Therestricted and controlled access to the data was provided in accordance with the Statistics Act, 1993. Iam grateful to Kevin Phelan, Gerry Brady, Ben Berstock, Carol Anne Hennessy and Dan Lawlor for theprovided assistance. I thank Ron Davies, Andrew Bernard and participants of the 3rd GIST conference,Robert Elliott, Matthew T. Cole, Stefanie Haller, Fergal McCann, Jurate Jaraite and participants of theXIth RIEF conference for helpful comments and suggestions. Funding from the Irish Research Councilfor the Humanities and Social Sciences (IRCHSS) and the Irish Research Council for Science, Engineeringand Technology (IRCSET) is gratefully acknowledged.†University College Dublin, School of Economics, svetlana.batrakova[at]ucd.ie
1 Introduction
Effects of environmental regulations have been an intense focus of many political
and academic debates for decades. Academic research has meticulously and thoroughly
studied regulations’ effects from as early as late 1970s.1 The primary objective of the
studies was to establish whether increased stringency of environmental regulations at
home would lead to increased imports from countries with laxer environmental stan-
dards. As this would mean plant reallocation and possible job losses the interest in this
debate is as acute now as it has been when it started. The perceived negative implications
of stricter environmental regulations at home and laxer regulations in source countries
became known as pollution haven effects. Despite an impressive volume of both theoret-
ical and empirical studies the debate has not been settled yet. See Copeland and Taylor
(1994), Copeland and Taylor (1995), Markusen et al. (1995), Antweiler et al. (2001),
Copeland and Taylor (1997), Copeland and Taylor (2004), Levinson (2009), Levinson
and Taylor (2008), Dean and Lovely (2010), Javorcik and Wei (2004), Ederington et al.
(2004), List et al. (2003), Keller and Levinson (2002), Cole and Elliott (2003) for some
findings on pollution havens. The more recent literature by e.g. Ederington et al. (2005)
and Cole et al. (2010) argues for a more differentiated empirical approach to pollution
havens by stressing, amongst other things, the importance of looking at the imports from
developing countries versus total imports and of focusing on the most polluting sectors
of the economy.
A question that has not been addressed by a pollution haven literature so far is whether
there is anything to the reverse side of the argument. Do export destinations matter as
well as a source country for firms’ behaviour? While the pollution haven effect suggests
that an increase in regulation would lead to a relocation of production to a low-regulation
location, affecting both the extensive and intensive trading decisions of a firm, it does
not discuss what other exporting firm choices might be affected. In particular, if strong
policies result from consumer preferences for green goods, then a shift in destination
regulation would also represent a shift in destination preferences. This in turn could
impact other environmental decisions of firms in the source country. This paper takes a
first step towards investigating this by examining energy usage of a firm as a function of
destination market.
This is an empirical investigation and it utilises a comprehensive Census dataset
of Irish manufacturing firms from the period of 1991 to 2008. As no direct emission
information is available in the data, the use is made of firms’ energy consumption as this
has been shown to be highly correlated with emissions.2 Export destination information is
1See e.g. early theoretical works of Pethig (1976) and McGuire (1982).2See Eskeland and Harrison (2003) and Cole et al. (2008).
2
available on an aggregate level for three destinations: Europe, USA, and all the rest of the
world (ROW). The research question this study addresses is whether a firm significantly
adjusts its energy using pattern before it starts exporting to either more developed and,
hence, more environmentally strict regions of the EU and the USA as opposed to the less
environmentally strict area of the rest of the world (ROW).3
The main empirical finding of this study is the evidence that firms in polluting in-
dustries, such as are defined by Cole et al. (2005) for the UK, Cole and Elliott (2005) for
the USA or as the set of industries affected by the EU ETS (European Union Emissions
Trading System) for the EU, starting to export to the EU significantly reduce their en-
ergy use compared to their non-exporting counterparts and this is not the case for firms
in these industries that start exporting to the ROW region. On average, however, there
are no significant differences in energy use found between all export starters to Europe
(and USA) and to the rest of the world when compared to non-exporters.
What could be driving this result? Almost all the industries classified as polluting are
high users of energy. Could the result simply be driven by high energy using industries
wherein firms deciding to start exporting to Europe are cutting down their energy costs
and firms deciding to start exporting to the rest of the world do not do so? To test this
the paper have looked at all export starters in the most energy-intensive industries and
failed to find the same energy improving effect of export starters to Europe there. So the
energy improving outcome is there for firms in most polluting industries but not firms
in most energy-intensive industries.4 Another possible explanation is that energy, being
an imperfect, if the only available, proxy for environmental behaviour of firms is just an
input and firms starting to export to Europe (and the USA) are trying to improve their
overall efficiency and the result is more vivid for firms in industries that heavily rely on
material inputs. To test this, the same estimations are re-run with material use instead
of energy use as a dependant variable. Data, however, does not show any evidence that
firms in polluting industries improve their material use before they start to export to
Europe, unlike the energy use finding. So the effects seems also not to be due to firms’
overall efficiency improvements.
Another possible explanation could lie in differences between preferences. As the
more developed markets are known to prefer higher standards of environmental quality,
this could spur energy efficiency adjustments of firms starting to export there. This
consideration may be of more importance in the industries that are big polluters, where
3Although, admittedly, the rest of the world region is a highly aggregated group which might includedeveloped, OECD countries such as Japan or Canada or Australia, it also includes developing worldcountries, hence average level of regulations overall is going to be lower there compared with Europe/USAdestinations. The study does verify the main findings with a shorter panel with more disaggregateddestinations data.
4Those industries overlap but not perfectly so.
3
highest improvements can be achieved per unit of abatement costs, such as the more
polluting industries, in line with argumentation by Wheeler (2001). Unfortunately, the
available data does not allow to empirically test this.
Yet other one could lie in differences in a perceived current and future relative envi-
ronmental regulation load in destination regions. Again, this difference may be of more
importance in the industries that are big polluters, where regulations pressure is the high-
est and also where highest improvements can be achieved per unit of abatement costs.
The effect of regulations can be empirically tested using a recent wave of Community In-
novation Survey available for a subset of Irish firms. The study uncovers some tentative
evidence that a pull of current and expected environmental regulations have made firms
in polluting sectors who export mainly to developed destinations (OECD or the EU) more
likely to introduce environmental innovations. All firms exporting to developed destina-
tions (OECD or the EU) are more likely to introduce those innovations reportedly as a
result of environmental regulations. Interestingly, firms in polluting industries exporting
mainly to developing world are significantly less likely to introduce any environmental
innovations in response to environmental regulations. Although this still does not ex-
plain why Irish firms in the polluting industries would react more to regulations when
exporting to developed as compared to developing destinations, it suggests that, perhaps,
exporters, that have always been known to be more innovative, have a higher incentive to
improve their overall environmental performance when facing a market which is known
for its higher valuation of environmental performance and a stricter regulatory stance on
it.
To sum up, there is something to be said about turning pollution heaven effect on its
head and investigating how firms’ export destination decision is affecting their environ-
mental performance proxied by energy use and self-reported environmental innovations.
Destination markets do matter but only for a subset of firms in polluting industries that
start exporting to Europe.
The remainder of the paper is structured as follows: Section 2 describes the datasets
and main variables used for the analysis, Section 3 presents the empirical methodology
employed in the paper, Section 4 outlines key findings. Section 5 then gives a summary
of robustness checks and Section 6 concludes.
4
2 Data
2.1 CIP Dataset and main variables
The main source of firm level data on manufacturing firms used in this study is the
Irish Census of Industrial Production (CIP) - an annual census of manufacturing, mining
and utilities firms. The Census is conducted by the Central Statistics Office (CSO) at
both enterprise and plant level. The CIP covers all enterprises or plants with 3 or more
people engaged. The period of the CIP data is 1991-2008. The list of manufacturing
industries used is given in Table 6 in Appendix A.
The CIP dataset on manufacturing firms provides an unbalanced panel spanning 18
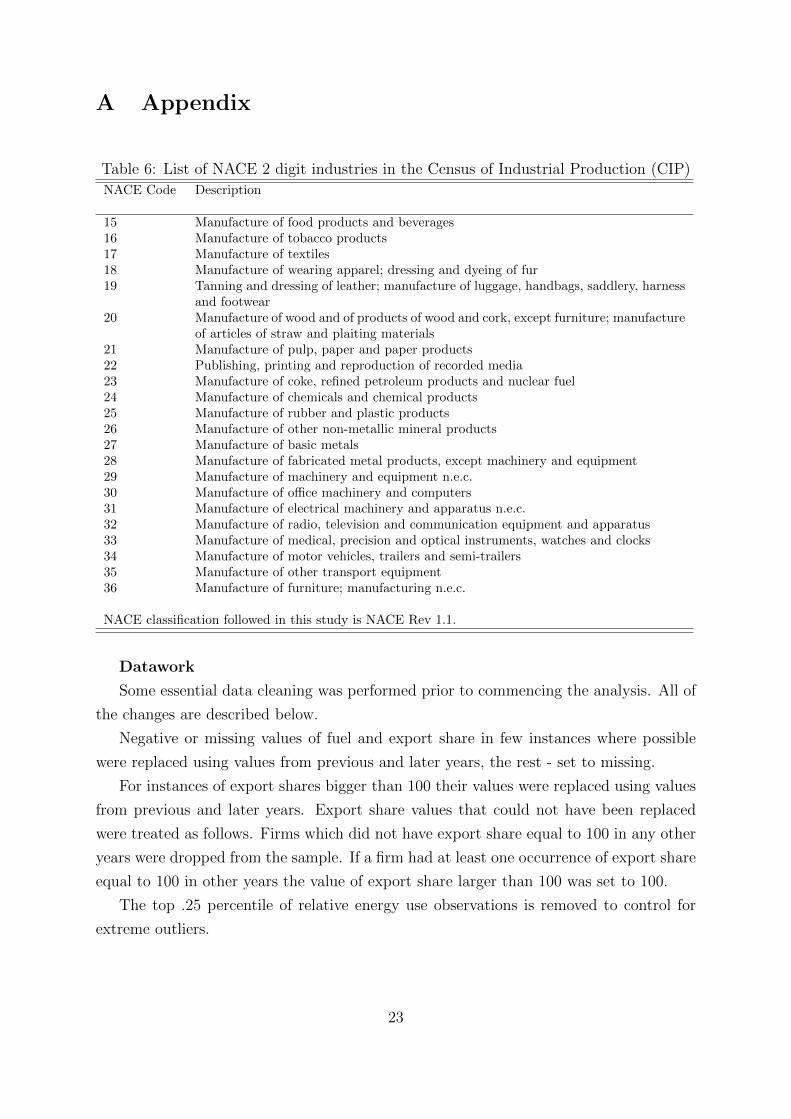
years and 10706 firms in total. Summary statistics of the main variables of interest are
presented in table 8 in Appendix A.5
The relevant variables in the Census of Industrial Production are primary industrial
classification (at 2, 3 and 4 digit NACE level), country of ownership, total turnover, export
share (as a % of turnover exported), employment (measured as total employed), skill level,
total labour costs, total gross earnings (wage), outsourced R&D expenses, aggregate
investments, freight charges, total purchases of fuel and power (energy): solid fuels,
petroleum products, natural and derived gas, renewable energy sources, heat, electricity.
Table 7 in Appendix A presents a list of variables used and their definitions for the
purpose of this analysis.
To proxy the environmental performance of firms, data on total energy spending on
firm level is used, similar to Cole et al. (2008) and Eskeland and Harrison (2003). As the
questions on fuel and power used were asked on the enterprise rather than plant level,
enterprise dataset of the CIP is used. Most enterprises (more than 90%) in the Census
are single-plant firms.
Dependent variable in the analysis presented below is therefore a firm’s energy inten-
sity (relative energy use) which is given by total energy use spending by a firm reported
annually in the Census in proportion to its total sales (turnover), to bring the energy
costs in perspective relative to firm’s size.6
Exporting information on a firm level is given by a share of exports in total sales
(turnover). This is being used to construct an exporter dummy on a firm level which
equals 1 if a firm i is an exporter at a time t and 0 otherwise. This is also being used to
split the sample into export destination groups as described in more detail below.
5Monetary values are deflated using Industrial Producer Price Indices with year 2005 as a base,provided by the CSO. Energy variables are deflated using the CSO Wholesale Price Indices for EnergyProducts with year 2005 as a base.
6Throughout the rest of the paper the term energy intensity and (relative) energy use will be usedinterchangeably to define the dependent variable as outlined above.
5
CIP provides further information on firm characteristics that are used as control
variables in the study. Firm’s productivity is measured as labour productivity, calculated
as a total turnover per employee. There is no data on capital stock in the CIP but there is
information on capital flows that is used to construct a capital proxy as an accumulated
measure of firm’s capital additions built over the whole period minus sales of capitals
assets, assuming 10% yearly depreciation rate overall. As earlier studies suggested that
foreign ownership might have an effect on firm’s environmental performance, an ownership
variable indicating whether a firm is foreign-owned, dummy variable set to 1, or domestic-
owned, dummy variable set to 0, is included.7 Skill intensity of a firm (share of skilled
labour in total labour) is included to see whether more skill-intensive firms might be more
energy-efficient. In all of the analysis additional controls for year and industry effects are
included too, in a form of year dummies and industry dummies at NACE 3 digit level.8
Export destinations
The dataset provides somewhat curtailed information on destinations. Generally, 4
major export destination groups are available - the EU, the UK, the USA and the rest
of the world. The CIP dataset allows to see what proportion of total sales goes to each
of these four groups of countries, if any.
For the purpose of the analysis, the four export destination groups are aggregated up
to two - exporters to Europe are those mostly exporting to the EU and the UK. Exporters
to the USA are added to that group of more developed destinations. The exporters to
the rest of the world (ROW) are those firms who primarily export to the countries in the
rest of the world group.
Since a lot of firms export to many and not just one destination, the division into
two export destination groups has been performed based on the majority rule. If over
60% of the firm’s export share has been going to the EU/UK and USA group, then those
firms are labelled as exporters to Europe/EU. If over 60% of firm’s exporting share has
been going to the rest of the world, then those firms are put into exporters to the ROW
category.
2.2 International trade data
An auxiliary dataset is being used to run a robustness check in the paper. It is an
international trade dataset of Irish firms involved in exporting or importing activities. It
includes information on the country of origin of an imported good and the country of
7See e.g. Albornoz et al. (2009), Cole et al. (2008), Cole et al. (2006).8CIP uses NACE Revision 1.1. NACE 1.1 is a European statistical classification system of economic
activities corresponding to ISIC Rev.3 at European level.
6
destination of an exported good, value and quantity of a good and its classification on
CN8 level. The data are available for a shorter panel set of 2000-2008. The international
trade dataset has been merged with the CIP dataset by the statisticians at the Central
Statistics Office Ireland. Most of the trading firms in the CIP dataset are found in the
international trade dataset too. For the purposes of this study the use is made of only
that part of the dataset that contains detailed export destination and trade value of goods
exported to a certain destination - the EU, OECD, Non-OECD. See Section 5 for more
details on the methodology of this exercise and its findings.
2.3 Community Innovation Survey (CIS) data
In search of possible explanations for finding the evidence supporting the flip side of
the pollution haven effect and to a certain degree reinforce the findings made with energy
use as a proxy for environmental behaviour, another dataset has been added to the two
already described above.
This dataset is different from the two above as it is a survey data and covers only
a proportion of Irish firms present in the CIP data. Community Innovation Survey has
been asking Irish firms in 3-year waves on their conduct in terms of product and process
innovations, R&D, and cooperative behaviour in research and innovation alliances. The
recent wave spanning 3 years of 2006 up to and including 2008 has added a set of questions
on environmental innovations. It asks whether a firm in the last three years (2006-2008)
has introduced an environmental innovation that helps it reduce energy or material use,
CO2 footprint, air or water or other pollution, etc. It also enquires on the motivation
behind introducing an environmental innovation, such as regulations, grants, agreements,
etc.9
When combined with the two datasets above, Community Innovation Survey was
used to examine questions on whether firms in polluting industries are more likely to
introduce environmental innovations if they export to developed world versus developing
and if regulations might play a role.
3 Empirical Strategy
The main focus of the paper and the main research question that it aims to answer
is whether there is a significant adjustment in firms’ energy behaviour before they start
9For more information on this or any other datasets described above, please visit web-site of theCentral Statistics Office Ireland at http://www.cso.ie/.
7
exporting to a more developed and therefore more environmentally strict area of the EU
and the USA or a less developed and environmentally strict area of the countries of the
rest of the world (ROW).
3.1 Energy use response to export start
The main empirical methodology is applying fixed effects estimations - within estimations
in a panel setting, making use of repeated firm observations over the available time period
(up to 18 years). The main focus is on changes in relative energy use (proxy for energy
intensity) one period before, at time t−1, associated with the changes in exporting status
within a firm at a time t, holding other things at t− 1 equal.
The focus on relative energy use one year before exporting is motivated by an effect
transportation or learning from exporting or other changes might have on energy use
when a firm starts exporting. To have a clear picture of whether exporting induces a firm
to significantly adjust its energy using pattern in a preparation to exporting either to the
EU or to other countries of the world, any possible clouding influences of these effects
should be excluded. However, to further justify the findings, the specification at time t
is run too and a resulting pattern is very similar.
Unobserved, time invariant firm fixed effects are eliminated by time demeaning -
subtracting the individual means of the variables as in (Wooldridge (2002), p.267):
Yit − Yit = (Xit −Xit)β + Uit − Uit (3.1)
where Y is a variable of interest, X - covariates and U - an error term. More specifi-
cally, what is being estimated here has a following form:
(Energy
Turnover
)it−1
= Exporteritj + Controlsit−1 + εit−1 (3.2)
Energy intensity is measured as firm’s total energy purchased relative to its turnover.
Controls includes ownership dummy, size (total wage bill) and size squared, capital, skill
intensity, year and industry (at NACE 3 level) dummies.10 Since energy intensity variable
on the left hand side is proportioning the costs of energy by turnover of the firm to account
for its size, labour productivity, measured as turnover per worker is therefore excluded
10In some specifications total employment is used instead of wage to control for size but this does notchange any of the derived results.
8
from the control variables on the right hand side. An additional account is taken of firm’s
size and its squared measure instead, together with a proxy for capital.11
Exporteritj dummy is the main variable of interest here. Conditioning on other firm’s
characteristics one period before, this variable shows how a future change in starting
to export to a particular destination j affects firm’s energy intensity prior to start of
exporting. More specifically, whether a firm switching to exporting to a region j in
period t, adjusts its energy intensity at a time t− 1 in a way significantly different from
that of a non-exporting firm.
Further, this specification is developed to add an effect of starting to export to a
certain destination interacted with a dummy for a polluting industry (or an energy in-
tensive one) to single out an effect of firm’s export start to a destination region if that
firm belongs to polluting sector over and above the average destination effect.
(Energy
Turnover
)it−1
= Exporteritj+Exporteritj∗Polluting Industry+Controlsit−1+εit−1 (3.3)
Alternatively, as mentioned above, to confirm some of the main findings, estimations
of the model at a time t to estimate contemporaneous effects of change in export status
are run:
(Energy
Turnover
)it
= Exporteritj + Exporteritj ∗Polluting Industry + Controlsit + εit (3.4)
To single out the effect due to export start only, the sample is limited to firms who
switch to exporting during their reported CIP life-span, contrasting them with firms who
never exported. In order to make sure the effect captured is that of a firm switching from
non-exporting to exporting status (0 to 1 in terms of the variable of interest) and not
the other way round, the sample is trimmed to include only the non-exporting firms and
firms that switch to exporting just once in their observed in the data life-span. Firms
that stop exporting are excluded from the sample.
3.2 Propensity to innovate
Although main results are derived from within estimations - looking at within firm change
of export status and how that affects its energy use, an auxiliary set of estimations is run
11To make sure exclusion of labour productivity is not affecting the main results, estimations are re-runwith labour productivity included on the right hand side, this does not affect the results, see Section 5.
9
to try and explain the main findings of the paper. They deal with firms’ propensity to
innovate.
To establish that a simple probit estimation is run on propensity to introduce an in-
novation depending on firm’s export status. Results are checked with demeaning all main
variables to account for firms’ fixed effects. Since the dataset used for these estimations
is an extremely short one of just three years of 2006-2008 and includes only a handful
of firms present in the main - CIP dataset, it is not possible to identically replicate the
estimation method above in terms of only focusing on export starters and non-exporters.
There is not enough export starters to observe in 3 years, especially with export start
at decreasing rate in the late 2000. So the estimation compares all exporters and non-
exporters who have been participating in the last wave of the Community Innovation
Survey (CIS).
P (Yit = 1|Xit) = G(Xitβ) (3.5)
The specification is along the lines of equation 3.5, where Y denotes a binary out-
come of either introducing an environmental innovation in the period of 2006-2008 - 1 or
not introducing one - 0. The variables of interest affecting this propensity to innovate
are different exporter status dummies to indicate exporters to either developed world
(OECD/EU) or developing region (non-OECD), and those dummies interacted with a
dummy indicating belonging to a polluting industry to single out the effect over and
above the average destination-exporter effect of firm in the polluting industry exporting
to a developed versus developing region. Estimations further control for ownership status,
size and size squared, labour productivity, capital proxy, energy used and skill level, as
well as year and industry dummy at 3 digit NACE level. As mentioned above, demeaning
is also done to check that time invariant firm average levels of controls do not drive the
results.
4 Do export destinations matter?
This study is enquiring whether there is something to the flip side of pollution haven
effect and, therefore, whether export destinations are important for firms’ environmental
behaviour, proxied in the data by their annual relative energy use. The research question
is to empirically investigate adjustments of firms’ energy behaviour depending on the
10
destination they start exporting to. As outlined in Section 3, results here are derived
for export-starters with majority of their export going either to a more environmentally
strict export destination of Europe (including the USA) versus a less strict destination
of the rest of the world (ROW). These export starters are compared to non-exporters,
although some robustness checks are run on that, see Section 5 for more detail. The main
variable of interest is the effect export start has on firm’s relative energy use one period
before as per specifications in equations 3.2, 3.3 or at a time t as in equation 3.4.
This section starts off with an estimation performed on the whole set of exports
starters, then focuses specifically on those in the most polluting industries. It later goes
on to discuss and address some possible explanations of the findings.
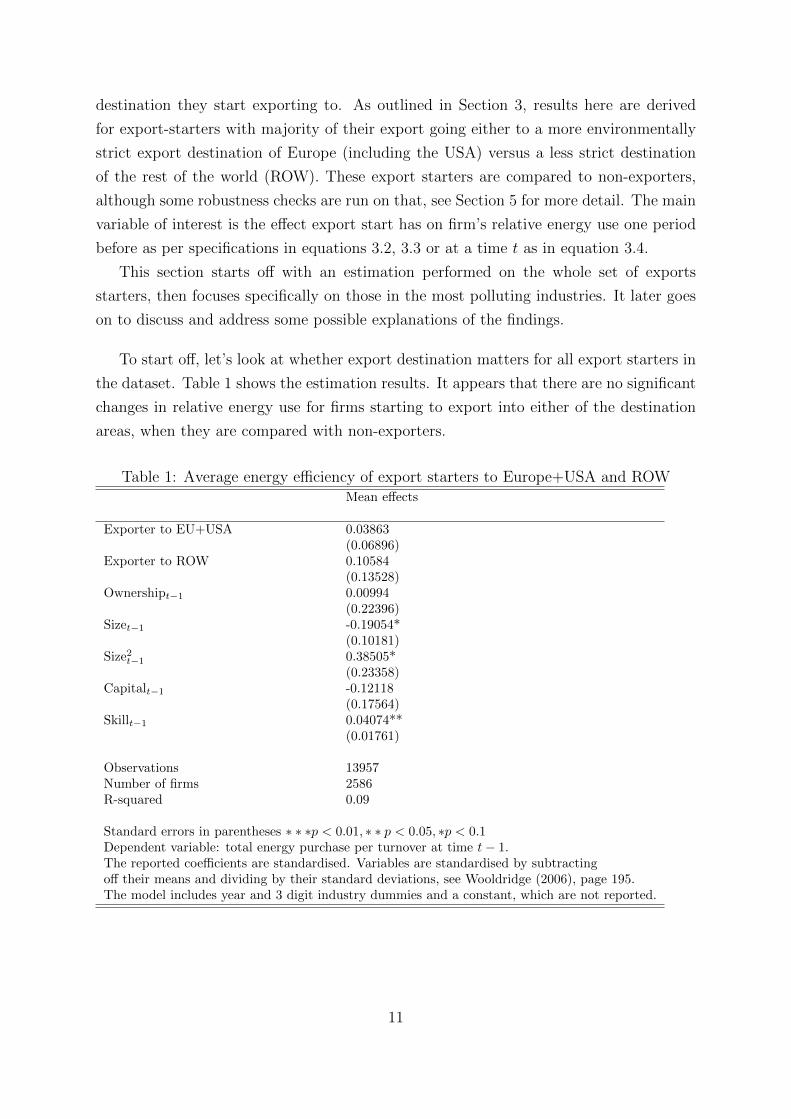
To start off, let’s look at whether export destination matters for all export starters in
the dataset. Table 1 shows the estimation results. It appears that there are no significant
changes in relative energy use for firms starting to export into either of the destination
areas, when they are compared with non-exporters.
Table 1: Average energy efficiency of export starters to Europe+USA and ROWMean effects
Exporter to EU+USA 0.03863(0.06896)
Exporter to ROW 0.10584(0.13528)
Ownershipt−1 0.00994(0.22396)
Sizet−1 -0.19054*(0.10181)
Size2t−1 0.38505*(0.23358)
Capitalt−1 -0.12118(0.17564)
Skillt−1 0.04074**(0.01761)
Observations 13957Number of firms 2586R-squared 0.09
Standard errors in parentheses ∗ ∗ ∗p < 0.01, ∗ ∗ p < 0.05, ∗p < 0.1Dependent variable: total energy purchase per turnover at time t− 1.The reported coefficients are standardised. Variables are standardised by subtractingoff their means and dividing by their standard deviations, see Wooldridge (2006), page 195.The model includes year and 3 digit industry dummies and a constant, which are not reported.
11
4.1 Polluting industries
However, as argued on the source country regulation side by e.g. Ederington et al.
(2005) and Cole et al. (2010) a more differentiated approach is needed when attempting
to discern a pollution haven effect. The more polluting industries are found to be more
responsive than all other industries to regulatory pressure at home, resulting in significant
changes of their sourcing patterns from abroad. Similar dynamics might be true for
when deciding to start exporting to destinations known to have higher environmental
preferences. Besides, pollution abatements costs in the most polluting industries are
likely to yield larger improvements, compared to less polluting ones. The next step,
therefore, is to focus on industries classified as the most polluting ones as the effect of
export destination region is more likely to be found there.
To identify the most polluting sector, I follow a classification of Cole et al. (2005) that
lists the most polluting industries for the UK, based on various emissions, of Cole and
Elliott (2005) that has similar list for the USA. I also take a set of industries affected
by the EU ETS (the European Union Emissions Trading System) in the EU. Table 11
in Appendix A lists the details of what groups of industries were looked at as the most
polluting. There is a significant overlap of industries in all three groups with industries
of pulp and paper, coke, petrolium products, non-metallic products and basic metals
manufacturing being present in all 3 groups.
In the first two rows of table 2 are the results for export starters to Europe and the
ROW if they are producing in one of the heavily polluting industries over and above
the average export starter to one of the two destinations effects, as per specification in
3.3.12 These outcomes produce key results for this study. They show that, on average,
when controlling for the mean effect of exporting to either destination, those firms who
produce in one of the more polluting industries tend to significantly improve on their
energy intensity before starting to export to Europe but not when they start exporting
to ROW. The magnitudes differ due to differences in classification of the most polluting
industries either according to the list made for the USA, UK or the EU ETS respectively
but the overall pattern is the same. Firms in the most polluting sectors exporting to
ROW either do not exhibit any adjustments in energy use associated with export start or
actually increase their energy use before starting to export, depending on the industries
included.13 This finding, however, is not very robust to other specification tests.
12There are no majority export starters to the USA in the more polluting or energy-intensive industriesso the analysis is effectively carried out for export starters to either Europe or ROW.
13Results for ROW must be treated with care, since there are fewer export starters there than to theEU but we consider EU outcome to be the most interesting and noteworthy result.
12
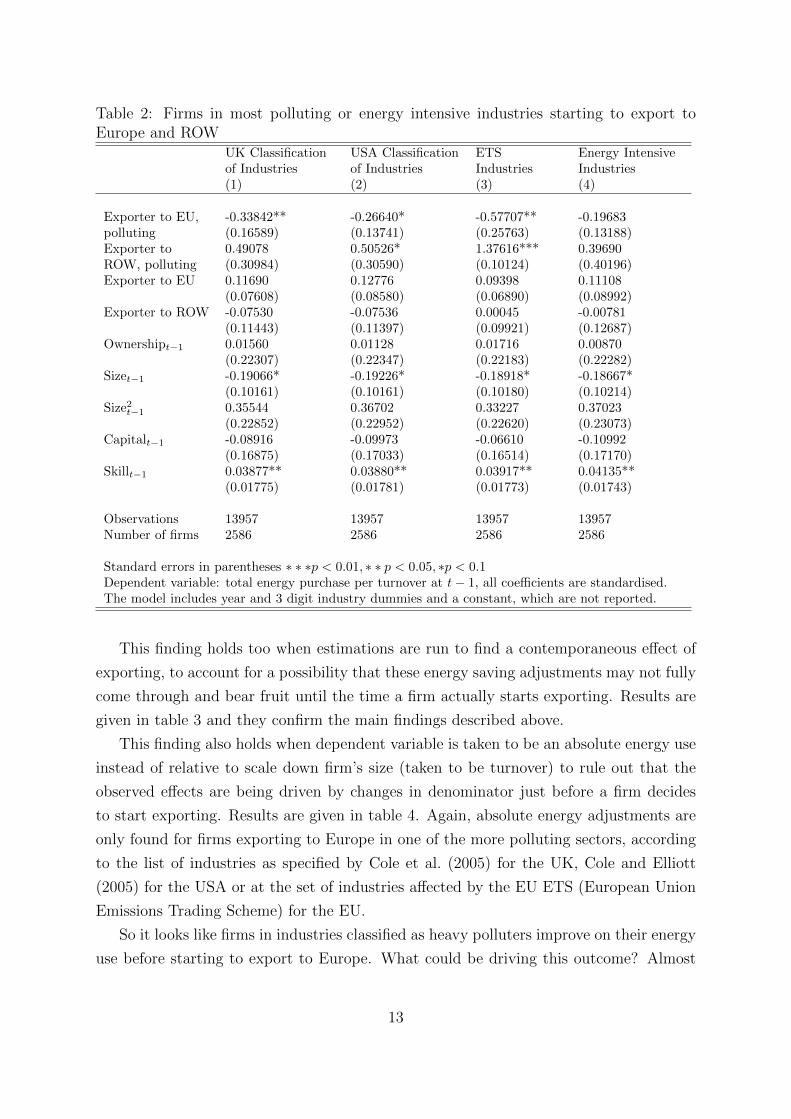
Table 2: Firms in most polluting or energy intensive industries starting to export toEurope and ROW
UK Classification USA Classification ETS Energy Intensiveof Industries of Industries Industries Industries(1) (2) (3) (4)
Exporter to EU, -0.33842** -0.26640* -0.57707** -0.19683polluting (0.16589) (0.13741) (0.25763) (0.13188)Exporter to 0.49078 0.50526* 1.37616*** 0.39690ROW, polluting (0.30984) (0.30590) (0.10124) (0.40196)Exporter to EU 0.11690 0.12776 0.09398 0.11108
(0.07608) (0.08580) (0.06890) (0.08992)Exporter to ROW -0.07530 -0.07536 0.00045 -0.00781
(0.11443) (0.11397) (0.09921) (0.12687)Ownershipt−1 0.01560 0.01128 0.01716 0.00870
(0.22307) (0.22347) (0.22183) (0.22282)Sizet−1 -0.19066* -0.19226* -0.18918* -0.18667*
(0.10161) (0.10161) (0.10180) (0.10214)Size2t−1 0.35544 0.36702 0.33227 0.37023
(0.22852) (0.22952) (0.22620) (0.23073)Capitalt−1 -0.08916 -0.09973 -0.06610 -0.10992
(0.16875) (0.17033) (0.16514) (0.17170)Skillt−1 0.03877** 0.03880** 0.03917** 0.04135**
(0.01775) (0.01781) (0.01773) (0.01743)
Observations 13957 13957 13957 13957Number of firms 2586 2586 2586 2586
Standard errors in parentheses ∗ ∗ ∗p < 0.01, ∗ ∗ p < 0.05, ∗p < 0.1Dependent variable: total energy purchase per turnover at t− 1, all coefficients are standardised.The model includes year and 3 digit industry dummies and a constant, which are not reported.
This finding holds too when estimations are run to find a contemporaneous effect of
exporting, to account for a possibility that these energy saving adjustments may not fully
come through and bear fruit until the time a firm actually starts exporting. Results are
given in table 3 and they confirm the main findings described above.
This finding also holds when dependent variable is taken to be an absolute energy use
instead of relative to scale down firm’s size (taken to be turnover) to rule out that the
observed effects are being driven by changes in denominator just before a firm decides
to start exporting. Results are given in table 4. Again, absolute energy adjustments are
only found for firms exporting to Europe in one of the more polluting sectors, according
to the list of industries as specified by Cole et al. (2005) for the UK, Cole and Elliott
(2005) for the USA or at the set of industries affected by the EU ETS (European Union
Emissions Trading Scheme) for the EU.
So it looks like firms in industries classified as heavy polluters improve on their energy
use before starting to export to Europe. What could be driving this outcome? Almost
13
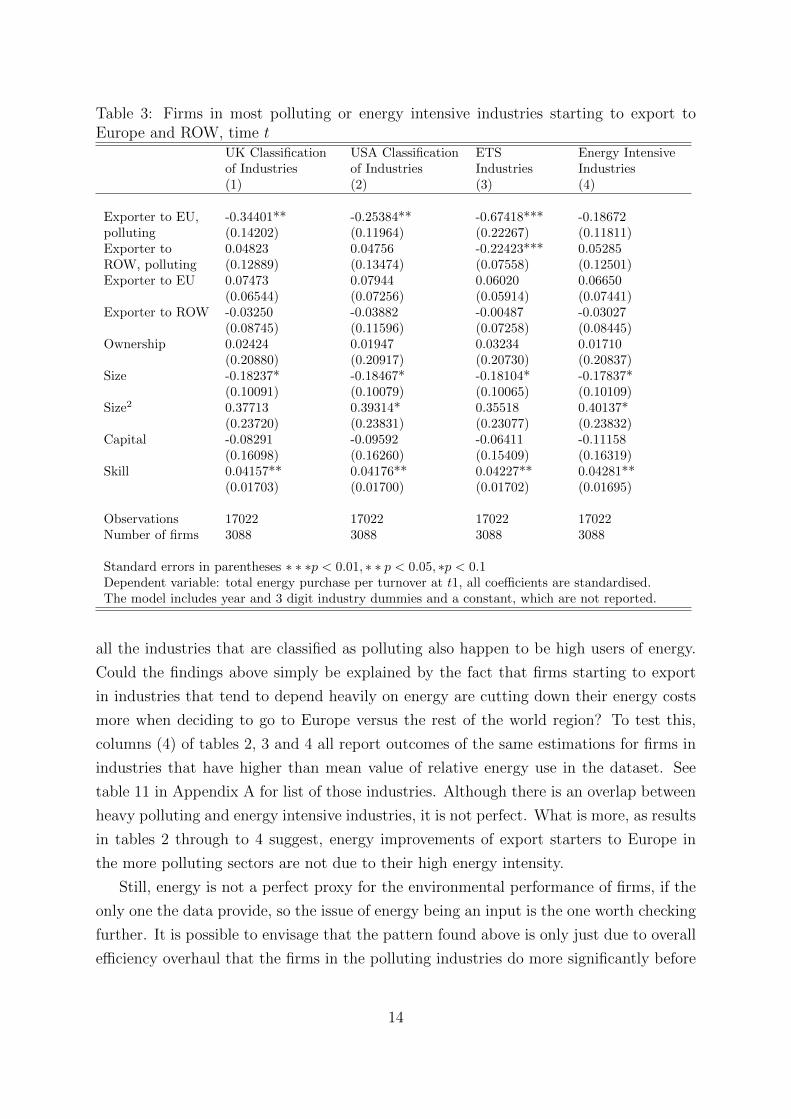
Table 3: Firms in most polluting or energy intensive industries starting to export toEurope and ROW, time t
UK Classification USA Classification ETS Energy Intensiveof Industries of Industries Industries Industries(1) (2) (3) (4)
Exporter to EU, -0.34401** -0.25384** -0.67418*** -0.18672polluting (0.14202) (0.11964) (0.22267) (0.11811)Exporter to 0.04823 0.04756 -0.22423*** 0.05285ROW, polluting (0.12889) (0.13474) (0.07558) (0.12501)Exporter to EU 0.07473 0.07944 0.06020 0.06650
(0.06544) (0.07256) (0.05914) (0.07441)Exporter to ROW -0.03250 -0.03882 -0.00487 -0.03027
(0.08745) (0.11596) (0.07258) (0.08445)Ownership 0.02424 0.01947 0.03234 0.01710
(0.20880) (0.20917) (0.20730) (0.20837)Size -0.18237* -0.18467* -0.18104* -0.17837*
(0.10091) (0.10079) (0.10065) (0.10109)Size2 0.37713 0.39314* 0.35518 0.40137*
(0.23720) (0.23831) (0.23077) (0.23832)Capital -0.08291 -0.09592 -0.06411 -0.11158
(0.16098) (0.16260) (0.15409) (0.16319)Skill 0.04157** 0.04176** 0.04227** 0.04281**
(0.01703) (0.01700) (0.01702) (0.01695)
Observations 17022 17022 17022 17022Number of firms 3088 3088 3088 3088
Standard errors in parentheses ∗ ∗ ∗p < 0.01, ∗ ∗ p < 0.05, ∗p < 0.1Dependent variable: total energy purchase per turnover at t1, all coefficients are standardised.The model includes year and 3 digit industry dummies and a constant, which are not reported.
all the industries that are classified as polluting also happen to be high users of energy.
Could the findings above simply be explained by the fact that firms starting to export
in industries that tend to depend heavily on energy are cutting down their energy costs
more when deciding to go to Europe versus the rest of the world region? To test this,
columns (4) of tables 2, 3 and 4 all report outcomes of the same estimations for firms in
industries that have higher than mean value of relative energy use in the dataset. See
table 11 in Appendix A for list of those industries. Although there is an overlap between
heavy polluting and energy intensive industries, it is not perfect. What is more, as results
in tables 2 through to 4 suggest, energy improvements of export starters to Europe in
the more polluting sectors are not due to their high energy intensity.
Still, energy is not a perfect proxy for the environmental performance of firms, if the
only one the data provide, so the issue of energy being an input is the one worth checking
further. It is possible to envisage that the pattern found above is only just due to overall
efficiency overhaul that the firms in the polluting industries do more significantly before
14
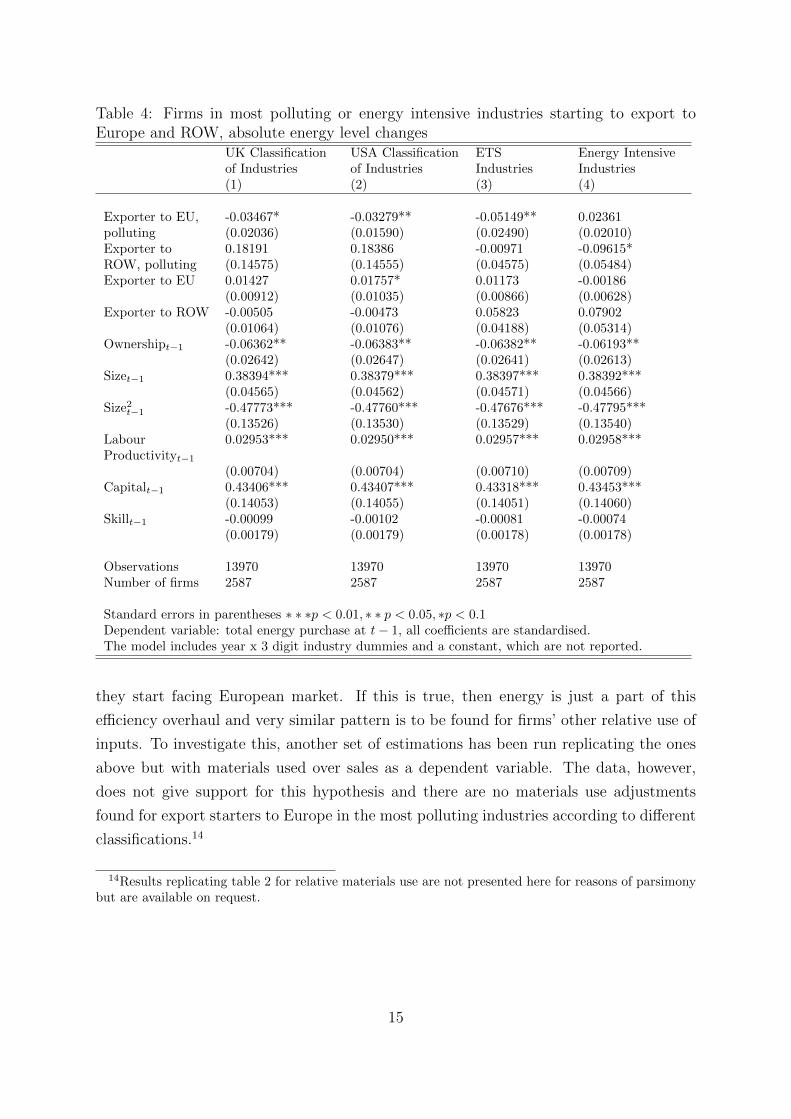
Table 4: Firms in most polluting or energy intensive industries starting to export toEurope and ROW, absolute energy level changes
UK Classification USA Classification ETS Energy Intensiveof Industries of Industries Industries Industries(1) (2) (3) (4)
Exporter to EU, -0.03467* -0.03279** -0.05149** 0.02361polluting (0.02036) (0.01590) (0.02490) (0.02010)Exporter to 0.18191 0.18386 -0.00971 -0.09615*ROW, polluting (0.14575) (0.14555) (0.04575) (0.05484)Exporter to EU 0.01427 0.01757* 0.01173 -0.00186
(0.00912) (0.01035) (0.00866) (0.00628)Exporter to ROW -0.00505 -0.00473 0.05823 0.07902
(0.01064) (0.01076) (0.04188) (0.05314)Ownershipt−1 -0.06362** -0.06383** -0.06382** -0.06193**
(0.02642) (0.02647) (0.02641) (0.02613)Sizet−1 0.38394*** 0.38379*** 0.38397*** 0.38392***
(0.04565) (0.04562) (0.04571) (0.04566)Size2t−1 -0.47773*** -0.47760*** -0.47676*** -0.47795***
(0.13526) (0.13530) (0.13529) (0.13540)LabourProductivityt−1
0.02953*** 0.02950*** 0.02957*** 0.02958***
(0.00704) (0.00704) (0.00710) (0.00709)Capitalt−1 0.43406*** 0.43407*** 0.43318*** 0.43453***
(0.14053) (0.14055) (0.14051) (0.14060)Skillt−1 -0.00099 -0.00102 -0.00081 -0.00074
(0.00179) (0.00179) (0.00178) (0.00178)
Observations 13970 13970 13970 13970Number of firms 2587 2587 2587 2587
Standard errors in parentheses ∗ ∗ ∗p < 0.01, ∗ ∗ p < 0.05, ∗p < 0.1Dependent variable: total energy purchase at t− 1, all coefficients are standardised.The model includes year x 3 digit industry dummies and a constant, which are not reported.
they start facing European market. If this is true, then energy is just a part of this
efficiency overhaul and very similar pattern is to be found for firms’ other relative use of
inputs. To investigate this, another set of estimations has been run replicating the ones
above but with materials used over sales as a dependent variable. The data, however,
does not give support for this hypothesis and there are no materials use adjustments
found for export starters to Europe in the most polluting industries according to different
classifications.14
14Results replicating table 2 for relative materials use are not presented here for reasons of parsimonybut are available on request.
15
4.2 Innovations
What other explanations could there be? Demand side considerations are likely to
drive this but are much harder to test. Europe and developed world on the whole are
better known for their environmental awareness, ’green’ preferences, higher environmental
standards and tougher regulations.
If firms perceive a certain expectation of their performance based on the relative
preferences of the region, this might help explain the observed findings. However, the
availability of data hampers testing this hypothesis.
What data do allow to test is the perceived effect of regulatory pressure. The subset
of Irish firms found in the main, Census of Industrial Production data has been asked
in the latest wave of the Community Innovation Survey (2006-2008) to report on various
aspects of their environmental innovations. Some of the questions referred to possible
reasons for introducing environmental innovations, such as current or future regulations,
governmental support, etc.
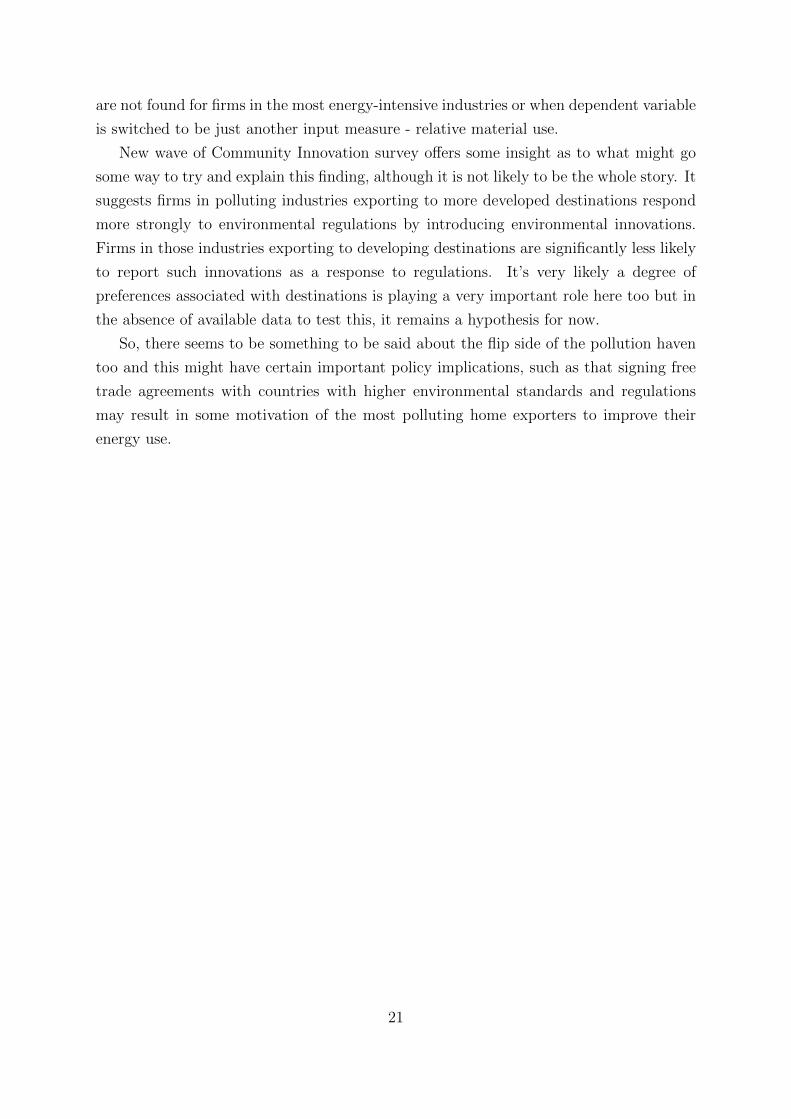
Table 5 shows the results of simple probit estimations to determine the propensity
to introduce an environmental innovation in response to existing environmental regula-
tions.15 The estimations compare exporters to OECD versus exporters to non-OECD
countries in general and exporters to both destinations in the most polluting industries.
To run the estimations a more detailed export destination dataset was used to circumvent
the issue of aggregated export destinations of the larger and longer panel which is used
for the main analysis, thus allowing to concentrate on pure developed versus developing
region comparison, here taken to be OECD versus non-OECD countries. What this table
shows is that, on average, exporters to OECD are more likely to report introducing an
environmental innovation in response to regulation. Exporters to non-OECD countries
do not exhibit the same propensity. However, when looking at firms in most polluting
sectors according to various classifications, it seems that exporting firms in the most
polluting sectors whose main focus is on non-OECD world are significantly less likely to
report an environmental innovation prompted by regulation. And firms in those indus-
tries with majority of their exporting shares going to the OECD are more likely than not
to do so. As a sector of chemicals is the one with a lot of re-export going on, removing
it proves to provide more robust results, same holds true for main estimation outcomes,
as mentioned in the next section. Similar pattern of outcomes is found when comparing
exporters to the EU and non-OECD, both all and in most polluting sectors.
Caveat has to be repeated here that due to a much shorter dataset starting in the
15Probit with demeaning to account for firm effects produces very similar results, expected environ-mental regulations to be introduced in the future have a similar effect too. All those estimation outcomesare not shown here but available on request.
16
late 2000s, it is not possible to run these estimation on export starters so these results
are comparing all exporters and non-exporters so care should be taken when interpreting
these. At best, these estimations suggest that a regulatory pull is stronger when export
is orientated towards a more developed world with stronger environmental standards and
regulations persisting there. But this does not go to say that this is the only factor to
play a role or to explain why we observe this in Ireland.
In addition, using the same data the analogous propensity estimations also show some,
albeit, weaker evidence that firms in more polluting industries exporting to the developed
world destinations report it more likely to have introduced innovations reducing their
energy use per output which is a dependent variable in the main estimations of this
study thus going some way towards confirming the findings described above.16
Before moving on to extensive testing of the robustness of the key findings, let’s go
over them again. The empirical evidence shows that firms starting to export to Europe
significantly improve their energy using behaviour and, to a certain extent, environmen-
tal innovations, but only if those firms produce in one of the more polluting industries.
Starting to export to ROW does not compel firms to improve on their energy use. Regu-
latory pressure might play some role in explaining these observed differences but is quite
unlikely to be the whole story.
5 Robustness Checks
An extensive array of robustness checks was performed on the key findings pertaining
to energy improvements found for firms exporting to the EU in the more polluting sectors
as compared to firms exporting to ROW and non-exporters. Robustness checks are
described in detail below. All the estimation tables for these checks are available on
request.
More detailed export destinations
The main concern of using export destination of the rest of the world is the high de-
gree of aggregation of that region. It might include both developed, OECD countries and
developing, non-OECD ones. That would introduce some confusion into the estimation
outcomes as firms are likely to have different motivation for these two groups of destina-
tions as the results have shown in the previous section. To try and circumvent this data
issue, a use is made of an additional dataset which details firms’ trade transactions in
the period of 2000-2008. The exact export destinations are known for this shorter panel
16Results not given to save space but available on request.
17
set. The export starters are then divided into majority OECD and non-OECD exporters
based on the declared value of exported goods to both destinations. The cut-off used is
again 60% of the total exports of a firm going to one of the export destination regions.
And although there are much fewer export starters in these data due to shorter panel and
decreasing rates of export start in the early and especially late 2000s, the outcomes with
these more detailed data confirm the main results. When the estimations as shown in ta-
ble 2, section 4 are repeated for export starters to OECD and non-OECD, the results show
energy improvements one period before for firms in polluting sectors starting to export
to OECD the next period and not for non-OECD, consistent with main estimations.
Do non-exporters drive the results?
It might plausibly be the case that firms who are less efficient about their energy
select into staying non-exporters. The energy efficiency improvements observed for export
starters to the EU in the most polluting sectors could then be simply driven by the fact
that non-exporters they are compared to are extremely energy inefficient. To check that
the results are not driven by this, the same fixed effects estimations as in table 2 was run
for just a sample of export starters to both destinations as compared to each other and not
to non-exporters. The downward energy adjustment (energy improvement) observed for
the export starters to EU in polluting sectors is still present and statistically significant.
The results also hold when reducing the sample to the more polluting industries to only
compare the more polluting exporters and non-exporters.
Do firms that have always been more energy efficient select into EU export?
Another serious issue to consider is interpretation of the energy improvement of export
starters to the EU one year before exporting, which, although continuing consistently
onto the next year or two of export start, might be a sign of more energy-efficient firms
selecting into exporting to Europe. To see whether it’s the firms that have always been
more energy efficient that self-select into exporting to the EU and not ROW, specification
as in equation 3.3 was run for deeper lags of t− 2 and t− 3. Results show no significant
difference in energy use there. So, there is no significant energy improvement observed
before one year prior to export start for firms exporting to the EU in the more polluting
sectors. To further test this, probit estimations were run to estimate whether more
energy-efficient firms have a higher propensity to start exporting to Europe the next
year. This is, however, not supported by the data either.
Export-platform FDI
Ireland has been known for attracting export-platform FDI. The results presented in
Section 4, however, are not driven by this. In fact, very few foreign owned firms actually
are export starters in the sample. Most of them are continuous exporters. This means
that for the most part the analysis is conducted on domestically owned firms starting to
18
export.
Outliers
To make sure results are not driven by outliers, the main estimations are repeated
with the top and bottom 1% of observations removed from the data. This does not change
any of the findings.
EU expansion
Since the period covered in the analysis includes the EU expansion time in 2004,
estimations were re-run on the separate period of pre- and post-expansion. Results hold
strongly for before 2004 as most export starters come from that time period.
UK as a separate region
UK plays an important role as a major destination of Irish exports. To see whether
this destination alone is responsible for all the observed outcomes, the firms were divided
into majority exporters to the UK, the EU and ROW. Results show that it is a weight of
combined UK and EU shares that matter and not one of these destinations separately.
Export shares
Majority exporters to either destinations are defined based on the share of firm’s
exports going either to a developed region of the world or a less developed one. This
does not say anything about how much of a firm’s total turnover the total export share
represents. In other words, how important is the export market for a firm’s operation.
To see that the main results are not driven by firms whose main source of revenue comes
from domestic operations, base estimations are re-run only for exporters whose export
share is at least half of their turnover. Same energy improvements for export starters to
Europe in the more polluting sectors are confirmed.
Results also hold for a number of other checks.17 Accounting for firms’ labour produc-
tivity, which was not included due to possible problem of turnover variable already being
present on the left hand side, does not affect any main findings. Neither does including
firm’s importing status. Results hold when reducing the sample to post 1994 to account
for CSO data collection issues and when controlling for destination or industry specific
year effects. Results also hold if export share of one region is 2/3 or over 90% of the total.
Learning from exporting?
The effect of export destination on energy using behaviour of firms found in the paper
could be seen as firms in the more polluting industries preparing and anticipating certain
aspects of the markets they face and acting accordingly beforehand. But what about
17General remark is in order, that the results are the most robust to a battery of various checks whenchemicals sector is removed from a list of the most polluting industries. This sector is known for a highshare of re-export in Ireland and results tend to be more robust without it.
19
learning from exporting? Is the observed effect limited to the export start or does it
continue with exporting as firms learn more from their experience? The data suggests
that the energy improving effect found for more polluting export starters to Europe
continues at a time t + 1, it still has the same sign at t + 2 but the significance falls
below being statistically different from zero. Which to a certain degree intertwines with
a finding that between differences of continuous exporters in the most polluting sectors
to either Europe or the rest of the world are not statistically discernible when it comes
to relative energy use.
6 Conclusions
This study sets out to look at the reverse side of the pollution haven effect, more
specifically should there be differences in how firms adjust their environmental perfor-
mance when they start exporting to a developed and hence more environmentally strict
versus less developed, or developing region. This is an empirical analysis done by employ-
ing various Irish manufacturing firm level datasets. The main one - Census of Industrial
Production covers almost an entire universe of Irish manufacturing firms with employ-
ment over 3 people for the period of 1991-2008 and allows to distinguish between broadly
defined export destinations of Europe (and the USA) and the rest of the world (ROW).
Auxiliary datasets to help check the findings and to offer some insights to the outcomes are
international trade data detailing information on export destinations for a shorter panel
of 2000-2008 and even smaller and shorter yet Community Innovation Survey dataset
from 2006-2008 on firms’ environmental innovations.
The main finding of the study is that firms in polluting industries, as defined by several
papers by Cole et al. (2005), Cole and Elliott (2005) and in industries affected by the EU
ETS (European Union Emissions Trading System), when starting to export to Europe
(a more developed destination) tend to significantly improve their energy use (measured
both as a relative use scaled down by turnover and an absolute value of energy used),
e.g. reduce it before the export starts and then keep it reduced for about two years into
exporting when compared to non-exporters or exporters to less developed destinations.
This is not the case when looking at export starters in polluting industries sending their
export off to less developed region of the rest of the world, outcome shown to be similar
for the more strictly specified developing, non-OECD region.
The energy-improving outcome of export starters to developed destinations in pollut-
ing industries is not driven by the fact that energy use is just a proxy for environmental
performance and is an input to firms’ production. Same energy efficiency improvements
20
are not found for firms in the most energy-intensive industries or when dependent variable
is switched to be just another input measure - relative material use.
New wave of Community Innovation survey offers some insight as to what might go
some way to try and explain this finding, although it is not likely to be the whole story. It
suggests firms in polluting industries exporting to more developed destinations respond
more strongly to environmental regulations by introducing environmental innovations.
Firms in those industries exporting to developing destinations are significantly less likely
to report such innovations as a response to regulations. It’s very likely a degree of
preferences associated with destinations is playing a very important role here too but in
the absence of available data to test this, it remains a hypothesis for now.
So, there seems to be something to be said about the flip side of the pollution haven
too and this might have certain important policy implications, such as that signing free
trade agreements with countries with higher environmental standards and regulations
may result in some motivation of the most polluting home exporters to improve their
energy use.
21
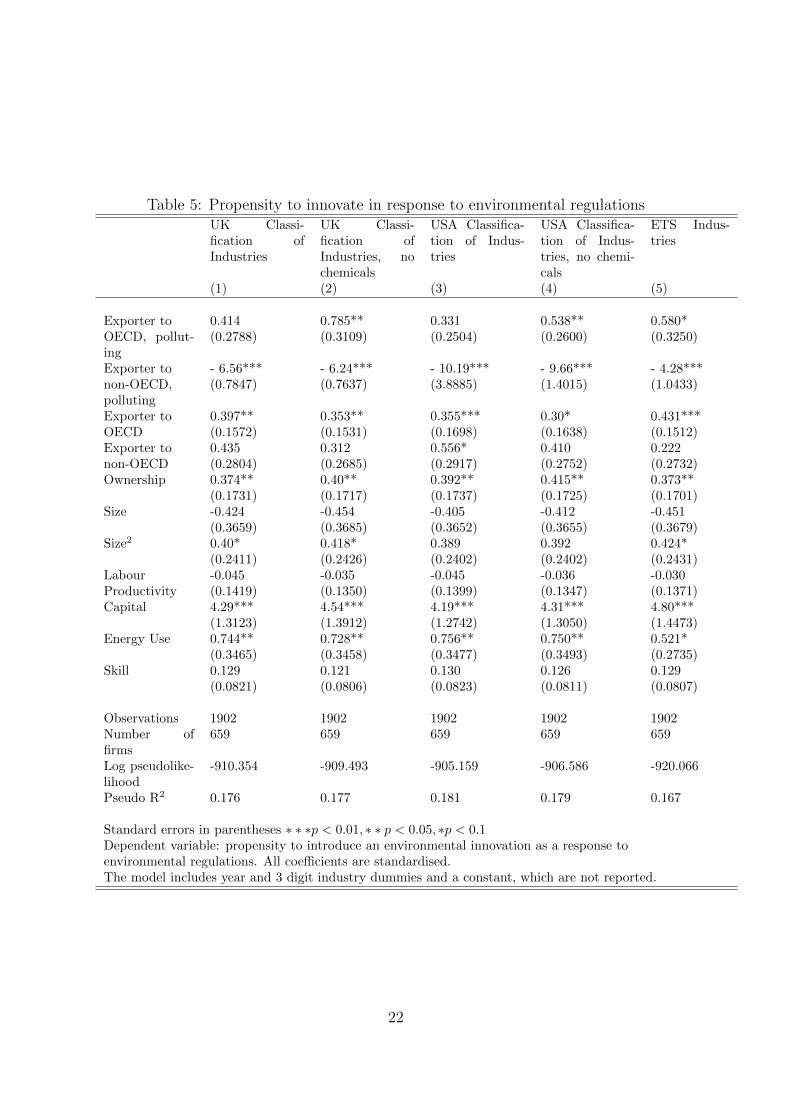
Table 5: Propensity to innovate in response to environmental regulationsUK Classi-fication ofIndustries
UK Classi-fication ofIndustries, nochemicals
USA Classifica-tion of Indus-tries
USA Classifica-tion of Indus-tries, no chemi-cals
ETS Indus-tries
(1) (2) (3) (4) (5)
Exporter to 0.414 0.785** 0.331 0.538** 0.580*OECD, pollut-ing
(0.2788) (0.3109) (0.2504) (0.2600) (0.3250)
Exporter to - 6.56*** - 6.24*** - 10.19*** - 9.66*** - 4.28***non-OECD,polluting
(0.7847) (0.7637) (3.8885) (1.4015) (1.0433)
Exporter to 0.397** 0.353** 0.355*** 0.30* 0.431***OECD (0.1572) (0.1531) (0.1698) (0.1638) (0.1512)Exporter to 0.435 0.312 0.556* 0.410 0.222non-OECD (0.2804) (0.2685) (0.2917) (0.2752) (0.2732)Ownership 0.374** 0.40** 0.392** 0.415** 0.373**
(0.1731) (0.1717) (0.1737) (0.1725) (0.1701)Size -0.424 -0.454 -0.405 -0.412 -0.451
(0.3659) (0.3685) (0.3652) (0.3655) (0.3679)Size2 0.40* 0.418* 0.389 0.392 0.424*
(0.2411) (0.2426) (0.2402) (0.2402) (0.2431)Labour -0.045 -0.035 -0.045 -0.036 -0.030Productivity (0.1419) (0.1350) (0.1399) (0.1347) (0.1371)Capital 4.29*** 4.54*** 4.19*** 4.31*** 4.80***
(1.3123) (1.3912) (1.2742) (1.3050) (1.4473)Energy Use 0.744** 0.728** 0.756** 0.750** 0.521*
(0.3465) (0.3458) (0.3477) (0.3493) (0.2735)Skill 0.129 0.121 0.130 0.126 0.129
(0.0821) (0.0806) (0.0823) (0.0811) (0.0807)
Observations 1902 1902 1902 1902 1902Number offirms
659 659 659 659 659
Log pseudolike-lihood
-910.354 -909.493 -905.159 -906.586 -920.066
Pseudo R2 0.176 0.177 0.181 0.179 0.167
Standard errors in parentheses ∗ ∗ ∗p < 0.01, ∗ ∗ p < 0.05, ∗p < 0.1Dependent variable: propensity to introduce an environmental innovation as a response toenvironmental regulations. All coefficients are standardised.The model includes year and 3 digit industry dummies and a constant, which are not reported.
22
A Appendix
Table 6: List of NACE 2 digit industries in the Census of Industrial Production (CIP)
NACE Code Description
15 Manufacture of food products and beverages16 Manufacture of tobacco products17 Manufacture of textiles18 Manufacture of wearing apparel; dressing and dyeing of fur19 Tanning and dressing of leather; manufacture of luggage, handbags, saddlery, harness
and footwear20 Manufacture of wood and of products of wood and cork, except furniture; manufacture
of articles of straw and plaiting materials21 Manufacture of pulp, paper and paper products22 Publishing, printing and reproduction of recorded media23 Manufacture of coke, refined petroleum products and nuclear fuel24 Manufacture of chemicals and chemical products25 Manufacture of rubber and plastic products26 Manufacture of other non-metallic mineral products27 Manufacture of basic metals28 Manufacture of fabricated metal products, except machinery and equipment29 Manufacture of machinery and equipment n.e.c.30 Manufacture of office machinery and computers31 Manufacture of electrical machinery and apparatus n.e.c.32 Manufacture of radio, television and communication equipment and apparatus33 Manufacture of medical, precision and optical instruments, watches and clocks34 Manufacture of motor vehicles, trailers and semi-trailers35 Manufacture of other transport equipment36 Manufacture of furniture; manufacturing n.e.c.
NACE classification followed in this study is NACE Rev 1.1.
Datawork
Some essential data cleaning was performed prior to commencing the analysis. All of
the changes are described below.
Negative or missing values of fuel and export share in few instances where possible
were replaced using values from previous and later years, the rest - set to missing.
For instances of export shares bigger than 100 their values were replaced using values
from previous and later years. Export share values that could not have been replaced
were treated as follows. Firms which did not have export share equal to 100 in any other
years were dropped from the sample. If a firm had at least one occurrence of export share
equal to 100 in other years the value of export share larger than 100 was set to 100.
The top .25 percentile of relative energy use observations is removed to control for
extreme outliers.
23
Table 7: Definition of variablesVariable Description
Relative energy use Total fuel and power purchase (energy) as declared by firms in the CIP,scaled down by turnover.
Exporter Dummy variable equal to 1 if a firm exports in any given year and 0otherwise.
Ownership Dummy variable equal to 1 if a firms is foreign-owned and 0 if it is adomestic firm.
Labour Total turnover divided by the number of employees.ProductivityCapital Firm’s capital additions built over the whole period minus sales of capi-
tals assets, assuming 10% yearly depreciation rate overall.Skill % of managerial/technical and clerical personnel in total employment.R&D Research and development services supplied to the enterprise.Size Total earnings.
Table 8: Summary statistics, all CIP manufacturing firmsVariable Mean Std. Dev. Min Max
Total energy use 220.04 1569.74 0 121904.20Energy per turnover 0.0299 0.041 0 2.834Export share 25.68 36.42 0 100Total Turnover 16966.48 188678.73 0 11416253Total Earnings 1268.87 4831.02 0 232037.38Total Employed 50.30 144.35 0 4554Labour Productivity 140.90 350.04 0 14471.48% High-Skilled 25.04 18.82 0 100Capital 2571.40 36515.90 -84260.71 3897787R&D 355.99 11396.25 0 1248941.38
Reported are mean values over the period of 1991-2008. All monetary values are in EUR thousands.
Table 9: Summary statistics for the estimation sampleVariable Mean Std. Dev. Min Max N
Total energy use 115.13 444.65 0 13153.29 17457Energy per turnover 0.0309 0.04 0 1.195 17406Export share 5.22 18.48 0 100 17460Total Turnover 6492.11 52983.19 0 2552493.8 17423Total Earnings 680.25 2173.87 0 70349.49 17400Total Employed 28.87 65.41 0 1557 17424Labour Productivity 120.82 318.27 0 14024.69 17401% High-Skilled 22.67 18.24 0 100 17422Capital 1139.52 9996.94 -82822.1 468184.4 17125R&D 170.74 6292.54 0 349248.9 17460Ownership 0.0388 0.1931 0 1 17460
Reported are mean values over the period of 1991-2008. All monetary values are in EUR thousands.
24
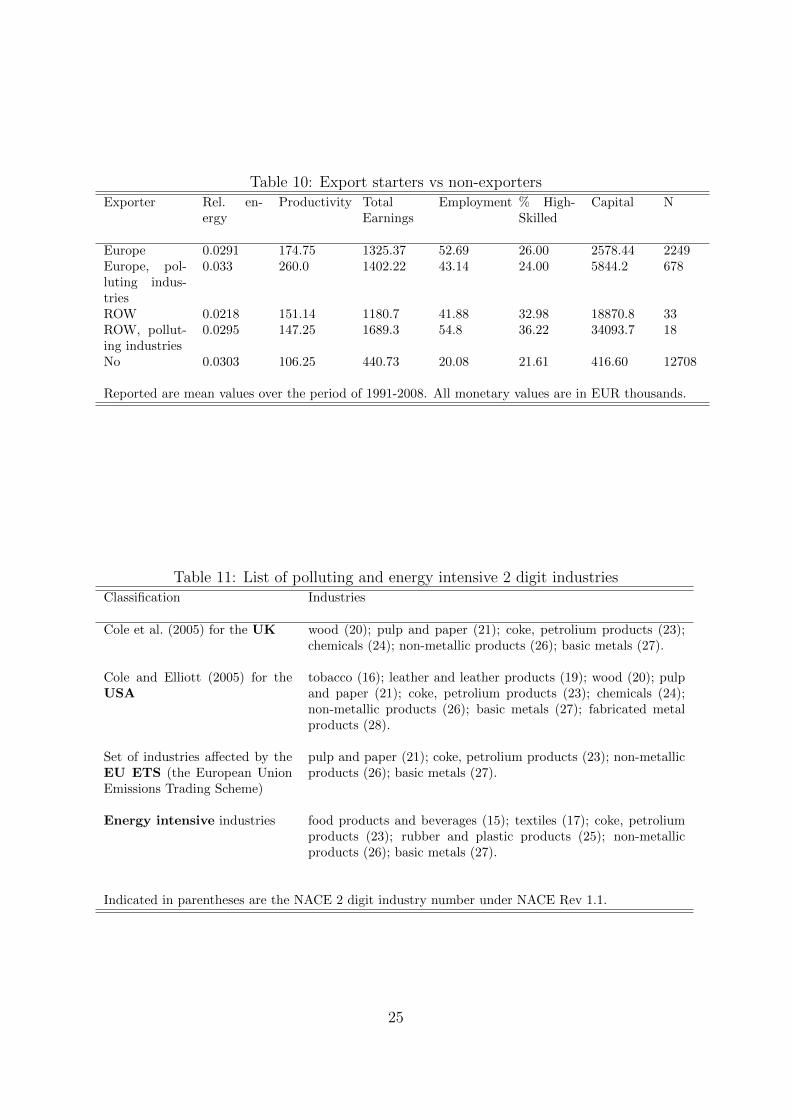
Table 10: Export starters vs non-exportersExporter Rel. en-
ergyProductivity Total
EarningsEmployment % High-
SkilledCapital N
Europe 0.0291 174.75 1325.37 52.69 26.00 2578.44 2249Europe, pol-luting indus-tries
0.033 260.0 1402.22 43.14 24.00 5844.2 678
ROW 0.0218 151.14 1180.7 41.88 32.98 18870.8 33ROW, pollut-ing industries
0.0295 147.25 1689.3 54.8 36.22 34093.7 18
No 0.0303 106.25 440.73 20.08 21.61 416.60 12708
Reported are mean values over the period of 1991-2008. All monetary values are in EUR thousands.
Table 11: List of polluting and energy intensive 2 digit industriesClassification Industries
Cole et al. (2005) for the UK wood (20); pulp and paper (21); coke, petrolium products (23);chemicals (24); non-metallic products (26); basic metals (27).
Cole and Elliott (2005) for theUSA
tobacco (16); leather and leather products (19); wood (20); pulpand paper (21); coke, petrolium products (23); chemicals (24);non-metallic products (26); basic metals (27); fabricated metalproducts (28).
Set of industries affected by theEU ETS (the European UnionEmissions Trading Scheme)
pulp and paper (21); coke, petrolium products (23); non-metallicproducts (26); basic metals (27).
Energy intensive industries food products and beverages (15); textiles (17); coke, petroliumproducts (23); rubber and plastic products (25); non-metallicproducts (26); basic metals (27).
Indicated in parentheses are the NACE 2 digit industry number under NACE Rev 1.1.
25
References
Albornoz, Facundo, Matthew A. Cole, Robert J. R. Elliott, and Marco G.
Ercolani, “In Search of Environmental Spillovers,” The World Economy, 2009, 32 (1),
136–163.
Antweiler, Werner, Brian R. Copeland, and M. Scott Taylor, “Is Free Trade
Good for the Environment?,” The American Economic Review, 2001, 91 (4), 877–908.
Cole, Matthew A. and Robert J.R. Elliott, “Do Environmental Regulations Influ-
ence Trade Patterns? Testing Old and New Trade Theories,” The World Economy,
2003, 26 (8), 1163–1186.
and , “FDI and the Capital Intensity of Dirty Sectors: A Missing Piece of the
Pollution Haven Puzzle,” Review of Development Economics, 2005, 9 (4), 530–548.
, , and Eric Strobl, “The environmental performance of firms: The role of foreign
ownership, training, and experience,” Ecological Economics, 2008, 65 (3), 538–546.
, , and Kenichi Shimamoto, “Industrial characteristics, environmental regulations
and air pollution: an analysis of the UK manufacturing sector,” Journal of Environ-
mental Economics and Management, 2005, 50 (1), 121–143.
, , and , “Globalization, firm-level characteristics and environmental management:
A study of Japan,” Ecological Economics, 2006, 59 (3), 312–323.
, , and Toshihiro Okubo, “Trade, environmental regulations and industrial mobil-
ity: An industry-level study of Japan,” Ecological Economics, 2010, 69 (10), 1995–2002.
Copeland, Brian R. and M. Scott Taylor, “North-South Trade and the Environ-
ment,” The Quarterly Journal of Economics, 1994, 109 (3), 755–787.
and , “Trade and Transboundary Pollution,” The American Economic Review,
1995, 85 (4), 716–737.
and , “A Simple Model of Trade, Capital Mobility, and the Environment,” 1997.
NBER Working Paper No. 5898.
and , “Trade, Growth, and the Environment,” Journal of Economic Literature,
2004, 42 (1), 7–71.
Dean, Judith M. and Mary E. Lovely, “Trade Growth, Production Fragmenta-
tion, and China’s Environment,” in Robert Feenstra and Shang-Jin Wei, eds., China’s
26
Growing Role in World Trade, The University of Chicago Press, 2010, chapter 11,
pp. 429–474.
Ederington, Josh, Arik Levinson, and Jenny Minier, “Trade Liberalization and
Pollution Havens,” Advances in Economic Analysis & Policy, 2004, 4 (2), Article 6.
, , and , “Footloose and Pollution-Free,” The Review of Economics and Statistics,
2005, 87 (1), 92–99.
Eskeland, Gunnar S. and Ann E. Harrison, “Moving to greener pastures? Multina-
tionals and the pollution haven hypothesis,” Journal of Development Economics, 2003,
70 (1), 1–23.
Javorcik, Beata Smarzynska and Shang-Jin Wei, “Pollution havens and foreign
direct investment: dirty secret or popular myth?,” Contributions to Economic Analysis
& Policy, 2004, 3 (2), Article 8.
Keller, Wolfgang and Arik Levinson, “Pollution Abatement Costs and Foreign Di-
rect Investment Inflows to U.S. States,” Review of Economics and Statistics, 2002, 84
(4), 691–703.
Levinson, Arik, “Technology, International Trade, and Pollution from US Manufactur-
ing,” American Economic Review, 2009, 99 (5), 2177–2192.
and M. Scott Taylor, “Unmasking the Pollution Haven Effect,” International Eco-
nomic Review, 2008, 49 (1), 223–254.
List, John A., Daniel L. Millimet, Per G. Fredriksson, and W. Warren
McHone, “Effects of Environmental Regulations on Manufacturing Plant Births: Ev-
idence from a Propensity Score Matching Estimator,” Review of Economics and Statis-
tics, 2003, 85 (4), 944–952.
Markusen, James R., Edward R. Morey, and Nancy Olewiler, “Competition
in regional environmental policies when plant locations are endogenous,” Journal of
Public Economics, 1995, 56 (1), 55–77.
McGuire, Martin C., “Regulation, factor rewards, and international trade,” Journal
of Public Economics, 1982, 17 (3), 335–354.
Pethig, Rudiger, “Pollution, welfare, and environmental policy in the theory of Com-
parative Advantage,” Journal of Environmental Economics and Management, 1976, 2
(3), 160–169.
27

Wheeler, David, “Racing to the Bottom? Foreign Investment and Air Quality in
Developing Countries,” 2001. World Bank Policy Research Working Paper No. 2524.
Wooldridge, Jeffrey M., Econometric Analysis of Cross Section and Panel Data, MIT
Press, 2002.
, Introductory Econometrics: A Modern Approach, Thomson South-Western, 2006.
28