Embed Size (px)
Citation preview
0
1H08 Consolidated Results
Flavio Cattaneo – Chief Executive Officer
Fabio Todeschini – Chief Financial Officer
July 30th, 2008

1
Highlights
1H08 Results
Closing Remarks
Annexes
Agenda
2
Highlights1H08 at a Glance
• Good operational performance, despite first year of regulatory period and weak
electricity demand
• Capex well underway: confirmed execution capabilities
• Brazil: ETEO acquisition successfully completed
• Regulatory: AEEG published the Technical Note
3
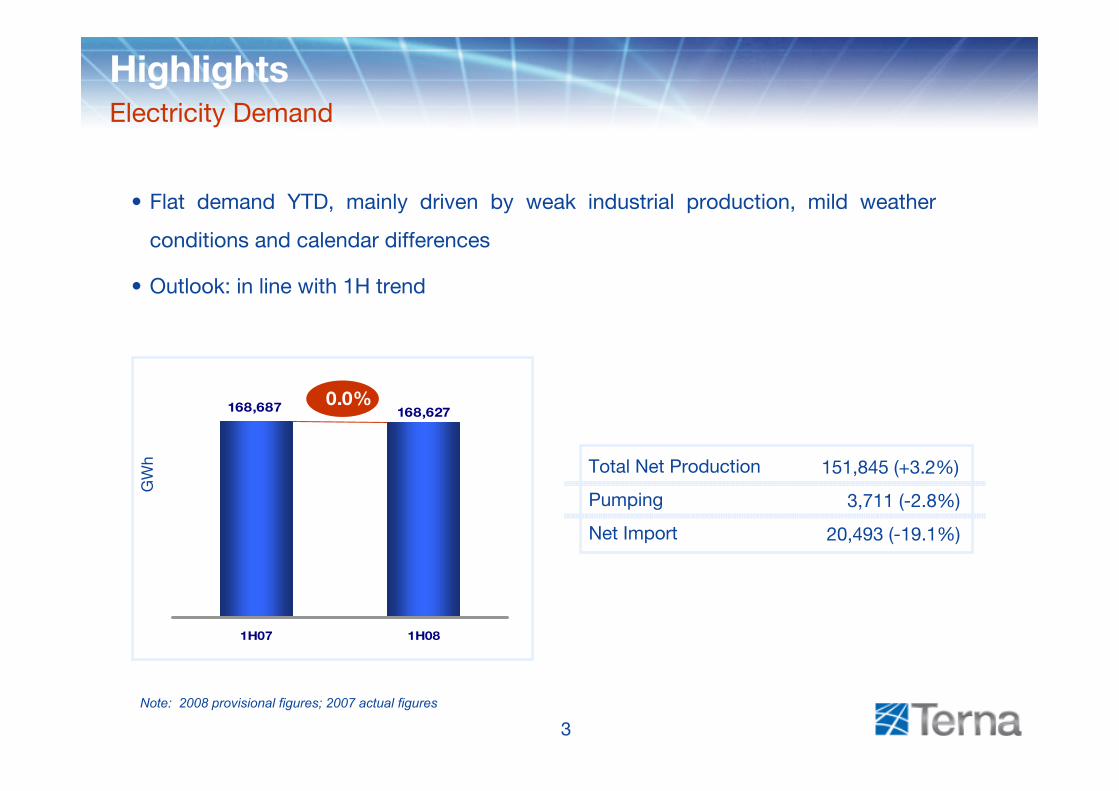
Note: 2008 provisional figures; 2007 actual figures
GW
h
HighlightsElectricity Demand
Total Net Production
Pumping
Net Import
151,845 (+3.2%)
3,711 (-2.8%)
20,493 (-19.1%)
168,627168,687
1H07 1H08
0.0%
• Flat demand YTD, mainly driven by weak industrial production, mild weather
conditions and calendar differences
• Outlook: in line with 1H trend
4
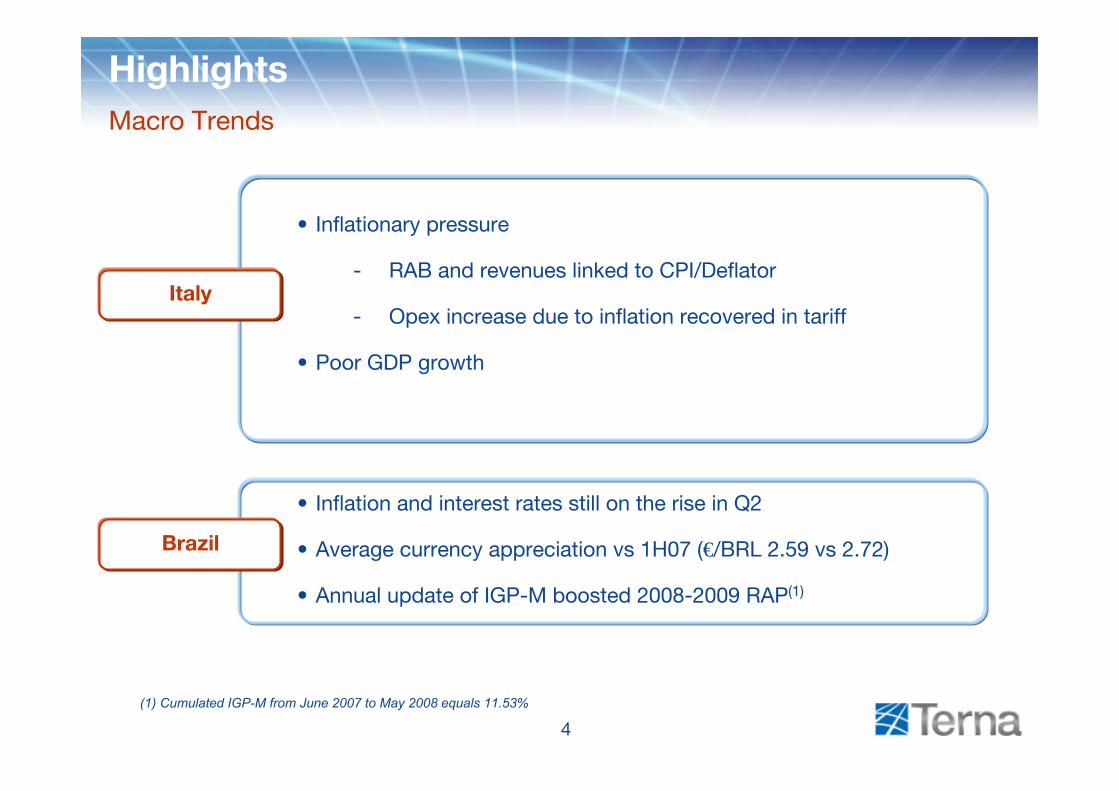
HighlightsMacro Trends
• Inflationary pressure
- RAB and revenues linked to CPI/Deflator
- Opex increase due to inflation recovered in tariff
• Poor GDP growth
Italy
• Inflation and interest rates still on the rise in Q2
• Average currency appreciation vs 1H07 (€/BRL 2.59 vs 2.72)
• Annual update of IGP-M boosted 2008-2009 RAP(1)
Brazil
(1) Cumulated IGP-M from June 2007 to May 2008 equals 11.53%
5
In mn Euro
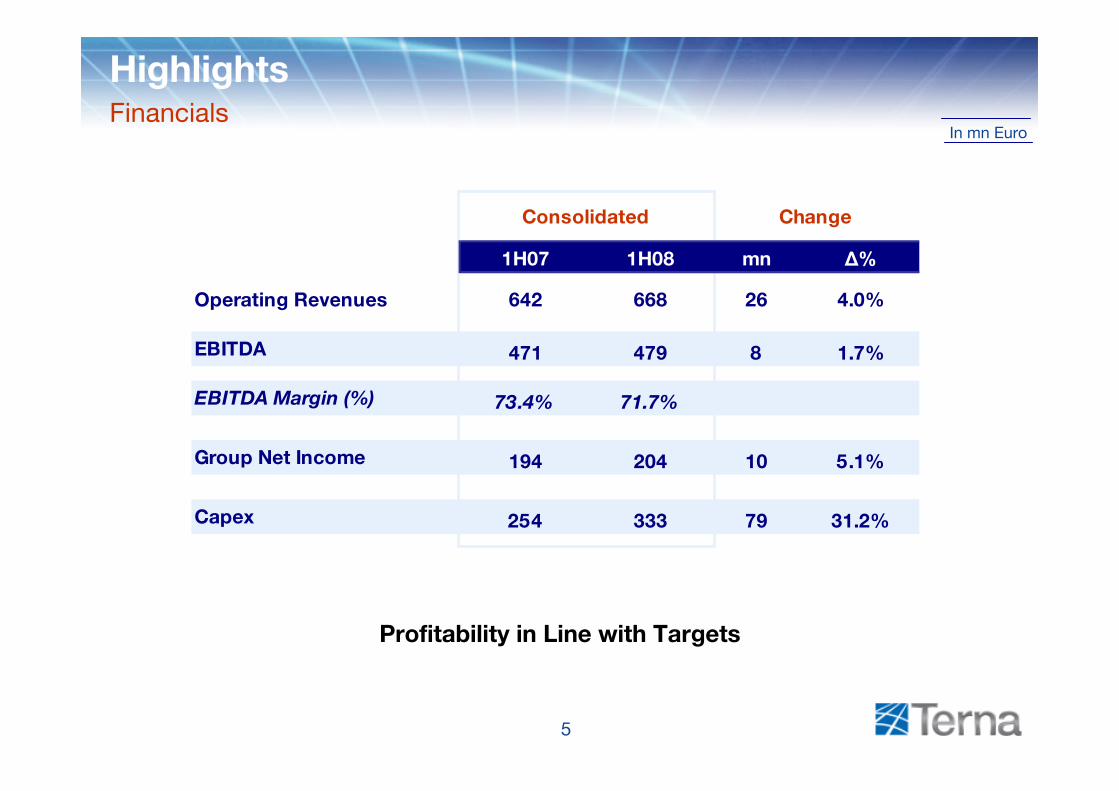
HighlightsFinancials
1H07 1H08 mn Δ%
Operating Revenues 642 668 26 4.0%
EBITDA 471 479 8 1.7%
EBITDA Margin (%) 73.4% 71.7%
Group Net Income 194 204 10 5.1%
Capex 254 333 79 31.2%
Consolidated Change
Profitability in Line with Targets
6
Highlights
1H08 Results
Closing Remarks
Annexes
Agenda
7
+5 668
+9
+7 +4 663
642
In mn Euro
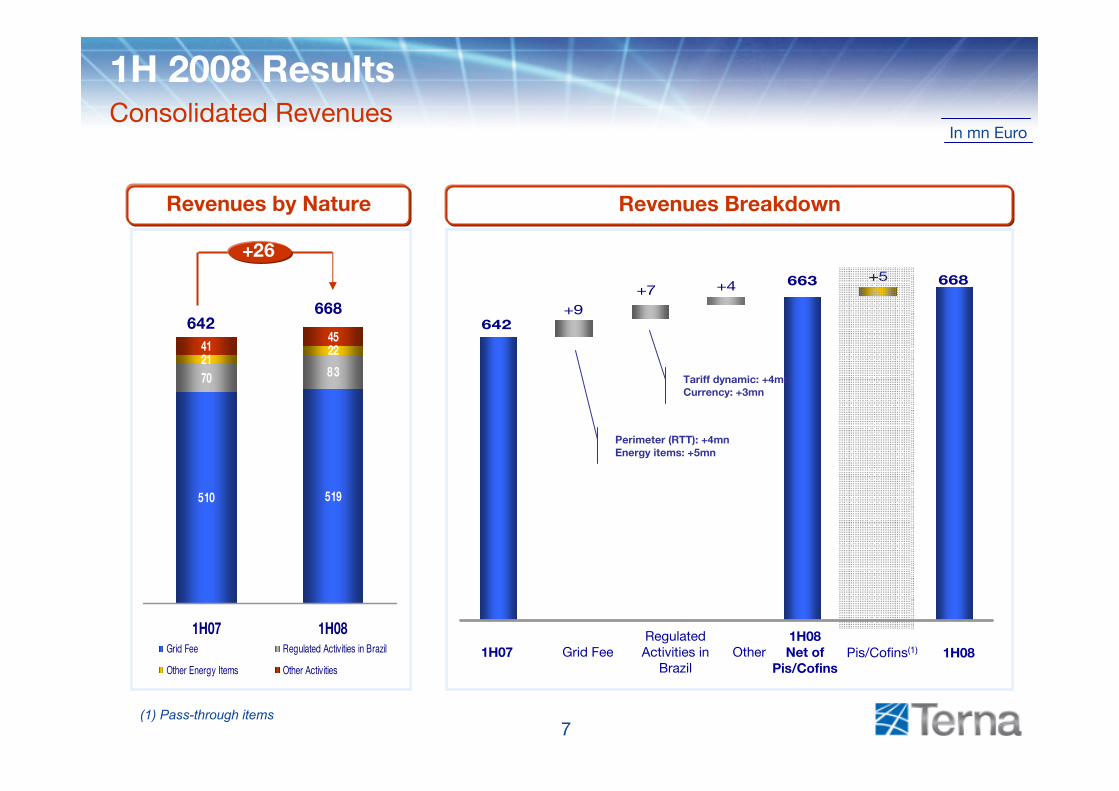
1H 2008 ResultsConsolidated Revenues
510 519
21224145
8 370
1H07 1H08Grid Fee Regulated Activities in Brazil
Other Energy Items Other Activities
Grid Fee Other1H08Net of
Pis/Cofins1H07
642668
+26
Regulated Activities in
Brazil
Revenues by Nature Revenues Breakdown
Perimeter (RTT): +4mnEnergy items: +5mn
Tariff dynamic: +4mnCurrency: +3mn
1H08Pis/Cofins(1)
(1) Pass-through items
8
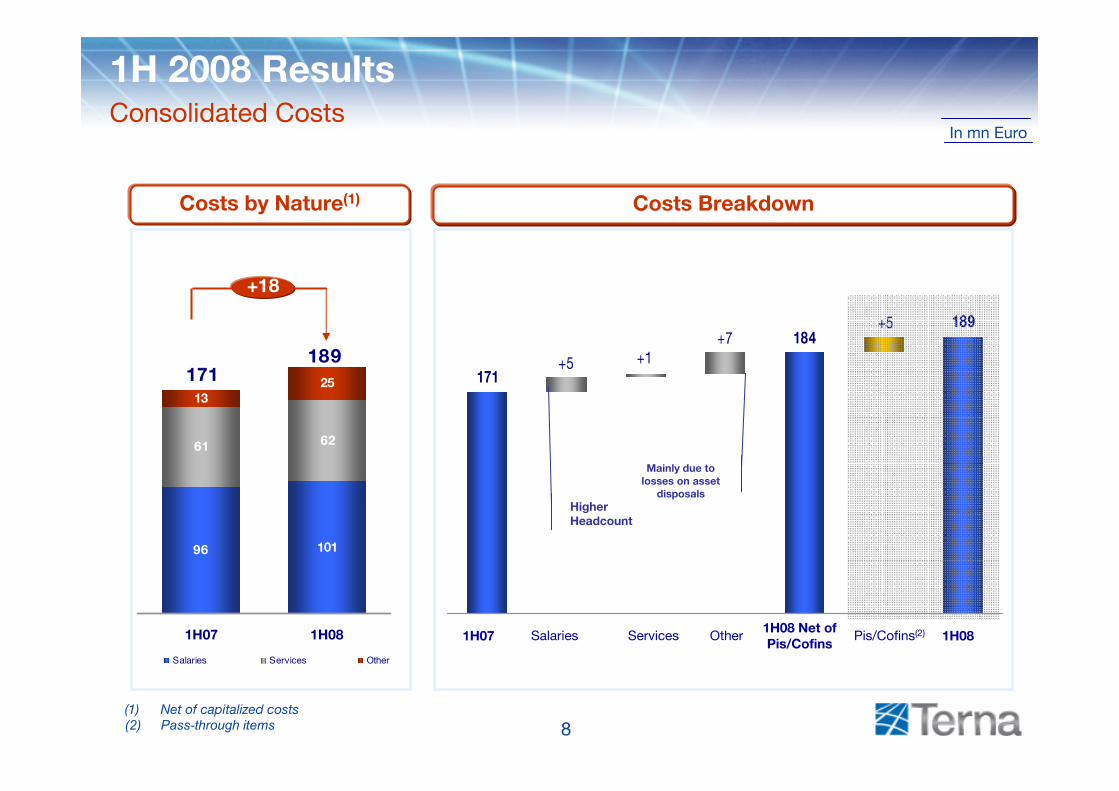
+7+1+5
184
171
189+5
(1) Net of capitalized costs(2) Pass-through items
Costs by Nature(1) Costs Breakdown
1H 2008 ResultsConsolidated Costs
96 101
13
6261
25
1H07 1H08
Salaries Services Other
1H08 Net of Pis/Cofins
1H07 Salaries Services Other
171189
+18
Mainly due to losses on asset
disposals
1H08Pis/Cofins(2)
In mn Euro
Higher Headcount
9
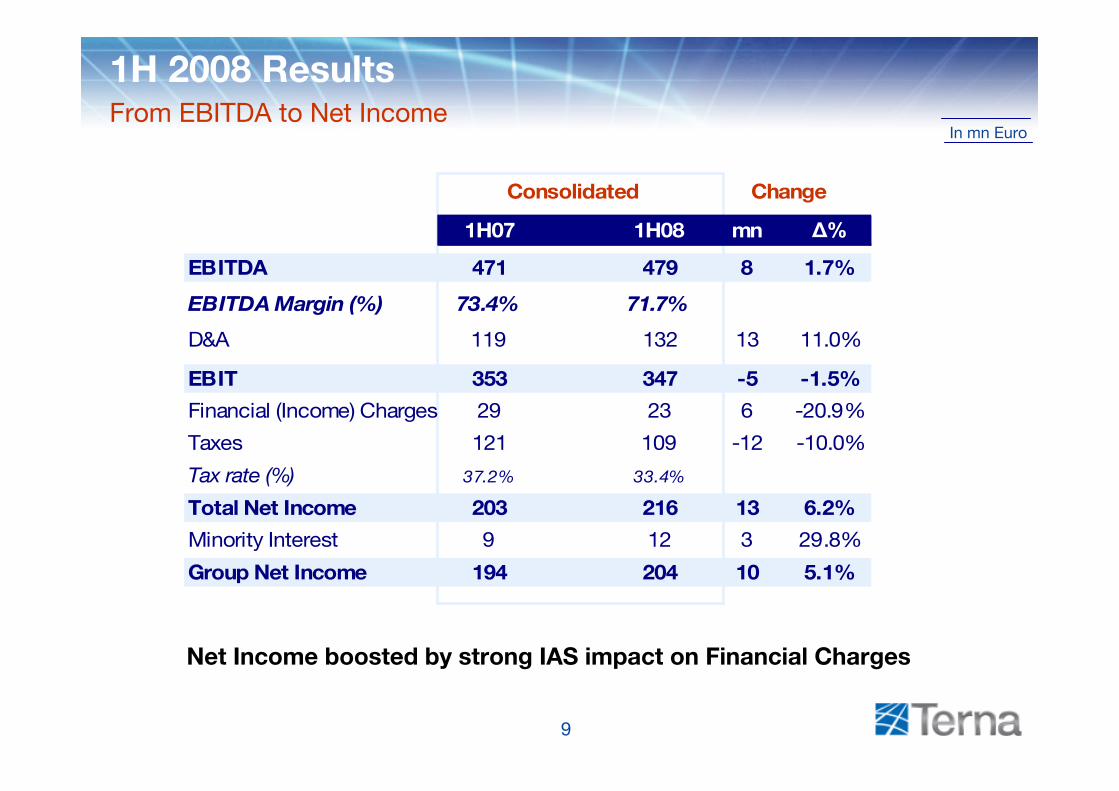
In mn Euro
1H 2008 ResultsFrom EBITDA to Net Income
Net Income boosted by strong IAS impact on Financial Charges
1H07 1H08 mn Δ%
EBITDA 471 479 8 1.7%
EBITDA Margin (%) 73.4% 71.7%
D&A 119 132 13 11.0%
EBIT 353 347 -5 -1.5%
Financial (Income) Charges 29 23 6 -20.9%
Taxes 121 109 -12 -10.0%
Tax rate (%) 37.2% 33.4%
Total Net Income 203 216 13 6.2%
Minority Interest 9 12 3 29.8%
Group Net Income 194 204 10 5.1%
Consolidated Change
10
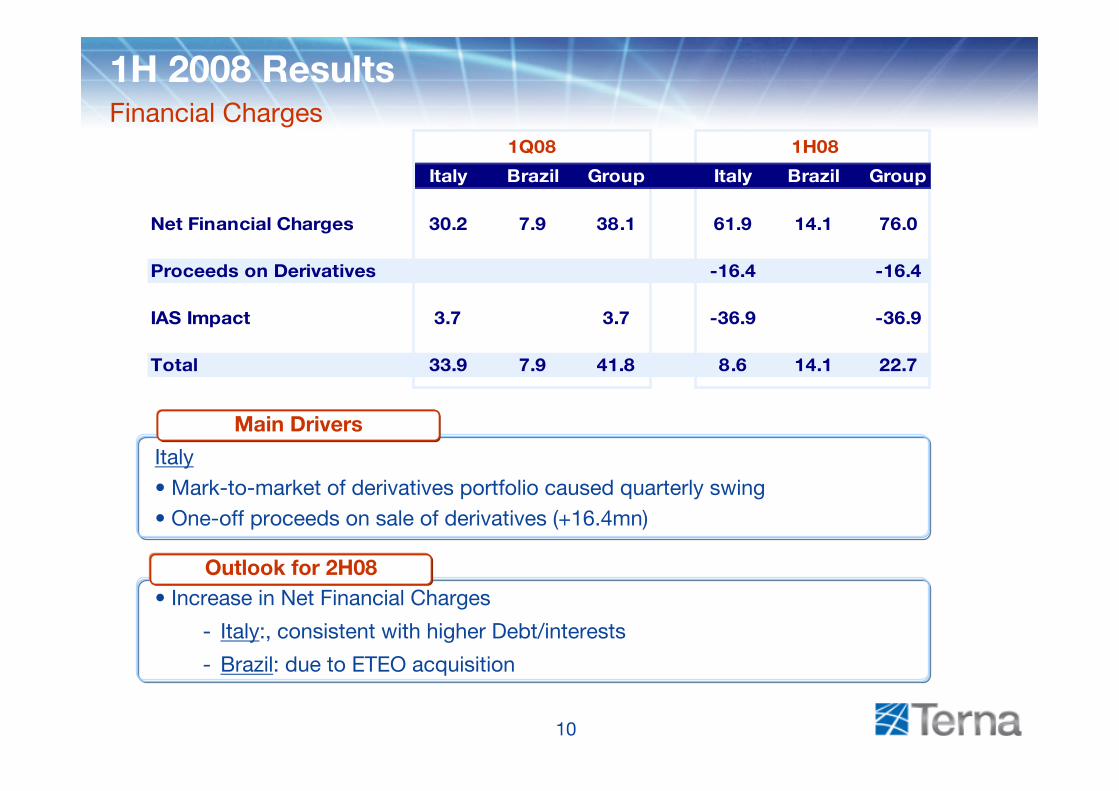
Main Drivers:Italy• Mark-to-market of derivatives portfolio caused quarterly swing• One-off proceeds on sale of derivatives (+16.4mn)
1H 2008 ResultsFinancial Charges
• Increase in Net Financial Charges
- Italy:, consistent with higher Debt/interests
- Brazil: due to ETEO acquisition
Italy Brazil Group Italy Brazil Group
Net Financial Charges 30.2 7.9 38.1 61.9 14.1 76.0
Proceeds on Derivatives -16.4 -16.4
IAS Impact 3.7 3.7 -36.9 -36.9
Total 33.9 7.9 41.8 8.6 14.1 22.7
1Q08 1H08
Outlook for 2H08
Main Drivers
11
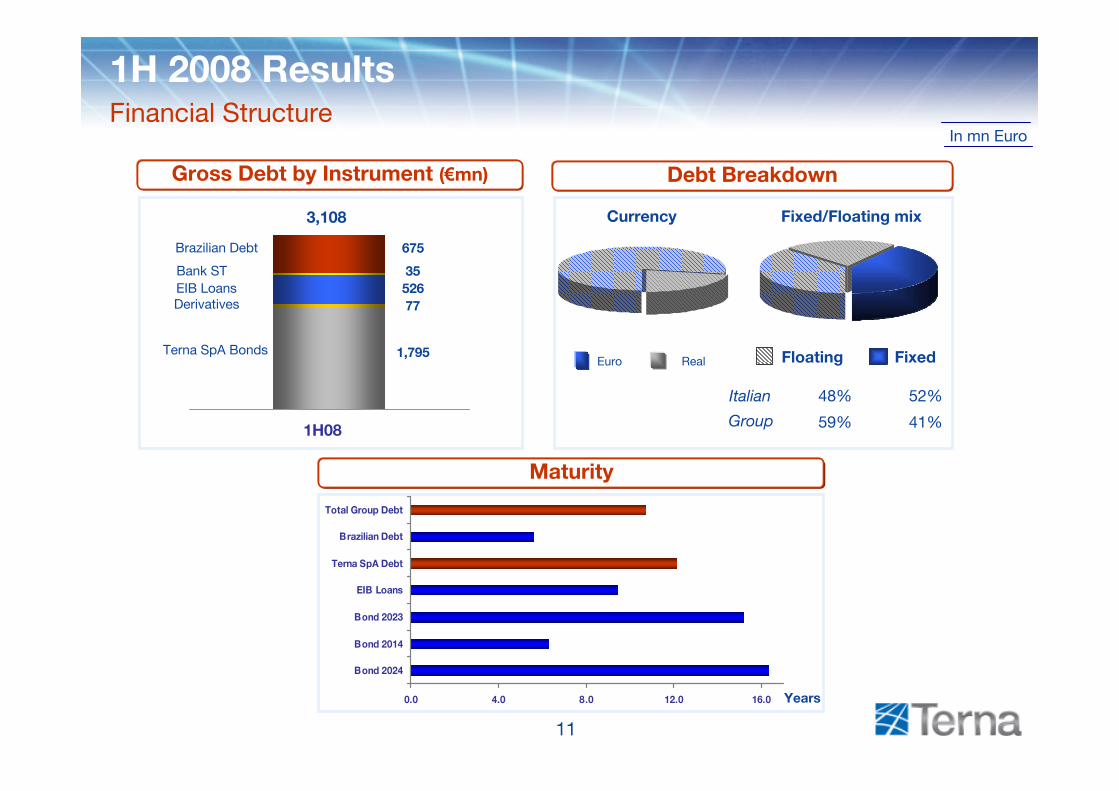
Gross Debt by Instrument (€mn) Debt Breakdown
1H 2008 ResultsFinancial Structure
In mn Euro
Terna SpA Bonds
1H08
3,108
1,795
526
675
Currency Fixed/Floating mix
Floating Fixed
Italian
Group 59%
48%
41%
52%
EIB Loans
Brazilian Debt
Euro Real
Bank ST 35
Maturity
0.0 4.0 8.0 12.0 16.0
Bond 2024
Bond 2014
Bond 2023
EIB Loans
Terna SpA Debt
Brazilian Debt
Total Group Debt
Years
77Derivatives
12
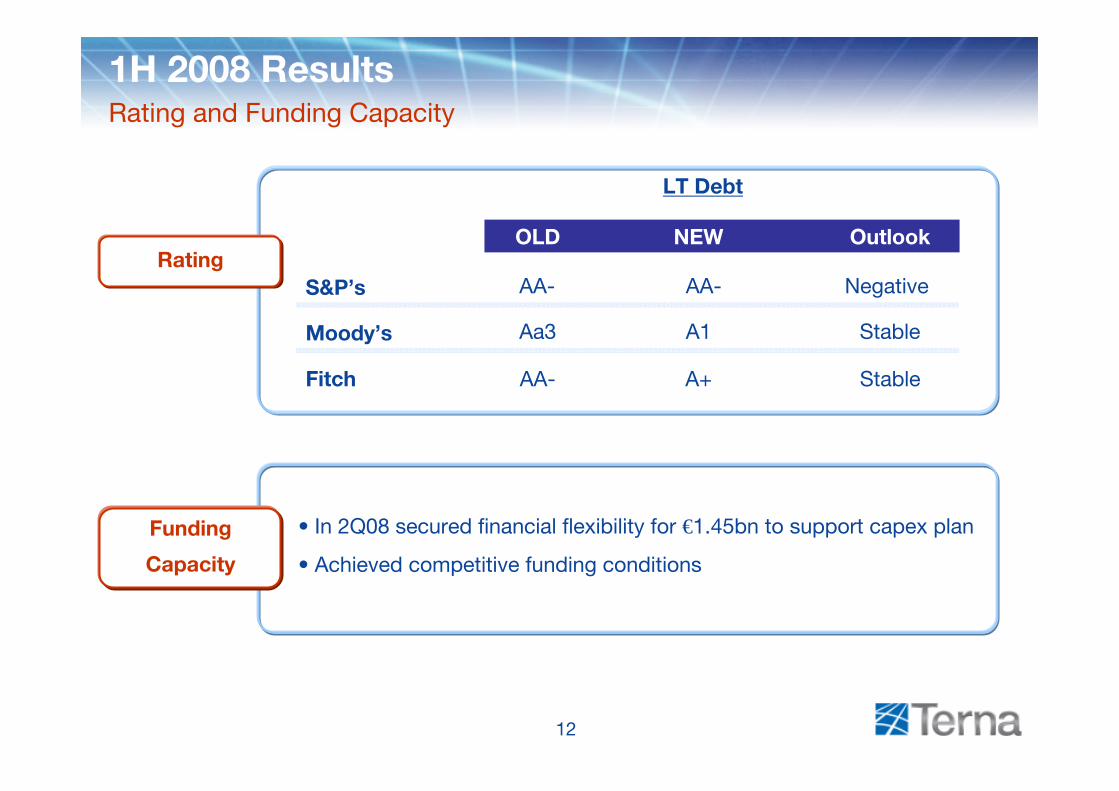
1H 2008 ResultsRating and Funding Capacity
Rating
Moody’s
Fitch
OLD NEW
StableAa3 A1
Outlook
StableAA- A+
LT Debt
Funding
Capacity
• In 2Q08 secured financial flexibility for €1.45bn to support capex plan
• Achieved competitive funding conditions
S&P’s Negative AA- AA-
13
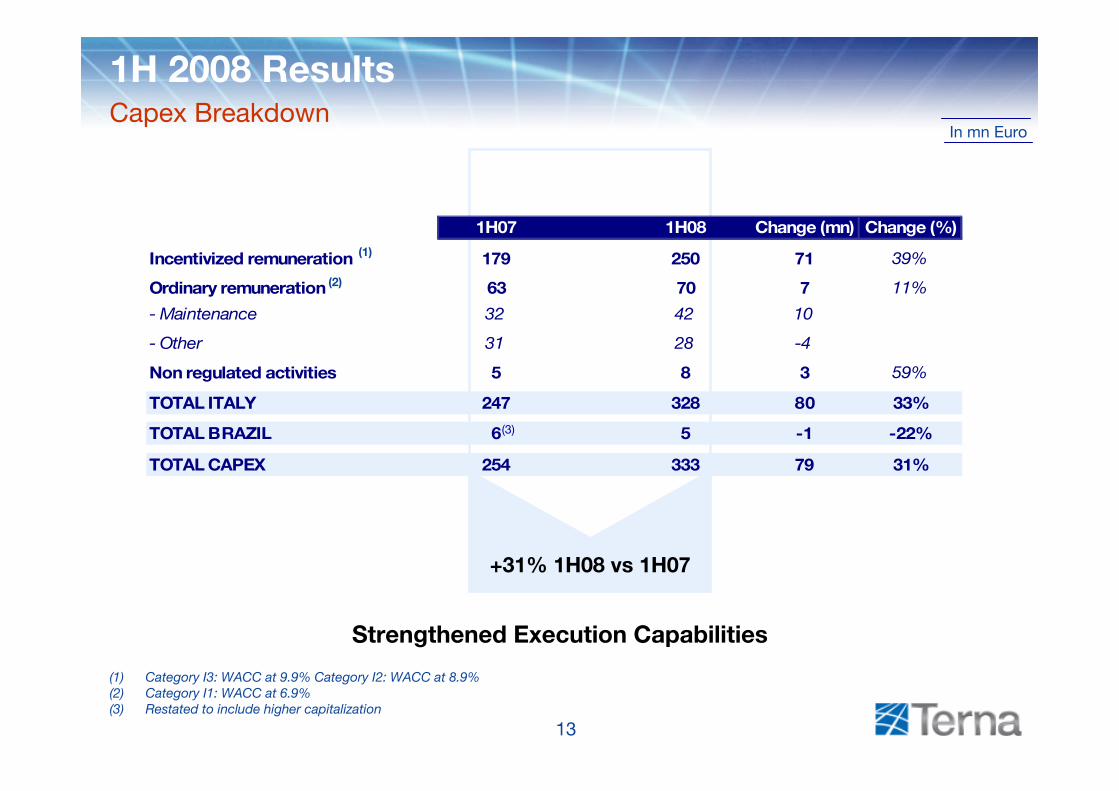
In mn Euro
1H 2008 ResultsCapex Breakdown
(1) Category I3: WACC at 9.9% Category I2: WACC at 8.9%(2) Category I1: WACC at 6.9%(3) Restated to include higher capitalization
(1)
(2)
+31% 1H08 vs 1H07
Strengthened Execution Capabilities
1H07 1H08 Change (mn) Change (%)
Incentivized remuneration 179 250 71 39%
Ordinary remuneration 63 70 7 11%
- Maintenance 32 42 10
- Other 31 28 -4
Non regulated activities 5 8 3 59%
TOTAL ITALY 247 328 80 33%
TOTAL BRAZIL 6 5 -1 -22%
TOTAL CAPEX 254 333 79 31%
(3)
14
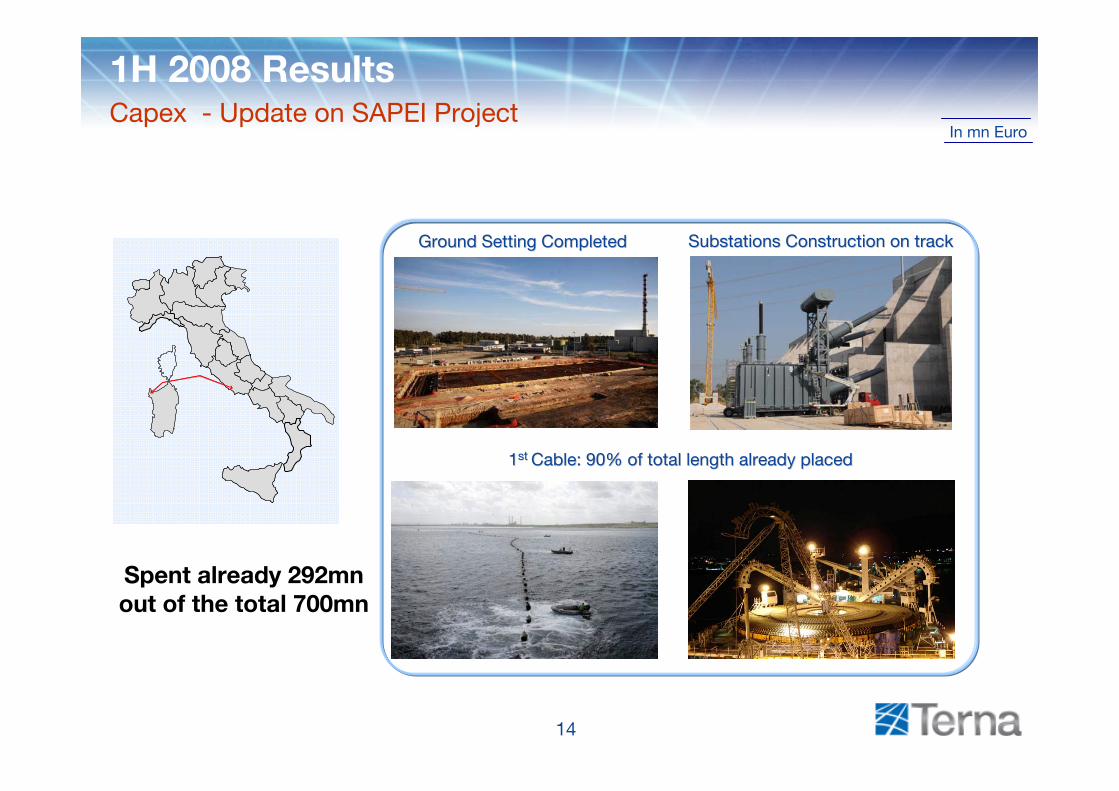
In mn Euro
1H 2008 ResultsCapex - Update on SAPEI Project
Substations Construction on trackSubstations Construction on track
Spent already 292mn out of the total 700mn
Ground Setting CompletedGround Setting Completed
11st st Cable: 90% of total length already placedCable: 90% of total length already placed
15
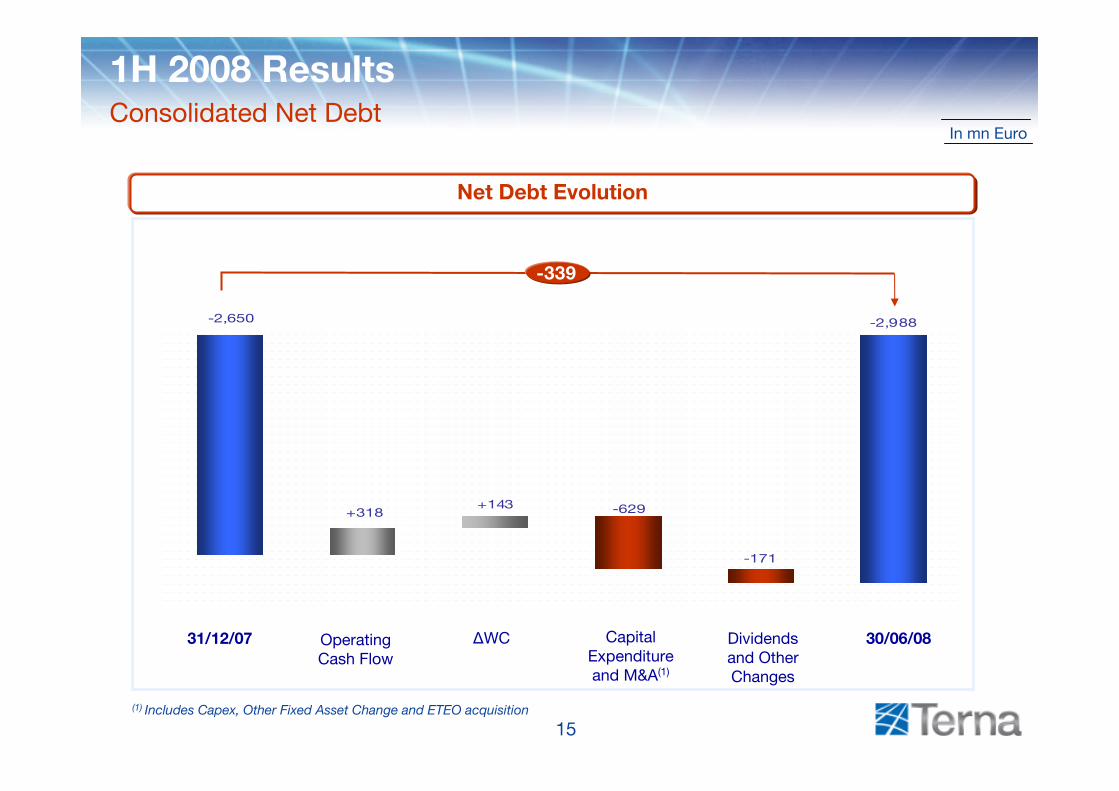
In mn Euro
(1) Includes Capex, Other Fixed Asset Change and ETEO acquisition
Net Debt Evolution
1H 2008 ResultsConsolidated Net Debt
-2,988
-171
-629+143+318
-2,650
Operating Cash Flow
ΔWC 30/06/0831/12/07 Capital Expenditure and M&A(1)
Dividends and Other Changes
-339
16
Highlights
1H08 Results
Closing Remarks
Annexes
Agenda
17
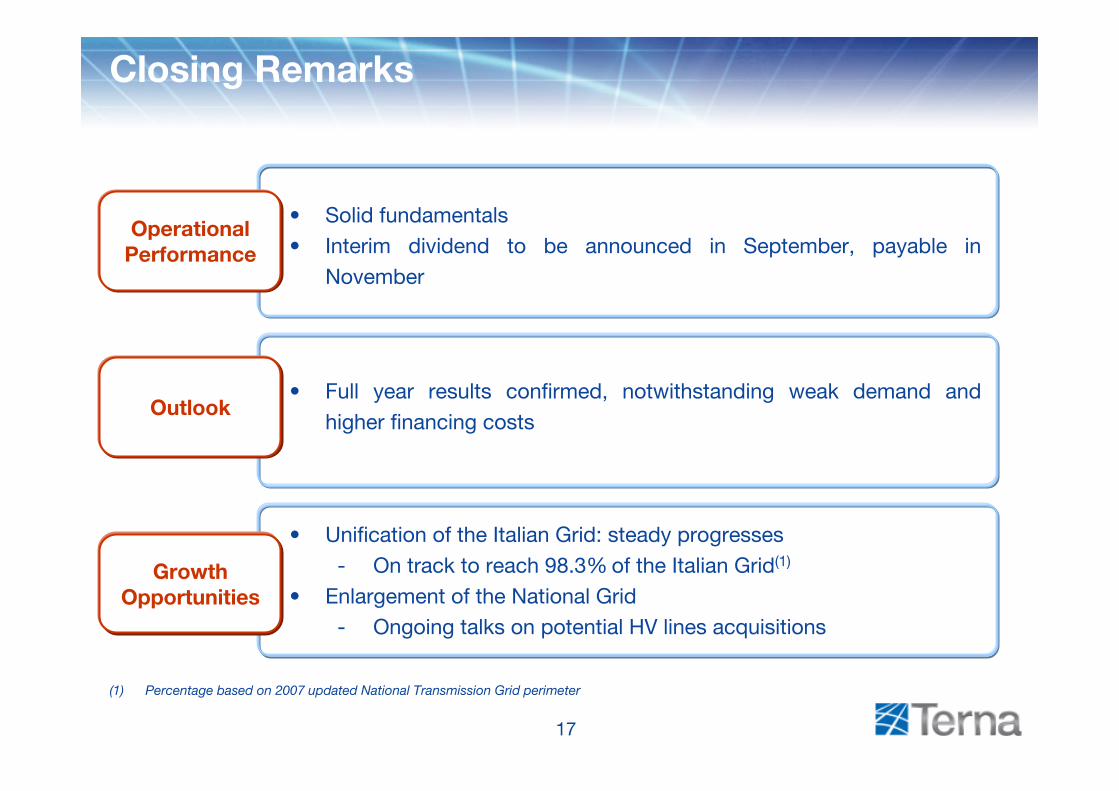
• Solid fundamentals • Interim dividend to be announced in September, payable in
November
Closing Remarks
Operational Performance
• Unification of the Italian Grid: steady progresses- On track to reach 98.3% of the Italian Grid(1)
• Enlargement of the National Grid- Ongoing talks on potential HV lines acquisitions
Growth Opportunities
• Full year results confirmed, notwithstanding weak demand and higher financing costs
Outlook
(1) Percentage based on 2007 updated National Transmission Grid perimeter

18
Highlights
1H08 Results
Closing Remarks
Annexes
Agenda
19
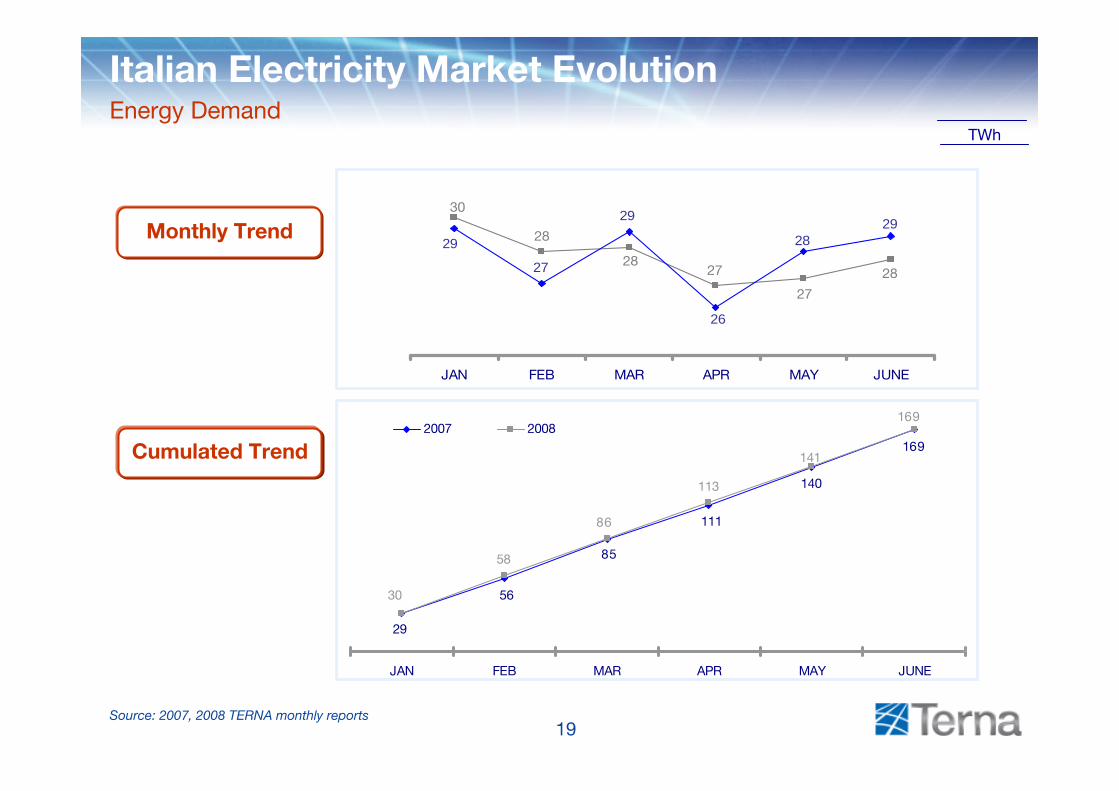
169
140
111
29
56
85
169
141
113
86
58
30
JAN FEB MAR APR MAY JUNE
2007 2008
Source: 2007, 2008 TERNA monthly reports
TWh
Italian Electricity Market EvolutionEnergy Demand
Monthly Trend
Cumulated Trend
2728
28
30
27
28
2928
26
29
27
29
JAN FEB MAR APR MAY JUNE
20
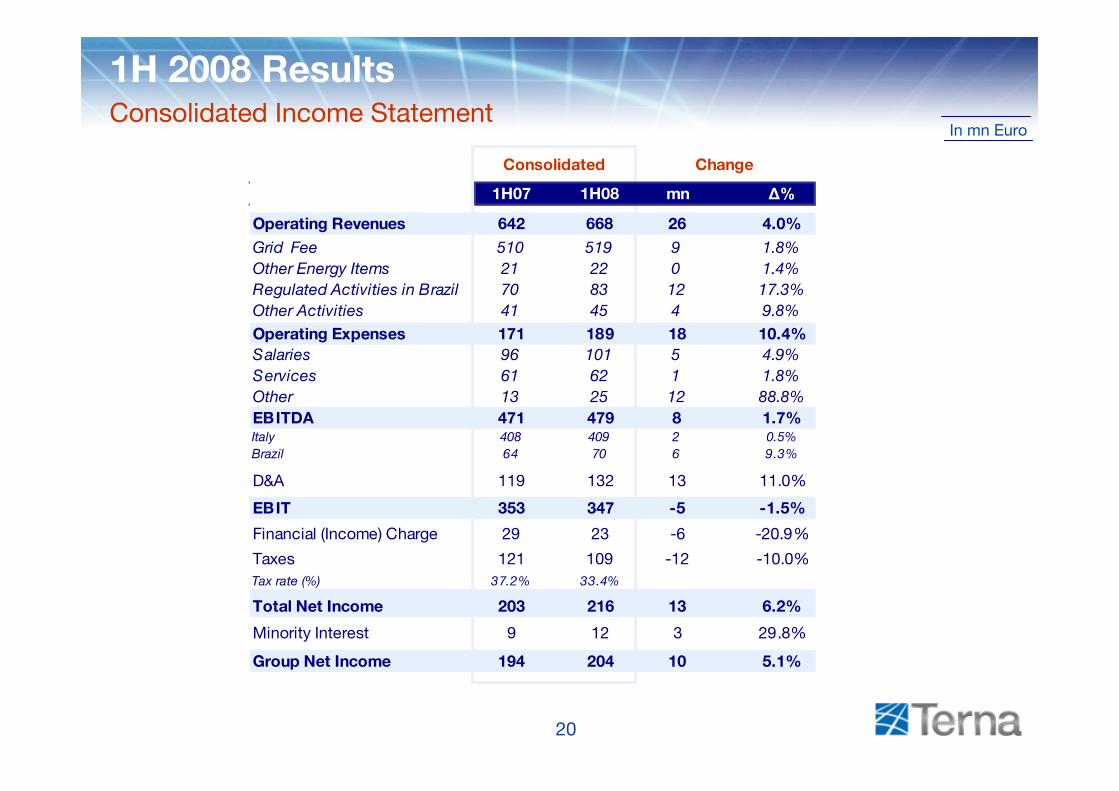
1H07 1H08 mn Δ%
Operating Revenues 642 668 26 4.0%Grid Fee 510 519 9 1.8%Other Energy Items 21 22 0 1.4%Regulated Activities in Brazil 70 83 12 17.3%Other Activities 41 45 4 9.8%Operating Expenses 171 189 18 10.4%Salaries 96 101 5 4.9%Services 61 62 1 1.8%Other 13 25 12 88.8%EBITDA 471 479 8 1.7%Italy 408 409 2 0.5%Brazil 64 70 6 9.3%
D&A 119 132 13 11.0%
EBIT 353 347 -5 -1.5%
Financial (Income) Charge 29 23 -6 -20.9%
Taxes 121 109 -12 -10.0%Tax rate (%) 37.2% 33.4%
Total Net Income 203 216 13 6.2%
Minority Interest 9 12 3 29.8%
Group Net Income 194 204 10 5.1%
Consolidated Change
In mn Euro
1H 2008 ResultsConsolidated Income Statement
21
In mn Euro
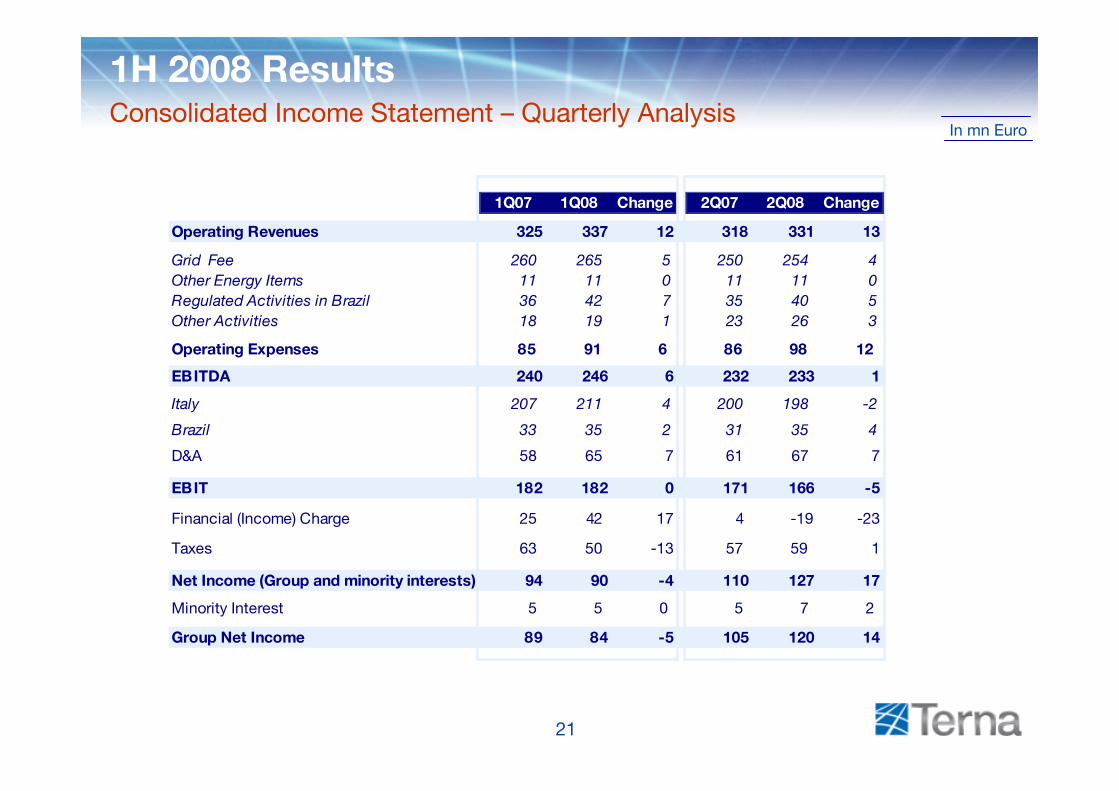
1H 2008 ResultsConsolidated Income Statement – Quarterly Analysis
1Q07 1Q08 Change 2Q07 2Q08 Change
Operating Revenues 325 337 12 318 331 13
Grid Fee 260 265 5 250 254 4Other Energy Items 11 11 0 11 11 0Regulated Activities in Brazil 36 42 7 35 40 5Other Activities 18 19 1 23 26 3
Operating Expenses 85 91 6 86 98 12
EBITDA 240 246 6 232 233 1
Italy 207 211 4 200 198 -2
Brazil 33 35 2 31 35 4
D&A 58 65 7 61 67 7
EBIT 182 182 0 171 166 -5
Financial (Income) Charge 25 42 17 4 -19 -23
Taxes 63 50 -13 57 59 1
Net Income (Group and minority interests) 94 90 -4 110 127 17
Minority Interest 5 5 0 5 7 2
Group Net Income 89 84 -5 105 120 14
22
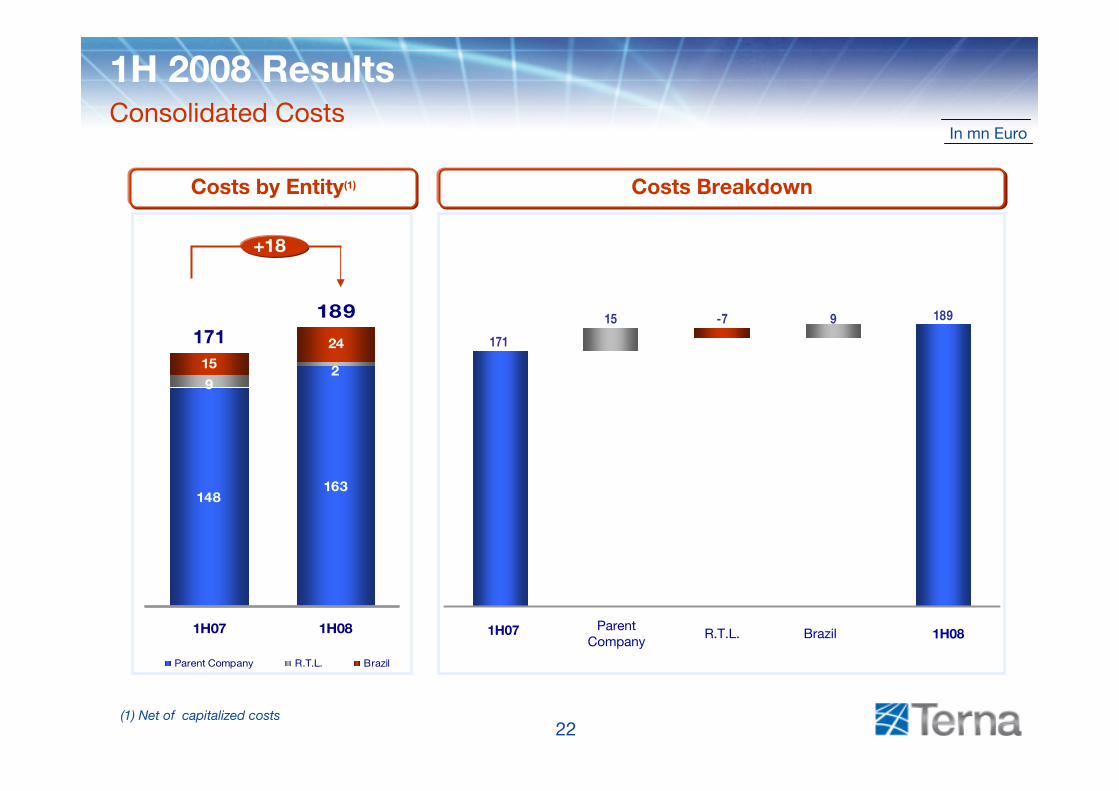
9-715 189
171
15
148163
29
24
1H07 1H08
Parent Company R.T.L. Brazil
In mn Euro
1H081H07 Parent Company
R.T.L. Brazil
(1) Net of capitalized costs
171189
1H 2008 ResultsConsolidated Costs
Costs by Entity(1) Costs Breakdown
+18
23
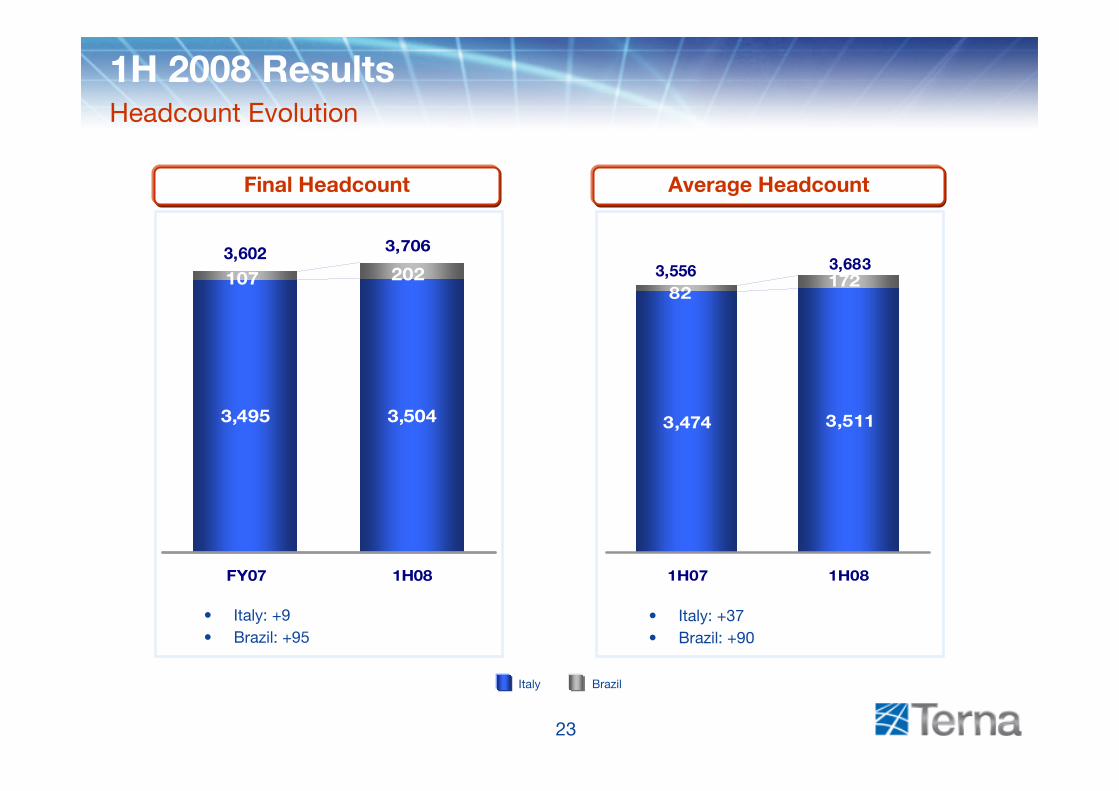
3,474 3,511
17282
1H07 1H08
3,495 3,504
107 202
FY07 1H08
• Italy: +37• Brazil: +90
3,6833,5563,602 3,706
Italy Brazil
• Italy: +9• Brazil: +95
1H 2008 ResultsHeadcount Evolution
Final Headcount Average Headcount
24
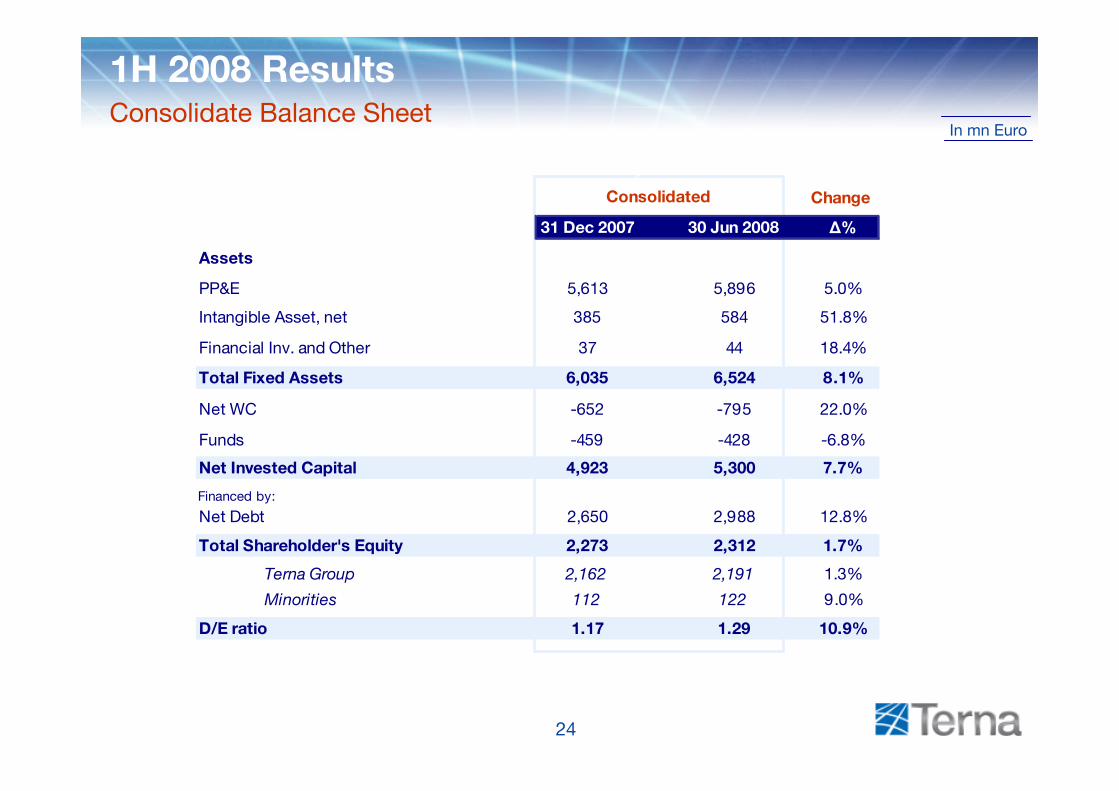
Change
31 Dec 2007 30 Jun 2008 Δ%
Assets
PP&E 5,613 5,896 5.0%
Intangible Asset, net 385 584 51.8%
Financial Inv. and Other 37 44 18.4%
Total Fixed Assets 6,035 6,524 8.1%
Net WC -652 -795 22.0%
Funds -459 -428 -6.8%
Net Invested Capital 4,923 5,300 7.7%
Financed by:
Net Debt 2,650 2,988 12.8%
Total Shareholder's Equity 2,273 2,312 1.7%
Terna Group 2,162 2,191 1.3%
Minorities 112 122 9.0%
D/E ratio 1.17 1.29 10.9%
Consolidated
In mn Euro
*
1H 2008 ResultsConsolidate Balance Sheet
25
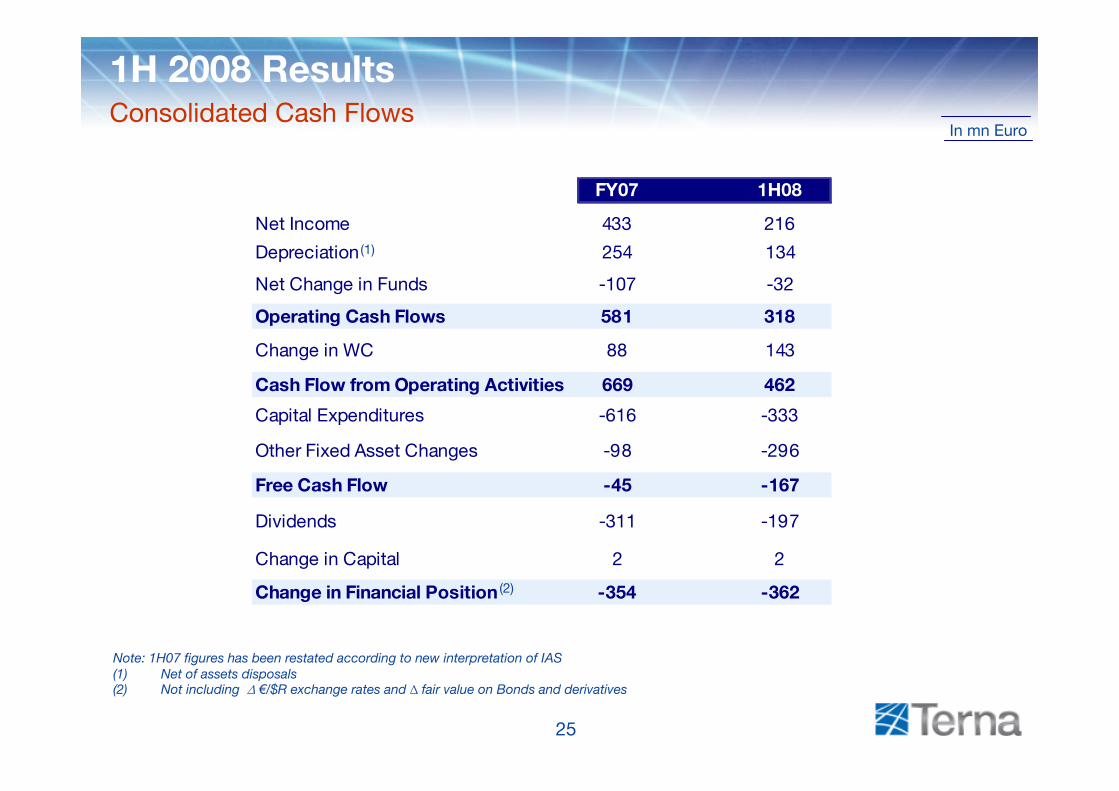
In mn Euro
FY07 1H08
Net Income 433 216
Depreciation 254 134
Net Change in Funds -107 -32
Operating Cash Flows 581 318
Change in WC 88 143
Cash Flow from Operating Activities 669 462
Capital Expenditures -616 -333
Other Fixed Asset Changes -98 -296
Free Cash Flow -45 -167
Dividends -311 -197
Change in Capital 2 2
Change in Financial Position -354 -362
Note: 1H07 figures has been restated according to new interpretation of IAS(1) Net of assets disposals(2) Not including ∆ €/$R exchange rates and ∆ fair value on Bonds and derivatives
(1)
(2)
1H 2008 ResultsConsolidated Cash Flows
26
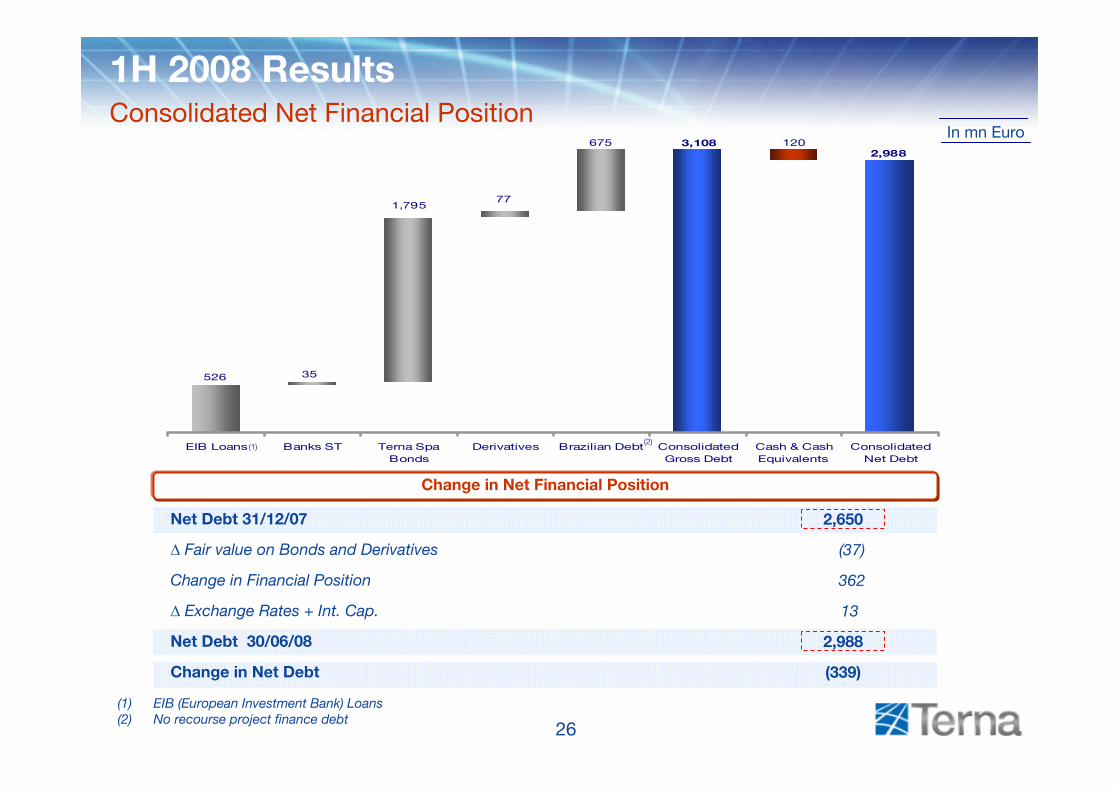
2,988675
77
1203,108
1,795
35526
EIB Loans Banks ST Terna SpaBonds
Derivatives Brazilian Debt ConsolidatedGross Debt
Cash & CashEquivalents
ConsolidatedNet Debt
(1)
(1) EIB (European Investment Bank) Loans (2) No recourse project finance debt
(2)
In mn Euro
Net Debt 31/12/07
∆ Fair value on Bonds and Derivatives
Change in Financial Position
∆ Exchange Rates + Int. Cap.
Net Debt 30/06/08
Change in Net Debt
1H 2008 ResultsConsolidated Net Financial Position
Change in Net Financial Position
2,650
(37)
362
13
2,988
(339)
27
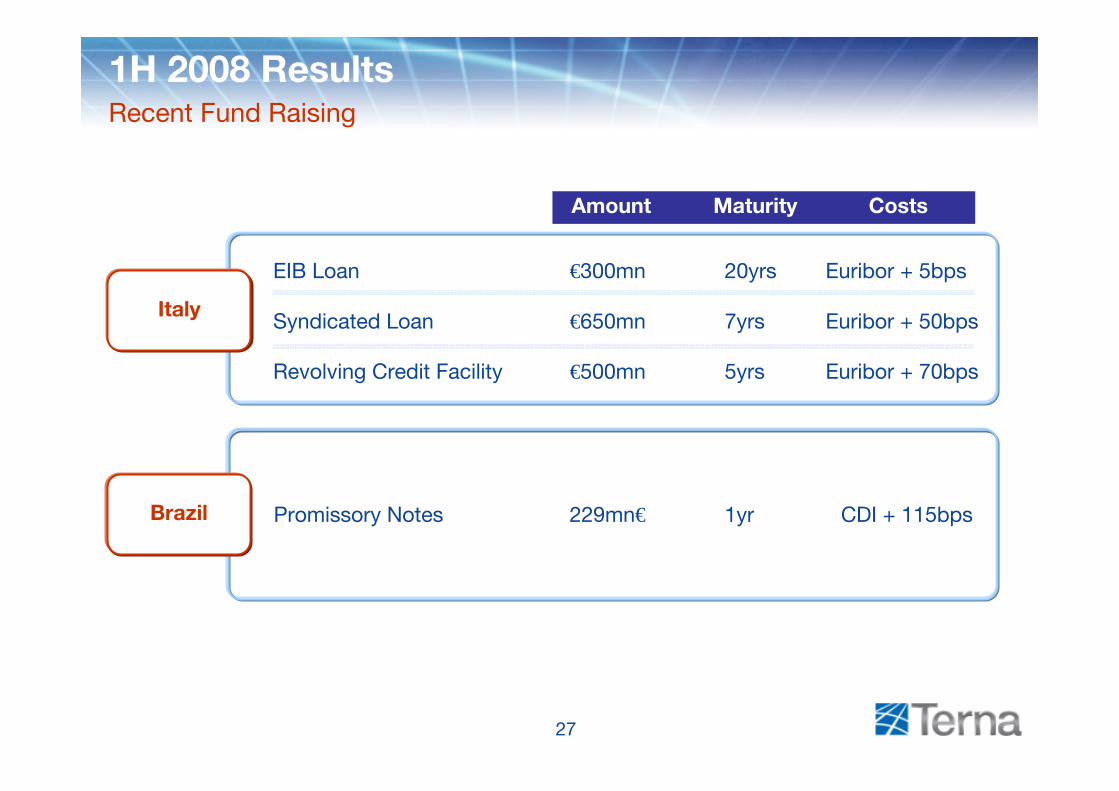
1H 2008 ResultsRecent Fund Raising
Brazil
Amount Maturity Costs
€300mn 20yrsEIB Loan Euribor + 5bps
Italy €650mn 7yrsSyndicated Loan Euribor + 50bps
€500mn 5yrsRevolving Credit Facility Euribor + 70bps
229mn€ 1yrPromissory Notes CDI + 115bps
28
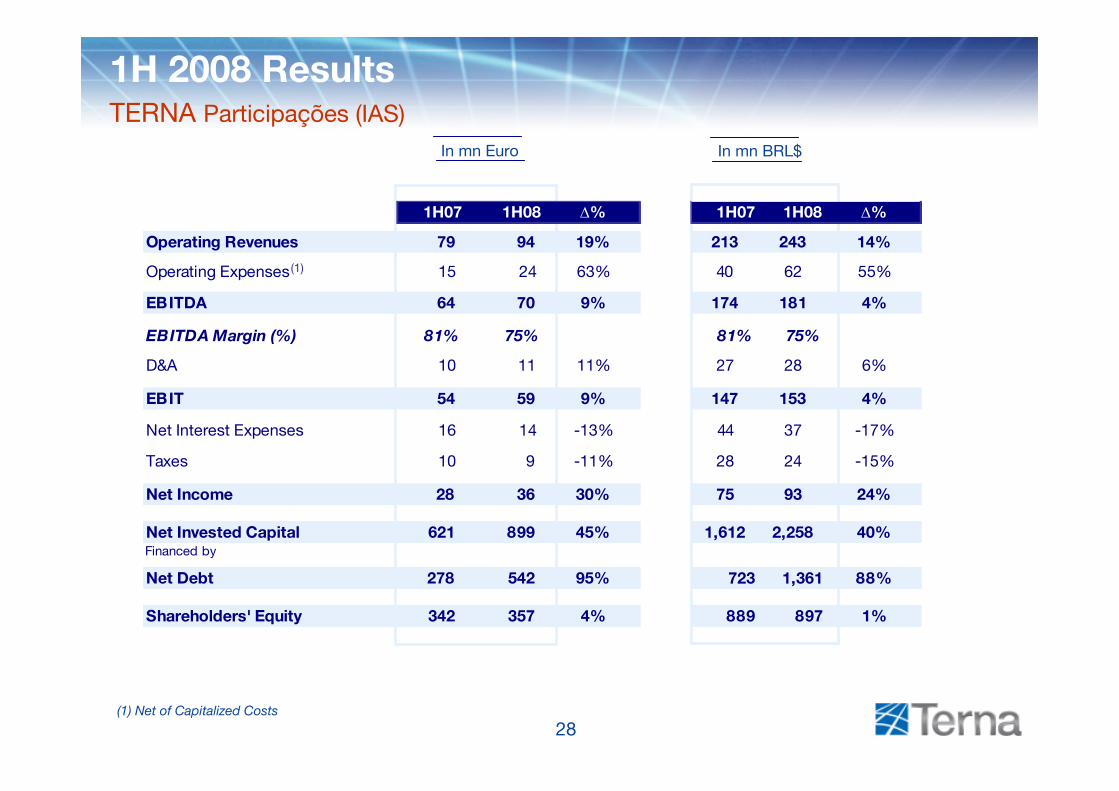
1H07 1H08 ∆%
Operating Revenues 79 94 19%
Operating Expenses 15 24 63%
EBITDA 64 70 9%
EBITDA Margin (%) 81% 75%
D&A 10 11 11%
EBIT 54 59 9%
Net Interest Expenses 16 14 -13%
Taxes 10 9 -11%
Net Income 28 36 30%
Net Invested Capital 621 899 45%Financed by
Net Debt 278 542 95%
Shareholders' Equity 342 357 4%
In mn Euro
1H 2008 ResultsTERNA Participações (IAS)
In mn BRL$
(1)
(1) Net of Capitalized Costs
1H07 1H08 ∆%
213 243 14%
40 62 55%
174 181 4%
81% 75%
27 28 6%
147 153 4%
44 37 -17%
28 24 -15%
75 93 24%
1,612 2,258 40%
723 1,361 88%
889 897 1%
29
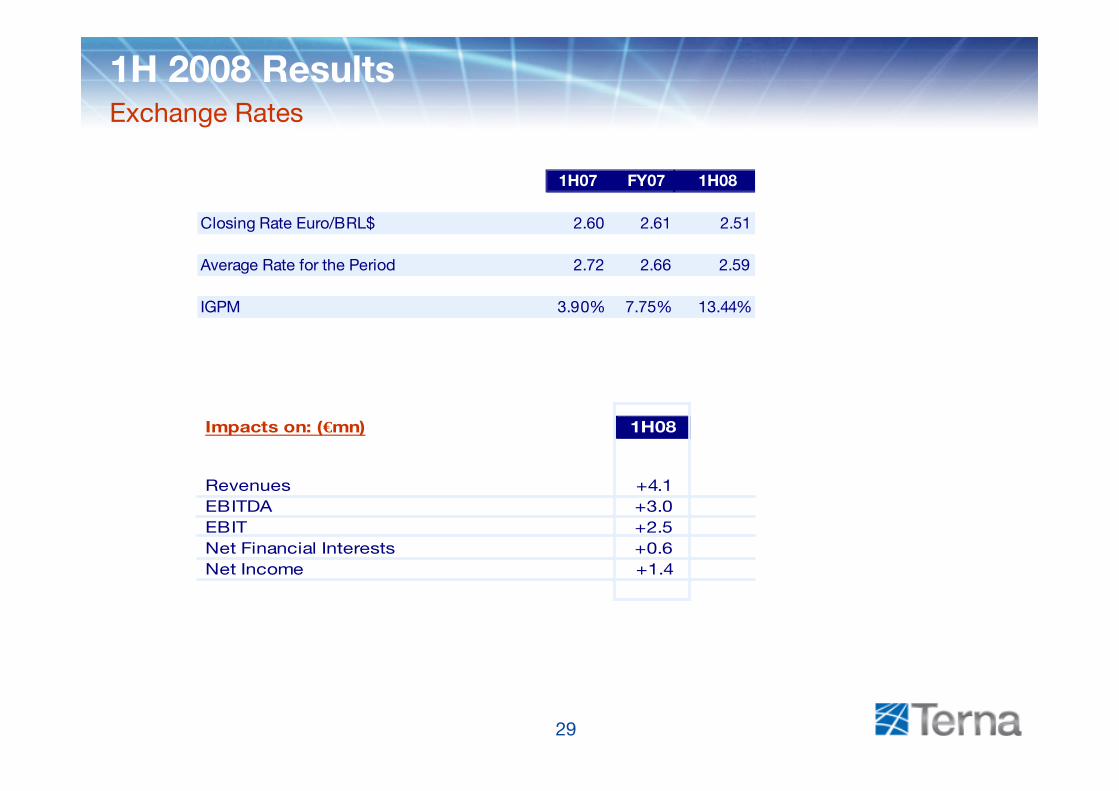
1H 2008 ResultsExchange Rates
1H07 FY07 1H08
Closing Rate Euro/BRL$ 2.60 2.61 2.51
Average Rate for the Period 2.72 2.66 2.59
IGPM 3.90% 7.75% 13.44%
Impacts on: (€mn) 1H08
Revenues +4.1EBITDA +3.0EBIT +2.5Net Financial Interests +0.6Net Income +1.4
30
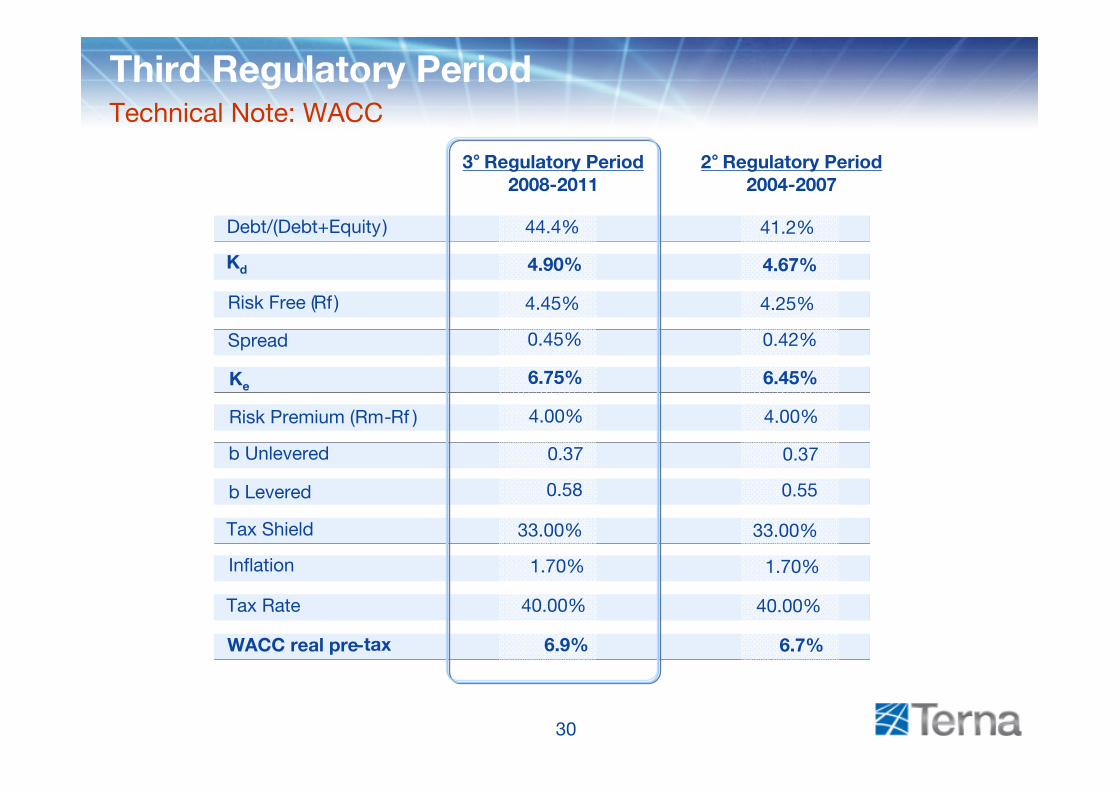
44.4%
4.90%
0.45%
6.75%
4.00%
0.37
0.58
33.00%
1.70%
40.00%
6.9%
4.45%
Debt/(Debt+Equity)
Kd
Risk Free (Rf )
Spread
Ke
Risk Premium (Rm-Rf )
b Unlevered
b Levered
Tax Shield
Inflation
Tax Rate
WACC real pre-tax
3°Regulatory Period2008-2011
2°Regulatory Period2004-2007
Third Regulatory PeriodTechnical Note: WACC
41.2%
4.67%
0.42%
6.45%
4.00%
0.37
0.55
33.00%
1.70%
40.00%
6.7%
4.25%
EXCUTIVE IN CHARGE OF THE PREPARATION OF ACCOUNTING DOCUMENTS “LUCIANO DI BACCO” DECLARES, PURSUANT TO PARAGRAPH 2 OF ARTICLE 154-BIS OF THE CONSOLIDATED LAW ON FINANCE, THAT THE ACCOUNTING INFORMATION CONTAINED IN THIS PRESENTATION CORRESPONDS TO THE DOCUMENT RESULTS, BOOKS AND ACCOUNTING RECORDS.
THIS DOCUMENT HAS BEEN PREPARED BY TERNA S.P.A. (THE “COMPANY”) FOR THE SOLE PURPOSE DESCRIBED HEREIN. IN NO CASE MAY IT BE INTERPRETED AS AN OFFER OR INVITATION TO SELL OR PURCHASE ANY SECURITY ISSUED BY THE COMPANY OR ITS SUBSIDIARIES.
THE CONTENT OF THIS DOCUMENT HAS A MERELY INFORMATIVE AND PROVISIONAL NATURE AND THE STATEMENTS CONTAINED HEREIN HAVE NOT BEEN INDEPENDENTLY VERIFIED. NEITHER THE COMPANY NOR ANY OF ITS REPRESENTATIVES SHALL ACCEPT ANY LIABILITY WHATSOEVER (WHETHER IN NEGLIGENCE OR OTHERWISE) ARISING IN ANY WAY FROM THE USE OF THIS DOCUMENT OR ITS CONTENTS OR OTHERWISE ARISING IN CONNECTION WITH THIS DOCUMENT OR ANY MATERIAL DISCUSSED DURING THE PRESENTATION.
THIS DOCUMENT MAY NOT BE REPRODUCED OR REDISTRIBUTED, IN WHOLE OR IN PART, TO ANY OTHER PERSON. THE INFORMATION CONTAINED HEREIN AND OTHER MATERIAL DISCUSSED AT THE CONFERENCE CALL MAY INCLUDE FORWARD-LOOKING STATEMENTS THAT ARE NOT HISTORICAL FACTS, INCLUDING STATEMENTS ABOUT THE COMPANY’S BELIEFS AND EXPECTATIONS. THESE STATEMENTS ARE BASED ON CURRENT PLANS, ESTIMATES, PROJECTIONS AND PROJECTS, AND CANNOT BE INTERPRETED AS A PROMISE OR GUARANTEE OF WHATSOEVER NATURE.
HOWEVER, FORWARD-LOOKING STATEMENTS INVOLVE INHERENT RISKS AND UNCERTAINTIES AND ARE CURRENT ONLY AT THE DATE THEY ARE MADE. WE CAUTION YOU THAT A NUMBER OF FACTORS COULD CAUSE THE COMPANY’S ACTUAL RESULTS AND PROVISIONS TO DIFFER MATERIALLY FROM THOSE CONTAINED IN ANY FORWARD-LOOKING STATEMENT. SUCH FACTORS INCLUDE, BUT ARE NOT LIMITED TO: TRENDS IN COMPANY’S BUSINESS, ITS ABILITY TO IMPLEMENT COST-CUTTING PLANS, CHANGES IN THE REGULATORY ENVIRONMENT, DIFFERENT INTERPRETATION OF THE LAW AND REGULATION, ITS ABILITY TO SUCCESSFULLY DIVERSIFY AND THE EXPECTED LEVEL OF FUTURE CAPITAL EXPENDITURES. THEREFORE, YOU SHOULD NOT PLACE UNDUE RELIANCE ON SUCH FORWARD-LOOKING STATEMENTS. TERNA DOES NOT UNDERTAKE ANY OBLIGATION TO UPDATE FORWARD-LOOKING STATEMENTS TO REFLECT ANY CHANGES IN TERNA’S EXPECTATIONS WITH REGARD THERETO OR ANY CHANGES IN EVENTS.
Disclaimer