Embed Size (px)
Citation preview
0
FY06 Consolidated Results
Flavio Cattaneo – Chief Executive Officer
Fabio Todeschini – Chief Financial Officer
March 21st, 2007
1
Agenda
Highlights
FY06 Results
Dividends and Closing Remarks
Annexes
2
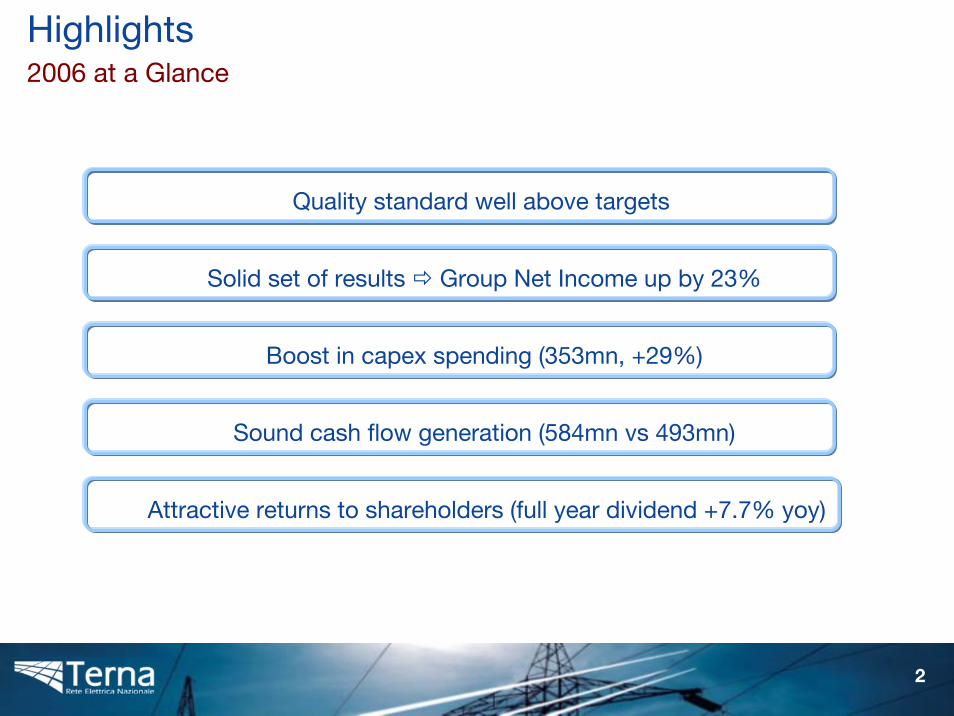
Highlights2006 at a Glance
Solid set of results Group Net Income up by 23%
Boost in capex spending (353mn, +29%)
Sound cash flow generation (584mn vs 493mn)
Attractive returns to shareholders (full year dividend +7.7% yoy)
Quality standard well above targets
3
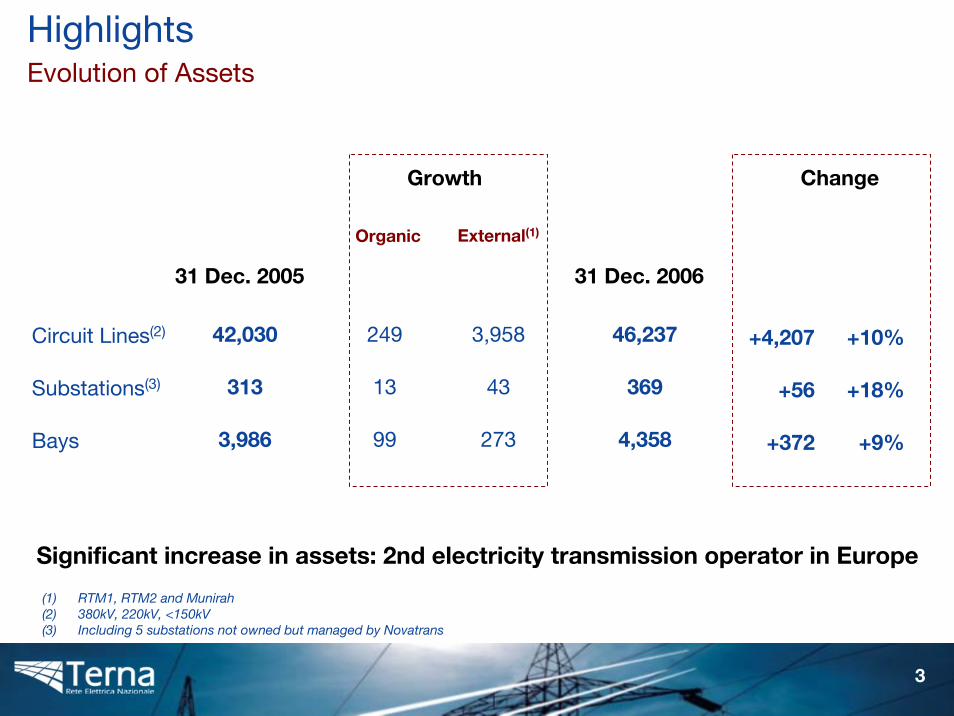
HighlightsEvolution of Assets
External(1)
Circuit Lines(2)
Substations(3)
Bays
Organic
Growth
42,030
313
3,986
46,237
369
4,358
249
13
99
3,958
43
273
(1) RTM1, RTM2 and Munirah(2) 380kV, 220kV, <150kV(3) Including 5 substations not owned but managed by Novatrans
+4,207
+56
+372
Change
+10%
+18%
+9%
31 Dec. 2005 31 Dec. 2006
Significant increase in assets: 2nd electricity transmission operator in Europe
4
Agenda
Highlights
FY06 Results
Dividends and Closing Remarks
Annexes
5
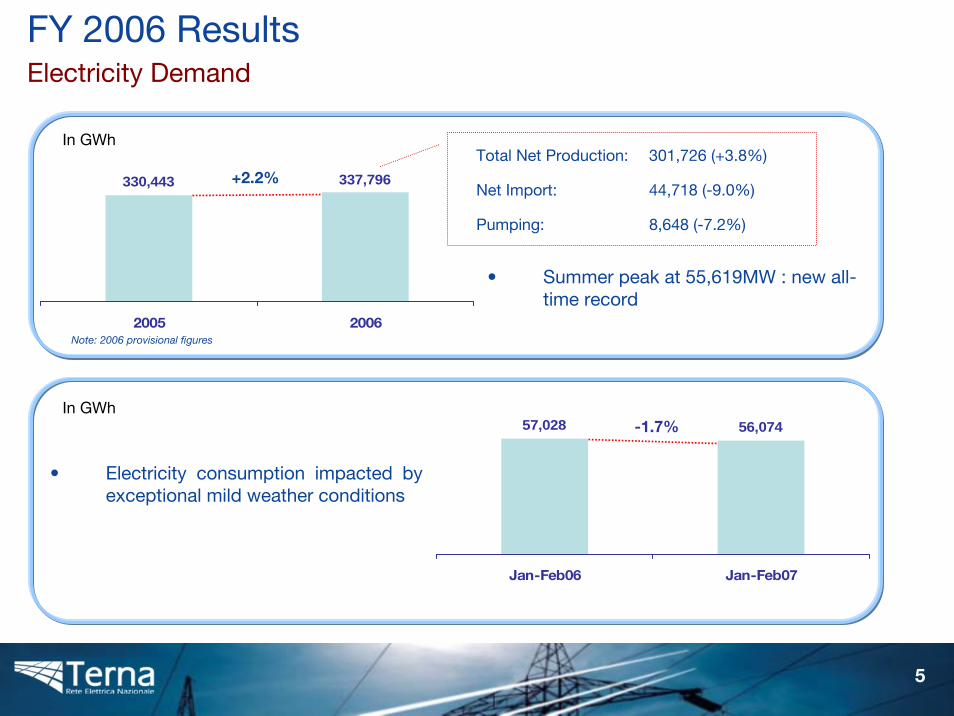
FY 2006 ResultsElectricity Demand
330,443 337,796
2005 2006
+2.2%
57,028 56,074
Jan-Feb06 Jan-Feb07
-1.7%
• Electricity consumption impacted by exceptional mild weather conditions
In GWhTotal Net Production: 301,726 (+3.8%)
Net Import: 44,718 (-9.0%)
Pumping: 8,648 (-7.2%)
• Summer peak at 55,619MW : new all-time record
Note: 2006 provisional figures
In GWh
6
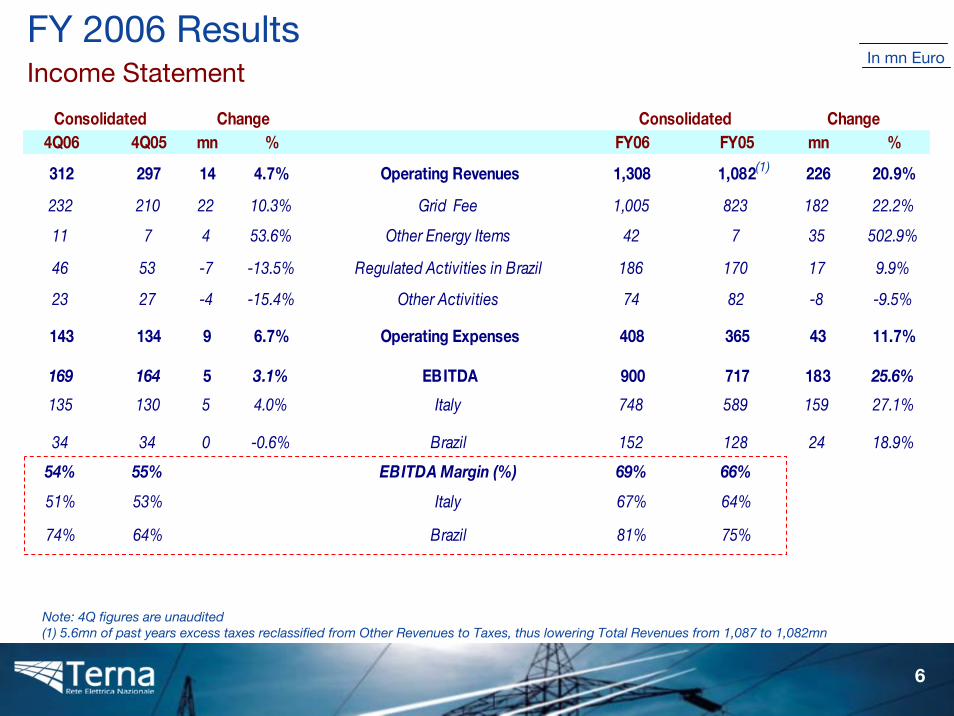
In mn EuroFY 2006 ResultsIncome Statement
4Q06 4Q05 mn % FY06 FY05 mn %
312 297 14 4.7% Operating Revenues 1,308 1,082 226 20.9%
232 210 22 10.3% Grid Fee 1,005 823 182 22.2%
11 7 4 53.6% Other Energy Items 42 7 35 502.9%
46 53 -7 -13.5% Regulated Activities in Brazil 186 170 17 9.9%
23 27 -4 -15.4% Other Activities 74 82 -8 -9.5%
143 134 9 6.7% Operating Expenses 408 365 43 11.7%
169 164 5 3.1% EBITDA 900 717 183 25.6%
135 130 5 4.0% Italy 748 589 159 27.1%
34 34 0 -0.6% Brazil 152 128 24 18.9%
54% 55% EBITDA Margin (%) 69% 66%
51% 53% Italy 67% 64%
74% 64% Brazil 81% 75%
Consolidated ChangeChangeConsolidated
(1)
Note: 4Q figures are unaudited(1) 5.6mn of past years excess taxes reclassified from Other Revenues to Taxes, thus lowering Total Revenues from 1,087 to 1,082mn
7
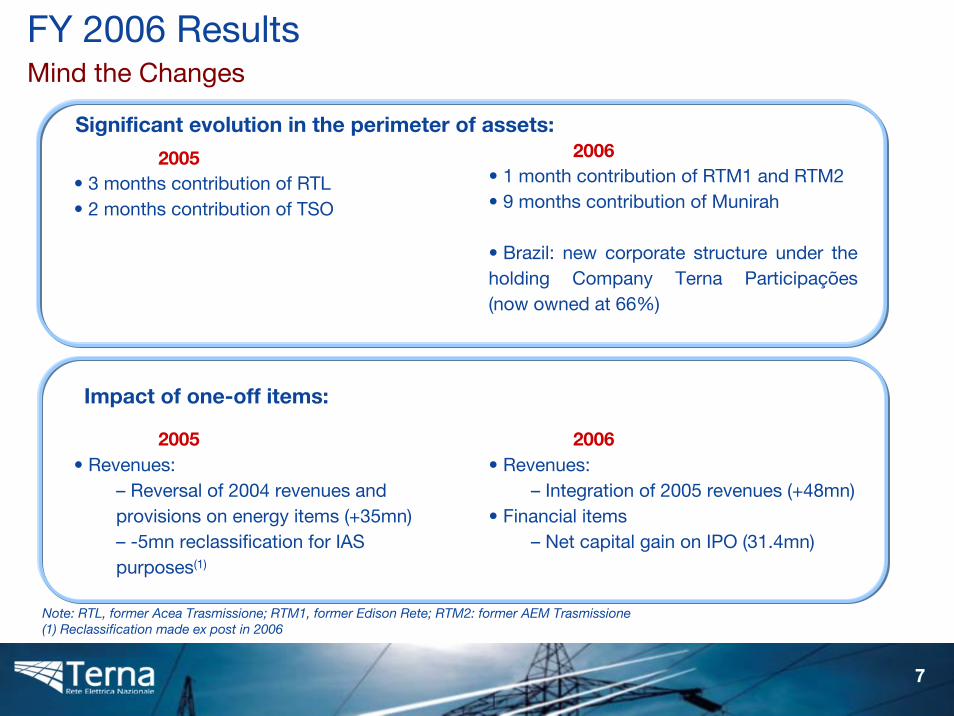
FY 2006 ResultsMind the Changes
Note: RTL, former Acea Trasmissione; RTM1, former Edison Rete; RTM2: former AEM Trasmissione(1) Reclassification made ex post in 2006
Significant evolution in the perimeter of assets:
2005• 3 months contribution of RTL• 2 months contribution of TSO
2006• 1 month contribution of RTM1 and RTM2• 9 months contribution of Munirah
• Brazil: new corporate structure under the holding Company Terna Participações(now owned at 66%)
Impact of one-off items:
2005• Revenues:
– Reversal of 2004 revenues and provisions on energy items (+35mn) – -5mn reclassification for IAS purposes(1)
2006• Revenues:
– Integration of 2005 revenues (+48mn)• Financial items
– Net capital gain on IPO (31.4mn)
8
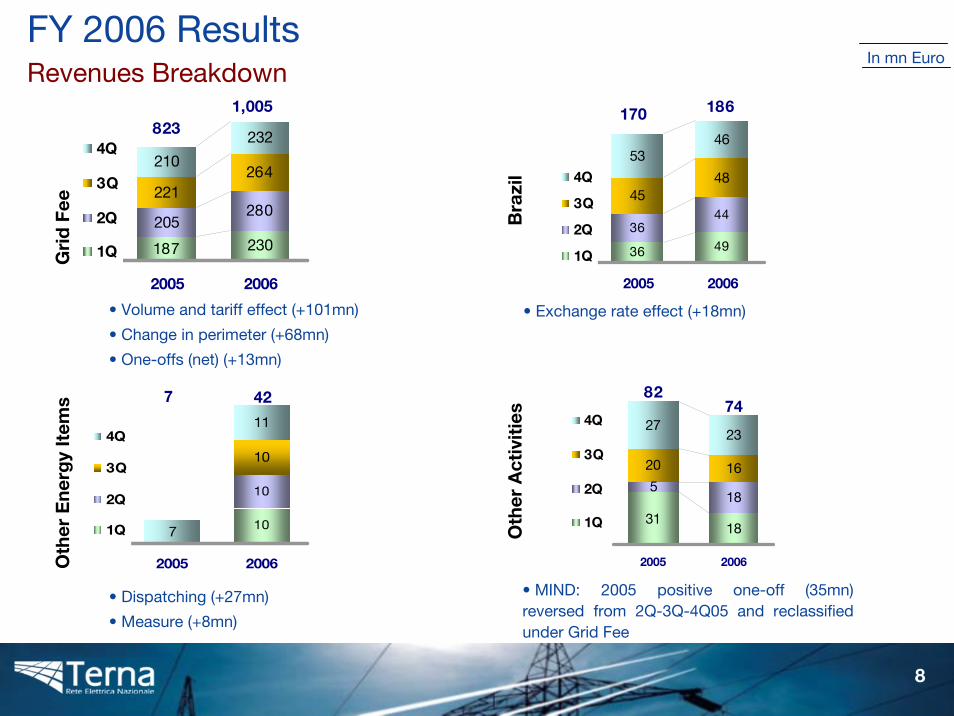
187 230
205280
221264
210
232
2005 2006
4Q
3Q
2Q
1Q
• Dispatching (+27mn)
• Measure (+8mn)
• Volume and tariff effect (+101mn)
• Change in perimeter (+68mn)
• One-offs (net) (+13mn)
FY 2006 ResultsRevenues Breakdown
Gri
d F
eeO
ther
Ene
rgy
Item
s
Bra
zil
Oth
er A
ctiv
itie
s
• Exchange rate effect (+18mn)
In mn Euro
8231,005
36 4936
4445
48
5346
2005 2006
4Q
3Q
2Q
1Q
10
10
10
7
11
2005 2006
4Q
3Q
2Q
1Q 18
518
20 16
2723
31
2005 2006
4Q
3Q
2Q
1Q
• MIND: 2005 positive one-off (35mn) reversed from 2Q-3Q-4Q05 and reclassified under Grid Fee
170 186
8274427
9
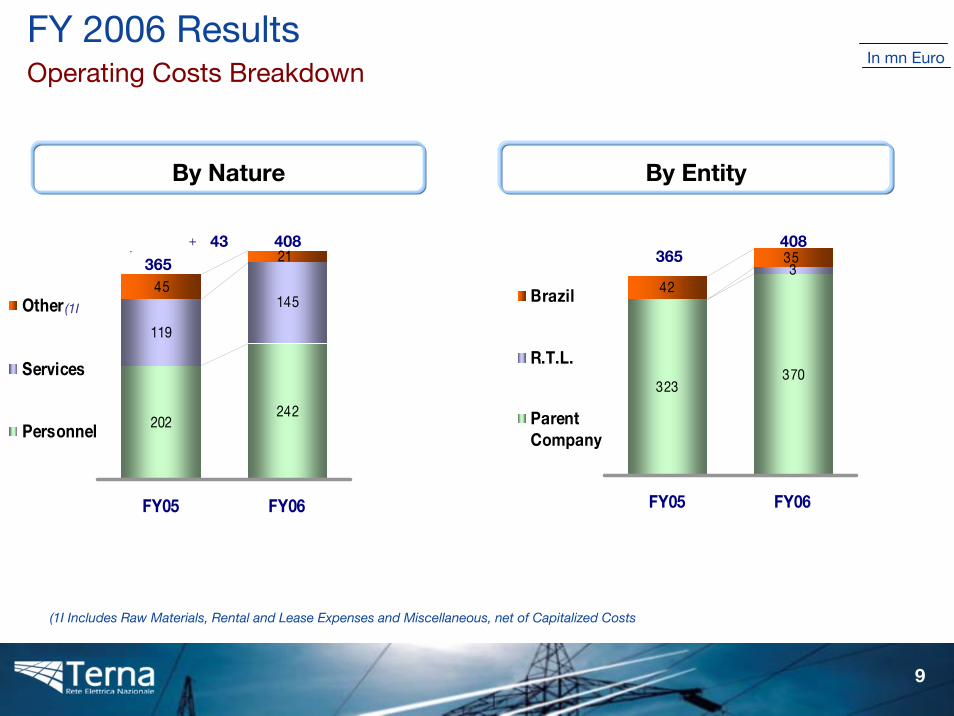
202242
145
119
45
21
FY05 FY06
Other
Services
Personnel
(1I Includes Raw Materials, Rental and Lease Expenses and Miscellaneous, net of Capitalized Costs
FY 2006 ResultsOperating Costs Breakdown
By Nature By Entity
In mn Euro
365408
(1I
43+
323370
335
42
FY05 FY06
Brazil
R.T.L.
ParentCompany
365408
10
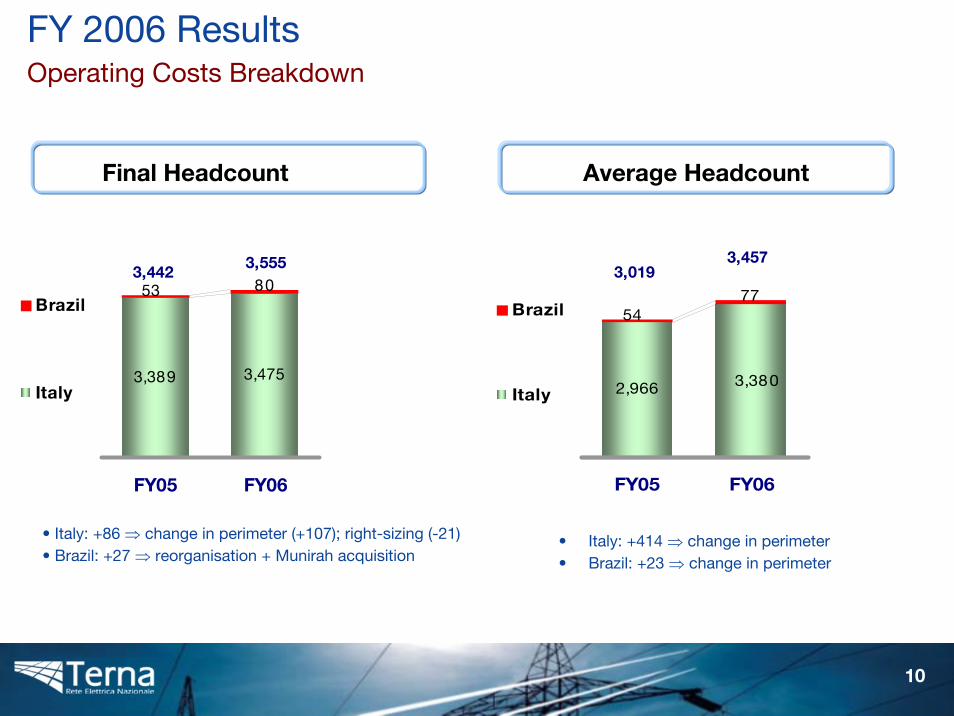
FY 2006 ResultsOperating Costs Breakdown
Final Headcount Average Headcount
3,389 3,475
8053
FY05 FY06
Brazil
Italy
3,442 3,555
2,966 3,380
5477
FY05 FY06
Brazil
Italy
3,019 3,457
• Italy: +414 ⇒ change in perimeter • Brazil: +23 ⇒ change in perimeter
• Italy: +86 ⇒ change in perimeter (+107); right-sizing (-21) • Brazil: +27 ⇒ reorganisation + Munirah acquisition
11
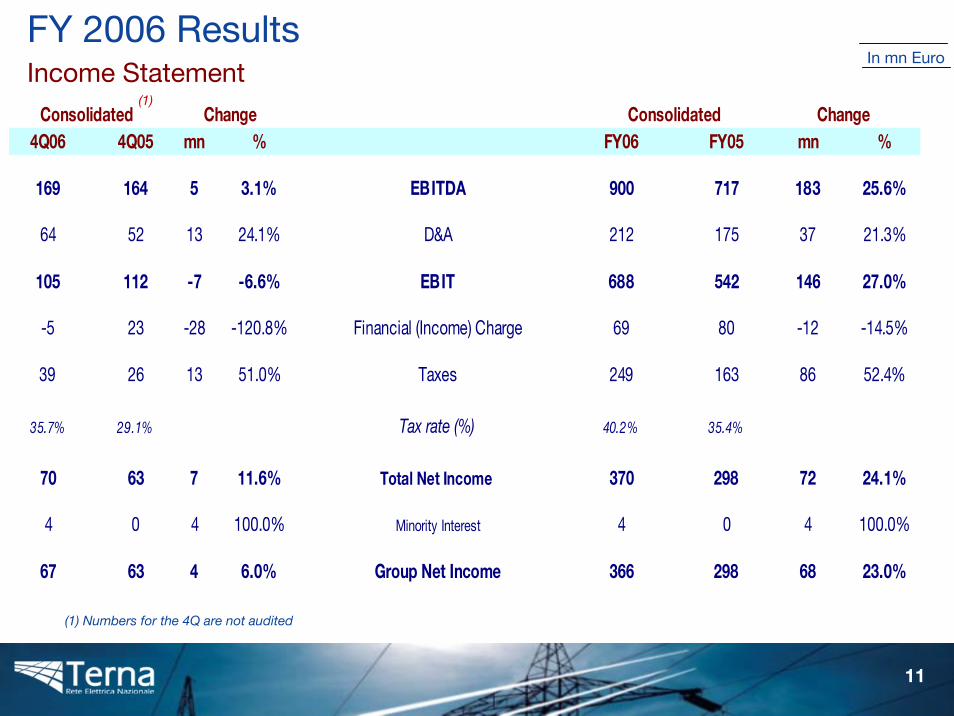
4Q06 4Q05 mn % FY06 FY05 mn %
169 164 5 3.1% EBITDA 900 717 183 25.6%
64 52 13 24.1% D&A 212 175 37 21.3%
105 112 -7 -6.6% EBIT 688 542 146 27.0%
-5 23 -28 -120.8% Financial (Income) Charge 69 80 -12 -14.5%
39 26 13 51.0% Taxes 249 163 86 52.4%
35.7% 29.1% Tax rate (%) 40.2% 35.4%
70 63 7 11.6% Total Net Income 370 298 72 24.1%
4 0 4 100.0% Minority Interest 4 0 4 100.0%
67 63 4 6.0% Group Net Income 366 298 68 23.0%
Consolidated Change Consolidated Change
In mn EuroFY 2006 ResultsIncome Statement
(1)
(1) Numbers for the 4Q are not audited
12
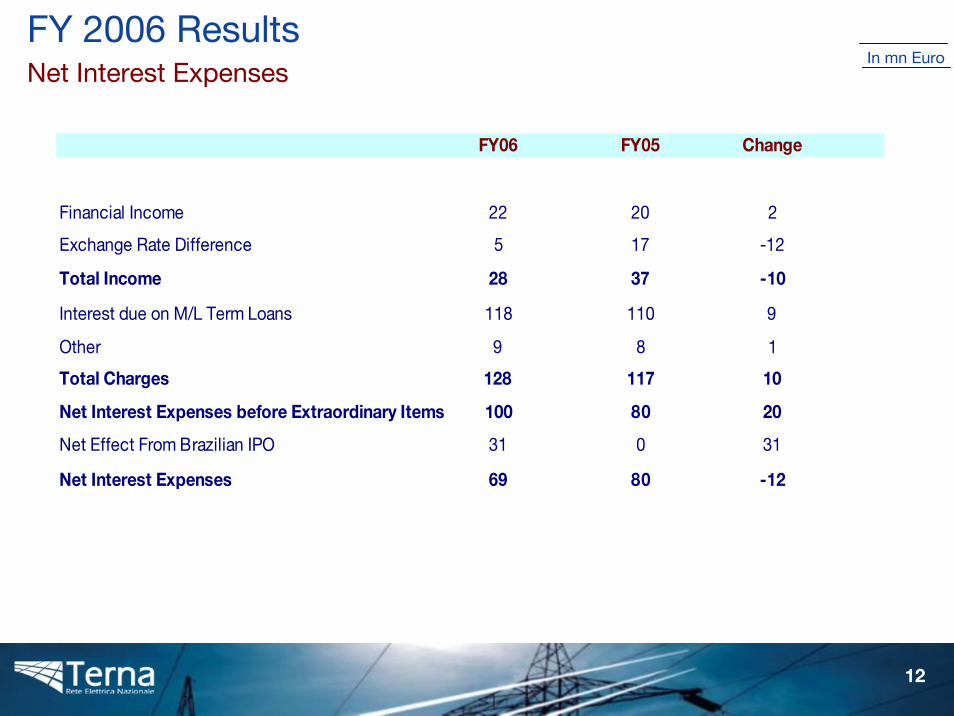
FY 2006 ResultsNet Interest Expenses
In mn Euro
FY06 FY05 Change
Financial Income 22 20 2
Exchange Rate Difference 5 17 -12
Total Income 28 37 -10
Interest due on M/L Term Loans 118 110 9
Other 9 8 1
Total Charges 128 117 10
Net Interest Expenses before Extraordinary Items 100 80 20
Net Effect From Brazilian IPO 31 0 31
Net Interest Expenses 69 80 -12
13
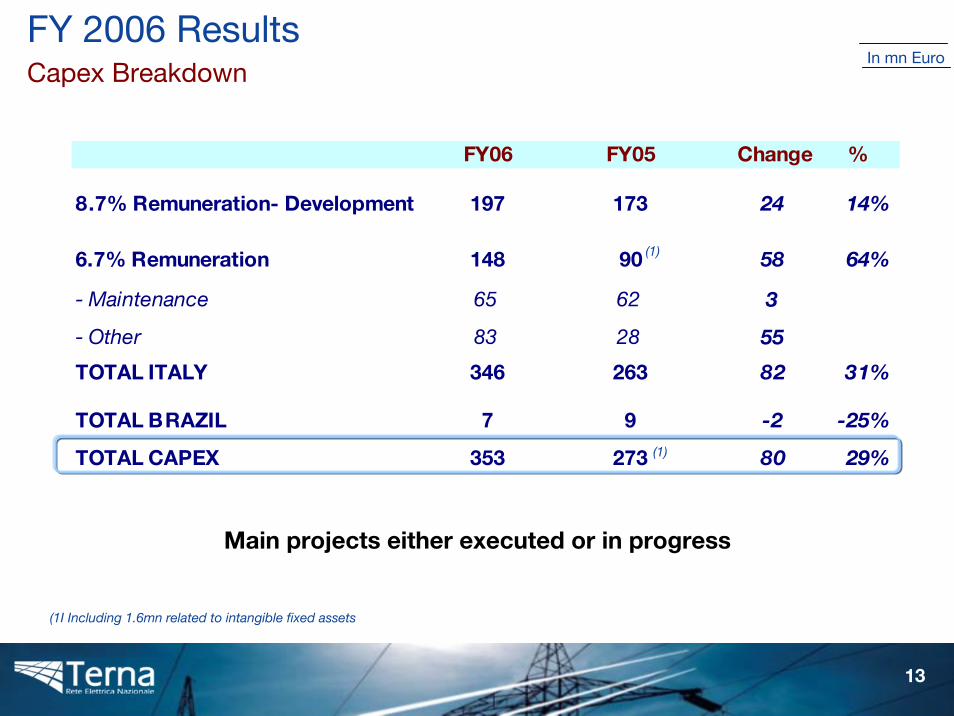
FY06 FY05 Change %
8.7% Remuneration- Development 197 173 24 14%
6.7% Remuneration 148 90 58 64%
- Maintenance 65 62 3
- Other 83 28 55
TOTAL ITALY 346 263 82 31%
TOTAL BRAZIL 7 9 -2 -25%
TOTAL CAPEX 353 273 80 29%
FY 2006 ResultsCapex Breakdown
In mn Euro
(1I Including 1.6mn related to intangible fixed assets
(1)
(1)
Main projects either executed or in progress
14
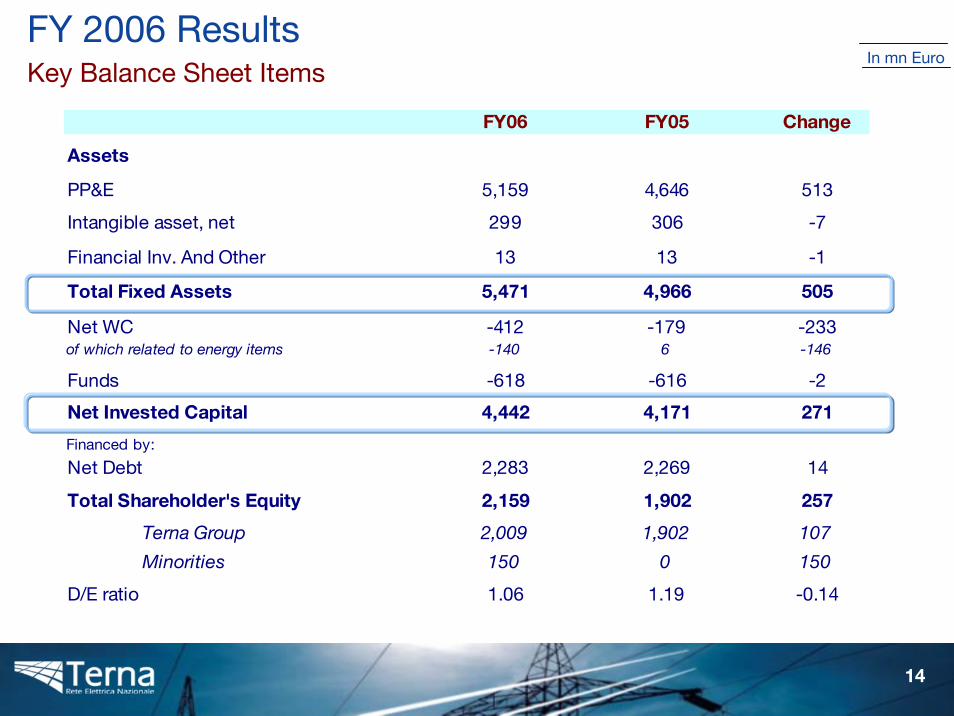
FY06 FY05 Change
Assets
PP&E 5,159 4,646 513
Intangible asset, net 299 306 -7
Financial Inv. And Other 13 13 -1
Total Fixed Assets 5,471 4,966 505
Net WC -412 -179 -233of which related to energy items -140 6 -146
Funds -618 -616 -2
Net Invested Capital 4,442 4,171 271
Financed by:
Net Debt 2,283 2,269 14
Total Shareholder's Equity 2,159 1,902 257
Terna Group 2,009 1,902 107
Minorities 150 0 150
D/E ratio 1.06 1.19 -0.14
FY 2006 ResultsKey Balance Sheet Items
In mn Euro
15
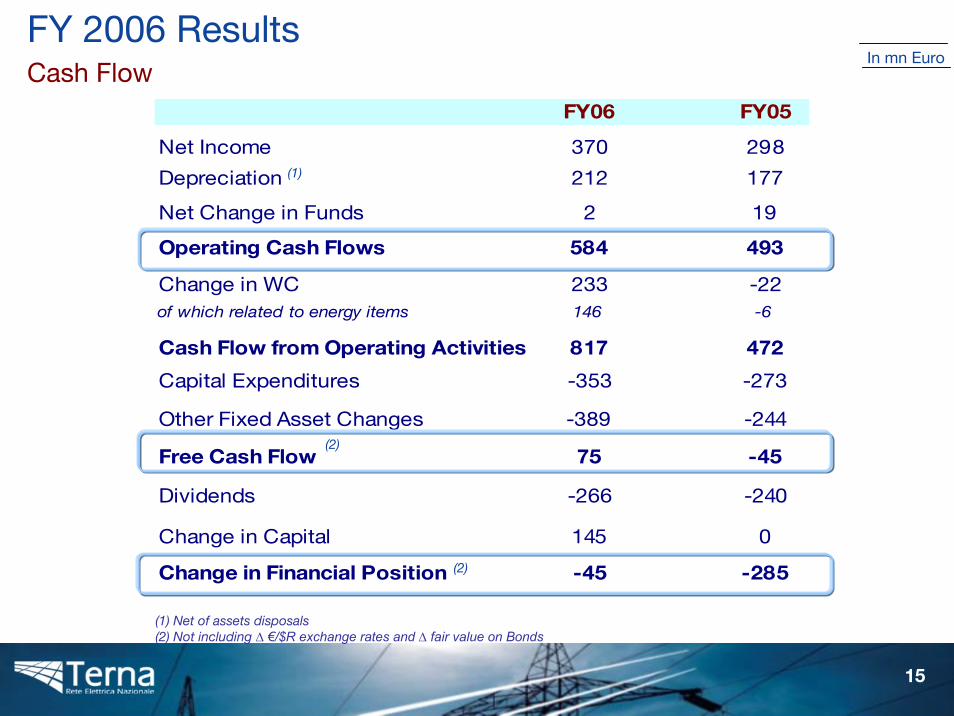
FY06 FY05
Net Income 370 298
Depreciation 212 177
Net Change in Funds 2 19
Operating Cash Flows 584 493
Change in WC 233 -22of which related to energy items 146 -6
Cash Flow from Operating Activities 817 472
Capital Expenditures -353 -273
Other Fixed Asset Changes -389 -244
Free Cash Flow 75 -45
Dividends -266 -240
Change in Capital 145 0
Change in Financial Position -45 -285
FY 2006 ResultsCash Flow
(1) Net of assets disposals(2) Not including ∆ €/$R exchange rates and ∆ fair value on Bonds
(1)
(2)
(2)
In mn Euro
16
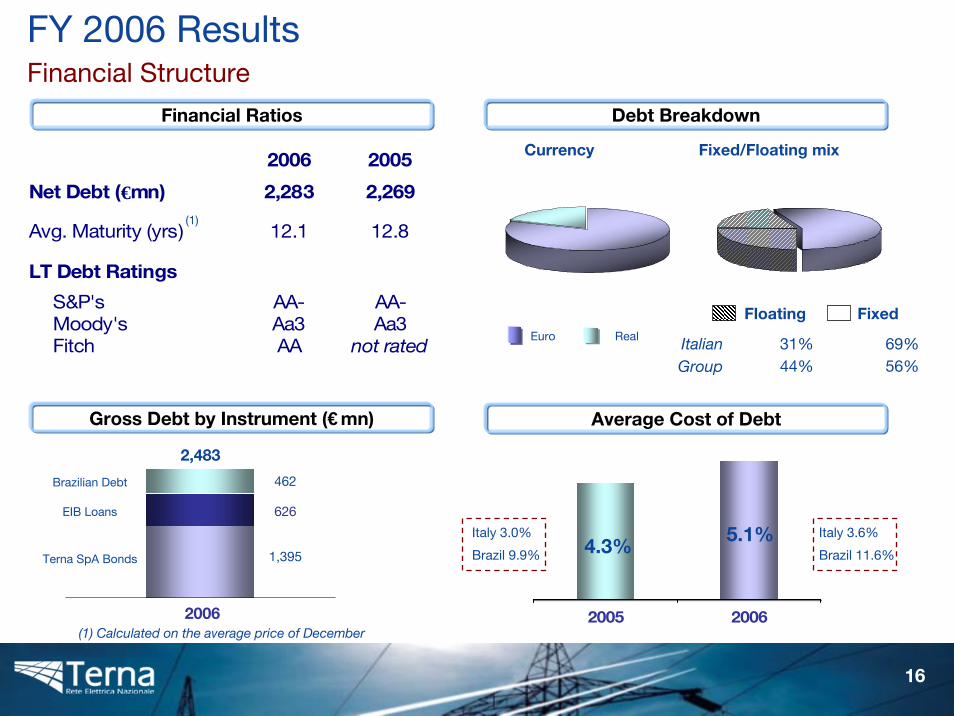
2005 2006
Average Cost of Debt
30/09/2006
Terna SpA Bonds
2006
2,483
FY 2006 ResultsFinancial Structure
Financial Ratios
1,395
626
462
Currency Fixed/Floating mix
Floating Fixed
ItalianGroup 44%
31%56%69%
EIB Loans
Brazilian Debt
5.1%4.3%
Italy 3.0%
Brazil 9.9%
Italy 3.6%
Brazil 11.6%
Gross Debt by Instrument (€mn)
Debt Breakdown
(1) Calculated on the average price of December
(1)
2006 2005
Net Debt (€mn) 2,283 2,269
Avg. Maturity (yrs) 12.1 12.8
LT Debt Ratings
S&P's AA- AA-Moody's Aa3 Aa3Fitch AA not rated
Euro Real
17
Agenda
Highlights
FY06 Results
Dividends and Closing Remarks
Annexes
18
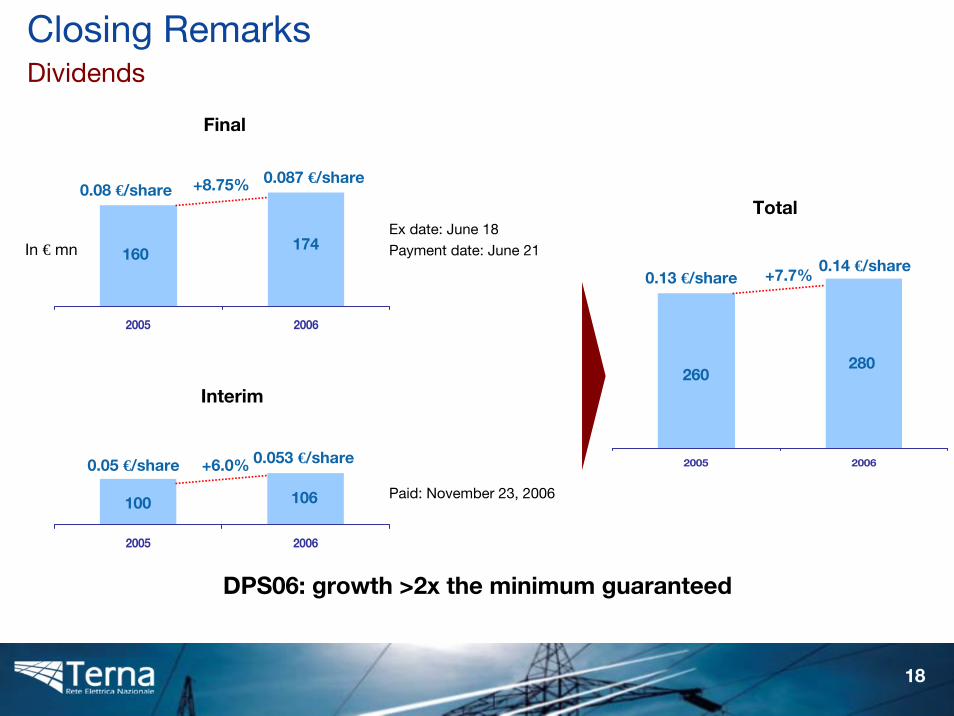
2005 2006
2005 2006
2005 2006
DPS06: growth >2x the minimum guaranteed
In € mn
+6.0%
100 106
Interim
+8.75%
160174
Final
+7.7%
260280
Closing RemarksDividends
Ex date: June 18Payment date: June 21
Total0.08 €/share
0.087 €/share
0.05 €/share 0.053 €/share
0.13 €/share0.14 €/share
Paid: November 23, 2006
19
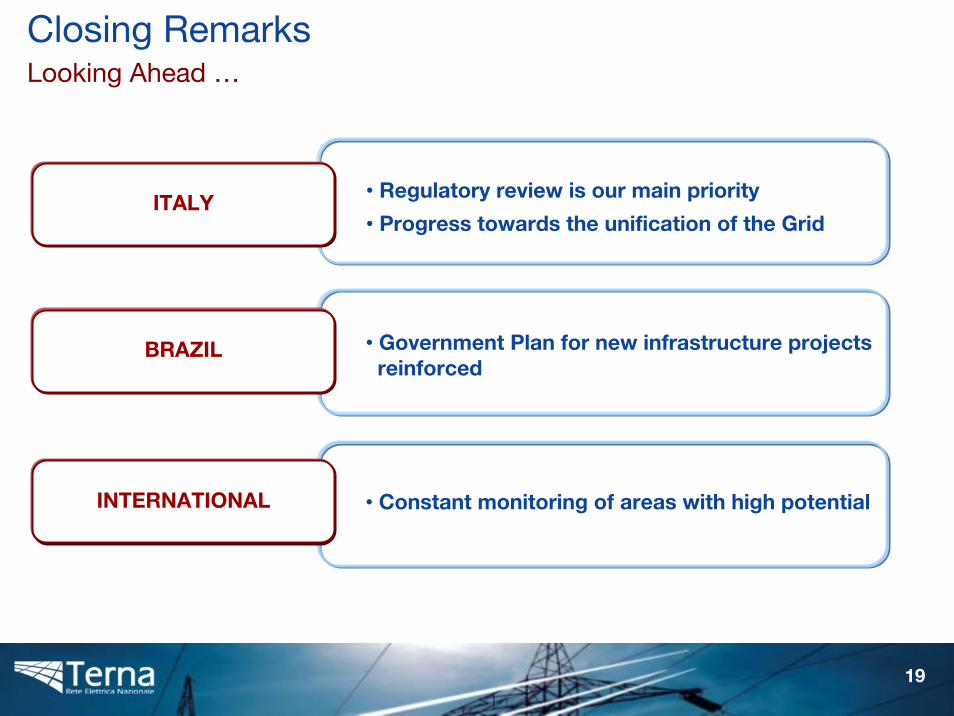
Closing RemarksLooking Ahead …
ITALY • Regulatory review is our main priority
• Progress towards the unification of the Grid
• Government Plan for new infrastructure projectsreinforced
BRAZIL
• Constant monitoring of areas with high potentialINTERNATIONAL
20
Agenda
Highlights
FY06 Results
Dividends and Closing Remarks
Annexes
21
JAN FEB MAR APR MAY JUNE JULY AUG SEPT OCT NOV DEC
2004 2005 2006
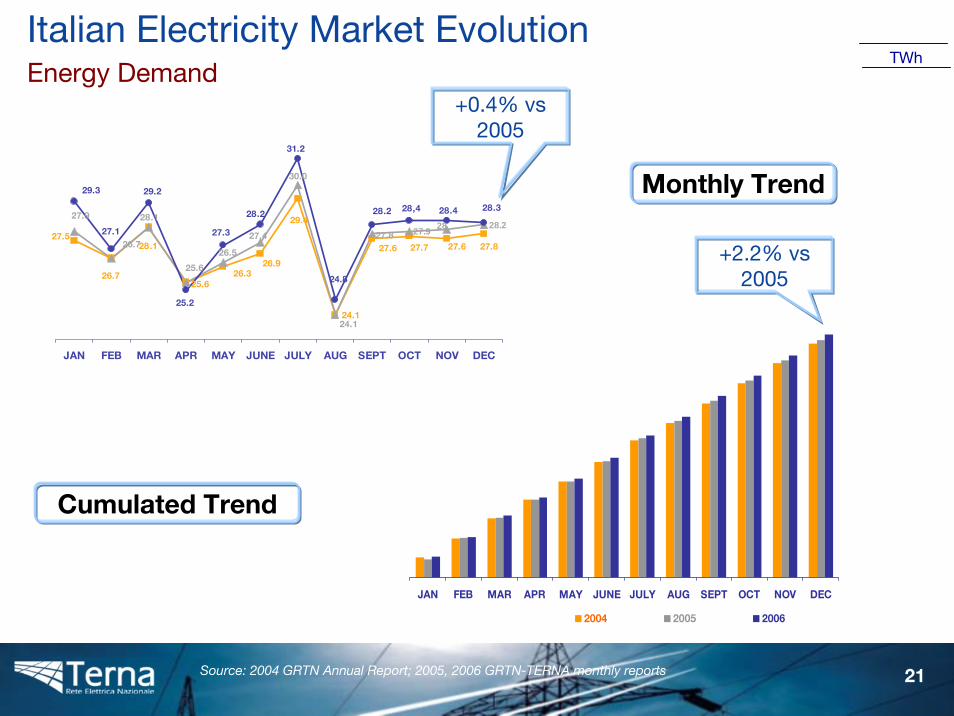
Monthly Trend
Cumulated Trend
TWh
Source: 2004 GRTN Annual Report; 2005, 2006 GRTN-TERNA monthly reports
Italian Electricity Market EvolutionEnergy Demand
+0.4% vs 2005
+2.2% vs 2005
29.4
24.1
27.827.627.727.627.5
26.7
28.1
25.626.3
26.9
28.227.9 2827.8
24.1
27.4
30.0
26.5
25.6
26.7
27.9 28.128.328.428,4
31.2
29.2
28.2
24.8
28.2
27.3
25.2
29.3
27.1
JAN FEB MAR APR MAY JUNE JULY AUG SEPT OCT NOV DEC
22
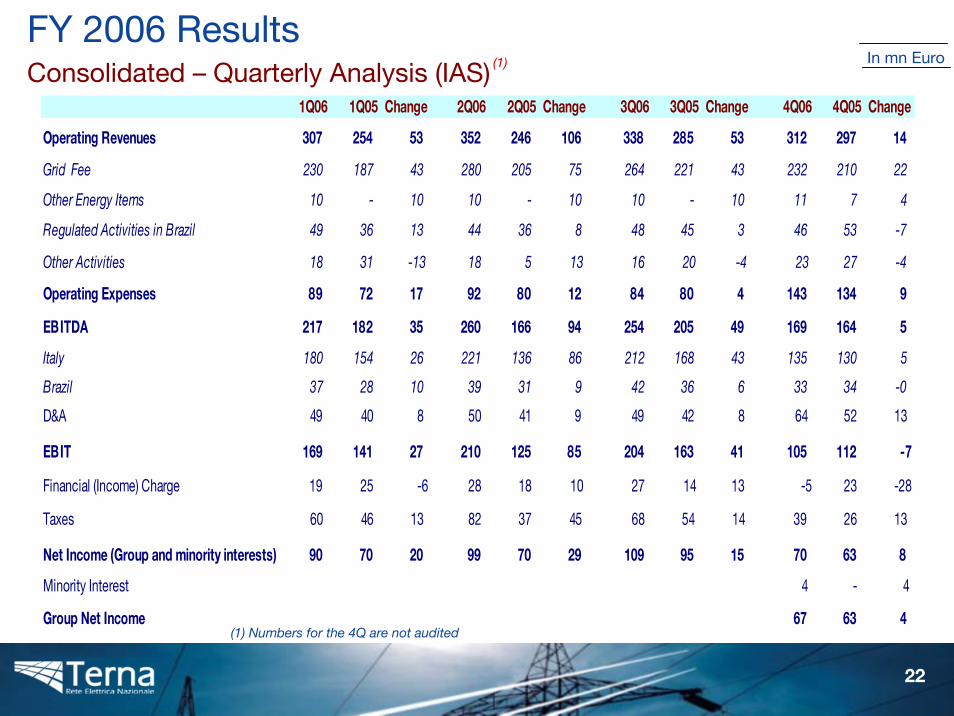
FY 2006 Results Consolidated – Quarterly Analysis (IAS)
In mn Euro
1Q06 1Q05 Change 2Q06 2Q05 Change 3Q06 3Q05 Change 4Q06 4Q05 Change
Operating Revenues 307 254 53 352 246 106 338 285 53 312 297 14
Grid Fee 230 187 43 280 205 75 264 221 43 232 210 22
Other Energy Items 10 - 10 10 - 10 10 - 10 11 7 4
Regulated Activities in Brazil 49 36 13 44 36 8 48 45 3 46 53 -7
Other Activities 18 31 -13 18 5 13 16 20 -4 23 27 -4
Operating Expenses 89 72 17 92 80 12 84 80 4 143 134 9
EBITDA 217 182 35 260 166 94 254 205 49 169 164 5
Italy 180 154 26 221 136 86 212 168 43 135 130 5
Brazil 37 28 10 39 31 9 42 36 6 33 34 -0
D&A 49 40 8 50 41 9 49 42 8 64 52 13
EBIT 169 141 27 210 125 85 204 163 41 105 112 -7
Financial (Income) Charge 19 25 -6 28 18 10 27 14 13 -5 23 -28
Taxes 60 46 13 82 37 45 68 54 14 39 26 13
Net Income (Group and minority interests) 90 70 20 99 70 29 109 95 15 70 63 8
Minority Interest 4 - 4
Group Net Income 67 63 4 (1) Numbers for the 4Q are not audited
(1)
23
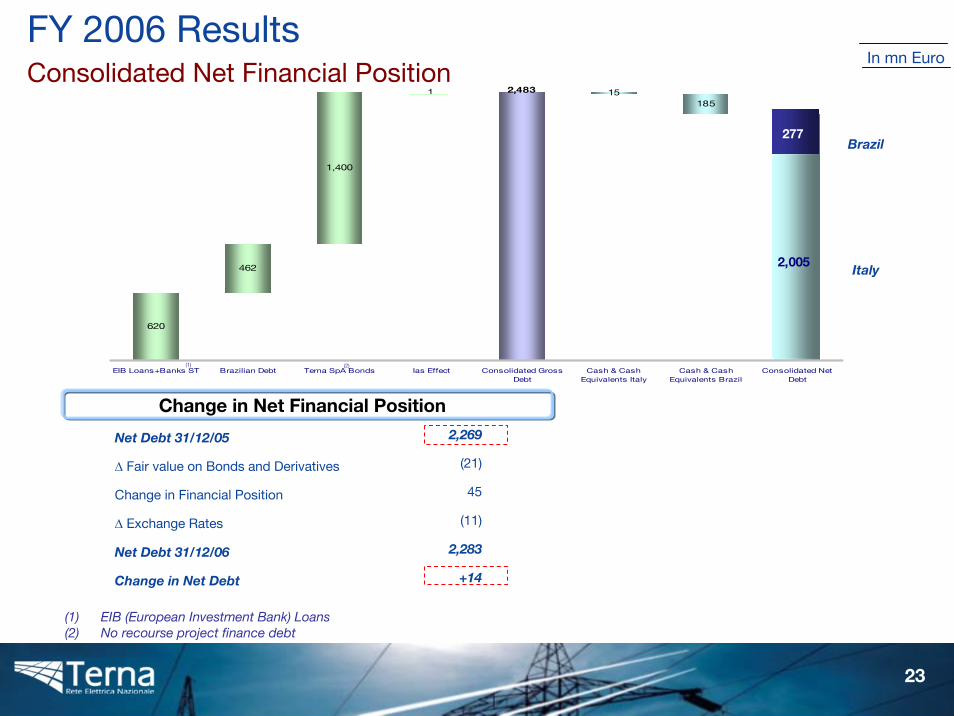
620
462
1,400
1 15185
2,483
2,283
EIB Loans+Banks ST Brazilian Debt Terna SpA Bonds Ias Effect Consolidated GrossDebt
Cash & CashEquivalents Italy
Cash & CashEquivalents Brazil
Consolidated NetDebt
Brazil
FY 2006 ResultsConsolidated Net Financial Position
(1)
(1) EIB (European Investment Bank) Loans (2) No recourse project finance debt
Change in Net Financial Position
Net Debt 31/12/05
∆ Fair value on Bonds and Derivatives
Change in Financial Position
∆ Exchange Rates
Net Debt 31/12/06
Change in Net Debt
2,269
(21)
45
(11)
2,283
+14
Italy
(2)
In mn Euro
277
2,005
24
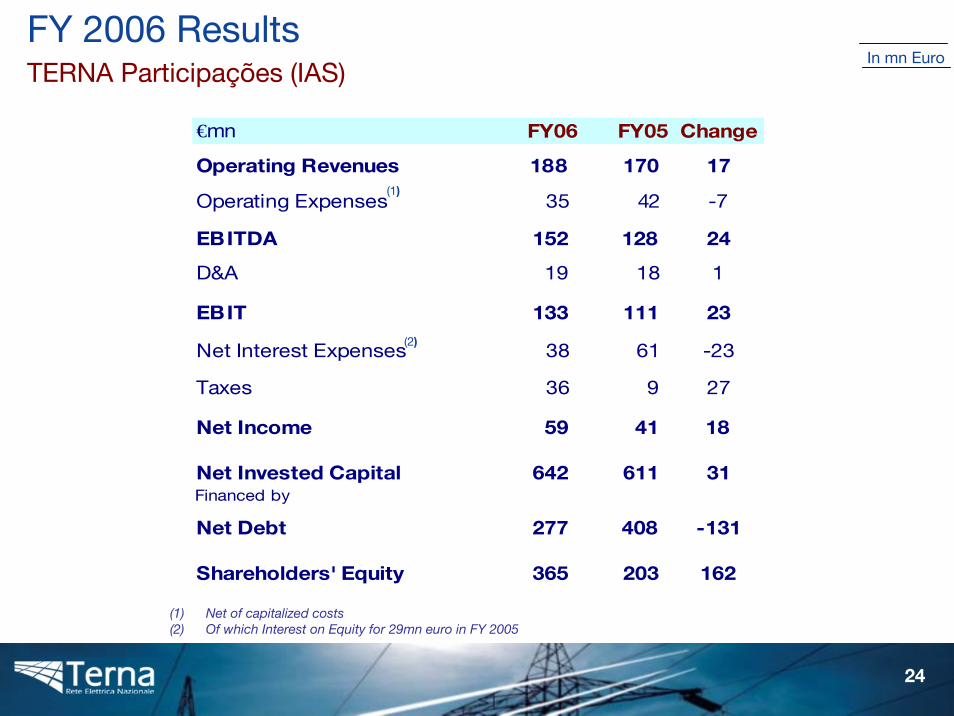
€mn FY06 FY05 Change
Operating Revenues 188 170 17
Operating Expenses 35 42 -7
EBITDA 152 128 24
D&A 19 18 1
EBIT 133 111 23
Net Interest Expenses 38 61 -23
Taxes 36 9 27
Net Income 59 41 18
Net Invested Capital 642 611 31Financed by
Net Debt 277 408 -131
Shareholders' Equity 365 203 162
(1) Net of capitalized costs(2) Of which Interest on Equity for 29mn euro in FY 2005
In mn EuroFY 2006 ResultsTERNA Participações (IAS)
(1)
(2)
25
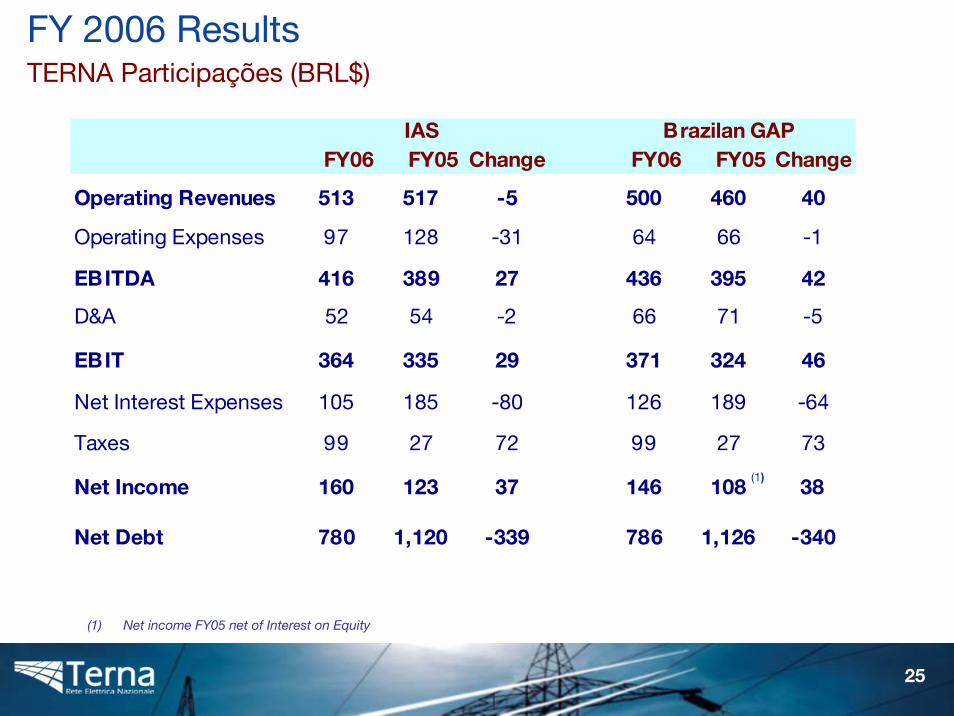
FY06 FY05 Change FY06 FY05 Change
Operating Revenues 513 517 -5 500 460 40
Operating Expenses 97 128 -31 64 66 -1
EBITDA 416 389 27 436 395 42
D&A 52 54 -2 66 71 -5
EBIT 364 335 29 371 324 46
Net Interest Expenses 105 185 -80 126 189 -64
Taxes 99 27 72 99 27 73
Net Income 160 123 37 146 108 38
Net Debt 780 1,120 -339 786 1,126 -340
IAS Brazilan GAP
(1)
FY 2006 ResultsTERNA Participações (BRL$)
(1) Net income FY05 net of Interest on Equity
26
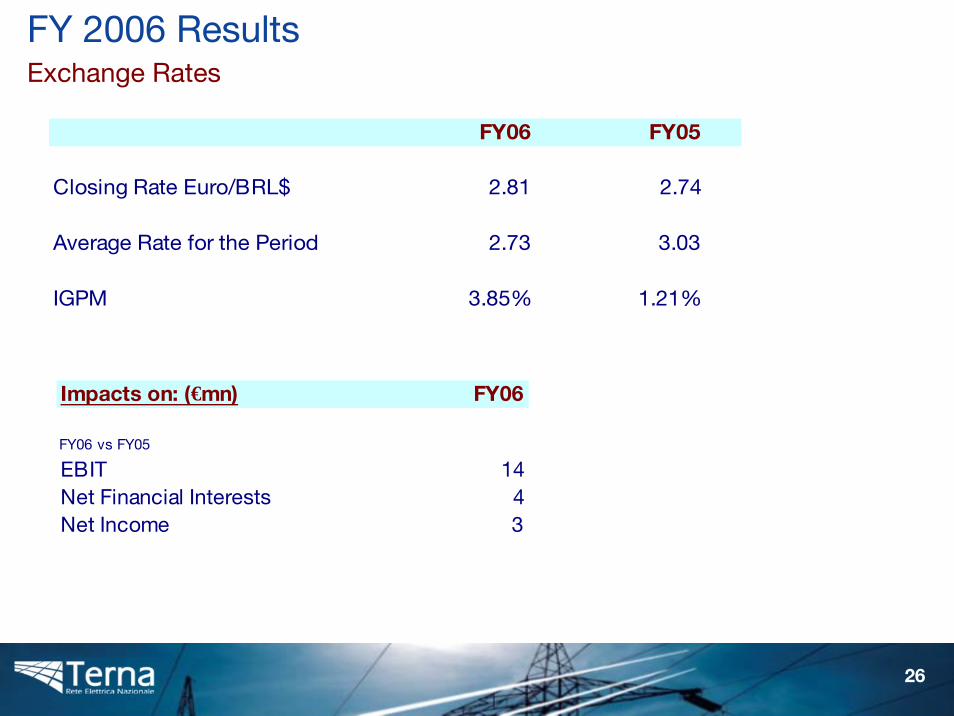
Impacts on: (€mn) FY06
FY06 vs FY05
EBIT 14Net Financial Interests 4Net Income 3
FY06 FY05
Closing Rate Euro/BRL$ 2.81 2.74
Average Rate for the Period 2.73 3.03
IGPM 3.85% 1.21%
FY 2006 ResultsExchange Rates
Disclaimer
THIS DOCUMENT HAS BEEN PREPARED BY TERNA S.P.A. (THE “COMPANY”) FOR THE SOLE PURPOSE DESCRIBED HEREIN. IN NO CASE MAY IT BE INTERPRETED AS AN OFFER OR INVITATION TO SELL OR PURCHASE ANY SECURITY ISSUED BY THE COMPANY OR ITS SUBSIDIARIES.
THE CONTENT OF THIS DOCUMENT HAS A MERELY INFORMATIVE AND PROVISIONAL NATURE AND THE STATEMENTS CONTAINED HEREIN HAVE NOT BEEN INDEPENDENTLY VERIFIED. NEITHER THE COMPANY NOR ANY OF ITS REPRESENTATIVES SHALL ACCEPT ANY LIABILITY WHATSOEVER (WHETHER IN NEGLIGENCE OR OTHERWISE) ARISING IN ANY WAY FROM THE USE OF THIS DOCUMENT.
THIS DOCUMENT MAY NOT BE REPRODUCED OR REDISTRIBUTED, IN WHOLE OR IN PART, TO ANY OTHER PERSON. THE INFORMATION CONTAINED HEREIN AND OTHER MATERIAL DISCUSSED AT THE CONFERENCE CALL MAY INCLUDE FORWARD-LOOKING STATEMENTS THAT ARE NOT HISTORICAL FACTS, INCLUDING STATEMENTS ABOUT THE COMPANY’S BELIEFS AND EXPECTATIONS. THESE STATEMENTS ARE BASED ON CURRENT PLANS, ESTIMATES AND PROJECTIONS, AND PROJECTS.
HOWEVER, FORWARD-LOOKING STATEMENTS INVOLVE INHERENT RISKS AND UNCERTAINTIES. WE CAUTION YOU THAT A NUMBER OF FACTORS COULD CAUSE THE COMPANY’S ACTUAL RESULTS TO DIFFER MATERIALLY FROM THOSE CONTAINED IN ANY FORWARD-LOOKING STATEMENT. SUCH FACTORS INCLUDE, BUT ARE NOT LIMITED TO: TRENDS IN COMPANY’S BUSINESS, ITS ABILITY TO IMPLEMENT COST-CUTTING PLANS, CHANGES IN THE REGULATORY ENVIRONMENT, ITS ABILITY TO SUCCESSFULLY DIVERSIFY AND THE EXPECTED LEVEL OF FUTURE CAPITAL EXPENDITURES. THEREFORE, YOU SHOULD NOT PLACE UNDUE RELIANCE ON SUCH FORWARD-LOOKING STATEMENTS.