Embed Size (px)
Citation preview

FLASH 128 : BUSINESS SURVEY - 2002
ECHANTILLON D'ENTREPRISES : PAYS COUVERTS PAR LE SONDAGE BUSINESSES SAMPLE : COUNTRIES COVERED BY THE SURVEY
*** RESULTS ARE WEIGHTED : N. of enterprises in the E.U. +----------------------------------------------------------------------------------------------------------------------------------------------------------------+ ¦ ¦ TOTAL ¦ SECTORS ¦ SIZE CATEGORIES ¦ EU COUNTRIES ACTIVITY ¦ COMPANY STATUS ¦ INTERVIEWED ¦ ¦ +-------+-------------------------------+-----------------------+-----------------------+-----------------------+---------------¦ ¦ ¦ EU 15 ¦Constru¦Indus ¦Trade ¦Servi ¦SME ¦SME ¦MAJORS ¦None ¦1-5 EU ¦6&+ EU ¦Indepen¦Mother ¦Member ¦General¦Mktg-Sa¦ ¦ ¦ ¦ction ¦try ¦ ¦ces ¦10-49 ¦50-249 ¦250+ ¦ ¦countr.¦countr.¦dant ¦Cy ¦group ¦Manager¦les Man¦ +--------------------------------+-------+-------+-------+-------+-------+-------+-------+-------+-------+-------+-------+-------+-------+-------+-------+-------¦ ¦UNWEIGHTED BASE : ..............¦ 2899 ¦ 331 ¦ 905 ¦ 802 ¦ 861 ¦ 1815 ¦ 637 ¦ 447 ¦ 2044 ¦ 526 ¦ 329 ¦ 2398 ¦ 133 ¦ 368 ¦ 1417 ¦ 1482 ¦ ¦................................¦100.0% ¦100.0% ¦100.0% ¦100.0% ¦100.0% ¦100.0% ¦100.0% ¦100.0% ¦100.0% ¦100.0% ¦100.0% ¦100.0% ¦100.0% ¦100.0% ¦100.0% ¦100.0% ¦ +--------------------------------+-------+-------+-------+-------+-------+-------+-------+-------+-------+-------+-------+-------+-------+-------+-------+-------¦ ¦Belgium.........................¦ 60 ¦ 8 ¦ 16 ¦ 21 ¦ 15 ¦ 50 ¦ 8 ¦ 2 ¦ 39 ¦ 11 ¦ 9 ¦ 46 ¦ 3 ¦ 11 ¦ 24 ¦ 36 ¦ ¦................................¦ 2.1% ¦ 1.9% ¦ 1.9% ¦ 2.8% ¦ 1.7% ¦ 2.0% ¦ 2.2% ¦ 3.0% ¦ 1.8% ¦ 2.4% ¦ 3.7% ¦ 1.8% ¦ 3.8% ¦ 4.5% ¦ 1.4% ¦ 2.9% ¦ +--------------------------------+-------+-------+-------+-------+-------+-------+-------+-------+-------+-------+-------+-------+-------+-------+-------+-------¦ ¦Denmark.........................¦ 38 ¦ 6 ¦ 12 ¦ 13 ¦ 7 ¦ 32 ¦ 5 ¦ 1 ¦ 32 ¦ 5 ¦ 1 ¦ 33 ¦ 1 ¦ 4 ¦ 15 ¦ 23 ¦ ¦................................¦ 1.3% ¦ 1.5% ¦ 1.4% ¦ 1.7% ¦ .9% ¦ 1.3% ¦ 1.6% ¦ 1.3% ¦ 1.4% ¦ 1.1% ¦ .6% ¦ 1.3% ¦ 1.1% ¦ 1.8% ¦ .9% ¦ 1.9% ¦ +--------------------------------+-------+-------+-------+-------+-------+-------+-------+-------+-------+-------+-------+-------+-------+-------+-------+-------¦ ¦Germany.........................¦ 906 ¦ 163 ¦ 200 ¦ 205 ¦ 338 ¦ 780 ¦ 98 ¦ 28 ¦ 608 ¦ 231 ¦ 67 ¦ 828 ¦ 11 ¦ 67 ¦ 626 ¦ 280 ¦ ¦................................¦ 31.3% ¦ 39.6% ¦ 23.2% ¦ 26.7% ¦ 39.3% ¦ 31.6% ¦ 28.5% ¦ 33.6% ¦ 27.9% ¦ 48.2% ¦ 27.7% ¦ 32.1% ¦ 14.2% ¦ 27.5% ¦ 37.4% ¦ 22.9% ¦ +--------------------------------+-------+-------+-------+-------+-------+-------+-------+-------+-------+-------+-------+-------+-------+-------+-------+-------¦ ¦Greece..........................¦ 41 ¦ 11 ¦ 14 ¦ 10 ¦ 6 ¦ 35 ¦ 5 ¦ 1 ¦ 37 ¦ 3 ¦ 1 ¦ 39 ¦ 0 ¦ 2 ¦ 27 ¦ 14 ¦ ¦................................¦ 1.4% ¦ 2.7% ¦ 1.6% ¦ 1.3% ¦ .7% ¦ 1.4% ¦ 1.5% ¦ .7% ¦ 1.7% ¦ .5% ¦ .6% ¦ 1.5% ¦ .1% ¦ .9% ¦ 1.6% ¦ 1.1% ¦ +--------------------------------+-------+-------+-------+-------+-------+-------+-------+-------+-------+-------+-------+-------+-------+-------+-------+-------¦ ¦Spain...........................¦ 284 ¦ 49 ¦ 90 ¦ 82 ¦ 63 ¦ 248 ¦ 31 ¦ 6 ¦ 258 ¦ 22 ¦ 4 ¦ 244 ¦ 19 ¦ 22 ¦ 103 ¦ 182 ¦ ¦................................¦ 9.8% ¦ 11.8% ¦ 10.5% ¦ 10.7% ¦ 7.4% ¦ 10.0% ¦ 8.9% ¦ 7.4% ¦ 11.8% ¦ 4.7% ¦ 1.8% ¦ 9.4% ¦ 25.4% ¦ 8.8% ¦ 6.1% ¦ 14.8% ¦ +--------------------------------+-------+-------+-------+-------+-------+-------+-------+-------+-------+-------+-------+-------+-------+-------+-------+-------¦ ¦Finland.........................¦ 28 ¦ 3 ¦ 9 ¦ 8 ¦ 8 ¦ 23 ¦ 4 ¦ 1 ¦ 26 ¦ 1 ¦ 1 ¦ 27 ¦ 0 ¦ 1 ¦ 28 ¦ 0 ¦ ¦................................¦ 1.0% ¦ .8% ¦ 1.1% ¦ 1.0% ¦ 1.0% ¦ .9% ¦ 1.2% ¦ 1.5% ¦ 1.2% ¦ .2% ¦ .4% ¦ 1.0% ¦ .2% ¦ .5% ¦ 1.7% ¦ .0% ¦ +--------------------------------+-------+-------+-------+-------+-------+-------+-------+-------+-------+-------+-------+-------+-------+-------+-------+-------¦ ¦France..........................¦ 358 ¦ 49 ¦ 102 ¦ 102 ¦ 105 ¦ 297 ¦ 50 ¦ 11 ¦ 299 ¦ 26 ¦ 33 ¦ 317 ¦ 8 ¦ 33 ¦ 202 ¦ 155 ¦ ¦................................¦ 12.3% ¦ 11.9% ¦ 11.8% ¦ 13.3% ¦ 12.2% ¦ 12.0% ¦ 14.6% ¦ 13.5% ¦ 13.7% ¦ 5.4% ¦ 13.6% ¦ 12.3% ¦ 10.2% ¦ 13.4% ¦ 12.1% ¦ 12.7% ¦ +--------------------------------+-------+-------+-------+-------+-------+-------+-------+-------+-------+-------+-------+-------+-------+-------+-------+-------¦ ¦Ireland.........................¦ 25 ¦ 2 ¦ 6 ¦ 10 ¦ 7 ¦ 24 ¦ 1 ¦ 0 ¦ 20 ¦ 5 ¦ 1 ¦ 23 ¦ 1 ¦ 1 ¦ 12 ¦ 13 ¦ ¦................................¦ .9% ¦ .5% ¦ .7% ¦ 1.3% ¦ .8% ¦ 1.0% ¦ .3% ¦ .2% ¦ .9% ¦ 1.0% ¦ .2% ¦ .9% ¦ 1.5% ¦ .5% ¦ .7% ¦ 1.0% ¦ +--------------------------------+-------+-------+-------+-------+-------+-------+-------+-------+-------+-------+-------+-------+-------+-------+-------+-------¦ ¦Italy...........................¦ 395 ¦ 44 ¦ 212 ¦ 78 ¦ 61 ¦ 354 ¦ 35 ¦ 6 ¦ 249 ¦ 86 ¦ 60 ¦ 357 ¦ 17 ¦ 21 ¦ 250 ¦ 145 ¦ ¦................................¦ 13.6% ¦ 10.8% ¦ 24.7% ¦ 10.1% ¦ 7.1% ¦ 14.3% ¦ 10.3% ¦ 6.8% ¦ 11.4% ¦ 18.1% ¦ 24.5% ¦ 13.9% ¦ 22.3% ¦ 8.4% ¦ 14.9% ¦ 11.8% ¦ +--------------------------------+-------+-------+-------+-------+-------+-------+-------+-------+-------+-------+-------+-------+-------+-------+-------+-------¦ ¦Luxembourg......................¦ 6 ¦ 1 ¦ 1 ¦ 2 ¦ 2 ¦ 5 ¦ 1 ¦ 0 ¦ 4 ¦ 1 ¦ 0 ¦ 5 ¦ 0 ¦ 0 ¦ 4 ¦ 2 ¦ ¦................................¦ .2% ¦ .3% ¦ .1% ¦ .3% ¦ .2% ¦ .2% ¦ .2% ¦ .2% ¦ .2% ¦ .3% ¦ .1% ¦ .2% ¦ .0% ¦ .2% ¦ .2% ¦ .2% ¦ +--------------------------------+-------+-------+-------+-------+-------+-------+-------+-------+-------+-------+-------+-------+-------+-------+-------+-------¦ ¦Netherlands.....................¦ 121 ¦ 17 ¦ 25 ¦ 34 ¦ 45 ¦ 95 ¦ 20 ¦ 5 ¦ 83 ¦ 29 ¦ 9 ¦ 95 ¦ 4 ¦ 22 ¦ 47 ¦ 74 ¦ ¦................................¦ 4.2% ¦ 4.2% ¦ 2.9% ¦ 4.4% ¦ 5.3% ¦ 3.9% ¦ 5.9% ¦ 6.4% ¦ 3.8% ¦ 6.0% ¦ 3.9% ¦ 3.7% ¦ 5.1% ¦ 8.9% ¦ 2.8% ¦ 6.0% ¦ +--------------------------------+-------+-------+-------+-------+-------+-------+-------+-------+-------+-------+-------+-------+-------+-------+-------+-------¦ ¦Austria.........................¦ 69 ¦ 12 ¦ 18 ¦ 24 ¦ 15 ¦ 57 ¦ 10 ¦ 2 ¦ 56 ¦ 10 ¦ 3 ¦ 63 ¦ 2 ¦ 4 ¦ 40 ¦ 29 ¦ ¦................................¦ 2.4% ¦ 2.9% ¦ 2.1% ¦ 3.2% ¦ 1.7% ¦ 2.3% ¦ 2.9% ¦ 2.5% ¦ 2.6% ¦ 2.0% ¦ 1.2% ¦ 2.4% ¦ 2.8% ¦ 1.7% ¦ 2.4% ¦ 2.3% ¦ +--------------------------------+-------+-------+-------+-------+-------+-------+-------+-------+-------+-------+-------+-------+-------+-------+-------+-------¦ ¦Portugal........................¦ 96 ¦ 13 ¦ 41 ¦ 30 ¦ 12 ¦ 82 ¦ 12 ¦ 2 ¦ 66 ¦ 13 ¦ 17 ¦ 86 ¦ 1 ¦ 8 ¦ 49 ¦ 47 ¦ ¦................................¦ 3.3% ¦ 3.1% ¦ 4.8% ¦ 3.9% ¦ 1.4% ¦ 3.3% ¦ 3.6% ¦ 2.0% ¦ 3.0% ¦ 2.6% ¦ 7.2% ¦ 3.3% ¦ 1.5% ¦ 3.4% ¦ 2.9% ¦ 3.8% ¦ +--------------------------------+-------+-------+-------+-------+-------+-------+-------+-------+-------+-------+-------+-------+-------+-------+-------+-------¦ ¦Sweden..........................¦ 55 ¦ 5 ¦ 16 ¦ 17 ¦ 17 ¦ 46 ¦ 7 ¦ 2 ¦ 31 ¦ 13 ¦ 11 ¦ 43 ¦ 3 ¦ 9 ¦ 31 ¦ 24 ¦ ¦................................¦ 1.9% ¦ 1.3% ¦ 1.8% ¦ 2.2% ¦ 2.0% ¦ 1.9% ¦ 2.1% ¦ 2.6% ¦ 1.4% ¦ 2.8% ¦ 4.4% ¦ 1.7% ¦ 3.8% ¦ 3.7% ¦ 1.9% ¦ 2.0% ¦ +--------------------------------+-------+-------+-------+-------+-------+-------+-------+-------+-------+-------+-------+-------+-------+-------+-------+-------¦ ¦United Kingdom..................¦ 417 ¦ 28 ¦ 98 ¦ 131 ¦ 159 ¦ 345 ¦ 57 ¦ 15 ¦ 369 ¦ 23 ¦ 25 ¦ 372 ¦ 6 ¦ 39 ¦ 215 ¦ 202 ¦ ¦................................¦ 14.4% ¦ 6.7% ¦ 11.4% ¦ 17.1% ¦ 18.5% ¦ 14.0% ¦ 16.4% ¦ 18.2% ¦ 17.0% ¦ 4.8% ¦ 10.2% ¦ 14.4% ¦ 7.9% ¦ 15.9% ¦ 12.9% ¦ 16.4% ¦ +----------------------------------------------------------------------------------------------------------------------------------------------------------------+Interviews : 26/08/02 - 23/09/02 SOFRES s.a. - Coordination EOS GALLUP EUROPE Volume B - Page : 1

FLASH 128 : BUSINESS SURVEY - 2002
ECHANTILLON D'ENTREPRISES : Secteurs d'activité BUSINESSES SAMPLE : Activity Sectors
*** RESULTS ARE WEIGHTED : N. of enterprises in the E.U. +----------------------------------------------------------------------------------------------------------------------------------------------------------------+ ¦ ¦ TOTAL ¦ SECTORS ¦ SIZE CATEGORIES ¦ EU COUNTRIES ACTIVITY ¦ COMPANY STATUS ¦ INTERVIEWED ¦ ¦ +-------+-------------------------------+-----------------------+-----------------------+-----------------------+---------------¦ ¦ ¦ EU 15 ¦Constru¦Indus ¦Trade ¦Servi ¦SME ¦SME ¦MAJORS ¦None ¦1-5 EU ¦6&+ EU ¦Indepen¦Mother ¦Member ¦General¦Mktg-Sa¦ ¦ ¦ ¦ction ¦try ¦ ¦ces ¦10-49 ¦50-249 ¦250+ ¦ ¦countr.¦countr.¦dant ¦Cy ¦group ¦Manager¦les Man¦ +--------------------------------+-------+-------+-------+-------+-------+-------+-------+-------+-------+-------+-------+-------+-------+-------+-------+-------¦ ¦UNWEIGHTED BASE : ..............¦ 2899 ¦ 331 ¦ 905 ¦ 802 ¦ 861 ¦ 1815 ¦ 637 ¦ 447 ¦ 2044 ¦ 526 ¦ 329 ¦ 2398 ¦ 133 ¦ 368 ¦ 1417 ¦ 1482 ¦ ¦................................¦100.0% ¦100.0% ¦100.0% ¦100.0% ¦100.0% ¦100.0% ¦100.0% ¦100.0% ¦100.0% ¦100.0% ¦100.0% ¦100.0% ¦100.0% ¦100.0% ¦100.0% ¦100.0% ¦ +--------------------------------+-------+-------+-------+-------+-------+-------+-------+-------+-------+-------+-------+-------+-------+-------+-------+-------¦ ¦Construction, génie civil ¦ ¦ ¦ ¦ ¦ ¦ ¦ ¦ ¦ ¦ ¦ ¦ ¦ ¦ ¦ ¦ ¦ ¦ Construction, civil engin......¦ 411 ¦ 411 ¦ 0 ¦ 0 ¦ 0 ¦ 372 ¦ 34 ¦ 5 ¦ 354 ¦ 55 ¦ 3 ¦ 389 ¦ 8 ¦ 14 ¦ 253 ¦ 159 ¦ ¦................................¦ 14.2% ¦100.0% ¦ .0% ¦ .0% ¦ .0% ¦ 15.1% ¦ 9.9% ¦ 5.9% ¦ 16.3% ¦ 11.4% ¦ 1.2% ¦ 15.1% ¦ 9.9% ¦ 5.9% ¦ 15.1% ¦ 12.9% ¦ +--------------------------------+-------+-------+-------+-------+-------+-------+-------+-------+-------+-------+-------+-------+-------+-------+-------+-------¦ ¦Industrie ¦ ¦ ¦ ¦ ¦ ¦ ¦ ¦ ¦ ¦ ¦ ¦ ¦ ¦ ¦ ¦ ¦ ¦ Industry.......................¦ 860 ¦ 0 ¦ 860 ¦ 0 ¦ 0 ¦ 685 ¦ 138 ¦ 37 ¦ 600 ¦ 153 ¦ 107 ¦ 743 ¦ 24 ¦ 93 ¦ 449 ¦ 412 ¦ ¦................................¦ 29.7% ¦ .0% ¦100.0% ¦ .0% ¦ .0% ¦ 27.7% ¦ 40.2% ¦ 45.6% ¦ 27.6% ¦ 32.0% ¦ 43.9% ¦ 28.8% ¦ 32.1% ¦ 37.9% ¦ 26.8% ¦ 33.6% ¦ +--------------------------------+-------+-------+-------+-------+-------+-------+-------+-------+-------+-------+-------+-------+-------+-------+-------+-------¦ ¦Commerce ¦ ¦ ¦ ¦ ¦ ¦ ¦ ¦ ¦ ¦ ¦ ¦ ¦ ¦ ¦ ¦ ¦ ¦ Trade..........................¦ 767 ¦ 0 ¦ 0 ¦ 767 ¦ 0 ¦ 692 ¦ 64 ¦ 11 ¦ 572 ¦ 136 ¦ 59 ¦ 681 ¦ 21 ¦ 65 ¦ 465 ¦ 302 ¦ ¦................................¦ 26.5% ¦ .0% ¦ .0% ¦100.0% ¦ .0% ¦ 28.0% ¦ 18.7% ¦ 13.3% ¦ 26.3% ¦ 28.5% ¦ 24.1% ¦ 26.4% ¦ 27.4% ¦ 26.7% ¦ 27.8% ¦ 24.6% ¦ +--------------------------------+-------+-------+-------+-------+-------+-------+-------+-------+-------+-------+-------+-------+-------+-------+-------+-------¦ ¦Services ¦ ¦ ¦ ¦ ¦ ¦ ¦ ¦ ¦ ¦ ¦ ¦ ¦ ¦ ¦ ¦ ¦ ¦ Services.......................¦ 861 ¦ 0 ¦ 0 ¦ 0 ¦ 861 ¦ 724 ¦ 107 ¦ 29 ¦ 651 ¦ 135 ¦ 75 ¦ 765 ¦ 23 ¦ 73 ¦ 506 ¦ 354 ¦ ¦................................¦ 29.7% ¦ .0% ¦ .0% ¦ .0% ¦100.0% ¦ 29.3% ¦ 31.2% ¦ 35.2% ¦ 29.9% ¦ 28.1% ¦ 30.8% ¦ 29.7% ¦ 30.6% ¦ 29.6% ¦ 30.3% ¦ 28.9% ¦ +----------------------------------------------------------------------------------------------------------------------------------------------------------------+
Interviews : 26/08/02 - 23/09/02 SOFRES s.a. - Coordination EOS GALLUP EUROPE Volume B - Page : 2

FLASH 128 : BUSINESS SURVEY - 2002
ECHANTILLON D'ENTREPRISES : Catégories de tailles (emploi) BUSINESSES SAMPLE : Size categories (employment)
*** RESULTS ARE WEIGHTED : N. of enterprises in the E.U. +----------------------------------------------------------------------------------------------------------------------------------------------------------------+ ¦ ¦ TOTAL ¦ SECTORS ¦ SIZE CATEGORIES ¦ EU COUNTRIES ACTIVITY ¦ COMPANY STATUS ¦ INTERVIEWED ¦ ¦ +-------+-------------------------------+-----------------------+-----------------------+-----------------------+---------------¦ ¦ ¦ EU 15 ¦Constru¦Indus ¦Trade ¦Servi ¦SME ¦SME ¦MAJORS ¦None ¦1-5 EU ¦6&+ EU ¦Indepen¦Mother ¦Member ¦General¦Mktg-Sa¦ ¦ ¦ ¦ction ¦try ¦ ¦ces ¦10-49 ¦50-249 ¦250+ ¦ ¦countr.¦countr.¦dant ¦Cy ¦group ¦Manager¦les Man¦ +--------------------------------+-------+-------+-------+-------+-------+-------+-------+-------+-------+-------+-------+-------+-------+-------+-------+-------¦ ¦UNWEIGHTED BASE : ..............¦ 2899 ¦ 331 ¦ 905 ¦ 802 ¦ 861 ¦ 1815 ¦ 637 ¦ 447 ¦ 2044 ¦ 526 ¦ 329 ¦ 2398 ¦ 133 ¦ 368 ¦ 1417 ¦ 1482 ¦ ¦................................¦100.0% ¦100.0% ¦100.0% ¦100.0% ¦100.0% ¦100.0% ¦100.0% ¦100.0% ¦100.0% ¦100.0% ¦100.0% ¦100.0% ¦100.0% ¦100.0% ¦100.0% ¦100.0% ¦ +--------------------------------+-------+-------+-------+-------+-------+-------+-------+-------+-------+-------+-------+-------+-------+-------+-------+-------¦ ¦10-49...........................¦ 2473 ¦ 372 ¦ 685 ¦ 692 ¦ 724 ¦ 2473 ¦ 0 ¦ 0 ¦ 1922 ¦ 379 ¦ 172 ¦ 2260 ¦ 48 ¦ 165 ¦ 1527 ¦ 946 ¦ ¦................................¦ 85.3% ¦ 90.6% ¦ 79.6% ¦ 90.2% ¦ 84.2% ¦100.0% ¦ .0% ¦ .0% ¦ 88.3% ¦ 79.2% ¦ 70.7% ¦ 87.7% ¦ 63.6% ¦ 67.3% ¦ 91.3% ¦ 77.1% ¦ +--------------------------------+-------+-------+-------+-------+-------+-------+-------+-------+-------+-------+-------+-------+-------+-------+-------+-------¦ ¦50-249..........................¦ 344 ¦ 34 ¦ 138 ¦ 64 ¦ 107 ¦ 0 ¦ 344 ¦ 0 ¦ 220 ¦ 76 ¦ 47 ¦ 273 ¦ 15 ¦ 56 ¦ 130 ¦ 214 ¦ ¦................................¦ 11.9% ¦ 8.3% ¦ 16.1% ¦ 8.4% ¦ 12.5% ¦ .0% ¦100.0% ¦ .0% ¦ 10.1% ¦ 15.9% ¦ 19.4% ¦ 10.6% ¦ 20.1% ¦ 22.8% ¦ 7.8% ¦ 17.4% ¦ +--------------------------------+-------+-------+-------+-------+-------+-------+-------+-------+-------+-------+-------+-------+-------+-------+-------+-------¦ ¦250 & +.........................¦ 82 ¦ 5 ¦ 37 ¦ 11 ¦ 29 ¦ 0 ¦ 0 ¦ 82 ¦ 34 ¦ 24 ¦ 24 ¦ 45 ¦ 12 ¦ 24 ¦ 15 ¦ 67 ¦ ¦................................¦ 2.8% ¦ 1.2% ¦ 4.3% ¦ 1.4% ¦ 3.4% ¦ .0% ¦ .0% ¦100.0% ¦ 1.6% ¦ 4.9% ¦ 9.9% ¦ 1.8% ¦ 16.2% ¦ 9.9% ¦ .9% ¦ 5.4% ¦ +----------------------------------------------------------------------------------------------------------------------------------------------------------------+
Interviews : 26/08/02 - 23/09/02 SOFRES s.a. - Coordination EOS GALLUP EUROPE Volume B - Page : 3

FLASH 128 : BUSINESS SURVEY - 2002
FILTRAGE (a) : Votre entreprise s'adresse-t-elle aux consommateurs finaux, FILTER (a) : Does your company target final consumers, meaning the generalc'est-à-dire le grand public, que ce soit par la vente, par la publicité public, in its sales or advertising or both ?ou les deux ?
*** RESULTS ARE WEIGHTED : N. of enterprises in the E.U. +----------------------------------------------------------------------------------------------------------------------------------------------------------------+ ¦ ¦ TOTAL ¦ SECTORS ¦ SIZE CATEGORIES ¦ EU COUNTRIES ACTIVITY ¦ COMPANY STATUS ¦ INTERVIEWED ¦ ¦ +-------+-------------------------------+-----------------------+-----------------------+-----------------------+---------------¦ ¦ ¦ EU 15 ¦Constru¦Indus ¦Trade ¦Servi ¦SME ¦SME ¦MAJORS ¦None ¦1-5 EU ¦6&+ EU ¦Indepen¦Mother ¦Member ¦General¦Mktg-Sa¦ ¦ ¦ ¦ction ¦try ¦ ¦ces ¦10-49 ¦50-249 ¦250+ ¦ ¦countr.¦countr.¦dant ¦Cy ¦group ¦Manager¦les Man¦ +--------------------------------+-------+-------+-------+-------+-------+-------+-------+-------+-------+-------+-------+-------+-------+-------+-------+-------¦ ¦UNWEIGHTED BASE : ..............¦ 2899 ¦ 331 ¦ 905 ¦ 802 ¦ 861 ¦ 1815 ¦ 637 ¦ 447 ¦ 2044 ¦ 526 ¦ 329 ¦ 2398 ¦ 133 ¦ 368 ¦ 1417 ¦ 1482 ¦ ¦................................¦100.0% ¦100.0% ¦100.0% ¦100.0% ¦100.0% ¦100.0% ¦100.0% ¦100.0% ¦100.0% ¦100.0% ¦100.0% ¦100.0% ¦100.0% ¦100.0% ¦100.0% ¦100.0% ¦ +--------------------------------+-------+-------+-------+-------+-------+-------+-------+-------+-------+-------+-------+-------+-------+-------+-------+-------¦ ¦Oui ¦ ¦ ¦ ¦ ¦ ¦ ¦ ¦ ¦ ¦ ¦ ¦ ¦ ¦ ¦ ¦ ¦ ¦ Yes............................¦ 2899 ¦ 411 ¦ 860 ¦ 767 ¦ 861 ¦ 2473 ¦ 344 ¦ 82 ¦ 2176 ¦ 479 ¦ 244 ¦ 2578 ¦ 76 ¦ 245 ¦ 1672 ¦ 1227 ¦ ¦................................¦100.0% ¦100.0% ¦100.0% ¦100.0% ¦100.0% ¦100.0% ¦100.0% ¦100.0% ¦100.0% ¦100.0% ¦100.0% ¦100.0% ¦100.0% ¦100.0% ¦100.0% ¦100.0% ¦ +----------------------------------------------------------------------------------------------------------------------------------------------------------------+
Interviews : 26/08/02 - 23/09/02 SOFRES s.a. - Coordination EOS GALLUP EUROPE Volume B - Page : 4
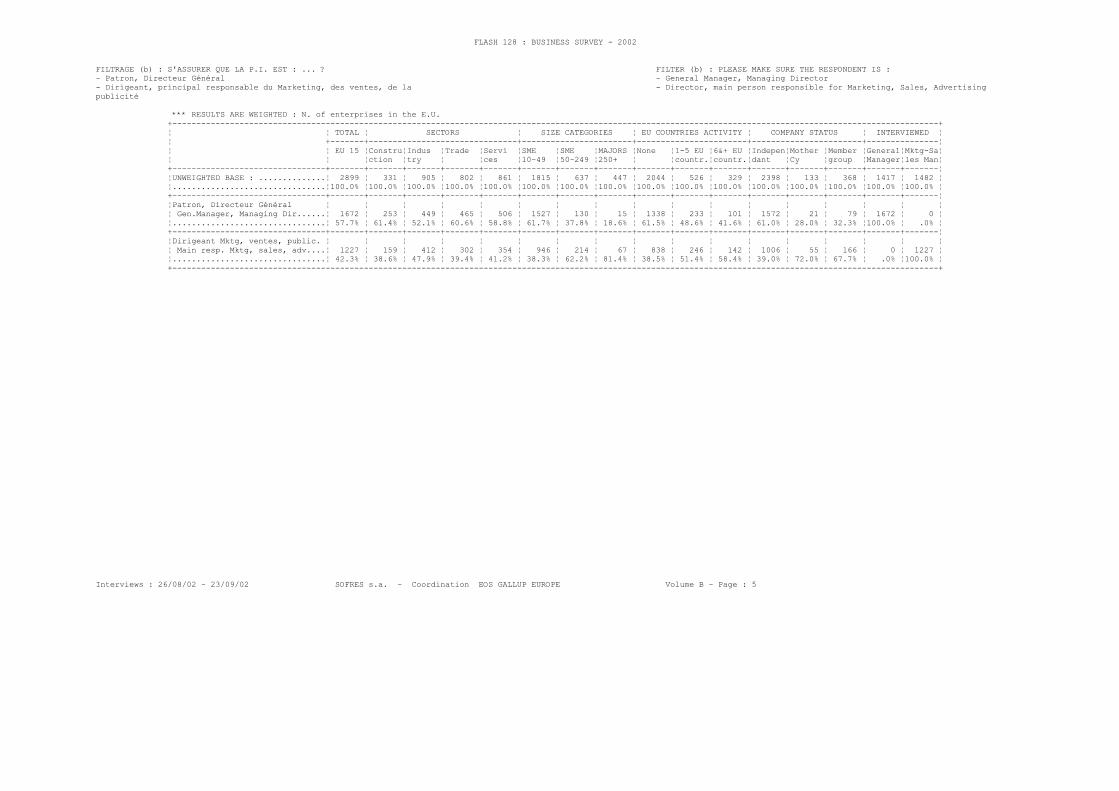
FLASH 128 : BUSINESS SURVEY - 2002
FILTRAGE (b) : S'ASSURER QUE LA P.I. EST : ... ? FILTER (b) : PLEASE MAKE SURE THE RESPONDENT IS :- Patron, Directeur Général - General Manager, Managing Director- Dirigeant, principal responsable du Marketing, des ventes, de la - Director, main person responsible for Marketing, Sales, Advertisingpublicité
*** RESULTS ARE WEIGHTED : N. of enterprises in the E.U. +----------------------------------------------------------------------------------------------------------------------------------------------------------------+ ¦ ¦ TOTAL ¦ SECTORS ¦ SIZE CATEGORIES ¦ EU COUNTRIES ACTIVITY ¦ COMPANY STATUS ¦ INTERVIEWED ¦ ¦ +-------+-------------------------------+-----------------------+-----------------------+-----------------------+---------------¦ ¦ ¦ EU 15 ¦Constru¦Indus ¦Trade ¦Servi ¦SME ¦SME ¦MAJORS ¦None ¦1-5 EU ¦6&+ EU ¦Indepen¦Mother ¦Member ¦General¦Mktg-Sa¦ ¦ ¦ ¦ction ¦try ¦ ¦ces ¦10-49 ¦50-249 ¦250+ ¦ ¦countr.¦countr.¦dant ¦Cy ¦group ¦Manager¦les Man¦ +--------------------------------+-------+-------+-------+-------+-------+-------+-------+-------+-------+-------+-------+-------+-------+-------+-------+-------¦ ¦UNWEIGHTED BASE : ..............¦ 2899 ¦ 331 ¦ 905 ¦ 802 ¦ 861 ¦ 1815 ¦ 637 ¦ 447 ¦ 2044 ¦ 526 ¦ 329 ¦ 2398 ¦ 133 ¦ 368 ¦ 1417 ¦ 1482 ¦ ¦................................¦100.0% ¦100.0% ¦100.0% ¦100.0% ¦100.0% ¦100.0% ¦100.0% ¦100.0% ¦100.0% ¦100.0% ¦100.0% ¦100.0% ¦100.0% ¦100.0% ¦100.0% ¦100.0% ¦ +--------------------------------+-------+-------+-------+-------+-------+-------+-------+-------+-------+-------+-------+-------+-------+-------+-------+-------¦ ¦Patron, Directeur Général ¦ ¦ ¦ ¦ ¦ ¦ ¦ ¦ ¦ ¦ ¦ ¦ ¦ ¦ ¦ ¦ ¦ ¦ Gen.Manager, Managing Dir......¦ 1672 ¦ 253 ¦ 449 ¦ 465 ¦ 506 ¦ 1527 ¦ 130 ¦ 15 ¦ 1338 ¦ 233 ¦ 101 ¦ 1572 ¦ 21 ¦ 79 ¦ 1672 ¦ 0 ¦ ¦................................¦ 57.7% ¦ 61.4% ¦ 52.1% ¦ 60.6% ¦ 58.8% ¦ 61.7% ¦ 37.8% ¦ 18.6% ¦ 61.5% ¦ 48.6% ¦ 41.6% ¦ 61.0% ¦ 28.0% ¦ 32.3% ¦100.0% ¦ .0% ¦ +--------------------------------+-------+-------+-------+-------+-------+-------+-------+-------+-------+-------+-------+-------+-------+-------+-------+-------¦ ¦Dirigeant Mktg, ventes, public. ¦ ¦ ¦ ¦ ¦ ¦ ¦ ¦ ¦ ¦ ¦ ¦ ¦ ¦ ¦ ¦ ¦ ¦ Main resp. Mktg, sales, adv....¦ 1227 ¦ 159 ¦ 412 ¦ 302 ¦ 354 ¦ 946 ¦ 214 ¦ 67 ¦ 838 ¦ 246 ¦ 142 ¦ 1006 ¦ 55 ¦ 166 ¦ 0 ¦ 1227 ¦ ¦................................¦ 42.3% ¦ 38.6% ¦ 47.9% ¦ 39.4% ¦ 41.2% ¦ 38.3% ¦ 62.2% ¦ 81.4% ¦ 38.5% ¦ 51.4% ¦ 58.4% ¦ 39.0% ¦ 72.0% ¦ 67.7% ¦ .0% ¦100.0% ¦ +----------------------------------------------------------------------------------------------------------------------------------------------------------------+
Interviews : 26/08/02 - 23/09/02 SOFRES s.a. - Coordination EOS GALLUP EUROPE Volume B - Page : 5

FLASH 128 : BUSINESS SURVEY - 2002
D1. Combien de personnes votre entreprise emploie-t-elle régulièrement en D1. How many persons does your company regularly employ in (OUR COUNTRY) ?(NOTRE PAYS) ?
*** RESULTS ARE WEIGHTED : N. of enterprises in the E.U. +----------------------------------------------------------------------------------------------------------------------------------------------------------------+ ¦ ¦ TOTAL ¦ SECTORS ¦ SIZE CATEGORIES ¦ EU COUNTRIES ACTIVITY ¦ COMPANY STATUS ¦ INTERVIEWED ¦ ¦ +-------+-------------------------------+-----------------------+-----------------------+-----------------------+---------------¦ ¦ ¦ EU 15 ¦Constru¦Indus ¦Trade ¦Servi ¦SME ¦SME ¦MAJORS ¦None ¦1-5 EU ¦6&+ EU ¦Indepen¦Mother ¦Member ¦General¦Mktg-Sa¦ ¦ ¦ ¦ction ¦try ¦ ¦ces ¦10-49 ¦50-249 ¦250+ ¦ ¦countr.¦countr.¦dant ¦Cy ¦group ¦Manager¦les Man¦ +--------------------------------+-------+-------+-------+-------+-------+-------+-------+-------+-------+-------+-------+-------+-------+-------+-------+-------¦ ¦UNWEIGHTED BASE : ..............¦ 2899 ¦ 331 ¦ 905 ¦ 802 ¦ 861 ¦ 1815 ¦ 637 ¦ 447 ¦ 2044 ¦ 526 ¦ 329 ¦ 2398 ¦ 133 ¦ 368 ¦ 1417 ¦ 1482 ¦ ¦................................¦100.0% ¦100.0% ¦100.0% ¦100.0% ¦100.0% ¦100.0% ¦100.0% ¦100.0% ¦100.0% ¦100.0% ¦100.0% ¦100.0% ¦100.0% ¦100.0% ¦100.0% ¦100.0% ¦ +--------------------------------+-------+-------+-------+-------+-------+-------+-------+-------+-------+-------+-------+-------+-------+-------+-------+-------¦ ¦10-19 ¦ ¦ ¦ ¦ ¦ ¦ ¦ ¦ ¦ ¦ ¦ ¦ ¦ ¦ ¦ ¦ ¦ ¦ 10-19..........................¦ 1277 ¦ 202 ¦ 361 ¦ 394 ¦ 320 ¦ 1277 ¦ 0 ¦ 0 ¦ 997 ¦ 217 ¦ 63 ¦ 1192 ¦ 21 ¦ 63 ¦ 866 ¦ 411 ¦ ¦................................¦ 44.0% ¦ 49.0% ¦ 42.0% ¦ 51.4% ¦ 37.1% ¦ 51.6% ¦ .0% ¦ .0% ¦ 45.8% ¦ 45.3% ¦ 25.8% ¦ 46.2% ¦ 27.5% ¦ 25.9% ¦ 51.8% ¦ 33.5% ¦ +--------------------------------+-------+-------+-------+-------+-------+-------+-------+-------+-------+-------+-------+-------+-------+-------+-------+-------¦ ¦20-29 ¦ ¦ ¦ ¦ ¦ ¦ ¦ ¦ ¦ ¦ ¦ ¦ ¦ ¦ ¦ ¦ ¦ ¦ 20-29..........................¦ 572 ¦ 79 ¦ 154 ¦ 163 ¦ 175 ¦ 572 ¦ 0 ¦ 0 ¦ 460 ¦ 74 ¦ 37 ¦ 518 ¦ 13 ¦ 40 ¦ 326 ¦ 245 ¦ ¦................................¦ 19.7% ¦ 19.2% ¦ 17.9% ¦ 21.3% ¦ 20.4% ¦ 23.1% ¦ .0% ¦ .0% ¦ 21.1% ¦ 15.5% ¦ 15.2% ¦ 20.1% ¦ 17.7% ¦ 16.3% ¦ 19.5% ¦ 20.0% ¦ +--------------------------------+-------+-------+-------+-------+-------+-------+-------+-------+-------+-------+-------+-------+-------+-------+-------+-------¦ ¦30-49 ¦ ¦ ¦ ¦ ¦ ¦ ¦ ¦ ¦ ¦ ¦ ¦ ¦ ¦ ¦ ¦ ¦ ¦ 30-49..........................¦ 625 ¦ 92 ¦ 170 ¦ 134 ¦ 229 ¦ 625 ¦ 0 ¦ 0 ¦ 465 ¦ 88 ¦ 72 ¦ 549 ¦ 14 ¦ 62 ¦ 335 ¦ 290 ¦ ¦................................¦ 21.6% ¦ 22.3% ¦ 19.7% ¦ 17.5% ¦ 26.7% ¦ 25.3% ¦ .0% ¦ .0% ¦ 21.4% ¦ 18.3% ¦ 29.6% ¦ 21.3% ¦ 18.4% ¦ 25.2% ¦ 20.0% ¦ 23.6% ¦ +--------------------------------+-------+-------+-------+-------+-------+-------+-------+-------+-------+-------+-------+-------+-------+-------+-------+-------¦ ¦50-99 ¦ ¦ ¦ ¦ ¦ ¦ ¦ ¦ ¦ ¦ ¦ ¦ ¦ ¦ ¦ ¦ ¦ ¦ 50-99..........................¦ 180 ¦ 22 ¦ 67 ¦ 35 ¦ 56 ¦ 0 ¦ 180 ¦ 0 ¦ 127 ¦ 32 ¦ 21 ¦ 152 ¦ 5 ¦ 23 ¦ 85 ¦ 95 ¦ ¦................................¦ 6.2% ¦ 5.5% ¦ 7.7% ¦ 4.5% ¦ 6.5% ¦ .0% ¦ 52.3% ¦ .0% ¦ 5.8% ¦ 6.6% ¦ 8.6% ¦ 5.9% ¦ 6.5% ¦ 9.4% ¦ 5.1% ¦ 7.7% ¦ +--------------------------------+-------+-------+-------+-------+-------+-------+-------+-------+-------+-------+-------+-------+-------+-------+-------+-------¦ ¦100-249 ¦ ¦ ¦ ¦ ¦ ¦ ¦ ¦ ¦ ¦ ¦ ¦ ¦ ¦ ¦ ¦ ¦ ¦ 100-249........................¦ 164 ¦ 12 ¦ 72 ¦ 30 ¦ 51 ¦ 0 ¦ 164 ¦ 0 ¦ 93 ¦ 45 ¦ 26 ¦ 121 ¦ 10 ¦ 33 ¦ 45 ¦ 119 ¦ ¦................................¦ 5.7% ¦ 2.8% ¦ 8.3% ¦ 3.9% ¦ 6.0% ¦ .0% ¦ 47.7% ¦ .0% ¦ 4.3% ¦ 9.3% ¦ 10.8% ¦ 4.7% ¦ 13.6% ¦ 13.4% ¦ 2.7% ¦ 9.7% ¦ +--------------------------------+-------+-------+-------+-------+-------+-------+-------+-------+-------+-------+-------+-------+-------+-------+-------+-------¦ ¦250-499 ¦ ¦ ¦ ¦ ¦ ¦ ¦ ¦ ¦ ¦ ¦ ¦ ¦ ¦ ¦ ¦ ¦ ¦ 250-499........................¦ 31 ¦ 1 ¦ 16 ¦ 3 ¦ 9 ¦ 0 ¦ 0 ¦ 31 ¦ 16 ¦ 8 ¦ 6 ¦ 20 ¦ 3 ¦ 8 ¦ 5 ¦ 26 ¦ ¦................................¦ 1.1% ¦ .3% ¦ 1.9% ¦ .4% ¦ 1.1% ¦ .0% ¦ .0% ¦ 37.3% ¦ .7% ¦ 1.7% ¦ 2.6% ¦ .8% ¦ 3.5% ¦ 3.3% ¦ .3% ¦ 2.1% ¦ +--------------------------------+-------+-------+-------+-------+-------+-------+-------+-------+-------+-------+-------+-------+-------+-------+-------+-------¦ ¦500-999 ¦ ¦ ¦ ¦ ¦ ¦ ¦ ¦ ¦ ¦ ¦ ¦ ¦ ¦ ¦ ¦ ¦ ¦ 500-999........................¦ 26 ¦ 1 ¦ 12 ¦ 3 ¦ 9 ¦ 0 ¦ 0 ¦ 26 ¦ 9 ¦ 7 ¦ 9 ¦ 14 ¦ 5 ¦ 6 ¦ 4 ¦ 21 ¦ ¦................................¦ .9% ¦ .2% ¦ 1.4% ¦ .5% ¦ 1.1% ¦ .0% ¦ .0% ¦ 31.2% ¦ .4% ¦ 1.5% ¦ 3.8% ¦ .5% ¦ 6.8% ¦ 2.6% ¦ .3% ¦ 1.7% ¦ +--------------------------------+-------+-------+-------+-------+-------+-------+-------+-------+-------+-------+-------+-------+-------+-------+-------+-------¦ ¦1000 et plus ¦ ¦ ¦ ¦ ¦ ¦ ¦ ¦ ¦ ¦ ¦ ¦ ¦ ¦ ¦ ¦ ¦ ¦ 1000 & more....................¦ 26 ¦ 3 ¦ 9 ¦ 4 ¦ 10 ¦ 0 ¦ 0 ¦ 26 ¦ 9 ¦ 8 ¦ 8 ¦ 12 ¦ 4 ¦ 10 ¦ 6 ¦ 19 ¦ ¦................................¦ .9% ¦ .7% ¦ 1.0% ¦ .5% ¦ 1.2% ¦ .0% ¦ .0% ¦ 31.5% ¦ .4% ¦ 1.8% ¦ 3.5% ¦ .5% ¦ 5.9% ¦ 4.0% ¦ .4% ¦ 1.6% ¦ +--------------------------------+-------+-------+-------+-------+-------+-------+-------+-------+-------+-------+-------+-------+-------+-------+-------+-------¦ ¦NOMBRE MOYEN AVERAGE¦ 72.5 ¦ 40.0 ¦ 72.3 ¦ 63.3 ¦ 96.5 ¦ 21.6 ¦ 103.6 ¦1479.9 ¦ 45.1 ¦ 117.6 ¦ 229.5 ¦ 50.0 ¦ 515.8 ¦ 173.1 ¦ 43.8 ¦ 111.7 ¦ ¦(Base : Répondants - Answering).¦ (2899)¦ (331)¦ (905)¦ (802)¦ (861)¦ (1815)¦ (637)¦ (447)¦ (2044)¦ (526)¦ (329)¦ (2398)¦ (133)¦ (368)¦ (1417)¦ (1482)¦ +----------------------------------------------------------------------------------------------------------------------------------------------------------------+
Interviews : 26/08/02 - 23/09/02 SOFRES s.a. - Coordination EOS GALLUP EUROPE Volume B - Page : 6

FLASH 128 : BUSINESS SURVEY - 2002
D2. Dans combien d'autres pays de l'union Européenne disposez-vous de D2. In how many other countries of the European Union, do you havepoints de vente ou filiales ? subsidiaries or retail outlets ?
*** RESULTS ARE WEIGHTED : N. of enterprises in the E.U. +----------------------------------------------------------------------------------------------------------------------------------------------------------------+ ¦ ¦ TOTAL ¦ SECTORS ¦ SIZE CATEGORIES ¦ EU COUNTRIES ACTIVITY ¦ COMPANY STATUS ¦ INTERVIEWED ¦ ¦ +-------+-------------------------------+-----------------------+-----------------------+-----------------------+---------------¦ ¦ ¦ EU 15 ¦Constru¦Indus ¦Trade ¦Servi ¦SME ¦SME ¦MAJORS ¦None ¦1-5 EU ¦6&+ EU ¦Indepen¦Mother ¦Member ¦General¦Mktg-Sa¦ ¦ ¦ ¦ction ¦try ¦ ¦ces ¦10-49 ¦50-249 ¦250+ ¦ ¦countr.¦countr.¦dant ¦Cy ¦group ¦Manager¦les Man¦ +--------------------------------+-------+-------+-------+-------+-------+-------+-------+-------+-------+-------+-------+-------+-------+-------+-------+-------¦ ¦UNWEIGHTED BASE : ..............¦ 2899 ¦ 331 ¦ 905 ¦ 802 ¦ 861 ¦ 1815 ¦ 637 ¦ 447 ¦ 2044 ¦ 526 ¦ 329 ¦ 2398 ¦ 133 ¦ 368 ¦ 1417 ¦ 1482 ¦ ¦................................¦100.0% ¦100.0% ¦100.0% ¦100.0% ¦100.0% ¦100.0% ¦100.0% ¦100.0% ¦100.0% ¦100.0% ¦100.0% ¦100.0% ¦100.0% ¦100.0% ¦100.0% ¦100.0% ¦ +--------------------------------+-------+-------+-------+-------+-------+-------+-------+-------+-------+-------+-------+-------+-------+-------+-------+-------¦ ¦Aucun ¦ ¦ ¦ ¦ ¦ ¦ ¦ ¦ ¦ ¦ ¦ ¦ ¦ ¦ ¦ ¦ ¦ ¦ None...........................¦ 2176 ¦ 354 ¦ 600 ¦ 572 ¦ 651 ¦ 1922 ¦ 220 ¦ 34 ¦ 2176 ¦ 0 ¦ 0 ¦ 2044 ¦ 20 ¦ 113 ¦ 1338 ¦ 838 ¦ ¦................................¦ 75.1% ¦ 86.0% ¦ 69.8% ¦ 74.5% ¦ 75.6% ¦ 77.7% ¦ 64.1% ¦ 41.7% ¦100.0% ¦ .0% ¦ .0% ¦ 79.3% ¦ 25.9% ¦ 46.2% ¦ 80.0% ¦ 68.3% ¦ +--------------------------------+-------+-------+-------+-------+-------+-------+-------+-------+-------+-------+-------+-------+-------+-------+-------+-------¦ ¦Un ¦ ¦ ¦ ¦ ¦ ¦ ¦ ¦ ¦ ¦ ¦ ¦ ¦ ¦ ¦ ¦ ¦ ¦ One............................¦ 250 ¦ 40 ¦ 74 ¦ 74 ¦ 63 ¦ 205 ¦ 38 ¦ 7 ¦ 0 ¦ 250 ¦ 0 ¦ 227 ¦ 6 ¦ 17 ¦ 126 ¦ 124 ¦ ¦................................¦ 8.6% ¦ 9.6% ¦ 8.6% ¦ 9.6% ¦ 7.4% ¦ 8.3% ¦ 11.0% ¦ 8.6% ¦ .0% ¦ 52.3% ¦ .0% ¦ 8.8% ¦ 7.6% ¦ 7.1% ¦ 7.5% ¦ 10.1% ¦ +--------------------------------+-------+-------+-------+-------+-------+-------+-------+-------+-------+-------+-------+-------+-------+-------+-------+-------¦ ¦Deux ¦ ¦ ¦ ¦ ¦ ¦ ¦ ¦ ¦ ¦ ¦ ¦ ¦ ¦ ¦ ¦ ¦ ¦ Two............................¦ 81 ¦ 3 ¦ 24 ¦ 19 ¦ 35 ¦ 61 ¦ 15 ¦ 6 ¦ 0 ¦ 81 ¦ 0 ¦ 62 ¦ 7 ¦ 11 ¦ 47 ¦ 34 ¦ ¦................................¦ 2.8% ¦ .8% ¦ 2.8% ¦ 2.4% ¦ 4.1% ¦ 2.4% ¦ 4.3% ¦ 7.3% ¦ .0% ¦ 17.0% ¦ .0% ¦ 2.4% ¦ 9.8% ¦ 4.7% ¦ 2.8% ¦ 2.8% ¦ +--------------------------------+-------+-------+-------+-------+-------+-------+-------+-------+-------+-------+-------+-------+-------+-------+-------+-------¦ ¦Trois à cinq ¦ ¦ ¦ ¦ ¦ ¦ ¦ ¦ ¦ ¦ ¦ ¦ ¦ ¦ ¦ ¦ ¦ ¦ Three to five..................¦ 147 ¦ 12 ¦ 56 ¦ 44 ¦ 36 ¦ 113 ¦ 24 ¦ 11 ¦ 0 ¦ 147 ¦ 0 ¦ 106 ¦ 15 ¦ 27 ¦ 59 ¦ 88 ¦ ¦................................¦ 5.1% ¦ 2.8% ¦ 6.5% ¦ 5.8% ¦ 4.2% ¦ 4.6% ¦ 6.9% ¦ 12.8% ¦ .0% ¦ 30.8% ¦ .0% ¦ 4.1% ¦ 19.4% ¦ 10.9% ¦ 3.5% ¦ 7.2% ¦ +--------------------------------+-------+-------+-------+-------+-------+-------+-------+-------+-------+-------+-------+-------+-------+-------+-------+-------¦ ¦Six à dix ¦ ¦ ¦ ¦ ¦ ¦ ¦ ¦ ¦ ¦ ¦ ¦ ¦ ¦ ¦ ¦ ¦ ¦ Six to ten.....................¦ 79 ¦ 0 ¦ 34 ¦ 19 ¦ 26 ¦ 49 ¦ 19 ¦ 11 ¦ 0 ¦ 0 ¦ 79 ¦ 53 ¦ 7 ¦ 18 ¦ 33 ¦ 45 ¦ ¦................................¦ 2.7% ¦ .1% ¦ 3.9% ¦ 2.5% ¦ 3.0% ¦ 2.0% ¦ 5.6% ¦ 13.2% ¦ .0% ¦ .0% ¦ 32.3% ¦ 2.1% ¦ 9.6% ¦ 7.4% ¦ 2.0% ¦ 3.7% ¦ +--------------------------------+-------+-------+-------+-------+-------+-------+-------+-------+-------+-------+-------+-------+-------+-------+-------+-------¦ ¦Onze à quatorze ¦ ¦ ¦ ¦ ¦ ¦ ¦ ¦ ¦ ¦ ¦ ¦ ¦ ¦ ¦ ¦ ¦ ¦ Eleven to fourteen.............¦ 165 ¦ 3 ¦ 73 ¦ 40 ¦ 50 ¦ 124 ¦ 28 ¦ 13 ¦ 0 ¦ 0 ¦ 165 ¦ 86 ¦ 21 ¦ 58 ¦ 68 ¦ 97 ¦ ¦................................¦ 5.7% ¦ .6% ¦ 8.5% ¦ 5.2% ¦ 5.8% ¦ 5.0% ¦ 8.1% ¦ 16.3% ¦ .0% ¦ .0% ¦ 67.7% ¦ 3.3% ¦ 27.7% ¦ 23.7% ¦ 4.1% ¦ 7.9% ¦ +--------------------------------+-------+-------+-------+-------+-------+-------+-------+-------+-------+-------+-------+-------+-------+-------+-------+-------¦ ¦NOMBRE MOYEN AVERAGE¦ 1.0 ¦ .2 ¦ 1.3 ¦ .9 ¦ 1.1 ¦ .8 ¦ 1.7 ¦ 3.8 ¦ .0 ¦ 2.0 ¦ 10.5 ¦ .6 ¦ 4.7 ¦ 3.7 ¦ .7 ¦ 1.4 ¦ ¦(Base : Répondants - Answering).¦ (2821)¦ (327)¦ (873)¦ (781)¦ (840)¦ (1763)¦ (623)¦ (435)¦ (2044)¦ (526)¦ (251)¦ (2343)¦ (126)¦ (352)¦ (1381)¦ (1440)¦ +----------------------------------------------------------------------------------------------------------------------------------------------------------------+
Interviews : 26/08/02 - 23/09/02 SOFRES s.a. - Coordination EOS GALLUP EUROPE Volume B - Page : 7

FLASH 128 : BUSINESS SURVEY - 2002
D3. Votre entreprise est : ... ? D3. Your company is : ... ?(SI : membre d'un groupe multinational à qui il n'est pas autorisé par la (IF : a member of a multinational group not permitted by the mother companymaison mère de vendre et de faire de la publicité à des consommateurs to sell and advertise to consumers living in other EU countries : STOPvivant dans d'autres pays de l'Union européenne : STOP INTERVIEW) INTERVIEW)
*** RESULTS ARE WEIGHTED : N. of enterprises in the E.U. +----------------------------------------------------------------------------------------------------------------------------------------------------------------+ ¦ ¦ TOTAL ¦ SECTORS ¦ SIZE CATEGORIES ¦ EU COUNTRIES ACTIVITY ¦ COMPANY STATUS ¦ INTERVIEWED ¦ ¦ +-------+-------------------------------+-----------------------+-----------------------+-----------------------+---------------¦ ¦ ¦ EU 15 ¦Constru¦Indus ¦Trade ¦Servi ¦SME ¦SME ¦MAJORS ¦None ¦1-5 EU ¦6&+ EU ¦Indepen¦Mother ¦Member ¦General¦Mktg-Sa¦ ¦ ¦ ¦ction ¦try ¦ ¦ces ¦10-49 ¦50-249 ¦250+ ¦ ¦countr.¦countr.¦dant ¦Cy ¦group ¦Manager¦les Man¦ +--------------------------------+-------+-------+-------+-------+-------+-------+-------+-------+-------+-------+-------+-------+-------+-------+-------+-------¦ ¦UNWEIGHTED BASE : ..............¦ 2899 ¦ 331 ¦ 905 ¦ 802 ¦ 861 ¦ 1815 ¦ 637 ¦ 447 ¦ 2044 ¦ 526 ¦ 329 ¦ 2398 ¦ 133 ¦ 368 ¦ 1417 ¦ 1482 ¦ ¦................................¦100.0% ¦100.0% ¦100.0% ¦100.0% ¦100.0% ¦100.0% ¦100.0% ¦100.0% ¦100.0% ¦100.0% ¦100.0% ¦100.0% ¦100.0% ¦100.0% ¦100.0% ¦100.0% ¦ +--------------------------------+-------+-------+-------+-------+-------+-------+-------+-------+-------+-------+-------+-------+-------+-------+-------+-------¦ ¦Une entreprise indépendante ¦ ¦ ¦ ¦ ¦ ¦ ¦ ¦ ¦ ¦ ¦ ¦ ¦ ¦ ¦ ¦ ¦ ¦ An independent company.........¦ 2578 ¦ 389 ¦ 743 ¦ 681 ¦ 765 ¦ 2260 ¦ 273 ¦ 45 ¦ 2044 ¦ 395 ¦ 139 ¦ 2578 ¦ 0 ¦ 0 ¦ 1572 ¦ 1006 ¦ ¦................................¦ 88.9% ¦ 94.7% ¦ 86.4% ¦ 88.8% ¦ 88.9% ¦ 91.4% ¦ 79.4% ¦ 55.3% ¦ 93.9% ¦ 82.6% ¦ 57.1% ¦100.0% ¦ .0% ¦ .0% ¦ 94.0% ¦ 82.0% ¦ +--------------------------------+-------+-------+-------+-------+-------+-------+-------+-------+-------+-------+-------+-------+-------+-------+-------+-------¦ ¦Maison mère groupe multinat. ¦ ¦ ¦ ¦ ¦ ¦ ¦ ¦ ¦ ¦ ¦ ¦ ¦ ¦ ¦ ¦ ¦ ¦ Mother Cy. of multinat.group...¦ 76 ¦ 8 ¦ 24 ¦ 21 ¦ 23 ¦ 48 ¦ 15 ¦ 12 ¦ 20 ¦ 28 ¦ 28 ¦ 0 ¦ 76 ¦ 0 ¦ 21 ¦ 55 ¦ ¦................................¦ 2.6% ¦ 1.8% ¦ 2.8% ¦ 2.7% ¦ 2.7% ¦ 1.9% ¦ 4.4% ¦ 15.0% ¦ .9% ¦ 5.8% ¦ 11.6% ¦ .0% ¦100.0% ¦ .0% ¦ 1.3% ¦ 4.4% ¦ +--------------------------------+-------+-------+-------+-------+-------+-------+-------+-------+-------+-------+-------+-------+-------+-------+-------+-------¦ ¦Membre groupe multinational ¦ ¦ ¦ ¦ ¦ ¦ ¦ ¦ ¦ ¦ ¦ ¦ ¦ ¦ ¦ ¦ ¦ ¦ Member of multinat.group.......¦ 245 ¦ 14 ¦ 93 ¦ 65 ¦ 73 ¦ 165 ¦ 56 ¦ 24 ¦ 113 ¦ 56 ¦ 76 ¦ 0 ¦ 0 ¦ 245 ¦ 79 ¦ 166 ¦ ¦................................¦ 8.5% ¦ 3.5% ¦ 10.8% ¦ 8.5% ¦ 8.4% ¦ 6.7% ¦ 16.2% ¦ 29.7% ¦ 5.2% ¦ 11.6% ¦ 31.3% ¦ .0% ¦ .0% ¦100.0% ¦ 4.7% ¦ 13.5% ¦ +----------------------------------------------------------------------------------------------------------------------------------------------------------------+
Interviews : 26/08/02 - 23/09/02 SOFRES s.a. - Coordination EOS GALLUP EUROPE Volume B - Page : 8

FLASH 128 : BUSINESS SURVEY - 2002
1. Pour commencer, peut-on dire que votre entreprise s'intéresse davantage 1. To begin with, would you say that your company is more interested inà encourager les ventes transfrontalières, oui ou non, encouraging cross-border sales :...(a) ... depuis que l'internet et le commerce électronique se sont (a) ... since the development of the Internet and e-commerce within thedéveloppés dans l'UE ? EU ?
*** RESULTS ARE WEIGHTED : N. of enterprises in the E.U. +----------------------------------------------------------------------------------------------------------------------------------------------------------------+ ¦ ¦ TOTAL ¦ SECTORS ¦ SIZE CATEGORIES ¦ EU COUNTRIES ACTIVITY ¦ COMPANY STATUS ¦ INTERVIEWED ¦ ¦ +-------+-------------------------------+-----------------------+-----------------------+-----------------------+---------------¦ ¦ ¦ EU 15 ¦Constru¦Indus ¦Trade ¦Servi ¦SME ¦SME ¦MAJORS ¦None ¦1-5 EU ¦6&+ EU ¦Indepen¦Mother ¦Member ¦General¦Mktg-Sa¦ ¦ ¦ ¦ction ¦try ¦ ¦ces ¦10-49 ¦50-249 ¦250+ ¦ ¦countr.¦countr.¦dant ¦Cy ¦group ¦Manager¦les Man¦ +--------------------------------+-------+-------+-------+-------+-------+-------+-------+-------+-------+-------+-------+-------+-------+-------+-------+-------¦ ¦UNWEIGHTED BASE : ..............¦ 2899 ¦ 331 ¦ 905 ¦ 802 ¦ 861 ¦ 1815 ¦ 637 ¦ 447 ¦ 2044 ¦ 526 ¦ 329 ¦ 2398 ¦ 133 ¦ 368 ¦ 1417 ¦ 1482 ¦ ¦................................¦100.0% ¦100.0% ¦100.0% ¦100.0% ¦100.0% ¦100.0% ¦100.0% ¦100.0% ¦100.0% ¦100.0% ¦100.0% ¦100.0% ¦100.0% ¦100.0% ¦100.0% ¦100.0% ¦ +--------------------------------+-------+-------+-------+-------+-------+-------+-------+-------+-------+-------+-------+-------+-------+-------+-------+-------¦ ¦Oui ¦ ¦ ¦ ¦ ¦ ¦ ¦ ¦ ¦ ¦ ¦ ¦ ¦ ¦ ¦ ¦ ¦ ¦ Yes............................¦ 1202 ¦ 111 ¦ 380 ¦ 329 ¦ 381 ¦ 1030 ¦ 139 ¦ 33 ¦ 871 ¦ 218 ¦ 113 ¦ 1039 ¦ 35 ¦ 128 ¦ 693 ¦ 508 ¦ ¦................................¦ 41.4% ¦ 27.0% ¦ 44.2% ¦ 42.9% ¦ 44.3% ¦ 41.6% ¦ 40.4% ¦ 40.0% ¦ 40.0% ¦ 45.5% ¦ 46.4% ¦ 40.3% ¦ 46.0% ¦ 52.1% ¦ 41.5% ¦ 41.4% ¦ +--------------------------------+-------+-------+-------+-------+-------+-------+-------+-------+-------+-------+-------+-------+-------+-------+-------+-------¦ ¦Non ¦ ¦ ¦ ¦ ¦ ¦ ¦ ¦ ¦ ¦ ¦ ¦ ¦ ¦ ¦ ¦ ¦ ¦ No.............................¦ 1619 ¦ 293 ¦ 457 ¦ 429 ¦ 441 ¦ 1371 ¦ 202 ¦ 47 ¦ 1256 ¦ 241 ¦ 123 ¦ 1470 ¦ 40 ¦ 109 ¦ 937 ¦ 682 ¦ ¦................................¦ 55.9% ¦ 71.3% ¦ 53.1% ¦ 55.9% ¦ 51.2% ¦ 55.4% ¦ 58.7% ¦ 56.9% ¦ 57.7% ¦ 50.2% ¦ 50.3% ¦ 57.0% ¦ 52.7% ¦ 44.5% ¦ 56.0% ¦ 55.6% ¦ +--------------------------------+-------+-------+-------+-------+-------+-------+-------+-------+-------+-------+-------+-------+-------+-------+-------+-------¦ ¦(nsp/sr) ¦ ¦ ¦ ¦ ¦ ¦ ¦ ¦ ¦ ¦ ¦ ¦ ¦ ¦ ¦ ¦ ¦ ¦ (dk/na)........................¦ 78 ¦ 7 ¦ 23 ¦ 9 ¦ 39 ¦ 72 ¦ 3 ¦ 3 ¦ 49 ¦ 21 ¦ 8 ¦ 69 ¦ 1 ¦ 8 ¦ 42 ¦ 36 ¦ ¦................................¦ 2.7% ¦ 1.7% ¦ 2.7% ¦ 1.2% ¦ 4.5% ¦ 2.9% ¦ .9% ¦ 3.1% ¦ 2.3% ¦ 4.3% ¦ 3.3% ¦ 2.7% ¦ 1.3% ¦ 3.4% ¦ 2.5% ¦ 2.9% ¦ +----------------------------------------------------------------------------------------------------------------------------------------------------------------+
Interviews : 26/08/02 - 23/09/02 SOFRES s.a. - Coordination EOS GALLUP EUROPE Volume B - Page : 9

FLASH 128 : BUSINESS SURVEY - 2002
1. Pour commencer, peut-on dire que votre entreprise s'intéresse davantage 1. To begin with, would you say that your company is more interested inà encourager les ventes transfrontalières, oui ou non, encouraging cross-border sales :...(b) ... depuis l'introduction des billets et pièces en euro dans 12 pays de (b) ... since the introduction of the euro notes and coins in 12 EU-l'UE ? countries ?
*** RESULTS ARE WEIGHTED : N. of enterprises in the E.U. +----------------------------------------------------------------------------------------------------------------------------------------------------------------+ ¦ ¦ TOTAL ¦ SECTORS ¦ SIZE CATEGORIES ¦ EU COUNTRIES ACTIVITY ¦ COMPANY STATUS ¦ INTERVIEWED ¦ ¦ +-------+-------------------------------+-----------------------+-----------------------+-----------------------+---------------¦ ¦ ¦ EU 15 ¦Constru¦Indus ¦Trade ¦Servi ¦SME ¦SME ¦MAJORS ¦None ¦1-5 EU ¦6&+ EU ¦Indepen¦Mother ¦Member ¦General¦Mktg-Sa¦ ¦ ¦ ¦ction ¦try ¦ ¦ces ¦10-49 ¦50-249 ¦250+ ¦ ¦countr.¦countr.¦dant ¦Cy ¦group ¦Manager¦les Man¦ +--------------------------------+-------+-------+-------+-------+-------+-------+-------+-------+-------+-------+-------+-------+-------+-------+-------+-------¦ ¦UNWEIGHTED BASE : ..............¦ 2899 ¦ 331 ¦ 905 ¦ 802 ¦ 861 ¦ 1815 ¦ 637 ¦ 447 ¦ 2044 ¦ 526 ¦ 329 ¦ 2398 ¦ 133 ¦ 368 ¦ 1417 ¦ 1482 ¦ ¦................................¦100.0% ¦100.0% ¦100.0% ¦100.0% ¦100.0% ¦100.0% ¦100.0% ¦100.0% ¦100.0% ¦100.0% ¦100.0% ¦100.0% ¦100.0% ¦100.0% ¦100.0% ¦100.0% ¦ +--------------------------------+-------+-------+-------+-------+-------+-------+-------+-------+-------+-------+-------+-------+-------+-------+-------+-------¦ ¦Oui ¦ ¦ ¦ ¦ ¦ ¦ ¦ ¦ ¦ ¦ ¦ ¦ ¦ ¦ ¦ ¦ ¦ ¦ Yes............................¦ 936 ¦ 104 ¦ 313 ¦ 277 ¦ 242 ¦ 803 ¦ 110 ¦ 23 ¦ 676 ¦ 166 ¦ 93 ¦ 813 ¦ 33 ¦ 90 ¦ 557 ¦ 379 ¦ ¦................................¦ 32.3% ¦ 25.3% ¦ 36.3% ¦ 36.1% ¦ 28.1% ¦ 32.5% ¦ 32.0% ¦ 27.9% ¦ 31.1% ¦ 34.7% ¦ 38.2% ¦ 31.5% ¦ 43.7% ¦ 36.7% ¦ 33.3% ¦ 30.9% ¦ +--------------------------------+-------+-------+-------+-------+-------+-------+-------+-------+-------+-------+-------+-------+-------+-------+-------+-------¦ ¦Non ¦ ¦ ¦ ¦ ¦ ¦ ¦ ¦ ¦ ¦ ¦ ¦ ¦ ¦ ¦ ¦ ¦ ¦ No.............................¦ 1886 ¦ 302 ¦ 530 ¦ 469 ¦ 585 ¦ 1606 ¦ 225 ¦ 55 ¦ 1436 ¦ 304 ¦ 146 ¦ 1695 ¦ 42 ¦ 149 ¦ 1065 ¦ 821 ¦ ¦................................¦ 65.1% ¦ 73.4% ¦ 61.6% ¦ 61.1% ¦ 67.9% ¦ 64.9% ¦ 65.3% ¦ 67.2% ¦ 66.0% ¦ 63.5% ¦ 59.7% ¦ 65.7% ¦ 55.6% ¦ 60.7% ¦ 63.7% ¦ 66.9% ¦ +--------------------------------+-------+-------+-------+-------+-------+-------+-------+-------+-------+-------+-------+-------+-------+-------+-------+-------¦ ¦(nsp/sr) ¦ ¦ ¦ ¦ ¦ ¦ ¦ ¦ ¦ ¦ ¦ ¦ ¦ ¦ ¦ ¦ ¦ ¦ (dk/na)........................¦ 78 ¦ 5 ¦ 17 ¦ 21 ¦ 34 ¦ 64 ¦ 9 ¦ 4 ¦ 64 ¦ 8 ¦ 5 ¦ 70 ¦ 1 ¦ 6 ¦ 51 ¦ 27 ¦ ¦................................¦ 2.7% ¦ 1.3% ¦ 2.0% ¦ 2.8% ¦ 3.9% ¦ 2.6% ¦ 2.7% ¦ 4.9% ¦ 2.9% ¦ 1.7% ¦ 2.1% ¦ 2.7% ¦ .8% ¦ 2.6% ¦ 3.0% ¦ 2.2% ¦ +----------------------------------------------------------------------------------------------------------------------------------------------------------------+
Interviews : 26/08/02 - 23/09/02 SOFRES s.a. - Coordination EOS GALLUP EUROPE Volume B - Page : 10

FLASH 128 : BUSINESS SURVEY - 2002
2. Certains facteurs peuvent encore rendre le développement de vos ventes 2. Certain factors may still cause you particular difficulty in theet publicités encore plus difficiles partout dans l'Union européenne. development of your sales and advertising throughout the European Union.Par exemple ( ... ) : diriez-vous qu'il s'agit d'une difficulté : - très For example ( ... ) : would you say that this difficulty is : - veryimportante - plutôt importante - plutôt pas importante, ou - pas important - fairly important - fairly unimportant - not important at allimportante du tout pour développer vos ventes et publicités for developing your cross-border sales and advertising ?transfrontalières ? (a) language differences(a) les différences de langues
*** RESULTS ARE WEIGHTED : N. of enterprises in the E.U. +----------------------------------------------------------------------------------------------------------------------------------------------------------------+ ¦ ¦ TOTAL ¦ SECTORS ¦ SIZE CATEGORIES ¦ EU COUNTRIES ACTIVITY ¦ COMPANY STATUS ¦ INTERVIEWED ¦ ¦ +-------+-------------------------------+-----------------------+-----------------------+-----------------------+---------------¦ ¦ ¦ EU 15 ¦Constru¦Indus ¦Trade ¦Servi ¦SME ¦SME ¦MAJORS ¦None ¦1-5 EU ¦6&+ EU ¦Indepen¦Mother ¦Member ¦General¦Mktg-Sa¦ ¦ ¦ ¦ction ¦try ¦ ¦ces ¦10-49 ¦50-249 ¦250+ ¦ ¦countr.¦countr.¦dant ¦Cy ¦group ¦Manager¦les Man¦ +--------------------------------+-------+-------+-------+-------+-------+-------+-------+-------+-------+-------+-------+-------+-------+-------+-------+-------¦ ¦UNWEIGHTED BASE : ..............¦ 2899 ¦ 331 ¦ 905 ¦ 802 ¦ 861 ¦ 1815 ¦ 637 ¦ 447 ¦ 2044 ¦ 526 ¦ 329 ¦ 2398 ¦ 133 ¦ 368 ¦ 1417 ¦ 1482 ¦ ¦................................¦100.0% ¦100.0% ¦100.0% ¦100.0% ¦100.0% ¦100.0% ¦100.0% ¦100.0% ¦100.0% ¦100.0% ¦100.0% ¦100.0% ¦100.0% ¦100.0% ¦100.0% ¦100.0% ¦ +--------------------------------+-------+-------+-------+-------+-------+-------+-------+-------+-------+-------+-------+-------+-------+-------+-------+-------¦ ¦Très importante ¦ ¦ ¦ ¦ ¦ ¦ ¦ ¦ ¦ ¦ ¦ ¦ ¦ ¦ ¦ ¦ ¦ ¦ Very important.................¦ 405 ¦ 61 ¦ 119 ¦ 116 ¦ 110 ¦ 350 ¦ 44 ¦ 12 ¦ 316 ¦ 60 ¦ 30 ¦ 365 ¦ 7 ¦ 33 ¦ 205 ¦ 200 ¦ ¦................................¦ 14.0% ¦ 14.8% ¦ 13.8% ¦ 15.1% ¦ 12.8% ¦ 14.1% ¦ 12.7% ¦ 14.5% ¦ 14.5% ¦ 12.6% ¦ 12.2% ¦ 14.2% ¦ 9.9% ¦ 13.3% ¦ 12.3% ¦ 16.3% ¦ +--------------------------------+-------+-------+-------+-------+-------+-------+-------+-------+-------+-------+-------+-------+-------+-------+-------+-------¦ ¦Plutôt importante ¦ ¦ ¦ ¦ ¦ ¦ ¦ ¦ ¦ ¦ ¦ ¦ ¦ ¦ ¦ ¦ ¦ ¦ Fairly important...............¦ 701 ¦ 111 ¦ 201 ¦ 195 ¦ 194 ¦ 604 ¦ 78 ¦ 19 ¦ 551 ¦ 87 ¦ 63 ¦ 611 ¦ 14 ¦ 76 ¦ 400 ¦ 301 ¦ ¦................................¦ 24.2% ¦ 27.0% ¦ 23.4% ¦ 25.4% ¦ 22.5% ¦ 24.4% ¦ 22.7% ¦ 22.9% ¦ 25.3% ¦ 18.2% ¦ 25.7% ¦ 23.7% ¦ 18.6% ¦ 30.9% ¦ 23.9% ¦ 24.5% ¦ +--------------------------------+-------+-------+-------+-------+-------+-------+-------+-------+-------+-------+-------+-------+-------+-------+-------+-------¦ ¦Plutôt pas importante ¦ ¦ ¦ ¦ ¦ ¦ ¦ ¦ ¦ ¦ ¦ ¦ ¦ ¦ ¦ ¦ ¦ ¦ Fairly unimportant.............¦ 920 ¦ 134 ¦ 296 ¦ 220 ¦ 270 ¦ 770 ¦ 119 ¦ 30 ¦ 630 ¦ 206 ¦ 84 ¦ 816 ¦ 31 ¦ 73 ¦ 532 ¦ 387 ¦ ¦................................¦ 31.7% ¦ 32.6% ¦ 34.4% ¦ 28.7% ¦ 31.4% ¦ 31.1% ¦ 34.7% ¦ 36.9% ¦ 29.0% ¦ 43.0% ¦ 34.3% ¦ 31.6% ¦ 40.9% ¦ 29.8% ¦ 31.8% ¦ 31.6% ¦ +--------------------------------+-------+-------+-------+-------+-------+-------+-------+-------+-------+-------+-------+-------+-------+-------+-------+-------¦ ¦Pas importante du tout ¦ ¦ ¦ ¦ ¦ ¦ ¦ ¦ ¦ ¦ ¦ ¦ ¦ ¦ ¦ ¦ ¦ ¦ Not important at all...........¦ 782 ¦ 90 ¦ 231 ¦ 213 ¦ 247 ¦ 662 ¦ 101 ¦ 19 ¦ 600 ¦ 117 ¦ 64 ¦ 696 ¦ 22 ¦ 63 ¦ 476 ¦ 305 ¦ ¦................................¦ 27.0% ¦ 21.9% ¦ 26.9% ¦ 27.8% ¦ 28.7% ¦ 26.8% ¦ 29.4% ¦ 22.7% ¦ 27.6% ¦ 24.5% ¦ 26.3% ¦ 27.0% ¦ 29.5% ¦ 25.8% ¦ 28.5% ¦ 24.9% ¦ +--------------------------------+-------+-------+-------+-------+-------+-------+-------+-------+-------+-------+-------+-------+-------+-------+-------+-------¦ ¦(nsp/sr) ¦ ¦ ¦ ¦ ¦ ¦ ¦ ¦ ¦ ¦ ¦ ¦ ¦ ¦ ¦ ¦ ¦ ¦ (dk/na)........................¦ 91 ¦ 15 ¦ 13 ¦ 23 ¦ 40 ¦ 87 ¦ 2 ¦ 3 ¦ 80 ¦ 8 ¦ 4 ¦ 90 ¦ 1 ¦ 1 ¦ 58 ¦ 33 ¦ ¦................................¦ 3.2% ¦ 3.6% ¦ 1.6% ¦ 3.0% ¦ 4.6% ¦ 3.5% ¦ .5% ¦ 3.1% ¦ 3.7% ¦ 1.7% ¦ 1.5% ¦ 3.5% ¦ 1.1% ¦ .2% ¦ 3.5% ¦ 2.7% ¦ +--------------------------------+-------+-------+-------+-------+-------+-------+-------+-------+-------+-------+-------+-------+-------+-------+-------+-------¦ ¦INDEX 100 <==> 0................¦ 42 ¦ 45 ¦ 41 ¦ 43 ¦ 40 ¦ 42 ¦ 40 ¦ 43 ¦ 43 ¦ 40 ¦ 41 ¦ 42 ¦ 36 ¦ 44 ¦ 40 ¦ 44 ¦ ¦(Base : Répondants - Answering).¦ (2800)¦ (318)¦ (891)¦ (774)¦ (817)¦ (1733)¦ (627)¦ (440)¦ (1954)¦ (522)¦ (324)¦ (2302)¦ (132)¦ (366)¦ (1349)¦ (1451)¦ +--------------------------------+-------+-------+-------+-------+-------+-------+-------+-------+-------+-------+-------+-------+-------+-------+-------+-------¦ ¦(++/+) IMPORTANT ¦ ¦ ¦ ¦ ¦ ¦ ¦ ¦ ¦ ¦ ¦ ¦ ¦ ¦ ¦ ¦ ¦ ¦ IMPORTANT......................¦ 38.2% ¦ 41.9% ¦ 37.2% ¦ 40.5% ¦ 35.3% ¦ 38.6% ¦ 35.4% ¦ 37.4% ¦ 39.8% ¦ 30.8% ¦ 37.9% ¦ 37.9% ¦ 28.4% ¦ 44.2% ¦ 36.2% ¦ 40.9% ¦ +--------------------------------+-------+-------+-------+-------+-------+-------+-------+-------+-------+-------+-------+-------+-------+-------+-------+-------¦ ¦(--/-) PAS IMPORTANT ¦ ¦ ¦ ¦ ¦ ¦ ¦ ¦ ¦ ¦ ¦ ¦ ¦ ¦ ¦ ¦ ¦ ¦ UNIMPORTANT....................¦ 58.7% ¦ 54.5% ¦ 61.3% ¦ 56.5% ¦ 60.1% ¦ 57.9% ¦ 64.1% ¦ 59.6% ¦ 56.5% ¦ 67.5% ¦ 60.6% ¦ 58.6% ¦ 70.4% ¦ 55.6% ¦ 60.3% ¦ 56.5% ¦ +----------------------------------------------------------------------------------------------------------------------------------------------------------------+
Interviews : 26/08/02 - 23/09/02 SOFRES s.a. - Coordination EOS GALLUP EUROPE Volume B - Page : 11

FLASH 128 : BUSINESS SURVEY - 2002
2. ( ... ) : diriez-vous qu'il s'agit d'une difficulté : - très importante 2. ( ... ) : would you say that this difficulty is : - very important -- plutôt importante - plutôt pas importante, ou - pas importante du tout fairly important - fairly unimportant - not important at all forpour développer vos ventes et publicités transfrontalières ? developing your cross-border sales and advertising ?(b) (VERSION ZONE EURO :) les différentes monnaies qui subsistent au (b) (EURO ZONE VERSION :) the different currencies in circulation outsideDanemark en Suède et au Royaume Uni à côté de la zone Euro the Eurozone in Denmark, Sweden and the United Kingdom(b') (VERSION PRE-IN :) les différences de monnaies entre (NOTRE PAYS) et (b') (PRE-IN VERSION :) differences in currencies between (OUR COUNTRY) andle reste de la zone Euro the rest of the Euro zone
*** RESULTS ARE WEIGHTED : N. of enterprises in the E.U. +----------------------------------------------------------------------------------------------------------------------------------------------------------------+ ¦ ¦ TOTAL ¦ SECTORS ¦ SIZE CATEGORIES ¦ EU COUNTRIES ACTIVITY ¦ COMPANY STATUS ¦ INTERVIEWED ¦ ¦ +-------+-------------------------------+-----------------------+-----------------------+-----------------------+---------------¦ ¦ ¦ EU 15 ¦Constru¦Indus ¦Trade ¦Servi ¦SME ¦SME ¦MAJORS ¦None ¦1-5 EU ¦6&+ EU ¦Indepen¦Mother ¦Member ¦General¦Mktg-Sa¦ ¦ ¦ ¦ction ¦try ¦ ¦ces ¦10-49 ¦50-249 ¦250+ ¦ ¦countr.¦countr.¦dant ¦Cy ¦group ¦Manager¦les Man¦ +--------------------------------+-------+-------+-------+-------+-------+-------+-------+-------+-------+-------+-------+-------+-------+-------+-------+-------¦ ¦UNWEIGHTED BASE : ..............¦ 2899 ¦ 331 ¦ 905 ¦ 802 ¦ 861 ¦ 1815 ¦ 637 ¦ 447 ¦ 2044 ¦ 526 ¦ 329 ¦ 2398 ¦ 133 ¦ 368 ¦ 1417 ¦ 1482 ¦ ¦................................¦100.0% ¦100.0% ¦100.0% ¦100.0% ¦100.0% ¦100.0% ¦100.0% ¦100.0% ¦100.0% ¦100.0% ¦100.0% ¦100.0% ¦100.0% ¦100.0% ¦100.0% ¦100.0% ¦ +--------------------------------+-------+-------+-------+-------+-------+-------+-------+-------+-------+-------+-------+-------+-------+-------+-------+-------¦ ¦Très importante ¦ ¦ ¦ ¦ ¦ ¦ ¦ ¦ ¦ ¦ ¦ ¦ ¦ ¦ ¦ ¦ ¦ ¦ Very important.................¦ 222 ¦ 33 ¦ 47 ¦ 83 ¦ 58 ¦ 194 ¦ 22 ¦ 6 ¦ 187 ¦ 18 ¦ 16 ¦ 199 ¦ 3 ¦ 20 ¦ 133 ¦ 89 ¦ ¦................................¦ 7.6% ¦ 8.1% ¦ 5.4% ¦ 10.9% ¦ 6.8% ¦ 7.8% ¦ 6.4% ¦ 6.7% ¦ 8.6% ¦ 3.8% ¦ 6.7% ¦ 7.7% ¦ 3.3% ¦ 8.3% ¦ 7.9% ¦ 7.3% ¦ +--------------------------------+-------+-------+-------+-------+-------+-------+-------+-------+-------+-------+-------+-------+-------+-------+-------+-------¦ ¦Plutôt importante ¦ ¦ ¦ ¦ ¦ ¦ ¦ ¦ ¦ ¦ ¦ ¦ ¦ ¦ ¦ ¦ ¦ ¦ Fairly important...............¦ 501 ¦ 65 ¦ 149 ¦ 158 ¦ 129 ¦ 432 ¦ 53 ¦ 16 ¦ 380 ¦ 63 ¦ 57 ¦ 437 ¦ 13 ¦ 51 ¦ 285 ¦ 216 ¦ ¦................................¦ 17.3% ¦ 15.7% ¦ 17.3% ¦ 20.6% ¦ 15.0% ¦ 17.4% ¦ 15.5% ¦ 19.4% ¦ 17.5% ¦ 13.1% ¦ 23.6% ¦ 16.9% ¦ 16.8% ¦ 20.9% ¦ 17.0% ¦ 17.6% ¦ +--------------------------------+-------+-------+-------+-------+-------+-------+-------+-------+-------+-------+-------+-------+-------+-------+-------+-------¦ ¦Plutôt pas importante ¦ ¦ ¦ ¦ ¦ ¦ ¦ ¦ ¦ ¦ ¦ ¦ ¦ ¦ ¦ ¦ ¦ ¦ Fairly unimportant.............¦ 947 ¦ 148 ¦ 309 ¦ 212 ¦ 277 ¦ 791 ¦ 124 ¦ 32 ¦ 653 ¦ 216 ¦ 78 ¦ 827 ¦ 33 ¦ 86 ¦ 551 ¦ 395 ¦ ¦................................¦ 32.7% ¦ 36.0% ¦ 36.0% ¦ 27.7% ¦ 32.1% ¦ 32.0% ¦ 36.0% ¦ 38.5% ¦ 30.0% ¦ 45.0% ¦ 31.8% ¦ 32.1% ¦ 43.8% ¦ 35.2% ¦ 33.0% ¦ 32.2% ¦ +--------------------------------+-------+-------+-------+-------+-------+-------+-------+-------+-------+-------+-------+-------+-------+-------+-------+-------¦ ¦Pas importante du tout ¦ ¦ ¦ ¦ ¦ ¦ ¦ ¦ ¦ ¦ ¦ ¦ ¦ ¦ ¦ ¦ ¦ ¦ Not important at all...........¦ 1088 ¦ 144 ¦ 340 ¦ 272 ¦ 331 ¦ 925 ¦ 138 ¦ 25 ¦ 831 ¦ 169 ¦ 88 ¦ 979 ¦ 25 ¦ 85 ¦ 609 ¦ 479 ¦ ¦................................¦ 37.5% ¦ 35.1% ¦ 39.6% ¦ 35.5% ¦ 38.5% ¦ 37.4% ¦ 40.3% ¦ 31.0% ¦ 38.2% ¦ 35.4% ¦ 36.1% ¦ 38.0% ¦ 32.5% ¦ 34.8% ¦ 36.4% ¦ 39.1% ¦ +--------------------------------+-------+-------+-------+-------+-------+-------+-------+-------+-------+-------+-------+-------+-------+-------+-------+-------¦ ¦(nsp/sr) ¦ ¦ ¦ ¦ ¦ ¦ ¦ ¦ ¦ ¦ ¦ ¦ ¦ ¦ ¦ ¦ ¦ ¦ (dk/na)........................¦ 142 ¦ 21 ¦ 15 ¦ 41 ¦ 65 ¦ 132 ¦ 6 ¦ 4 ¦ 124 ¦ 13 ¦ 4 ¦ 137 ¦ 3 ¦ 2 ¦ 95 ¦ 47 ¦ ¦................................¦ 4.9% ¦ 5.0% ¦ 1.8% ¦ 5.3% ¦ 7.6% ¦ 5.3% ¦ 1.9% ¦ 4.3% ¦ 5.7% ¦ 2.7% ¦ 1.8% ¦ 5.3% ¦ 3.5% ¦ .9% ¦ 5.7% ¦ 3.8% ¦ +--------------------------------+-------+-------+-------+-------+-------+-------+-------+-------+-------+-------+-------+-------+-------+-------+-------+-------¦ ¦INDEX 100 <==> 0................¦ 32 ¦ 32 ¦ 29 ¦ 36 ¦ 30 ¦ 32 ¦ 29 ¦ 34 ¦ 32 ¦ 28 ¦ 34 ¦ 31 ¦ 30 ¦ 34 ¦ 32 ¦ 31 ¦ ¦(Base : Répondants - Answering).¦ (2766)¦ (316)¦ (881)¦ (761)¦ (808)¦ (1710)¦ (623)¦ (433)¦ (1928)¦ (517)¦ (321)¦ (2277)¦ (130)¦ (359)¦ (1328)¦ (1438)¦ +--------------------------------+-------+-------+-------+-------+-------+-------+-------+-------+-------+-------+-------+-------+-------+-------+-------+-------¦ ¦(++/+) IMPORTANT ¦ ¦ ¦ ¦ ¦ ¦ ¦ ¦ ¦ ¦ ¦ ¦ ¦ ¦ ¦ ¦ ¦ ¦ IMPORTANT......................¦ 24.9% ¦ 23.9% ¦ 22.7% ¦ 31.5% ¦ 21.8% ¦ 25.3% ¦ 21.9% ¦ 26.1% ¦ 26.1% ¦ 16.9% ¦ 30.3% ¦ 24.7% ¦ 20.2% ¦ 29.1% ¦ 25.0% ¦ 24.9% ¦ +--------------------------------+-------+-------+-------+-------+-------+-------+-------+-------+-------+-------+-------+-------+-------+-------+-------+-------¦ ¦(--/-) PAS IMPORTANT ¦ ¦ ¦ ¦ ¦ ¦ ¦ ¦ ¦ ¦ ¦ ¦ ¦ ¦ ¦ ¦ ¦ ¦ UNIMPORTANT....................¦ 70.2% ¦ 71.1% ¦ 75.5% ¦ 63.2% ¦ 70.6% ¦ 69.4% ¦ 76.2% ¦ 69.5% ¦ 68.2% ¦ 80.4% ¦ 67.9% ¦ 70.0% ¦ 76.3% ¦ 70.0% ¦ 69.4% ¦ 71.3% ¦ +----------------------------------------------------------------------------------------------------------------------------------------------------------------+
Interviews : 26/08/02 - 23/09/02 SOFRES s.a. - Coordination EOS GALLUP EUROPE Volume B - Page : 12

FLASH 128 : BUSINESS SURVEY - 2002
2. ( ... ) : diriez-vous qu'il s'agit d'une difficulté : - très importante 2. ( ... ) : would you say that this difficulty is : - very important -- plutôt importante - plutôt pas importante, ou - pas importante du tout fairly important - fairly unimportant - not important at all forpour développer vos ventes et publicités transfrontalières ? developing your cross-border sales and advertising ?(c) les différentes réglementations nationales sur les pratiques (c) need for compliance with different national regulations on commercialcommerciales, la publicité et les autres règles sur la protection des practices, advertising and other consumer protection regulationsconsommateurs auxquelles il faut se conformer
*** RESULTS ARE WEIGHTED : N. of enterprises in the E.U. +----------------------------------------------------------------------------------------------------------------------------------------------------------------+ ¦ ¦ TOTAL ¦ SECTORS ¦ SIZE CATEGORIES ¦ EU COUNTRIES ACTIVITY ¦ COMPANY STATUS ¦ INTERVIEWED ¦ ¦ +-------+-------------------------------+-----------------------+-----------------------+-----------------------+---------------¦ ¦ ¦ EU 15 ¦Constru¦Indus ¦Trade ¦Servi ¦SME ¦SME ¦MAJORS ¦None ¦1-5 EU ¦6&+ EU ¦Indepen¦Mother ¦Member ¦General¦Mktg-Sa¦ ¦ ¦ ¦ction ¦try ¦ ¦ces ¦10-49 ¦50-249 ¦250+ ¦ ¦countr.¦countr.¦dant ¦Cy ¦group ¦Manager¦les Man¦ +--------------------------------+-------+-------+-------+-------+-------+-------+-------+-------+-------+-------+-------+-------+-------+-------+-------+-------¦ ¦UNWEIGHTED BASE : ..............¦ 2899 ¦ 331 ¦ 905 ¦ 802 ¦ 861 ¦ 1815 ¦ 637 ¦ 447 ¦ 2044 ¦ 526 ¦ 329 ¦ 2398 ¦ 133 ¦ 368 ¦ 1417 ¦ 1482 ¦ ¦................................¦100.0% ¦100.0% ¦100.0% ¦100.0% ¦100.0% ¦100.0% ¦100.0% ¦100.0% ¦100.0% ¦100.0% ¦100.0% ¦100.0% ¦100.0% ¦100.0% ¦100.0% ¦100.0% ¦ +--------------------------------+-------+-------+-------+-------+-------+-------+-------+-------+-------+-------+-------+-------+-------+-------+-------+-------¦ ¦Très importante ¦ ¦ ¦ ¦ ¦ ¦ ¦ ¦ ¦ ¦ ¦ ¦ ¦ ¦ ¦ ¦ ¦ ¦ Very important.................¦ 545 ¦ 75 ¦ 145 ¦ 160 ¦ 165 ¦ 456 ¦ 71 ¦ 19 ¦ 421 ¦ 82 ¦ 42 ¦ 495 ¦ 13 ¦ 37 ¦ 342 ¦ 203 ¦ ¦................................¦ 18.8% ¦ 18.2% ¦ 16.8% ¦ 20.9% ¦ 19.2% ¦ 18.4% ¦ 20.6% ¦ 22.8% ¦ 19.3% ¦ 17.2% ¦ 17.4% ¦ 19.2% ¦ 17.1% ¦ 15.2% ¦ 20.5% ¦ 16.6% ¦ +--------------------------------+-------+-------+-------+-------+-------+-------+-------+-------+-------+-------+-------+-------+-------+-------+-------+-------¦ ¦Plutôt importante ¦ ¦ ¦ ¦ ¦ ¦ ¦ ¦ ¦ ¦ ¦ ¦ ¦ ¦ ¦ ¦ ¦ ¦ Fairly important...............¦ 826 ¦ 122 ¦ 268 ¦ 223 ¦ 213 ¦ 708 ¦ 96 ¦ 22 ¦ 621 ¦ 136 ¦ 70 ¦ 714 ¦ 24 ¦ 88 ¦ 471 ¦ 355 ¦ ¦................................¦ 28.5% ¦ 29.8% ¦ 31.1% ¦ 29.1% ¦ 24.7% ¦ 28.6% ¦ 28.0% ¦ 26.7% ¦ 28.5% ¦ 28.4% ¦ 28.6% ¦ 27.7% ¦ 31.1% ¦ 36.0% ¦ 28.2% ¦ 28.9% ¦ +--------------------------------+-------+-------+-------+-------+-------+-------+-------+-------+-------+-------+-------+-------+-------+-------+-------+-------¦ ¦Plutôt pas importante ¦ ¦ ¦ ¦ ¦ ¦ ¦ ¦ ¦ ¦ ¦ ¦ ¦ ¦ ¦ ¦ ¦ ¦ Fairly unimportant.............¦ 738 ¦ 101 ¦ 234 ¦ 189 ¦ 215 ¦ 629 ¦ 82 ¦ 26 ¦ 513 ¦ 155 ¦ 70 ¦ 644 ¦ 26 ¦ 69 ¦ 413 ¦ 325 ¦ ¦................................¦ 25.5% ¦ 24.6% ¦ 27.2% ¦ 24.6% ¦ 25.0% ¦ 25.5% ¦ 23.9% ¦ 32.2% ¦ 23.6% ¦ 32.4% ¦ 28.6% ¦ 25.0% ¦ 34.1% ¦ 28.0% ¦ 24.7% ¦ 26.5% ¦ +--------------------------------+-------+-------+-------+-------+-------+-------+-------+-------+-------+-------+-------+-------+-------+-------+-------+-------¦ ¦Pas importante du tout ¦ ¦ ¦ ¦ ¦ ¦ ¦ ¦ ¦ ¦ ¦ ¦ ¦ ¦ ¦ ¦ ¦ ¦ Not important at all...........¦ 660 ¦ 92 ¦ 194 ¦ 160 ¦ 213 ¦ 567 ¦ 83 ¦ 10 ¦ 510 ¦ 98 ¦ 52 ¦ 606 ¦ 11 ¦ 43 ¦ 380 ¦ 280 ¦ ¦................................¦ 22.8% ¦ 22.4% ¦ 22.6% ¦ 20.9% ¦ 24.8% ¦ 22.9% ¦ 24.0% ¦ 12.7% ¦ 23.4% ¦ 20.4% ¦ 21.2% ¦ 23.5% ¦ 14.2% ¦ 17.7% ¦ 22.7% ¦ 22.8% ¦ +--------------------------------+-------+-------+-------+-------+-------+-------+-------+-------+-------+-------+-------+-------+-------+-------+-------+-------¦ ¦(nsp/sr) ¦ ¦ ¦ ¦ ¦ ¦ ¦ ¦ ¦ ¦ ¦ ¦ ¦ ¦ ¦ ¦ ¦ ¦ (dk/na)........................¦ 130 ¦ 21 ¦ 20 ¦ 35 ¦ 55 ¦ 113 ¦ 12 ¦ 5 ¦ 112 ¦ 8 ¦ 10 ¦ 120 ¦ 3 ¦ 8 ¦ 66 ¦ 64 ¦ ¦................................¦ 4.5% ¦ 5.0% ¦ 2.3% ¦ 4.5% ¦ 6.4% ¦ 4.6% ¦ 3.5% ¦ 5.6% ¦ 5.1% ¦ 1.6% ¦ 4.2% ¦ 4.6% ¦ 3.5% ¦ 3.1% ¦ 4.0% ¦ 5.2% ¦ +--------------------------------+-------+-------+-------+-------+-------+-------+-------+-------+-------+-------+-------+-------+-------+-------+-------+-------¦ ¦INDEX 100 <==> 0................¦ 48 ¦ 49 ¦ 48 ¦ 51 ¦ 47 ¦ 48 ¦ 49 ¦ 54 ¦ 49 ¦ 48 ¦ 48 ¦ 48 ¦ 51 ¦ 50 ¦ 49 ¦ 47 ¦ ¦(Base : Répondants - Answering).¦ (2743)¦ (314)¦ (877)¦ (747)¦ (805)¦ (1699)¦ (614)¦ (430)¦ (1917)¦ (514)¦ (312)¦ (2262)¦ (127)¦ (354)¦ (1327)¦ (1416)¦ +--------------------------------+-------+-------+-------+-------+-------+-------+-------+-------+-------+-------+-------+-------+-------+-------+-------+-------¦ ¦(++/+) IMPORTANT ¦ ¦ ¦ ¦ ¦ ¦ ¦ ¦ ¦ ¦ ¦ ¦ ¦ ¦ ¦ ¦ ¦ ¦ IMPORTANT......................¦ 47.3% ¦ 48.0% ¦ 47.9% ¦ 50.0% ¦ 43.9% ¦ 47.0% ¦ 48.6% ¦ 49.6% ¦ 47.8% ¦ 45.5% ¦ 46.0% ¦ 46.9% ¦ 48.2% ¦ 51.2% ¦ 48.6% ¦ 45.5% ¦ +--------------------------------+-------+-------+-------+-------+-------+-------+-------+-------+-------+-------+-------+-------+-------+-------+-------+-------¦ ¦(--/-) PAS IMPORTANT ¦ ¦ ¦ ¦ ¦ ¦ ¦ ¦ ¦ ¦ ¦ ¦ ¦ ¦ ¦ ¦ ¦ ¦ UNIMPORTANT....................¦ 48.2% ¦ 47.0% ¦ 49.8% ¦ 45.5% ¦ 49.7% ¦ 48.4% ¦ 47.9% ¦ 44.9% ¦ 47.0% ¦ 52.8% ¦ 49.8% ¦ 48.5% ¦ 48.3% ¦ 45.7% ¦ 47.4% ¦ 49.3% ¦ +----------------------------------------------------------------------------------------------------------------------------------------------------------------+
Interviews : 26/08/02 - 23/09/02 SOFRES s.a. - Coordination EOS GALLUP EUROPE Volume B - Page : 13

FLASH 128 : BUSINESS SURVEY - 2002
2. ( ... ) : diriez-vous qu'il s'agit d'une difficulté : - très importante 2. ( ... ) : would you say that this difficulty is : - very important -- plutôt importante - plutôt pas importante, ou - pas importante du tout fairly important - fairly unimportant - not important at all forpour développer vos ventes et publicités transfrontalières ? developing your cross-border sales and advertising ?(d) les différentes réglementations nationales fiscales, de TVA et autres (d) need for compliance with different national fiscal regulations, VAT andauxquelles il faut se conformer others,
*** RESULTS ARE WEIGHTED : N. of enterprises in the E.U. +----------------------------------------------------------------------------------------------------------------------------------------------------------------+ ¦ ¦ TOTAL ¦ SECTORS ¦ SIZE CATEGORIES ¦ EU COUNTRIES ACTIVITY ¦ COMPANY STATUS ¦ INTERVIEWED ¦ ¦ +-------+-------------------------------+-----------------------+-----------------------+-----------------------+---------------¦ ¦ ¦ EU 15 ¦Constru¦Indus ¦Trade ¦Servi ¦SME ¦SME ¦MAJORS ¦None ¦1-5 EU ¦6&+ EU ¦Indepen¦Mother ¦Member ¦General¦Mktg-Sa¦ ¦ ¦ ¦ction ¦try ¦ ¦ces ¦10-49 ¦50-249 ¦250+ ¦ ¦countr.¦countr.¦dant ¦Cy ¦group ¦Manager¦les Man¦ +--------------------------------+-------+-------+-------+-------+-------+-------+-------+-------+-------+-------+-------+-------+-------+-------+-------+-------¦ ¦UNWEIGHTED BASE : ..............¦ 2899 ¦ 331 ¦ 905 ¦ 802 ¦ 861 ¦ 1815 ¦ 637 ¦ 447 ¦ 2044 ¦ 526 ¦ 329 ¦ 2398 ¦ 133 ¦ 368 ¦ 1417 ¦ 1482 ¦ ¦................................¦100.0% ¦100.0% ¦100.0% ¦100.0% ¦100.0% ¦100.0% ¦100.0% ¦100.0% ¦100.0% ¦100.0% ¦100.0% ¦100.0% ¦100.0% ¦100.0% ¦100.0% ¦100.0% ¦ +--------------------------------+-------+-------+-------+-------+-------+-------+-------+-------+-------+-------+-------+-------+-------+-------+-------+-------¦ ¦Très importante ¦ ¦ ¦ ¦ ¦ ¦ ¦ ¦ ¦ ¦ ¦ ¦ ¦ ¦ ¦ ¦ ¦ ¦ Very important.................¦ 620 ¦ 83 ¦ 129 ¦ 212 ¦ 196 ¦ 544 ¦ 63 ¦ 12 ¦ 506 ¦ 76 ¦ 38 ¦ 566 ¦ 15 ¦ 39 ¦ 396 ¦ 224 ¦ ¦................................¦ 21.4% ¦ 20.2% ¦ 15.0% ¦ 27.6% ¦ 22.8% ¦ 22.0% ¦ 18.4% ¦ 14.7% ¦ 23.2% ¦ 15.9% ¦ 15.6% ¦ 22.0% ¦ 19.8% ¦ 15.9% ¦ 23.7% ¦ 18.3% ¦ +--------------------------------+-------+-------+-------+-------+-------+-------+-------+-------+-------+-------+-------+-------+-------+-------+-------+-------¦ ¦Plutôt importante ¦ ¦ ¦ ¦ ¦ ¦ ¦ ¦ ¦ ¦ ¦ ¦ ¦ ¦ ¦ ¦ ¦ ¦ Fairly important...............¦ 727 ¦ 120 ¦ 212 ¦ 190 ¦ 204 ¦ 606 ¦ 98 ¦ 22 ¦ 511 ¦ 131 ¦ 85 ¦ 608 ¦ 21 ¦ 98 ¦ 346 ¦ 380 ¦ ¦................................¦ 25.1% ¦ 29.3% ¦ 24.6% ¦ 24.8% ¦ 23.7% ¦ 24.5% ¦ 28.6% ¦ 27.2% ¦ 23.5% ¦ 27.3% ¦ 35.0% ¦ 23.6% ¦ 27.2% ¦ 40.1% ¦ 20.7% ¦ 31.0% ¦ +--------------------------------+-------+-------+-------+-------+-------+-------+-------+-------+-------+-------+-------+-------+-------+-------+-------+-------¦ ¦Plutôt pas importante ¦ ¦ ¦ ¦ ¦ ¦ ¦ ¦ ¦ ¦ ¦ ¦ ¦ ¦ ¦ ¦ ¦ ¦ Fairly unimportant.............¦ 746 ¦ 96 ¦ 264 ¦ 185 ¦ 201 ¦ 630 ¦ 90 ¦ 27 ¦ 518 ¦ 164 ¦ 64 ¦ 670 ¦ 19 ¦ 57 ¦ 439 ¦ 307 ¦ ¦................................¦ 25.7% ¦ 23.4% ¦ 30.7% ¦ 24.1% ¦ 23.4% ¦ 25.5% ¦ 26.1% ¦ 32.6% ¦ 23.8% ¦ 34.1% ¦ 26.4% ¦ 26.0% ¦ 25.0% ¦ 23.3% ¦ 26.3% ¦ 25.0% ¦ +--------------------------------+-------+-------+-------+-------+-------+-------+-------+-------+-------+-------+-------+-------+-------+-------+-------+-------¦ ¦Pas importante du tout ¦ ¦ ¦ ¦ ¦ ¦ ¦ ¦ ¦ ¦ ¦ ¦ ¦ ¦ ¦ ¦ ¦ ¦ Not important at all...........¦ 667 ¦ 92 ¦ 228 ¦ 150 ¦ 197 ¦ 574 ¦ 79 ¦ 15 ¦ 530 ¦ 93 ¦ 44 ¦ 613 ¦ 12 ¦ 43 ¦ 421 ¦ 246 ¦ ¦................................¦ 23.0% ¦ 22.3% ¦ 26.5% ¦ 19.6% ¦ 22.9% ¦ 23.2% ¦ 22.8% ¦ 17.9% ¦ 24.3% ¦ 19.5% ¦ 18.1% ¦ 23.8% ¦ 15.4% ¦ 17.4% ¦ 25.2% ¦ 20.1% ¦ +--------------------------------+-------+-------+-------+-------+-------+-------+-------+-------+-------+-------+-------+-------+-------+-------+-------+-------¦ ¦(nsp/sr) ¦ ¦ ¦ ¦ ¦ ¦ ¦ ¦ ¦ ¦ ¦ ¦ ¦ ¦ ¦ ¦ ¦ ¦ (dk/na)........................¦ 139 ¦ 20 ¦ 27 ¦ 30 ¦ 62 ¦ 119 ¦ 14 ¦ 6 ¦ 112 ¦ 15 ¦ 12 ¦ 121 ¦ 10 ¦ 8 ¦ 70 ¦ 69 ¦ ¦................................¦ 4.8% ¦ 4.9% ¦ 3.1% ¦ 3.8% ¦ 7.3% ¦ 4.8% ¦ 4.0% ¦ 7.6% ¦ 5.1% ¦ 3.1% ¦ 5.0% ¦ 4.7% ¦ 12.7% ¦ 3.4% ¦ 4.2% ¦ 5.6% ¦ +--------------------------------+-------+-------+-------+-------+-------+-------+-------+-------+-------+-------+-------+-------+-------+-------+-------+-------¦ ¦INDEX 100 <==> 0................¦ 49 ¦ 50 ¦ 43 ¦ 54 ¦ 50 ¦ 49 ¦ 48 ¦ 47 ¦ 49 ¦ 47 ¦ 50 ¦ 49 ¦ 53 ¦ 52 ¦ 48 ¦ 50 ¦ ¦(Base : Répondants - Answering).¦ (2729)¦ (311)¦ (865)¦ (752)¦ (801)¦ (1697)¦ (610)¦ (422)¦ (1914)¦ (509)¦ (306)¦ (2254)¦ (124)¦ (351)¦ (1330)¦ (1399)¦ +--------------------------------+-------+-------+-------+-------+-------+-------+-------+-------+-------+-------+-------+-------+-------+-------+-------+-------¦ ¦(++/+) IMPORTANT ¦ ¦ ¦ ¦ ¦ ¦ ¦ ¦ ¦ ¦ ¦ ¦ ¦ ¦ ¦ ¦ ¦ ¦ IMPORTANT......................¦ 46.4% ¦ 49.5% ¦ 39.7% ¦ 52.4% ¦ 46.5% ¦ 46.5% ¦ 47.0% ¦ 41.9% ¦ 46.7% ¦ 43.2% ¦ 50.6% ¦ 45.5% ¦ 46.9% ¦ 55.9% ¦ 44.4% ¦ 49.3% ¦ +--------------------------------+-------+-------+-------+-------+-------+-------+-------+-------+-------+-------+-------+-------+-------+-------+-------+-------¦ ¦(--/-) PAS IMPORTANT ¦ ¦ ¦ ¦ ¦ ¦ ¦ ¦ ¦ ¦ ¦ ¦ ¦ ¦ ¦ ¦ ¦ ¦ UNIMPORTANT....................¦ 48.8% ¦ 45.6% ¦ 57.2% ¦ 43.7% ¦ 46.3% ¦ 48.7% ¦ 49.0% ¦ 50.5% ¦ 48.2% ¦ 53.7% ¦ 44.4% ¦ 49.8% ¦ 40.4% ¦ 40.7% ¦ 51.4% ¦ 45.1% ¦ +----------------------------------------------------------------------------------------------------------------------------------------------------------------+
Interviews : 26/08/02 - 23/09/02 SOFRES s.a. - Coordination EOS GALLUP EUROPE Volume B - Page : 14

FLASH 128 : BUSINESS SURVEY - 2002
2. ( ... ) : diriez-vous qu'il s'agit d'une difficulté : - très importante 2. ( ... ) : would you say that this difficulty is : - very important -- plutôt importante - plutôt pas importante, ou - pas importante du tout fairly important - fairly unimportant - not important at all forpour développer vos ventes et publicités transfrontalières ? developing your cross-border sales and advertising ?(e) des risques plus élevés de fraudes et d'impayés dans vos ventes (e) higher risk of fraud and outstanding payments in your cross-bordertransfrontalières sales
*** RESULTS ARE WEIGHTED : N. of enterprises in the E.U. +----------------------------------------------------------------------------------------------------------------------------------------------------------------+ ¦ ¦ TOTAL ¦ SECTORS ¦ SIZE CATEGORIES ¦ EU COUNTRIES ACTIVITY ¦ COMPANY STATUS ¦ INTERVIEWED ¦ ¦ +-------+-------------------------------+-----------------------+-----------------------+-----------------------+---------------¦ ¦ ¦ EU 15 ¦Constru¦Indus ¦Trade ¦Servi ¦SME ¦SME ¦MAJORS ¦None ¦1-5 EU ¦6&+ EU ¦Indepen¦Mother ¦Member ¦General¦Mktg-Sa¦ ¦ ¦ ¦ction ¦try ¦ ¦ces ¦10-49 ¦50-249 ¦250+ ¦ ¦countr.¦countr.¦dant ¦Cy ¦group ¦Manager¦les Man¦ +--------------------------------+-------+-------+-------+-------+-------+-------+-------+-------+-------+-------+-------+-------+-------+-------+-------+-------¦ ¦UNWEIGHTED BASE : ..............¦ 2899 ¦ 331 ¦ 905 ¦ 802 ¦ 861 ¦ 1815 ¦ 637 ¦ 447 ¦ 2044 ¦ 526 ¦ 329 ¦ 2398 ¦ 133 ¦ 368 ¦ 1417 ¦ 1482 ¦ ¦................................¦100.0% ¦100.0% ¦100.0% ¦100.0% ¦100.0% ¦100.0% ¦100.0% ¦100.0% ¦100.0% ¦100.0% ¦100.0% ¦100.0% ¦100.0% ¦100.0% ¦100.0% ¦100.0% ¦ +--------------------------------+-------+-------+-------+-------+-------+-------+-------+-------+-------+-------+-------+-------+-------+-------+-------+-------¦ ¦Très importante ¦ ¦ ¦ ¦ ¦ ¦ ¦ ¦ ¦ ¦ ¦ ¦ ¦ ¦ ¦ ¦ ¦ ¦ Very important.................¦ 633 ¦ 108 ¦ 155 ¦ 185 ¦ 184 ¦ 554 ¦ 69 ¦ 10 ¦ 513 ¦ 78 ¦ 42 ¦ 573 ¦ 12 ¦ 48 ¦ 371 ¦ 262 ¦ ¦................................¦ 21.8% ¦ 26.3% ¦ 18.1% ¦ 24.2% ¦ 21.4% ¦ 22.4% ¦ 20.1% ¦ 12.5% ¦ 23.6% ¦ 16.4% ¦ 17.0% ¦ 22.2% ¦ 15.8% ¦ 19.6% ¦ 22.2% ¦ 21.4% ¦ +--------------------------------+-------+-------+-------+-------+-------+-------+-------+-------+-------+-------+-------+-------+-------+-------+-------+-------¦ ¦Plutôt importante ¦ ¦ ¦ ¦ ¦ ¦ ¦ ¦ ¦ ¦ ¦ ¦ ¦ ¦ ¦ ¦ ¦ ¦ Fairly important...............¦ 687 ¦ 104 ¦ 240 ¦ 183 ¦ 160 ¦ 576 ¦ 88 ¦ 23 ¦ 500 ¦ 117 ¦ 70 ¦ 607 ¦ 15 ¦ 65 ¦ 381 ¦ 306 ¦ ¦................................¦ 23.7% ¦ 25.3% ¦ 27.9% ¦ 23.9% ¦ 18.6% ¦ 23.3% ¦ 25.5% ¦ 28.6% ¦ 23.0% ¦ 24.5% ¦ 28.6% ¦ 23.5% ¦ 20.1% ¦ 26.6% ¦ 22.8% ¦ 25.0% ¦ +--------------------------------+-------+-------+-------+-------+-------+-------+-------+-------+-------+-------+-------+-------+-------+-------+-------+-------¦ ¦Plutôt pas importante ¦ ¦ ¦ ¦ ¦ ¦ ¦ ¦ ¦ ¦ ¦ ¦ ¦ ¦ ¦ ¦ ¦ ¦ Fairly unimportant.............¦ 732 ¦ 75 ¦ 248 ¦ 178 ¦ 231 ¦ 617 ¦ 94 ¦ 22 ¦ 504 ¦ 165 ¦ 63 ¦ 639 ¦ 24 ¦ 70 ¦ 422 ¦ 310 ¦ ¦................................¦ 25.3% ¦ 18.3% ¦ 28.8% ¦ 23.3% ¦ 26.8% ¦ 24.9% ¦ 27.3% ¦ 26.4% ¦ 23.2% ¦ 34.4% ¦ 26.0% ¦ 24.8% ¦ 31.1% ¦ 28.5% ¦ 25.2% ¦ 25.3% ¦ +--------------------------------+-------+-------+-------+-------+-------+-------+-------+-------+-------+-------+-------+-------+-------+-------+-------+-------¦ ¦Pas importante du tout ¦ ¦ ¦ ¦ ¦ ¦ ¦ ¦ ¦ ¦ ¦ ¦ ¦ ¦ ¦ ¦ ¦ ¦ Not important at all...........¦ 659 ¦ 90 ¦ 183 ¦ 169 ¦ 218 ¦ 561 ¦ 77 ¦ 21 ¦ 502 ¦ 98 ¦ 59 ¦ 588 ¦ 17 ¦ 54 ¦ 396 ¦ 263 ¦ ¦................................¦ 22.7% ¦ 21.8% ¦ 21.3% ¦ 22.0% ¦ 25.3% ¦ 22.7% ¦ 22.4% ¦ 25.6% ¦ 23.1% ¦ 20.5% ¦ 24.1% ¦ 22.8% ¦ 22.5% ¦ 22.1% ¦ 23.7% ¦ 21.4% ¦ +--------------------------------+-------+-------+-------+-------+-------+-------+-------+-------+-------+-------+-------+-------+-------+-------+-------+-------¦ ¦(nsp/sr) ¦ ¦ ¦ ¦ ¦ ¦ ¦ ¦ ¦ ¦ ¦ ¦ ¦ ¦ ¦ ¦ ¦ ¦ (dk/na)........................¦ 187 ¦ 34 ¦ 34 ¦ 51 ¦ 68 ¦ 166 ¦ 16 ¦ 6 ¦ 156 ¦ 21 ¦ 10 ¦ 172 ¦ 8 ¦ 8 ¦ 103 ¦ 85 ¦ ¦................................¦ 6.5% ¦ 8.3% ¦ 4.0% ¦ 6.7% ¦ 7.9% ¦ 6.7% ¦ 4.7% ¦ 6.9% ¦ 7.2% ¦ 4.3% ¦ 4.3% ¦ 6.7% ¦ 10.6% ¦ 3.2% ¦ 6.1% ¦ 6.9% ¦ +--------------------------------+-------+-------+-------+-------+-------+-------+-------+-------+-------+-------+-------+-------+-------+-------+-------+-------¦ ¦INDEX 100 <==> 0................¦ 49 ¦ 54 ¦ 48 ¦ 51 ¦ 46 ¦ 50 ¦ 49 ¦ 43 ¦ 50 ¦ 46 ¦ 47 ¦ 49 ¦ 44 ¦ 48 ¦ 49 ¦ 50 ¦ ¦(Base : Répondants - Answering).¦ (2703)¦ (300)¦ (859)¦ (746)¦ (798)¦ (1675)¦ (608)¦ (420)¦ (1888)¦ (506)¦ (309)¦ (2230)¦ (125)¦ (348)¦ (1312)¦ (1391)¦ +--------------------------------+-------+-------+-------+-------+-------+-------+-------+-------+-------+-------+-------+-------+-------+-------+-------+-------¦ ¦(++/+) IMPORTANT ¦ ¦ ¦ ¦ ¦ ¦ ¦ ¦ ¦ ¦ ¦ ¦ ¦ ¦ ¦ ¦ ¦ ¦ IMPORTANT......................¦ 45.5% ¦ 51.6% ¦ 46.0% ¦ 48.0% ¦ 40.0% ¦ 45.7% ¦ 45.6% ¦ 41.0% ¦ 46.6% ¦ 40.8% ¦ 45.6% ¦ 45.8% ¦ 35.8% ¦ 46.3% ¦ 45.0% ¦ 46.3% ¦ +--------------------------------+-------+-------+-------+-------+-------+-------+-------+-------+-------+-------+-------+-------+-------+-------+-------+-------¦ ¦(--/-) PAS IMPORTANT ¦ ¦ ¦ ¦ ¦ ¦ ¦ ¦ ¦ ¦ ¦ ¦ ¦ ¦ ¦ ¦ ¦ ¦ UNIMPORTANT....................¦ 48.0% ¦ 40.1% ¦ 50.1% ¦ 45.3% ¦ 52.1% ¦ 47.6% ¦ 49.7% ¦ 52.0% ¦ 46.2% ¦ 54.9% ¦ 50.1% ¦ 47.6% ¦ 53.6% ¦ 50.6% ¦ 48.9% ¦ 46.8% ¦ +----------------------------------------------------------------------------------------------------------------------------------------------------------------+
Interviews : 26/08/02 - 23/09/02 SOFRES s.a. - Coordination EOS GALLUP EUROPE Volume B - Page : 15

FLASH 128 : BUSINESS SURVEY - 2002
2. ( ... ) : diriez-vous qu'il s'agit d'une difficulté : - très importante 2. ( ... ) : would you say that this difficulty is : - very important -- plutôt importante - plutôt pas importante, ou - pas importante du tout fairly important - fairly unimportant - not important at all forpour développer vos ventes et publicités transfrontalières ? developing your cross-border sales and advertising ?(f) de plus grandes difficultés pour résoudre les plaintes et les conflits (f) greater difficulty in resolving cross-border complaints and conflictstransfrontaliers
*** RESULTS ARE WEIGHTED : N. of enterprises in the E.U. +----------------------------------------------------------------------------------------------------------------------------------------------------------------+ ¦ ¦ TOTAL ¦ SECTORS ¦ SIZE CATEGORIES ¦ EU COUNTRIES ACTIVITY ¦ COMPANY STATUS ¦ INTERVIEWED ¦ ¦ +-------+-------------------------------+-----------------------+-----------------------+-----------------------+---------------¦ ¦ ¦ EU 15 ¦Constru¦Indus ¦Trade ¦Servi ¦SME ¦SME ¦MAJORS ¦None ¦1-5 EU ¦6&+ EU ¦Indepen¦Mother ¦Member ¦General¦Mktg-Sa¦ ¦ ¦ ¦ction ¦try ¦ ¦ces ¦10-49 ¦50-249 ¦250+ ¦ ¦countr.¦countr.¦dant ¦Cy ¦group ¦Manager¦les Man¦ +--------------------------------+-------+-------+-------+-------+-------+-------+-------+-------+-------+-------+-------+-------+-------+-------+-------+-------¦ ¦UNWEIGHTED BASE : ..............¦ 2899 ¦ 331 ¦ 905 ¦ 802 ¦ 861 ¦ 1815 ¦ 637 ¦ 447 ¦ 2044 ¦ 526 ¦ 329 ¦ 2398 ¦ 133 ¦ 368 ¦ 1417 ¦ 1482 ¦ ¦................................¦100.0% ¦100.0% ¦100.0% ¦100.0% ¦100.0% ¦100.0% ¦100.0% ¦100.0% ¦100.0% ¦100.0% ¦100.0% ¦100.0% ¦100.0% ¦100.0% ¦100.0% ¦100.0% ¦ +--------------------------------+-------+-------+-------+-------+-------+-------+-------+-------+-------+-------+-------+-------+-------+-------+-------+-------¦ ¦Très importante ¦ ¦ ¦ ¦ ¦ ¦ ¦ ¦ ¦ ¦ ¦ ¦ ¦ ¦ ¦ ¦ ¦ ¦ Very important.................¦ 526 ¦ 93 ¦ 125 ¦ 150 ¦ 159 ¦ 463 ¦ 54 ¦ 9 ¦ 420 ¦ 65 ¦ 41 ¦ 481 ¦ 10 ¦ 35 ¦ 315 ¦ 211 ¦ ¦................................¦ 18.1% ¦ 22.5% ¦ 14.5% ¦ 19.5% ¦ 18.5% ¦ 18.7% ¦ 15.7% ¦ 11.5% ¦ 19.3% ¦ 13.6% ¦ 16.7% ¦ 18.7% ¦ 12.8% ¦ 14.5% ¦ 18.8% ¦ 17.2% ¦ +--------------------------------+-------+-------+-------+-------+-------+-------+-------+-------+-------+-------+-------+-------+-------+-------+-------+-------¦ ¦Plutôt importante ¦ ¦ ¦ ¦ ¦ ¦ ¦ ¦ ¦ ¦ ¦ ¦ ¦ ¦ ¦ ¦ ¦ ¦ Fairly important...............¦ 819 ¦ 128 ¦ 274 ¦ 214 ¦ 204 ¦ 681 ¦ 116 ¦ 22 ¦ 620 ¦ 142 ¦ 57 ¦ 724 ¦ 20 ¦ 75 ¦ 457 ¦ 363 ¦ ¦................................¦ 28.3% ¦ 31.0% ¦ 31.9% ¦ 27.9% ¦ 23.7% ¦ 27.5% ¦ 33.8% ¦ 26.7% ¦ 28.5% ¦ 29.7% ¦ 23.3% ¦ 28.1% ¦ 26.7% ¦ 30.6% ¦ 27.3% ¦ 29.6% ¦ +--------------------------------+-------+-------+-------+-------+-------+-------+-------+-------+-------+-------+-------+-------+-------+-------+-------+-------¦ ¦Plutôt pas importante ¦ ¦ ¦ ¦ ¦ ¦ ¦ ¦ ¦ ¦ ¦ ¦ ¦ ¦ ¦ ¦ ¦ ¦ Fairly unimportant.............¦ 705 ¦ 71 ¦ 214 ¦ 184 ¦ 236 ¦ 591 ¦ 88 ¦ 27 ¦ 442 ¦ 178 ¦ 85 ¦ 596 ¦ 28 ¦ 82 ¦ 376 ¦ 329 ¦ ¦................................¦ 24.3% ¦ 17.3% ¦ 24.9% ¦ 24.0% ¦ 27.4% ¦ 23.9% ¦ 25.5% ¦ 33.0% ¦ 20.3% ¦ 37.2% ¦ 35.0% ¦ 23.1% ¦ 36.4% ¦ 33.3% ¦ 22.5% ¦ 26.8% ¦ +--------------------------------+-------+-------+-------+-------+-------+-------+-------+-------+-------+-------+-------+-------+-------+-------+-------+-------¦ ¦Pas importante du tout ¦ ¦ ¦ ¦ ¦ ¦ ¦ ¦ ¦ ¦ ¦ ¦ ¦ ¦ ¦ ¦ ¦ ¦ Not important at all...........¦ 683 ¦ 80 ¦ 216 ¦ 172 ¦ 215 ¦ 588 ¦ 76 ¦ 19 ¦ 551 ¦ 80 ¦ 52 ¦ 621 ¦ 14 ¦ 47 ¦ 430 ¦ 253 ¦ ¦................................¦ 23.5% ¦ 19.4% ¦ 25.1% ¦ 22.5% ¦ 25.0% ¦ 23.8% ¦ 22.0% ¦ 23.0% ¦ 25.3% ¦ 16.7% ¦ 21.5% ¦ 24.1% ¦ 18.9% ¦ 19.2% ¦ 25.7% ¦ 20.6% ¦ +--------------------------------+-------+-------+-------+-------+-------+-------+-------+-------+-------+-------+-------+-------+-------+-------+-------+-------¦ ¦(nsp/sr) ¦ ¦ ¦ ¦ ¦ ¦ ¦ ¦ ¦ ¦ ¦ ¦ ¦ ¦ ¦ ¦ ¦ ¦ (dk/na)........................¦ 166 ¦ 40 ¦ 31 ¦ 47 ¦ 48 ¦ 150 ¦ 11 ¦ 5 ¦ 143 ¦ 14 ¦ 9 ¦ 156 ¦ 4 ¦ 6 ¦ 95 ¦ 71 ¦ ¦................................¦ 5.7% ¦ 9.7% ¦ 3.6% ¦ 6.1% ¦ 5.6% ¦ 6.1% ¦ 3.1% ¦ 5.8% ¦ 6.6% ¦ 2.9% ¦ 3.5% ¦ 6.0% ¦ 5.2% ¦ 2.5% ¦ 5.7% ¦ 5.8% ¦ +--------------------------------+-------+-------+-------+-------+-------+-------+-------+-------+-------+-------+-------+-------+-------+-------+-------+-------¦ ¦INDEX 100 <==> 0................¦ 48 ¦ 54 ¦ 46 ¦ 49 ¦ 46 ¦ 48 ¦ 48 ¦ 43 ¦ 48 ¦ 47 ¦ 45 ¦ 48 ¦ 45 ¦ 47 ¦ 47 ¦ 49 ¦ ¦(Base : Répondants - Answering).¦ (2718)¦ (302)¦ (869)¦ (742)¦ (805)¦ (1677)¦ (613)¦ (428)¦ (1894)¦ (513)¦ (311)¦ (2238)¦ (128)¦ (352)¦ (1314)¦ (1404)¦ +--------------------------------+-------+-------+-------+-------+-------+-------+-------+-------+-------+-------+-------+-------+-------+-------+-------+-------¦ ¦(++/+) IMPORTANT ¦ ¦ ¦ ¦ ¦ ¦ ¦ ¦ ¦ ¦ ¦ ¦ ¦ ¦ ¦ ¦ ¦ ¦ IMPORTANT......................¦ 46.4% ¦ 53.6% ¦ 46.4% ¦ 47.4% ¦ 42.1% ¦ 46.3% ¦ 49.4% ¦ 38.2% ¦ 47.8% ¦ 43.3% ¦ 40.0% ¦ 46.7% ¦ 39.5% ¦ 45.0% ¦ 46.1% ¦ 46.8% ¦ +--------------------------------+-------+-------+-------+-------+-------+-------+-------+-------+-------+-------+-------+-------+-------+-------+-------+-------¦ ¦(--/-) PAS IMPORTANT ¦ ¦ ¦ ¦ ¦ ¦ ¦ ¦ ¦ ¦ ¦ ¦ ¦ ¦ ¦ ¦ ¦ ¦ UNIMPORTANT....................¦ 47.9% ¦ 36.7% ¦ 50.0% ¦ 46.5% ¦ 52.3% ¦ 47.7% ¦ 47.5% ¦ 56.0% ¦ 45.6% ¦ 53.8% ¦ 56.5% ¦ 47.2% ¦ 55.3% ¦ 52.4% ¦ 48.2% ¦ 47.5% ¦ +----------------------------------------------------------------------------------------------------------------------------------------------------------------+
Interviews : 26/08/02 - 23/09/02 SOFRES s.a. - Coordination EOS GALLUP EUROPE Volume B - Page : 16

FLASH 128 : BUSINESS SURVEY - 2002
2. ( ... ) : diriez-vous qu'il s'agit d'une difficulté : - très importante 2. ( ... ) : would you say that this difficulty is : - very important -- plutôt importante - plutôt pas importante, ou - pas importante du tout fairly important - fairly unimportant - not important at all forpour développer vos ventes et publicités transfrontalières ? developing your cross-border sales and advertising ?(g) de plus grandes difficultés pour assurer un service après-vente (g) greater difficulty in ensuring an efficient cross-border after-salesefficace transfrontalier. service.
*** RESULTS ARE WEIGHTED : N. of enterprises in the E.U. +----------------------------------------------------------------------------------------------------------------------------------------------------------------+ ¦ ¦ TOTAL ¦ SECTORS ¦ SIZE CATEGORIES ¦ EU COUNTRIES ACTIVITY ¦ COMPANY STATUS ¦ INTERVIEWED ¦ ¦ +-------+-------------------------------+-----------------------+-----------------------+-----------------------+---------------¦ ¦ ¦ EU 15 ¦Constru¦Indus ¦Trade ¦Servi ¦SME ¦SME ¦MAJORS ¦None ¦1-5 EU ¦6&+ EU ¦Indepen¦Mother ¦Member ¦General¦Mktg-Sa¦ ¦ ¦ ¦ction ¦try ¦ ¦ces ¦10-49 ¦50-249 ¦250+ ¦ ¦countr.¦countr.¦dant ¦Cy ¦group ¦Manager¦les Man¦ +--------------------------------+-------+-------+-------+-------+-------+-------+-------+-------+-------+-------+-------+-------+-------+-------+-------+-------¦ ¦UNWEIGHTED BASE : ..............¦ 2899 ¦ 331 ¦ 905 ¦ 802 ¦ 861 ¦ 1815 ¦ 637 ¦ 447 ¦ 2044 ¦ 526 ¦ 329 ¦ 2398 ¦ 133 ¦ 368 ¦ 1417 ¦ 1482 ¦ ¦................................¦100.0% ¦100.0% ¦100.0% ¦100.0% ¦100.0% ¦100.0% ¦100.0% ¦100.0% ¦100.0% ¦100.0% ¦100.0% ¦100.0% ¦100.0% ¦100.0% ¦100.0% ¦100.0% ¦ +--------------------------------+-------+-------+-------+-------+-------+-------+-------+-------+-------+-------+-------+-------+-------+-------+-------+-------¦ ¦Très importante ¦ ¦ ¦ ¦ ¦ ¦ ¦ ¦ ¦ ¦ ¦ ¦ ¦ ¦ ¦ ¦ ¦ ¦ Very important.................¦ 480 ¦ 103 ¦ 121 ¦ 142 ¦ 114 ¦ 418 ¦ 53 ¦ 10 ¦ 381 ¦ 61 ¦ 39 ¦ 440 ¦ 9 ¦ 32 ¦ 281 ¦ 199 ¦ ¦................................¦ 16.6% ¦ 25.1% ¦ 14.1% ¦ 18.5% ¦ 13.2% ¦ 16.9% ¦ 15.3% ¦ 12.1% ¦ 17.5% ¦ 12.7% ¦ 15.9% ¦ 17.1% ¦ 12.2% ¦ 12.9% ¦ 16.8% ¦ 16.2% ¦ +--------------------------------+-------+-------+-------+-------+-------+-------+-------+-------+-------+-------+-------+-------+-------+-------+-------+-------¦ ¦Plutôt importante ¦ ¦ ¦ ¦ ¦ ¦ ¦ ¦ ¦ ¦ ¦ ¦ ¦ ¦ ¦ ¦ ¦ ¦ Fairly important...............¦ 696 ¦ 86 ¦ 242 ¦ 190 ¦ 177 ¦ 579 ¦ 99 ¦ 18 ¦ 504 ¦ 133 ¦ 59 ¦ 617 ¦ 18 ¦ 60 ¦ 383 ¦ 312 ¦ ¦................................¦ 24.0% ¦ 21.0% ¦ 28.1% ¦ 24.8% ¦ 20.6% ¦ 23.4% ¦ 28.8% ¦ 21.6% ¦ 23.1% ¦ 27.8% ¦ 24.1% ¦ 23.9% ¦ 24.1% ¦ 24.6% ¦ 22.9% ¦ 25.5% ¦ +--------------------------------+-------+-------+-------+-------+-------+-------+-------+-------+-------+-------+-------+-------+-------+-------+-------+-------¦ ¦Plutôt pas importante ¦ ¦ ¦ ¦ ¦ ¦ ¦ ¦ ¦ ¦ ¦ ¦ ¦ ¦ ¦ ¦ ¦ ¦ Fairly unimportant.............¦ 786 ¦ 107 ¦ 221 ¦ 197 ¦ 261 ¦ 675 ¦ 83 ¦ 28 ¦ 539 ¦ 169 ¦ 78 ¦ 684 ¦ 22 ¦ 80 ¦ 448 ¦ 338 ¦ ¦................................¦ 27.1% ¦ 26.0% ¦ 25.6% ¦ 25.7% ¦ 30.4% ¦ 27.3% ¦ 24.1% ¦ 33.8% ¦ 24.8% ¦ 35.3% ¦ 31.9% ¦ 26.5% ¦ 29.5% ¦ 32.6% ¦ 26.8% ¦ 27.5% ¦ +--------------------------------+-------+-------+-------+-------+-------+-------+-------+-------+-------+-------+-------+-------+-------+-------+-------+-------¦ ¦Pas importante du tout ¦ ¦ ¦ ¦ ¦ ¦ ¦ ¦ ¦ ¦ ¦ ¦ ¦ ¦ ¦ ¦ ¦ ¦ Not important at all...........¦ 741 ¦ 83 ¦ 238 ¦ 184 ¦ 236 ¦ 629 ¦ 91 ¦ 21 ¦ 591 ¦ 94 ¦ 56 ¦ 662 ¦ 19 ¦ 60 ¦ 447 ¦ 294 ¦ ¦................................¦ 25.6% ¦ 20.2% ¦ 27.7% ¦ 24.0% ¦ 27.5% ¦ 25.4% ¦ 26.6% ¦ 25.6% ¦ 27.1% ¦ 19.7% ¦ 23.2% ¦ 25.7% ¦ 25.4% ¦ 24.4% ¦ 26.7% ¦ 24.0% ¦ +--------------------------------+-------+-------+-------+-------+-------+-------+-------+-------+-------+-------+-------+-------+-------+-------+-------+-------¦ ¦(nsp/sr) ¦ ¦ ¦ ¦ ¦ ¦ ¦ ¦ ¦ ¦ ¦ ¦ ¦ ¦ ¦ ¦ ¦ ¦ (dk/na)........................¦ 196 ¦ 32 ¦ 38 ¦ 55 ¦ 71 ¦ 172 ¦ 18 ¦ 6 ¦ 162 ¦ 21 ¦ 12 ¦ 175 ¦ 7 ¦ 14 ¦ 112 ¦ 83 ¦ ¦................................¦ 6.7% ¦ 7.7% ¦ 4.4% ¦ 7.1% ¦ 8.3% ¦ 7.0% ¦ 5.3% ¦ 6.8% ¦ 7.5% ¦ 4.4% ¦ 4.9% ¦ 6.8% ¦ 8.8% ¦ 5.6% ¦ 6.7% ¦ 6.8% ¦ +--------------------------------+-------+-------+-------+-------+-------+-------+-------+-------+-------+-------+-------+-------+-------+-------+-------+-------¦ ¦INDEX 100 <==> 0................¦ 45 ¦ 52 ¦ 43 ¦ 47 ¦ 40 ¦ 45 ¦ 45 ¦ 41 ¦ 44 ¦ 45 ¦ 45 ¦ 45 ¦ 42 ¦ 42 ¦ 44 ¦ 45 ¦ ¦(Base : Répondants - Answering).¦ (2695)¦ (308)¦ (861)¦ (740)¦ (786)¦ (1673)¦ (603)¦ (419)¦ (1884)¦ (502)¦ (309)¦ (2223)¦ (125)¦ (347)¦ (1294)¦ (1401)¦ +--------------------------------+-------+-------+-------+-------+-------+-------+-------+-------+-------+-------+-------+-------+-------+-------+-------+-------¦ ¦(++/+) IMPORTANT ¦ ¦ ¦ ¦ ¦ ¦ ¦ ¦ ¦ ¦ ¦ ¦ ¦ ¦ ¦ ¦ ¦ ¦ IMPORTANT......................¦ 40.6% ¦ 46.1% ¦ 42.3% ¦ 43.2% ¦ 33.9% ¦ 40.3% ¦ 44.1% ¦ 33.7% ¦ 40.6% ¦ 40.6% ¦ 40.0% ¦ 41.0% ¦ 36.4% ¦ 37.5% ¦ 39.7% ¦ 41.7% ¦ +--------------------------------+-------+-------+-------+-------+-------+-------+-------+-------+-------+-------+-------+-------+-------+-------+-------+-------¦ ¦(--/-) PAS IMPORTANT ¦ ¦ ¦ ¦ ¦ ¦ ¦ ¦ ¦ ¦ ¦ ¦ ¦ ¦ ¦ ¦ ¦ ¦ UNIMPORTANT....................¦ 52.7% ¦ 46.2% ¦ 53.3% ¦ 49.6% ¦ 57.8% ¦ 52.7% ¦ 50.7% ¦ 59.5% ¦ 51.9% ¦ 55.0% ¦ 55.1% ¦ 52.2% ¦ 54.9% ¦ 56.9% ¦ 53.5% ¦ 51.5% ¦ +----------------------------------------------------------------------------------------------------------------------------------------------------------------+
Interviews : 26/08/02 - 23/09/02 SOFRES s.a. - Coordination EOS GALLUP EUROPE Volume B - Page : 17
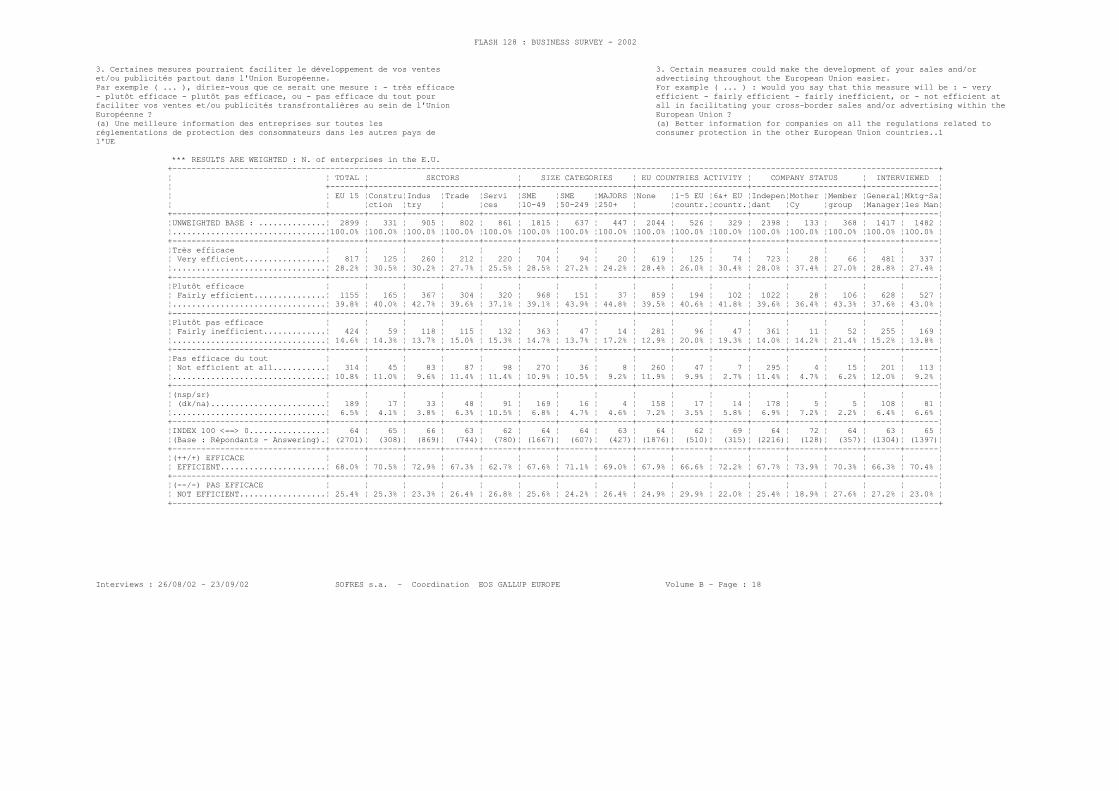
FLASH 128 : BUSINESS SURVEY - 2002
3. Certaines mesures pourraient faciliter le développement de vos ventes 3. Certain measures could make the development of your sales and/oret/ou publicités partout dans l'Union Européenne. advertising throughout the European Union easier.Par exemple ( ... ), diriez-vous que ce serait une mesure : - très efficace For example ( ... ) : would you say that this measure will be : - very- plutôt efficace - plutôt pas efficace, ou - pas efficace du tout pour efficient - fairly efficient - fairly inefficient, or - not efficient atfaciliter vos ventes et/ou publicités transfrontalières au sein de l'Union all in facilitating your cross-border sales and/or advertising within theEuropéenne ? European Union ?(a) Une meilleure information des entreprises sur toutes les (a) Better information for companies on all the regulations related toréglementations de protection des consommateurs dans les autres pays de consumer protection in the other European Union countries..1l'UE
*** RESULTS ARE WEIGHTED : N. of enterprises in the E.U. +----------------------------------------------------------------------------------------------------------------------------------------------------------------+ ¦ ¦ TOTAL ¦ SECTORS ¦ SIZE CATEGORIES ¦ EU COUNTRIES ACTIVITY ¦ COMPANY STATUS ¦ INTERVIEWED ¦ ¦ +-------+-------------------------------+-----------------------+-----------------------+-----------------------+---------------¦ ¦ ¦ EU 15 ¦Constru¦Indus ¦Trade ¦Servi ¦SME ¦SME ¦MAJORS ¦None ¦1-5 EU ¦6&+ EU ¦Indepen¦Mother ¦Member ¦General¦Mktg-Sa¦ ¦ ¦ ¦ction ¦try ¦ ¦ces ¦10-49 ¦50-249 ¦250+ ¦ ¦countr.¦countr.¦dant ¦Cy ¦group ¦Manager¦les Man¦ +--------------------------------+-------+-------+-------+-------+-------+-------+-------+-------+-------+-------+-------+-------+-------+-------+-------+-------¦ ¦UNWEIGHTED BASE : ..............¦ 2899 ¦ 331 ¦ 905 ¦ 802 ¦ 861 ¦ 1815 ¦ 637 ¦ 447 ¦ 2044 ¦ 526 ¦ 329 ¦ 2398 ¦ 133 ¦ 368 ¦ 1417 ¦ 1482 ¦ ¦................................¦100.0% ¦100.0% ¦100.0% ¦100.0% ¦100.0% ¦100.0% ¦100.0% ¦100.0% ¦100.0% ¦100.0% ¦100.0% ¦100.0% ¦100.0% ¦100.0% ¦100.0% ¦100.0% ¦ +--------------------------------+-------+-------+-------+-------+-------+-------+-------+-------+-------+-------+-------+-------+-------+-------+-------+-------¦ ¦Très efficace ¦ ¦ ¦ ¦ ¦ ¦ ¦ ¦ ¦ ¦ ¦ ¦ ¦ ¦ ¦ ¦ ¦ ¦ Very efficient.................¦ 817 ¦ 125 ¦ 260 ¦ 212 ¦ 220 ¦ 704 ¦ 94 ¦ 20 ¦ 619 ¦ 125 ¦ 74 ¦ 723 ¦ 28 ¦ 66 ¦ 481 ¦ 337 ¦ ¦................................¦ 28.2% ¦ 30.5% ¦ 30.2% ¦ 27.7% ¦ 25.5% ¦ 28.5% ¦ 27.2% ¦ 24.2% ¦ 28.4% ¦ 26.0% ¦ 30.4% ¦ 28.0% ¦ 37.4% ¦ 27.0% ¦ 28.8% ¦ 27.4% ¦ +--------------------------------+-------+-------+-------+-------+-------+-------+-------+-------+-------+-------+-------+-------+-------+-------+-------+-------¦ ¦Plutôt efficace ¦ ¦ ¦ ¦ ¦ ¦ ¦ ¦ ¦ ¦ ¦ ¦ ¦ ¦ ¦ ¦ ¦ ¦ Fairly efficient...............¦ 1155 ¦ 165 ¦ 367 ¦ 304 ¦ 320 ¦ 968 ¦ 151 ¦ 37 ¦ 859 ¦ 194 ¦ 102 ¦ 1022 ¦ 28 ¦ 106 ¦ 628 ¦ 527 ¦ ¦................................¦ 39.8% ¦ 40.0% ¦ 42.7% ¦ 39.6% ¦ 37.1% ¦ 39.1% ¦ 43.9% ¦ 44.8% ¦ 39.5% ¦ 40.6% ¦ 41.8% ¦ 39.6% ¦ 36.4% ¦ 43.3% ¦ 37.6% ¦ 43.0% ¦ +--------------------------------+-------+-------+-------+-------+-------+-------+-------+-------+-------+-------+-------+-------+-------+-------+-------+-------¦ ¦Plutôt pas efficace ¦ ¦ ¦ ¦ ¦ ¦ ¦ ¦ ¦ ¦ ¦ ¦ ¦ ¦ ¦ ¦ ¦ ¦ Fairly inefficient.............¦ 424 ¦ 59 ¦ 118 ¦ 115 ¦ 132 ¦ 363 ¦ 47 ¦ 14 ¦ 281 ¦ 96 ¦ 47 ¦ 361 ¦ 11 ¦ 52 ¦ 255 ¦ 169 ¦ ¦................................¦ 14.6% ¦ 14.3% ¦ 13.7% ¦ 15.0% ¦ 15.3% ¦ 14.7% ¦ 13.7% ¦ 17.2% ¦ 12.9% ¦ 20.0% ¦ 19.3% ¦ 14.0% ¦ 14.2% ¦ 21.4% ¦ 15.2% ¦ 13.8% ¦ +--------------------------------+-------+-------+-------+-------+-------+-------+-------+-------+-------+-------+-------+-------+-------+-------+-------+-------¦ ¦Pas efficace du tout ¦ ¦ ¦ ¦ ¦ ¦ ¦ ¦ ¦ ¦ ¦ ¦ ¦ ¦ ¦ ¦ ¦ ¦ Not efficient at all...........¦ 314 ¦ 45 ¦ 83 ¦ 87 ¦ 98 ¦ 270 ¦ 36 ¦ 8 ¦ 260 ¦ 47 ¦ 7 ¦ 295 ¦ 4 ¦ 15 ¦ 201 ¦ 113 ¦ ¦................................¦ 10.8% ¦ 11.0% ¦ 9.6% ¦ 11.4% ¦ 11.4% ¦ 10.9% ¦ 10.5% ¦ 9.2% ¦ 11.9% ¦ 9.9% ¦ 2.7% ¦ 11.4% ¦ 4.7% ¦ 6.2% ¦ 12.0% ¦ 9.2% ¦ +--------------------------------+-------+-------+-------+-------+-------+-------+-------+-------+-------+-------+-------+-------+-------+-------+-------+-------¦ ¦(nsp/sr) ¦ ¦ ¦ ¦ ¦ ¦ ¦ ¦ ¦ ¦ ¦ ¦ ¦ ¦ ¦ ¦ ¦ ¦ (dk/na)........................¦ 189 ¦ 17 ¦ 33 ¦ 48 ¦ 91 ¦ 169 ¦ 16 ¦ 4 ¦ 158 ¦ 17 ¦ 14 ¦ 178 ¦ 5 ¦ 5 ¦ 108 ¦ 81 ¦ ¦................................¦ 6.5% ¦ 4.1% ¦ 3.8% ¦ 6.3% ¦ 10.5% ¦ 6.8% ¦ 4.7% ¦ 4.6% ¦ 7.2% ¦ 3.5% ¦ 5.8% ¦ 6.9% ¦ 7.2% ¦ 2.2% ¦ 6.4% ¦ 6.6% ¦ +--------------------------------+-------+-------+-------+-------+-------+-------+-------+-------+-------+-------+-------+-------+-------+-------+-------+-------¦ ¦INDEX 100 <==> 0................¦ 64 ¦ 65 ¦ 66 ¦ 63 ¦ 62 ¦ 64 ¦ 64 ¦ 63 ¦ 64 ¦ 62 ¦ 69 ¦ 64 ¦ 72 ¦ 64 ¦ 63 ¦ 65 ¦ ¦(Base : Répondants - Answering).¦ (2701)¦ (308)¦ (869)¦ (744)¦ (780)¦ (1667)¦ (607)¦ (427)¦ (1876)¦ (510)¦ (315)¦ (2216)¦ (128)¦ (357)¦ (1304)¦ (1397)¦ +--------------------------------+-------+-------+-------+-------+-------+-------+-------+-------+-------+-------+-------+-------+-------+-------+-------+-------¦ ¦(++/+) EFFICACE ¦ ¦ ¦ ¦ ¦ ¦ ¦ ¦ ¦ ¦ ¦ ¦ ¦ ¦ ¦ ¦ ¦ ¦ EFFICIENT......................¦ 68.0% ¦ 70.5% ¦ 72.9% ¦ 67.3% ¦ 62.7% ¦ 67.6% ¦ 71.1% ¦ 69.0% ¦ 67.9% ¦ 66.6% ¦ 72.2% ¦ 67.7% ¦ 73.9% ¦ 70.3% ¦ 66.3% ¦ 70.4% ¦ +--------------------------------+-------+-------+-------+-------+-------+-------+-------+-------+-------+-------+-------+-------+-------+-------+-------+-------¦ ¦(--/-) PAS EFFICACE ¦ ¦ ¦ ¦ ¦ ¦ ¦ ¦ ¦ ¦ ¦ ¦ ¦ ¦ ¦ ¦ ¦ ¦ NOT EFFICIENT..................¦ 25.4% ¦ 25.3% ¦ 23.3% ¦ 26.4% ¦ 26.8% ¦ 25.6% ¦ 24.2% ¦ 26.4% ¦ 24.9% ¦ 29.9% ¦ 22.0% ¦ 25.4% ¦ 18.9% ¦ 27.6% ¦ 27.2% ¦ 23.0% ¦ +----------------------------------------------------------------------------------------------------------------------------------------------------------------+
Interviews : 26/08/02 - 23/09/02 SOFRES s.a. - Coordination EOS GALLUP EUROPE Volume B - Page : 18

FLASH 128 : BUSINESS SURVEY - 2002
3. ( ... ), diriez-vous que ce serait une mesure : - très efficace - plutôt 3. ( ... ) : would you say that this measure will be : - very efficient -efficace - plutôt pas efficace, ou - pas efficace du tout pour faciliter fairly efficient - fairly inefficient, or - not efficient at all invos ventes et/ou publicités transfrontalières au sein de l'Union facilitating your cross-border sales and/or advertising within theEuropéenne ? European Union ?(b) (VERSION ZONE EURO :) Le passage à l'euro des dernières monnaies (b) (EURO ZONE VERSION :) Replacement of the remaining national currenciesnationales qui subsistent : au Danemark, en Suède et au Royaume-Uni with the Euro : in Denmark, Sweden and the United Kingdom(b') (VERSION PRE-IN :) l'adoption de l'euro par (NOTRE PAYS) (b') (PRE-IN VERSION :) adoption of the Euro by (OUR COUNTRY)
*** RESULTS ARE WEIGHTED : N. of enterprises in the E.U. +----------------------------------------------------------------------------------------------------------------------------------------------------------------+ ¦ ¦ TOTAL ¦ SECTORS ¦ SIZE CATEGORIES ¦ EU COUNTRIES ACTIVITY ¦ COMPANY STATUS ¦ INTERVIEWED ¦ ¦ +-------+-------------------------------+-----------------------+-----------------------+-----------------------+---------------¦ ¦ ¦ EU 15 ¦Constru¦Indus ¦Trade ¦Servi ¦SME ¦SME ¦MAJORS ¦None ¦1-5 EU ¦6&+ EU ¦Indepen¦Mother ¦Member ¦General¦Mktg-Sa¦ ¦ ¦ ¦ction ¦try ¦ ¦ces ¦10-49 ¦50-249 ¦250+ ¦ ¦countr.¦countr.¦dant ¦Cy ¦group ¦Manager¦les Man¦ +--------------------------------+-------+-------+-------+-------+-------+-------+-------+-------+-------+-------+-------+-------+-------+-------+-------+-------¦ ¦UNWEIGHTED BASE : ..............¦ 2899 ¦ 331 ¦ 905 ¦ 802 ¦ 861 ¦ 1815 ¦ 637 ¦ 447 ¦ 2044 ¦ 526 ¦ 329 ¦ 2398 ¦ 133 ¦ 368 ¦ 1417 ¦ 1482 ¦ ¦................................¦100.0% ¦100.0% ¦100.0% ¦100.0% ¦100.0% ¦100.0% ¦100.0% ¦100.0% ¦100.0% ¦100.0% ¦100.0% ¦100.0% ¦100.0% ¦100.0% ¦100.0% ¦100.0% ¦ +--------------------------------+-------+-------+-------+-------+-------+-------+-------+-------+-------+-------+-------+-------+-------+-------+-------+-------¦ ¦Très efficace ¦ ¦ ¦ ¦ ¦ ¦ ¦ ¦ ¦ ¦ ¦ ¦ ¦ ¦ ¦ ¦ ¦ ¦ Very efficient.................¦ 577 ¦ 69 ¦ 166 ¦ 187 ¦ 154 ¦ 508 ¦ 51 ¦ 18 ¦ 443 ¦ 85 ¦ 49 ¦ 503 ¦ 11 ¦ 63 ¦ 347 ¦ 230 ¦ ¦................................¦ 19.9% ¦ 16.8% ¦ 19.3% ¦ 24.4% ¦ 17.9% ¦ 20.5% ¦ 14.8% ¦ 21.9% ¦ 20.3% ¦ 17.8% ¦ 19.9% ¦ 19.5% ¦ 14.6% ¦ 25.6% ¦ 20.7% ¦ 18.7% ¦ +--------------------------------+-------+-------+-------+-------+-------+-------+-------+-------+-------+-------+-------+-------+-------+-------+-------+-------¦ ¦Plutôt efficace ¦ ¦ ¦ ¦ ¦ ¦ ¦ ¦ ¦ ¦ ¦ ¦ ¦ ¦ ¦ ¦ ¦ ¦ Fairly efficient...............¦ 976 ¦ 136 ¦ 293 ¦ 261 ¦ 286 ¦ 819 ¦ 128 ¦ 29 ¦ 719 ¦ 167 ¦ 91 ¦ 848 ¦ 30 ¦ 99 ¦ 528 ¦ 448 ¦ ¦................................¦ 33.7% ¦ 33.0% ¦ 34.1% ¦ 34.0% ¦ 33.3% ¦ 33.1% ¦ 37.2% ¦ 35.7% ¦ 33.0% ¦ 34.8% ¦ 37.4% ¦ 32.9% ¦ 39.0% ¦ 40.3% ¦ 31.6% ¦ 36.5% ¦ +--------------------------------+-------+-------+-------+-------+-------+-------+-------+-------+-------+-------+-------+-------+-------+-------+-------+-------¦ ¦Plutôt pas efficace ¦ ¦ ¦ ¦ ¦ ¦ ¦ ¦ ¦ ¦ ¦ ¦ ¦ ¦ ¦ ¦ ¦ ¦ Fairly inefficient.............¦ 524 ¦ 66 ¦ 181 ¦ 124 ¦ 153 ¦ 435 ¦ 72 ¦ 16 ¦ 356 ¦ 105 ¦ 63 ¦ 461 ¦ 16 ¦ 46 ¦ 295 ¦ 229 ¦ ¦................................¦ 18.1% ¦ 16.1% ¦ 21.0% ¦ 16.1% ¦ 17.8% ¦ 17.6% ¦ 21.0% ¦ 20.1% ¦ 16.3% ¦ 21.9% ¦ 25.9% ¦ 17.9% ¦ 21.6% ¦ 18.8% ¦ 17.6% ¦ 18.7% ¦ +--------------------------------+-------+-------+-------+-------+-------+-------+-------+-------+-------+-------+-------+-------+-------+-------+-------+-------¦ ¦Pas efficace du tout ¦ ¦ ¦ ¦ ¦ ¦ ¦ ¦ ¦ ¦ ¦ ¦ ¦ ¦ ¦ ¦ ¦ ¦ Not efficient at all...........¦ 613 ¦ 116 ¦ 185 ¦ 141 ¦ 171 ¦ 524 ¦ 76 ¦ 13 ¦ 475 ¦ 105 ¦ 33 ¦ 566 ¦ 16 ¦ 30 ¦ 385 ¦ 228 ¦ ¦................................¦ 21.1% ¦ 28.3% ¦ 21.5% ¦ 18.4% ¦ 19.8% ¦ 21.2% ¦ 22.0% ¦ 16.5% ¦ 21.8% ¦ 22.0% ¦ 13.6% ¦ 22.0% ¦ 21.4% ¦ 12.4% ¦ 23.0% ¦ 18.6% ¦ +--------------------------------+-------+-------+-------+-------+-------+-------+-------+-------+-------+-------+-------+-------+-------+-------+-------+-------¦ ¦(nsp/sr) ¦ ¦ ¦ ¦ ¦ ¦ ¦ ¦ ¦ ¦ ¦ ¦ ¦ ¦ ¦ ¦ ¦ ¦ (dk/na)........................¦ 209 ¦ 24 ¦ 35 ¦ 54 ¦ 96 ¦ 187 ¦ 17 ¦ 5 ¦ 184 ¦ 17 ¦ 8 ¦ 199 ¦ 3 ¦ 7 ¦ 117 ¦ 92 ¦ ¦................................¦ 7.2% ¦ 5.9% ¦ 4.1% ¦ 7.1% ¦ 11.1% ¦ 7.6% ¦ 5.0% ¦ 5.8% ¦ 8.5% ¦ 3.5% ¦ 3.3% ¦ 7.7% ¦ 3.4% ¦ 2.9% ¦ 7.0% ¦ 7.5% ¦ +--------------------------------+-------+-------+-------+-------+-------+-------+-------+-------+-------+-------+-------+-------+-------+-------+-------+-------¦ ¦INDEX 100 <==> 0................¦ 52 ¦ 47 ¦ 51 ¦ 57 ¦ 52 ¦ 53 ¦ 49 ¦ 56 ¦ 52 ¦ 50 ¦ 55 ¦ 51 ¦ 50 ¦ 61 ¦ 51 ¦ 53 ¦ ¦(Base : Répondants - Answering).¦ (2694)¦ (305)¦ (865)¦ (746)¦ (778)¦ (1663)¦ (606)¦ (425)¦ (1871)¦ (507)¦ (316)¦ (2212)¦ (127)¦ (355)¦ (1299)¦ (1395)¦ +--------------------------------+-------+-------+-------+-------+-------+-------+-------+-------+-------+-------+-------+-------+-------+-------+-------+-------¦ ¦(++/+) EFFICACE ¦ ¦ ¦ ¦ ¦ ¦ ¦ ¦ ¦ ¦ ¦ ¦ ¦ ¦ ¦ ¦ ¦ ¦ EFFICIENT......................¦ 53.6% ¦ 49.8% ¦ 53.4% ¦ 58.4% ¦ 51.2% ¦ 53.7% ¦ 52.0% ¦ 57.6% ¦ 53.4% ¦ 52.6% ¦ 57.3% ¦ 52.4% ¦ 53.6% ¦ 65.9% ¦ 52.3% ¦ 55.3% ¦ +--------------------------------+-------+-------+-------+-------+-------+-------+-------+-------+-------+-------+-------+-------+-------+-------+-------+-------¦ ¦(--/-) PAS EFFICACE ¦ ¦ ¦ ¦ ¦ ¦ ¦ ¦ ¦ ¦ ¦ ¦ ¦ ¦ ¦ ¦ ¦ ¦ NOT EFFICIENT..................¦ 39.2% ¦ 44.3% ¦ 42.5% ¦ 34.5% ¦ 37.7% ¦ 38.8% ¦ 43.0% ¦ 36.5% ¦ 38.2% ¦ 43.9% ¦ 39.5% ¦ 39.9% ¦ 43.0% ¦ 31.2% ¦ 40.7% ¦ 37.2% ¦ +----------------------------------------------------------------------------------------------------------------------------------------------------------------+
Interviews : 26/08/02 - 23/09/02 SOFRES s.a. - Coordination EOS GALLUP EUROPE Volume B - Page : 19

FLASH 128 : BUSINESS SURVEY - 2002
3. ( ... ), diriez-vous que ce serait une mesure : - très efficace - plutôt 3. ( ... ) : would you say that this measure will be : - very efficient -efficace - plutôt pas efficace, ou - pas efficace du tout pour faciliter fairly efficient - fairly inefficient, or - not efficient at all invos ventes et/ou publicités transfrontalières au sein de l'Union facilitating your cross-border sales and/or advertising within theEuropéenne ? European Union ?(c) La mise en place de services d'arbitrage et de conciliation (c) Setting up independent arbitration and conciliation services, able toindépendants, compétents pour les plaintes et les conflits deal with cross-border complaints and disputestransfrontaliers
*** RESULTS ARE WEIGHTED : N. of enterprises in the E.U. +----------------------------------------------------------------------------------------------------------------------------------------------------------------+ ¦ ¦ TOTAL ¦ SECTORS ¦ SIZE CATEGORIES ¦ EU COUNTRIES ACTIVITY ¦ COMPANY STATUS ¦ INTERVIEWED ¦ ¦ +-------+-------------------------------+-----------------------+-----------------------+-----------------------+---------------¦ ¦ ¦ EU 15 ¦Constru¦Indus ¦Trade ¦Servi ¦SME ¦SME ¦MAJORS ¦None ¦1-5 EU ¦6&+ EU ¦Indepen¦Mother ¦Member ¦General¦Mktg-Sa¦ ¦ ¦ ¦ction ¦try ¦ ¦ces ¦10-49 ¦50-249 ¦250+ ¦ ¦countr.¦countr.¦dant ¦Cy ¦group ¦Manager¦les Man¦ +--------------------------------+-------+-------+-------+-------+-------+-------+-------+-------+-------+-------+-------+-------+-------+-------+-------+-------¦ ¦UNWEIGHTED BASE : ..............¦ 2899 ¦ 331 ¦ 905 ¦ 802 ¦ 861 ¦ 1815 ¦ 637 ¦ 447 ¦ 2044 ¦ 526 ¦ 329 ¦ 2398 ¦ 133 ¦ 368 ¦ 1417 ¦ 1482 ¦ ¦................................¦100.0% ¦100.0% ¦100.0% ¦100.0% ¦100.0% ¦100.0% ¦100.0% ¦100.0% ¦100.0% ¦100.0% ¦100.0% ¦100.0% ¦100.0% ¦100.0% ¦100.0% ¦100.0% ¦ +--------------------------------+-------+-------+-------+-------+-------+-------+-------+-------+-------+-------+-------+-------+-------+-------+-------+-------¦ ¦Très efficace ¦ ¦ ¦ ¦ ¦ ¦ ¦ ¦ ¦ ¦ ¦ ¦ ¦ ¦ ¦ ¦ ¦ ¦ Very efficient.................¦ 611 ¦ 110 ¦ 194 ¦ 150 ¦ 157 ¦ 539 ¦ 60 ¦ 13 ¦ 470 ¦ 91 ¦ 50 ¦ 553 ¦ 18 ¦ 40 ¦ 366 ¦ 245 ¦ ¦................................¦ 21.1% ¦ 26.8% ¦ 22.6% ¦ 19.6% ¦ 18.2% ¦ 21.8% ¦ 17.5% ¦ 15.3% ¦ 21.6% ¦ 18.9% ¦ 20.7% ¦ 21.5% ¦ 24.2% ¦ 16.3% ¦ 21.9% ¦ 20.0% ¦ +--------------------------------+-------+-------+-------+-------+-------+-------+-------+-------+-------+-------+-------+-------+-------+-------+-------+-------¦ ¦Plutôt efficace ¦ ¦ ¦ ¦ ¦ ¦ ¦ ¦ ¦ ¦ ¦ ¦ ¦ ¦ ¦ ¦ ¦ ¦ Fairly efficient...............¦ 1108 ¦ 183 ¦ 332 ¦ 295 ¦ 297 ¦ 940 ¦ 133 ¦ 35 ¦ 844 ¦ 188 ¦ 76 ¦ 977 ¦ 28 ¦ 103 ¦ 607 ¦ 501 ¦ ¦................................¦ 38.2% ¦ 44.5% ¦ 38.6% ¦ 38.5% ¦ 34.5% ¦ 38.0% ¦ 38.7% ¦ 42.3% ¦ 38.8% ¦ 39.2% ¦ 31.4% ¦ 37.9% ¦ 36.5% ¦ 41.9% ¦ 36.3% ¦ 40.9% ¦ +--------------------------------+-------+-------+-------+-------+-------+-------+-------+-------+-------+-------+-------+-------+-------+-------+-------+-------¦ ¦Plutôt pas efficace ¦ ¦ ¦ ¦ ¦ ¦ ¦ ¦ ¦ ¦ ¦ ¦ ¦ ¦ ¦ ¦ ¦ ¦ Fairly inefficient.............¦ 487 ¦ 31 ¦ 162 ¦ 150 ¦ 144 ¦ 409 ¦ 63 ¦ 15 ¦ 318 ¦ 110 ¦ 59 ¦ 423 ¦ 13 ¦ 51 ¦ 279 ¦ 208 ¦ ¦................................¦ 16.8% ¦ 7.6% ¦ 18.8% ¦ 19.6% ¦ 16.7% ¦ 16.5% ¦ 18.4% ¦ 18.3% ¦ 14.6% ¦ 23.0% ¦ 24.1% ¦ 16.4% ¦ 17.3% ¦ 20.8% ¦ 16.7% ¦ 16.9% ¦ +--------------------------------+-------+-------+-------+-------+-------+-------+-------+-------+-------+-------+-------+-------+-------+-------+-------+-------¦ ¦Pas efficace du tout ¦ ¦ ¦ ¦ ¦ ¦ ¦ ¦ ¦ ¦ ¦ ¦ ¦ ¦ ¦ ¦ ¦ ¦ Not efficient at all...........¦ 450 ¦ 54 ¦ 122 ¦ 119 ¦ 155 ¦ 372 ¦ 65 ¦ 13 ¦ 349 ¦ 67 ¦ 34 ¦ 407 ¦ 10 ¦ 33 ¦ 289 ¦ 161 ¦ ¦................................¦ 15.5% ¦ 13.1% ¦ 14.1% ¦ 15.6% ¦ 18.0% ¦ 15.0% ¦ 19.0% ¦ 15.4% ¦ 16.0% ¦ 13.9% ¦ 13.9% ¦ 15.8% ¦ 13.1% ¦ 13.7% ¦ 17.3% ¦ 13.1% ¦ +--------------------------------+-------+-------+-------+-------+-------+-------+-------+-------+-------+-------+-------+-------+-------+-------+-------+-------¦ ¦(nsp/sr) ¦ ¦ ¦ ¦ ¦ ¦ ¦ ¦ ¦ ¦ ¦ ¦ ¦ ¦ ¦ ¦ ¦ ¦ (dk/na)........................¦ 243 ¦ 33 ¦ 50 ¦ 52 ¦ 108 ¦ 214 ¦ 22 ¦ 7 ¦ 196 ¦ 23 ¦ 24 ¦ 219 ¦ 7 ¦ 18 ¦ 132 ¦ 111 ¦ ¦................................¦ 8.4% ¦ 8.0% ¦ 5.8% ¦ 6.8% ¦ 12.5% ¦ 8.7% ¦ 6.4% ¦ 8.7% ¦ 9.0% ¦ 4.9% ¦ 9.9% ¦ 8.5% ¦ 8.9% ¦ 7.3% ¦ 7.9% ¦ 9.1% ¦ +--------------------------------+-------+-------+-------+-------+-------+-------+-------+-------+-------+-------+-------+-------+-------+-------+-------+-------¦ ¦INDEX 100 <==> 0................¦ 57 ¦ 64 ¦ 58 ¦ 56 ¦ 54 ¦ 58 ¦ 53 ¦ 54 ¦ 58 ¦ 56 ¦ 55 ¦ 57 ¦ 60 ¦ 55 ¦ 56 ¦ 58 ¦ ¦(Base : Répondants - Answering).¦ (2642)¦ (300)¦ (847)¦ (729)¦ (766)¦ (1639)¦ (592)¦ (411)¦ (1842)¦ (500)¦ (300)¦ (2172)¦ (125)¦ (345)¦ (1278)¦ (1364)¦ +--------------------------------+-------+-------+-------+-------+-------+-------+-------+-------+-------+-------+-------+-------+-------+-------+-------+-------¦ ¦(++/+) EFFICACE ¦ ¦ ¦ ¦ ¦ ¦ ¦ ¦ ¦ ¦ ¦ ¦ ¦ ¦ ¦ ¦ ¦ ¦ EFFICIENT......................¦ 59.3% ¦ 71.3% ¦ 61.2% ¦ 58.1% ¦ 52.8% ¦ 59.8% ¦ 56.2% ¦ 57.6% ¦ 60.4% ¦ 58.2% ¦ 52.0% ¦ 59.4% ¦ 60.7% ¦ 58.2% ¦ 58.2% ¦ 60.9% ¦ +--------------------------------+-------+-------+-------+-------+-------+-------+-------+-------+-------+-------+-------+-------+-------+-------+-------+-------¦ ¦(--/-) PAS EFFICACE ¦ ¦ ¦ ¦ ¦ ¦ ¦ ¦ ¦ ¦ ¦ ¦ ¦ ¦ ¦ ¦ ¦ ¦ NOT EFFICIENT..................¦ 32.3% ¦ 20.7% ¦ 33.0% ¦ 35.1% ¦ 34.7% ¦ 31.6% ¦ 37.4% ¦ 33.7% ¦ 30.6% ¦ 36.9% ¦ 38.0% ¦ 32.2% ¦ 30.4% ¦ 34.4% ¦ 33.9% ¦ 30.1% ¦ +----------------------------------------------------------------------------------------------------------------------------------------------------------------+
Interviews : 26/08/02 - 23/09/02 SOFRES s.a. - Coordination EOS GALLUP EUROPE Volume B - Page : 20

FLASH 128 : BUSINESS SURVEY - 2002
3. ( ... ), diriez-vous que ce serait une mesure : - très efficace - plutôt 3. ( ... ) : would you say that this measure will be : - very efficient -efficace - plutôt pas efficace, ou - pas efficace du tout pour faciliter fairly efficient - fairly inefficient, or - not efficient at all invos ventes et/ou publicités transfrontalières au sein de l'Union facilitating your cross-border sales and/or advertising within theEuropéenne ? European Union ?(d) L'adhésion à un code de bonne conduite européen qui permette de se (d) Abiding by a European code of good conduct and thereby complying withconformer aux différentes réglementations nationales sur la protection des different national regulations on consumer protectionconsommateurs
*** RESULTS ARE WEIGHTED : N. of enterprises in the E.U. +----------------------------------------------------------------------------------------------------------------------------------------------------------------+ ¦ ¦ TOTAL ¦ SECTORS ¦ SIZE CATEGORIES ¦ EU COUNTRIES ACTIVITY ¦ COMPANY STATUS ¦ INTERVIEWED ¦ ¦ +-------+-------------------------------+-----------------------+-----------------------+-----------------------+---------------¦ ¦ ¦ EU 15 ¦Constru¦Indus ¦Trade ¦Servi ¦SME ¦SME ¦MAJORS ¦None ¦1-5 EU ¦6&+ EU ¦Indepen¦Mother ¦Member ¦General¦Mktg-Sa¦ ¦ ¦ ¦ction ¦try ¦ ¦ces ¦10-49 ¦50-249 ¦250+ ¦ ¦countr.¦countr.¦dant ¦Cy ¦group ¦Manager¦les Man¦ +--------------------------------+-------+-------+-------+-------+-------+-------+-------+-------+-------+-------+-------+-------+-------+-------+-------+-------¦ ¦UNWEIGHTED BASE : ..............¦ 2899 ¦ 331 ¦ 905 ¦ 802 ¦ 861 ¦ 1815 ¦ 637 ¦ 447 ¦ 2044 ¦ 526 ¦ 329 ¦ 2398 ¦ 133 ¦ 368 ¦ 1417 ¦ 1482 ¦ ¦................................¦100.0% ¦100.0% ¦100.0% ¦100.0% ¦100.0% ¦100.0% ¦100.0% ¦100.0% ¦100.0% ¦100.0% ¦100.0% ¦100.0% ¦100.0% ¦100.0% ¦100.0% ¦100.0% ¦ +--------------------------------+-------+-------+-------+-------+-------+-------+-------+-------+-------+-------+-------+-------+-------+-------+-------+-------¦ ¦Très efficace ¦ ¦ ¦ ¦ ¦ ¦ ¦ ¦ ¦ ¦ ¦ ¦ ¦ ¦ ¦ ¦ ¦ ¦ Very efficient.................¦ 734 ¦ 113 ¦ 236 ¦ 202 ¦ 184 ¦ 639 ¦ 78 ¦ 17 ¦ 574 ¦ 104 ¦ 56 ¦ 655 ¦ 25 ¦ 55 ¦ 466 ¦ 268 ¦ ¦................................¦ 25.3% ¦ 27.5% ¦ 27.4% ¦ 26.4% ¦ 21.3% ¦ 25.9% ¦ 22.6% ¦ 21.0% ¦ 26.4% ¦ 21.7% ¦ 23.0% ¦ 25.4% ¦ 32.9% ¦ 22.4% ¦ 27.9% ¦ 21.9% ¦ +--------------------------------+-------+-------+-------+-------+-------+-------+-------+-------+-------+-------+-------+-------+-------+-------+-------+-------¦ ¦Plutôt efficace ¦ ¦ ¦ ¦ ¦ ¦ ¦ ¦ ¦ ¦ ¦ ¦ ¦ ¦ ¦ ¦ ¦ ¦ Fairly efficient...............¦ 1154 ¦ 179 ¦ 370 ¦ 288 ¦ 316 ¦ 976 ¦ 147 ¦ 31 ¦ 851 ¦ 195 ¦ 108 ¦ 1013 ¦ 30 ¦ 110 ¦ 621 ¦ 533 ¦ ¦................................¦ 39.8% ¦ 43.6% ¦ 43.1% ¦ 37.6% ¦ 36.7% ¦ 39.5% ¦ 42.9% ¦ 37.5% ¦ 39.1% ¦ 40.7% ¦ 44.3% ¦ 39.3% ¦ 40.3% ¦ 44.9% ¦ 37.1% ¦ 43.4% ¦ +--------------------------------+-------+-------+-------+-------+-------+-------+-------+-------+-------+-------+-------+-------+-------+-------+-------+-------¦ ¦Plutôt pas efficace ¦ ¦ ¦ ¦ ¦ ¦ ¦ ¦ ¦ ¦ ¦ ¦ ¦ ¦ ¦ ¦ ¦ ¦ Fairly inefficient.............¦ 442 ¦ 34 ¦ 139 ¦ 123 ¦ 146 ¦ 371 ¦ 51 ¦ 20 ¦ 302 ¦ 94 ¦ 46 ¦ 388 ¦ 7 ¦ 47 ¦ 247 ¦ 196 ¦ ¦................................¦ 15.3% ¦ 8.3% ¦ 16.2% ¦ 16.0% ¦ 17.0% ¦ 15.0% ¦ 14.9% ¦ 24.8% ¦ 13.9% ¦ 19.7% ¦ 18.8% ¦ 15.0% ¦ 9.7% ¦ 19.3% ¦ 14.8% ¦ 15.9% ¦ +--------------------------------+-------+-------+-------+-------+-------+-------+-------+-------+-------+-------+-------+-------+-------+-------+-------+-------¦ ¦Pas efficace du tout ¦ ¦ ¦ ¦ ¦ ¦ ¦ ¦ ¦ ¦ ¦ ¦ ¦ ¦ ¦ ¦ ¦ ¦ Not efficient at all...........¦ 354 ¦ 55 ¦ 77 ¦ 103 ¦ 119 ¦ 299 ¦ 46 ¦ 9 ¦ 270 ¦ 60 ¦ 23 ¦ 323 ¦ 5 ¦ 25 ¦ 236 ¦ 118 ¦ ¦................................¦ 12.2% ¦ 13.3% ¦ 8.9% ¦ 13.4% ¦ 13.8% ¦ 12.1% ¦ 13.4% ¦ 10.6% ¦ 12.4% ¦ 12.5% ¦ 9.6% ¦ 12.5% ¦ 7.2% ¦ 10.2% ¦ 14.1% ¦ 9.6% ¦ +--------------------------------+-------+-------+-------+-------+-------+-------+-------+-------+-------+-------+-------+-------+-------+-------+-------+-------¦ ¦(nsp/sr) ¦ ¦ ¦ ¦ ¦ ¦ ¦ ¦ ¦ ¦ ¦ ¦ ¦ ¦ ¦ ¦ ¦ ¦ (dk/na)........................¦ 215 ¦ 30 ¦ 38 ¦ 51 ¦ 96 ¦ 188 ¦ 21 ¦ 5 ¦ 178 ¦ 26 ¦ 10 ¦ 199 ¦ 8 ¦ 8 ¦ 103 ¦ 112 ¦ ¦................................¦ 7.4% ¦ 7.3% ¦ 4.5% ¦ 6.6% ¦ 11.1% ¦ 7.6% ¦ 6.2% ¦ 6.1% ¦ 8.2% ¦ 5.4% ¦ 4.3% ¦ 7.7% ¦ 9.9% ¦ 3.3% ¦ 6.1% ¦ 9.1% ¦ +--------------------------------+-------+-------+-------+-------+-------+-------+-------+-------+-------+-------+-------+-------+-------+-------+-------+-------¦ ¦INDEX 100 <==> 0................¦ 62 ¦ 64 ¦ 64 ¦ 61 ¦ 58 ¦ 62 ¦ 60 ¦ 58 ¦ 62 ¦ 59 ¦ 62 ¦ 61 ¦ 70 ¦ 61 ¦ 61 ¦ 62 ¦ ¦(Base : Répondants - Answering).¦ (2680)¦ (304)¦ (865)¦ (738)¦ (773)¦ (1649)¦ (604)¦ (427)¦ (1862)¦ (505)¦ (313)¦ (2202)¦ (124)¦ (354)¦ (1300)¦ (1380)¦ +--------------------------------+-------+-------+-------+-------+-------+-------+-------+-------+-------+-------+-------+-------+-------+-------+-------+-------¦ ¦(++/+) EFFICACE ¦ ¦ ¦ ¦ ¦ ¦ ¦ ¦ ¦ ¦ ¦ ¦ ¦ ¦ ¦ ¦ ¦ ¦ EFFICIENT......................¦ 65.1% ¦ 71.0% ¦ 70.5% ¦ 64.0% ¦ 58.0% ¦ 65.3% ¦ 65.5% ¦ 58.5% ¦ 65.5% ¦ 62.4% ¦ 67.3% ¦ 64.7% ¦ 73.2% ¦ 67.3% ¦ 65.0% ¦ 65.3% ¦ +--------------------------------+-------+-------+-------+-------+-------+-------+-------+-------+-------+-------+-------+-------+-------+-------+-------+-------¦ ¦(--/-) PAS EFFICACE ¦ ¦ ¦ ¦ ¦ ¦ ¦ ¦ ¦ ¦ ¦ ¦ ¦ ¦ ¦ ¦ ¦ ¦ NOT EFFICIENT..................¦ 27.5% ¦ 21.6% ¦ 25.1% ¦ 29.4% ¦ 30.8% ¦ 27.1% ¦ 28.3% ¦ 35.4% ¦ 26.3% ¦ 32.2% ¦ 28.4% ¦ 27.6% ¦ 16.9% ¦ 29.5% ¦ 28.8% ¦ 25.6% ¦ +----------------------------------------------------------------------------------------------------------------------------------------------------------------+
Interviews : 26/08/02 - 23/09/02 SOFRES s.a. - Coordination EOS GALLUP EUROPE Volume B - Page : 21

FLASH 128 : BUSINESS SURVEY - 2002
3. ( ... ), diriez-vous que ce serait une mesure : - très efficace - plutôt 3. ( ... ) : would you say that this measure will be : - very efficient -efficace - plutôt pas efficace, ou - pas efficace du tout pour faciliter fairly efficient - fairly inefficient, or - not efficient at all invos ventes et/ou publicités transfrontalières au sein de l'Union facilitating your cross-border sales and/or advertising within theEuropéenne ? European Union ?(e) L'harmonisation des réglementations nationales sur la publicité, les (e) Harmonising national regulations in relation to advertising, commercialpratiques commerciales et les autres réglementations sur la protection des practices and other regulations on consumer protectionconsommateurs
*** RESULTS ARE WEIGHTED : N. of enterprises in the E.U. +----------------------------------------------------------------------------------------------------------------------------------------------------------------+ ¦ ¦ TOTAL ¦ SECTORS ¦ SIZE CATEGORIES ¦ EU COUNTRIES ACTIVITY ¦ COMPANY STATUS ¦ INTERVIEWED ¦ ¦ +-------+-------------------------------+-----------------------+-----------------------+-----------------------+---------------¦ ¦ ¦ EU 15 ¦Constru¦Indus ¦Trade ¦Servi ¦SME ¦SME ¦MAJORS ¦None ¦1-5 EU ¦6&+ EU ¦Indepen¦Mother ¦Member ¦General¦Mktg-Sa¦ ¦ ¦ ¦ction ¦try ¦ ¦ces ¦10-49 ¦50-249 ¦250+ ¦ ¦countr.¦countr.¦dant ¦Cy ¦group ¦Manager¦les Man¦ +--------------------------------+-------+-------+-------+-------+-------+-------+-------+-------+-------+-------+-------+-------+-------+-------+-------+-------¦ ¦UNWEIGHTED BASE : ..............¦ 2899 ¦ 331 ¦ 905 ¦ 802 ¦ 861 ¦ 1815 ¦ 637 ¦ 447 ¦ 2044 ¦ 526 ¦ 329 ¦ 2398 ¦ 133 ¦ 368 ¦ 1417 ¦ 1482 ¦ ¦................................¦100.0% ¦100.0% ¦100.0% ¦100.0% ¦100.0% ¦100.0% ¦100.0% ¦100.0% ¦100.0% ¦100.0% ¦100.0% ¦100.0% ¦100.0% ¦100.0% ¦100.0% ¦100.0% ¦ +--------------------------------+-------+-------+-------+-------+-------+-------+-------+-------+-------+-------+-------+-------+-------+-------+-------+-------¦ ¦Très efficace ¦ ¦ ¦ ¦ ¦ ¦ ¦ ¦ ¦ ¦ ¦ ¦ ¦ ¦ ¦ ¦ ¦ ¦ Very efficient.................¦ 795 ¦ 113 ¦ 265 ¦ 195 ¦ 222 ¦ 668 ¦ 104 ¦ 23 ¦ 603 ¦ 125 ¦ 67 ¦ 700 ¦ 27 ¦ 69 ¦ 496 ¦ 299 ¦ ¦................................¦ 27.4% ¦ 27.6% ¦ 30.8% ¦ 25.4% ¦ 25.8% ¦ 27.0% ¦ 30.2% ¦ 27.8% ¦ 27.7% ¦ 26.1% ¦ 27.5% ¦ 27.1% ¦ 35.5% ¦ 28.0% ¦ 29.7% ¦ 24.4% ¦ +--------------------------------+-------+-------+-------+-------+-------+-------+-------+-------+-------+-------+-------+-------+-------+-------+-------+-------¦ ¦Plutôt efficace ¦ ¦ ¦ ¦ ¦ ¦ ¦ ¦ ¦ ¦ ¦ ¦ ¦ ¦ ¦ ¦ ¦ ¦ Fairly efficient...............¦ 1182 ¦ 163 ¦ 365 ¦ 325 ¦ 330 ¦ 1007 ¦ 143 ¦ 32 ¦ 902 ¦ 190 ¦ 90 ¦ 1055 ¦ 27 ¦ 100 ¦ 665 ¦ 518 ¦ ¦................................¦ 40.8% ¦ 39.7% ¦ 42.4% ¦ 42.3% ¦ 38.3% ¦ 40.7% ¦ 41.5% ¦ 39.6% ¦ 41.5% ¦ 39.6% ¦ 37.0% ¦ 40.9% ¦ 36.2% ¦ 40.8% ¦ 39.7% ¦ 42.2% ¦ +--------------------------------+-------+-------+-------+-------+-------+-------+-------+-------+-------+-------+-------+-------+-------+-------+-------+-------¦ ¦Plutôt pas efficace ¦ ¦ ¦ ¦ ¦ ¦ ¦ ¦ ¦ ¦ ¦ ¦ ¦ ¦ ¦ ¦ ¦ ¦ Fairly inefficient.............¦ 398 ¦ 55 ¦ 111 ¦ 108 ¦ 125 ¦ 335 ¦ 46 ¦ 18 ¦ 251 ¦ 88 ¦ 60 ¦ 337 ¦ 13 ¦ 48 ¦ 200 ¦ 199 ¦ ¦................................¦ 13.7% ¦ 13.3% ¦ 12.9% ¦ 14.1% ¦ 14.5% ¦ 13.5% ¦ 13.3% ¦ 21.7% ¦ 11.5% ¦ 18.3% ¦ 24.5% ¦ 13.1% ¦ 17.6% ¦ 19.5% ¦ 11.9% ¦ 16.2% ¦ +--------------------------------+-------+-------+-------+-------+-------+-------+-------+-------+-------+-------+-------+-------+-------+-------+-------+-------¦ ¦Pas efficace du tout ¦ ¦ ¦ ¦ ¦ ¦ ¦ ¦ ¦ ¦ ¦ ¦ ¦ ¦ ¦ ¦ ¦ ¦ Not efficient at all...........¦ 322 ¦ 51 ¦ 82 ¦ 92 ¦ 97 ¦ 279 ¦ 37 ¦ 5 ¦ 241 ¦ 63 ¦ 18 ¦ 295 ¦ 5 ¦ 21 ¦ 209 ¦ 113 ¦ ¦................................¦ 11.1% ¦ 12.3% ¦ 9.5% ¦ 12.1% ¦ 11.2% ¦ 11.3% ¦ 10.8% ¦ 6.4% ¦ 11.1% ¦ 13.1% ¦ 7.2% ¦ 11.5% ¦ 6.7% ¦ 8.6% ¦ 12.5% ¦ 9.2% ¦ +--------------------------------+-------+-------+-------+-------+-------+-------+-------+-------+-------+-------+-------+-------+-------+-------+-------+-------¦ ¦(nsp/sr) ¦ ¦ ¦ ¦ ¦ ¦ ¦ ¦ ¦ ¦ ¦ ¦ ¦ ¦ ¦ ¦ ¦ ¦ (dk/na)........................¦ 202 ¦ 29 ¦ 38 ¦ 47 ¦ 87 ¦ 183 ¦ 15 ¦ 4 ¦ 179 ¦ 14 ¦ 9 ¦ 191 ¦ 3 ¦ 8 ¦ 104 ¦ 98 ¦ ¦................................¦ 7.0% ¦ 7.1% ¦ 4.5% ¦ 6.1% ¦ 10.1% ¦ 7.4% ¦ 4.3% ¦ 4.6% ¦ 8.2% ¦ 2.9% ¦ 3.8% ¦ 7.4% ¦ 4.1% ¦ 3.1% ¦ 6.2% ¦ 8.0% ¦ +--------------------------------+-------+-------+-------+-------+-------+-------+-------+-------+-------+-------+-------+-------+-------+-------+-------+-------¦ ¦INDEX 100 <==> 0................¦ 64 ¦ 63 ¦ 66 ¦ 62 ¦ 63 ¦ 63 ¦ 65 ¦ 64 ¦ 65 ¦ 60 ¦ 63 ¦ 64 ¦ 68 ¦ 64 ¦ 64 ¦ 63 ¦ ¦(Base : Répondants - Answering).¦ (2682)¦ (306)¦ (864)¦ (740)¦ (772)¦ (1653)¦ (603)¦ (426)¦ (1859)¦ (507)¦ (316)¦ (2203)¦ (127)¦ (352)¦ (1299)¦ (1383)¦ +--------------------------------+-------+-------+-------+-------+-------+-------+-------+-------+-------+-------+-------+-------+-------+-------+-------+-------¦ ¦(++/+) EFFICACE ¦ ¦ ¦ ¦ ¦ ¦ ¦ ¦ ¦ ¦ ¦ ¦ ¦ ¦ ¦ ¦ ¦ ¦ EFFICIENT......................¦ 68.2% ¦ 67.3% ¦ 73.2% ¦ 67.7% ¦ 64.1% ¦ 67.8% ¦ 71.6% ¦ 67.3% ¦ 69.2% ¦ 65.8% ¦ 64.5% ¦ 68.1% ¦ 71.6% ¦ 68.7% ¦ 69.4% ¦ 66.6% ¦ +--------------------------------+-------+-------+-------+-------+-------+-------+-------+-------+-------+-------+-------+-------+-------+-------+-------+-------¦ ¦(--/-) PAS EFFICACE ¦ ¦ ¦ ¦ ¦ ¦ ¦ ¦ ¦ ¦ ¦ ¦ ¦ ¦ ¦ ¦ ¦ ¦ NOT EFFICIENT..................¦ 24.8% ¦ 25.7% ¦ 22.4% ¦ 26.1% ¦ 25.7% ¦ 24.8% ¦ 24.1% ¦ 28.1% ¦ 22.6% ¦ 31.4% ¦ 31.7% ¦ 24.5% ¦ 24.3% ¦ 28.2% ¦ 24.4% ¦ 25.4% ¦ +----------------------------------------------------------------------------------------------------------------------------------------------------------------+
Interviews : 26/08/02 - 23/09/02 SOFRES s.a. - Coordination EOS GALLUP EUROPE Volume B - Page : 22

FLASH 128 : BUSINESS SURVEY - 2002
4. Dans vos VENTES FAITES PAR INTERNET à des consommateurs de l'Union 4. Of your INTERNET SALES to European Union consumers, can you estimate theEuropéenne, pouvez-vous estimer le pourcentage de vos ventes percentage of cross-border sales ?transfrontalières ? (INT.: IF DK/NA, SUGGEST : Was it : ... nothing at all ? around 1% ? ..(ENQ.: SI NSP/SR, SUGGERER : Etait-ce : ... rien du tout ? autour de 1% ? 2% ? .. 3% ? .. 5% ? .. 10% ? .. 15% ? .. 20% ? .. 25% ? etc ...).. 2% ? .. 3% ? .. 5% ? .. 10% ? .. 15% ? .. 20% ? .. 25% ? etc ...)
*** RESULTS ARE WEIGHTED : N. of enterprises in the E.U. +----------------------------------------------------------------------------------------------------------------------------------------------------------------+ ¦ ¦ TOTAL ¦ SECTORS ¦ SIZE CATEGORIES ¦ EU COUNTRIES ACTIVITY ¦ COMPANY STATUS ¦ INTERVIEWED ¦ ¦ +-------+-------------------------------+-----------------------+-----------------------+-----------------------+---------------¦ ¦ ¦ EU 15 ¦Constru¦Indus ¦Trade ¦Servi ¦SME ¦SME ¦MAJORS ¦None ¦1-5 EU ¦6&+ EU ¦Indepen¦Mother ¦Member ¦General¦Mktg-Sa¦ ¦ ¦ ¦ction ¦try ¦ ¦ces ¦10-49 ¦50-249 ¦250+ ¦ ¦countr.¦countr.¦dant ¦Cy ¦group ¦Manager¦les Man¦ +--------------------------------+-------+-------+-------+-------+-------+-------+-------+-------+-------+-------+-------+-------+-------+-------+-------+-------¦ ¦UNWEIGHTED BASE : ..............¦ 2899 ¦ 331 ¦ 905 ¦ 802 ¦ 861 ¦ 1815 ¦ 637 ¦ 447 ¦ 2044 ¦ 526 ¦ 329 ¦ 2398 ¦ 133 ¦ 368 ¦ 1417 ¦ 1482 ¦ ¦................................¦100.0% ¦100.0% ¦100.0% ¦100.0% ¦100.0% ¦100.0% ¦100.0% ¦100.0% ¦100.0% ¦100.0% ¦100.0% ¦100.0% ¦100.0% ¦100.0% ¦100.0% ¦100.0% ¦ +--------------------------------+-------+-------+-------+-------+-------+-------+-------+-------+-------+-------+-------+-------+-------+-------+-------+-------¦ ¦0% ¦ ¦ ¦ ¦ ¦ ¦ ¦ ¦ ¦ ¦ ¦ ¦ ¦ ¦ ¦ ¦ ¦ ¦ 0%.............................¦ 2068 ¦ 330 ¦ 660 ¦ 546 ¦ 532 ¦ 1782 ¦ 230 ¦ 57 ¦ 1607 ¦ 307 ¦ 155 ¦ 1860 ¦ 43 ¦ 165 ¦ 1198 ¦ 870 ¦ ¦................................¦ 71.3% ¦ 80.3% ¦ 76.7% ¦ 71.2% ¦ 61.8% ¦ 72.1% ¦ 66.7% ¦ 69.1% ¦ 73.8% ¦ 64.1% ¦ 63.5% ¦ 72.1% ¦ 56.6% ¦ 67.4% ¦ 71.6% ¦ 71.0% ¦ +--------------------------------+-------+-------+-------+-------+-------+-------+-------+-------+-------+-------+-------+-------+-------+-------+-------+-------¦ ¦Autour de 1% ¦ ¦ ¦ ¦ ¦ ¦ ¦ ¦ ¦ ¦ ¦ ¦ ¦ ¦ ¦ ¦ ¦ ¦ Around 1%......................¦ 185 ¦ 20 ¦ 38 ¦ 60 ¦ 66 ¦ 149 ¦ 31 ¦ 4 ¦ 140 ¦ 33 ¦ 11 ¦ 162 ¦ 7 ¦ 15 ¦ 114 ¦ 70 ¦ ¦................................¦ 6.4% ¦ 5.0% ¦ 4.4% ¦ 7.8% ¦ 7.7% ¦ 6.0% ¦ 9.1% ¦ 5.0% ¦ 6.5% ¦ 6.9% ¦ 4.6% ¦ 6.3% ¦ 9.2% ¦ 6.2% ¦ 6.8% ¦ 5.7% ¦ +--------------------------------+-------+-------+-------+-------+-------+-------+-------+-------+-------+-------+-------+-------+-------+-------+-------+-------¦ ¦Autour de 2% ¦ ¦ ¦ ¦ ¦ ¦ ¦ ¦ ¦ ¦ ¦ ¦ ¦ ¦ ¦ ¦ ¦ ¦ Around 2%......................¦ 88 ¦ 16 ¦ 25 ¦ 12 ¦ 34 ¦ 70 ¦ 13 ¦ 4 ¦ 43 ¦ 37 ¦ 8 ¦ 78 ¦ 4 ¦ 5 ¦ 49 ¦ 39 ¦ ¦................................¦ 3.0% ¦ 4.0% ¦ 2.9% ¦ 1.6% ¦ 3.9% ¦ 2.8% ¦ 3.9% ¦ 5.3% ¦ 2.0% ¦ 7.8% ¦ 3.2% ¦ 3.0% ¦ 5.8% ¦ 2.2% ¦ 2.9% ¦ 3.2% ¦ +--------------------------------+-------+-------+-------+-------+-------+-------+-------+-------+-------+-------+-------+-------+-------+-------+-------+-------¦ ¦Autour de 3% ¦ ¦ ¦ ¦ ¦ ¦ ¦ ¦ ¦ ¦ ¦ ¦ ¦ ¦ ¦ ¦ ¦ ¦ Around 3%......................¦ 70 ¦ 7 ¦ 21 ¦ 22 ¦ 19 ¦ 57 ¦ 10 ¦ 3 ¦ 53 ¦ 12 ¦ 4 ¦ 63 ¦ 2 ¦ 5 ¦ 38 ¦ 32 ¦ ¦................................¦ 2.4% ¦ 1.6% ¦ 2.5% ¦ 2.9% ¦ 2.3% ¦ 2.3% ¦ 3.0% ¦ 3.2% ¦ 2.4% ¦ 2.6% ¦ 1.7% ¦ 2.5% ¦ 2.2% ¦ 1.8% ¦ 2.3% ¦ 2.6% ¦ +--------------------------------+-------+-------+-------+-------+-------+-------+-------+-------+-------+-------+-------+-------+-------+-------+-------+-------¦ ¦Autour de 5% (= 4-7%) ¦ ¦ ¦ ¦ ¦ ¦ ¦ ¦ ¦ ¦ ¦ ¦ ¦ ¦ ¦ ¦ ¦ ¦ Around 5% (= 4-7%)...........¦ 150 ¦ 6 ¦ 36 ¦ 40 ¦ 68 ¦ 125 ¦ 22 ¦ 3 ¦ 104 ¦ 23 ¦ 23 ¦ 133 ¦ 2 ¦ 14 ¦ 89 ¦ 61 ¦ ¦................................¦ 5.2% ¦ 1.6% ¦ 4.2% ¦ 5.2% ¦ 7.9% ¦ 5.1% ¦ 6.3% ¦ 3.6% ¦ 4.8% ¦ 4.9% ¦ 9.3% ¦ 5.2% ¦ 2.9% ¦ 5.9% ¦ 5.3% ¦ 4.9% ¦ +--------------------------------+-------+-------+-------+-------+-------+-------+-------+-------+-------+-------+-------+-------+-------+-------+-------+-------¦ ¦Autour de 10% (= 8-12%) ¦ ¦ ¦ ¦ ¦ ¦ ¦ ¦ ¦ ¦ ¦ ¦ ¦ ¦ ¦ ¦ ¦ ¦ Around 10% (= 8-12%)...........¦ 96 ¦ 6 ¦ 23 ¦ 31 ¦ 35 ¦ 84 ¦ 10 ¦ 2 ¦ 70 ¦ 15 ¦ 10 ¦ 89 ¦ 3 ¦ 4 ¦ 56 ¦ 39 ¦ ¦................................¦ 3.3% ¦ 1.4% ¦ 2.7% ¦ 4.1% ¦ 4.1% ¦ 3.4% ¦ 2.9% ¦ 2.4% ¦ 3.2% ¦ 3.1% ¦ 4.3% ¦ 3.4% ¦ 3.5% ¦ 1.7% ¦ 3.4% ¦ 3.2% ¦ +--------------------------------+-------+-------+-------+-------+-------+-------+-------+-------+-------+-------+-------+-------+-------+-------+-------+-------¦ ¦Autour de 15% (=13-17%) ¦ ¦ ¦ ¦ ¦ ¦ ¦ ¦ ¦ ¦ ¦ ¦ ¦ ¦ ¦ ¦ ¦ ¦ Around 15% (=13-17%)...........¦ 18 ¦ 4 ¦ 5 ¦ 1 ¦ 8 ¦ 13 ¦ 4 ¦ 1 ¦ 7 ¦ 6 ¦ 5 ¦ 14 ¦ 3 ¦ 1 ¦ 11 ¦ 7 ¦ ¦................................¦ .6% ¦ 1.0% ¦ .6% ¦ .1% ¦ .9% ¦ .5% ¦ 1.0% ¦ 1.4% ¦ .3% ¦ 1.3% ¦ 2.0% ¦ .6% ¦ 3.4% ¦ .5% ¦ .6% ¦ .6% ¦ +--------------------------------+-------+-------+-------+-------+-------+-------+-------+-------+-------+-------+-------+-------+-------+-------+-------+-------¦ ¦Autour de 20% (=18-22%) ¦ ¦ ¦ ¦ ¦ ¦ ¦ ¦ ¦ ¦ ¦ ¦ ¦ ¦ ¦ ¦ ¦ ¦ Around 20% (=18-22%)...........¦ 46 ¦ 0 ¦ 6 ¦ 14 ¦ 26 ¦ 43 ¦ 2 ¦ 1 ¦ 20 ¦ 20 ¦ 5 ¦ 32 ¦ 0 ¦ 13 ¦ 26 ¦ 20 ¦ ¦................................¦ 1.6% ¦ .0% ¦ .7% ¦ 1.8% ¦ 3.0% ¦ 1.7% ¦ .7% ¦ .6% ¦ .9% ¦ 4.3% ¦ 2.2% ¦ 1.3% ¦ .4% ¦ 5.3% ¦ 1.6% ¦ 1.6% ¦ +--------------------------------+-------+-------+-------+-------+-------+-------+-------+-------+-------+-------+-------+-------+-------+-------+-------+-------¦ ¦Autour de 25% (=23-27%) ¦ ¦ ¦ ¦ ¦ ¦ ¦ ¦ ¦ ¦ ¦ ¦ ¦ ¦ ¦ ¦ ¦ ¦ Around 25% (=23-27%)...........¦ 16 ¦ 2 ¦ 3 ¦ 7 ¦ 4 ¦ 15 ¦ 1 ¦ 0 ¦ 13 ¦ 3 ¦ 0 ¦ 15 ¦ 0 ¦ 1 ¦ 11 ¦ 5 ¦ ¦................................¦ .6% ¦ .5% ¦ .4% ¦ .9% ¦ .5% ¦ .6% ¦ .2% ¦ .3% ¦ .6% ¦ .6% ¦ .0% ¦ .6% ¦ .0% ¦ .4% ¦ .7% ¦ .4% ¦ +--------------------------------+-------+-------+-------+-------+-------+-------+-------+-------+-------+-------+-------+-------+-------+-------+-------+-------¦ ¦Autour de 30% (=28-35%) ¦ ¦ ¦ ¦ ¦ ¦ ¦ ¦ ¦ ¦ ¦ ¦ ¦ ¦ ¦ ¦ ¦ ¦ Around 30% (=28-35%)...........¦ 14 ¦ 0 ¦ 0 ¦ 9 ¦ 4 ¦ 13 ¦ 0 ¦ 0 ¦ 13 ¦ 0 ¦ 0 ¦ 14 ¦ 0 ¦ 0 ¦ 10 ¦ 4 ¦ ¦................................¦ .5% ¦ .1% ¦ .1% ¦ 1.1% ¦ .5% ¦ .5% ¦ .1% ¦ .3% ¦ .6% ¦ .1% ¦ .1% ¦ .5% ¦ .0% ¦ .0% ¦ .6% ¦ .3% ¦ +----------------------------------------------------------------------------------------------------------------------------------------------------------------+ (suite page suivante) - (continued next page)Interviews : 26/08/02 - 23/09/02 SOFRES s.a. - Coordination EOS GALLUP EUROPE Volume B - Page : 23
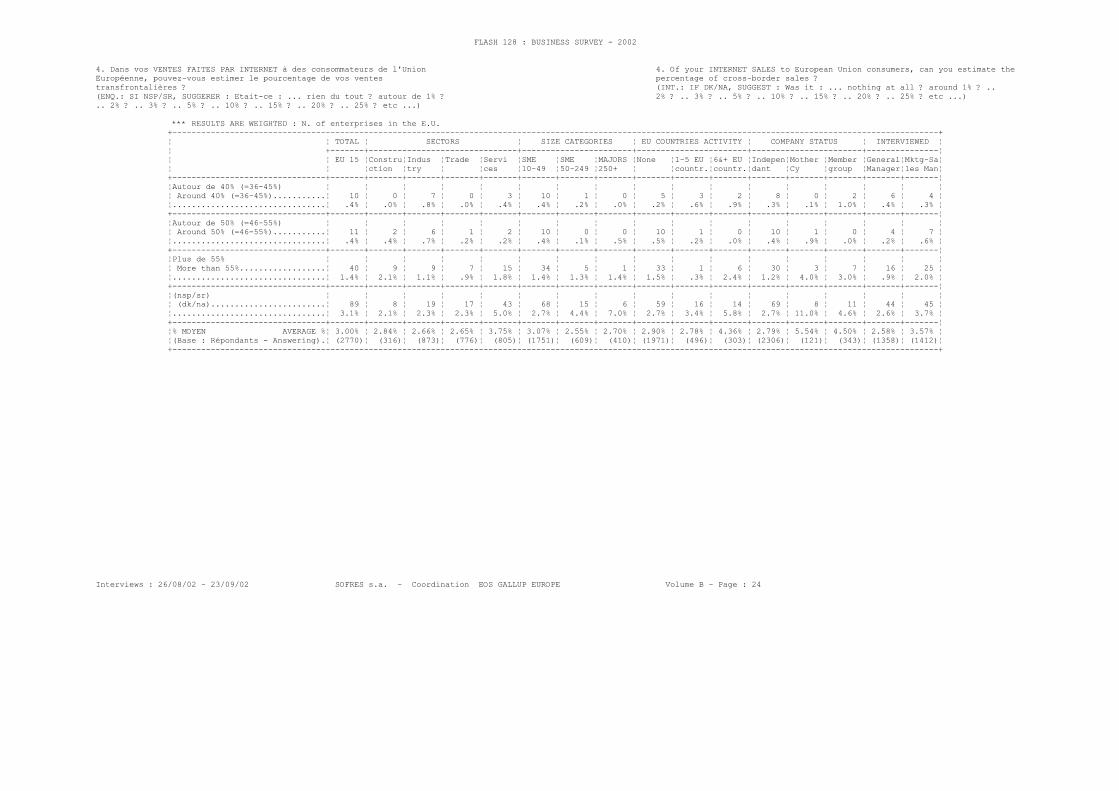
FLASH 128 : BUSINESS SURVEY - 2002
4. Dans vos VENTES FAITES PAR INTERNET à des consommateurs de l'Union 4. Of your INTERNET SALES to European Union consumers, can you estimate theEuropéenne, pouvez-vous estimer le pourcentage de vos ventes percentage of cross-border sales ?transfrontalières ? (INT.: IF DK/NA, SUGGEST : Was it : ... nothing at all ? around 1% ? ..(ENQ.: SI NSP/SR, SUGGERER : Etait-ce : ... rien du tout ? autour de 1% ? 2% ? .. 3% ? .. 5% ? .. 10% ? .. 15% ? .. 20% ? .. 25% ? etc ...).. 2% ? .. 3% ? .. 5% ? .. 10% ? .. 15% ? .. 20% ? .. 25% ? etc ...)
*** RESULTS ARE WEIGHTED : N. of enterprises in the E.U. +----------------------------------------------------------------------------------------------------------------------------------------------------------------+ ¦ ¦ TOTAL ¦ SECTORS ¦ SIZE CATEGORIES ¦ EU COUNTRIES ACTIVITY ¦ COMPANY STATUS ¦ INTERVIEWED ¦ ¦ +-------+-------------------------------+-----------------------+-----------------------+-----------------------+---------------¦ ¦ ¦ EU 15 ¦Constru¦Indus ¦Trade ¦Servi ¦SME ¦SME ¦MAJORS ¦None ¦1-5 EU ¦6&+ EU ¦Indepen¦Mother ¦Member ¦General¦Mktg-Sa¦ ¦ ¦ ¦ction ¦try ¦ ¦ces ¦10-49 ¦50-249 ¦250+ ¦ ¦countr.¦countr.¦dant ¦Cy ¦group ¦Manager¦les Man¦ +--------------------------------+-------+-------+-------+-------+-------+-------+-------+-------+-------+-------+-------+-------+-------+-------+-------+-------¦ ¦Autour de 40% (=36-45%) ¦ ¦ ¦ ¦ ¦ ¦ ¦ ¦ ¦ ¦ ¦ ¦ ¦ ¦ ¦ ¦ ¦ ¦ Around 40% (=36-45%)...........¦ 10 ¦ 0 ¦ 7 ¦ 0 ¦ 3 ¦ 10 ¦ 1 ¦ 0 ¦ 5 ¦ 3 ¦ 2 ¦ 8 ¦ 0 ¦ 2 ¦ 6 ¦ 4 ¦ ¦................................¦ .4% ¦ .0% ¦ .8% ¦ .0% ¦ .4% ¦ .4% ¦ .2% ¦ .0% ¦ .2% ¦ .6% ¦ .9% ¦ .3% ¦ .1% ¦ 1.0% ¦ .4% ¦ .3% ¦ +--------------------------------+-------+-------+-------+-------+-------+-------+-------+-------+-------+-------+-------+-------+-------+-------+-------+-------¦ ¦Autour de 50% (=46-55%) ¦ ¦ ¦ ¦ ¦ ¦ ¦ ¦ ¦ ¦ ¦ ¦ ¦ ¦ ¦ ¦ ¦ ¦ Around 50% (=46-55%)...........¦ 11 ¦ 2 ¦ 6 ¦ 1 ¦ 2 ¦ 10 ¦ 0 ¦ 0 ¦ 10 ¦ 1 ¦ 0 ¦ 10 ¦ 1 ¦ 0 ¦ 4 ¦ 7 ¦ ¦................................¦ .4% ¦ .4% ¦ .7% ¦ .2% ¦ .2% ¦ .4% ¦ .1% ¦ .5% ¦ .5% ¦ .2% ¦ .0% ¦ .4% ¦ .9% ¦ .0% ¦ .2% ¦ .6% ¦ +--------------------------------+-------+-------+-------+-------+-------+-------+-------+-------+-------+-------+-------+-------+-------+-------+-------+-------¦ ¦Plus de 55% ¦ ¦ ¦ ¦ ¦ ¦ ¦ ¦ ¦ ¦ ¦ ¦ ¦ ¦ ¦ ¦ ¦ ¦ More than 55%..................¦ 40 ¦ 9 ¦ 9 ¦ 7 ¦ 15 ¦ 34 ¦ 5 ¦ 1 ¦ 33 ¦ 1 ¦ 6 ¦ 30 ¦ 3 ¦ 7 ¦ 16 ¦ 25 ¦ ¦................................¦ 1.4% ¦ 2.1% ¦ 1.1% ¦ .9% ¦ 1.8% ¦ 1.4% ¦ 1.3% ¦ 1.4% ¦ 1.5% ¦ .3% ¦ 2.4% ¦ 1.2% ¦ 4.0% ¦ 3.0% ¦ .9% ¦ 2.0% ¦ +--------------------------------+-------+-------+-------+-------+-------+-------+-------+-------+-------+-------+-------+-------+-------+-------+-------+-------¦ ¦(nsp/sr) ¦ ¦ ¦ ¦ ¦ ¦ ¦ ¦ ¦ ¦ ¦ ¦ ¦ ¦ ¦ ¦ ¦ ¦ (dk/na)........................¦ 89 ¦ 8 ¦ 19 ¦ 17 ¦ 43 ¦ 68 ¦ 15 ¦ 6 ¦ 59 ¦ 16 ¦ 14 ¦ 69 ¦ 8 ¦ 11 ¦ 44 ¦ 45 ¦ ¦................................¦ 3.1% ¦ 2.1% ¦ 2.3% ¦ 2.3% ¦ 5.0% ¦ 2.7% ¦ 4.4% ¦ 7.0% ¦ 2.7% ¦ 3.4% ¦ 5.8% ¦ 2.7% ¦ 11.0% ¦ 4.6% ¦ 2.6% ¦ 3.7% ¦ +--------------------------------+-------+-------+-------+-------+-------+-------+-------+-------+-------+-------+-------+-------+-------+-------+-------+-------¦ ¦% MOYEN AVERAGE %¦ 3.00% ¦ 2.84% ¦ 2.66% ¦ 2.65% ¦ 3.75% ¦ 3.07% ¦ 2.55% ¦ 2.70% ¦ 2.90% ¦ 2.78% ¦ 4.36% ¦ 2.79% ¦ 5.54% ¦ 4.50% ¦ 2.58% ¦ 3.57% ¦ ¦(Base : Répondants - Answering).¦ (2770)¦ (316)¦ (873)¦ (776)¦ (805)¦ (1751)¦ (609)¦ (410)¦ (1971)¦ (496)¦ (303)¦ (2306)¦ (121)¦ (343)¦ (1358)¦ (1412)¦ +----------------------------------------------------------------------------------------------------------------------------------------------------------------+
Interviews : 26/08/02 - 23/09/02 SOFRES s.a. - Coordination EOS GALLUP EUROPE Volume B - Page : 24

FLASH 128 : BUSINESS SURVEY - 2002
5. Dans vos ventes faites PAR CORRESPONDANCE OU PAR TELEPHONE à des 5. Of your MAIL-ORDER SALES or TELESALES to EU consumers, can you estimateconsommateurs de l'UE, pouvez-vous estimer le pourcentage de vos ventes the percentage of cross-border sales ?transfrontalières ? (INT.: IF DK/NA, YOU MAY SUGGEST THE SCALE BELOW : In order to have an idea(ENQ.: SI NSP/SR, SUGGERER : Etait-ce : ... rien du tout ? autour de 1% ? of the size, was it : ... nothing at all ? / ... around 1% ? / ... 2% ?.. 2% ? .. 3% ? .. 5% ? .. 10% ? .. 15% ? .. 20% ? .. 25% ? etc ...) ... 3% ? / ... 5% ? / ... 10% ? / ...15% ? ...20% ? / ...25% ? ... etc ...)
*** RESULTS ARE WEIGHTED : N. of enterprises in the E.U. +----------------------------------------------------------------------------------------------------------------------------------------------------------------+ ¦ ¦ TOTAL ¦ SECTORS ¦ SIZE CATEGORIES ¦ EU COUNTRIES ACTIVITY ¦ COMPANY STATUS ¦ INTERVIEWED ¦ ¦ +-------+-------------------------------+-----------------------+-----------------------+-----------------------+---------------¦ ¦ ¦ EU 15 ¦Constru¦Indus ¦Trade ¦Servi ¦SME ¦SME ¦MAJORS ¦None ¦1-5 EU ¦6&+ EU ¦Indepen¦Mother ¦Member ¦General¦Mktg-Sa¦ ¦ ¦ ¦ction ¦try ¦ ¦ces ¦10-49 ¦50-249 ¦250+ ¦ ¦countr.¦countr.¦dant ¦Cy ¦group ¦Manager¦les Man¦ +--------------------------------+-------+-------+-------+-------+-------+-------+-------+-------+-------+-------+-------+-------+-------+-------+-------+-------¦ ¦UNWEIGHTED BASE : ..............¦ 2899 ¦ 331 ¦ 905 ¦ 802 ¦ 861 ¦ 1815 ¦ 637 ¦ 447 ¦ 2044 ¦ 526 ¦ 329 ¦ 2398 ¦ 133 ¦ 368 ¦ 1417 ¦ 1482 ¦ ¦................................¦100.0% ¦100.0% ¦100.0% ¦100.0% ¦100.0% ¦100.0% ¦100.0% ¦100.0% ¦100.0% ¦100.0% ¦100.0% ¦100.0% ¦100.0% ¦100.0% ¦100.0% ¦100.0% ¦ +--------------------------------+-------+-------+-------+-------+-------+-------+-------+-------+-------+-------+-------+-------+-------+-------+-------+-------¦ ¦0% ¦ ¦ ¦ ¦ ¦ ¦ ¦ ¦ ¦ ¦ ¦ ¦ ¦ ¦ ¦ ¦ ¦ ¦ 0%.............................¦ 2091 ¦ 354 ¦ 599 ¦ 550 ¦ 589 ¦ 1798 ¦ 238 ¦ 54 ¦ 1687 ¦ 257 ¦ 148 ¦ 1886 ¦ 48 ¦ 157 ¦ 1250 ¦ 841 ¦ ¦................................¦ 72.1% ¦ 86.0% ¦ 69.7% ¦ 71.7% ¦ 68.4% ¦ 72.7% ¦ 69.3% ¦ 66.4% ¦ 77.5% ¦ 53.6% ¦ 60.5% ¦ 73.2% ¦ 62.9% ¦ 64.1% ¦ 74.7% ¦ 68.6% ¦ +--------------------------------+-------+-------+-------+-------+-------+-------+-------+-------+-------+-------+-------+-------+-------+-------+-------+-------¦ ¦Autour de 1% ¦ ¦ ¦ ¦ ¦ ¦ ¦ ¦ ¦ ¦ ¦ ¦ ¦ ¦ ¦ ¦ ¦ ¦ Around 1%......................¦ 117 ¦ 2 ¦ 32 ¦ 48 ¦ 35 ¦ 101 ¦ 13 ¦ 3 ¦ 90 ¦ 21 ¦ 7 ¦ 106 ¦ 2 ¦ 9 ¦ 69 ¦ 48 ¦ ¦................................¦ 4.0% ¦ .6% ¦ 3.7% ¦ 6.2% ¦ 4.0% ¦ 4.1% ¦ 3.8% ¦ 3.8% ¦ 4.1% ¦ 4.3% ¦ 2.7% ¦ 4.1% ¦ 2.6% ¦ 3.8% ¦ 4.1% ¦ 3.9% ¦ +--------------------------------+-------+-------+-------+-------+-------+-------+-------+-------+-------+-------+-------+-------+-------+-------+-------+-------¦ ¦Autour de 2% ¦ ¦ ¦ ¦ ¦ ¦ ¦ ¦ ¦ ¦ ¦ ¦ ¦ ¦ ¦ ¦ ¦ ¦ Around 2%......................¦ 83 ¦ 6 ¦ 31 ¦ 19 ¦ 27 ¦ 70 ¦ 10 ¦ 3 ¦ 56 ¦ 21 ¦ 6 ¦ 76 ¦ 1 ¦ 7 ¦ 53 ¦ 30 ¦ ¦................................¦ 2.9% ¦ 1.4% ¦ 3.6% ¦ 2.5% ¦ 3.1% ¦ 2.8% ¦ 2.9% ¦ 3.3% ¦ 2.6% ¦ 4.4% ¦ 2.3% ¦ 2.9% ¦ .8% ¦ 2.7% ¦ 3.1% ¦ 2.5% ¦ +--------------------------------+-------+-------+-------+-------+-------+-------+-------+-------+-------+-------+-------+-------+-------+-------+-------+-------¦ ¦Autour de 3% ¦ ¦ ¦ ¦ ¦ ¦ ¦ ¦ ¦ ¦ ¦ ¦ ¦ ¦ ¦ ¦ ¦ ¦ Around 3%......................¦ 63 ¦ 4 ¦ 21 ¦ 28 ¦ 9 ¦ 54 ¦ 8 ¦ 2 ¦ 30 ¦ 32 ¦ 1 ¦ 57 ¦ 2 ¦ 4 ¦ 35 ¦ 27 ¦ ¦................................¦ 2.2% ¦ 1.1% ¦ 2.5% ¦ 3.7% ¦ 1.0% ¦ 2.2% ¦ 2.2% ¦ 2.0% ¦ 1.4% ¦ 6.6% ¦ .5% ¦ 2.2% ¦ 2.5% ¦ 1.6% ¦ 2.1% ¦ 2.2% ¦ +--------------------------------+-------+-------+-------+-------+-------+-------+-------+-------+-------+-------+-------+-------+-------+-------+-------+-------¦ ¦Autour de 5% (= 4-7%) ¦ ¦ ¦ ¦ ¦ ¦ ¦ ¦ ¦ ¦ ¦ ¦ ¦ ¦ ¦ ¦ ¦ ¦ Around 5% (= 4-7%)...........¦ 156 ¦ 15 ¦ 48 ¦ 44 ¦ 48 ¦ 141 ¦ 12 ¦ 2 ¦ 99 ¦ 39 ¦ 17 ¦ 137 ¦ 5 ¦ 14 ¦ 84 ¦ 71 ¦ ¦................................¦ 5.4% ¦ 3.7% ¦ 5.6% ¦ 5.8% ¦ 5.6% ¦ 5.7% ¦ 3.6% ¦ 3.0% ¦ 4.5% ¦ 8.2% ¦ 7.1% ¦ 5.3% ¦ 6.2% ¦ 5.8% ¦ 5.0% ¦ 5.8% ¦ +--------------------------------+-------+-------+-------+-------+-------+-------+-------+-------+-------+-------+-------+-------+-------+-------+-------+-------¦ ¦Autour de 10% (= 8-12%) ¦ ¦ ¦ ¦ ¦ ¦ ¦ ¦ ¦ ¦ ¦ ¦ ¦ ¦ ¦ ¦ ¦ ¦ Around 10% (= 8-12%)...........¦ 86 ¦ 12 ¦ 27 ¦ 13 ¦ 34 ¦ 68 ¦ 16 ¦ 3 ¦ 48 ¦ 22 ¦ 16 ¦ 75 ¦ 4 ¦ 7 ¦ 34 ¦ 52 ¦ ¦................................¦ 3.0% ¦ 3.0% ¦ 3.1% ¦ 1.7% ¦ 4.0% ¦ 2.7% ¦ 4.5% ¦ 3.4% ¦ 2.2% ¦ 4.5% ¦ 6.7% ¦ 2.9% ¦ 5.6% ¦ 2.8% ¦ 2.1% ¦ 4.2% ¦ +--------------------------------+-------+-------+-------+-------+-------+-------+-------+-------+-------+-------+-------+-------+-------+-------+-------+-------¦ ¦Autour de 15% (=13-17%) ¦ ¦ ¦ ¦ ¦ ¦ ¦ ¦ ¦ ¦ ¦ ¦ ¦ ¦ ¦ ¦ ¦ ¦ Around 15% (=13-17%)...........¦ 31 ¦ 1 ¦ 12 ¦ 7 ¦ 11 ¦ 23 ¦ 7 ¦ 1 ¦ 9 ¦ 14 ¦ 8 ¦ 25 ¦ 1 ¦ 5 ¦ 20 ¦ 10 ¦ ¦................................¦ 1.1% ¦ .2% ¦ 1.4% ¦ .9% ¦ 1.3% ¦ .9% ¦ 2.1% ¦ .9% ¦ .4% ¦ 2.9% ¦ 3.2% ¦ 1.0% ¦ .7% ¦ 2.2% ¦ 1.2% ¦ .8% ¦ +--------------------------------+-------+-------+-------+-------+-------+-------+-------+-------+-------+-------+-------+-------+-------+-------+-------+-------¦ ¦Autour de 20% (=18-22%) ¦ ¦ ¦ ¦ ¦ ¦ ¦ ¦ ¦ ¦ ¦ ¦ ¦ ¦ ¦ ¦ ¦ ¦ Around 20% (=18-22%)...........¦ 33 ¦ 0 ¦ 8 ¦ 9 ¦ 16 ¦ 30 ¦ 2 ¦ 1 ¦ 12 ¦ 12 ¦ 10 ¦ 28 ¦ 0 ¦ 5 ¦ 20 ¦ 13 ¦ ¦................................¦ 1.1% ¦ .0% ¦ 1.0% ¦ 1.1% ¦ 1.9% ¦ 1.2% ¦ .5% ¦ 1.7% ¦ .5% ¦ 2.5% ¦ 4.0% ¦ 1.1% ¦ .4% ¦ 1.9% ¦ 1.2% ¦ 1.1% ¦ +--------------------------------+-------+-------+-------+-------+-------+-------+-------+-------+-------+-------+-------+-------+-------+-------+-------+-------¦ ¦Autour de 25% (=23-27%) ¦ ¦ ¦ ¦ ¦ ¦ ¦ ¦ ¦ ¦ ¦ ¦ ¦ ¦ ¦ ¦ ¦ ¦ Around 25% (=23-27%)...........¦ 29 ¦ 5 ¦ 9 ¦ 4 ¦ 11 ¦ 24 ¦ 5 ¦ 0 ¦ 16 ¦ 13 ¦ 0 ¦ 24 ¦ 0 ¦ 6 ¦ 15 ¦ 15 ¦ ¦................................¦ 1.0% ¦ 1.3% ¦ 1.0% ¦ .6% ¦ 1.3% ¦ 1.0% ¦ 1.4% ¦ .4% ¦ .7% ¦ 2.8% ¦ .1% ¦ .9% ¦ .0% ¦ 2.3% ¦ .9% ¦ 1.2% ¦ +--------------------------------+-------+-------+-------+-------+-------+-------+-------+-------+-------+-------+-------+-------+-------+-------+-------+-------¦ ¦Autour de 30% (=28-35%) ¦ ¦ ¦ ¦ ¦ ¦ ¦ ¦ ¦ ¦ ¦ ¦ ¦ ¦ ¦ ¦ ¦ ¦ Around 30% (=28-35%)...........¦ 36 ¦ 2 ¦ 8 ¦ 15 ¦ 11 ¦ 30 ¦ 6 ¦ 1 ¦ 21 ¦ 12 ¦ 3 ¦ 34 ¦ 0 ¦ 2 ¦ 27 ¦ 9 ¦ +----------------------------------------------------------------------------------------------------------------------------------------------------------------+ (suite page suivante) - (continued next page)Interviews : 26/08/02 - 23/09/02 SOFRES s.a. - Coordination EOS GALLUP EUROPE Volume B - Page : 25

FLASH 128 : BUSINESS SURVEY - 2002
5. Dans vos ventes faites PAR CORRESPONDANCE OU PAR TELEPHONE à des 5. Of your MAIL-ORDER SALES or TELESALES to EU consumers, can you estimateconsommateurs de l'UE, pouvez-vous estimer le pourcentage de vos ventes the percentage of cross-border sales ?transfrontalières ? (INT.: IF DK/NA, YOU MAY SUGGEST THE SCALE BELOW : In order to have an idea(ENQ.: SI NSP/SR, SUGGERER : Etait-ce : ... rien du tout ? autour de 1% ? of the size, was it : ... nothing at all ? / ... around 1% ? / ... 2% ?.. 2% ? .. 3% ? .. 5% ? .. 10% ? .. 15% ? .. 20% ? .. 25% ? etc ...) ... 3% ? / ... 5% ? / ... 10% ? / ...15% ? ...20% ? / ...25% ? ... etc ...)
*** RESULTS ARE WEIGHTED : N. of enterprises in the E.U. +----------------------------------------------------------------------------------------------------------------------------------------------------------------+ ¦ ¦ TOTAL ¦ SECTORS ¦ SIZE CATEGORIES ¦ EU COUNTRIES ACTIVITY ¦ COMPANY STATUS ¦ INTERVIEWED ¦ ¦ +-------+-------------------------------+-----------------------+-----------------------+-----------------------+---------------¦ ¦ ¦ EU 15 ¦Constru¦Indus ¦Trade ¦Servi ¦SME ¦SME ¦MAJORS ¦None ¦1-5 EU ¦6&+ EU ¦Indepen¦Mother ¦Member ¦General¦Mktg-Sa¦ ¦ ¦ ¦ction ¦try ¦ ¦ces ¦10-49 ¦50-249 ¦250+ ¦ ¦countr.¦countr.¦dant ¦Cy ¦group ¦Manager¦les Man¦ +--------------------------------+-------+-------+-------+-------+-------+-------+-------+-------+-------+-------+-------+-------+-------+-------+-------+-------¦ ¦................................¦ 1.2% ¦ .6% ¦ .9% ¦ 1.9% ¦ 1.3% ¦ 1.2% ¦ 1.6% ¦ 1.1% ¦ 1.0% ¦ 2.6% ¦ 1.2% ¦ 1.3% ¦ .1% ¦ .9% ¦ 1.6% ¦ .7% ¦ +--------------------------------+-------+-------+-------+-------+-------+-------+-------+-------+-------+-------+-------+-------+-------+-------+-------+-------¦ ¦Autour de 40% (=36-45%) ¦ ¦ ¦ ¦ ¦ ¦ ¦ ¦ ¦ ¦ ¦ ¦ ¦ ¦ ¦ ¦ ¦ ¦ Around 40% (=36-45%)...........¦ 21 ¦ 0 ¦ 4 ¦ 2 ¦ 16 ¦ 20 ¦ 1 ¦ 0 ¦ 19 ¦ 1 ¦ 1 ¦ 19 ¦ 0 ¦ 2 ¦ 3 ¦ 18 ¦ ¦................................¦ .7% ¦ .0% ¦ .4% ¦ .2% ¦ 1.8% ¦ .8% ¦ .4% ¦ .0% ¦ .9% ¦ .3% ¦ .4% ¦ .7% ¦ .0% ¦ .8% ¦ .2% ¦ 1.5% ¦ +--------------------------------+-------+-------+-------+-------+-------+-------+-------+-------+-------+-------+-------+-------+-------+-------+-------+-------¦ ¦Autour de 50% (=46-55%) ¦ ¦ ¦ ¦ ¦ ¦ ¦ ¦ ¦ ¦ ¦ ¦ ¦ ¦ ¦ ¦ ¦ ¦ Around 50% (=46-55%)...........¦ 18 ¦ 0 ¦ 7 ¦ 3 ¦ 8 ¦ 14 ¦ 3 ¦ 1 ¦ 12 ¦ 6 ¦ 0 ¦ 16 ¦ 0 ¦ 2 ¦ 7 ¦ 12 ¦ ¦................................¦ .6% ¦ .1% ¦ .8% ¦ .4% ¦ .9% ¦ .6% ¦ .9% ¦ 1.6% ¦ .6% ¦ 1.2% ¦ .2% ¦ .6% ¦ .1% ¦ .8% ¦ .4% ¦ 1.0% ¦ +--------------------------------+-------+-------+-------+-------+-------+-------+-------+-------+-------+-------+-------+-------+-------+-------+-------+-------¦ ¦Plus de 55% ¦ ¦ ¦ ¦ ¦ ¦ ¦ ¦ ¦ ¦ ¦ ¦ ¦ ¦ ¦ ¦ ¦ ¦ More than 55%..................¦ 45 ¦ 1 ¦ 26 ¦ 6 ¦ 13 ¦ 38 ¦ 5 ¦ 2 ¦ 30 ¦ 10 ¦ 6 ¦ 34 ¦ 1 ¦ 10 ¦ 14 ¦ 31 ¦ ¦................................¦ 1.6% ¦ .3% ¦ 3.0% ¦ .8% ¦ 1.5% ¦ 1.6% ¦ 1.4% ¦ 2.6% ¦ 1.4% ¦ 2.1% ¦ 2.3% ¦ 1.3% ¦ 1.7% ¦ 4.2% ¦ .8% ¦ 2.5% ¦ +--------------------------------+-------+-------+-------+-------+-------+-------+-------+-------+-------+-------+-------+-------+-------+-------+-------+-------¦ ¦(nsp/sr) ¦ ¦ ¦ ¦ ¦ ¦ ¦ ¦ ¦ ¦ ¦ ¦ ¦ ¦ ¦ ¦ ¦ ¦ (dk/na)........................¦ 89 ¦ 8 ¦ 28 ¦ 20 ¦ 33 ¦ 63 ¦ 19 ¦ 8 ¦ 49 ¦ 20 ¦ 21 ¦ 62 ¦ 12 ¦ 15 ¦ 41 ¦ 48 ¦ ¦................................¦ 3.1% ¦ 2.0% ¦ 3.3% ¦ 2.6% ¦ 3.8% ¦ 2.5% ¦ 5.5% ¦ 9.9% ¦ 2.2% ¦ 4.1% ¦ 8.7% ¦ 2.4% ¦ 16.4% ¦ 6.0% ¦ 2.5% ¦ 3.9% ¦ +--------------------------------+-------+-------+-------+-------+-------+-------+-------+-------+-------+-------+-------+-------+-------+-------+-------+-------¦ ¦% MOYEN AVERAGE %¦ 3.68% ¦ 1.33% ¦ 4.80% ¦ 2.72% ¦ 4.54% ¦ 3.60% ¦ 4.01% ¦ 4.77% ¦ 3.01% ¦ 6.13% ¦ 5.01% ¦ 3.44% ¦ 3.23% ¦ 6.40% ¦ 2.78% ¦ 4.92% ¦ ¦(Base : Répondants - Answering).¦ (2753)¦ (314)¦ (860)¦ (768)¦ (811)¦ (1747)¦ (605)¦ (401)¦ (1972)¦ (492)¦ (289)¦ (2300)¦ (117)¦ (336)¦ (1352)¦ (1401)¦ +----------------------------------------------------------------------------------------------------------------------------------------------------------------+
Interviews : 26/08/02 - 23/09/02 SOFRES s.a. - Coordination EOS GALLUP EUROPE Volume B - Page : 26
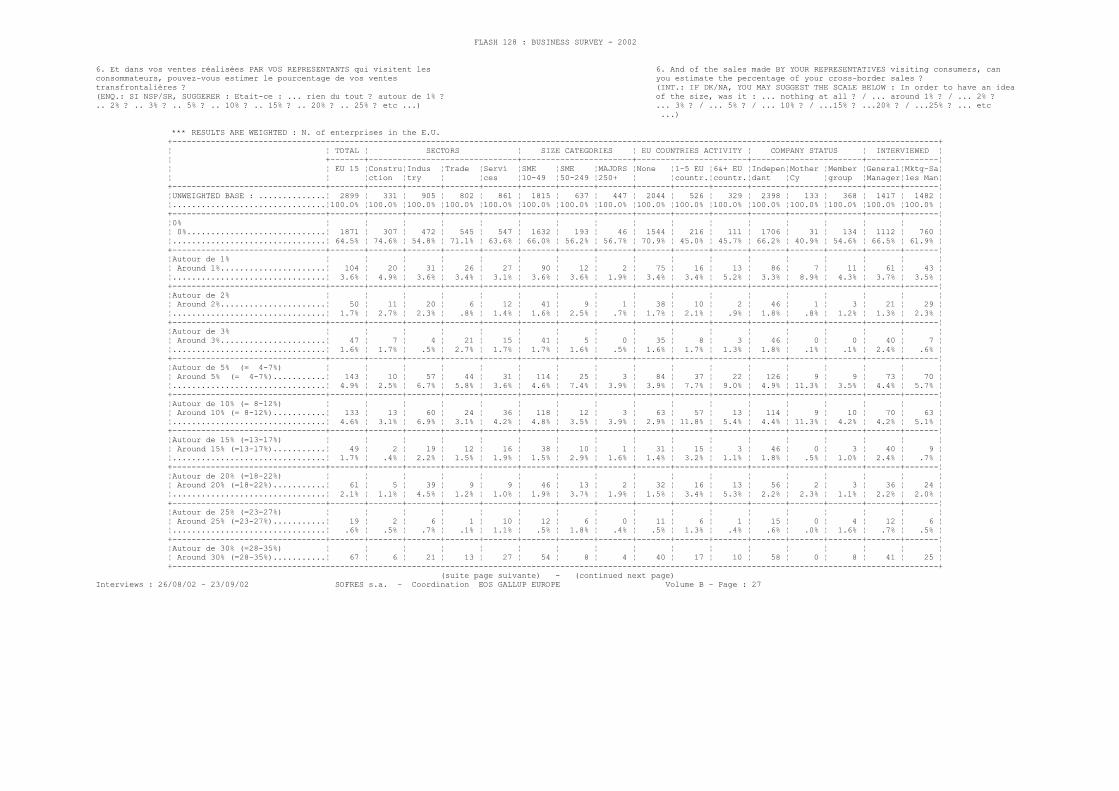
FLASH 128 : BUSINESS SURVEY - 2002
6. Et dans vos ventes réalisées PAR VOS REPRESENTANTS qui visitent les 6. And of the sales made BY YOUR REPRESENTATIVES visiting consumers, canconsommateurs, pouvez-vous estimer le pourcentage de vos ventes you estimate the percentage of your cross-border sales ?transfrontalières ? (INT.: IF DK/NA, YOU MAY SUGGEST THE SCALE BELOW : In order to have an idea(ENQ.: SI NSP/SR, SUGGERER : Etait-ce : ... rien du tout ? autour de 1% ? of the size, was it : ... nothing at all ? / ... around 1% ? / ... 2% ?.. 2% ? .. 3% ? .. 5% ? .. 10% ? .. 15% ? .. 20% ? .. 25% ? etc ...) ... 3% ? / ... 5% ? / ... 10% ? / ...15% ? ...20% ? / ...25% ? ... etc ...)
*** RESULTS ARE WEIGHTED : N. of enterprises in the E.U. +----------------------------------------------------------------------------------------------------------------------------------------------------------------+ ¦ ¦ TOTAL ¦ SECTORS ¦ SIZE CATEGORIES ¦ EU COUNTRIES ACTIVITY ¦ COMPANY STATUS ¦ INTERVIEWED ¦ ¦ +-------+-------------------------------+-----------------------+-----------------------+-----------------------+---------------¦ ¦ ¦ EU 15 ¦Constru¦Indus ¦Trade ¦Servi ¦SME ¦SME ¦MAJORS ¦None ¦1-5 EU ¦6&+ EU ¦Indepen¦Mother ¦Member ¦General¦Mktg-Sa¦ ¦ ¦ ¦ction ¦try ¦ ¦ces ¦10-49 ¦50-249 ¦250+ ¦ ¦countr.¦countr.¦dant ¦Cy ¦group ¦Manager¦les Man¦ +--------------------------------+-------+-------+-------+-------+-------+-------+-------+-------+-------+-------+-------+-------+-------+-------+-------+-------¦ ¦UNWEIGHTED BASE : ..............¦ 2899 ¦ 331 ¦ 905 ¦ 802 ¦ 861 ¦ 1815 ¦ 637 ¦ 447 ¦ 2044 ¦ 526 ¦ 329 ¦ 2398 ¦ 133 ¦ 368 ¦ 1417 ¦ 1482 ¦ ¦................................¦100.0% ¦100.0% ¦100.0% ¦100.0% ¦100.0% ¦100.0% ¦100.0% ¦100.0% ¦100.0% ¦100.0% ¦100.0% ¦100.0% ¦100.0% ¦100.0% ¦100.0% ¦100.0% ¦ +--------------------------------+-------+-------+-------+-------+-------+-------+-------+-------+-------+-------+-------+-------+-------+-------+-------+-------¦ ¦0% ¦ ¦ ¦ ¦ ¦ ¦ ¦ ¦ ¦ ¦ ¦ ¦ ¦ ¦ ¦ ¦ ¦ ¦ 0%.............................¦ 1871 ¦ 307 ¦ 472 ¦ 545 ¦ 547 ¦ 1632 ¦ 193 ¦ 46 ¦ 1544 ¦ 216 ¦ 111 ¦ 1706 ¦ 31 ¦ 134 ¦ 1112 ¦ 760 ¦ ¦................................¦ 64.5% ¦ 74.6% ¦ 54.8% ¦ 71.1% ¦ 63.6% ¦ 66.0% ¦ 56.2% ¦ 56.7% ¦ 70.9% ¦ 45.0% ¦ 45.7% ¦ 66.2% ¦ 40.9% ¦ 54.6% ¦ 66.5% ¦ 61.9% ¦ +--------------------------------+-------+-------+-------+-------+-------+-------+-------+-------+-------+-------+-------+-------+-------+-------+-------+-------¦ ¦Autour de 1% ¦ ¦ ¦ ¦ ¦ ¦ ¦ ¦ ¦ ¦ ¦ ¦ ¦ ¦ ¦ ¦ ¦ ¦ Around 1%......................¦ 104 ¦ 20 ¦ 31 ¦ 26 ¦ 27 ¦ 90 ¦ 12 ¦ 2 ¦ 75 ¦ 16 ¦ 13 ¦ 86 ¦ 7 ¦ 11 ¦ 61 ¦ 43 ¦ ¦................................¦ 3.6% ¦ 4.9% ¦ 3.6% ¦ 3.4% ¦ 3.1% ¦ 3.6% ¦ 3.6% ¦ 1.9% ¦ 3.4% ¦ 3.4% ¦ 5.2% ¦ 3.3% ¦ 8.9% ¦ 4.3% ¦ 3.7% ¦ 3.5% ¦ +--------------------------------+-------+-------+-------+-------+-------+-------+-------+-------+-------+-------+-------+-------+-------+-------+-------+-------¦ ¦Autour de 2% ¦ ¦ ¦ ¦ ¦ ¦ ¦ ¦ ¦ ¦ ¦ ¦ ¦ ¦ ¦ ¦ ¦ ¦ Around 2%......................¦ 50 ¦ 11 ¦ 20 ¦ 6 ¦ 12 ¦ 41 ¦ 9 ¦ 1 ¦ 38 ¦ 10 ¦ 2 ¦ 46 ¦ 1 ¦ 3 ¦ 21 ¦ 29 ¦ ¦................................¦ 1.7% ¦ 2.7% ¦ 2.3% ¦ .8% ¦ 1.4% ¦ 1.6% ¦ 2.5% ¦ .7% ¦ 1.7% ¦ 2.1% ¦ .9% ¦ 1.8% ¦ .8% ¦ 1.2% ¦ 1.3% ¦ 2.3% ¦ +--------------------------------+-------+-------+-------+-------+-------+-------+-------+-------+-------+-------+-------+-------+-------+-------+-------+-------¦ ¦Autour de 3% ¦ ¦ ¦ ¦ ¦ ¦ ¦ ¦ ¦ ¦ ¦ ¦ ¦ ¦ ¦ ¦ ¦ ¦ Around 3%......................¦ 47 ¦ 7 ¦ 4 ¦ 21 ¦ 15 ¦ 41 ¦ 5 ¦ 0 ¦ 35 ¦ 8 ¦ 3 ¦ 46 ¦ 0 ¦ 0 ¦ 40 ¦ 7 ¦ ¦................................¦ 1.6% ¦ 1.7% ¦ .5% ¦ 2.7% ¦ 1.7% ¦ 1.7% ¦ 1.6% ¦ .5% ¦ 1.6% ¦ 1.7% ¦ 1.3% ¦ 1.8% ¦ .1% ¦ .1% ¦ 2.4% ¦ .6% ¦ +--------------------------------+-------+-------+-------+-------+-------+-------+-------+-------+-------+-------+-------+-------+-------+-------+-------+-------¦ ¦Autour de 5% (= 4-7%) ¦ ¦ ¦ ¦ ¦ ¦ ¦ ¦ ¦ ¦ ¦ ¦ ¦ ¦ ¦ ¦ ¦ ¦ Around 5% (= 4-7%)...........¦ 143 ¦ 10 ¦ 57 ¦ 44 ¦ 31 ¦ 114 ¦ 25 ¦ 3 ¦ 84 ¦ 37 ¦ 22 ¦ 126 ¦ 9 ¦ 9 ¦ 73 ¦ 70 ¦ ¦................................¦ 4.9% ¦ 2.5% ¦ 6.7% ¦ 5.8% ¦ 3.6% ¦ 4.6% ¦ 7.4% ¦ 3.9% ¦ 3.9% ¦ 7.7% ¦ 9.0% ¦ 4.9% ¦ 11.3% ¦ 3.5% ¦ 4.4% ¦ 5.7% ¦ +--------------------------------+-------+-------+-------+-------+-------+-------+-------+-------+-------+-------+-------+-------+-------+-------+-------+-------¦ ¦Autour de 10% (= 8-12%) ¦ ¦ ¦ ¦ ¦ ¦ ¦ ¦ ¦ ¦ ¦ ¦ ¦ ¦ ¦ ¦ ¦ ¦ Around 10% (= 8-12%)...........¦ 133 ¦ 13 ¦ 60 ¦ 24 ¦ 36 ¦ 118 ¦ 12 ¦ 3 ¦ 63 ¦ 57 ¦ 13 ¦ 114 ¦ 9 ¦ 10 ¦ 70 ¦ 63 ¦ ¦................................¦ 4.6% ¦ 3.1% ¦ 6.9% ¦ 3.1% ¦ 4.2% ¦ 4.8% ¦ 3.5% ¦ 3.9% ¦ 2.9% ¦ 11.8% ¦ 5.4% ¦ 4.4% ¦ 11.3% ¦ 4.2% ¦ 4.2% ¦ 5.1% ¦ +--------------------------------+-------+-------+-------+-------+-------+-------+-------+-------+-------+-------+-------+-------+-------+-------+-------+-------¦ ¦Autour de 15% (=13-17%) ¦ ¦ ¦ ¦ ¦ ¦ ¦ ¦ ¦ ¦ ¦ ¦ ¦ ¦ ¦ ¦ ¦ ¦ Around 15% (=13-17%)...........¦ 49 ¦ 2 ¦ 19 ¦ 12 ¦ 16 ¦ 38 ¦ 10 ¦ 1 ¦ 31 ¦ 15 ¦ 3 ¦ 46 ¦ 0 ¦ 3 ¦ 40 ¦ 9 ¦ ¦................................¦ 1.7% ¦ .4% ¦ 2.2% ¦ 1.5% ¦ 1.9% ¦ 1.5% ¦ 2.9% ¦ 1.6% ¦ 1.4% ¦ 3.2% ¦ 1.1% ¦ 1.8% ¦ .5% ¦ 1.0% ¦ 2.4% ¦ .7% ¦ +--------------------------------+-------+-------+-------+-------+-------+-------+-------+-------+-------+-------+-------+-------+-------+-------+-------+-------¦ ¦Autour de 20% (=18-22%) ¦ ¦ ¦ ¦ ¦ ¦ ¦ ¦ ¦ ¦ ¦ ¦ ¦ ¦ ¦ ¦ ¦ ¦ Around 20% (=18-22%)...........¦ 61 ¦ 5 ¦ 39 ¦ 9 ¦ 9 ¦ 46 ¦ 13 ¦ 2 ¦ 32 ¦ 16 ¦ 13 ¦ 56 ¦ 2 ¦ 3 ¦ 36 ¦ 24 ¦ ¦................................¦ 2.1% ¦ 1.1% ¦ 4.5% ¦ 1.2% ¦ 1.0% ¦ 1.9% ¦ 3.7% ¦ 1.9% ¦ 1.5% ¦ 3.4% ¦ 5.3% ¦ 2.2% ¦ 2.3% ¦ 1.1% ¦ 2.2% ¦ 2.0% ¦ +--------------------------------+-------+-------+-------+-------+-------+-------+-------+-------+-------+-------+-------+-------+-------+-------+-------+-------¦ ¦Autour de 25% (=23-27%) ¦ ¦ ¦ ¦ ¦ ¦ ¦ ¦ ¦ ¦ ¦ ¦ ¦ ¦ ¦ ¦ ¦ ¦ Around 25% (=23-27%)...........¦ 19 ¦ 2 ¦ 6 ¦ 1 ¦ 10 ¦ 12 ¦ 6 ¦ 0 ¦ 11 ¦ 6 ¦ 1 ¦ 15 ¦ 0 ¦ 4 ¦ 12 ¦ 6 ¦ ¦................................¦ .6% ¦ .5% ¦ .7% ¦ .1% ¦ 1.1% ¦ .5% ¦ 1.8% ¦ .4% ¦ .5% ¦ 1.3% ¦ .4% ¦ .6% ¦ .0% ¦ 1.6% ¦ .7% ¦ .5% ¦ +--------------------------------+-------+-------+-------+-------+-------+-------+-------+-------+-------+-------+-------+-------+-------+-------+-------+-------¦ ¦Autour de 30% (=28-35%) ¦ ¦ ¦ ¦ ¦ ¦ ¦ ¦ ¦ ¦ ¦ ¦ ¦ ¦ ¦ ¦ ¦ ¦ Around 30% (=28-35%)...........¦ 67 ¦ 6 ¦ 21 ¦ 13 ¦ 27 ¦ 54 ¦ 8 ¦ 4 ¦ 40 ¦ 17 ¦ 10 ¦ 58 ¦ 0 ¦ 8 ¦ 41 ¦ 25 ¦ +----------------------------------------------------------------------------------------------------------------------------------------------------------------+ (suite page suivante) - (continued next page)Interviews : 26/08/02 - 23/09/02 SOFRES s.a. - Coordination EOS GALLUP EUROPE Volume B - Page : 27

FLASH 128 : BUSINESS SURVEY - 2002
6. Et dans vos ventes réalisées PAR VOS REPRESENTANTS qui visitent les 6. And of the sales made BY YOUR REPRESENTATIVES visiting consumers, canconsommateurs, pouvez-vous estimer le pourcentage de vos ventes you estimate the percentage of your cross-border sales ?transfrontalières ? (INT.: IF DK/NA, YOU MAY SUGGEST THE SCALE BELOW : In order to have an idea(ENQ.: SI NSP/SR, SUGGERER : Etait-ce : ... rien du tout ? autour de 1% ? of the size, was it : ... nothing at all ? / ... around 1% ? / ... 2% ?.. 2% ? .. 3% ? .. 5% ? .. 10% ? .. 15% ? .. 20% ? .. 25% ? etc ...) ... 3% ? / ... 5% ? / ... 10% ? / ...15% ? ...20% ? / ...25% ? ... etc ...)
*** RESULTS ARE WEIGHTED : N. of enterprises in the E.U. +----------------------------------------------------------------------------------------------------------------------------------------------------------------+ ¦ ¦ TOTAL ¦ SECTORS ¦ SIZE CATEGORIES ¦ EU COUNTRIES ACTIVITY ¦ COMPANY STATUS ¦ INTERVIEWED ¦ ¦ +-------+-------------------------------+-----------------------+-----------------------+-----------------------+---------------¦ ¦ ¦ EU 15 ¦Constru¦Indus ¦Trade ¦Servi ¦SME ¦SME ¦MAJORS ¦None ¦1-5 EU ¦6&+ EU ¦Indepen¦Mother ¦Member ¦General¦Mktg-Sa¦ ¦ ¦ ¦ction ¦try ¦ ¦ces ¦10-49 ¦50-249 ¦250+ ¦ ¦countr.¦countr.¦dant ¦Cy ¦group ¦Manager¦les Man¦ +--------------------------------+-------+-------+-------+-------+-------+-------+-------+-------+-------+-------+-------+-------+-------+-------+-------+-------¦ ¦................................¦ 2.3% ¦ 1.5% ¦ 2.5% ¦ 1.7% ¦ 3.1% ¦ 2.2% ¦ 2.3% ¦ 5.4% ¦ 1.8% ¦ 3.5% ¦ 4.1% ¦ 2.3% ¦ .5% ¦ 3.4% ¦ 2.5% ¦ 2.1% ¦ +--------------------------------+-------+-------+-------+-------+-------+-------+-------+-------+-------+-------+-------+-------+-------+-------+-------+-------¦ ¦Autour de 40% (=36-45%) ¦ ¦ ¦ ¦ ¦ ¦ ¦ ¦ ¦ ¦ ¦ ¦ ¦ ¦ ¦ ¦ ¦ ¦ Around 40% (=36-45%)...........¦ 26 ¦ 2 ¦ 11 ¦ 4 ¦ 9 ¦ 22 ¦ 4 ¦ 0 ¦ 18 ¦ 4 ¦ 4 ¦ 25 ¦ 0 ¦ 0 ¦ 11 ¦ 15 ¦ ¦................................¦ .9% ¦ .4% ¦ 1.3% ¦ .6% ¦ 1.0% ¦ .9% ¦ 1.1% ¦ .4% ¦ .8% ¦ .9% ¦ 1.5% ¦ 1.0% ¦ .5% ¦ .1% ¦ .7% ¦ 1.2% ¦ +--------------------------------+-------+-------+-------+-------+-------+-------+-------+-------+-------+-------+-------+-------+-------+-------+-------+-------¦ ¦Autour de 50% (=46-55%) ¦ ¦ ¦ ¦ ¦ ¦ ¦ ¦ ¦ ¦ ¦ ¦ ¦ ¦ ¦ ¦ ¦ ¦ Around 50% (=46-55%)...........¦ 54 ¦ 11 ¦ 19 ¦ 9 ¦ 16 ¦ 47 ¦ 6 ¦ 1 ¦ 27 ¦ 18 ¦ 9 ¦ 45 ¦ 1 ¦ 8 ¦ 37 ¦ 17 ¦ ¦................................¦ 1.9% ¦ 2.6% ¦ 2.2% ¦ 1.1% ¦ 1.9% ¦ 1.9% ¦ 1.8% ¦ 1.1% ¦ 1.3% ¦ 3.7% ¦ 3.6% ¦ 1.7% ¦ 1.9% ¦ 3.3% ¦ 2.2% ¦ 1.4% ¦ +--------------------------------+-------+-------+-------+-------+-------+-------+-------+-------+-------+-------+-------+-------+-------+-------+-------+-------¦ ¦Plus de 55% ¦ ¦ ¦ ¦ ¦ ¦ ¦ ¦ ¦ ¦ ¦ ¦ ¦ ¦ ¦ ¦ ¦ ¦ More than 55%..................¦ 147 ¦ 5 ¦ 67 ¦ 25 ¦ 50 ¦ 118 ¦ 18 ¦ 11 ¦ 87 ¦ 38 ¦ 22 ¦ 105 ¦ 7 ¦ 36 ¦ 67 ¦ 80 ¦ ¦................................¦ 5.1% ¦ 1.1% ¦ 7.8% ¦ 3.3% ¦ 5.9% ¦ 4.8% ¦ 5.3% ¦ 13.6% ¦ 4.0% ¦ 8.0% ¦ 8.9% ¦ 4.1% ¦ 9.0% ¦ 14.5% ¦ 4.0% ¦ 6.5% ¦ +--------------------------------+-------+-------+-------+-------+-------+-------+-------+-------+-------+-------+-------+-------+-------+-------+-------+-------¦ ¦(nsp/sr) ¦ ¦ ¦ ¦ ¦ ¦ ¦ ¦ ¦ ¦ ¦ ¦ ¦ ¦ ¦ ¦ ¦ ¦ (dk/na)........................¦ 130 ¦ 11 ¦ 35 ¦ 28 ¦ 56 ¦ 101 ¦ 22 ¦ 6 ¦ 91 ¦ 21 ¦ 18 ¦ 104 ¦ 9 ¦ 17 ¦ 52 ¦ 78 ¦ ¦................................¦ 4.5% ¦ 2.7% ¦ 4.0% ¦ 3.6% ¦ 6.5% ¦ 4.1% ¦ 6.4% ¦ 7.8% ¦ 4.2% ¦ 4.3% ¦ 7.5% ¦ 4.0% ¦ 12.0% ¦ 7.1% ¦ 3.1% ¦ 6.4% ¦ +--------------------------------+-------+-------+-------+-------+-------+-------+-------+-------+-------+-------+-------+-------+-------+-------+-------+-------¦ ¦% MOYEN AVERAGE %¦ 8.26% ¦ 3.98% ¦11.68% ¦ 5.43% ¦ 9.49% ¦ 7.83% ¦ 9.60% ¦16.09% ¦ 6.39% ¦13.63% ¦14.73% ¦ 7.36% ¦12.70% ¦16.76% ¦ 7.52% ¦ 9.31% ¦ ¦(Base : Répondants - Answering).¦ (2728)¦ (311)¦ (858)¦ (761)¦ (798)¦ (1727)¦ (596)¦ (405)¦ (1941)¦ (491)¦ (296)¦ (2276)¦ (118)¦ (334)¦ (1348)¦ (1380)¦ +----------------------------------------------------------------------------------------------------------------------------------------------------------------+
Interviews : 26/08/02 - 23/09/02 SOFRES s.a. - Coordination EOS GALLUP EUROPE Volume B - Page : 28

FLASH 128 : BUSINESS SURVEY - 2002
7. Dans vos VENTES AU DETAIL EN MAGASINS, pouvez-vous estimer le 7. Of your RETAIL SALES IN SHOPS, can you estimate the percentage of yourpourcentage de vos ventes transfrontalières ? cross-border sales ?(ENQ.: SI NSP/SR, SUGGERER : Etait-ce : ... rien du tout ? autour de 1% ? (INT.: IF DK/NA, YOU MAY SUGGEST THE SCALE BELOW : In order to have an idea.. 2% ? .. 3% ? .. 5% ? .. 10% ? .. 15% ? .. 20% ? .. 25% ? etc ...) of the size, was it : ... nothing at all ? / ... around 1% ? / ... 2% ? ... 3% ? / ... 5% ? / ... 10% ? / ...15% ? ...20% ? / ...25% ? ... etc ...)
*** RESULTS ARE WEIGHTED : N. of enterprises in the E.U. +----------------------------------------------------------------------------------------------------------------------------------------------------------------+ ¦ ¦ TOTAL ¦ SECTORS ¦ SIZE CATEGORIES ¦ EU COUNTRIES ACTIVITY ¦ COMPANY STATUS ¦ INTERVIEWED ¦ ¦ +-------+-------------------------------+-----------------------+-----------------------+-----------------------+---------------¦ ¦ ¦ EU 15 ¦Constru¦Indus ¦Trade ¦Servi ¦SME ¦SME ¦MAJORS ¦None ¦1-5 EU ¦6&+ EU ¦Indepen¦Mother ¦Member ¦General¦Mktg-Sa¦ ¦ ¦ ¦ction ¦try ¦ ¦ces ¦10-49 ¦50-249 ¦250+ ¦ ¦countr.¦countr.¦dant ¦Cy ¦group ¦Manager¦les Man¦ +--------------------------------+-------+-------+-------+-------+-------+-------+-------+-------+-------+-------+-------+-------+-------+-------+-------+-------¦ ¦UNWEIGHTED BASE : ..............¦ 2899 ¦ 331 ¦ 905 ¦ 802 ¦ 861 ¦ 1815 ¦ 637 ¦ 447 ¦ 2044 ¦ 526 ¦ 329 ¦ 2398 ¦ 133 ¦ 368 ¦ 1417 ¦ 1482 ¦ ¦................................¦100.0% ¦100.0% ¦100.0% ¦100.0% ¦100.0% ¦100.0% ¦100.0% ¦100.0% ¦100.0% ¦100.0% ¦100.0% ¦100.0% ¦100.0% ¦100.0% ¦100.0% ¦100.0% ¦ +--------------------------------+-------+-------+-------+-------+-------+-------+-------+-------+-------+-------+-------+-------+-------+-------+-------+-------¦ ¦0% ¦ ¦ ¦ ¦ ¦ ¦ ¦ ¦ ¦ ¦ ¦ ¦ ¦ ¦ ¦ ¦ ¦ ¦ 0%.............................¦ 1899 ¦ 340 ¦ 525 ¦ 413 ¦ 621 ¦ 1628 ¦ 220 ¦ 51 ¦ 1503 ¦ 268 ¦ 128 ¦ 1720 ¦ 30 ¦ 149 ¦ 1107 ¦ 792 ¦ ¦................................¦ 65.5% ¦ 82.6% ¦ 61.0% ¦ 53.8% ¦ 72.2% ¦ 65.8% ¦ 64.1% ¦ 62.1% ¦ 69.1% ¦ 56.0% ¦ 52.4% ¦ 66.7% ¦ 39.6% ¦ 60.7% ¦ 66.2% ¦ 64.5% ¦ +--------------------------------+-------+-------+-------+-------+-------+-------+-------+-------+-------+-------+-------+-------+-------+-------+-------+-------¦ ¦Autour de 1% ¦ ¦ ¦ ¦ ¦ ¦ ¦ ¦ ¦ ¦ ¦ ¦ ¦ ¦ ¦ ¦ ¦ ¦ Around 1%......................¦ 158 ¦ 18 ¦ 51 ¦ 58 ¦ 31 ¦ 138 ¦ 17 ¦ 3 ¦ 121 ¦ 24 ¦ 13 ¦ 134 ¦ 7 ¦ 18 ¦ 79 ¦ 79 ¦ ¦................................¦ 5.5% ¦ 4.5% ¦ 5.9% ¦ 7.5% ¦ 3.7% ¦ 5.6% ¦ 5.1% ¦ 3.8% ¦ 5.5% ¦ 5.1% ¦ 5.4% ¦ 5.2% ¦ 9.4% ¦ 7.2% ¦ 4.7% ¦ 6.4% ¦ +--------------------------------+-------+-------+-------+-------+-------+-------+-------+-------+-------+-------+-------+-------+-------+-------+-------+-------¦ ¦Autour de 2% ¦ ¦ ¦ ¦ ¦ ¦ ¦ ¦ ¦ ¦ ¦ ¦ ¦ ¦ ¦ ¦ ¦ ¦ Around 2%......................¦ 84 ¦ 7 ¦ 23 ¦ 28 ¦ 26 ¦ 71 ¦ 13 ¦ 0 ¦ 52 ¦ 23 ¦ 8 ¦ 77 ¦ 1 ¦ 7 ¦ 62 ¦ 22 ¦ ¦................................¦ 2.9% ¦ 1.7% ¦ 2.7% ¦ 3.6% ¦ 3.0% ¦ 2.9% ¦ 3.6% ¦ .4% ¦ 2.4% ¦ 4.9% ¦ 3.4% ¦ 3.0% ¦ 1.0% ¦ 2.7% ¦ 3.7% ¦ 1.8% ¦ +--------------------------------+-------+-------+-------+-------+-------+-------+-------+-------+-------+-------+-------+-------+-------+-------+-------+-------¦ ¦Autour de 3% ¦ ¦ ¦ ¦ ¦ ¦ ¦ ¦ ¦ ¦ ¦ ¦ ¦ ¦ ¦ ¦ ¦ ¦ Around 3%......................¦ 64 ¦ 7 ¦ 14 ¦ 29 ¦ 14 ¦ 58 ¦ 5 ¦ 1 ¦ 43 ¦ 16 ¦ 4 ¦ 57 ¦ 4 ¦ 2 ¦ 42 ¦ 21 ¦ ¦................................¦ 2.2% ¦ 1.6% ¦ 1.6% ¦ 3.8% ¦ 1.6% ¦ 2.3% ¦ 1.4% ¦ .9% ¦ 2.0% ¦ 3.3% ¦ 1.8% ¦ 2.2% ¦ 5.2% ¦ 1.0% ¦ 2.5% ¦ 1.7% ¦ +--------------------------------+-------+-------+-------+-------+-------+-------+-------+-------+-------+-------+-------+-------+-------+-------+-------+-------¦ ¦Autour de 5% (= 4-7%) ¦ ¦ ¦ ¦ ¦ ¦ ¦ ¦ ¦ ¦ ¦ ¦ ¦ ¦ ¦ ¦ ¦ ¦ Around 5% (= 4-7%)...........¦ 138 ¦ 2 ¦ 48 ¦ 58 ¦ 29 ¦ 113 ¦ 21 ¦ 3 ¦ 91 ¦ 32 ¦ 15 ¦ 128 ¦ 2 ¦ 8 ¦ 79 ¦ 59 ¦ ¦................................¦ 4.7% ¦ .6% ¦ 5.6% ¦ 7.6% ¦ 3.3% ¦ 4.6% ¦ 6.2% ¦ 4.2% ¦ 4.2% ¦ 6.6% ¦ 6.0% ¦ 5.0% ¦ 2.2% ¦ 3.1% ¦ 4.7% ¦ 4.8% ¦ +--------------------------------+-------+-------+-------+-------+-------+-------+-------+-------+-------+-------+-------+-------+-------+-------+-------+-------¦ ¦Autour de 10% (= 8-12%) ¦ ¦ ¦ ¦ ¦ ¦ ¦ ¦ ¦ ¦ ¦ ¦ ¦ ¦ ¦ ¦ ¦ ¦ Around 10% (= 8-12%)...........¦ 123 ¦ 13 ¦ 46 ¦ 46 ¦ 19 ¦ 111 ¦ 8 ¦ 3 ¦ 74 ¦ 42 ¦ 7 ¦ 113 ¦ 4 ¦ 7 ¦ 92 ¦ 31 ¦ ¦................................¦ 4.2% ¦ 3.1% ¦ 5.3% ¦ 5.9% ¦ 2.2% ¦ 4.5% ¦ 2.3% ¦ 4.2% ¦ 3.4% ¦ 8.7% ¦ 2.7% ¦ 4.4% ¦ 4.7% ¦ 2.7% ¦ 5.5% ¦ 2.5% ¦ +--------------------------------+-------+-------+-------+-------+-------+-------+-------+-------+-------+-------+-------+-------+-------+-------+-------+-------¦ ¦Autour de 15% (=13-17%) ¦ ¦ ¦ ¦ ¦ ¦ ¦ ¦ ¦ ¦ ¦ ¦ ¦ ¦ ¦ ¦ ¦ ¦ Around 15% (=13-17%)...........¦ 25 ¦ 0 ¦ 9 ¦ 10 ¦ 6 ¦ 21 ¦ 5 ¦ 0 ¦ 20 ¦ 3 ¦ 2 ¦ 24 ¦ 1 ¦ 0 ¦ 13 ¦ 13 ¦ ¦................................¦ .9% ¦ .0% ¦ 1.0% ¦ 1.4% ¦ .7% ¦ .8% ¦ 1.3% ¦ .1% ¦ .9% ¦ .6% ¦ 1.0% ¦ .9% ¦ .9% ¦ .2% ¦ .7% ¦ 1.0% ¦ +--------------------------------+-------+-------+-------+-------+-------+-------+-------+-------+-------+-------+-------+-------+-------+-------+-------+-------¦ ¦Autour de 20% (=18-22%) ¦ ¦ ¦ ¦ ¦ ¦ ¦ ¦ ¦ ¦ ¦ ¦ ¦ ¦ ¦ ¦ ¦ ¦ Around 20% (=18-22%)...........¦ 55 ¦ 1 ¦ 26 ¦ 16 ¦ 13 ¦ 49 ¦ 4 ¦ 2 ¦ 31 ¦ 13 ¦ 11 ¦ 44 ¦ 3 ¦ 8 ¦ 27 ¦ 28 ¦ ¦................................¦ 1.9% ¦ .2% ¦ 3.0% ¦ 2.1% ¦ 1.5% ¦ 2.0% ¦ 1.3% ¦ 1.9% ¦ 1.4% ¦ 2.8% ¦ 4.5% ¦ 1.7% ¦ 4.0% ¦ 3.2% ¦ 1.6% ¦ 2.3% ¦ +--------------------------------+-------+-------+-------+-------+-------+-------+-------+-------+-------+-------+-------+-------+-------+-------+-------+-------¦ ¦Autour de 25% (=23-27%) ¦ ¦ ¦ ¦ ¦ ¦ ¦ ¦ ¦ ¦ ¦ ¦ ¦ ¦ ¦ ¦ ¦ ¦ Around 25% (=23-27%)...........¦ 23 ¦ 0 ¦ 10 ¦ 7 ¦ 6 ¦ 21 ¦ 1 ¦ 0 ¦ 17 ¦ 4 ¦ 2 ¦ 19 ¦ 0 ¦ 4 ¦ 8 ¦ 14 ¦ ¦................................¦ .8% ¦ .0% ¦ 1.2% ¦ .9% ¦ .7% ¦ .9% ¦ .4% ¦ .6% ¦ .8% ¦ .9% ¦ .7% ¦ .7% ¦ .0% ¦ 1.6% ¦ .5% ¦ 1.2% ¦ +--------------------------------+-------+-------+-------+-------+-------+-------+-------+-------+-------+-------+-------+-------+-------+-------+-------+-------¦ ¦Autour de 30% (=28-35%) ¦ ¦ ¦ ¦ ¦ ¦ ¦ ¦ ¦ ¦ ¦ ¦ ¦ ¦ ¦ ¦ ¦ ¦ Around 30% (=28-35%)...........¦ 32 ¦ 6 ¦ 13 ¦ 6 ¦ 7 ¦ 27 ¦ 5 ¦ 1 ¦ 25 ¦ 2 ¦ 6 ¦ 28 ¦ 0 ¦ 5 ¦ 9 ¦ 23 ¦ +----------------------------------------------------------------------------------------------------------------------------------------------------------------+ (suite page suivante) - (continued next page)Interviews : 26/08/02 - 23/09/02 SOFRES s.a. - Coordination EOS GALLUP EUROPE Volume B - Page : 29

FLASH 128 : BUSINESS SURVEY - 2002
7. Dans vos VENTES AU DETAIL EN MAGASINS, pouvez-vous estimer le 7. Of your RETAIL SALES IN SHOPS, can you estimate the percentage of yourpourcentage de vos ventes transfrontalières ? cross-border sales ?(ENQ.: SI NSP/SR, SUGGERER : Etait-ce : ... rien du tout ? autour de 1% ? (INT.: IF DK/NA, YOU MAY SUGGEST THE SCALE BELOW : In order to have an idea.. 2% ? .. 3% ? .. 5% ? .. 10% ? .. 15% ? .. 20% ? .. 25% ? etc ...) of the size, was it : ... nothing at all ? / ... around 1% ? / ... 2% ? ... 3% ? / ... 5% ? / ... 10% ? / ...15% ? ...20% ? / ...25% ? ... etc ...)
*** RESULTS ARE WEIGHTED : N. of enterprises in the E.U. +----------------------------------------------------------------------------------------------------------------------------------------------------------------+ ¦ ¦ TOTAL ¦ SECTORS ¦ SIZE CATEGORIES ¦ EU COUNTRIES ACTIVITY ¦ COMPANY STATUS ¦ INTERVIEWED ¦ ¦ +-------+-------------------------------+-----------------------+-----------------------+-----------------------+---------------¦ ¦ ¦ EU 15 ¦Constru¦Indus ¦Trade ¦Servi ¦SME ¦SME ¦MAJORS ¦None ¦1-5 EU ¦6&+ EU ¦Indepen¦Mother ¦Member ¦General¦Mktg-Sa¦ ¦ ¦ ¦ction ¦try ¦ ¦ces ¦10-49 ¦50-249 ¦250+ ¦ ¦countr.¦countr.¦dant ¦Cy ¦group ¦Manager¦les Man¦ +--------------------------------+-------+-------+-------+-------+-------+-------+-------+-------+-------+-------+-------+-------+-------+-------+-------+-------¦ ¦................................¦ 1.1% ¦ 1.5% ¦ 1.5% ¦ .8% ¦ .8% ¦ 1.1% ¦ 1.3% ¦ 1.3% ¦ 1.1% ¦ .4% ¦ 2.5% ¦ 1.1% ¦ .1% ¦ 2.0% ¦ .6% ¦ 1.9% ¦ +--------------------------------+-------+-------+-------+-------+-------+-------+-------+-------+-------+-------+-------+-------+-------+-------+-------+-------¦ ¦Autour de 40% (=36-45%) ¦ ¦ ¦ ¦ ¦ ¦ ¦ ¦ ¦ ¦ ¦ ¦ ¦ ¦ ¦ ¦ ¦ ¦ Around 40% (=36-45%)...........¦ 29 ¦ 2 ¦ 3 ¦ 16 ¦ 7 ¦ 26 ¦ 2 ¦ 1 ¦ 15 ¦ 12 ¦ 2 ¦ 25 ¦ 3 ¦ 1 ¦ 13 ¦ 16 ¦ ¦................................¦ 1.0% ¦ .6% ¦ .4% ¦ 2.1% ¦ .8% ¦ 1.1% ¦ .5% ¦ 1.2% ¦ .7% ¦ 2.5% ¦ .6% ¦ 1.0% ¦ 3.5% ¦ .5% ¦ .7% ¦ 1.3% ¦ +--------------------------------+-------+-------+-------+-------+-------+-------+-------+-------+-------+-------+-------+-------+-------+-------+-------+-------¦ ¦Autour de 50% (=46-55%) ¦ ¦ ¦ ¦ ¦ ¦ ¦ ¦ ¦ ¦ ¦ ¦ ¦ ¦ ¦ ¦ ¦ ¦ Around 50% (=46-55%)...........¦ 30 ¦ 0 ¦ 15 ¦ 1 ¦ 13 ¦ 25 ¦ 4 ¦ 1 ¦ 18 ¦ 3 ¦ 9 ¦ 26 ¦ 2 ¦ 2 ¦ 16 ¦ 14 ¦ ¦................................¦ 1.0% ¦ .1% ¦ 1.8% ¦ .1% ¦ 1.6% ¦ 1.0% ¦ 1.1% ¦ 1.4% ¦ .8% ¦ .6% ¦ 3.8% ¦ 1.0% ¦ 3.3% ¦ .6% ¦ .9% ¦ 1.1% ¦ +--------------------------------+-------+-------+-------+-------+-------+-------+-------+-------+-------+-------+-------+-------+-------+-------+-------+-------¦ ¦Plus de 55% ¦ ¦ ¦ ¦ ¦ ¦ ¦ ¦ ¦ ¦ ¦ ¦ ¦ ¦ ¦ ¦ ¦ ¦ More than 55%..................¦ 64 ¦ 0 ¦ 27 ¦ 24 ¦ 13 ¦ 47 ¦ 11 ¦ 6 ¦ 39 ¦ 13 ¦ 12 ¦ 50 ¦ 3 ¦ 11 ¦ 31 ¦ 33 ¦ ¦................................¦ 2.2% ¦ .1% ¦ 3.2% ¦ 3.1% ¦ 1.5% ¦ 1.9% ¦ 3.2% ¦ 7.2% ¦ 1.8% ¦ 2.7% ¦ 4.9% ¦ 1.9% ¦ 4.2% ¦ 4.7% ¦ 1.9% ¦ 2.7% ¦ +--------------------------------+-------+-------+-------+-------+-------+-------+-------+-------+-------+-------+-------+-------+-------+-------+-------+-------¦ ¦(nsp/sr) ¦ ¦ ¦ ¦ ¦ ¦ ¦ ¦ ¦ ¦ ¦ ¦ ¦ ¦ ¦ ¦ ¦ ¦ (dk/na)........................¦ 176 ¦ 14 ¦ 49 ¦ 56 ¦ 56 ¦ 138 ¦ 29 ¦ 9 ¦ 127 ¦ 24 ¦ 25 ¦ 135 ¦ 17 ¦ 24 ¦ 94 ¦ 82 ¦ ¦................................¦ 6.1% ¦ 3.5% ¦ 5.7% ¦ 7.3% ¦ 6.5% ¦ 5.6% ¦ 8.3% ¦ 10.6% ¦ 5.8% ¦ 4.9% ¦ 10.3% ¦ 5.2% ¦ 22.1% ¦ 9.8% ¦ 5.6% ¦ 6.7% ¦ +--------------------------------+-------+-------+-------+-------+-------+-------+-------+-------+-------+-------+-------+-------+-------+-------+-------+-------¦ ¦% MOYEN AVERAGE %¦ 4.84% ¦ 1.37% ¦ 6.30% ¦ 6.09% ¦ 3.99% ¦ 4.61% ¦ 5.56% ¦ 9.32% ¦ 4.02% ¦ 6.17% ¦ 9.75% ¦ 4.52% ¦10.64% ¦ 6.85% ¦ 4.28% ¦ 5.62% ¦ ¦(Base : Répondants - Answering).¦ (2670)¦ (308)¦ (832)¦ (734)¦ (796)¦ (1697)¦ (583)¦ (390)¦ (1893)¦ (482)¦ (295)¦ (2229)¦ (112)¦ (329)¦ (1310)¦ (1360)¦ +----------------------------------------------------------------------------------------------------------------------------------------------------------------+
Interviews : 26/08/02 - 23/09/02 SOFRES s.a. - Coordination EOS GALLUP EUROPE Volume B - Page : 30

FLASH 128 : BUSINESS SURVEY - 2002
8. Maintenant, en additionnant toutes ces ventes aux consommateurs, pouvez- 8. Now, in adding up all these consumer sales, can you estimate thevous estimer le pourcentage de vos ventes transfrontalières aux percentage of your sales to final consumers that are cross-border ?consommateurs finaux ? (INT.: IF DK/NA, YOU MAY SUGGEST THE SCALE BELOW : In order to have an idea(ENQ.: SI NSP/SR, SUGGERER : Etait-ce : ... rien du tout ? autour de 1% ? of the size, was it : ... nothing at all ? / ... around 1% ? / ... 2% ?.. 2% ? .. 3% ? .. 5% ? .. 10% ? .. 15% ? .. 20% ? .. 25% ? etc ...) ... 3% ? / ... 5% ? / ... 10% ? / ...15% ? ...20% ? / ...25% ? ... etc ...)
*** RESULTS ARE WEIGHTED : N. of enterprises in the E.U. +----------------------------------------------------------------------------------------------------------------------------------------------------------------+ ¦ ¦ TOTAL ¦ SECTORS ¦ SIZE CATEGORIES ¦ EU COUNTRIES ACTIVITY ¦ COMPANY STATUS ¦ INTERVIEWED ¦ ¦ +-------+-------------------------------+-----------------------+-----------------------+-----------------------+---------------¦ ¦ ¦ EU 15 ¦Constru¦Indus ¦Trade ¦Servi ¦SME ¦SME ¦MAJORS ¦None ¦1-5 EU ¦6&+ EU ¦Indepen¦Mother ¦Member ¦General¦Mktg-Sa¦ ¦ ¦ ¦ction ¦try ¦ ¦ces ¦10-49 ¦50-249 ¦250+ ¦ ¦countr.¦countr.¦dant ¦Cy ¦group ¦Manager¦les Man¦ +--------------------------------+-------+-------+-------+-------+-------+-------+-------+-------+-------+-------+-------+-------+-------+-------+-------+-------¦ ¦UNWEIGHTED BASE : ..............¦ 2899 ¦ 331 ¦ 905 ¦ 802 ¦ 861 ¦ 1815 ¦ 637 ¦ 447 ¦ 2044 ¦ 526 ¦ 329 ¦ 2398 ¦ 133 ¦ 368 ¦ 1417 ¦ 1482 ¦ ¦................................¦100.0% ¦100.0% ¦100.0% ¦100.0% ¦100.0% ¦100.0% ¦100.0% ¦100.0% ¦100.0% ¦100.0% ¦100.0% ¦100.0% ¦100.0% ¦100.0% ¦100.0% ¦100.0% ¦ +--------------------------------+-------+-------+-------+-------+-------+-------+-------+-------+-------+-------+-------+-------+-------+-------+-------+-------¦ ¦0% ¦ ¦ ¦ ¦ ¦ ¦ ¦ ¦ ¦ ¦ ¦ ¦ ¦ ¦ ¦ ¦ ¦ ¦ 0%.............................¦ 895 ¦ 191 ¦ 185 ¦ 238 ¦ 281 ¦ 794 ¦ 78 ¦ 23 ¦ 782 ¦ 72 ¦ 41 ¦ 830 ¦ 7 ¦ 58 ¦ 536 ¦ 358 ¦ ¦................................¦ 30.9% ¦ 46.4% ¦ 21.5% ¦ 31.1% ¦ 32.6% ¦ 32.1% ¦ 22.8% ¦ 27.8% ¦ 35.9% ¦ 15.0% ¦ 17.0% ¦ 32.2% ¦ 9.5% ¦ 23.5% ¦ 32.1% ¦ 29.2% ¦ +--------------------------------+-------+-------+-------+-------+-------+-------+-------+-------+-------+-------+-------+-------+-------+-------+-------+-------¦ ¦Autour de 1% ¦ ¦ ¦ ¦ ¦ ¦ ¦ ¦ ¦ ¦ ¦ ¦ ¦ ¦ ¦ ¦ ¦ ¦ Around 1%......................¦ 242 ¦ 35 ¦ 67 ¦ 86 ¦ 55 ¦ 210 ¦ 29 ¦ 4 ¦ 205 ¦ 25 ¦ 13 ¦ 218 ¦ 10 ¦ 14 ¦ 143 ¦ 99 ¦ ¦................................¦ 8.4% ¦ 8.5% ¦ 7.8% ¦ 11.2% ¦ 6.3% ¦ 8.5% ¦ 8.4% ¦ 4.3% ¦ 9.4% ¦ 5.2% ¦ 5.3% ¦ 8.4% ¦ 13.4% ¦ 5.9% ¦ 8.6% ¦ 8.1% ¦ +--------------------------------+-------+-------+-------+-------+-------+-------+-------+-------+-------+-------+-------+-------+-------+-------+-------+-------¦ ¦Autour de 2% ¦ ¦ ¦ ¦ ¦ ¦ ¦ ¦ ¦ ¦ ¦ ¦ ¦ ¦ ¦ ¦ ¦ ¦ Around 2%......................¦ 121 ¦ 18 ¦ 37 ¦ 43 ¦ 23 ¦ 96 ¦ 22 ¦ 3 ¦ 87 ¦ 28 ¦ 7 ¦ 107 ¦ 3 ¦ 12 ¦ 65 ¦ 56 ¦ ¦................................¦ 4.2% ¦ 4.3% ¦ 4.3% ¦ 5.6% ¦ 2.7% ¦ 3.9% ¦ 6.3% ¦ 3.5% ¦ 4.0% ¦ 5.8% ¦ 2.7% ¦ 4.1% ¦ 3.4% ¦ 4.8% ¦ 3.9% ¦ 4.5% ¦ +--------------------------------+-------+-------+-------+-------+-------+-------+-------+-------+-------+-------+-------+-------+-------+-------+-------+-------¦ ¦Autour de 3% ¦ ¦ ¦ ¦ ¦ ¦ ¦ ¦ ¦ ¦ ¦ ¦ ¦ ¦ ¦ ¦ ¦ ¦ Around 3%......................¦ 87 ¦ 12 ¦ 21 ¦ 33 ¦ 20 ¦ 76 ¦ 10 ¦ 1 ¦ 81 ¦ 6 ¦ 1 ¦ 84 ¦ 0 ¦ 4 ¦ 54 ¦ 33 ¦ ¦................................¦ 3.0% ¦ 3.0% ¦ 2.5% ¦ 4.3% ¦ 2.4% ¦ 3.1% ¦ 2.8% ¦ 1.7% ¦ 3.7% ¦ 1.2% ¦ .4% ¦ 3.2% ¦ .0% ¦ 1.5% ¦ 3.2% ¦ 2.7% ¦ +--------------------------------+-------+-------+-------+-------+-------+-------+-------+-------+-------+-------+-------+-------+-------+-------+-------+-------¦ ¦Autour de 5% (= 4-7%) ¦ ¦ ¦ ¦ ¦ ¦ ¦ ¦ ¦ ¦ ¦ ¦ ¦ ¦ ¦ ¦ ¦ ¦ Around 5% (= 4-7%)...........¦ 260 ¦ 31 ¦ 86 ¦ 77 ¦ 66 ¦ 224 ¦ 31 ¦ 6 ¦ 196 ¦ 50 ¦ 15 ¦ 241 ¦ 5 ¦ 14 ¦ 166 ¦ 94 ¦ ¦................................¦ 9.0% ¦ 7.5% ¦ 10.0% ¦ 10.0% ¦ 7.7% ¦ 9.0% ¦ 9.1% ¦ 7.0% ¦ 9.0% ¦ 10.4% ¦ 6.0% ¦ 9.4% ¦ 6.3% ¦ 5.9% ¦ 9.9% ¦ 7.7% ¦ +--------------------------------+-------+-------+-------+-------+-------+-------+-------+-------+-------+-------+-------+-------+-------+-------+-------+-------¦ ¦Autour de 10% (= 8-12%) ¦ ¦ ¦ ¦ ¦ ¦ ¦ ¦ ¦ ¦ ¦ ¦ ¦ ¦ ¦ ¦ ¦ ¦ Around 10% (= 8-12%)...........¦ 226 ¦ 24 ¦ 67 ¦ 57 ¦ 79 ¦ 193 ¦ 28 ¦ 6 ¦ 158 ¦ 54 ¦ 14 ¦ 193 ¦ 9 ¦ 24 ¦ 138 ¦ 89 ¦ ¦................................¦ 7.8% ¦ 5.9% ¦ 7.7% ¦ 7.4% ¦ 9.2% ¦ 7.8% ¦ 8.0% ¦ 7.4% ¦ 7.3% ¦ 11.3% ¦ 5.8% ¦ 7.5% ¦ 12.0% ¦ 9.9% ¦ 8.2% ¦ 7.2% ¦ +--------------------------------+-------+-------+-------+-------+-------+-------+-------+-------+-------+-------+-------+-------+-------+-------+-------+-------¦ ¦Autour de 15% (=13-17%) ¦ ¦ ¦ ¦ ¦ ¦ ¦ ¦ ¦ ¦ ¦ ¦ ¦ ¦ ¦ ¦ ¦ ¦ Around 15% (=13-17%)...........¦ 87 ¦ 19 ¦ 33 ¦ 22 ¦ 14 ¦ 73 ¦ 10 ¦ 4 ¦ 49 ¦ 31 ¦ 6 ¦ 78 ¦ 6 ¦ 4 ¦ 45 ¦ 42 ¦ ¦................................¦ 3.0% ¦ 4.7% ¦ 3.8% ¦ 2.8% ¦ 1.6% ¦ 2.9% ¦ 3.0% ¦ 5.2% ¦ 2.3% ¦ 6.6% ¦ 2.6% ¦ 3.0% ¦ 7.7% ¦ 1.5% ¦ 2.7% ¦ 3.5% ¦ +--------------------------------+-------+-------+-------+-------+-------+-------+-------+-------+-------+-------+-------+-------+-------+-------+-------+-------¦ ¦Autour de 20% (=18-22%) ¦ ¦ ¦ ¦ ¦ ¦ ¦ ¦ ¦ ¦ ¦ ¦ ¦ ¦ ¦ ¦ ¦ ¦ Around 20% (=18-22%)...........¦ 130 ¦ 10 ¦ 39 ¦ 32 ¦ 49 ¦ 112 ¦ 15 ¦ 3 ¦ 74 ¦ 33 ¦ 23 ¦ 114 ¦ 3 ¦ 13 ¦ 81 ¦ 49 ¦ ¦................................¦ 4.5% ¦ 2.5% ¦ 4.5% ¦ 4.1% ¦ 5.7% ¦ 4.5% ¦ 4.3% ¦ 3.7% ¦ 3.4% ¦ 6.9% ¦ 9.4% ¦ 4.4% ¦ 4.6% ¦ 5.2% ¦ 4.8% ¦ 4.0% ¦ +--------------------------------+-------+-------+-------+-------+-------+-------+-------+-------+-------+-------+-------+-------+-------+-------+-------+-------¦ ¦Autour de 25% (=23-27%) ¦ ¦ ¦ ¦ ¦ ¦ ¦ ¦ ¦ ¦ ¦ ¦ ¦ ¦ ¦ ¦ ¦ ¦ Around 25% (=23-27%)...........¦ 64 ¦ 2 ¦ 32 ¦ 17 ¦ 12 ¦ 52 ¦ 10 ¦ 3 ¦ 39 ¦ 21 ¦ 5 ¦ 61 ¦ 1 ¦ 2 ¦ 38 ¦ 26 ¦ ¦................................¦ 2.2% ¦ .6% ¦ 3.7% ¦ 2.3% ¦ 1.4% ¦ 2.1% ¦ 2.9% ¦ 3.1% ¦ 1.8% ¦ 4.4% ¦ 1.9% ¦ 2.4% ¦ 1.4% ¦ 1.0% ¦ 2.3% ¦ 2.1% ¦ +--------------------------------+-------+-------+-------+-------+-------+-------+-------+-------+-------+-------+-------+-------+-------+-------+-------+-------¦ ¦Autour de 30% (=28-35%) ¦ ¦ ¦ ¦ ¦ ¦ ¦ ¦ ¦ ¦ ¦ ¦ ¦ ¦ ¦ ¦ ¦ ¦ Around 30% (=28-35%)...........¦ 132 ¦ 18 ¦ 55 ¦ 32 ¦ 28 ¦ 103 ¦ 25 ¦ 4 ¦ 82 ¦ 28 ¦ 22 ¦ 117 ¦ 6 ¦ 8 ¦ 76 ¦ 56 ¦ +----------------------------------------------------------------------------------------------------------------------------------------------------------------+ (suite page suivante) - (continued next page)Interviews : 26/08/02 - 23/09/02 SOFRES s.a. - Coordination EOS GALLUP EUROPE Volume B - Page : 31

FLASH 128 : BUSINESS SURVEY - 2002
8. Maintenant, en additionnant toutes ces ventes aux consommateurs, pouvez- 8. Now, in adding up all these consumer sales, can you estimate thevous estimer le pourcentage de vos ventes transfrontalières aux percentage of your sales to final consumers that are cross-border ?consommateurs finaux ? (INT.: IF DK/NA, YOU MAY SUGGEST THE SCALE BELOW : In order to have an idea(ENQ.: SI NSP/SR, SUGGERER : Etait-ce : ... rien du tout ? autour de 1% ? of the size, was it : ... nothing at all ? / ... around 1% ? / ... 2% ?.. 2% ? .. 3% ? .. 5% ? .. 10% ? .. 15% ? .. 20% ? .. 25% ? etc ...) ... 3% ? / ... 5% ? / ... 10% ? / ...15% ? ...20% ? / ...25% ? ... etc ...)
*** RESULTS ARE WEIGHTED : N. of enterprises in the E.U. +----------------------------------------------------------------------------------------------------------------------------------------------------------------+ ¦ ¦ TOTAL ¦ SECTORS ¦ SIZE CATEGORIES ¦ EU COUNTRIES ACTIVITY ¦ COMPANY STATUS ¦ INTERVIEWED ¦ ¦ +-------+-------------------------------+-----------------------+-----------------------+-----------------------+---------------¦ ¦ ¦ EU 15 ¦Constru¦Indus ¦Trade ¦Servi ¦SME ¦SME ¦MAJORS ¦None ¦1-5 EU ¦6&+ EU ¦Indepen¦Mother ¦Member ¦General¦Mktg-Sa¦ ¦ ¦ ¦ction ¦try ¦ ¦ces ¦10-49 ¦50-249 ¦250+ ¦ ¦countr.¦countr.¦dant ¦Cy ¦group ¦Manager¦les Man¦ +--------------------------------+-------+-------+-------+-------+-------+-------+-------+-------+-------+-------+-------+-------+-------+-------+-------+-------¦ ¦................................¦ 4.5% ¦ 4.3% ¦ 6.4% ¦ 4.1% ¦ 3.2% ¦ 4.2% ¦ 7.3% ¦ 4.3% ¦ 3.8% ¦ 5.8% ¦ 8.9% ¦ 4.6% ¦ 7.8% ¦ 3.4% ¦ 4.5% ¦ 4.6% ¦ +--------------------------------+-------+-------+-------+-------+-------+-------+-------+-------+-------+-------+-------+-------+-------+-------+-------+-------¦ ¦Autour de 40% (=36-45%) ¦ ¦ ¦ ¦ ¦ ¦ ¦ ¦ ¦ ¦ ¦ ¦ ¦ ¦ ¦ ¦ ¦ ¦ Around 40% (=36-45%)...........¦ 93 ¦ 6 ¦ 42 ¦ 18 ¦ 27 ¦ 76 ¦ 15 ¦ 2 ¦ 58 ¦ 23 ¦ 12 ¦ 84 ¦ 0 ¦ 9 ¦ 43 ¦ 50 ¦ ¦................................¦ 3.2% ¦ 1.4% ¦ 4.9% ¦ 2.3% ¦ 3.1% ¦ 3.1% ¦ 4.3% ¦ 2.4% ¦ 2.7% ¦ 4.8% ¦ 4.8% ¦ 3.3% ¦ .2% ¦ 3.5% ¦ 2.5% ¦ 4.1% ¦ +--------------------------------+-------+-------+-------+-------+-------+-------+-------+-------+-------+-------+-------+-------+-------+-------+-------+-------¦ ¦Autour de 50% (=46-55%) ¦ ¦ ¦ ¦ ¦ ¦ ¦ ¦ ¦ ¦ ¦ ¦ ¦ ¦ ¦ ¦ ¦ ¦ Around 50% (=46-55%)...........¦ 70 ¦ 2 ¦ 28 ¦ 13 ¦ 28 ¦ 63 ¦ 5 ¦ 2 ¦ 45 ¦ 16 ¦ 9 ¦ 57 ¦ 2 ¦ 11 ¦ 41 ¦ 29 ¦ ¦................................¦ 2.4% ¦ .5% ¦ 3.2% ¦ 1.7% ¦ 3.2% ¦ 2.6% ¦ 1.5% ¦ 1.9% ¦ 2.1% ¦ 3.3% ¦ 3.8% ¦ 2.2% ¦ 3.0% ¦ 4.5% ¦ 2.4% ¦ 2.4% ¦ +--------------------------------+-------+-------+-------+-------+-------+-------+-------+-------+-------+-------+-------+-------+-------+-------+-------+-------¦ ¦Plus de 55% ¦ ¦ ¦ ¦ ¦ ¦ ¦ ¦ ¦ ¦ ¦ ¦ ¦ ¦ ¦ ¦ ¦ ¦ More than 55%..................¦ 167 ¦ 6 ¦ 77 ¦ 18 ¦ 66 ¦ 129 ¦ 28 ¦ 10 ¦ 91 ¦ 39 ¦ 36 ¦ 122 ¦ 7 ¦ 37 ¦ 70 ¦ 97 ¦ ¦................................¦ 5.7% ¦ 1.5% ¦ 8.9% ¦ 2.4% ¦ 7.6% ¦ 5.2% ¦ 8.0% ¦ 11.6% ¦ 4.2% ¦ 8.2% ¦ 14.8% ¦ 4.7% ¦ 9.2% ¦ 15.3% ¦ 4.2% ¦ 7.9% ¦ +--------------------------------+-------+-------+-------+-------+-------+-------+-------+-------+-------+-------+-------+-------+-------+-------+-------+-------¦ ¦(nsp/sr) ¦ ¦ ¦ ¦ ¦ ¦ ¦ ¦ ¦ ¦ ¦ ¦ ¦ ¦ ¦ ¦ ¦ ¦ (dk/na)........................¦ 324 ¦ 38 ¦ 92 ¦ 81 ¦ 114 ¦ 272 ¦ 39 ¦ 13 ¦ 231 ¦ 53 ¦ 41 ¦ 273 ¦ 16 ¦ 35 ¦ 176 ¦ 148 ¦ ¦................................¦ 11.2% ¦ 9.1% ¦ 10.7% ¦ 10.6% ¦ 13.2% ¦ 11.0% ¦ 11.3% ¦ 16.2% ¦ 10.6% ¦ 11.1% ¦ 16.6% ¦ 10.6% ¦ 21.6% ¦ 14.2% ¦ 10.5% ¦ 12.1% ¦ +--------------------------------+-------+-------+-------+-------+-------+-------+-------+-------+-------+-------+-------+-------+-------+-------+-------+-------¦ ¦% MOYEN AVERAGE %¦13.31% ¦ 6.54% ¦18.01% ¦ 9.47% ¦15.38% ¦12.74% ¦16.36% ¦18.03% ¦10.64% ¦19.46% ¦26.00% ¦12.33% ¦19.73% ¦22.26% ¦11.91% ¦15.25% ¦ ¦(Base : Répondants - Answering).¦ (2511)¦ (293)¦ (777)¦ (703)¦ (738)¦ (1603)¦ (549)¦ (359)¦ (1793)¦ (448)¦ (270)¦ (2095)¦ (108)¦ (308)¦ (1239)¦ (1272)¦ +----------------------------------------------------------------------------------------------------------------------------------------------------------------+
Interviews : 26/08/02 - 23/09/02 SOFRES s.a. - Coordination EOS GALLUP EUROPE Volume B - Page : 32

FLASH 128 : BUSINESS SURVEY - 2002
9. Quel pourcentage de votre budget marketing et publicitaire est destiné à 9. What percentage of your total marketing and advertising budget is givenencourager les ventes transfrontalières ? to encouraging cross-border sales ?(ENQ.: SI NSP/SR, SUGGERER : Etait-ce : ... rien du tout ? autour de 1% ? (INT.: IF DK/NA, YOU MAY SUGGEST THE SCALE BELOW : In order to have an idea.. 2% ? .. 3% ? .. 5% ? .. 10% ? .. 15% ? .. 20% ? .. 25% ? etc ...) of the size, was it : ... nothing at all ? / ... around 1% ? / ... 2% ? ... 3% ? / ... 5% ? / ... 10% ? / ...15% ? ...20% ? / ...25% ? ... etc ...)
*** RESULTS ARE WEIGHTED : N. of enterprises in the E.U. +----------------------------------------------------------------------------------------------------------------------------------------------------------------+ ¦ ¦ TOTAL ¦ SECTORS ¦ SIZE CATEGORIES ¦ EU COUNTRIES ACTIVITY ¦ COMPANY STATUS ¦ INTERVIEWED ¦ ¦ +-------+-------------------------------+-----------------------+-----------------------+-----------------------+---------------¦ ¦ ¦ EU 15 ¦Constru¦Indus ¦Trade ¦Servi ¦SME ¦SME ¦MAJORS ¦None ¦1-5 EU ¦6&+ EU ¦Indepen¦Mother ¦Member ¦General¦Mktg-Sa¦ ¦ ¦ ¦ction ¦try ¦ ¦ces ¦10-49 ¦50-249 ¦250+ ¦ ¦countr.¦countr.¦dant ¦Cy ¦group ¦Manager¦les Man¦ +--------------------------------+-------+-------+-------+-------+-------+-------+-------+-------+-------+-------+-------+-------+-------+-------+-------+-------¦ ¦UNWEIGHTED BASE : ..............¦ 2899 ¦ 331 ¦ 905 ¦ 802 ¦ 861 ¦ 1815 ¦ 637 ¦ 447 ¦ 2044 ¦ 526 ¦ 329 ¦ 2398 ¦ 133 ¦ 368 ¦ 1417 ¦ 1482 ¦ ¦................................¦100.0% ¦100.0% ¦100.0% ¦100.0% ¦100.0% ¦100.0% ¦100.0% ¦100.0% ¦100.0% ¦100.0% ¦100.0% ¦100.0% ¦100.0% ¦100.0% ¦100.0% ¦100.0% ¦ +--------------------------------+-------+-------+-------+-------+-------+-------+-------+-------+-------+-------+-------+-------+-------+-------+-------+-------¦ ¦0% ¦ ¦ ¦ ¦ ¦ ¦ ¦ ¦ ¦ ¦ ¦ ¦ ¦ ¦ ¦ ¦ ¦ ¦ 0%.............................¦ 1459 ¦ 264 ¦ 350 ¦ 439 ¦ 407 ¦ 1287 ¦ 145 ¦ 27 ¦ 1258 ¦ 147 ¦ 54 ¦ 1349 ¦ 22 ¦ 89 ¦ 870 ¦ 590 ¦ ¦................................¦ 50.3% ¦ 64.1% ¦ 40.6% ¦ 57.3% ¦ 47.3% ¦ 52.1% ¦ 42.3% ¦ 32.6% ¦ 57.8% ¦ 30.7% ¦ 22.2% ¦ 52.3% ¦ 29.0% ¦ 36.2% ¦ 52.0% ¦ 48.1% ¦ +--------------------------------+-------+-------+-------+-------+-------+-------+-------+-------+-------+-------+-------+-------+-------+-------+-------+-------¦ ¦Autour de 1% ¦ ¦ ¦ ¦ ¦ ¦ ¦ ¦ ¦ ¦ ¦ ¦ ¦ ¦ ¦ ¦ ¦ ¦ Around 1%......................¦ 222 ¦ 28 ¦ 85 ¦ 68 ¦ 42 ¦ 187 ¦ 28 ¦ 7 ¦ 146 ¦ 51 ¦ 25 ¦ 196 ¦ 10 ¦ 17 ¦ 128 ¦ 94 ¦ ¦................................¦ 7.7% ¦ 6.7% ¦ 9.8% ¦ 8.8% ¦ 4.9% ¦ 7.6% ¦ 8.2% ¦ 8.9% ¦ 6.7% ¦ 10.7% ¦ 10.1% ¦ 7.6% ¦ 12.8% ¦ 6.9% ¦ 7.7% ¦ 7.7% ¦ +--------------------------------+-------+-------+-------+-------+-------+-------+-------+-------+-------+-------+-------+-------+-------+-------+-------+-------¦ ¦Autour de 2% ¦ ¦ ¦ ¦ ¦ ¦ ¦ ¦ ¦ ¦ ¦ ¦ ¦ ¦ ¦ ¦ ¦ ¦ Around 2%......................¦ 110 ¦ 8 ¦ 44 ¦ 23 ¦ 34 ¦ 88 ¦ 17 ¦ 4 ¦ 63 ¦ 39 ¦ 8 ¦ 98 ¦ 5 ¦ 7 ¦ 61 ¦ 49 ¦ ¦................................¦ 3.8% ¦ 2.0% ¦ 5.2% ¦ 3.1% ¦ 3.9% ¦ 3.6% ¦ 5.1% ¦ 4.8% ¦ 2.9% ¦ 8.1% ¦ 3.2% ¦ 3.8% ¦ 6.0% ¦ 2.9% ¦ 3.6% ¦ 4.0% ¦ +--------------------------------+-------+-------+-------+-------+-------+-------+-------+-------+-------+-------+-------+-------+-------+-------+-------+-------¦ ¦Autour de 3% ¦ ¦ ¦ ¦ ¦ ¦ ¦ ¦ ¦ ¦ ¦ ¦ ¦ ¦ ¦ ¦ ¦ ¦ Around 3%......................¦ 85 ¦ 4 ¦ 46 ¦ 18 ¦ 18 ¦ 70 ¦ 15 ¦ 1 ¦ 50 ¦ 20 ¦ 16 ¦ 76 ¦ 0 ¦ 10 ¦ 56 ¦ 29 ¦ ¦................................¦ 2.9% ¦ 1.0% ¦ 5.3% ¦ 2.3% ¦ 2.1% ¦ 2.8% ¦ 4.2% ¦ 1.6% ¦ 2.3% ¦ 4.1% ¦ 6.6% ¦ 2.9% ¦ .0% ¦ 4.0% ¦ 3.4% ¦ 2.4% ¦ +--------------------------------+-------+-------+-------+-------+-------+-------+-------+-------+-------+-------+-------+-------+-------+-------+-------+-------¦ ¦Autour de 5% (= 4-7%) ¦ ¦ ¦ ¦ ¦ ¦ ¦ ¦ ¦ ¦ ¦ ¦ ¦ ¦ ¦ ¦ ¦ ¦ Around 5% (= 4-7%)...........¦ 253 ¦ 27 ¦ 92 ¦ 59 ¦ 75 ¦ 222 ¦ 22 ¦ 9 ¦ 170 ¦ 54 ¦ 29 ¦ 222 ¦ 6 ¦ 24 ¦ 154 ¦ 99 ¦ ¦................................¦ 8.7% ¦ 6.7% ¦ 10.7% ¦ 7.6% ¦ 8.7% ¦ 9.0% ¦ 6.4% ¦ 10.7% ¦ 7.8% ¦ 11.3% ¦ 12.0% ¦ 8.6% ¦ 8.5% ¦ 9.9% ¦ 9.2% ¦ 8.1% ¦ +--------------------------------+-------+-------+-------+-------+-------+-------+-------+-------+-------+-------+-------+-------+-------+-------+-------+-------¦ ¦Autour de 10% (= 8-12%) ¦ ¦ ¦ ¦ ¦ ¦ ¦ ¦ ¦ ¦ ¦ ¦ ¦ ¦ ¦ ¦ ¦ ¦ Around 10% (= 8-12%)...........¦ 162 ¦ 13 ¦ 59 ¦ 38 ¦ 52 ¦ 129 ¦ 25 ¦ 8 ¦ 120 ¦ 20 ¦ 22 ¦ 151 ¦ 5 ¦ 6 ¦ 99 ¦ 63 ¦ ¦................................¦ 5.6% ¦ 3.1% ¦ 6.8% ¦ 5.0% ¦ 6.0% ¦ 5.2% ¦ 7.3% ¦ 9.3% ¦ 5.5% ¦ 4.2% ¦ 8.9% ¦ 5.9% ¦ 6.2% ¦ 2.6% ¦ 5.9% ¦ 5.1% ¦ +--------------------------------+-------+-------+-------+-------+-------+-------+-------+-------+-------+-------+-------+-------+-------+-------+-------+-------¦ ¦Autour de 15% (=13-17%) ¦ ¦ ¦ ¦ ¦ ¦ ¦ ¦ ¦ ¦ ¦ ¦ ¦ ¦ ¦ ¦ ¦ ¦ Around 15% (=13-17%)...........¦ 45 ¦ 5 ¦ 16 ¦ 5 ¦ 19 ¦ 37 ¦ 5 ¦ 3 ¦ 24 ¦ 18 ¦ 3 ¦ 39 ¦ 1 ¦ 5 ¦ 18 ¦ 26 ¦ ¦................................¦ 1.5% ¦ 1.3% ¦ 1.8% ¦ .7% ¦ 2.2% ¦ 1.5% ¦ 1.4% ¦ 3.5% ¦ 1.1% ¦ 3.7% ¦ 1.2% ¦ 1.5% ¦ .8% ¦ 1.9% ¦ 1.1% ¦ 2.1% ¦ +--------------------------------+-------+-------+-------+-------+-------+-------+-------+-------+-------+-------+-------+-------+-------+-------+-------+-------¦ ¦Autour de 20% (=18-22%) ¦ ¦ ¦ ¦ ¦ ¦ ¦ ¦ ¦ ¦ ¦ ¦ ¦ ¦ ¦ ¦ ¦ ¦ Around 20% (=18-22%)...........¦ 74 ¦ 1 ¦ 19 ¦ 21 ¦ 33 ¦ 57 ¦ 15 ¦ 2 ¦ 41 ¦ 30 ¦ 3 ¦ 59 ¦ 3 ¦ 12 ¦ 40 ¦ 34 ¦ ¦................................¦ 2.6% ¦ .2% ¦ 2.2% ¦ 2.8% ¦ 3.9% ¦ 2.3% ¦ 4.2% ¦ 3.0% ¦ 1.9% ¦ 6.3% ¦ 1.2% ¦ 2.3% ¦ 3.8% ¦ 5.1% ¦ 2.4% ¦ 2.8% ¦ +--------------------------------+-------+-------+-------+-------+-------+-------+-------+-------+-------+-------+-------+-------+-------+-------+-------+-------¦ ¦Autour de 25% (=23-27%) ¦ ¦ ¦ ¦ ¦ ¦ ¦ ¦ ¦ ¦ ¦ ¦ ¦ ¦ ¦ ¦ ¦ ¦ Around 25% (=23-27%)...........¦ 42 ¦ 11 ¦ 9 ¦ 9 ¦ 13 ¦ 32 ¦ 9 ¦ 1 ¦ 31 ¦ 6 ¦ 5 ¦ 33 ¦ 1 ¦ 8 ¦ 30 ¦ 12 ¦ ¦................................¦ 1.4% ¦ 2.6% ¦ 1.0% ¦ 1.2% ¦ 1.5% ¦ 1.3% ¦ 2.8% ¦ .6% ¦ 1.4% ¦ 1.2% ¦ 1.9% ¦ 1.3% ¦ .8% ¦ 3.1% ¦ 1.8% ¦ .9% ¦ +--------------------------------+-------+-------+-------+-------+-------+-------+-------+-------+-------+-------+-------+-------+-------+-------+-------+-------¦ ¦Autour de 30% (=28-35%) ¦ ¦ ¦ ¦ ¦ ¦ ¦ ¦ ¦ ¦ ¦ ¦ ¦ ¦ ¦ ¦ ¦ ¦ Around 30% (=28-35%)...........¦ 64 ¦ 6 ¦ 28 ¦ 7 ¦ 22 ¦ 51 ¦ 10 ¦ 3 ¦ 43 ¦ 14 ¦ 6 ¦ 46 ¦ 5 ¦ 13 ¦ 35 ¦ 29 ¦ +----------------------------------------------------------------------------------------------------------------------------------------------------------------+ (suite page suivante) - (continued next page)Interviews : 26/08/02 - 23/09/02 SOFRES s.a. - Coordination EOS GALLUP EUROPE Volume B - Page : 33

FLASH 128 : BUSINESS SURVEY - 2002
9. Quel pourcentage de votre budget marketing et publicitaire est destiné à 9. What percentage of your total marketing and advertising budget is givenencourager les ventes transfrontalières ? to encouraging cross-border sales ?(ENQ.: SI NSP/SR, SUGGERER : Etait-ce : ... rien du tout ? autour de 1% ? (INT.: IF DK/NA, YOU MAY SUGGEST THE SCALE BELOW : In order to have an idea.. 2% ? .. 3% ? .. 5% ? .. 10% ? .. 15% ? .. 20% ? .. 25% ? etc ...) of the size, was it : ... nothing at all ? / ... around 1% ? / ... 2% ? ... 3% ? / ... 5% ? / ... 10% ? / ...15% ? ...20% ? / ...25% ? ... etc ...)
*** RESULTS ARE WEIGHTED : N. of enterprises in the E.U. +----------------------------------------------------------------------------------------------------------------------------------------------------------------+ ¦ ¦ TOTAL ¦ SECTORS ¦ SIZE CATEGORIES ¦ EU COUNTRIES ACTIVITY ¦ COMPANY STATUS ¦ INTERVIEWED ¦ ¦ +-------+-------------------------------+-----------------------+-----------------------+-----------------------+---------------¦ ¦ ¦ EU 15 ¦Constru¦Indus ¦Trade ¦Servi ¦SME ¦SME ¦MAJORS ¦None ¦1-5 EU ¦6&+ EU ¦Indepen¦Mother ¦Member ¦General¦Mktg-Sa¦ ¦ ¦ ¦ction ¦try ¦ ¦ces ¦10-49 ¦50-249 ¦250+ ¦ ¦countr.¦countr.¦dant ¦Cy ¦group ¦Manager¦les Man¦ +--------------------------------+-------+-------+-------+-------+-------+-------+-------+-------+-------+-------+-------+-------+-------+-------+-------+-------¦ ¦................................¦ 2.2% ¦ 1.5% ¦ 3.3% ¦ .9% ¦ 2.6% ¦ 2.1% ¦ 3.0% ¦ 3.1% ¦ 2.0% ¦ 3.0% ¦ 2.6% ¦ 1.8% ¦ 6.5% ¦ 5.4% ¦ 2.1% ¦ 2.3% ¦ +--------------------------------+-------+-------+-------+-------+-------+-------+-------+-------+-------+-------+-------+-------+-------+-------+-------+-------¦ ¦Autour de 40% (=36-45%) ¦ ¦ ¦ ¦ ¦ ¦ ¦ ¦ ¦ ¦ ¦ ¦ ¦ ¦ ¦ ¦ ¦ ¦ Around 40% (=36-45%)...........¦ 21 ¦ 0 ¦ 10 ¦ 2 ¦ 8 ¦ 16 ¦ 3 ¦ 2 ¦ 9 ¦ 3 ¦ 8 ¦ 16 ¦ 3 ¦ 2 ¦ 4 ¦ 16 ¦ ¦................................¦ .7% ¦ .1% ¦ 1.2% ¦ .3% ¦ .9% ¦ .6% ¦ .9% ¦ 2.4% ¦ .4% ¦ .7% ¦ 3.4% ¦ .6% ¦ 4.4% ¦ .8% ¦ .3% ¦ 1.3% ¦ +--------------------------------+-------+-------+-------+-------+-------+-------+-------+-------+-------+-------+-------+-------+-------+-------+-------+-------¦ ¦Autour de 50% (=46-55%) ¦ ¦ ¦ ¦ ¦ ¦ ¦ ¦ ¦ ¦ ¦ ¦ ¦ ¦ ¦ ¦ ¦ ¦ Around 50% (=46-55%)...........¦ 41 ¦ 5 ¦ 17 ¦ 5 ¦ 14 ¦ 33 ¦ 6 ¦ 2 ¦ 21 ¦ 11 ¦ 9 ¦ 33 ¦ 3 ¦ 5 ¦ 17 ¦ 25 ¦ ¦................................¦ 1.4% ¦ 1.2% ¦ 2.0% ¦ .6% ¦ 1.7% ¦ 1.3% ¦ 1.7% ¦ 2.6% ¦ 1.0% ¦ 2.2% ¦ 3.9% ¦ 1.3% ¦ 3.9% ¦ 2.1% ¦ 1.0% ¦ 2.0% ¦ +--------------------------------+-------+-------+-------+-------+-------+-------+-------+-------+-------+-------+-------+-------+-------+-------+-------+-------¦ ¦Plus de 55% ¦ ¦ ¦ ¦ ¦ ¦ ¦ ¦ ¦ ¦ ¦ ¦ ¦ ¦ ¦ ¦ ¦ ¦ More than 55%..................¦ 76 ¦ 3 ¦ 29 ¦ 5 ¦ 41 ¦ 60 ¦ 11 ¦ 5 ¦ 38 ¦ 22 ¦ 17 ¦ 55 ¦ 3 ¦ 18 ¦ 31 ¦ 45 ¦ ¦................................¦ 2.6% ¦ .6% ¦ 3.3% ¦ .6% ¦ 4.7% ¦ 2.4% ¦ 3.2% ¦ 6.2% ¦ 1.7% ¦ 4.5% ¦ 7.0% ¦ 2.1% ¦ 4.3% ¦ 7.5% ¦ 1.9% ¦ 3.7% ¦ +--------------------------------+-------+-------+-------+-------+-------+-------+-------+-------+-------+-------+-------+-------+-------+-------+-------+-------¦ ¦(nsp/sr) ¦ ¦ ¦ ¦ ¦ ¦ ¦ ¦ ¦ ¦ ¦ ¦ ¦ ¦ ¦ ¦ ¦ ¦ (dk/na)........................¦ 245 ¦ 37 ¦ 58 ¦ 68 ¦ 82 ¦ 203 ¦ 32 ¦ 9 ¦ 162 ¦ 44 ¦ 38 ¦ 206 ¦ 10 ¦ 28 ¦ 129 ¦ 115 ¦ ¦................................¦ 8.4% ¦ 8.9% ¦ 6.8% ¦ 8.8% ¦ 9.5% ¦ 8.2% ¦ 9.3% ¦ 10.9% ¦ 7.4% ¦ 9.3% ¦ 15.6% ¦ 8.0% ¦ 13.2% ¦ 11.6% ¦ 7.7% ¦ 9.4% ¦ +--------------------------------+-------+-------+-------+-------+-------+-------+-------+-------+-------+-------+-------+-------+-------+-------+-------+-------¦ ¦% MOYEN AVERAGE %¦ 6.66% ¦ 3.64% ¦ 8.39% ¦ 3.49% ¦ 9.19% ¦ 6.20% ¦ 8.76% ¦12.19% ¦ 5.10% ¦10.50% ¦13.90% ¦ 5.87% ¦12.98% ¦13.45% ¦ 5.52% ¦ 8.25% ¦ ¦(Base : Répondants - Answering).¦ (2637)¦ (298)¦ (820)¦ (730)¦ (789)¦ (1678)¦ (574)¦ (385)¦ (1899)¦ (465)¦ (273)¦ (2205)¦ (110)¦ (322)¦ (1314)¦ (1323)¦ +----------------------------------------------------------------------------------------------------------------------------------------------------------------+
Interviews : 26/08/02 - 23/09/02 SOFRES s.a. - Coordination EOS GALLUP EUROPE Volume B - Page : 34

FLASH 128 : BUSINESS SURVEY - 2002
10. Imaginons maintenant que toutes les réglementations sur la publicité, 10. Imagine now that all regulations on advertising, commercial practicesles pratiques commerciales et les autres réglementations sur la protection and other regulations on consumer protection are completely harmonised indes consommateurs soient complètement harmonisées dans les 15 pays de l'UE. the 15 countries of the European Union.Si c'était le cas, d'après vous, la part de votre budget marketing et If this were the case, in you opinion, the proportion of your marketing andpublicité destiné à encourager les ventes transfrontalières : - advertising budget given to encouraging cross-border sales : - WouldAugmenterait beaucoup - Augmenterait un peu - Ne changerait pas - increase a lot - Would increase a little - Would not change at all - WouldDiminuerait un peu - Diminuerait beaucoup ... ? decrease a little - Would decrease a lot ... ?
*** RESULTS ARE WEIGHTED : N. of enterprises in the E.U. +----------------------------------------------------------------------------------------------------------------------------------------------------------------+ ¦ ¦ TOTAL ¦ SECTORS ¦ SIZE CATEGORIES ¦ EU COUNTRIES ACTIVITY ¦ COMPANY STATUS ¦ INTERVIEWED ¦ ¦ +-------+-------------------------------+-----------------------+-----------------------+-----------------------+---------------¦ ¦ ¦ EU 15 ¦Constru¦Indus ¦Trade ¦Servi ¦SME ¦SME ¦MAJORS ¦None ¦1-5 EU ¦6&+ EU ¦Indepen¦Mother ¦Member ¦General¦Mktg-Sa¦ ¦ ¦ ¦ction ¦try ¦ ¦ces ¦10-49 ¦50-249 ¦250+ ¦ ¦countr.¦countr.¦dant ¦Cy ¦group ¦Manager¦les Man¦ +--------------------------------+-------+-------+-------+-------+-------+-------+-------+-------+-------+-------+-------+-------+-------+-------+-------+-------¦ ¦UNWEIGHTED BASE : ..............¦ 2899 ¦ 331 ¦ 905 ¦ 802 ¦ 861 ¦ 1815 ¦ 637 ¦ 447 ¦ 2044 ¦ 526 ¦ 329 ¦ 2398 ¦ 133 ¦ 368 ¦ 1417 ¦ 1482 ¦ ¦................................¦100.0% ¦100.0% ¦100.0% ¦100.0% ¦100.0% ¦100.0% ¦100.0% ¦100.0% ¦100.0% ¦100.0% ¦100.0% ¦100.0% ¦100.0% ¦100.0% ¦100.0% ¦100.0% ¦ +--------------------------------+-------+-------+-------+-------+-------+-------+-------+-------+-------+-------+-------+-------+-------+-------+-------+-------¦ ¦Augmenterait beaucoup ¦ ¦ ¦ ¦ ¦ ¦ ¦ ¦ ¦ ¦ ¦ ¦ ¦ ¦ ¦ ¦ ¦ ¦ Would increase a lot...........¦ 223 ¦ 15 ¦ 85 ¦ 63 ¦ 60 ¦ 189 ¦ 28 ¦ 7 ¦ 129 ¦ 62 ¦ 33 ¦ 192 ¦ 11 ¦ 21 ¦ 135 ¦ 89 ¦ ¦................................¦ 7.7% ¦ 3.6% ¦ 9.9% ¦ 8.3% ¦ 7.0% ¦ 7.6% ¦ 8.1% ¦ 8.0% ¦ 5.9% ¦ 12.9% ¦ 13.5% ¦ 7.4% ¦ 14.1% ¦ 8.5% ¦ 8.1% ¦ 7.2% ¦ +--------------------------------+-------+-------+-------+-------+-------+-------+-------+-------+-------+-------+-------+-------+-------+-------+-------+-------¦ ¦Augmenterait un peu ¦ ¦ ¦ ¦ ¦ ¦ ¦ ¦ ¦ ¦ ¦ ¦ ¦ ¦ ¦ ¦ ¦ ¦ Would increase a little........¦ 886 ¦ 124 ¦ 285 ¦ 244 ¦ 233 ¦ 744 ¦ 119 ¦ 23 ¦ 654 ¦ 145 ¦ 87 ¦ 778 ¦ 28 ¦ 80 ¦ 553 ¦ 333 ¦ ¦................................¦ 30.6% ¦ 30.2% ¦ 33.1% ¦ 31.8% ¦ 27.1% ¦ 30.1% ¦ 34.6% ¦ 28.3% ¦ 30.0% ¦ 30.3% ¦ 35.6% ¦ 30.2% ¦ 37.1% ¦ 32.4% ¦ 33.0% ¦ 27.2% ¦ +--------------------------------+-------+-------+-------+-------+-------+-------+-------+-------+-------+-------+-------+-------+-------+-------+-------+-------¦ ¦Ne changerait pas ¦ ¦ ¦ ¦ ¦ ¦ ¦ ¦ ¦ ¦ ¦ ¦ ¦ ¦ ¦ ¦ ¦ ¦ Would not change at all........¦ 1594 ¦ 244 ¦ 439 ¦ 404 ¦ 508 ¦ 1374 ¦ 175 ¦ 46 ¦ 1256 ¦ 229 ¦ 109 ¦ 1429 ¦ 34 ¦ 131 ¦ 875 ¦ 719 ¦ ¦................................¦ 55.0% ¦ 59.3% ¦ 51.0% ¦ 52.7% ¦ 59.0% ¦ 55.5% ¦ 50.8% ¦ 55.9% ¦ 57.7% ¦ 47.8% ¦ 44.7% ¦ 55.4% ¦ 45.5% ¦ 53.5% ¦ 52.3% ¦ 58.6% ¦ +--------------------------------+-------+-------+-------+-------+-------+-------+-------+-------+-------+-------+-------+-------+-------+-------+-------+-------¦ ¦Diminuerait un peu ¦ ¦ ¦ ¦ ¦ ¦ ¦ ¦ ¦ ¦ ¦ ¦ ¦ ¦ ¦ ¦ ¦ ¦ Would decrease a little........¦ 49 ¦ 8 ¦ 19 ¦ 9 ¦ 14 ¦ 37 ¦ 8 ¦ 4 ¦ 27 ¦ 17 ¦ 6 ¦ 41 ¦ 2 ¦ 6 ¦ 25 ¦ 24 ¦ ¦................................¦ 1.7% ¦ 2.0% ¦ 2.2% ¦ 1.1% ¦ 1.6% ¦ 1.5% ¦ 2.3% ¦ 5.5% ¦ 1.2% ¦ 3.6% ¦ 2.3% ¦ 1.6% ¦ 2.2% ¦ 2.5% ¦ 1.5% ¦ 2.0% ¦ +--------------------------------+-------+-------+-------+-------+-------+-------+-------+-------+-------+-------+-------+-------+-------+-------+-------+-------¦ ¦Diminuerait beaucoup ¦ ¦ ¦ ¦ ¦ ¦ ¦ ¦ ¦ ¦ ¦ ¦ ¦ ¦ ¦ ¦ ¦ ¦ Would decrease a lot...........¦ 21 ¦ 5 ¦ 4 ¦ 11 ¦ 2 ¦ 21 ¦ 0 ¦ 0 ¦ 16 ¦ 5 ¦ 0 ¦ 21 ¦ 0 ¦ 0 ¦ 19 ¦ 2 ¦ ¦................................¦ .7% ¦ 1.1% ¦ .5% ¦ 1.4% ¦ .2% ¦ .8% ¦ .0% ¦ .1% ¦ .7% ¦ 1.0% ¦ .0% ¦ .8% ¦ .0% ¦ .0% ¦ 1.1% ¦ .2% ¦ +--------------------------------+-------+-------+-------+-------+-------+-------+-------+-------+-------+-------+-------+-------+-------+-------+-------+-------¦ ¦(nsp/sr) ¦ ¦ ¦ ¦ ¦ ¦ ¦ ¦ ¦ ¦ ¦ ¦ ¦ ¦ ¦ ¦ ¦ ¦ (dk/na)........................¦ 125 ¦ 15 ¦ 29 ¦ 37 ¦ 44 ¦ 109 ¦ 14 ¦ 2 ¦ 94 ¦ 21 ¦ 10 ¦ 117 ¦ 1 ¦ 7 ¦ 67 ¦ 59 ¦ ¦................................¦ 4.3% ¦ 3.8% ¦ 3.3% ¦ 4.8% ¦ 5.2% ¦ 4.4% ¦ 4.2% ¦ 2.2% ¦ 4.3% ¦ 4.4% ¦ 4.0% ¦ 4.5% ¦ 1.2% ¦ 3.0% ¦ 4.0% ¦ 4.8% ¦ +--------------------------------+-------+-------+-------+-------+-------+-------+-------+-------+-------+-------+-------+-------+-------+-------+-------+-------¦ ¦INDEX +100 <==> -100............¦ 22 ¦ 17 ¦ 26 ¦ 23 ¦ 21 ¦ 22 ¦ 25 ¦ 20 ¦ 20 ¦ 26 ¦ 31 ¦ 22 ¦ 32 ¦ 24 ¦ 24 ¦ 21 ¦ ¦(Base : Répondants - Answering).¦ (2744)¦ (305)¦ (866)¦ (757)¦ (816)¦ (1702)¦ (611)¦ (431)¦ (1921)¦ (507)¦ (316)¦ (2265)¦ (129)¦ (350)¦ (1337)¦ (1407)¦ +--------------------------------+-------+-------+-------+-------+-------+-------+-------+-------+-------+-------+-------+-------+-------+-------+-------+-------¦ ¦(++/+) AUGMENTERAIT ¦ ¦ ¦ ¦ ¦ ¦ ¦ ¦ ¦ ¦ ¦ ¦ ¦ ¦ ¦ ¦ ¦ ¦ WOULD INCREASE.................¦ 38.3% ¦ 33.8% ¦ 43.0% ¦ 40.0% ¦ 34.1% ¦ 37.7% ¦ 42.7% ¦ 36.3% ¦ 36.0% ¦ 43.2% ¦ 49.1% ¦ 37.6% ¦ 51.2% ¦ 40.9% ¦ 41.1% ¦ 34.4% ¦ +--------------------------------+-------+-------+-------+-------+-------+-------+-------+-------+-------+-------+-------+-------+-------+-------+-------+-------¦ ¦(--/-) DIMINUERAIT ¦ ¦ ¦ ¦ ¦ ¦ ¦ ¦ ¦ ¦ ¦ ¦ ¦ ¦ ¦ ¦ ¦ ¦ WOULD DECREASE.................¦ 2.4% ¦ 3.1% ¦ 2.6% ¦ 2.5% ¦ 1.8% ¦ 2.3% ¦ 2.3% ¦ 5.6% ¦ 2.0% ¦ 4.6% ¦ 2.3% ¦ 2.4% ¦ 2.2% ¦ 2.5% ¦ 2.6% ¦ 2.2% ¦ +----------------------------------------------------------------------------------------------------------------------------------------------------------------+
Interviews : 26/08/02 - 23/09/02 SOFRES s.a. - Coordination EOS GALLUP EUROPE Volume B - Page : 35

FLASH 128 : BUSINESS SURVEY - 2002
11. Et toujours si les réglementations sur la protection des consommateurs 11. And if the regulations on consumer protection were completelyétaient complètement harmonisées dans les 15 pays de l'UE, la part de vos harmonised in the 15 countries of the EU, the proportion of your cross-ventes transfrontalières : - Augmenterait beaucoup - Augmenterait un peu - border sales : - Would increase a lot - Would increase a little - WouldNe changerait pas - Diminuerait un peu - Diminuerait beaucoup ... ? not change at all - Would decrease a little - Would decrease a lot ... ?
*** RESULTS ARE WEIGHTED : N. of enterprises in the E.U. +----------------------------------------------------------------------------------------------------------------------------------------------------------------+ ¦ ¦ TOTAL ¦ SECTORS ¦ SIZE CATEGORIES ¦ EU COUNTRIES ACTIVITY ¦ COMPANY STATUS ¦ INTERVIEWED ¦ ¦ +-------+-------------------------------+-----------------------+-----------------------+-----------------------+---------------¦ ¦ ¦ EU 15 ¦Constru¦Indus ¦Trade ¦Servi ¦SME ¦SME ¦MAJORS ¦None ¦1-5 EU ¦6&+ EU ¦Indepen¦Mother ¦Member ¦General¦Mktg-Sa¦ ¦ ¦ ¦ction ¦try ¦ ¦ces ¦10-49 ¦50-249 ¦250+ ¦ ¦countr.¦countr.¦dant ¦Cy ¦group ¦Manager¦les Man¦ +--------------------------------+-------+-------+-------+-------+-------+-------+-------+-------+-------+-------+-------+-------+-------+-------+-------+-------¦ ¦UNWEIGHTED BASE : ..............¦ 2899 ¦ 331 ¦ 905 ¦ 802 ¦ 861 ¦ 1815 ¦ 637 ¦ 447 ¦ 2044 ¦ 526 ¦ 329 ¦ 2398 ¦ 133 ¦ 368 ¦ 1417 ¦ 1482 ¦ ¦................................¦100.0% ¦100.0% ¦100.0% ¦100.0% ¦100.0% ¦100.0% ¦100.0% ¦100.0% ¦100.0% ¦100.0% ¦100.0% ¦100.0% ¦100.0% ¦100.0% ¦100.0% ¦100.0% ¦ +--------------------------------+-------+-------+-------+-------+-------+-------+-------+-------+-------+-------+-------+-------+-------+-------+-------+-------¦ ¦Augmenterait beaucoup ¦ ¦ ¦ ¦ ¦ ¦ ¦ ¦ ¦ ¦ ¦ ¦ ¦ ¦ ¦ ¦ ¦ ¦ Would increase a lot...........¦ 255 ¦ 29 ¦ 107 ¦ 54 ¦ 65 ¦ 221 ¦ 28 ¦ 7 ¦ 156 ¦ 64 ¦ 36 ¦ 223 ¦ 11 ¦ 22 ¦ 169 ¦ 87 ¦ ¦................................¦ 8.8% ¦ 7.2% ¦ 12.4% ¦ 7.1% ¦ 7.5% ¦ 8.9% ¦ 8.1% ¦ 8.5% ¦ 7.2% ¦ 13.3% ¦ 14.8% ¦ 8.6% ¦ 13.9% ¦ 9.0% ¦ 10.1% ¦ 7.1% ¦ +--------------------------------+-------+-------+-------+-------+-------+-------+-------+-------+-------+-------+-------+-------+-------+-------+-------+-------¦ ¦Augmenterait un peu ¦ ¦ ¦ ¦ ¦ ¦ ¦ ¦ ¦ ¦ ¦ ¦ ¦ ¦ ¦ ¦ ¦ ¦ Would increase a little........¦ 1063 ¦ 155 ¦ 331 ¦ 285 ¦ 292 ¦ 894 ¦ 137 ¦ 32 ¦ 782 ¦ 188 ¦ 92 ¦ 941 ¦ 27 ¦ 94 ¦ 644 ¦ 419 ¦ ¦................................¦ 36.7% ¦ 37.7% ¦ 38.5% ¦ 37.1% ¦ 33.9% ¦ 36.1% ¦ 39.9% ¦ 38.7% ¦ 35.9% ¦ 39.3% ¦ 37.8% ¦ 36.5% ¦ 36.1% ¦ 38.6% ¦ 38.5% ¦ 34.2% ¦ +--------------------------------+-------+-------+-------+-------+-------+-------+-------+-------+-------+-------+-------+-------+-------+-------+-------+-------¦ ¦Ne changerait pas ¦ ¦ ¦ ¦ ¦ ¦ ¦ ¦ ¦ ¦ ¦ ¦ ¦ ¦ ¦ ¦ ¦ ¦ Would not change at all........¦ 1431 ¦ 210 ¦ 387 ¦ 381 ¦ 453 ¦ 1226 ¦ 165 ¦ 40 ¦ 1125 ¦ 201 ¦ 105 ¦ 1276 ¦ 32 ¦ 123 ¦ 780 ¦ 651 ¦ ¦................................¦ 49.4% ¦ 51.0% ¦ 45.0% ¦ 49.7% ¦ 52.6% ¦ 49.6% ¦ 47.9% ¦ 49.3% ¦ 51.7% ¦ 41.9% ¦ 43.1% ¦ 49.5% ¦ 42.6% ¦ 50.0% ¦ 46.6% ¦ 53.1% ¦ +--------------------------------+-------+-------+-------+-------+-------+-------+-------+-------+-------+-------+-------+-------+-------+-------+-------+-------¦ ¦Diminuerait un peu ¦ ¦ ¦ ¦ ¦ ¦ ¦ ¦ ¦ ¦ ¦ ¦ ¦ ¦ ¦ ¦ ¦ ¦ Would decrease a little........¦ 15 ¦ 1 ¦ 4 ¦ 9 ¦ 0 ¦ 14 ¦ 0 ¦ 0 ¦ 9 ¦ 4 ¦ 2 ¦ 15 ¦ 0 ¦ 0 ¦ 8 ¦ 7 ¦ ¦................................¦ .5% ¦ .2% ¦ .5% ¦ 1.2% ¦ .1% ¦ .6% ¦ .1% ¦ .4% ¦ .4% ¦ .8% ¦ .6% ¦ .6% ¦ .0% ¦ .0% ¦ .5% ¦ .6% ¦ +--------------------------------+-------+-------+-------+-------+-------+-------+-------+-------+-------+-------+-------+-------+-------+-------+-------+-------¦ ¦Diminuerait beaucoup ¦ ¦ ¦ ¦ ¦ ¦ ¦ ¦ ¦ ¦ ¦ ¦ ¦ ¦ ¦ ¦ ¦ ¦ Would decrease a lot...........¦ 3 ¦ 0 ¦ 2 ¦ 2 ¦ 0 ¦ 3 ¦ 0 ¦ 0 ¦ 2 ¦ 0 ¦ 1 ¦ 3 ¦ 0 ¦ 0 ¦ 1 ¦ 2 ¦ ¦................................¦ .1% ¦ .0% ¦ .2% ¦ .2% ¦ .0% ¦ .1% ¦ .0% ¦ .0% ¦ .1% ¦ .0% ¦ .5% ¦ .1% ¦ .2% ¦ .0% ¦ .1% ¦ .2% ¦ +--------------------------------+-------+-------+-------+-------+-------+-------+-------+-------+-------+-------+-------+-------+-------+-------+-------+-------¦ ¦(nsp/sr) ¦ ¦ ¦ ¦ ¦ ¦ ¦ ¦ ¦ ¦ ¦ ¦ ¦ ¦ ¦ ¦ ¦ ¦ (dk/na)........................¦ 132 ¦ 16 ¦ 29 ¦ 36 ¦ 50 ¦ 116 ¦ 14 ¦ 3 ¦ 102 ¦ 22 ¦ 8 ¦ 120 ¦ 5 ¦ 6 ¦ 71 ¦ 60 ¦ ¦................................¦ 4.5% ¦ 4.0% ¦ 3.4% ¦ 4.7% ¦ 5.9% ¦ 4.7% ¦ 3.9% ¦ 3.1% ¦ 4.7% ¦ 4.6% ¦ 3.2% ¦ 4.7% ¦ 7.2% ¦ 2.4% ¦ 4.3% ¦ 4.9% ¦ +--------------------------------+-------+-------+-------+-------+-------+-------+-------+-------+-------+-------+-------+-------+-------+-------+-------+-------¦ ¦INDEX +100 <==> -100............¦ 28 ¦ 27 ¦ 32 ¦ 26 ¦ 26 ¦ 28 ¦ 29 ¦ 28 ¦ 26 ¦ 34 ¦ 34 ¦ 28 ¦ 34 ¦ 29 ¦ 30 ¦ 25 ¦ ¦(Base : Répondants - Answering).¦ (2746)¦ (306)¦ (875)¦ (756)¦ (809)¦ (1707)¦ (609)¦ (430)¦ (1924)¦ (507)¦ (315)¦ (2265)¦ (127)¦ (354)¦ (1341)¦ (1405)¦ +--------------------------------+-------+-------+-------+-------+-------+-------+-------+-------+-------+-------+-------+-------+-------+-------+-------+-------¦ ¦(++/+) AUGMENTERAIT ¦ ¦ ¦ ¦ ¦ ¦ ¦ ¦ ¦ ¦ ¦ ¦ ¦ ¦ ¦ ¦ ¦ ¦ WOULD INCREASE.................¦ 45.5% ¦ 44.8% ¦ 50.9% ¦ 44.2% ¦ 41.5% ¦ 45.1% ¦ 48.0% ¦ 47.1% ¦ 43.1% ¦ 52.6% ¦ 52.6% ¦ 45.1% ¦ 50.0% ¦ 47.6% ¦ 48.6% ¦ 41.2% ¦ +--------------------------------+-------+-------+-------+-------+-------+-------+-------+-------+-------+-------+-------+-------+-------+-------+-------+-------¦ ¦(--/-) DIMINUERAIT ¦ ¦ ¦ ¦ ¦ ¦ ¦ ¦ ¦ ¦ ¦ ¦ ¦ ¦ ¦ ¦ ¦ ¦ WOULD DECREASE.................¦ .6% ¦ .2% ¦ .7% ¦ 1.4% ¦ .1% ¦ .7% ¦ .1% ¦ .4% ¦ .5% ¦ .9% ¦ 1.1% ¦ .7% ¦ .2% ¦ .0% ¦ .5% ¦ .7% ¦ +----------------------------------------------------------------------------------------------------------------------------------------------------------------+
Interviews : 26/08/02 - 23/09/02 SOFRES s.a. - Coordination EOS GALLUP EUROPE Volume B - Page : 36