Embed Size (px)
Citation preview
RE S E A R C H RE P O R T
Five Democratic Approaches to
Social Security Reform Estimated Impact of Plans from the 2020 Presidential Campaign
Karen E. Smith Richard W. Johnson Melissa M. Favreault
October 2020
P R O G R A M O N R E T I R E M E N T P O L I C Y

A B O U T T H E U R BA N I N S T I T U TE The nonprofit Urban Institute is a leading research organization dedicated to developing evidence-based insights that improve people’s lives and strengthen communities. For 50 years, Urban has been the trusted source for rigorous analysis of complex social and economic issues; strategic advice to policymakers, philanthropists, and practitioners; and new, promising ideas that expand opportunities for all. Our work inspires effective decisions that advance fairness and enhance the well-being of people and places.
Copyright © October 2020. Urban Institute. Permission is granted for reproduction of this file, with attribution to the Urban Institute. Cover image by Tim Meko.
Contents Acknowledgments v
Executive Summary vi Projected Impact on Social Security Finances viii Projected Impact on Beneficiaries ix Conclusions x
Social Security Reform Proposals from the 2020 Democratic Presidential Campaign 1 How Does Social Security Work? 3 What Did the Democratic Candidates Propose? 5
Revenue-Enhancing Provisions 5 Benefit-Enhancing Provisions 7
Methods and Data 13 DYNASIM4 16 Behavioral Assumptions 17
How Would the Plans Affect Social Security Finances? 19 Impact on Program Revenue 21 Impact on Program Costs 23
How Would Household Earnings and Taxes Change? 31 How Would Federal Revenue and Spending Change? 36 How Would the Plans Affect Economic Well-Being? 38
Annual Social Security Benefits 39 Lifetime Benefits and Taxes 45 Replacement Rates 54 Economic Hardship 57 Income of Aged and Disabled Adults 60
How Are Tax and Benefit Changes Distributed? 63 Change in Taxes by Income 63 Change in Benefits by Lifetime Earnings 64
Conclusions 67
Appendix: Estimated Long-Term Effects of Candidates’ Proposals on Social Security’s
Finances 70 Biden’s Plan 71 Buttigieg’s Plan 74 Klobuchar’s Plan 76 Sanders’s Plan 78
I V C O N T E N T S
Warren’s Plan 81
Notes 84
References 88
About the Authors 92
Statement of Independence 94

A C K N O W L E D G M E N T S V
Acknowledgments This report was funded by Arnold Ventures and the Alfred P. Sloan Foundation. We are grateful to them
and to all our funders, who make it possible for Urban to advance its mission.
The views expressed are those of the authors and should not be attributed to the Urban Institute,
its trustees, or its funders. Funders do not determine research findings or the insights and
recommendations of Urban experts. Further information on the Urban Institute’s funding principles is
available at urban.org/fundingprinciples.
We are grateful to the many researchers and programmers who have contributed to the DYNASIM
model over several decades. Douglas Murray has been a key contributor to DYNASIM’s development
for the past 20 years. Damir Cosic was instrumental in developing and implementing many of the
elements that differentiate DYNASIM4 from its predecessor, DYNASIM3. Aaron Williams provided
excellent research assistance and contributed to many elements of the DYNASIM4 development.
We are also grateful to Donald Marron, Frank Sammartino, and Jack Smalligan, who reviewed an
earlier draft of this document. We also thank Ed Harris and Julie Topoleski at the Congressional Budget
Office and Stephen Goss and Karen Glenn at the Social Security Administration for assistance with
model assumptions.

V I E X E C U T I V E S U M M A R Y
Executive Summary The Social Security policy debate is intensifying. Social Security, the nation’s largest government
program, provides cash benefits to retirees, people with disabilities, and spouses, dependents, and
survivors. Those payments account for much of beneficiaries’ incomes, especially for low-income
people. Yet, many older adults and people with disabilities struggle financially. Moreover, Social
Security faces a long-term financing gap that could within a decade jeopardize its ability to pay full
benefits. These challenges have prompted calls from many Democratic policymakers to expand Social
Security benefits, especially for lower-income people, and to shore up the program’s finances.
This report examines the Social Security proposals released by five candidates for the 2020
Democratic presidential nomination: former vice president Joe Biden, former mayor Pete Buttigieg,
Senator Amy Klobuchar (D-MN), Senator Bernie Sanders (I-VT), and Senator Elizabeth Warren (D-MA).
All the plans would expand benefits and improve program finances, but the extent of the impacts varies
widely. Although Biden is the Democratic nominee, the other candidates’ ideas illustrate the spectrum
of approaches to changing Social Security being considered by the party.
All the plans would increase Social Security revenues by boosting payroll contributions from high-
earning taxpayers. Currently, most of Social Security’s revenue comes from a 12.4 percent payroll tax
that is split evenly between workers and their employers and levied on annual earnings up to $137,700
in 2020. The Democratic candidates would extend the payroll tax to high earnings; all except Biden
would tax earnings above $250,000, and Biden would tax earnings above $400,000. Additionally,
Sanders and Warren would devote the proceeds from a new investment income tax on high-income
investors to Social Security, and Warren would increase the payroll tax rate on high earnings and tax
distributions to active participants in S corporations, partnerships, and limited liability companies.
Buttigieg would automatically boost the payroll tax rate for high-earning workers to ensure that Social
Security could pay all scheduled benefits each year.
The Democratic candidates would devote much of the additional revenue they raise to expanding
Social Security benefits. The major benefit enhancements proposed by the candidates include:
a new minimum benefit equal to 125 percent of the federal poverty level for a single adult (or
$15,950 annually in 2020) for beneficiaries with at least 30 years of covered earnings.
Beneficiaries with shorter careers would receive a prorated minimum benefit. Variants of this
provision are part of Biden’s, Buttigieg’s, Sanders’s, and Warren’s plans.
E X E C U T I V E S U M M A R Y V I I
caregiver credits, which would credit earnings that factor into future benefit computations to
workers who reduce their employment to care for children, older family members, and people
with disabilities. Variants of this provision are part of Biden’s, Buttigieg’s, Klobuchar’s, and
Warren’s plans.
higher benefits for some surviving spouses of deceased beneficiaries. This provision is part of
Biden’s, Klobuchar’s, and Warren’s plans.
a bonus equal to 5 percent of benefits for beneficiaries who have been collecting Social Security
for 20 years. This provision is part of Biden’s plan.
increased cost-of-living adjustments, which would be tied to the change in the consumer price
index for the elderly. That index generally grows faster than the index currently used to adjust
benefits. This provision is part of Biden’s, Sanders’s, and Warren’s plans.
elimination of Social Security’s Windfall Elimination Provision and Government Pension Offset,
which reduce Social Security benefits for some retired government workers and their spouses
and survivors. This provision is part of Biden’s and Warren’s plans.
a $200 per month across-the-board increase in Social Security benefits. This provision is part of
Warren’s plan.
an increase in the bottom bend point in the benefit formula that would boost payments to all
beneficiaries except those with the lowest lifetime earnings. This provision is part of Sanders’s
plan.
We simulate the potential impact of each plan on beneficiaries, taxpayers, and Social Security’s
finances using the Dynamic Simulation of Income Model4 (DYNASIM4), the Urban Institute’s unique
dynamic microsimulation tool. The current version of DYNASIM4 uses the 2019 Social Security
trustees’ intermediate demographic and economic assumptions, which do not incorporate the potential
effects of the COVID-19 pandemic. We limit our analysis to Social Security tax and benefit provisions
even though many of the candidates propose additional policy changes that would affect older people’s
financial security. We assume that the candidates’ plans would be implemented in 2021, and we often
report impacts in 2065, when all plan provisions would have fully phased in.
V I I I E X E C U T I V E S U M M A R Y
Projected Impact on Social Security Finances All five candidates’ plans would significantly increase Social Security revenue. The impact would be
largest under Warren’s plan and smallest under Biden’s plan. In 2021, projected program revenue
would increase, relative to current law, 30 percent under Warren’s plan, 15 percent under Sanders’s
plan, 10 percent under Buttigieg’s and Klobuchar’s plans, and 7 percent under Biden’s plan. The plans’
revenue increases would grow over time as wage growth and income growth increase the share of the
population with earnings or investment income subject to higher taxes. We project that in 2065
program revenue would increase, relative to current law, 48 percent under Warren’s plan, 40 percent
under Buttigieg’s plan, 26 percent under Sanders’s plan, and 16 percent under Biden’s and Klobuchar’s
plans.
Several candidates would devote much of this additional revenue to enhancing benefits. Warren’s
plan would increase benefits most, and Klobuchar’s plan would increase benefits least. We project that
in 2021 benefits would increase, relative to current law, 27 percent under Warren’s plan, 11 percent
under Buttigieg’s plan, 4 percent under Biden’s plan, 1 percent under Klobuchar’s plan, and less than 1
percent under Sanders’s plan. Under many of the proposed plans, increases in scheduled benefits—
those specified by a plan regardless of its capacity to finance them—would grow over time as benefit
enhancements phase in. We project that in 2065 scheduled benefits would increase, relative to current
law, 16 percent under Warren’s plan, 11 percent under Buttigieg’s plan, 9 percent under Sanders’s and
Biden’s plans, and 2 percent under Klobuchar’s plan.
Projected revenue increases would outstrip scheduled cost increases under all the proposed plans,
improving Social Security’s finances. Our projections show that Warren’s and Buttigieg’s plans would
eliminate Social Security’s 75-year financial shortfall, but the other plans would not raise enough
revenue to cover all scheduled benefits over 75 years. Nonetheless, they would significantly improve
Social Security’s finances and delay the date when the program trust funds are expected to run out. We
project that Sanders’s plan would close 81 percent of Social Security’s long-term financing gap,
Klobuchar’s plan would close 70 percent of the gap, and Biden’s plan would close 26 percent of the gap.
The Social Security trustees project that the program’s combined trust funds will run out in 2035. We
project that the trust funds would last until 2040 under Biden’s plan, 2061 under Klobuchar’s plan, and
2076 under Sanders’s plan. Social Security would not be able to pay all scheduled benefits after the
trust funds are depleted unless Congress raises program revenues, but Biden’s, Klobuchar’s, and
Sanders’s plans would reduce the benefit cuts needed to balance costs and revenue. Our projections,
however, do not account for the economic and demographic effects of the COVID-19 pandemic and
associated recession, which will likely worsen Social Security’s finances.
E X E C U T I V E S U M M A R Y I X
Projected Impact on Beneficiaries
All the Democratic candidates’ plans would significantly increase Social Security benefits relative to
current law, even when program financing constraints prevent Social Security from paying full
scheduled benefits. We project that in 2065 average Social Security benefits would increase, relative to
current law, 42 percent under Warren’s plan, 38 percent under Buttigieg’s plan, 36 percent under
Sanders’s plan, 18 percent under Klobuchar’s plan, and 15 percent under Biden’s plan. All the
candidates’ plans would reduce poverty rates for older adults and people with disabilities, increase the
share of preretirement earnings that Social Security replaces, and increase lifetime benefits relative to
lifetime earnings. They would increase the ratio of lifetime taxes to lifetime earnings for workers with
high earnings but not for workers with low or moderate earnings.
The proposed plans would generate higher percent benefit increases for lower-income
beneficiaries than for higher-income beneficiaries. Many of the proposed Social Security changes, such
as an enhanced minimum benefit and caregiver credits, would target low-income beneficiaries. Other
changes, such as an updated cost-of-living adjustment, a $200 per month benefit increase, an increase
in the bottom bend point of the benefit formula, and a bonus to long-term beneficiaries, would increase
payments to beneficiaries regardless of need. Biden’s and Warren’s proposals to repeal the Windfall
Elimination Provision and Government Pension Offset, which reduce Social Security benefits for some
retirees receiving government pensions and their spouses and survivors, would help many teachers,
police, and firefighters, but relatively few of these retirees have low incomes. By strengthening Social
Security’s trust funds, the Democratic candidates’ plans would eliminate or delay potential solvency-
related benefit cuts, which would help beneficiaries at all income levels.
The timing of the benefit and contribution changes affects who gains from higher benefits and who
pays for them. Buttigieg’s and Warren’s plans would initially pay much higher benefits to more
beneficiaries than the other candidates’ plans, which phase in benefit increases more slowly and often
limit them to new beneficiaries. Early generations would gain substantially more from Buttigieg’s and
Warren’s plans because they would receive higher benefits for more years without having to pay higher
taxes. Warren’s and Sanders’s plans, which include a new investment income surtax, help spread the tax
burden to some currently retired high-income beneficiaries who would never face a higher payroll tax.
Biden’s, Buttigieg’s, and Klobuchar’s plans, which are funded solely by higher taxes on earnings, puts
more of the financing burden on later generations who have more work years ahead of them with
higher tax rates.
X E X E C U T I V E S U M M A R Y
Conclusions
Ultimately, the choice between more or less generous retirement and disability supports is a political
decision. All the Democratic candidates have opted for a more generous social insurance system and
avoid cutting scheduled payments to even the highest-income beneficiaries. Buttigieg’s, Sanders’s, and
Warren’s plans show that we can provide retirees and people with disabilities much more generous
benefits as long as we are willing to increase program funding. Klobuchar’s plan is less generous in terms
of new benefits and Biden’s plan is less generous in terms of additional financing, but they illustrate how
incremental change can improve beneficiaries’ financial security.
The decision about how to address Social Security’s long-term financing challenges must be made
within a larger budgetary context. Expanding Social Security and reducing the program’s shortfall solely
through increased revenues will leave federal policymakers with fewer resources to address other
budgetary shortfalls, such as Medicare’s long-term deficit and the broader federal debt, and to meet
other public priorities.
Social Security Reform Proposals from the 2020 Democratic Presidential Campaign Social Security, formally known as Old Age, Survivors, and Disability Insurance (OASDI), is the nation’s
largest federal program. In July 2020, it provided cash benefits worth $90.4 billion to 64.7 million
retirees; people with disabilities; and spouses, dependents, and survivors.1 However, the program faces
a significant long-term financing gap. Social Security’s trustees project that under current benefit and
tax rules, the program’s annual revenues will fall short of annual costs in 2021 and never recover (Board
of Trustees 2020). Trust funds built up over the past four decades, when tax revenues from the large
generation of baby-boomer workers exceeded benefit payments, can cover the shortfall for about a
decade and a half, but the trustees’ intermediate projections show that the trust funds will be depleted
in 2035. When that happens, the program will be able to cover only about four-fifths of scheduled
benefits. These projections were completed before the COVID-19 pandemic upended the global
economy, which could worsen the program’s financial outlook.
Despite the program’s financial problems, some advocates are calling on federal policymakers to
increase Social Security benefits to strengthen financial security for older adults and people with
disabilities (Altman and Kingson 2015; Morrissey 2018). Social Security benefits account for about half
of the income received by adults age 65 and older and for about three-quarters of the income received
by those older adults in the bottom third of the income distribution (Bee and Mitchell 2017). The
average monthly Social Security benefit was only about $1,400 in July 2020.2 Consequently, many
retirees and people with disabilities struggle financially. In 2019, 13 percent of adults age 65 and older
had income below the federal poverty level (FPL), according to the US Census Bureau’s supplemental
poverty measure, which is a more accurate indicator of financial need than the official poverty measure
(Fox 2020). Economic hardship is more prevalent among certain groups of retirees, including Black
people; Latino people; adults who did not complete high school; and widowed, divorced, and never-
married adults (Johnson 2020a). Many people with disabilities also struggle financially. Nearly half of
adults ages 31 to 49 who receive Social Security disability benefits are in the bottom fifth of the income
distribution (Favreault, Johnson, and Smith 2013). Some policymakers have recently responded to
these concerns with legislation to expand Social Security, such as the Social Security 2100 Act
introduced in Congress in 2019 by Representative John Larson.3
2 F I V E D E M O C R A T I C A P P R O A C H E S T O S O C I A L S E C U R I T Y R E F O R M
Several candidates for the 2020 Democratic presidential nomination have released plans to reform
Social Security. Although the presidential primary is over and former vice president Joe Biden is the
Democratic nominee, the other candidates’ ideas live on and illustrate the spectrum of Social Security
reform approaches being considered by the party, including in its platform.4 Most of these proposals
share common features. They would raise revenues to improve Social Security’s finances, typically by
requiring high-wage workers and their employers to contribute more. They also enhance benefits
through many provisions designed to help low-income beneficiaries. However, many of the plans differ
significantly. Most plans include a minimum benefit that would keep beneficiaries with long careers out
of poverty. Some would enhance benefits for certain groups, such as long-term beneficiaries who often
incur high out-of-pocket medical expenses; the surviving spouses of deceased beneficiaries; and people
who temporarily left the labor force or worked less than full-time to care for children, elderly adults, or
people with disabilities. Other proposals would raise benefits across the board. Moreover, some
candidates would tax additional types of income and dedicate those revenues to Social Security. None
of the plans would reduce Social Security benefits.
This report examines the Social Security reform proposals developed by several Democratic
presidential candidates and estimates their potential impact on beneficiaries, taxpayers, and program
solvency.5 We compare plans released by Biden, former mayor Pete Buttigieg, Senator Amy Klobuchar
(D-MN), Senator Bernie Sanders (I-VT), and Senator Elizabeth Warren (D-MA). The analysis uses the
Dynamic Simulation of Income Model 4 (DYNASIM4), the Urban Institute’s unique dynamic
microsimulation tool. The current version of DYNASIM4 uses the 2019 Social Security trustees’
intermediate demographic and economic assumptions (Board of Trustees 2019), which do not
incorporate the potential effects of the COVID-19 pandemic. We limit our analysis to Social Security
tax and benefit provisions even though many of the candidates propose additional reforms that would
affect older people’s financial security. For example, several candidates propose expanding
Supplemental Security Income, a federal program that provides cash benefits to older adults and people
with disabilities with very limited income and assets.
Our results show that the Social Security plans developed by the Democratic presidential
candidates could improve program financing and beneficiary well-being, but the extent of the likely
impacts varies widely. Warren’s plan is the most expansive, including sweeping tax increases and
benefit expansions, while Klobuchar’s plan is the most modest, including a much smaller tax hike and
narrower benefit increases. Biden’s plan includes many benefit-enhancing provisions, but it has the
smallest tax increase and, like current law, cannot fully fund promised benefits. Like current law, his
plan’s long-term revenue shortfall would eventually require additional Congressional action to increase
F I V E D E M O C R A T I C A P P R O A C H E S T O S O C I A L S E C U R I T Y R E F O R M 3
Social Security revenues to avoid future benefit reductions. Nonetheless, compared with current law, all
plans would significantly expand Social Security, with Warren’s plan increasing program outlays by half
in 2040 and Biden’s plan increasing outlays by nearly a fifth. Unlike some past center-left Social Security
reform proposals, none of these Democratic reform plans would reduce payments to any beneficiaries,
even those with the highest incomes.6 All the plans we examine would reduce Social Security’s long-
term financing gap by raising taxes on workers with substantial earnings, but we find that only Warren’s
and Buttigieg’s plans would achieve program solvency over a 75-year horizon under the trustees’ 2019
intermediate assumptions.
By bolstering Social Security’s trust funds, the Democratic candidates’ plans would eliminate or
delay potential solvency-related benefit cuts, which would help beneficiaries at all income levels. None
of the plans would reduce payments to any beneficiaries. Certain benefit enhancements included in
some of the plans, such as the introduction of a minimum benefit and caregiver credits, would target
low-income beneficiaries. Other provisions enhance benefits more broadly. All the plans we examine
would significantly reduce economic hardship among older and disabled adults. However, the
substantial tax hikes included in some of the plans could limit economic growth and leave less potential
revenue available to address other pressing public priorities.
How Does Social Security Work?
Social Security provides cash benefits to retirees and people with disabilities as well as to their
dependents and survivors. Established in 1935, the program paid its first retirement benefits in 1940.
Disability benefits were added in 1956, initially available only to covered workers age 50 and older with
long lasting medical conditions that prevent work. The age restriction was dropped in 1960, but
beneficiaries must have completed a certain amount of covered work to qualify.
Social Security replaces a portion of lifetime earnings when workers retire or develop disabilities,
and higher lifetime earnings translate into larger Social Security benefits. The benefit formula is
progressive, replacing a larger share of earnings for low-wage workers than for high-wage workers. To
compute benefits, Social Security indexes a worker’s lifetime earnings to changes in the economy-wide
average wage and then calculates average indexed monthly earnings (AIME) over a worker’s highest-
paying 35 years. Each year, however, Social Security limits the amount of earnings that count toward
future benefits. That limit, known as the contribution and benefit base, is $137,700 in 2020 and
increases over time with the growth in the average national wage.7 The program uses AIME to compute
the basic benefit, or primary insurance amount (PIA), which is paid to beneficiaries who begin collecting
4 F I V E D E M O C R A T I C A P P R O A C H E S T O S O C I A L S E C U R I T Y R E F O R M
at the full retirement age (65 to 67, depending on a beneficiary’s birth year). For workers who turn 60 in
2020, the PIA equals 90 percent of their first $960 of AIME ($11,520 annually) plus 32 percent of
additional earnings up to $5,785 of AIME ($69,420 annually) and 15 percent of AIME over $5,785. The
monthly benefit paid by Social Security is reduced for beneficiaries who begin collecting before the full
retirement age and increased for those who delay collecting until after the full retirement age.8 Social
Security benefits are updated annually by the change in the cost of living, based on the Bureau of Labor
Statistics’ consumer price index for urban wage earners and clerical workers (CPI-W).
Social Security also pays spousal and survivor benefits. Instead of collecting benefits based on their
own earnings, beneficiaries may receive 50 percent of their spouse’s PIA or 100 percent of their
deceased spouse’s benefit if collecting on their spouse’s earnings would generate a higher payment.
Spouse and survivor benefits are available to divorced people if their marriage lasted at least 10 years.
Social Security is financed mainly through payroll taxes. The current payroll tax rate is 6.2 percent,
and that rate is levied on both covered employees and their employers. Self-employed workers pay 12.4
percent of their earnings to the program. However, only earnings in covered employment below the
contribution and benefit base are subject to taxation each year. Although the base typically increases
with the change in the average national wage, the share of covered workers’ earnings subject to the
program’s payroll tax decreased from 90 percent in 1983 to 83 percent in 2018 because earnings have
increased more rapidly for high-wage workers than for moderate- and low-wage workers (Social
Security Administration 2019a, table 4.B1; Johnson 2020b).
Congress began taxing a portion of Social Security benefits in 1984 and devoting that revenue to
Social Security and, since 1993, to Medicare. Benefits are taxed only for beneficiaries with incomes of
$25,000 or more if single and $32,000 or more if married. Those income thresholds are not indexed for
inflation, however, so the share of beneficiaries paying taxes on their Social Security benefits has been
growing over time. Between 1984 and 2018, revenue from the taxation of benefits increased from 1.8
percent to 4.1 percent of benefits paid (Social Security Administration 2019a, table 4.A1). The
Congressional Budget Office estimates that about half of Social Security beneficiaries paid income tax
on their benefits in 2014 (Shakin and Seibert 2015).
Social Security faces a long-term financing gap that program trustees have warned about for
decades as fertility has declined and life expectancy has increased, reducing the number of workers
supporting each retiree. The trustees’ most recent intermediate projections indicate that under current
rules, the program’s 75-year shortfall totals 3.21 percent of taxable payroll and program costs will
exceed revenues in 2021 and every subsequent year for the foreseeable future (Board of Trustees
F I V E D E M O C R A T I C A P P R O A C H E S T O S O C I A L S E C U R I T Y R E F O R M 5
2020).9 Social Security maintains two trust funds, one for Old Age and Survivors Insurance and the
other for Disability Insurance. These trust funds grew significantly after 1983, when Congress last
addressed Social Security financing, and they can cover the shortfall for the next decade and a half.
However, the trustees project that the combined OASDI trust fund reserves will be depleted in 2035,
just 15 years from now.
The trustees estimate that if Congress takes action today, it could eliminate the shortfall by
increasing the payroll tax 3.14 percentage points. Alternatively, Congress could eliminate the 75-year
shortfall by cutting payments 19 percent for all beneficiaries or cutting payments 23 percent only for
beneficiaries who first began collecting after 2019 (Board of Trustees 2020). If instead Congress waits
until 2035 to address Social Security’s financing gap, the required program changes would be larger.
The Social Security Trustees report that in 2035, a 4.13 percentage point payroll tax increase, a
permanent benefit reduction of 25 percent, or some combination of those would be required to fully
fund the program (Board of Trustees 2020).
What Did the Democratic Candidates Propose?
The five leading Democratic presidential candidates each proposed a series of Social Security reform
measures that would increase program revenues and enhance benefits. Sanders introduced his plan, the
Social Security Expansion Act, in the US Senate on February 13, 2019.10 The legislative language and a
cost analysis by the Social Security Administration (Goss 2019) provide details on his proposal. The
Democratic vice-presidential nominee, Senator Kamala Harris (D-CA), co-sponsored Sanders’s bill with
three other Democratic senators. Descriptions of the other candidates’ Social Security plans were
available on their campaign websites.11 We corresponded with campaign staff to obtain additional
details to ensure we interpreted their proposed policies correctly.12
Revenue-Enhancing Provisions
The candidates’ Social Security reform plans would significantly increase program revenues to narrow
Social Security’s financing gap and fund enhanced benefits (table 1). All the plans we examined would
substantially increase the payroll contribution base by requiring high earners and their employers to
contribute more. Each plan would collect payroll contributions from two tiers of earnings. The first tier
consists of the existing contribution base, which now covers earnings up to $137,700. That limit
increases over time with the growth in average wages. The second tier would consist of annual earnings
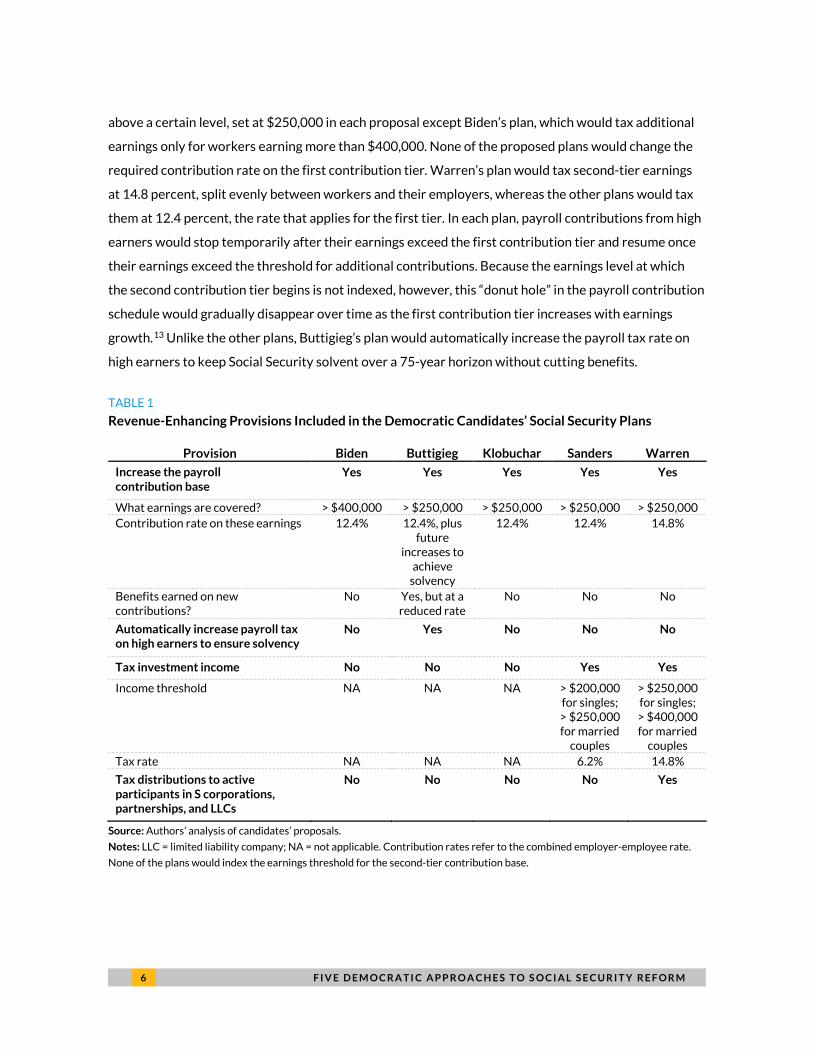
6 F I V E D E M O C R A T I C A P P R O A C H E S T O S O C I A L S E C U R I T Y R E F O R M
above a certain level, set at $250,000 in each proposal except Biden’s plan, which would tax additional
earnings only for workers earning more than $400,000. None of the proposed plans would change the
required contribution rate on the first contribution tier. Warren’s plan would tax second-tier earnings
at 14.8 percent, split evenly between workers and their employers, whereas the other plans would tax
them at 12.4 percent, the rate that applies for the first tier. In each plan, payroll contributions from high
earners would stop temporarily after their earnings exceed the first contribution tier and resume once
their earnings exceed the threshold for additional contributions. Because the earnings level at which
the second contribution tier begins is not indexed, however, this “donut hole” in the payroll contribution
schedule would gradually disappear over time as the first contribution tier increases with earnings
growth.13 Unlike the other plans, Buttigieg’s plan would automatically increase the payroll tax rate on
high earners to keep Social Security solvent over a 75-year horizon without cutting benefits.
TABLE 1
Revenue-Enhancing Provisions Included in the Democratic Candidates’ Social Security Plans
Provision Biden Buttigieg Klobuchar Sanders Warren
Increase the payroll contribution base
Yes Yes Yes Yes Yes
What earnings are covered? > $400,000 > $250,000 > $250,000 > $250,000 > $250,000 Contribution rate on these earnings 12.4% 12.4%, plus
future increases to
achieve solvency
12.4% 12.4% 14.8%
Benefits earned on new contributions?
No Yes, but at a reduced rate
No No No
Automatically increase payroll tax on high earners to ensure solvency
No Yes No No No
Tax investment income No No No Yes Yes
Income threshold NA NA NA > $200,000 for singles; > $250,000 for married
couples
> $250,000 for singles; > $400,000 for married
couples Tax rate NA NA NA 6.2% 14.8%
Tax distributions to active participants in S corporations, partnerships, and LLCs
No No No No Yes
Source: Authors’ analysis of candidates’ proposals.
Notes: LLC = limited liability company; NA = not applicable. Contribution rates refer to the combined employer-employee rate.
None of the plans would index the earnings threshold for the second-tier contribution base.
F I V E D E M O C R A T I C A P P R O A C H E S T O S O C I A L S E C U R I T Y R E F O R M 7
Except for Buttigieg’s plan, none of the Democratic candidates’ plans would allow workers to earn
Social Security benefits on their second-tier contributions. These additional contributions would pay for
other benefit expansions and reduce Social Security’s long-term financing shortfall. The additional
contributions collected under Buttigieg’s plan would also help close the program’s financing gap
because workers would earn only limited benefits on those contributions. His plan would index earnings
in the second contribution tier over a career and add 2 percent of those indexed earnings to the primary
insurance amount, less than the 15 percent replacement rate applied to the highest earnings covered by
Social Security under existing rules.
Warren’s and Sanders’s plans would also broaden Social Security’s revenue tax base to include
investment income. Modeled after the Affordable Care Act’s net investment income tax, both plans
would tax net investment income (including interest, dividends, royalties, capital gains, and rental
income, minus investment expenses) for high-income taxpayers and apply the proceeds to the Social
Security trust funds. Warren’s plan would set the income thresholds at $250,000 for single filers and
$400,000 for married couples filing jointly and set the tax rate at 14.8 percent. Sanders’s plan would set
the income thresholds at $200,000 for single filers and $250,000 for married couples filing joining and
set the tax rate at 6.2 percent. However, the investment income subject to this tax could not be greater
than the amount by which modified adjusted gross income exceeds the net investment income tax
thresholds. Warren’s plan would also levy this tax on distributions received by active participants in S
corporations, limited partnerships, and limited liability companies.14 These income thresholds are not
indexed for inflation, so the share of filers subject to the tax would increase over time.
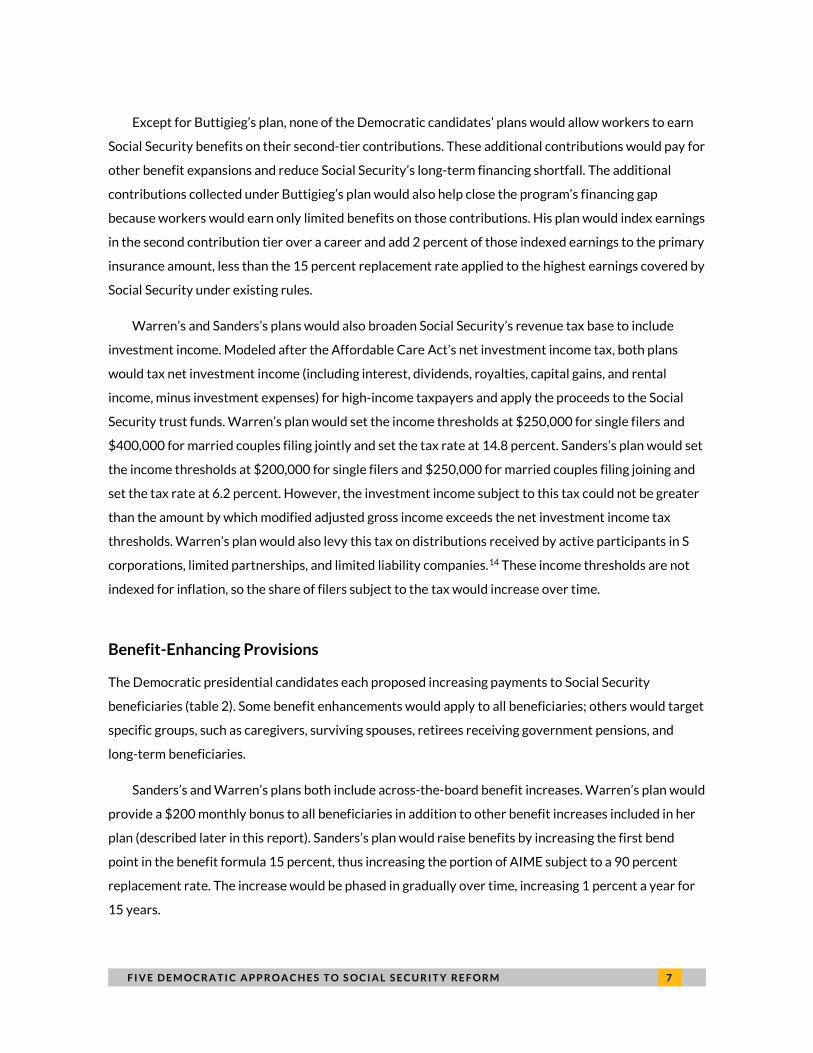
Benefit-Enhancing Provisions
The Democratic presidential candidates each proposed increasing payments to Social Security
beneficiaries (table 2). Some benefit enhancements would apply to all beneficiaries; others would target
specific groups, such as caregivers, surviving spouses, retirees receiving government pensions, and
long-term beneficiaries.
Sanders’s and Warren’s plans both include across-the-board benefit increases. Warren’s plan would
provide a $200 monthly bonus to all beneficiaries in addition to other benefit increases included in her
plan (described later in this report). Sanders’s plan would raise benefits by increasing the first bend
point in the benefit formula 15 percent, thus increasing the portion of AIME subject to a 90 percent
replacement rate. The increase would be phased in gradually over time, increasing 1 percent a year for
15 years.
8 F I V E D E M O C R A T I C A P P R O A C H E S T O S O C I A L S E C U R I T Y R E F O R M
TABLE 2
Major Benefit-Enhancing Provisions Included in the Democratic Candidates’ Social Security Plans
Provision Biden Buttigieg Klobuchar Sanders Warren
Increase monthly benefits across the board by $200 No No No No Yes
Increase the first bend point in the benefit formula No No No Yes No
Increase minimum benefits to 125% of FPL Yes Yes No Yes Yes
Index minimum to the growth in average wages Yes No NA Yes No Minimum applies to new beneficiaries only, or all New only All NA New only All
Increase COLA by using CPI-E to raise benefits Yes No No Yes Yes
Increase payments to long-term beneficiaries Yes No No No No
Increase survivor benefits Yes No Yes No Yes
Provide caregiver credits Yes Yes Yes No Yes
Credit amount
Own earnings plus up to 50%
of national average wage
100% of national
average wage 50% of national
average wage NA
100% of national
average wage Maximum age for qualifying child 11 17 5 NA 5 Limit on caregiver credits 5 years None None NA None
Eliminate WEP and GPO Yes No No No Yes
Source: Authors’ analysis of candidates’ proposals.
Notes: COLA = cost-of-living adjustment; CPI-E = consumer price index for the elderly; FPL = federal poverty level; GPO =
Government Pension Offset; NA = not applicable; WEP = Windfall Elimination Provision.
INCREASE THE MINIMUM BENEFIT
Social Security currently includes a minimum benefit, a feature designed to boost payments to retirees
who spent many years working at low wages, but the minimum is too low to help many beneficiaries. At
the end of 2019, just 32,000 Social Security beneficiaries received the special minimum, less than 0.1
percent of all Social Security beneficiaries (Social Security Administration 2020a, table 5.A8). No new
Social Security awards have included the special minimum since 1998, except for a few retirees
receiving government pensions that reduced their Social Security benefits (Feinstein 2013).
Biden, Buttigieg, Sanders, and Warren all propose a new Social Security minimum benefit equal to
125 percent of the FPL for a single adult, or $15,950 annually in 2020. Beneficiaries must have
completed 30 years of covered employment to qualify for the full minimum, but all beneficiaries with at

F I V E D E M O C R A T I C A P P R O A C H E S T O S O C I A L S E C U R I T Y R E F O R M 9
least 10 years of covered employment could qualify for a prorated share of the minimum.15 These
employment eligibility rules would apply to beneficiaries and their survivors, including those who die or
develop disabilities before age 62.
Some details regarding the minimum benefit differ across the proposals. Biden’s and Sanders’s
proposals would index the minimum benefit to the annual change in the average national wage, whereas
the minimum benefit in Buttigieg’s and Warren’s proposals would grow over time as the FPL increases.
Because the FPL adjusts each year with inflation and because wages generally grow faster than
inflation, the minimum benefit would increase more rapidly under Biden’s and Sanders’s proposals. On
the other hand, all beneficiaries could qualify for the minimum benefit under Buttigieg’s and Warren’s
proposals, whereas Biden’s and Sanders’s minimum benefit would cover only new beneficiaries (those
who begin collecting benefits or die after 2020).
INCREASE COST OF LIVING ADJUSTMENTS
Biden’s and Warren’s proposals would increase Social Security’s cost-of-living adjustment (COLA) by
tying it to the change in the experimental consumer price index for the elderly (CPI-E) instead of the
CPI-W. The Bureau of Labor Statistics computes the CPI-W based on spending by urban wage earners
and clerical workers, who generally do not collect Social Security benefits. The experimental CPI-E is
based on spending by adults age 62 and older and their families. Compared with the CPI-W, the CPI-E
gives more weight to spending on medical care and housing and less weight to spending on
transportation, education, food and beverages, and apparel (Bureau of Labor Statistics 2012) and may
better reflect the spending needs of Social Security beneficiaries (Koenig and Waid 2012; National
Committee to Preserve Social Security and Medicare 2017).
In most years, the CPI-E has increased more rapidly than the CPI-W. The Social Security actuaries
assume that the CPI-E would grow 0.2 percentage points more than the CPI-W each year.16 Although
the difference between the two indexes is small, the impact on benefit levels of using the CPI-E instead
of the CPI-W would cumulate over time and become substantial for long-term beneficiaries. The Social
Security trustees’ intermediate assumptions imply, for example, that beneficiaries would receive 5
percent more in their 25th year of benefit collection if the COLA were based on the CPI-E rather than
the CPI-W.
INCREASE PAYMENTS TO LONG-TERM BENEFICIARIES
Biden’s plan provides additional help to long-term beneficiaries. It would boost payments by 1 percent
of the average benefit for beneficiaries who had collected payments for 16 years and provide an
1 0 F I V E D E M O C R A T I C A P P R O A C H E S T O S O C I A L S E C U R I T Y R E F O R M
additional 1 percent bonus for each additional year of collection until the benefit bump-up reaches 5
percent of the average benefit for beneficiaries who had collected for 20 years.17 Payments would then
remain at that level, plus annual COLAs.
Many long-term Social Security beneficiaries receive relatively low payments because their
benefits are based on earnings received many years earlier. The COLA raises payments to offset
inflation, but because wages typically grow faster than prices, beneficiaries who began collecting more
recently generally receive larger benefits than those who began collecting earlier. Moreover, out-of-
pocket spending on medical care and home and residential care typically surges after age 80 (Cubanski
et al. 2019; Hatfield et al. 2018), exacerbating economic hardship for many long-term beneficiaries.
However, a benefit bump-up for long-term beneficiaries does not necessarily go to the most vulnerable
beneficiaries, because those who survive to older ages tend to have more lifetime earnings than those
who die at relatively young ages (Bosley, Morris, and Glenn 2018; Chetty et al. 2016; Waldron 2007).
INCREASE SURVIVOR BENEFITS
Biden’s, Klobuchar’s, and Warren’s proposals would increase Social Security benefits to some surviving
spouses of deceased beneficiaries, who made up about 6 percent of all Social Security beneficiaries in
2018 (Social Security Administration 2019a, table 5.A1). In addition to providing survivors with the
existing option of receiving 100 percent of their spouse’s benefit upon his or her death or retaining 100
percent of their own worker benefit, this proposal would provide survivors with the option to collect 75
percent of the total benefit received by the household before the deceased spouse died (but no more
than the benefit received by a two-earner couple with average career earnings).
As well as increasing overall survivor benefits, this change would reduce the disparity in survivor
benefits between spouses in dual-earner couples and those in single-earner couples.18 Under current
benefit rules (Social Security Administration 2019d), survivors in dual-earner couples in which both
spouses received similar earnings over their lifetime would generally experience about a 50 percent cut
in household benefits upon their spouse’s death. Survivors in single-earner couples (or in couples in
which one spouse earned much more than the other) would generally experience a 33 percent cut in
benefits upon their spouse’s death. Under the proposed change to survivor benefits, the benefit cut
would be no more than 25 percent of the household benefits received before a spouse’s death (except
for some high-income beneficiaries). This proposal could help reduce the poverty rate for older widows,
which is more than three times as high as the rate for older married women (Social Security
Administration 2016). However, boosting survivor benefits could exacerbate inequities by race, lifetime
earnings, and education (Favreault and Mermin 2008; Harrington Meyer, Wolf, and Himes 2004). Black
F I V E D E M O C R A T I C A P P R O A C H E S T O S O C I A L S E C U R I T Y R E F O R M 1 1
people and Latino people, for example, are less likely to marry and more likely to divorce than non-
Hispanic white people.
PROVIDE SOCIAL SECURITY CREDITS TO CAREGIVERS
Biden’s, Buttigieg’s, Klobuchar’s, and Warren’s proposals would extend Social Security credits to
workers who take time out of the workforce to care for children, for dependents with disabilities, or for
aged family members. For every month that caregivers provide at least 80 hours of care, Social Security
would credit them with earnings tied to the average national monthly wage, not their own past
earnings. Those earnings would factor into the AIME calculation, in most cases raising future Social
Security benefits.19 Buttigieg and Warren would credit caregivers with the full average national wage,
whereas Biden and Klobuchar would credit them with half of the average national wage. Biden’s
caregiver credit differs from the other candidates’ credits. His plan would provide a credit on top of a
caregiver’s earnings, but it would phase out the credit by 50 cents for every $1 earned by the caregiver
until the credit is eliminated for workers earning the average wage; the other candidates’ plans would
replace a caregiver’s earnings in the Social Security benefit formula with the caregiver credit as long as
that credit exceeded the worker’s earnings. In 2017, the average national wage was $50,322 and
median earnings were $30,079, so a 100 percent credit would exceed earnings for more than half of all
earners. Buttigieg’s proposal credits caregivers of all children under age 18, Biden’s proposal credits
caregivers of children under age 12, and Klobuchar’s and Warren’s proposals restrict credits to
caregivers of children under age 6. Buttigieg’s, Klobuchar’s, and Warren’s plans do not cap the number
of caregiving years eligible for a Social Security credit, but Biden’s plan allows only 5 years of caregiver
credits. All of the plans limit credits to caregiving activities that occurred before beneficiaries claimed
Social Security.
Caregiver credits could significantly boost Social Security benefits for women, who shoulder most
caregiving responsibilities (Parker 2015; Schulz and Eden 2016). Women earn lower Social Security
benefits than men because they earn lower wages and work fewer hours, often because of caregiving
responsibilities (Cosic, Johnson, and Smith 2018; Favreault 2018). Providing help directly to caregivers,
rather than helping them indirectly through spousal benefits, would benefit single mothers, who are
disproportionately low-income women of color (Livingston 2018), although people who cannot afford
to leave the workforce or reduce their paid work hours would not benefit from the proposal.
ELIMINATE SOCIAL SECURITY OFFSETS FOR UNCOVERED GOVERNMENT EMPLOYEES
Both Biden and Warren propose repealing Social Security’s Windfall Elimination Provision (WEP) and
Government Pension Offset (GPO), which reduce Social Security benefits for workers receiving
1 2 F I V E D E M O C R A T I C A P P R O A C H E S T O S O C I A L S E C U R I T Y R E F O R M
government pensions from jobs not covered by Social Security (Social Security Administration 2019b,
2020b). Some state and local government jobs that provide relatively generous pensions do not provide
Social Security coverage. Workers who retire from these jobs and were employed in a Social Security
covered job generally have low AIMEs because they spent much of their career in uncovered
employment. The progressive Social Security benefit formula would ordinarily replace a large share of
their covered earnings. To prevent this windfall, the WEP, enacted in 1983, reduces the replacement
rate on earnings below the first bend point from 90 percent to 40 percent for beneficiaries receiving a
government pension from an uncovered job with no more than 20 years of covered employment. The
WEP reduction phases out for beneficiaries with more than 20 years of covered employment and ends
once beneficiaries complete 30 years of covered employment.
The GPO, enacted in 1977, is similar to the WEP but applies to spouse and survivor benefits. This
provision reduces spouse and survivor Social Security benefits by two-thirds of any government
pension income received from an uncovered job. The GPO aims to treat government workers similarly
to private-sector workers, whose Social Security worker benefits would limit access to spouse and
survivor benefits.
In 2019, the WEP reduced benefits for 1.9 million Social Security beneficiaries, or about 2 percent
of all beneficiaries, and the GPO reduced spouse and survivor benefits for about 700,000 beneficiaries,
or about 1 percent of all beneficiaries, eliminating benefits for about three-quarters of them (Li 2020).
Abolishing the WEP and GPO would remove an unpopular and often misunderstood Social Security
provision that mainly affects teachers, police officers, and firefighters (Boyens, Kolasi, and Smalligan
2019). However, eliminating the provisions would create disparities in the treatment of government
and public-sector retirees. Several recent Congressional bills would reform the way Social Security
computes benefits for government pensioners rather than eliminating those cuts.20
OTHER BENEFIT ENHANCEMENTS
Warren’s and Sanders’s proposals include other provisions that would enhance Social Security benefits.
Both candidates would extend family benefits to children older than age 18 if they are enrolled full time in
high school, college, or vocational school. Social Security now pays benefits to the children of beneficiaries,
but those benefits generally end when children turn 18. Sanders would extend the age cutoff for child
benefits to 22 for students, and Warren would extend the cutoff to age 24.21
Warren’s plan would also expand survivor benefits for people with disabilities and adjust future
Social Security benefits for time that beneficiaries spent in training and apprenticeship programs.
Currently, Social Security provides benefits to survivors of deceased beneficiaries age 50 and older if
F I V E D E M O C R A T I C A P P R O A C H E S T O S O C I A L S E C U R I T Y R E F O R M 1 3
they have a disability that began within seven years of the worker’s death and reduces their benefits to
71.5 percent of the deceased worker’s basic benefit amount. (Survivors without disabilities cannot
receive Social Security until age 60.)22 Warren’s proposal would eliminate that age requirement and the
reduction factors for early claiming. Warren’s proposal would also exclude from a worker’s AIME
calculation up to three years spent in job training and apprenticeship programs. This adjustment would
raise participants’ future Social Security benefits by excluding some zero-earnings years from the AIME
calculation.
Methods and Data
We simulate how the Democratic presidential candidates’ Social Security reform proposals would affect
program finances and payments received by beneficiaries. For each proposal, we compare outcomes to
each other and to current law. The analysis focuses on payable scenarios, which show payments that
Social Security could afford to make under existing tax rates and benefit rules or under the tax rates and
budget rules proposed by the candidates; under these scenarios, benefits are reduced to match
available tax revenues once the trust funds are depleted. We also sometimes show outcomes under
scheduled scenarios, which show what payments would be under existing benefit rules or under the
benefit rules proposed by the candidates if program revenues were unlimited. Social Security studies
sometimes make other assumptions about how the program’s financing gap would be closed after the
trust funds are depleted, such as by increasing payroll taxes to fund scheduled benefits (Clingman,
Burkhalter, and Chaplain 2020) or combining a payroll tax increase with an equal reduction in benefits
(Bosworth, Burtless, and Keys 2003), but we limit the number of comparisons here to keep the analyses
tractable. Unless otherwise noted, we assume that all reforms would be enacted in 2021. We report all
amounts in inflation-adjusted 2018 dollars.
To assess the impact of the candidates’ proposed Social Security reform plans on program finances,
we simulate Social Security’s noninterest income and costs, the program’s long-term actuarial balance,
the trust fund ratio, and the trust fund exhaustion year. We project these outcomes for 75 years, the
horizon Social Security uses to assess the program’s financial condition.
Although Social Security maintains two trust funds, we follow the common practice of combining
these trust funds in our projections. The long-term actuarial balance summarizes the program’s
financial condition throughout the 75-year projection period. We compute the long-term actuarial
balance as the present discounted value of noninterest revenues over the period plus the value of the
trust funds at the start of the period, minus the present discounted value of projected costs over the
1 4 F I V E D E M O C R A T I C A P P R O A C H E S T O S O C I A L S E C U R I T Y R E F O R M
period and the present discounted value of projected costs in the 76th year. These values are expressed
as a percentage of the present discounted value of taxable payroll projected over the period. The trust
fund ratio is defined as the combined Social Security trust fund reserves expressed as a percentage of
annual program cost. The program is considered solvent when the trust fund ratio remains positive
throughout the 75-year projection period. We identify the trust fund exhaustion year based on when
the trust fund ratio first falls below zero. When the trust funds run out, the current-law-payable
scenario reduces all Social Security benefits across the board by the percentage necessary to keep
program costs equal to program revenue.23 The analysis computes projected cost rates, defined as
program cost as a percentage of taxable payroll, and income rates, defined as noninterest income as a
percentage of taxable payroll. In all cases, we show cost estimates for each candidate’s payable plan. We
also estimate the effect of each reform provision in isolation, with no other changes, reporting the
impact on the long-term actuarial balance and on beneficiaries.
Additionally, our analysis examines how the candidates’ proposals would change federal revenue
and expenditures. Our revenue measure includes changes in receipts from the federal individual income
tax, Social Security and Medicare payroll tax (including the 3.8 percent net investment income surtax
and the 0.9 percent additional Medicare tax imposed on some high income taxpayers), income-related
premiums for Medicare Parts B and D, and the Social Security net investment income surtax imposed by
Sanders’s and Warren’s plans.24 Our expenditure measure includes changes in Social Security,
Supplemental Security Income (SSI), and other government benefits.25 We aggregate the change in
federal revenue and expenditures between 2021 and 2030 because Congress usually considers the 10-
year impact on net federal expenditures when evaluating tax and spending proposals.
Much of our analysis focuses on how each of the proposals would affect workers and beneficiaries.
For beneficiaries, we show how reform plans would affect Social Security benefits; median income; the
share of beneficiaries with low incomes; and the share of preretirement earnings beneficiaries are able
to replace at age 70, when most people have retired and begun collecting benefits. We generally report
outcomes for adults receiving disability or retirement benefits. When measuring Social Security
benefits, we subtract any federal income taxes paid on those benefits, following Congressional Budget
Office conventions. We report per capita median income net of taxes by (1) subtracting from income
federal and state income taxes, Social Security and Medicare payroll taxes (including the additional
Medicare tax and the net investment income tax), and income-related Medicare Part B and Part D
premiums above the base premium and (2) dividing income and taxes by two for married couples. We
show how income varies by demographic and economic characteristics, including race and Hispanic
F I V E D E M O C R A T I C A P P R O A C H E S T O S O C I A L S E C U R I T Y R E F O R M 1 5
origin, educational attainment, marital status, age, work years, and income and lifetime earnings
quintiles.
We use two alternative measures to classify beneficiaries as having low incomes. The first measure
indicates whether family income falls below 100 percent of the FPL.26 The second measure indicates
whether family income, adjusted for family size, falls below 25 percent of the average earnings of
workers. Because poverty thresholds increase over time with prices and incomes tend to grow faster
than prices, poverty rates generally fall over time. Comparing Social Security benefits to the average
wage shows whether beneficiaries are falling behind workers. The analysis adjusts income for family
size and composition using the equivalence measures calculated for the US Census Bureau’s
supplemental poverty measure (Short 2013).
Our replacement measure compares Social Security benefits and total income to average lifetime
earnings. We compute average earnings over workers’ top 35 earning years by indexing annual earnings
to the growth in the economy-wide average annual wage, similar to the AIME measure used to compute
Social Security benefits, except we split couples’ earnings evenly between the partners in years in which
they were married. We also show the share of 70-year-olds with income that does not equal at least 75
percent of their preretirement earnings, a common rule of thumb for defining adequate retirement
income (Cosic, Johnson, and Smith 2018). For this comparison, we define preretirement earnings as the
average annual earnings received from ages 50 to 59, and our measure of age-70 income includes
earnings, partnership and S-corporation income; Social Security benefits; defined-benefit pension income;
SSI; other cash benefits; and the annual income from an annuity valued at 80 percent of financial assets,
including retirement accounts. The annuity measure of financial assets allows us to compare the value of
defined-contribution plan assets with defined-benefit pension income. We measure both earnings and
age-70 income in inflation-adjusted 2018 dollars and again split couples’ earnings evenly between the
partners in years in which they were married.
Our analysis also examines lifetime outcomes. We compute lifetime measures of Social Security
taxes and benefits relative to lifetime earnings by 10-year birth cohorts and compare benefits with
taxes for beneficiaries who survive to age 65. Lifetime taxes include both worker and employer payroll
taxes plus the Social Security net investment income surtax included in Sanders’s and Warren’s plans.
We calculate the present value of lifetime benefits, taxes, and earnings at age 65 using a 2.6 percent
annual real discount rate. Projected lifetime benefits account for the age at which each person claims
benefits and include disabled-worker benefits, retired worker benefits, and spouse and survivor
benefits. We calculate per capita measures that split couple benefits, taxes, and earnings in years each
person is married. By focusing on people who survive to age 65, we characterize the experience of
1 6 F I V E D E M O C R A T I C A P P R O A C H E S T O S O C I A L S E C U R I T Y R E F O R M
typical retirees with Social Security. However, a significant share of workers pay payroll taxes but do
not survive long enough to collect retirement benefits. Social Security projections indicate that about
20 percent of men and 12 percent of women who were born in 1960 will die between ages 18 and 65
(Board of Trustees 2019); these early decedents disproportionately have low education and earnings
(Favreault 2019). Analyses of the lifetime distributional effects of Social Security thus often include
those who die before age 65.27
Our final set of analyses examines how the distribution of changes to taxes and benefits vary with
income and lifetime earnings to determine how well each plan targets low-income beneficiaries and
high-income taxpayers. We focus on outcomes in 2065, when the plans have fully phased in.
DYNASIM4
Our analysis of the candidates’ Social Security reform proposals is based on DYNASIM4. The model
starts with a nationally representative sample of individuals and families in 2006 and ages them year by
year, simulating key demographic, economic, and health events. For example, DYNASIM4 projects that
each year, some people in the sample get married, have a child, or find a job. The model projects that
other people become divorced or widowed, stop working, begin collecting Social Security, become
disabled, or die. These transitions are based on probabilities generated by carefully calibrated
equations estimated from national household survey data. The equations account for important
differences in how likely various experiences are depending on gender, education, earnings, and other
characteristics. Other equations in DYNASIM4 project annual earnings, savings, and home equity. The
model includes detailed Social Security, SSI, health insurance, and income tax calculators that combine
historical and projected program rules with projections of lifetime earnings, disability and health status,
and household income and wealth to project Social Security retirement and disability benefits,
Medicare benefits, SSI and other benefits, and tax liabilities.
The baseline model projects current-law program rules into the future, including the sunset of tax
provisions in the 2017 Tax Cut and Jobs Act. We also assume that current indexing of income tax
parameters and government benefits continue indefinitely. For consistency with Social Security’s
projections about program revenues and payments, we generally use the same assumptions that the
Social Security and Medicare trustees used in their 2019 projections.
DYNASIM4 has been rigorously validated, and its projections align closely with those developed by
the Social Security actuaries (Smith et al. 2018). One area in which we deviate from the actuaries,
however, is our projection of revenues generated by the income taxation of Social Security benefits.
F I V E D E M O C R A T I C A P P R O A C H E S T O S O C I A L S E C U R I T Y R E F O R M 1 7
Because we assume that current law continues indefinitely, we hold the income thresholds for the
taxation of Social Security benefits, which have not changed since they were created in 1983, at their
current levels throughout the projection period. Consequently, we project that revenue from taxing
Social Security benefits increases as inflation and productivity growth raises income. Our projections
show that between 2027 and 2095, this revenue as a share of total benefits paid will grow from 5
percent to 8.5 percent. By contrast, the Social Security actuaries project that income tax collections as a
share of benefits paid will increase over the same period from 5 percent to 5.6 percent (Social Security
Administration 2019c).28
Urban Institute researchers have used DYNASIM extensively to evaluate programs and policies
affecting older adults (including Social Security, Medicare, long-term services and supports, and
employer-provided pensions) and the potential impact of reforms. Studies have examined Social
Security and pension reform proposals from the Bipartisan Policy Center’s Commission on Retirement
Security and Personal Savings (Bipartisan Policy Center 2016), the National Commission on Fiscal
Responsibility and Reform (Favreault and Karamcheva 2011), and the President’s Commission to
Strengthen Social Security (Favreault et al. 2004).29
Behavioral Assumptions
Our analysis incorporates various assumptions about how employers and workers would respond to the
tax changes proposed by the Democratic candidates. Following most other analysts, including the
Congressional Budget Office (2015), Tax Policy Center,30 Social Security Administration (2009), Tax
Foundation (Watson and Miller 2020), Joint Committee on Taxation, and the US Treasury’s Office of
Tax Analysis, we assume that workers bear the full burden of the Social Security payroll tax, including
the employer portion. As a result, any increase in the employer payroll tax would lead employers to
reduce the wages and salaries they pay workers by an equivalent amount so employer payroll costs do
not change. We also assume that an increase in the payroll tax rate would lead workers and their
employers to shift some employee compensation from taxable salaries to tax-exempt fringe benefits to
reduce tax burdens, especially for high-wage earners, who would be more willing to accept that trade-
off.31 For workers with earnings above the threshold for the second tier of the contribution base, we
shift between 1 and 10 percent of newly taxed earnings into tax-exempt compensation, depending on
how much additional payroll tax workers would pay.32
Tax hikes often encourage taxpayers to shift some of their investments into assets taxed at lower
rates to reduce their tax liability, limiting revenue raised by investment tax increases. Capital gains
1 8 F I V E D E M O C R A T I C A P P R O A C H E S T O S O C I A L S E C U R I T Y R E F O R M
taxes are particularly susceptible to tax avoidance behavior because taxpayers can easily reduce or
delay realized capital gains (Leiserson 2020). Our analysis captures this tendency by assuming that
investors reconfigure their investment portfolio to reduce their tax liabilities when taxes on investment
income increase. Following the Tax Policy Center,33 for capital gains, we assume a −1.1 elasticity of
taxable income with respect to the tax rate in the first year of a tax change and a −0.7 elasticity each
year thereafter. We use a −0.175 elasticity on other investment income for taxpayers in the top 1
percent of the income distribution. However, Sanders’s proposal treats gifts and bequests of
appreciated property as realization events (so that people would pay capital gains taxes on any accrued
gains when they make a gift during their lifetime or leave a bequest upon death). Because this change
reduces the benefit of holding appreciated assets until death, the Tax Policy Center reduces the capital
gains elasticity to −0.4 at a 20 percent tax rate. Warren’s proposal would apply carryover basis to
bequests, so the Tax Policy Center reduces the elasticity on capital gains to −0.55 at a 20 percent tax
rate.
Changes to Social Security benefits and taxes would affect economic growth by shifting work and
savings incentives and hence work, spending, and saving decisions. Workers, especially those near
retirement, may consider the longer-term impacts of Social Security reforms on future retirement
income as well as the immediate impact on take-home pay. Aggregating the work, savings, and
consumption choices of all families in the economy could significantly raise or lower prices for labor and
returns to capital and shift the macroeconomy. Using a complex overlapping generations model, the
Penn Wharton Budget Model team projects that the economy would grow faster under most Social
Security proposals that increase program revenue than under current policy (Penn Wharton Budget
Model 2019). They find that reforms that, unlike the plans we are examining, combine progressive
benefit reductions with tax increases would spur the most economic growth. They also conclude that
reforms that introduce “donut holes” without increasing benefits for higher-income individuals would
reduce growth more than reforms that simply increase the existing payroll tax rate.
We do not integrate macroeconomic effects into our analysis. These effects, which are difficult to
incorporate into a complex dynamic microsimulation model, are unlikely to significantly change the
projected distributional impact of potential policy reforms (Leiserson 2017), which is the focus of our
analysis.
F I V E D E M O C R A T I C A P P R O A C H E S T O S O C I A L S E C U R I T Y R E F O R M 1 9
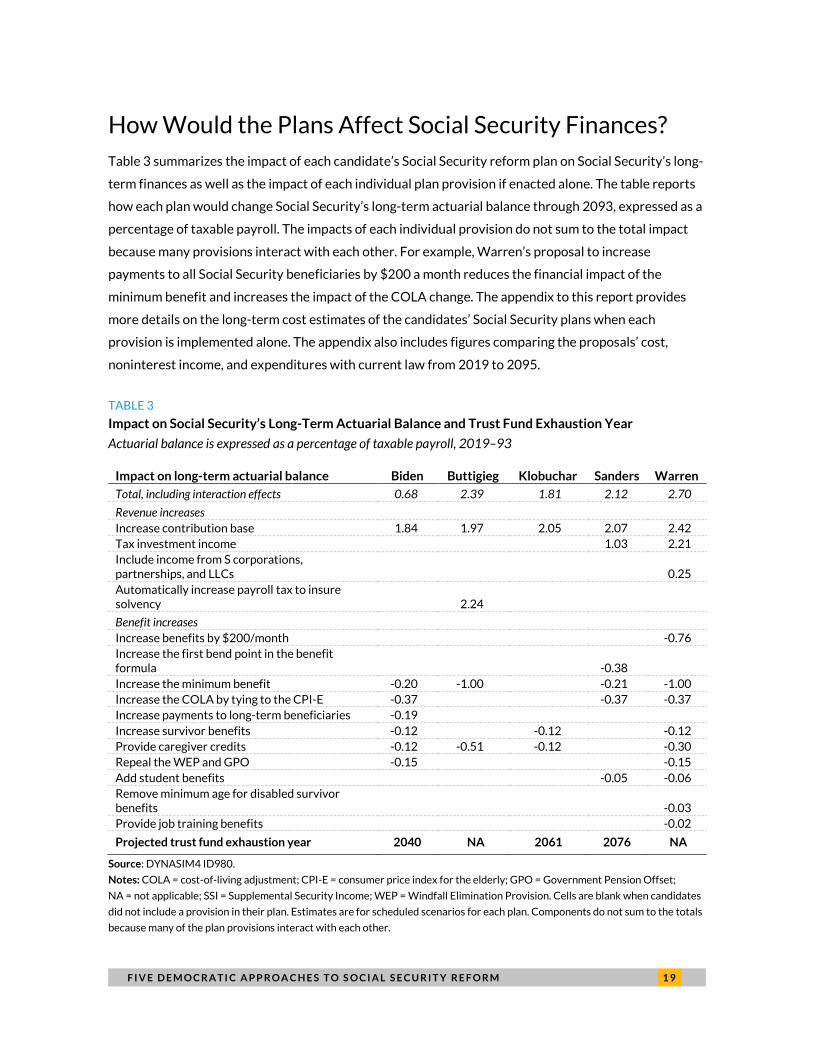
How Would the Plans Affect Social Security Finances? Table 3 summarizes the impact of each candidate’s Social Security reform plan on Social Security’s long-
term finances as well as the impact of each individual plan provision if enacted alone. The table reports
how each plan would change Social Security’s long-term actuarial balance through 2093, expressed as a
percentage of taxable payroll. The impacts of each individual provision do not sum to the total impact
because many provisions interact with each other. For example, Warren’s proposal to increase
payments to all Social Security beneficiaries by $200 a month reduces the financial impact of the
minimum benefit and increases the impact of the COLA change. The appendix to this report provides
more details on the long-term cost estimates of the candidates’ Social Security plans when each
provision is implemented alone. The appendix also includes figures comparing the proposals’ cost,
noninterest income, and expenditures with current law from 2019 to 2095.
TABLE 3
Impact on Social Security’s Long-Term Actuarial Balance and Trust Fund Exhaustion Year
Actuarial balance is expressed as a percentage of taxable payroll, 2019–93
Impact on long-term actuarial balance Biden Buttigieg Klobuchar Sanders Warren
Total, including interaction effects 0.68 2.39 1.81 2.12 2.70
Revenue increases Increase contribution base 1.84 1.97 2.05 2.07 2.42 Tax investment income 1.03 2.21 Include income from S corporations, partnerships, and LLCs 0.25 Automatically increase payroll tax to insure solvency 2.24
Benefit increases Increase benefits by $200/month -0.76 Increase the first bend point in the benefit formula -0.38 Increase the minimum benefit -0.20 -1.00 -0.21 -1.00 Increase the COLA by tying to the CPI-E -0.37 -0.37 -0.37 Increase payments to long-term beneficiaries -0.19 Increase survivor benefits -0.12 -0.12 -0.12 Provide caregiver credits -0.12 -0.51 -0.12 -0.30 Repeal the WEP and GPO -0.15 -0.15 Add student benefits -0.05 -0.06 Remove minimum age for disabled survivor benefits -0.03 Provide job training benefits -0.02
Projected trust fund exhaustion year 2040 NA 2061 2076 NA
Source: DYNASIM4 ID980.
Notes: COLA = cost-of-living adjustment; CPI-E = consumer price index for the elderly; GPO = Government Pension Offset;
NA = not applicable; SSI = Supplemental Security Income; WEP = Windfall Elimination Provision. Cells are blank when candidates
did not include a provision in their plan. Estimates are for scheduled scenarios for each plan. Components do not sum to the totals
because many of the plan provisions interact with each other.
2 0 F I V E D E M O C R A T I C A P P R O A C H E S T O S O C I A L S E C U R I T Y R E F O R M
Using the 2019 intermediate demographic and economic assumptions adopted by the Social
Security trustees, DYNASIM4 projects that Social Security currently faces a 75-year actuarial deficit of
2.59 percent of taxable payroll. DYNASIM4 also projects that Social Security’s combined trust funds
will run out in 2035.34 Plans must raise the program’s long-term actuarial balance to achieve solvency
over the 75-year projection period, though the timing and size of revenue and expenditure changes
affect actuarial balances, interest income, and program solvency.
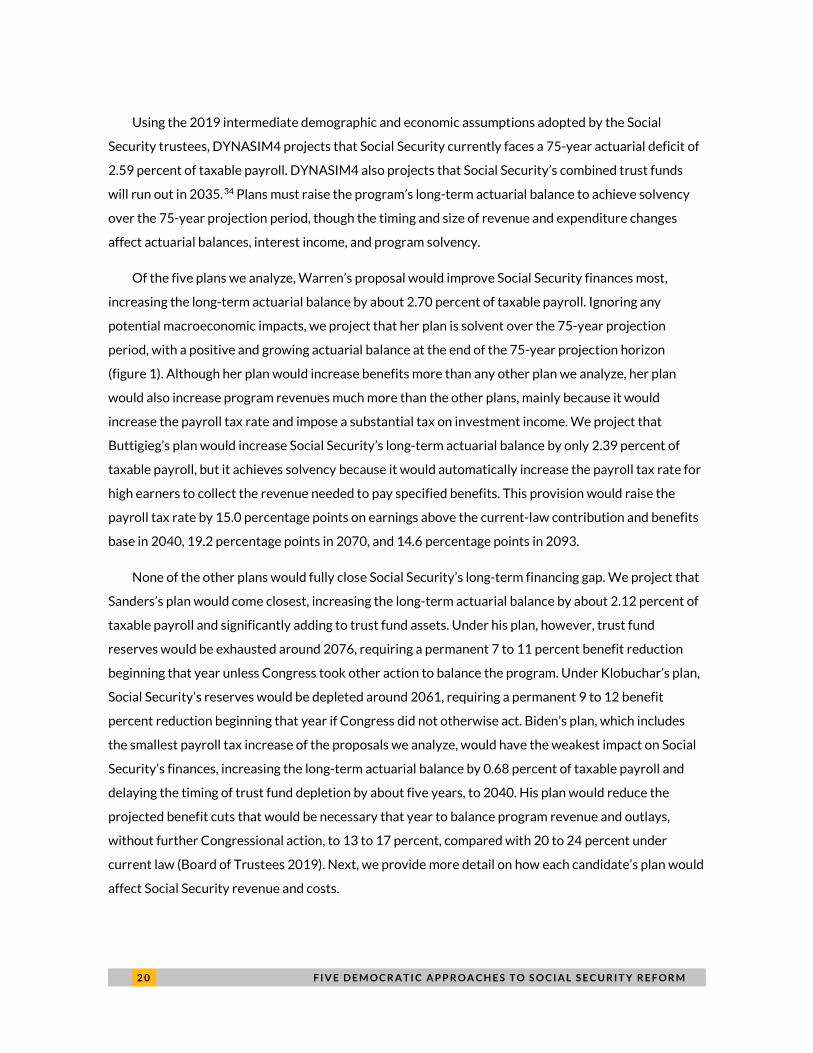
Of the five plans we analyze, Warren’s proposal would improve Social Security finances most,
increasing the long-term actuarial balance by about 2.70 percent of taxable payroll. Ignoring any
potential macroeconomic impacts, we project that her plan is solvent over the 75-year projection
period, with a positive and growing actuarial balance at the end of the 75-year projection horizon
(figure 1). Although her plan would increase benefits more than any other plan we analyze, her plan
would also increase program revenues much more than the other plans, mainly because it would
increase the payroll tax rate and impose a substantial tax on investment income. We project that
Buttigieg’s plan would increase Social Security’s long-term actuarial balance by only 2.39 percent of
taxable payroll, but it achieves solvency because it would automatically increase the payroll tax rate for
high earners to collect the revenue needed to pay specified benefits. This provision would raise the
payroll tax rate by 15.0 percentage points on earnings above the current-law contribution and benefits
base in 2040, 19.2 percentage points in 2070, and 14.6 percentage points in 2093.
None of the other plans would fully close Social Security’s long-term financing gap. We project that
Sanders’s plan would come closest, increasing the long-term actuarial balance by about 2.12 percent of
taxable payroll and significantly adding to trust fund assets. Under his plan, however, trust fund
reserves would be exhausted around 2076, requiring a permanent 7 to 11 percent benefit reduction
beginning that year unless Congress took other action to balance the program. Under Klobuchar’s plan,
Social Security’s reserves would be depleted around 2061, requiring a permanent 9 to 12 benefit
percent reduction beginning that year if Congress did not otherwise act. Biden’s plan, which includes
the smallest payroll tax increase of the proposals we analyze, would have the weakest impact on Social
Security’s finances, increasing the long-term actuarial balance by 0.68 percent of taxable payroll and
delaying the timing of trust fund depletion by about five years, to 2040. His plan would reduce the
projected benefit cuts that would be necessary that year to balance program revenue and outlays,
without further Congressional action, to 13 to 17 percent, compared with 20 to 24 percent under
current law (Board of Trustees 2019). Next, we provide more detail on how each candidate’s plan would
affect Social Security revenue and costs.
F I V E D E M O C R A T I C A P P R O A C H E S T O S O C I A L S E C U R I T Y R E F O R M 2 1
FIGURE 1
Projected Trust Fund Ratio, 2005–95 (%)
Current law and each reform plan, under scheduled scenarios
URBAN INSTITUTE Source: DYNASIM4 ID980.
Notes: The trust fund ratio is defined as the asset reserves at the beginning of a year expressed as a percentage of the cost during
the year.
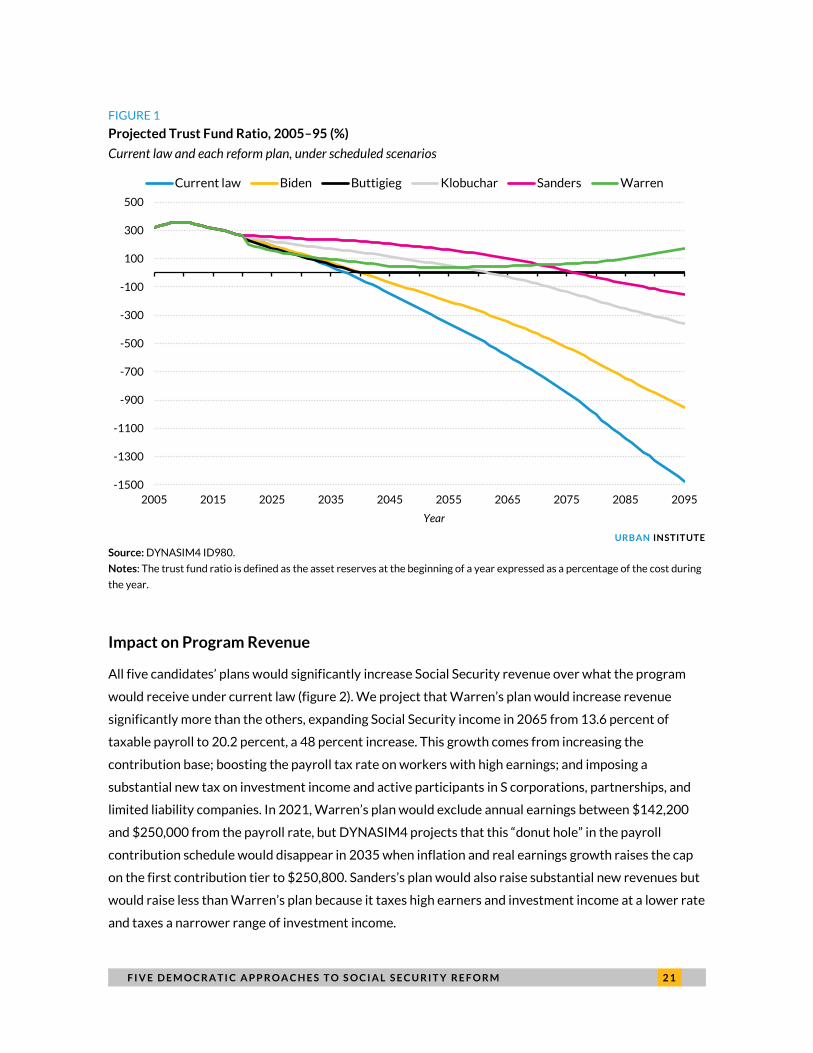
Impact on Program Revenue
All five candidates’ plans would significantly increase Social Security revenue over what the program
would receive under current law (figure 2). We project that Warren’s plan would increase revenue
significantly more than the others, expanding Social Security income in 2065 from 13.6 percent of
taxable payroll to 20.2 percent, a 48 percent increase. This growth comes from increasing the
contribution base; boosting the payroll tax rate on workers with high earnings; and imposing a
substantial new tax on investment income and active participants in S corporations, partnerships, and
limited liability companies. In 2021, Warren’s plan would exclude annual earnings between $142,200
and $250,000 from the payroll rate, but DYNASIM4 projects that this “donut hole” in the payroll
contribution schedule would disappear in 2035 when inflation and real earnings growth raises the cap
on the first contribution tier to $250,800. Sanders’s plan would also raise substantial new revenues but
would raise less than Warren’s plan because it taxes high earners and investment income at a lower rate
and taxes a narrower range of investment income.
-1500
-1300
-1100
-900
-700
-500
-300
-100
100
300
500
2005 2015 2025 2035 2045 2055 2065 2075 2085 2095
Current law Biden Buttigieg Klobuchar Sanders Warren
Year
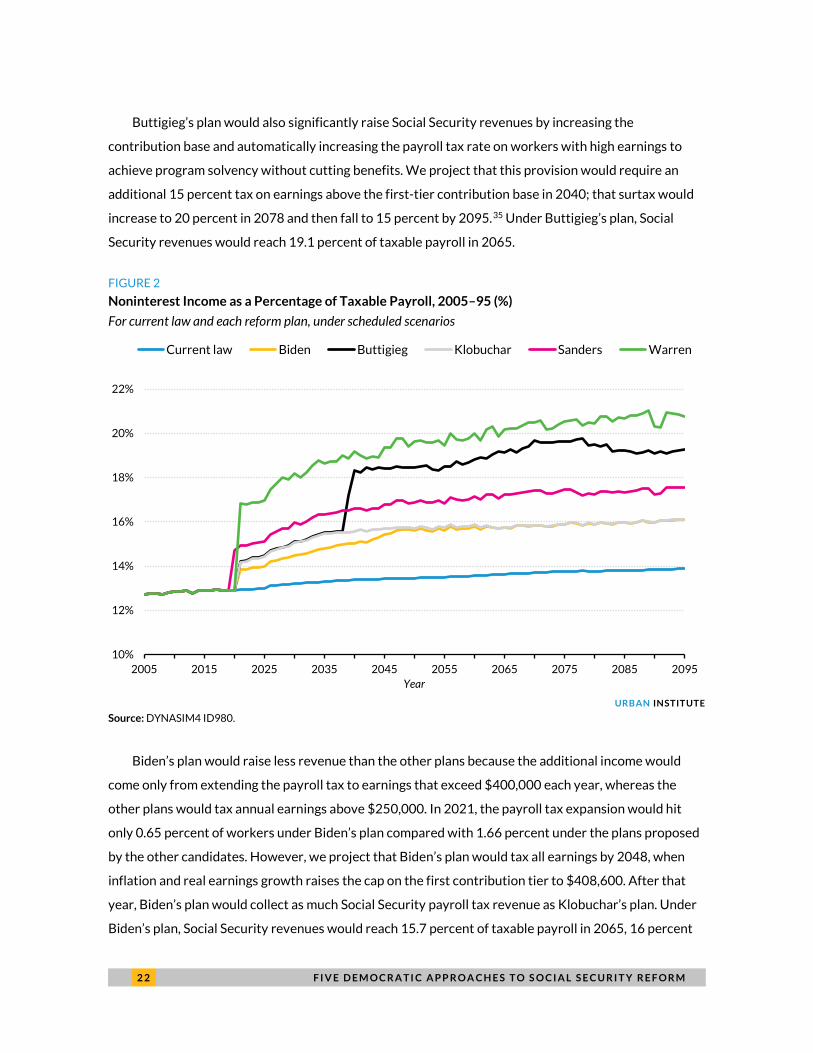
2 2 F I V E D E M O C R A T I C A P P R O A C H E S T O S O C I A L S E C U R I T Y R E F O R M
Buttigieg’s plan would also significantly raise Social Security revenues by increasing the
contribution base and automatically increasing the payroll tax rate on workers with high earnings to
achieve program solvency without cutting benefits. We project that this provision would require an
additional 15 percent tax on earnings above the first-tier contribution base in 2040; that surtax would
increase to 20 percent in 2078 and then fall to 15 percent by 2095.35 Under Buttigieg’s plan, Social
Security revenues would reach 19.1 percent of taxable payroll in 2065.
FIGURE 2
Noninterest Income as a Percentage of Taxable Payroll, 2005–95 (%)
For current law and each reform plan, under scheduled scenarios
URBAN INSTITUTE
Source: DYNASIM4 ID980.
Biden’s plan would raise less revenue than the other plans because the additional income would
come only from extending the payroll tax to earnings that exceed $400,000 each year, whereas the
other plans would tax annual earnings above $250,000. In 2021, the payroll tax expansion would hit
only 0.65 percent of workers under Biden’s plan compared with 1.66 percent under the plans proposed
by the other candidates. However, we project that Biden’s plan would tax all earnings by 2048, when
inflation and real earnings growth raises the cap on the first contribution tier to $408,600. After that
year, Biden’s plan would collect as much Social Security payroll tax revenue as Klobuchar’s plan. Under
Biden’s plan, Social Security revenues would reach 15.7 percent of taxable payroll in 2065, 16 percent
10%
12%
14%
16%
18%
20%
22%
2005 2015 2025 2035 2045 2055 2065 2075 2085 2095
Current law Biden Buttigieg Klobuchar Sanders Warren
Year
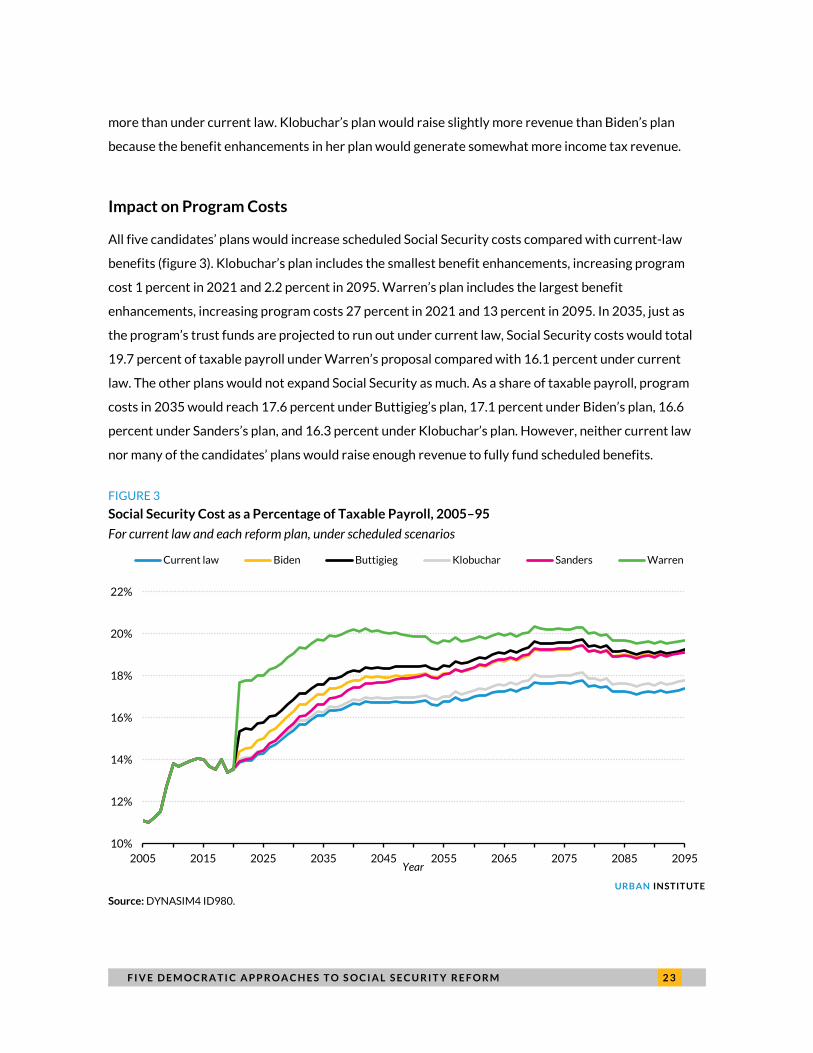
F I V E D E M O C R A T I C A P P R O A C H E S T O S O C I A L S E C U R I T Y R E F O R M 2 3
more than under current law. Klobuchar’s plan would raise slightly more revenue than Biden’s plan
because the benefit enhancements in her plan would generate somewhat more income tax revenue.
Impact on Program Costs
All five candidates’ plans would increase scheduled Social Security costs compared with current-law
benefits (figure 3). Klobuchar’s plan includes the smallest benefit enhancements, increasing program
cost 1 percent in 2021 and 2.2 percent in 2095. Warren’s plan includes the largest benefit
enhancements, increasing program costs 27 percent in 2021 and 13 percent in 2095. In 2035, just as
the program’s trust funds are projected to run out under current law, Social Security costs would total
19.7 percent of taxable payroll under Warren’s proposal compared with 16.1 percent under current
law. The other plans would not expand Social Security as much. As a share of taxable payroll, program
costs in 2035 would reach 17.6 percent under Buttigieg’s plan, 17.1 percent under Biden’s plan, 16.6
percent under Sanders’s plan, and 16.3 percent under Klobuchar’s plan. However, neither current law
nor many of the candidates’ plans would raise enough revenue to fully fund scheduled benefits.
FIGURE 3
Social Security Cost as a Percentage of Taxable Payroll, 2005–95
For current law and each reform plan, under scheduled scenarios
URBAN INSTITUTE Source: DYNASIM4 ID980.
10%
12%
14%
16%
18%
20%
22%
2005 2015 2025 2035 2045 2055 2065 2075 2085 2095
Current law Biden Buttigieg Klobuchar Sanders Warren
Year
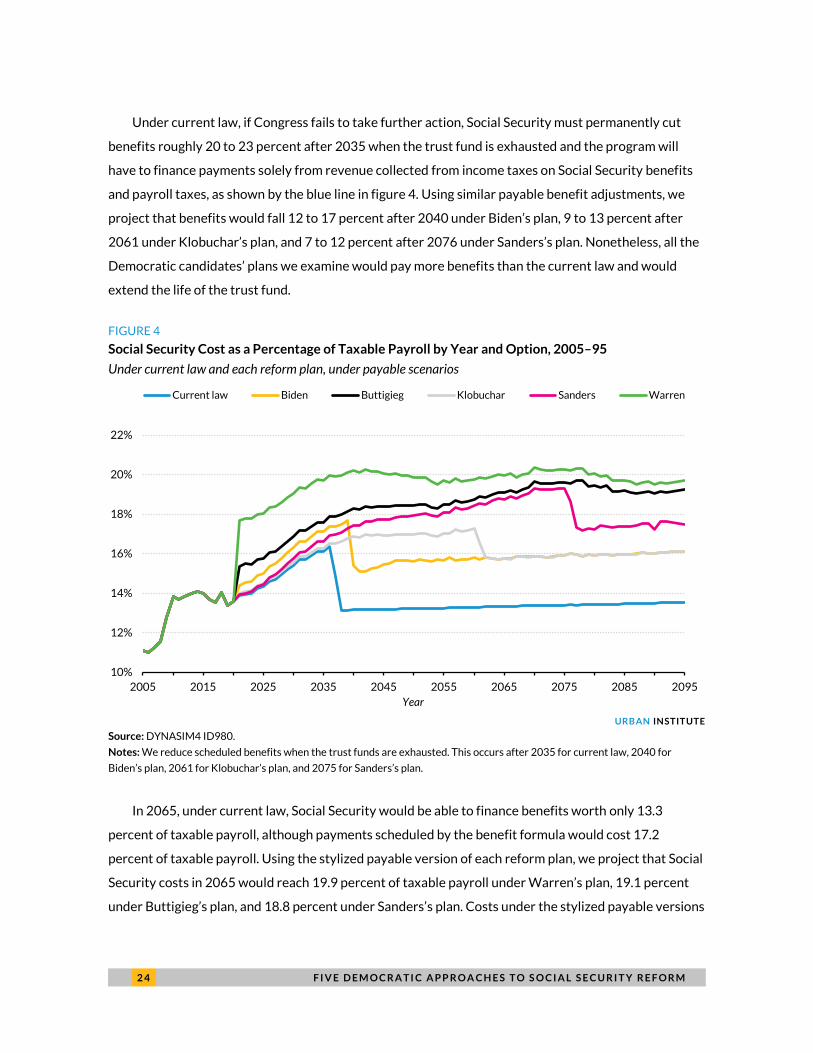
2 4 F I V E D E M O C R A T I C A P P R O A C H E S T O S O C I A L S E C U R I T Y R E F O R M
Under current law, if Congress fails to take further action, Social Security must permanently cut
benefits roughly 20 to 23 percent after 2035 when the trust fund is exhausted and the program will
have to finance payments solely from revenue collected from income taxes on Social Security benefits
and payroll taxes, as shown by the blue line in figure 4. Using similar payable benefit adjustments, we
project that benefits would fall 12 to 17 percent after 2040 under Biden’s plan, 9 to 13 percent after
2061 under Klobuchar’s plan, and 7 to 12 percent after 2076 under Sanders’s plan. Nonetheless, all the
Democratic candidates’ plans we examine would pay more benefits than the current law and would
extend the life of the trust fund.
FIGURE 4
Social Security Cost as a Percentage of Taxable Payroll by Year and Option, 2005–95
Under current law and each reform plan, under payable scenarios
URBAN INSTITUTE Source: DYNASIM4 ID980.
Notes: We reduce scheduled benefits when the trust funds are exhausted. This occurs after 2035 for current law, 2040 for
Biden’s plan, 2061 for Klobuchar’s plan, and 2075 for Sanders’s plan.
In 2065, under current law, Social Security would be able to finance benefits worth only 13.3
percent of taxable payroll, although payments scheduled by the benefit formula would cost 17.2
percent of taxable payroll. Using the stylized payable version of each reform plan, we project that Social
Security costs in 2065 would reach 19.9 percent of taxable payroll under Warren’s plan, 19.1 percent
under Buttigieg’s plan, and 18.8 percent under Sanders’s plan. Costs under the stylized payable versions
10%
12%
14%
16%
18%
20%
22%
2005 2015 2025 2035 2045 2055 2065 2075 2085 2095
Current law Biden Buttigieg Klobuchar Sanders Warren
Year
F I V E D E M O C R A T I C A P P R O A C H E S T O S O C I A L S E C U R I T Y R E F O R M 2 5
of Biden’s and Klobuchar’s plans would fall to 15.8 percent of taxable payroll in 2065, because neither
plan extends solvency to 2065, forcing benefit cuts without further Congressional action. Nonetheless,
Social Security would be able to finance more benefits under these plans than under current law. The
following sections describe the cost components of each plan.
INCREASE THE MINIMUM BENEFIT
Increasing the minimum benefit is the most expensive item in Buttigieg’s and Warren’s plans. We
project that, if enacted alone, this change would reduce Social Security’s long-term actuarial balance by
1.0 percent of taxable payroll. Biden’s and Sanders’s plans would also increase the minimum benefit, but
their minimum benefit would cost less than one-third as much over the next 75 years because they
would only provide this additional payment to new beneficiaries, not people already collecting.
Buttigieg’s and Warren’s minimum-benefit provision would increase Social Security benefits for 36
percent of all beneficiaries in 2025, including 46 percent of beneficiaries in the bottom benefit quintile.
It would increase benefits for 46 percent of women and 85 percent of beneficiaries age 85 and older.
The provision would increase Social Security payments 36 percent for beneficiaries who receive the
minimum benefit and reduce the poverty rate for beneficiaries by 2.3 percentage points.
Biden’s and Sanders’s minimum-benefit provision would increase Social Security benefits for only 2
percent of beneficiaries in 2025 because it would cover only those beneficiaries who recently began
collecting, and it would reduce the poverty rate for beneficiaries by less than 1 percentage point. By
2065, when the minimum benefit would cover most beneficiaries, 14 percent would receive the
minimum benefit, including 43 percent of those in the bottom benefit quintile. However, the impact on
the poverty rate would still be small that year, because the share of beneficiaries projected to have
incomes below the FPL declines over time as productivity growth raises average earnings and Social
Security benefits. Compared with benefits scheduled under current law, in 2065 Biden’s and Sanders’s
minimum-benefit provision would reduce poverty 0.3 percentage points. However, their provision
would raise lifetime benefits more for beneficiaries in the bottom fifth of the lifetime earnings
distribution than Buttigieg’s and Warren’s provision, because Biden and Sanders would index the
minimum benefit to average wage growth rather than the growth in prices.
Although the minimum-benefit provisions would target workers with long employment histories,
they would also increase benefits for spouses and survivors with few or no work years. Some of the
biggest gains in Buttigieg’s and Warren’s proposals would go to spouses and widows with few work
years who were married to workers employed for 30 or more years.
2 6 F I V E D E M O C R A T I C A P P R O A C H E S T O S O C I A L S E C U R I T Y R E F O R M
PROVIDE A MONTHLY $200 BONUS
The second most expensive component of Warren’s plan is the provision to boost benefits across the
board by $200 a month. We project that, if enacted alone, this bonus would reduce Social Security’s
long-term actuarial balance by 0.76 percent of taxable payroll. In 2025, this provision would increase
average benefits 11 percent (about $1,200 a year in 2018 dollars). The relative impact would be larger
for low-income beneficiaries, with benefits increasing 26 percent for the bottom fifth of beneficiaries
and only 7 percent for the top fifth. In 2025, the extra $200 a month would reduce the poverty rate for
full-year beneficiaries 2.8 percentage points, from 7.3 percent to 4.5 percent.
Because Warren’s plan does not index the $200 monthly bonus for inflation, its buying power
would decline over time. In 2065, it would raise average benefits 3 percent, or $700 per year in 2018
dollars. The largest percentage benefit increase would continue to go to those receiving low benefits,
with beneficiaries in the bottom benefit quintile experiencing a 6 percent benefit increase, compared
with a 2 percent increase for those in the top benefit quintile.
INCREASE THE FIRST BEND POINT IN THE BENEFIT FORMULA
The most expensive component of Sanders’s plan is the provision to gradually increase the first bend
point in the benefit formula 15 percent. We project that, if enacted alone, this provision would reduce
Social Security’s long-term actuarial balance by 0.38 percent of taxable payroll. Under this provision,
the first bend point would increase from $2,035 to $2,340 in 2039. This provision would increase
payments to all beneficiaries whose initial benefits were calculated under the new formula, but benefits
for current beneficiaries would not change. Consequently, only 3 percent of beneficiaries would receive
higher benefits in 2025. Among beneficiaries with a benefit change, average annual benefits in 2025
would increase only $37 (in 2018 dollars). The average benefit hike would be larger for beneficiaries in
the top benefit quintile ($91) and lower for beneficiaries in the bottom benefit quintile ($26).
In 2065, most beneficiaries would receive benefits calculated under the new formula. Compared
with 2065 scheduled benefits, the average Social Security benefit would increase about 4 percent, or
$1,157 in 2018 dollars, under this provision. The absolute benefit increase would be larger for
beneficiaries in the top benefit quintile ($1,391 in 2018 dollars) than for beneficiaries in the bottom
quintile ($814), but the percentage increase would be smaller for top-quintile beneficiaries (3 percent
versus 6 percent).
F I V E D E M O C R A T I C A P P R O A C H E S T O S O C I A L S E C U R I T Y R E F O R M 2 7
INCREASE THE COST-OF-LIVING ADJUSTMENT
Three of the candidates propose increasing the COLA by tying it to changes in the CPI-E (the price index
for elderly consumers) instead of the CPI-W (the index for workers). We project that this provision,
included in Biden’s, Sanders’s, and Warren’s plans, would on its own reduce Social Security’s long-term
actuarial balance by 0.37 percent of taxable payroll.
Because the COLA cumulates over time, the impact of the COLA increase would most affect long-
term beneficiaries. Compared with 2065 scheduled benefits, we project that this change would increase
average benefits among beneficiaries age 85 and older 5.7 percent, or $1,625 in 2018 dollars. Widows
would also experience substantial gains, with their 2065 average benefits increasing 4.5 percent, or
$1,364 in 2018 dollars.
INCREASE PAYMENTS TO LONG-TERM BENEFICIARIES
The provision in Biden’s plan to increase payments to beneficiaries who have been collecting for at least
20 years would reduce Social Security’s long-term actuarial balance by 0.19 percent of payroll if
enacted alone. We project that 39 percent of beneficiaries would get a benefit increase in 2025 under
this provision, with an average increase of 3 percent ($483 a year in 2018 dollars). Nearly all
beneficiaries age 80 and older would receive a benefit increase, along with many younger beneficiaries
who first became entitled as disabled workers. We estimate that the size of the increase would be
similar across different income, earnings, marital status, education, and racial groups. The benefit
increase would be too small to lift many long-term beneficiaries out of poverty, reducing poverty rates
among people age 85 and older by less than 1 percentage point in 2025.
PROVIDE SOCIAL SECURITY CREDITS TO CAREGIVERS
Providing Social Security credits to workers who care for children, people with disabilities, and older
family members is an important cost driver in the Social Security reform plans proposed by Biden,
Klobuchar, Warren, and especially Buttigieg. Buttigieg’s caregiver provision is the most expensive, costing
0.51 percent of taxable payroll over 75 years, because all caregivers of children under 18 could qualify and
the credit would equal 100 percent of average earnings, which is much higher than median earnings.
Warren’s caregiver provision would cost only 0.30 percent of taxable payroll because it would not cover
workers caring for children age 6 and older. Klobuchar’s caregiver provision, which also restricts child
caregivers to those with children under age 6 but limits credits to 50 percent of the average earnings,
which is lower than median earnings, would cost only 0.12 percent of taxable payroll. Biden’s caregiver
provision restricts child caregivers to those with children under age 12 and provides a credit equal to 50
percent of the average earnings, but it reduces the credit amount by 50 cents for each dollar earned (less
2 8 F I V E D E M O C R A T I C A P P R O A C H E S T O S O C I A L S E C U R I T Y R E F O R M
than the dollar-for-dollar earnings offset in the other caregiver provisions). Biden’s caregiver provision
would cost only 0.12 percent of taxable payroll over 75 years because his plan allows only five caregiver
credit years that are not limited in the other caregiver plans.
A caregiver credit that does not retroactively credit workers for past care would not significantly
increase average Social Security benefits until years after being introduced, because workers are often
decades away from retirement when they are caring for young children. We project that the share of
beneficiaries who would gain from caregiver credits under Buttigieg’s plan, which is the most expansive,
would increase from 2 percent in 2025 to 45 percent in 2065. In 2065, 36 percent would benefit from
Biden’s caregiving credits, 33 percent of beneficiaries would benefit from Warren’s caregiving credits,
and 27 percent would benefit from Klobuchar’s caregiver credits. Although Warren’s and Klobuchar’s
plans use the same eligibility criteria for caregiver credits, the smaller credit in Klobuchar’s plan would
reduce its reach by limiting the number of caregivers who would replace an employment year in the
AIME calculation with a caregiver credit year.
The caregiver credit would especially help families that include a worker with a disability. Workers
with a disability often experience lost wages, receive lower-than-average earnings, and are more likely
than better-abled adults to work intermittently. As a result, they often earn only limited Social Security
benefits based on their own earnings and often rely on spousal and survivor benefits in old age.
Moreover, many of their spouses must reduce their work hours to provide care. In addition to
increasing Social Security benefits for caregivers, caregiver credits would also increase the spousal,
survivor, and family benefits paid to caregivers’ disabled spouses and dependent children.
Beneficiaries in the bottom benefit quintile would gain most from the caregiver credit because
credits are tied to the average wage. Compared with 2065 benefits scheduled under current law, the
credit in Buttigieg’s plan would increase caregivers’ average benefits 50 percent (or $5,590 in 2018
dollars) for beneficiaries in the bottom benefit quintile, compared with 1 percent (or $465) for
beneficiaries in the top benefit quintile. Female beneficiaries would gain 17 percent on average; male
beneficiaries would gain 8 percent. Beneficiaries who collect disability benefits would gain 26 percent
on average. Patterns would be similar for Biden’s, Klobuchar’s, and Warren’s plans, although gains
under theirs would be smaller.
INCREASE SURVIVOR BENEFITS
Increasing Social Security’s survivor benefits for two-earner couples, part of Biden’s, Klobuchar’s, and
Warren’s plans, would modestly raise program costs, reducing Social Security’s long-term actuarial
balance by 0.12 percent of taxable payroll.
F I V E D E M O C R A T I C A P P R O A C H E S T O S O C I A L S E C U R I T Y R E F O R M 2 9
This provision would benefit only beneficiaries with a qualifying marriage, including surviving
spouses and surviving divorced spouses whose marriage lasted at least 10 years. In 2025, this provision
would increase benefits for 31 percent of widowed beneficiaries and 5 percent of divorced
beneficiaries. Among those who would gain, average benefits would increase 15 percent overall ($2,560
a year in 2018 dollars); benefits for bottom-quintile beneficiaries would increase 21 percent, while
benefits for top-quintile beneficiaries would increase 12 percent. The probability of benefiting from this
provision increases with age as widowhood becomes more likely. Because widowhood generally occurs
near the end of life, the benefit increase would not generally last long. Increasing survivor benefits
would reduce poverty rates by less than 1 percentage point in 2025.
REPEAL THE WINFALL ELIMINATION PROVISION AND GOVERNMENT PENSION OFFSET
Both Biden’s and Warren’s plans would repeal the WEP and GPO (provisions that reduce Social Security
payments to certain retired government employees) at a projected 75-year cost of 0.15 percent of taxable
payroll. Although these provisions affect relatively few beneficiaries, they often substantially reduce
Social Security benefits for those affected. We estimate that in 2025, eliminating the WEP and GPO would
increase Social Security benefits for 4.5 percent of beneficiaries and that the annual increase for those
affected would average about $7,300 (in 2018 dollars). Affected beneficiaries in the bottom fifth of the
lifetime earnings quintile would receive an additional $3,600 annually; those in the top fifth of the lifetime
earnings quintile would receive an additional $8,900 annually.
The share of beneficiaries affected by the WEP and GPO will decline over time because the 1983
Social Security reforms expanded Social Security coverage to include all newly hired federal
government workers (Social Security Administration 1984). We project that repealing the WEP and
GPO will affect only 2 percent of beneficiaries in 2065, compared with benefits scheduled under
current law. Affected beneficiaries will gain about $6,900 (in 2018 dollars). As in earlier years, high
earners would gain more from this provision than low earners.
Beneficiaries affected by the WEP and GPO have access to employer-provided pensions through
their government employment, and most worked for many years. These workers and their families
typically have incomes above the FPL, so repealing the WEP and GPO would not materially affect the
poverty rate.
ADD STUDENT BENEFITS
Sanders’s and Warren’s plans would expand Social Security benefits to students older than age 18.
Sanders’s provision, which extends benefits to dependent full-time students as old as 22, would cost
about 0.05 percent of taxable payroll over 75 years if enacted alone. Warren’s provision, which extends
benefits to age 24, would cost about 0.06 percent of taxable payroll.
3 0 F I V E D E M O C R A T I C A P P R O A C H E S T O S O C I A L S E C U R I T Y R E F O R M
We estimate that expanding benefits to full-time students through age 22 would add about
400,000 beneficiaries to Social Security’s rolls in 2021, an 8.4 percent increase in child beneficiaries,
and cost $3.7 billion, an 8 percent increase in child benefits. Expanding benefits through age 24 would
add about 553,000 student beneficiaries in 2021 and cost $5.1 billion. It would increase incomes most
for families with a disabled worker beneficiary, because they are more likely than families with an aged
beneficiary to have college-age children. Because Black workers are more likely than white workers to
be disabled or widowed at younger ages, Black families would disproportionately benefit from this
policy. Because people are more likely to attend college if their parents attended, well-educated
beneficiaries would be more likely than less-educated beneficiaries to collect child benefits for their
dependent students.
EXPAND SURVIVOR BENEFITS FOR PEOPLE WITH DISABILITIES
If enacted alone, Warren’s plan’s provision to remove the minimum age and early reduction factors for
survivor benefits to people with disabilities would reduce Social Security’s long-term actuarial balance
by about 0.03 percent of taxable payroll. We project that disabled widow beneficiaries would account
for about 1 percent of all Social Security beneficiaries in 2025 and that Warren’s plan would increase
their average annual benefits by about $4,100 that year, a 25 percent increase. The percentage benefit
increase would be larger for beneficiaries in the lowest benefit quintile (37 percent) than for
beneficiaries in the highest benefit quintile (16 percent). Although the option affects relatively few
beneficiaries, it represents a sizeable increase in benefits for this low-benefit group.
PROVIDE JOB-TRAINING BENEFITS
Warren’s proposal would exclude up to three years spent in job training and apprenticeship programs
from a worker’s AIME calculation. This adjustment would raise participants’ future Social Security
benefits by excluding some zero-earnings years from the AIME calculation.36 Because Warren’s
provision would not provide any immediate financial incentive to receive training, we assume that her
plan would not significantly increase training. For workers participating in training programs, we
subtract up to three years of earnings from their AIME calculation.
We project that if enacted alone, Warren’s training benefit would reduce Social Security’s long-
term actuarial balance by 0.02 percent of taxable payroll. Because training is more common at younger
ages and the benefit would not be available to current beneficiaries, its impact on Social Security
benefits accrues slowly. Compared with current-law-scheduled benefits, we project that 4 percent of
Social Security beneficiaries would have greater benefits in 2055 and 8 percent would have greater
benefits in 2065. In 2065, the average annual Social Security benefit increase for people with a change
would be about $735 (in 2018 dollars), a 3 percent increase in benefits. The gains are similar across
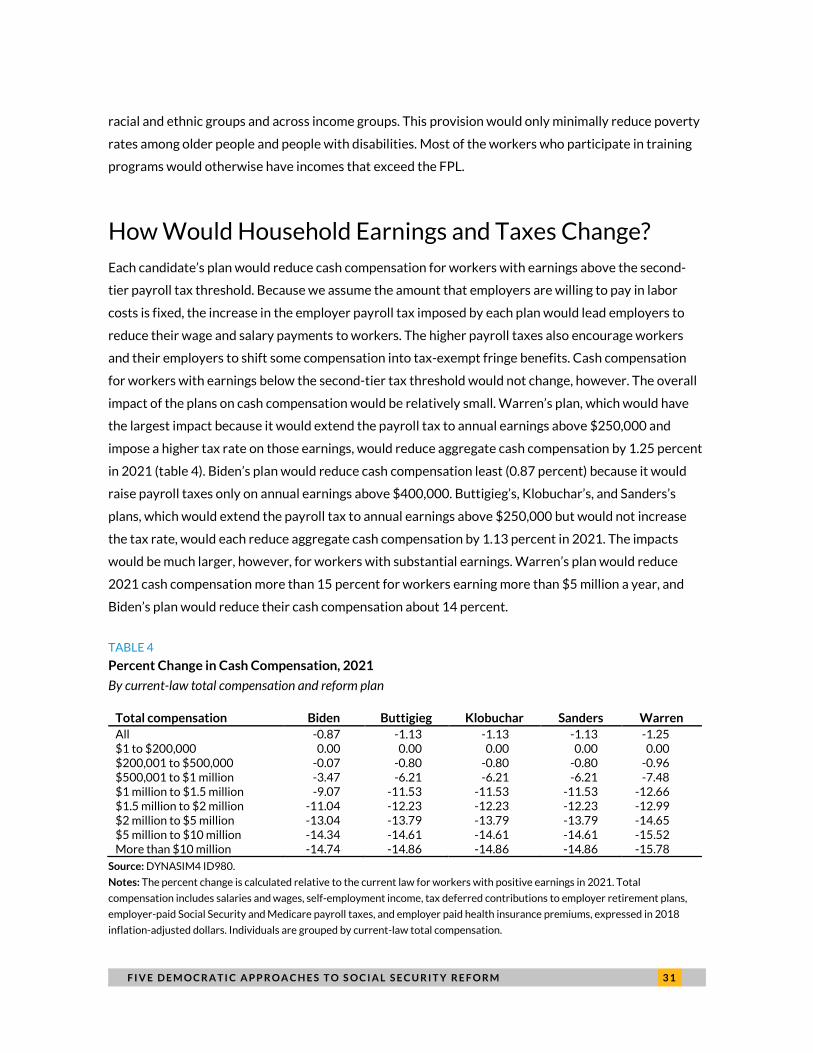
F I V E D E M O C R A T I C A P P R O A C H E S T O S O C I A L S E C U R I T Y R E F O R M 3 1
racial and ethnic groups and across income groups. This provision would only minimally reduce poverty
rates among older people and people with disabilities. Most of the workers who participate in training
programs would otherwise have incomes that exceed the FPL.
How Would Household Earnings and Taxes Change? Each candidate’s plan would reduce cash compensation for workers with earnings above the second-
tier payroll tax threshold. Because we assume the amount that employers are willing to pay in labor
costs is fixed, the increase in the employer payroll tax imposed by each plan would lead employers to
reduce their wage and salary payments to workers. The higher payroll taxes also encourage workers
and their employers to shift some compensation into tax-exempt fringe benefits. Cash compensation
for workers with earnings below the second-tier tax threshold would not change, however. The overall
impact of the plans on cash compensation would be relatively small. Warren’s plan, which would have
the largest impact because it would extend the payroll tax to annual earnings above $250,000 and
impose a higher tax rate on those earnings, would reduce aggregate cash compensation by 1.25 percent
in 2021 (table 4). Biden’s plan would reduce cash compensation least (0.87 percent) because it would
raise payroll taxes only on annual earnings above $400,000. Buttigieg’s, Klobuchar’s, and Sanders’s
plans, which would extend the payroll tax to annual earnings above $250,000 but would not increase
the tax rate, would each reduce aggregate cash compensation by 1.13 percent in 2021. The impacts
would be much larger, however, for workers with substantial earnings. Warren’s plan would reduce
2021 cash compensation more than 15 percent for workers earning more than $5 million a year, and
Biden’s plan would reduce their cash compensation about 14 percent.
TABLE 4
Percent Change in Cash Compensation, 2021
By current-law total compensation and reform plan
Total compensation Biden Buttigieg Klobuchar Sanders Warren All -0.87 -1.13 -1.13 -1.13 -1.25 $1 to $200,000 0.00 0.00 0.00 0.00 0.00 $200,001 to $500,000 -0.07 -0.80 -0.80 -0.80 -0.96 $500,001 to $1 million -3.47 -6.21 -6.21 -6.21 -7.48 $1 million to $1.5 million -9.07 -11.53 -11.53 -11.53 -12.66 $1.5 million to $2 million -11.04 -12.23 -12.23 -12.23 -12.99 $2 million to $5 million -13.04 -13.79 -13.79 -13.79 -14.65 $5 million to $10 million -14.34 -14.61 -14.61 -14.61 -15.52 More than $10 million -14.74 -14.86 -14.86 -14.86 -15.78
Source: DYNASIM4 ID980.
Notes: The percent change is calculated relative to the current law for workers with positive earnings in 2021. Total
compensation includes salaries and wages, self-employment income, tax deferred contributions to employer retirement plans,
employer-paid Social Security and Medicare payroll taxes, and employer paid health insurance premiums, expressed in 2018
inflation-adjusted dollars. Individuals are grouped by current-law total compensation.
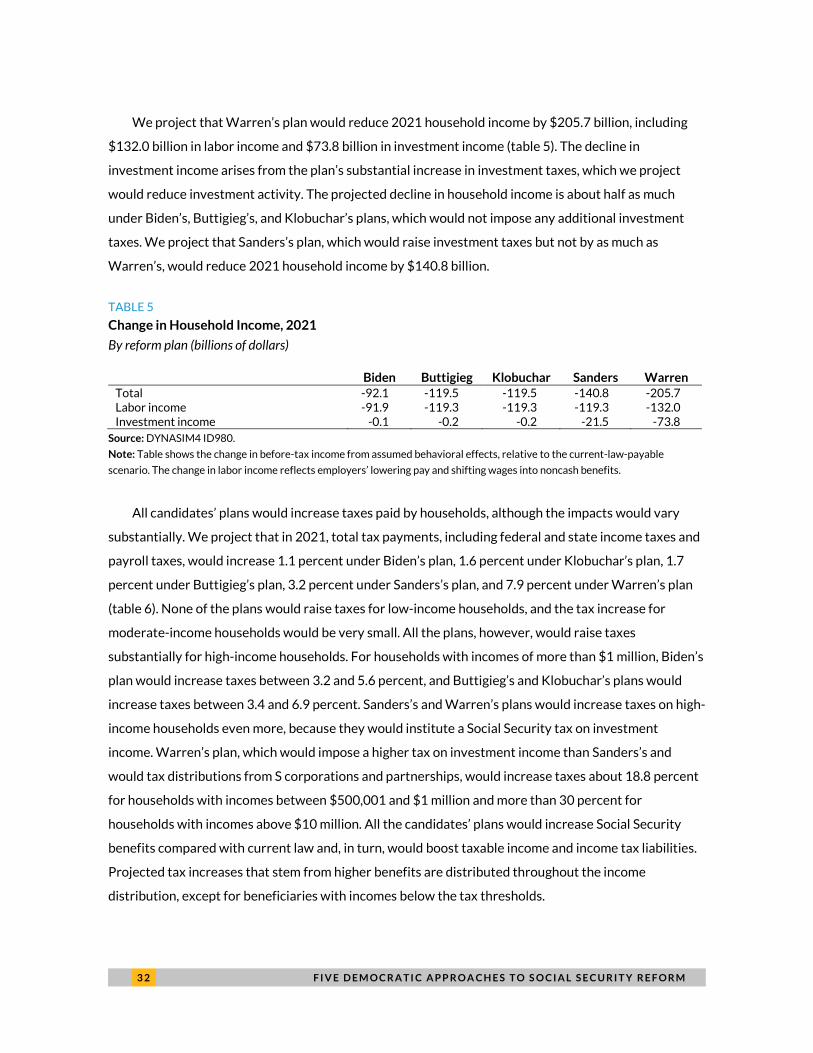
3 2 F I V E D E M O C R A T I C A P P R O A C H E S T O S O C I A L S E C U R I T Y R E F O R M
We project that Warren’s plan would reduce 2021 household income by $205.7 billion, including
$132.0 billion in labor income and $73.8 billion in investment income (table 5). The decline in
investment income arises from the plan’s substantial increase in investment taxes, which we project
would reduce investment activity. The projected decline in household income is about half as much
under Biden’s, Buttigieg’s, and Klobuchar’s plans, which would not impose any additional investment
taxes. We project that Sanders’s plan, which would raise investment taxes but not by as much as
Warren’s, would reduce 2021 household income by $140.8 billion.
TABLE 5
Change in Household Income, 2021
By reform plan (billions of dollars)
Biden Buttigieg Klobuchar Sanders Warren Total -92.1 -119.5 -119.5 -140.8 -205.7 Labor income -91.9 -119.3 -119.3 -119.3 -132.0 Investment income -0.1 -0.2 -0.2 -21.5 -73.8
Source: DYNASIM4 ID980.
Note: Table shows the change in before-tax income from assumed behavioral effects, relative to the current-law-payable
scenario. The change in labor income reflects employers’ lowering pay and shifting wages into noncash benefits.
All candidates’ plans would increase taxes paid by households, although the impacts would vary
substantially. We project that in 2021, total tax payments, including federal and state income taxes and
payroll taxes, would increase 1.1 percent under Biden’s plan, 1.6 percent under Klobuchar’s plan, 1.7
percent under Buttigieg’s plan, 3.2 percent under Sanders’s plan, and 7.9 percent under Warren’s plan
(table 6). None of the plans would raise taxes for low-income households, and the tax increase for
moderate-income households would be very small. All the plans, however, would raise taxes
substantially for high-income households. For households with incomes of more than $1 million, Biden’s
plan would increase taxes between 3.2 and 5.6 percent, and Buttigieg’s and Klobuchar’s plans would
increase taxes between 3.4 and 6.9 percent. Sanders’s and Warren’s plans would increase taxes on high-
income households even more, because they would institute a Social Security tax on investment
income. Warren’s plan, which would impose a higher tax on investment income than Sanders’s and
would tax distributions from S corporations and partnerships, would increase taxes about 18.8 percent
for households with incomes between $500,001 and $1 million and more than 30 percent for
households with incomes above $10 million. All the candidates’ plans would increase Social Security
benefits compared with current law and, in turn, would boost taxable income and income tax liabilities.
Projected tax increases that stem from higher benefits are distributed throughout the income
distribution, except for beneficiaries with incomes below the tax thresholds.
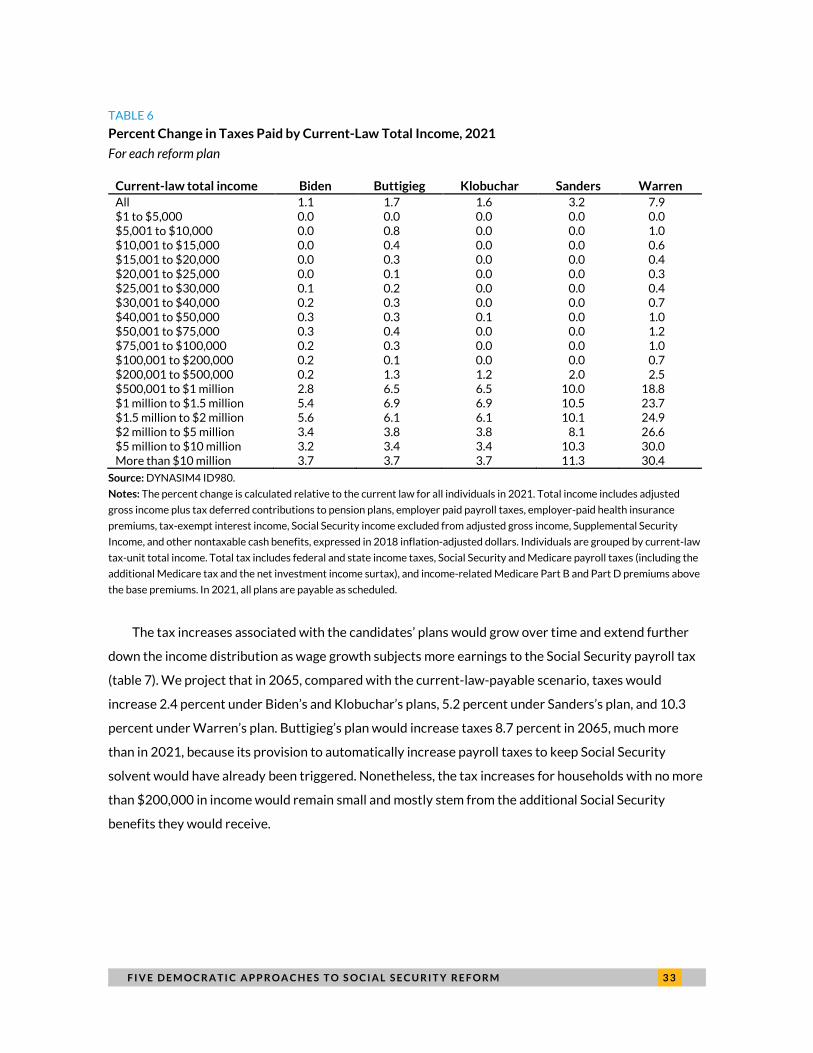
F I V E D E M O C R A T I C A P P R O A C H E S T O S O C I A L S E C U R I T Y R E F O R M 3 3
TABLE 6
Percent Change in Taxes Paid by Current-Law Total Income, 2021
For each reform plan
Current-law total income Biden Buttigieg Klobuchar Sanders Warren All 1.1 1.7 1.6 3.2 7.9 $1 to $5,000 0.0 0.0 0.0 0.0 0.0 $5,001 to $10,000 0.0 0.8 0.0 0.0 1.0 $10,001 to $15,000 0.0 0.4 0.0 0.0 0.6 $15,001 to $20,000 0.0 0.3 0.0 0.0 0.4 $20,001 to $25,000 0.0 0.1 0.0 0.0 0.3 $25,001 to $30,000 0.1 0.2 0.0 0.0 0.4 $30,001 to $40,000 0.2 0.3 0.0 0.0 0.7 $40,001 to $50,000 0.3 0.3 0.1 0.0 1.0 $50,001 to $75,000 0.3 0.4 0.0 0.0 1.2 $75,001 to $100,000 0.2 0.3 0.0 0.0 1.0 $100,001 to $200,000 0.2 0.1 0.0 0.0 0.7 $200,001 to $500,000 0.2 1.3 1.2 2.0 2.5 $500,001 to $1 million 2.8 6.5 6.5 10.0 18.8 $1 million to $1.5 million 5.4 6.9 6.9 10.5 23.7 $1.5 million to $2 million 5.6 6.1 6.1 10.1 24.9 $2 million to $5 million 3.4 3.8 3.8 8.1 26.6 $5 million to $10 million 3.2 3.4 3.4 10.3 30.0 More than $10 million 3.7 3.7 3.7 11.3 30.4
Source: DYNASIM4 ID980.
Notes: The percent change is calculated relative to the current law for all individuals in 2021. Total income includes adjusted
gross income plus tax deferred contributions to pension plans, employer paid payroll taxes, employer-paid health insurance
premiums, tax-exempt interest income, Social Security income excluded from adjusted gross income, Supplemental Security
Income, and other nontaxable cash benefits, expressed in 2018 inflation-adjusted dollars. Individuals are grouped by current-law
tax-unit total income. Total tax includes federal and state income taxes, Social Security and Medicare payroll taxes (including the
additional Medicare tax and the net investment income surtax), and income-related Medicare Part B and Part D premiums above
the base premiums. In 2021, all plans are payable as scheduled.
The tax increases associated with the candidates’ plans would grow over time and extend further
down the income distribution as wage growth subjects more earnings to the Social Security payroll tax
(table 7). We project that in 2065, compared with the current-law-payable scenario, taxes would
increase 2.4 percent under Biden’s and Klobuchar’s plans, 5.2 percent under Sanders’s plan, and 10.3
percent under Warren’s plan. Buttigieg’s plan would increase taxes 8.7 percent in 2065, much more
than in 2021, because its provision to automatically increase payroll taxes to keep Social Security
solvent would have already been triggered. Nonetheless, the tax increases for households with no more
than $200,000 in income would remain small and mostly stem from the additional Social Security
benefits they would receive.
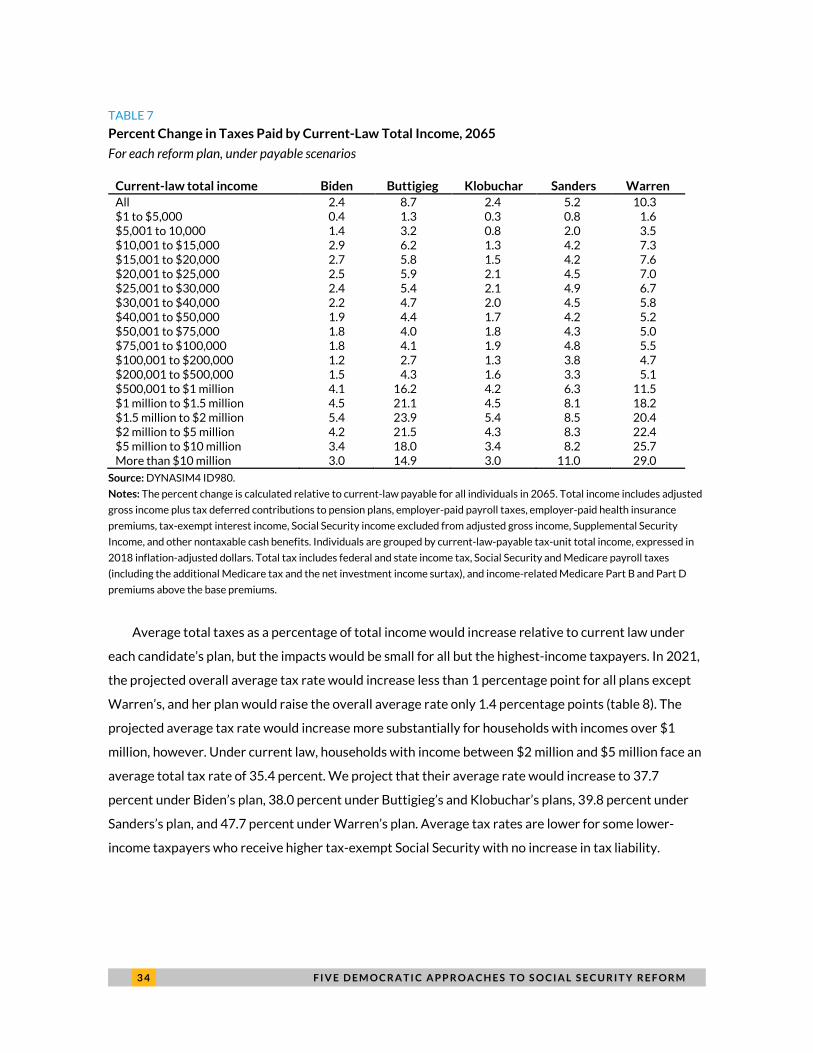
3 4 F I V E D E M O C R A T I C A P P R O A C H E S T O S O C I A L S E C U R I T Y R E F O R M
TABLE 7
Percent Change in Taxes Paid by Current-Law Total Income, 2065
For each reform plan, under payable scenarios
Current-law total income Biden Buttigieg Klobuchar Sanders Warren All 2.4 8.7 2.4 5.2 10.3 $1 to $5,000 0.4 1.3 0.3 0.8 1.6 $5,001 to 10,000 1.4 3.2 0.8 2.0 3.5 $10,001 to $15,000 2.9 6.2 1.3 4.2 7.3 $15,001 to $20,000 2.7 5.8 1.5 4.2 7.6 $20,001 to $25,000 2.5 5.9 2.1 4.5 7.0 $25,001 to $30,000 2.4 5.4 2.1 4.9 6.7 $30,001 to $40,000 2.2 4.7 2.0 4.5 5.8 $40,001 to $50,000 1.9 4.4 1.7 4.2 5.2 $50,001 to $75,000 1.8 4.0 1.8 4.3 5.0 $75,001 to $100,000 1.8 4.1 1.9 4.8 5.5 $100,001 to $200,000 1.2 2.7 1.3 3.8 4.7 $200,001 to $500,000 1.5 4.3 1.6 3.3 5.1 $500,001 to $1 million 4.1 16.2 4.2 6.3 11.5 $1 million to $1.5 million 4.5 21.1 4.5 8.1 18.2 $1.5 million to $2 million 5.4 23.9 5.4 8.5 20.4 $2 million to $5 million 4.2 21.5 4.3 8.3 22.4 $5 million to $10 million 3.4 18.0 3.4 8.2 25.7 More than $10 million 3.0 14.9 3.0 11.0 29.0
Source: DYNASIM4 ID980.
Notes: The percent change is calculated relative to current-law payable for all individuals in 2065. Total income includes adjusted
gross income plus tax deferred contributions to pension plans, employer-paid payroll taxes, employer-paid health insurance
premiums, tax-exempt interest income, Social Security income excluded from adjusted gross income, Supplemental Security
Income, and other nontaxable cash benefits. Individuals are grouped by current-law-payable tax-unit total income, expressed in
2018 inflation-adjusted dollars. Total tax includes federal and state income tax, Social Security and Medicare payroll taxes
(including the additional Medicare tax and the net investment income surtax), and income-related Medicare Part B and Part D
premiums above the base premiums.
Average total taxes as a percentage of total income would increase relative to current law under
each candidate’s plan, but the impacts would be small for all but the highest-income taxpayers. In 2021,
the projected overall average tax rate would increase less than 1 percentage point for all plans except
Warren’s, and her plan would raise the overall average rate only 1.4 percentage points (table 8). The
projected average tax rate would increase more substantially for households with incomes over $1
million, however. Under current law, households with income between $2 million and $5 million face an
average total tax rate of 35.4 percent. We project that their average rate would increase to 37.7
percent under Biden’s plan, 38.0 percent under Buttigieg’s and Klobuchar’s plans, 39.8 percent under
Sanders’s plan, and 47.7 percent under Warren’s plan. Average tax rates are lower for some lower-
income taxpayers who receive higher tax-exempt Social Security with no increase in tax liability.
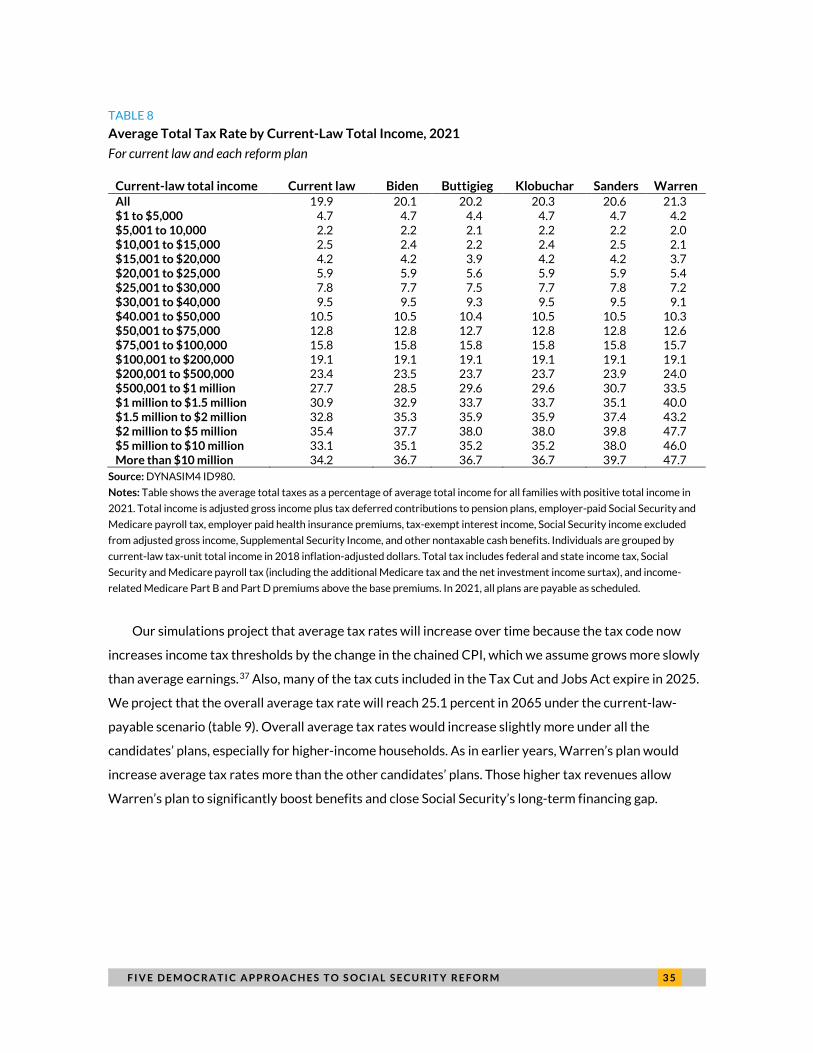
F I V E D E M O C R A T I C A P P R O A C H E S T O S O C I A L S E C U R I T Y R E F O R M 3 5
TABLE 8
Average Total Tax Rate by Current-Law Total Income, 2021
For current law and each reform plan
Current-law total income Current law Biden Buttigieg Klobuchar Sanders Warren All 19.9 20.1 20.2 20.3 20.6 21.3 $1 to $5,000 4.7 4.7 4.4 4.7 4.7 4.2 $5,001 to 10,000 2.2 2.2 2.1 2.2 2.2 2.0 $10,001 to $15,000 2.5 2.4 2.2 2.4 2.5 2.1 $15,001 to $20,000 4.2 4.2 3.9 4.2 4.2 3.7 $20,001 to $25,000 5.9 5.9 5.6 5.9 5.9 5.4 $25,001 to $30,000 7.8 7.7 7.5 7.7 7.8 7.2 $30,001 to $40,000 9.5 9.5 9.3 9.5 9.5 9.1 $40.001 to $50,000 10.5 10.5 10.4 10.5 10.5 10.3 $50,001 to $75,000 12.8 12.8 12.7 12.8 12.8 12.6 $75,001 to $100,000 15.8 15.8 15.8 15.8 15.8 15.7 $100,001 to $200,000 19.1 19.1 19.1 19.1 19.1 19.1 $200,001 to $500,000 23.4 23.5 23.7 23.7 23.9 24.0 $500,001 to $1 million 27.7 28.5 29.6 29.6 30.7 33.5 $1 million to $1.5 million 30.9 32.9 33.7 33.7 35.1 40.0 $1.5 million to $2 million 32.8 35.3 35.9 35.9 37.4 43.2 $2 million to $5 million 35.4 37.7 38.0 38.0 39.8 47.7 $5 million to $10 million 33.1 35.1 35.2 35.2 38.0 46.0 More than $10 million 34.2 36.7 36.7 36.7 39.7 47.7
Source: DYNASIM4 ID980.
Notes: Table shows the average total taxes as a percentage of average total income for all families with positive total income in
2021. Total income is adjusted gross income plus tax deferred contributions to pension plans, employer-paid Social Security and
Medicare payroll tax, employer paid health insurance premiums, tax-exempt interest income, Social Security income excluded
from adjusted gross income, Supplemental Security Income, and other nontaxable cash benefits. Individuals are grouped by
current-law tax-unit total income in 2018 inflation-adjusted dollars. Total tax includes federal and state income tax, Social
Security and Medicare payroll tax (including the additional Medicare tax and the net investment income surtax), and income-
related Medicare Part B and Part D premiums above the base premiums. In 2021, all plans are payable as scheduled.
Our simulations project that average tax rates will increase over time because the tax code now
increases income tax thresholds by the change in the chained CPI, which we assume grows more slowly
than average earnings.37 Also, many of the tax cuts included in the Tax Cut and Jobs Act expire in 2025.
We project that the overall average tax rate will reach 25.1 percent in 2065 under the current-law-
payable scenario (table 9). Overall average tax rates would increase slightly more under all the
candidates’ plans, especially for higher-income households. As in earlier years, Warren’s plan would
increase average tax rates more than the other candidates’ plans. Those higher tax revenues allow
Warren’s plan to significantly boost benefits and close Social Security’s long-term financing gap.
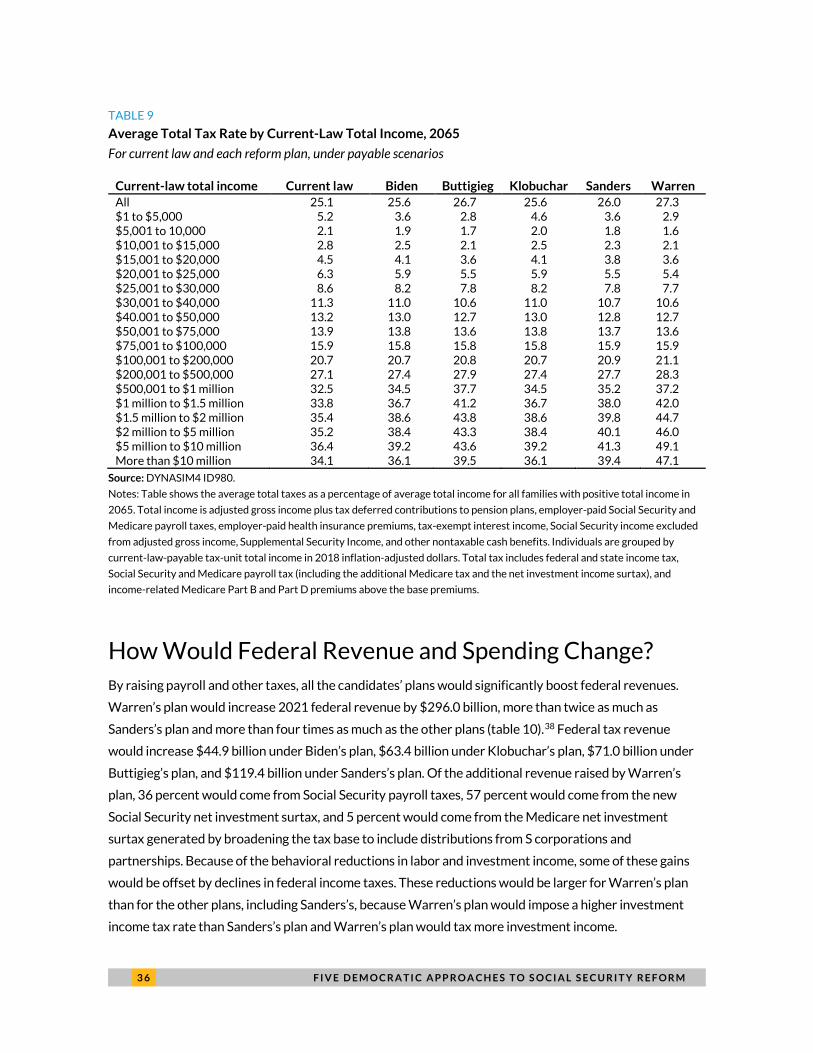
3 6 F I V E D E M O C R A T I C A P P R O A C H E S T O S O C I A L S E C U R I T Y R E F O R M
TABLE 9
Average Total Tax Rate by Current-Law Total Income, 2065
For current law and each reform plan, under payable scenarios
Current-law total income Current law Biden Buttigieg Klobuchar Sanders Warren All 25.1 25.6 26.7 25.6 26.0 27.3 $1 to $5,000 5.2 3.6 2.8 4.6 3.6 2.9 $5,001 to 10,000 2.1 1.9 1.7 2.0 1.8 1.6 $10,001 to $15,000 2.8 2.5 2.1 2.5 2.3 2.1 $15,001 to $20,000 4.5 4.1 3.6 4.1 3.8 3.6 $20,001 to $25,000 6.3 5.9 5.5 5.9 5.5 5.4 $25,001 to $30,000 8.6 8.2 7.8 8.2 7.8 7.7 $30,001 to $40,000 11.3 11.0 10.6 11.0 10.7 10.6 $40.001 to $50,000 13.2 13.0 12.7 13.0 12.8 12.7 $50,001 to $75,000 13.9 13.8 13.6 13.8 13.7 13.6 $75,001 to $100,000 15.9 15.8 15.8 15.8 15.9 15.9 $100,001 to $200,000 20.7 20.7 20.8 20.7 20.9 21.1 $200,001 to $500,000 27.1 27.4 27.9 27.4 27.7 28.3 $500,001 to $1 million 32.5 34.5 37.7 34.5 35.2 37.2 $1 million to $1.5 million 33.8 36.7 41.2 36.7 38.0 42.0 $1.5 million to $2 million 35.4 38.6 43.8 38.6 39.8 44.7 $2 million to $5 million 35.2 38.4 43.3 38.4 40.1 46.0 $5 million to $10 million 36.4 39.2 43.6 39.2 41.3 49.1 More than $10 million 34.1 36.1 39.5 36.1 39.4 47.1
Source: DYNASIM4 ID980.
Notes: Table shows the average total taxes as a percentage of average total income for all families with positive total income in
2065. Total income is adjusted gross income plus tax deferred contributions to pension plans, employer-paid Social Security and
Medicare payroll taxes, employer-paid health insurance premiums, tax-exempt interest income, Social Security income excluded
from adjusted gross income, Supplemental Security Income, and other nontaxable cash benefits. Individuals are grouped by
current-law-payable tax-unit total income in 2018 inflation-adjusted dollars. Total tax includes federal and state income tax,
Social Security and Medicare payroll tax (including the additional Medicare tax and the net investment income surtax), and
income-related Medicare Part B and Part D premiums above the base premiums.
How Would Federal Revenue and Spending Change? By raising payroll and other taxes, all the candidates’ plans would significantly boost federal revenues.
Warren’s plan would increase 2021 federal revenue by $296.0 billion, more than twice as much as
Sanders’s plan and more than four times as much as the other plans (table 10).38 Federal tax revenue
would increase $44.9 billion under Biden’s plan, $63.4 billion under Klobuchar’s plan, $71.0 billion under
Buttigieg’s plan, and $119.4 billion under Sanders’s plan. Of the additional revenue raised by Warren’s
plan, 36 percent would come from Social Security payroll taxes, 57 percent would come from the new
Social Security net investment surtax, and 5 percent would come from the Medicare net investment
surtax generated by broadening the tax base to include distributions from S corporations and
partnerships. Because of the behavioral reductions in labor and investment income, some of these gains
would be offset by declines in federal income taxes. These reductions would be larger for Warren’s plan
than for the other plans, including Sanders’s, because Warren’s plan would impose a higher investment
income tax rate than Sanders’s plan and Warren’s plan would tax more investment income.
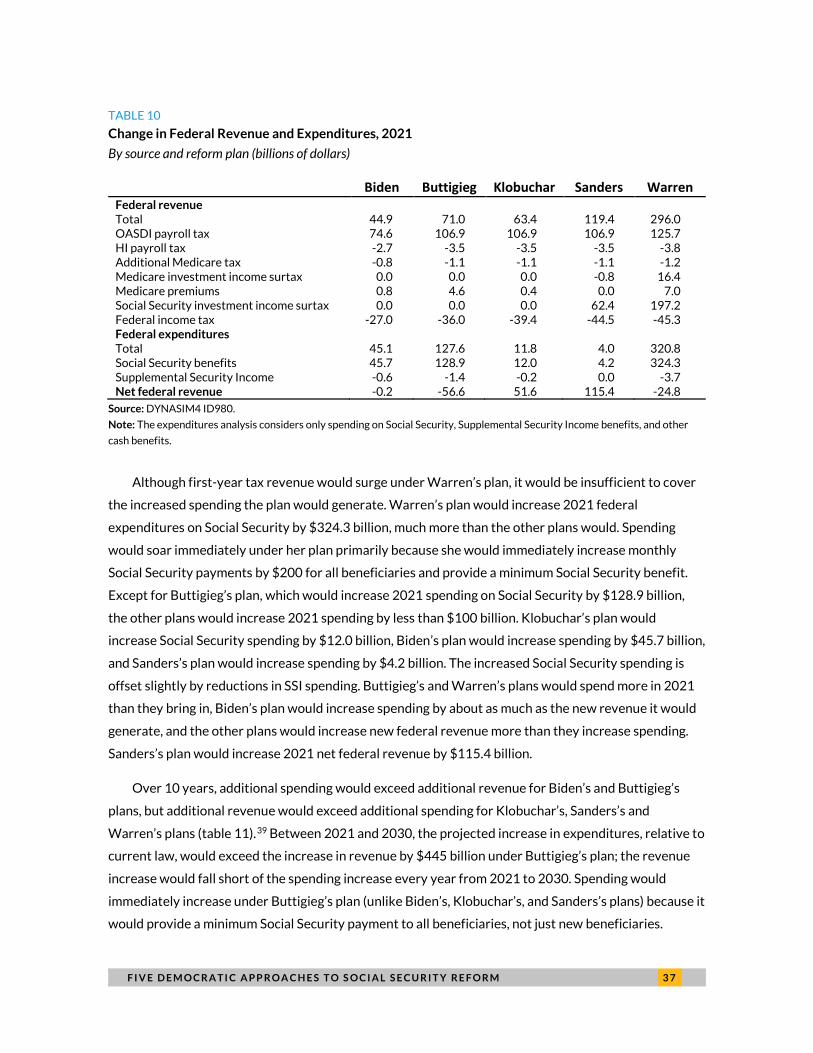
F I V E D E M O C R A T I C A P P R O A C H E S T O S O C I A L S E C U R I T Y R E F O R M 3 7
TABLE 10
Change in Federal Revenue and Expenditures, 2021
By source and reform plan (billions of dollars)
Biden Buttigieg Klobuchar Sanders Warren Federal revenue Total 44.9 71.0 63.4 119.4 296.0 OASDI payroll tax 74.6 106.9 106.9 106.9 125.7 HI payroll tax -2.7 -3.5 -3.5 -3.5 -3.8 Additional Medicare tax -0.8 -1.1 -1.1 -1.1 -1.2 Medicare investment income surtax 0.0 0.0 0.0 -0.8 16.4 Medicare premiums 0.8 4.6 0.4 0.0 7.0 Social Security investment income surtax 0.0 0.0 0.0 62.4 197.2 Federal income tax -27.0 -36.0 -39.4 -44.5 -45.3 Federal expenditures Total 45.1 127.6 11.8 4.0 320.8 Social Security benefits 45.7 128.9 12.0 4.2 324.3 Supplemental Security Income -0.6 -1.4 -0.2 0.0 -3.7 Net federal revenue -0.2 -56.6 51.6 115.4 -24.8
Source: DYNASIM4 ID980.
Note: The expenditures analysis considers only spending on Social Security, Supplemental Security Income benefits, and other
cash benefits.
Although first-year tax revenue would surge under Warren’s plan, it would be insufficient to cover
the increased spending the plan would generate. Warren’s plan would increase 2021 federal
expenditures on Social Security by $324.3 billion, much more than the other plans would. Spending
would soar immediately under her plan primarily because she would immediately increase monthly
Social Security payments by $200 for all beneficiaries and provide a minimum Social Security benefit.
Except for Buttigieg’s plan, which would increase 2021 spending on Social Security by $128.9 billion,
the other plans would increase 2021 spending by less than $100 billion. Klobuchar’s plan would
increase Social Security spending by $12.0 billion, Biden’s plan would increase spending by $45.7 billion,
and Sanders’s plan would increase spending by $4.2 billion. The increased Social Security spending is
offset slightly by reductions in SSI spending. Buttigieg’s and Warren’s plans would spend more in 2021
than they bring in, Biden’s plan would increase spending by about as much as the new revenue it would
generate, and the other plans would increase new federal revenue more than they increase spending.
Sanders’s plan would increase 2021 net federal revenue by $115.4 billion.
Over 10 years, additional spending would exceed additional revenue for Biden’s and Buttigieg’s
plans, but additional revenue would exceed additional spending for Klobuchar’s, Sanders’s and
Warren’s plans (table 11).39 Between 2021 and 2030, the projected increase in expenditures, relative to
current law, would exceed the increase in revenue by $445 billion under Buttigieg’s plan; the revenue
increase would fall short of the spending increase every year from 2021 to 2030. Spending would
immediately increase under Buttigieg’s plan (unlike Biden’s, Klobuchar’s, and Sanders’s plans) because it
would provide a minimum Social Security payment to all beneficiaries, not just new beneficiaries.
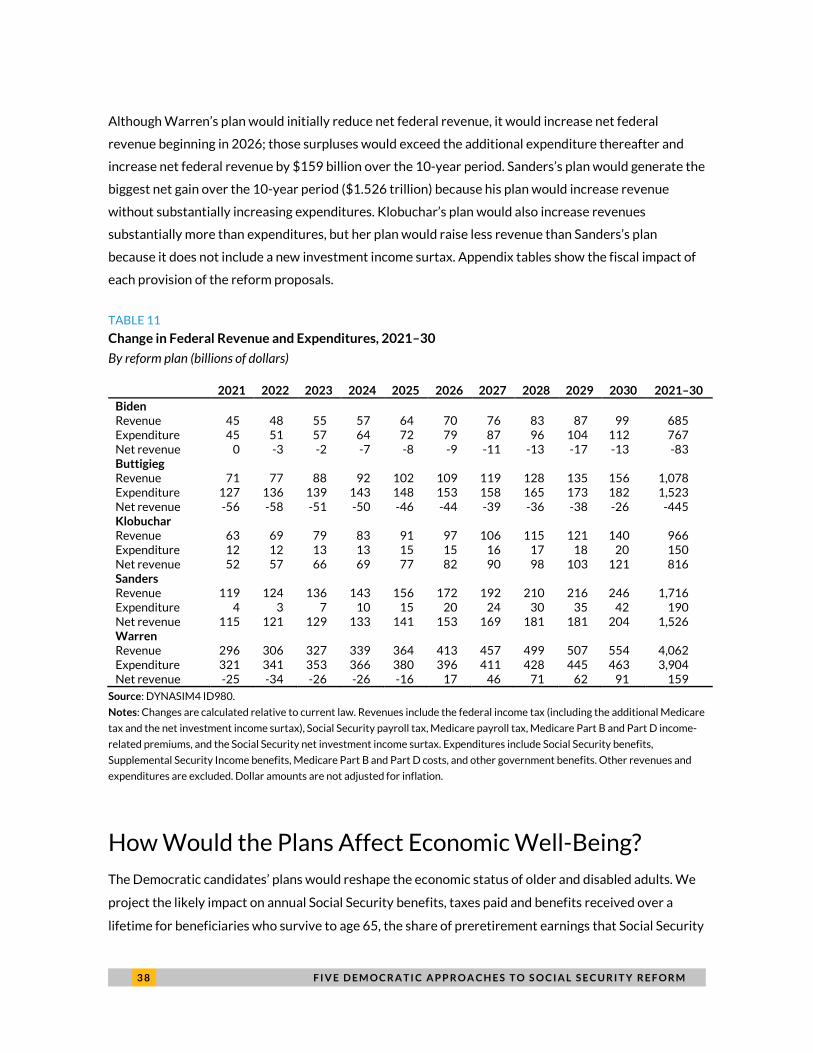
3 8 F I V E D E M O C R A T I C A P P R O A C H E S T O S O C I A L S E C U R I T Y R E F O R M
Although Warren’s plan would initially reduce net federal revenue, it would increase net federal
revenue beginning in 2026; those surpluses would exceed the additional expenditure thereafter and
increase net federal revenue by $159 billion over the 10-year period. Sanders’s plan would generate the
biggest net gain over the 10-year period ($1.526 trillion) because his plan would increase revenue
without substantially increasing expenditures. Klobuchar’s plan would also increase revenues
substantially more than expenditures, but her plan would raise less revenue than Sanders’s plan
because it does not include a new investment income surtax. Appendix tables show the fiscal impact of
each provision of the reform proposals.
TABLE 11
Change in Federal Revenue and Expenditures, 2021–30
By reform plan (billions of dollars)
2021 2022 2023 2024 2025 2026 2027 2028 2029 2030 2021–30 Biden Revenue 45 48 55 57 64 70 76 83 87 99 685 Expenditure 45 51 57 64 72 79 87 96 104 112 767 Net revenue 0 -3 -2 -7 -8 -9 -11 -13 -17 -13 -83 Buttigieg Revenue 71 77 88 92 102 109 119 128 135 156 1,078 Expenditure 127 136 139 143 148 153 158 165 173 182 1,523 Net revenue -56 -58 -51 -50 -46 -44 -39 -36 -38 -26 -445 Klobuchar Revenue 63 69 79 83 91 97 106 115 121 140 966 Expenditure 12 12 13 13 15 15 16 17 18 20 150 Net revenue 52 57 66 69 77 82 90 98 103 121 816 Sanders Revenue 119 124 136 143 156 172 192 210 216 246 1,716 Expenditure 4 3 7 10 15 20 24 30 35 42 190 Net revenue 115 121 129 133 141 153 169 181 181 204 1,526 Warren Revenue 296 306 327 339 364 413 457 499 507 554 4,062 Expenditure 321 341 353 366 380 396 411 428 445 463 3,904 Net revenue -25 -34 -26 -26 -16 17 46 71 62 91 159
Source: DYNASIM4 ID980.
Notes: Changes are calculated relative to current law. Revenues include the federal income tax (including the additional Medicare
tax and the net investment income surtax), Social Security payroll tax, Medicare payroll tax, Medicare Part B and Part D income-
related premiums, and the Social Security net investment income surtax. Expenditures include Social Security benefits,
Supplemental Security Income benefits, Medicare Part B and Part D costs, and other government benefits. Other revenues and
expenditures are excluded. Dollar amounts are not adjusted for inflation.
How Would the Plans Affect Economic Well-Being?
The Democratic candidates’ plans would reshape the economic status of older and disabled adults. We
project the likely impact on annual Social Security benefits, taxes paid and benefits received over a
lifetime for beneficiaries who survive to age 65, the share of preretirement earnings that Social Security
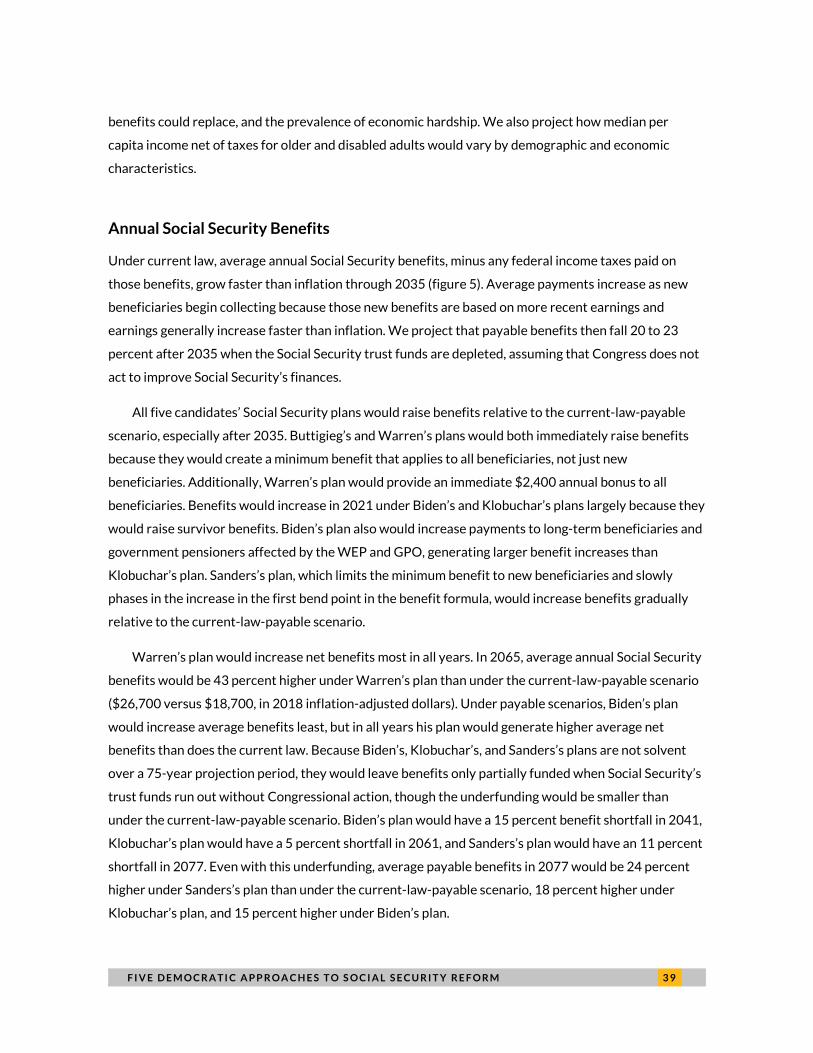
F I V E D E M O C R A T I C A P P R O A C H E S T O S O C I A L S E C U R I T Y R E F O R M 3 9
benefits could replace, and the prevalence of economic hardship. We also project how median per
capita income net of taxes for older and disabled adults would vary by demographic and economic
characteristics.
Annual Social Security Benefits
Under current law, average annual Social Security benefits, minus any federal income taxes paid on
those benefits, grow faster than inflation through 2035 (figure 5). Average payments increase as new
beneficiaries begin collecting because those new benefits are based on more recent earnings and
earnings generally increase faster than inflation. We project that payable benefits then fall 20 to 23
percent after 2035 when the Social Security trust funds are depleted, assuming that Congress does not
act to improve Social Security’s finances.
All five candidates’ Social Security plans would raise benefits relative to the current-law-payable
scenario, especially after 2035. Buttigieg’s and Warren’s plans would both immediately raise benefits
because they would create a minimum benefit that applies to all beneficiaries, not just new
beneficiaries. Additionally, Warren’s plan would provide an immediate $2,400 annual bonus to all
beneficiaries. Benefits would increase in 2021 under Biden’s and Klobuchar’s plans largely because they
would raise survivor benefits. Biden’s plan also would increase payments to long-term beneficiaries and
government pensioners affected by the WEP and GPO, generating larger benefit increases than
Klobuchar’s plan. Sanders’s plan, which limits the minimum benefit to new beneficiaries and slowly
phases in the increase in the first bend point in the benefit formula, would increase benefits gradually
relative to the current-law-payable scenario.
Warren’s plan would increase net benefits most in all years. In 2065, average annual Social Security
benefits would be 43 percent higher under Warren’s plan than under the current-law-payable scenario
($26,700 versus $18,700, in 2018 inflation-adjusted dollars). Under payable scenarios, Biden’s plan
would increase average benefits least, but in all years his plan would generate higher average net
benefits than does the current law. Because Biden’s, Klobuchar’s, and Sanders’s plans are not solvent
over a 75-year projection period, they would leave benefits only partially funded when Social Security’s
trust funds run out without Congressional action, though the underfunding would be smaller than
under the current-law-payable scenario. Biden’s plan would have a 15 percent benefit shortfall in 2041,
Klobuchar’s plan would have a 5 percent shortfall in 2061, and Sanders’s plan would have an 11 percent
shortfall in 2077. Even with this underfunding, average payable benefits in 2077 would be 24 percent
higher under Sanders’s plan than under the current-law-payable scenario, 18 percent higher under
Klobuchar’s plan, and 15 percent higher under Biden’s plan.
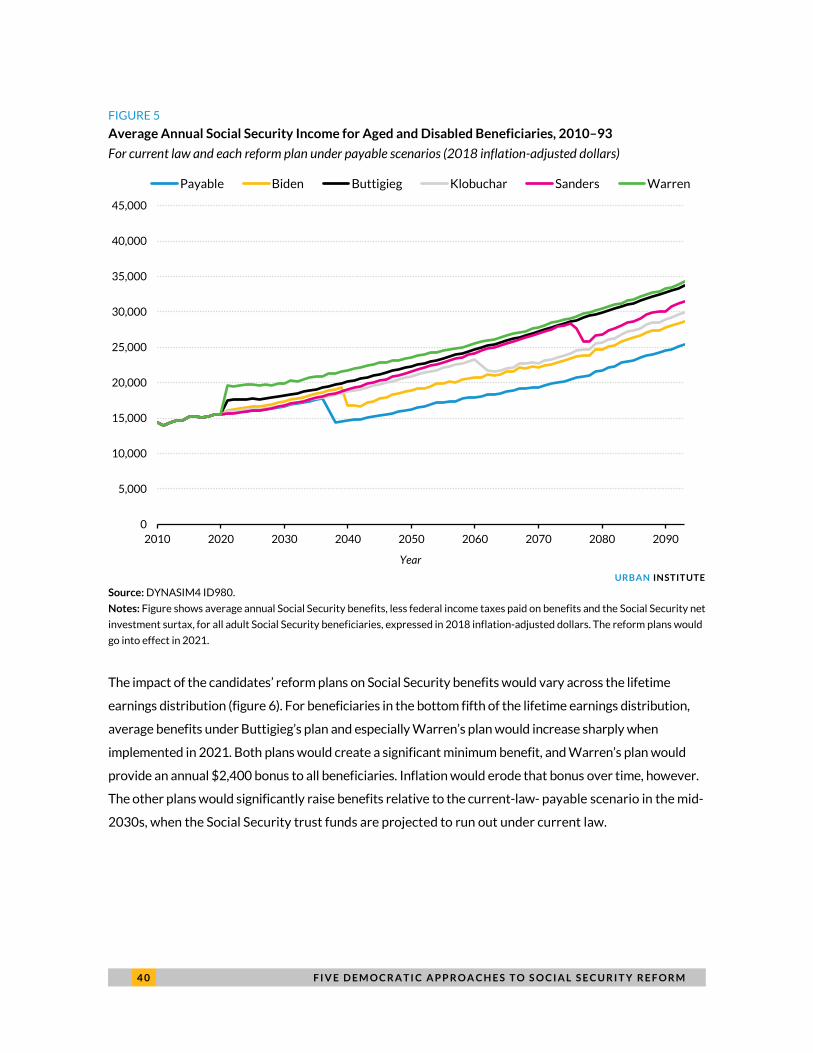
4 0 F I V E D E M O C R A T I C A P P R O A C H E S T O S O C I A L S E C U R I T Y R E F O R M
FIGURE 5
Average Annual Social Security Income for Aged and Disabled Beneficiaries, 2010–93
For current law and each reform plan under payable scenarios (2018 inflation-adjusted dollars)
URBAN INSTITUTE
Source: DYNASIM4 ID980.
Notes: Figure shows average annual Social Security benefits, less federal income taxes paid on benefits and the Social Security net
investment surtax, for all adult Social Security beneficiaries, expressed in 2018 inflation-adjusted dollars. The reform plans would
go into effect in 2021.
The impact of the candidates’ reform plans on Social Security benefits would vary across the lifetime
earnings distribution (figure 6). For beneficiaries in the bottom fifth of the lifetime earnings distribution,
average benefits under Buttigieg’s plan and especially Warren’s plan would increase sharply when
implemented in 2021. Both plans would create a significant minimum benefit, and Warren’s plan would
provide an annual $2,400 bonus to all beneficiaries. Inflation would erode that bonus over time, however.
The other plans would significantly raise benefits relative to the current-law- payable scenario in the mid-
2030s, when the Social Security trust funds are projected to run out under current law.
0
5,000
10,000
15,000
20,000
25,000
30,000
35,000
40,000
45,000
2010 2020 2030 2040 2050 2060 2070 2080 2090
Payable Biden Buttigieg Klobuchar Sanders Warren
Year
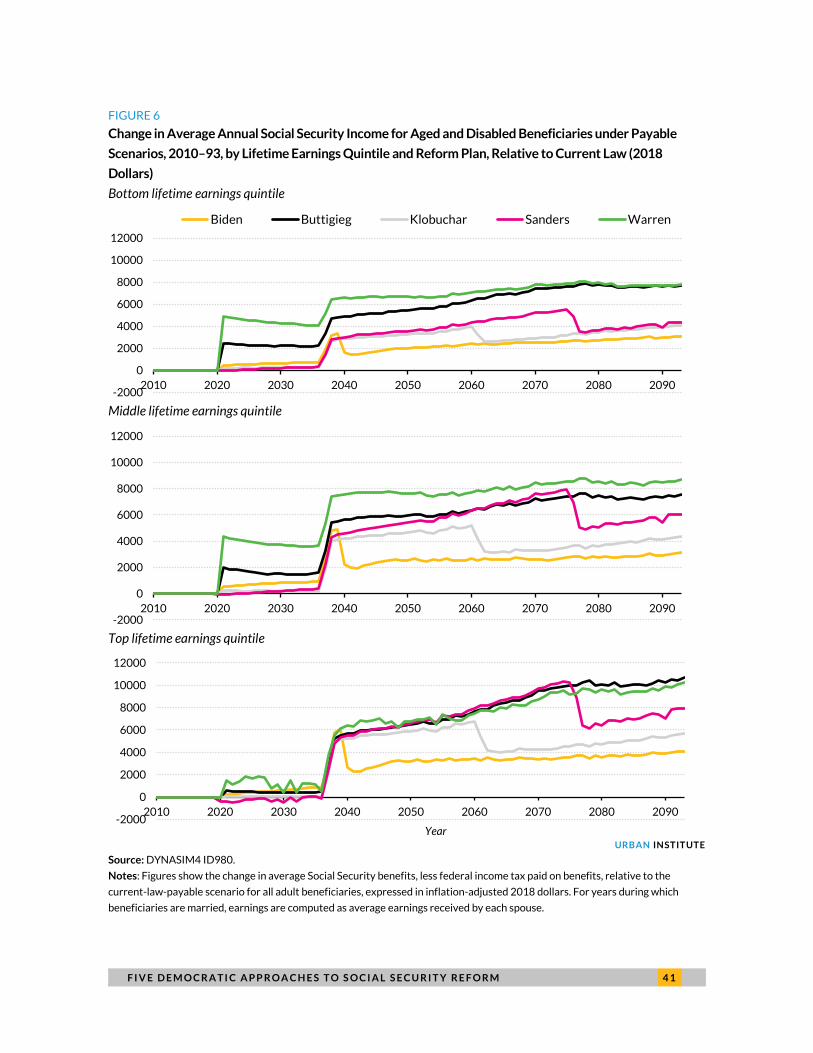
F I V E D E M O C R A T I C A P P R O A C H E S T O S O C I A L S E C U R I T Y R E F O R M 4 1
FIGURE 6
Change in Average Annual Social Security Income for Aged and Disabled Beneficiaries under Payable
Scenarios, 2010–93, by Lifetime Earnings Quintile and Reform Plan, Relative to Current Law (2018
Dollars)
Bottom lifetime earnings quintile
Middle lifetime earnings quintile
Top lifetime earnings quintile
URBAN INSTITUTE
Source: DYNASIM4 ID980.
Notes: Figures show the change in average Social Security benefits, less federal income tax paid on benefits, relative to the
current-law-payable scenario for all adult beneficiaries, expressed in inflation-adjusted 2018 dollars. For years during which
beneficiaries are married, earnings are computed as average earnings received by each spouse.
-2000
0
2000
4000
6000
8000
10000
12000
2010 2020 2030 2040 2050 2060 2070 2080 2090
Biden Buttigieg Klobuchar Sanders Warren
-2000
0
2000
4000
6000
8000
10000
12000
2010 2020 2030 2040 2050 2060 2070 2080 2090
-2000
0
2000
4000
6000
8000
10000
12000
2010 2020 2030 2040 2050 2060 2070 2080 2090
Year
4 2 F I V E D E M O C R A T I C A P P R O A C H E S T O S O C I A L S E C U R I T Y R E F O R M
Before the trust funds are projected to run out, the reform plans proposed by the Democratic
candidates would increase payments less for beneficiaries in the top fifth of the lifetime earnings
distribution than for those in the bottom fifth. Initially, only Warren’s plan would increase payments
significantly to beneficiaries with high lifetime earnings, providing them with an annual $2,400 Social
Security bonus. However, all the plans would pay beneficiaries with high lifetime earnings substantially
more than they would receive under current law after the trust funds run out by avoiding the 20 to 23
percent across-the-board benefit cuts that would follow trust fund depletion without Congressional
action. The Social Security trust funds would run out in later years under Biden’s, Klobuchar’s, and
Sanders’s plans, but those shortfalls would lead to smaller across-the-board cuts than those projected
under current law without further Congressional action.
Initially, Warren’s, Buttigieg’s, and Biden’s plans would provide much higher payments to
beneficiaries with limited benefits relative to what they would receive under current law (figure 7). In
2025, beneficiaries at the 10th percentile of the benefit distribution would receive 41 percent more
under Warren’s plan, 13 percent more under Buttigieg’s plan, and 8 percent more under Biden’s plan.
The minimum-benefit provision in Buttigieg’s and Warren’s plans, which apply to all beneficiaries, not
only new ones, would significantly raise benefits at the low end of the distribution, and Warren’s annual
$2,400 Social Security bonus would have a relatively large percentage impact on beneficiaries receiving
limited payments. Biden’s and Warren’s plans both repeal the WEP and GPO, which would generally
increase payments to beneficiaries who would otherwise receive very limited payments. In 2025, the
Biden plan would not increase benefits much for people in the top three-fourths of the benefit
distribution. However, Buttigieg’s plan would increase median benefits (the 50th percentile) 12 percent
because the impact of the minimum benefit would extend well up the benefit distribution, and Warren’s
plan would increase benefits 25 percent, reflecting the combined impact of the minimum benefit and
the Social Security bonus. Because of phase-ins and eligibility requirements in Klobuchar’s and
Sanders’s plans, those plans would not increase Social Security benefits much in 2025.
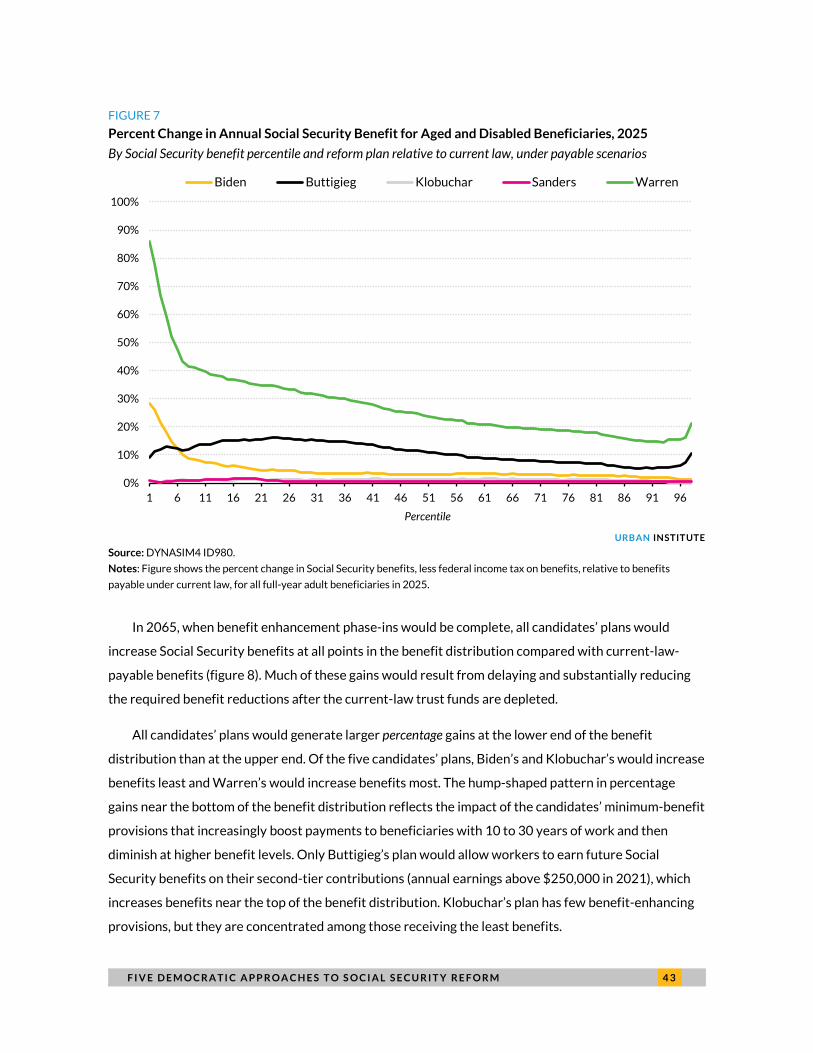
F I V E D E M O C R A T I C A P P R O A C H E S T O S O C I A L S E C U R I T Y R E F O R M 4 3
FIGURE 7
Percent Change in Annual Social Security Benefit for Aged and Disabled Beneficiaries, 2025
By Social Security benefit percentile and reform plan relative to current law, under payable scenarios
URBAN INSTITUTE
Source: DYNASIM4 ID980.
Notes: Figure shows the percent change in Social Security benefits, less federal income tax on benefits, relative to benefits
payable under current law, for all full-year adult beneficiaries in 2025.
In 2065, when benefit enhancement phase-ins would be complete, all candidates’ plans would
increase Social Security benefits at all points in the benefit distribution compared with current-law-
payable benefits (figure 8). Much of these gains would result from delaying and substantially reducing
the required benefit reductions after the current-law trust funds are depleted.
All candidates’ plans would generate larger percentage gains at the lower end of the benefit
distribution than at the upper end. Of the five candidates’ plans, Biden’s and Klobuchar’s would increase
benefits least and Warren’s would increase benefits most. The hump-shaped pattern in percentage
gains near the bottom of the benefit distribution reflects the impact of the candidates’ minimum-benefit
provisions that increasingly boost payments to beneficiaries with 10 to 30 years of work and then
diminish at higher benefit levels. Only Buttigieg’s plan would allow workers to earn future Social
Security benefits on their second-tier contributions (annual earnings above $250,000 in 2021), which
increases benefits near the top of the benefit distribution. Klobuchar’s plan has few benefit-enhancing
provisions, but they are concentrated among those receiving the least benefits.
0%
10%
20%
30%
40%
50%
60%
70%
80%
90%
100%
1 6 11 16 21 26 31 36 41 46 51 56 61 66 71 76 81 86 91 96
Biden Buttigieg Klobuchar Sanders Warren
Percentile
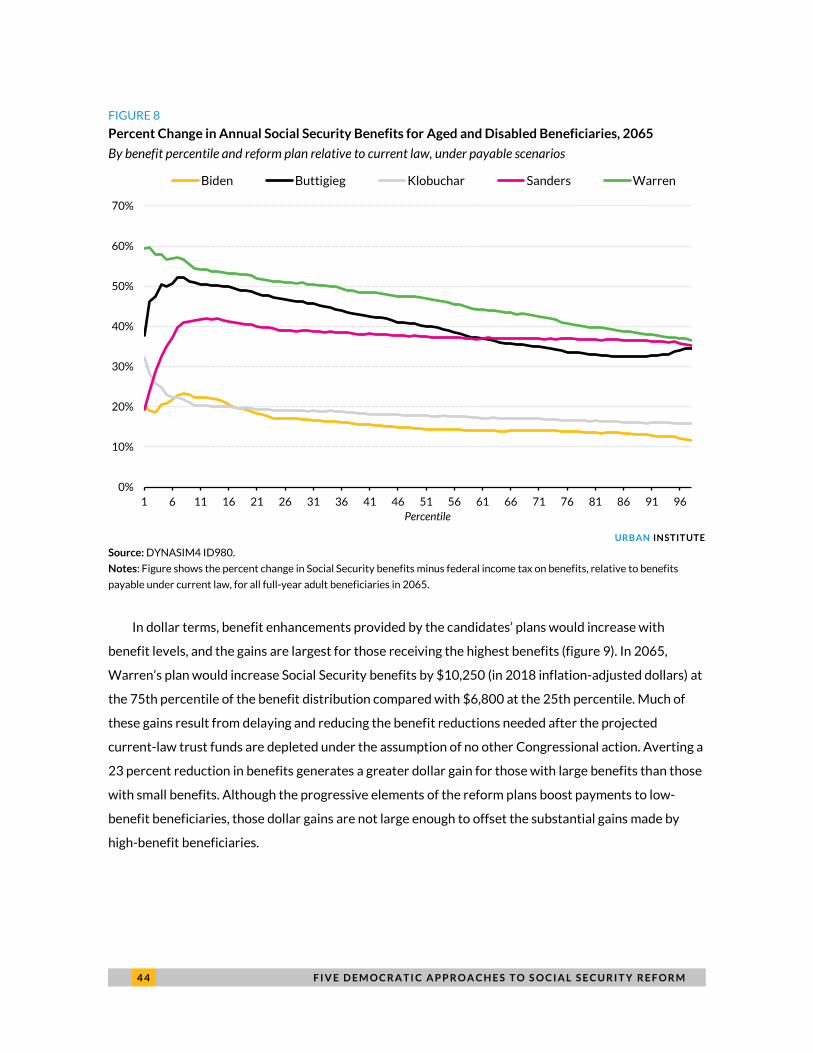
4 4 F I V E D E M O C R A T I C A P P R O A C H E S T O S O C I A L S E C U R I T Y R E F O R M
FIGURE 8
Percent Change in Annual Social Security Benefits for Aged and Disabled Beneficiaries, 2065
By benefit percentile and reform plan relative to current law, under payable scenarios
URBAN INSTITUTE
Source: DYNASIM4 ID980.
Notes: Figure shows the percent change in Social Security benefits minus federal income tax on benefits, relative to benefits
payable under current law, for all full-year adult beneficiaries in 2065.
In dollar terms, benefit enhancements provided by the candidates’ plans would increase with
benefit levels, and the gains are largest for those receiving the highest benefits (figure 9). In 2065,
Warren’s plan would increase Social Security benefits by $10,250 (in 2018 inflation-adjusted dollars) at
the 75th percentile of the benefit distribution compared with $6,800 at the 25th percentile. Much of
these gains result from delaying and reducing the benefit reductions needed after the projected
current-law trust funds are depleted under the assumption of no other Congressional action. Averting a
23 percent reduction in benefits generates a greater dollar gain for those with large benefits than those
with small benefits. Although the progressive elements of the reform plans boost payments to low-
benefit beneficiaries, those dollar gains are not large enough to offset the substantial gains made by
high-benefit beneficiaries.
0%
10%
20%
30%
40%
50%
60%
70%
1 6 11 16 21 26 31 36 41 46 51 56 61 66 71 76 81 86 91 96
Biden Buttigieg Klobuchar Sanders Warren
Percentile
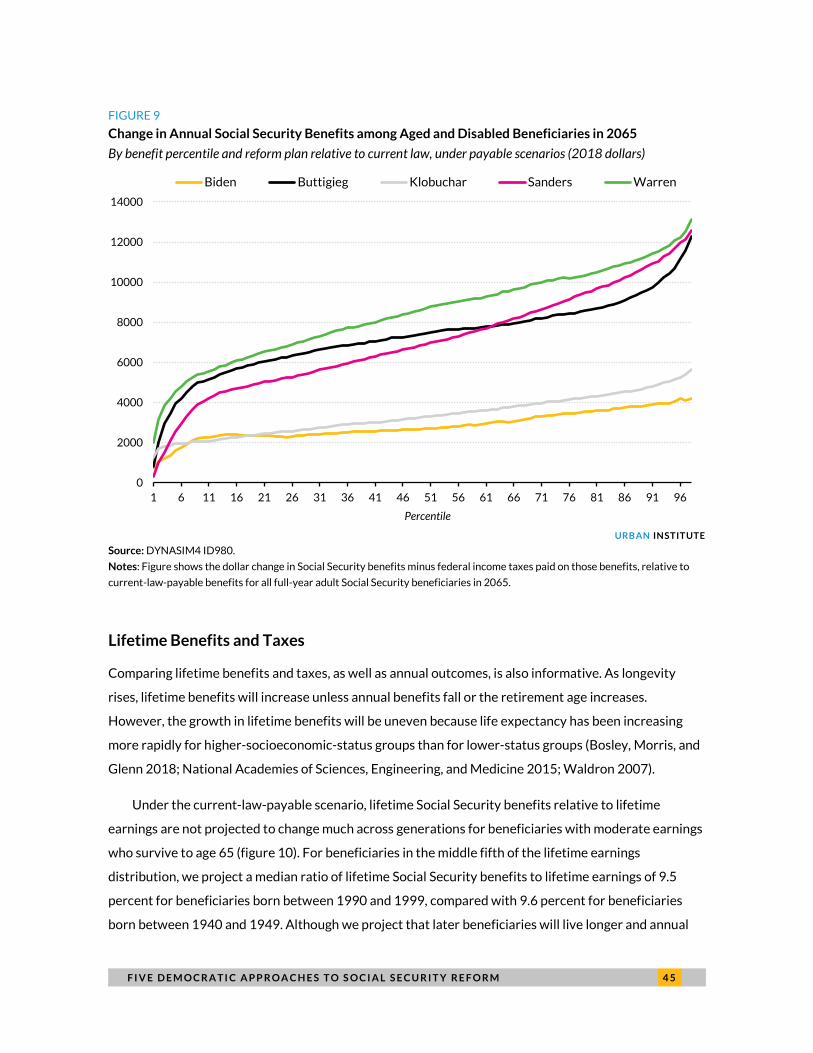
F I V E D E M O C R A T I C A P P R O A C H E S T O S O C I A L S E C U R I T Y R E F O R M 4 5
FIGURE 9
Change in Annual Social Security Benefits among Aged and Disabled Beneficiaries in 2065
By benefit percentile and reform plan relative to current law, under payable scenarios (2018 dollars)
URBAN INSTITUTE
Source: DYNASIM4 ID980.
Notes: Figure shows the dollar change in Social Security benefits minus federal income taxes paid on those benefits, relative to
current-law-payable benefits for all full-year adult Social Security beneficiaries in 2065.
Lifetime Benefits and Taxes
Comparing lifetime benefits and taxes, as well as annual outcomes, is also informative. As longevity
rises, lifetime benefits will increase unless annual benefits fall or the retirement age increases.
However, the growth in lifetime benefits will be uneven because life expectancy has been increasing
more rapidly for higher-socioeconomic-status groups than for lower-status groups (Bosley, Morris, and
Glenn 2018; National Academies of Sciences, Engineering, and Medicine 2015; Waldron 2007).
Under the current-law-payable scenario, lifetime Social Security benefits relative to lifetime
earnings are not projected to change much across generations for beneficiaries with moderate earnings
who survive to age 65 (figure 10). For beneficiaries in the middle fifth of the lifetime earnings
distribution, we project a median ratio of lifetime Social Security benefits to lifetime earnings of 9.5
percent for beneficiaries born between 1990 and 1999, compared with 9.6 percent for beneficiaries
born between 1940 and 1949. Although we project that later beneficiaries will live longer and annual
0
2000
4000
6000
8000
10000
12000
14000
1 6 11 16 21 26 31 36 41 46 51 56 61 66 71 76 81 86 91 96
Biden Buttigieg Klobuchar Sanders Warren
Percentile
4 6 F I V E D E M O C R A T I C A P P R O A C H E S T O S O C I A L S E C U R I T Y R E F O R M
benefits will generally increase, these gains will not keep pace with growth in lifetime earnings,
primarily because the program would be forced to cut benefits if the trust funds run out and Congress
takes no additional action. Lifetime benefits relative to lifetime earnings would decline somewhat over
time for both the top fifth of lifetime earners, whose earnings are projected to increase substantially,
and the bottom fifth, whose life expectancy is projected to increase only modestly. Because of Social
Security’s progressive benefit formula, however, beneficiaries with limited lifetime earnings who
survive to age 65 will continue to receive more lifetime benefits as a share of their earnings than
beneficiaries with higher lifetime earnings.
For both high and low earners, all the candidates’ plans would increase workers’ lifetime benefits as a
share of their lifetime earnings compared with the current-law-payable scenario. Warren’s plan increases
lifetime benefits most. Her plan would immediately boost benefits, including for beneficiaries born
between 1940 to 1949 (who are ages 72 to 81 in 2021), whereas the phase-in restrictions and eligibility
limitations in the other candidates’ plans would limit most gains to later cohorts.
For beneficiaries in the bottom fifth of the lifetime earnings distribution, Warren’s and Buttigieg’s
plans would increase lifetime benefits relative to lifetime earnings most. The $200 monthly benefit
bonus and expansive minimum benefit increases in Warren’s plan would raise lifetime benefits for low-
earners born between 1940 and 1949, and it would raise benefits even more for those born after 1949.
Buttigieg’s plan’s more expansive caregiver credit, paired with its minimum benefit, would increase
lifetime benefits for low earners born between 1990 and 1999 about as much as Warren’s plan. Biden
has a less expansive Social Security reform plan, but it would nonetheless increase benefits compared
with the current-law-payable scenario. Although Biden’s and Sanders’s plans, unlike the other plans,
increase their minimum benefit as the average wage increases, they would not increase low-earner
lifetime benefits as much as Warren’s and Buttigieg’s plans.
All five candidates’ plans would also raise lifetime benefits for moderate and high earners. Sanders’s
plan would substantially boost benefits for these groups because it would increase the first bend point in
the benefit formula, raising payments to all beneficiaries. This provision would eventually increase lifetime
benefits for high earners in Sanders’s plan about as much as Warren’s, whose $200 monthly benefit bonus
would also apply to all beneficiaries regardless of income. Biden’s plan would increase payments to all
long-term beneficiaries, who tend to have more income than beneficiaries who die early, and Biden’s,
Sanders’s, and Warren’s plans would increase COLAs for all beneficiaries.
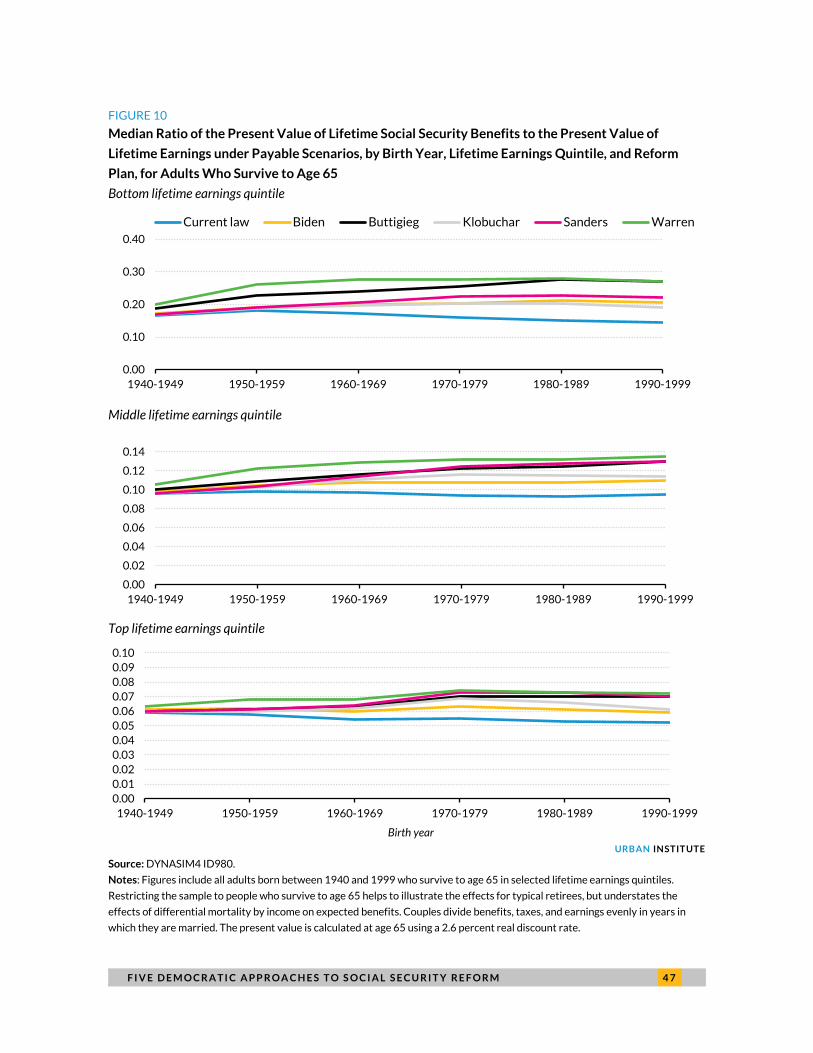
F I V E D E M O C R A T I C A P P R O A C H E S T O S O C I A L S E C U R I T Y R E F O R M 4 7
FIGURE 10
Median Ratio of the Present Value of Lifetime Social Security Benefits to the Present Value of
Lifetime Earnings under Payable Scenarios, by Birth Year, Lifetime Earnings Quintile, and Reform
Plan, for Adults Who Survive to Age 65
Bottom lifetime earnings quintile
Middle lifetime earnings quintile
Top lifetime earnings quintile
URBAN INSTITUTE
Source: DYNASIM4 ID980.
Notes: Figures include all adults born between 1940 and 1999 who survive to age 65 in selected lifetime earnings quintiles.
Restricting the sample to people who survive to age 65 helps to illustrate the effects for typical retirees, but understates the
effects of differential mortality by income on expected benefits. Couples divide benefits, taxes, and earnings evenly in years in
which they are married. The present value is calculated at age 65 using a 2.6 percent real discount rate.
0.00
0.10
0.20
0.30
0.40
1940-1949 1950-1959 1960-1969 1970-1979 1980-1989 1990-1999
Current law Biden Buttigieg Klobuchar Sanders Warren
0.00
0.02
0.04
0.06
0.08
0.10
0.12
0.14
1940-1949 1950-1959 1960-1969 1970-1979 1980-1989 1990-1999
0.000.010.020.030.040.050.060.070.080.090.10
1940-1949 1950-1959 1960-1969 1970-1979 1980-1989 1990-1999
Birth year
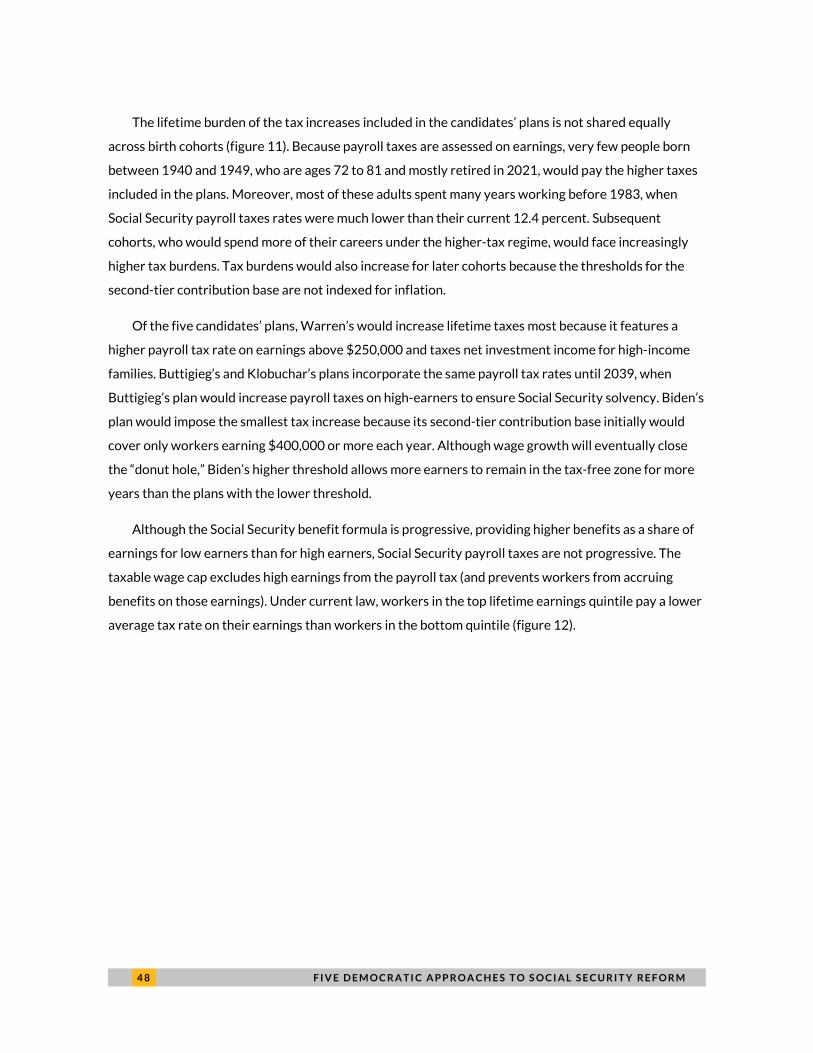
4 8 F I V E D E M O C R A T I C A P P R O A C H E S T O S O C I A L S E C U R I T Y R E F O R M
The lifetime burden of the tax increases included in the candidates’ plans is not shared equally
across birth cohorts (figure 11). Because payroll taxes are assessed on earnings, very few people born
between 1940 and 1949, who are ages 72 to 81 and mostly retired in 2021, would pay the higher taxes
included in the plans. Moreover, most of these adults spent many years working before 1983, when
Social Security payroll taxes rates were much lower than their current 12.4 percent. Subsequent
cohorts, who would spend more of their careers under the higher-tax regime, would face increasingly
higher tax burdens. Tax burdens would also increase for later cohorts because the thresholds for the
second-tier contribution base are not indexed for inflation.
Of the five candidates’ plans, Warren’s would increase lifetime taxes most because it features a
higher payroll tax rate on earnings above $250,000 and taxes net investment income for high-income
families. Buttigieg’s and Klobuchar’s plans incorporate the same payroll tax rates until 2039, when
Buttigieg’s plan would increase payroll taxes on high-earners to ensure Social Security solvency. Biden’s
plan would impose the smallest tax increase because its second-tier contribution base initially would
cover only workers earning $400,000 or more each year. Although wage growth will eventually close
the “donut hole,” Biden’s higher threshold allows more earners to remain in the tax-free zone for more
years than the plans with the lower threshold.
Although the Social Security benefit formula is progressive, providing higher benefits as a share of
earnings for low earners than for high earners, Social Security payroll taxes are not progressive. The
taxable wage cap excludes high earnings from the payroll tax (and prevents workers from accruing
benefits on those earnings). Under current law, workers in the top lifetime earnings quintile pay a lower
average tax rate on their earnings than workers in the bottom quintile (figure 12).
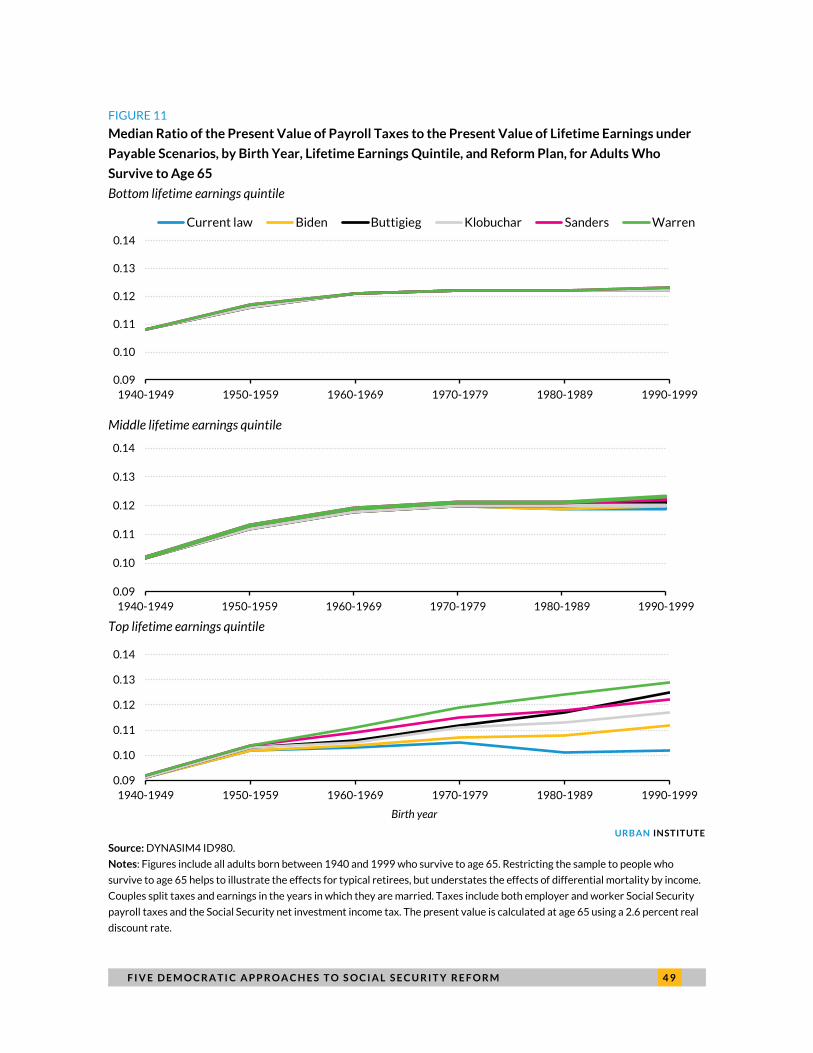
F I V E D E M O C R A T I C A P P R O A C H E S T O S O C I A L S E C U R I T Y R E F O R M 4 9
FIGURE 11
Median Ratio of the Present Value of Payroll Taxes to the Present Value of Lifetime Earnings under
Payable Scenarios, by Birth Year, Lifetime Earnings Quintile, and Reform Plan, for Adults Who
Survive to Age 65
Bottom lifetime earnings quintile
Middle lifetime earnings quintile
Top lifetime earnings quintile
URBAN INSTITUTE
Source: DYNASIM4 ID980.
Notes: Figures include all adults born between 1940 and 1999 who survive to age 65. Restricting the sample to people who
survive to age 65 helps to illustrate the effects for typical retirees, but understates the effects of differential mortality by income.
Couples split taxes and earnings in the years in which they are married. Taxes include both employer and worker Social Security
payroll taxes and the Social Security net investment income tax. The present value is calculated at age 65 using a 2.6 percent real
discount rate.
0.09
0.10
0.11
0.12
0.13
0.14
1940-1949 1950-1959 1960-1969 1970-1979 1980-1989 1990-1999
Current law Biden Buttigieg Klobuchar Sanders Warren
0.09
0.10
0.11
0.12
0.13
0.14
1940-1949 1950-1959 1960-1969 1970-1979 1980-1989 1990-1999
0.09
0.10
0.11
0.12
0.13
0.14
1940-1949 1950-1959 1960-1969 1970-1979 1980-1989 1990-1999
Birth year
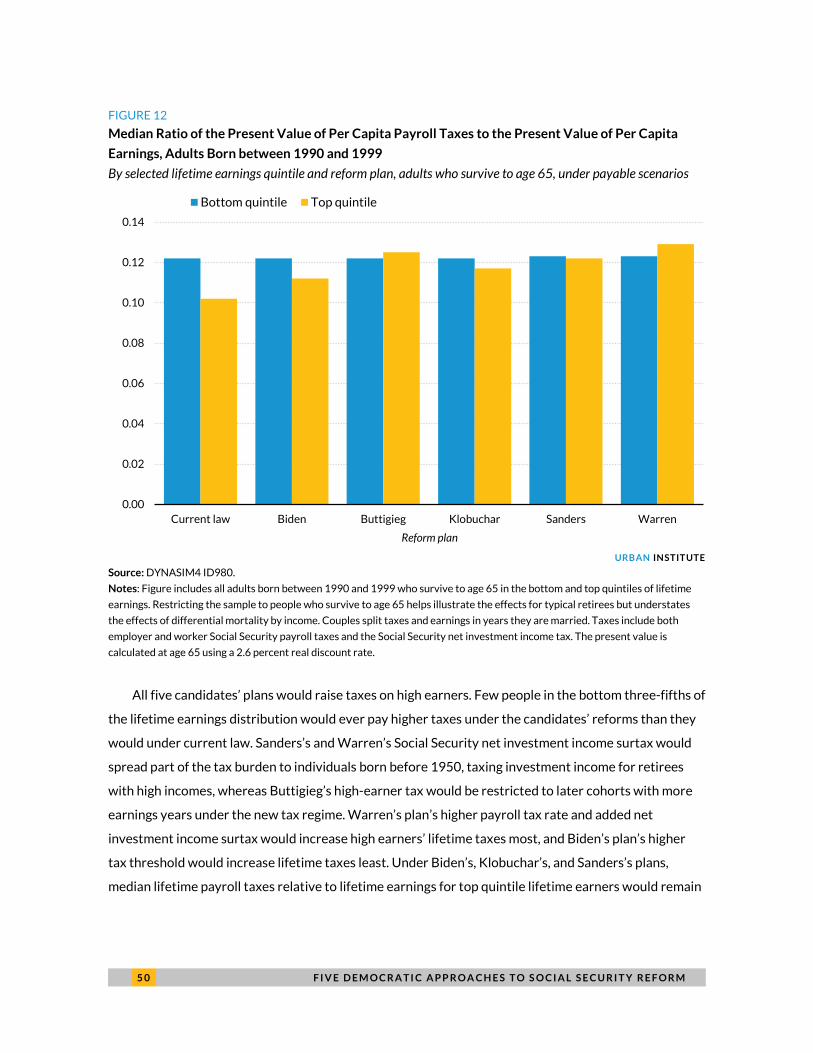
5 0 F I V E D E M O C R A T I C A P P R O A C H E S T O S O C I A L S E C U R I T Y R E F O R M
FIGURE 12
Median Ratio of the Present Value of Per Capita Payroll Taxes to the Present Value of Per Capita
Earnings, Adults Born between 1990 and 1999
By selected lifetime earnings quintile and reform plan, adults who survive to age 65, under payable scenarios
URBAN INSTITUTE
Source: DYNASIM4 ID980.
Notes: Figure includes all adults born between 1990 and 1999 who survive to age 65 in the bottom and top quintiles of lifetime
earnings. Restricting the sample to people who survive to age 65 helps illustrate the effects for typical retirees but understates
the effects of differential mortality by income. Couples split taxes and earnings in years they are married. Taxes include both
employer and worker Social Security payroll taxes and the Social Security net investment income tax. The present value is
calculated at age 65 using a 2.6 percent real discount rate.
All five candidates’ plans would raise taxes on high earners. Few people in the bottom three-fifths of
the lifetime earnings distribution would ever pay higher taxes under the candidates’ reforms than they
would under current law. Sanders’s and Warren’s Social Security net investment income surtax would
spread part of the tax burden to individuals born before 1950, taxing investment income for retirees
with high incomes, whereas Buttigieg’s high-earner tax would be restricted to later cohorts with more
earnings years under the new tax regime. Warren’s plan’s higher payroll tax rate and added net
investment income surtax would increase high earners’ lifetime taxes most, and Biden’s plan’s higher
tax threshold would increase lifetime taxes least. Under Biden’s, Klobuchar’s, and Sanders’s plans,
median lifetime payroll taxes relative to lifetime earnings for top quintile lifetime earners would remain
0.00
0.02
0.04
0.06
0.08
0.10
0.12
0.14
Current law Biden Buttigieg Klobuchar Sanders Warren
Bottom quintile Top quintile
Reform plan
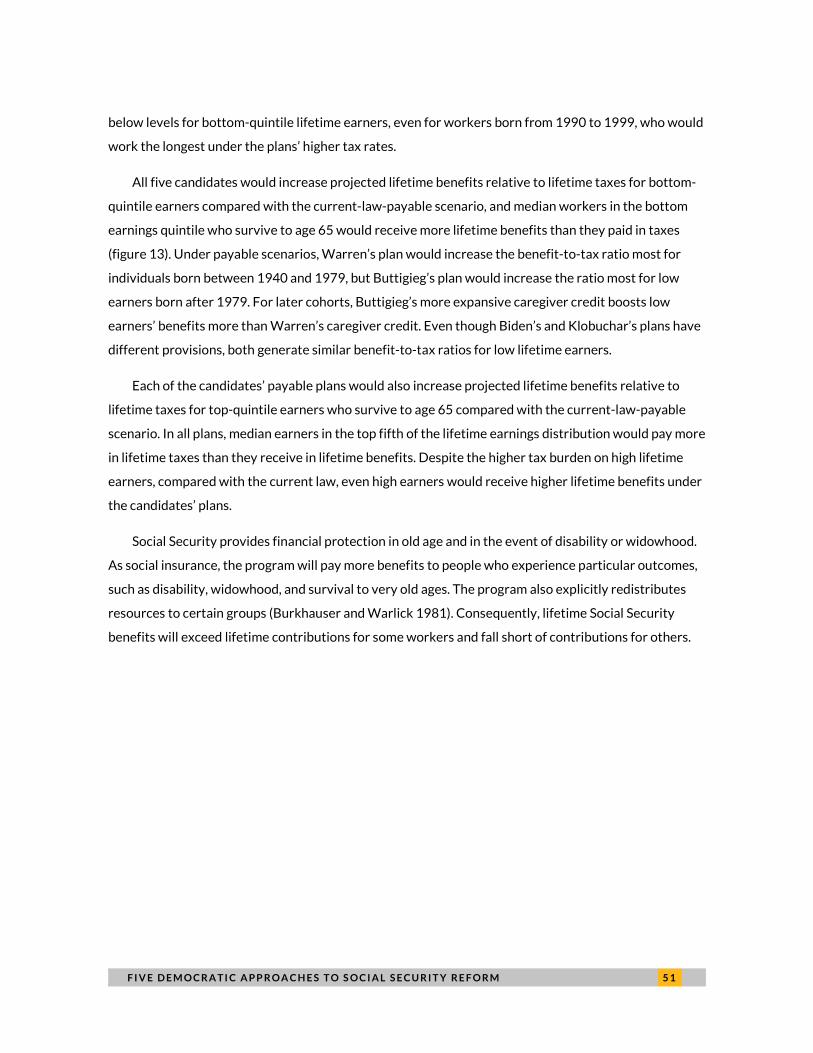
F I V E D E M O C R A T I C A P P R O A C H E S T O S O C I A L S E C U R I T Y R E F O R M 5 1
below levels for bottom-quintile lifetime earners, even for workers born from 1990 to 1999, who would
work the longest under the plans’ higher tax rates.
All five candidates would increase projected lifetime benefits relative to lifetime taxes for bottom-
quintile earners compared with the current-law-payable scenario, and median workers in the bottom
earnings quintile who survive to age 65 would receive more lifetime benefits than they paid in taxes
(figure 13). Under payable scenarios, Warren’s plan would increase the benefit-to-tax ratio most for
individuals born between 1940 and 1979, but Buttigieg’s plan would increase the ratio most for low
earners born after 1979. For later cohorts, Buttigieg’s more expansive caregiver credit boosts low
earners’ benefits more than Warren’s caregiver credit. Even though Biden’s and Klobuchar’s plans have
different provisions, both generate similar benefit-to-tax ratios for low lifetime earners.
Each of the candidates’ payable plans would also increase projected lifetime benefits relative to
lifetime taxes for top-quintile earners who survive to age 65 compared with the current-law-payable
scenario. In all plans, median earners in the top fifth of the lifetime earnings distribution would pay more
in lifetime taxes than they receive in lifetime benefits. Despite the higher tax burden on high lifetime
earners, compared with the current law, even high earners would receive higher lifetime benefits under
the candidates’ plans.
Social Security provides financial protection in old age and in the event of disability or widowhood.
As social insurance, the program will pay more benefits to people who experience particular outcomes,
such as disability, widowhood, and survival to very old ages. The program also explicitly redistributes
resources to certain groups (Burkhauser and Warlick 1981). Consequently, lifetime Social Security
benefits will exceed lifetime contributions for some workers and fall short of contributions for others.
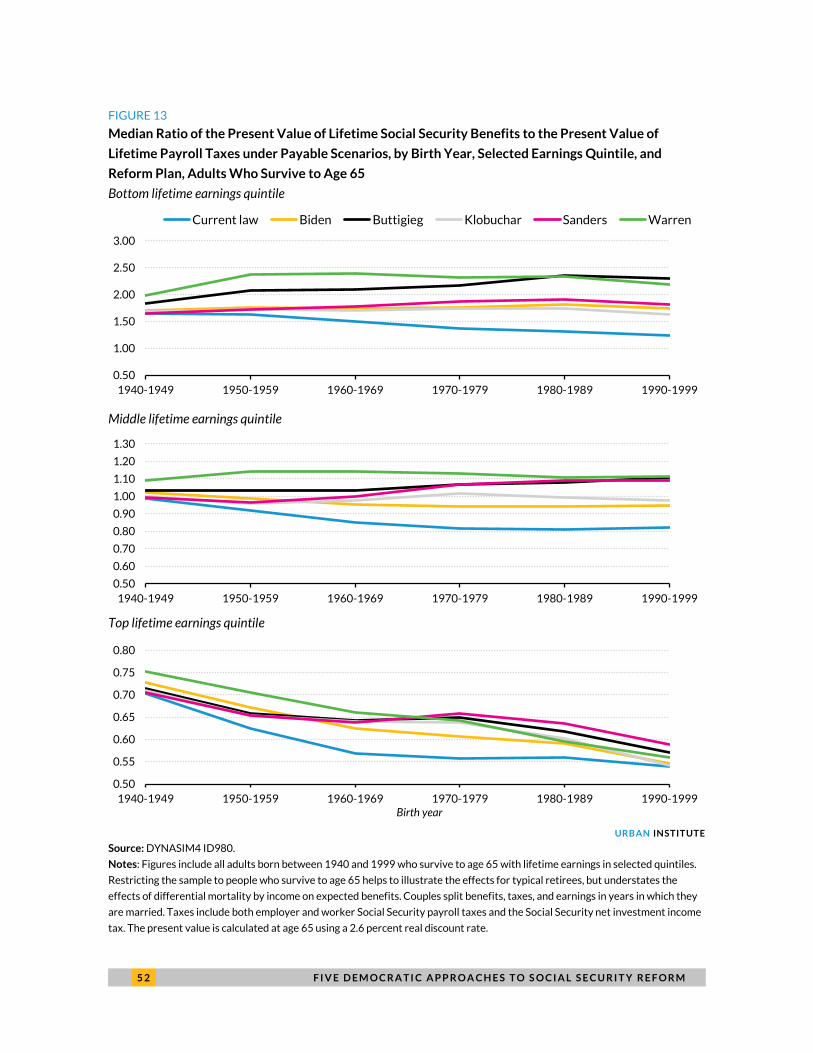
5 2 F I V E D E M O C R A T I C A P P R O A C H E S T O S O C I A L S E C U R I T Y R E F O R M
FIGURE 13
Median Ratio of the Present Value of Lifetime Social Security Benefits to the Present Value of
Lifetime Payroll Taxes under Payable Scenarios, by Birth Year, Selected Earnings Quintile, and
Reform Plan, Adults Who Survive to Age 65
Bottom lifetime earnings quintile
Middle lifetime earnings quintile
Top lifetime earnings quintile
URBAN INSTITUTE
Source: DYNASIM4 ID980.
Notes: Figures include all adults born between 1940 and 1999 who survive to age 65 with lifetime earnings in selected quintiles.
Restricting the sample to people who survive to age 65 helps to illustrate the effects for typical retirees, but understates the
effects of differential mortality by income on expected benefits. Couples split benefits, taxes, and earnings in years in which they
are married. Taxes include both employer and worker Social Security payroll taxes and the Social Security net investment income
tax. The present value is calculated at age 65 using a 2.6 percent real discount rate.
0.50
1.00
1.50
2.00
2.50
3.00
1940-1949 1950-1959 1960-1969 1970-1979 1980-1989 1990-1999
Current law Biden Buttigieg Klobuchar Sanders Warren
0.50
0.60
0.70
0.80
0.90
1.00
1.10
1.20
1.30
1940-1949 1950-1959 1960-1969 1970-1979 1980-1989 1990-1999
0.50
0.55
0.60
0.65
0.70
0.75
0.80
1940-1949 1950-1959 1960-1969 1970-1979 1980-1989 1990-1999Birth year
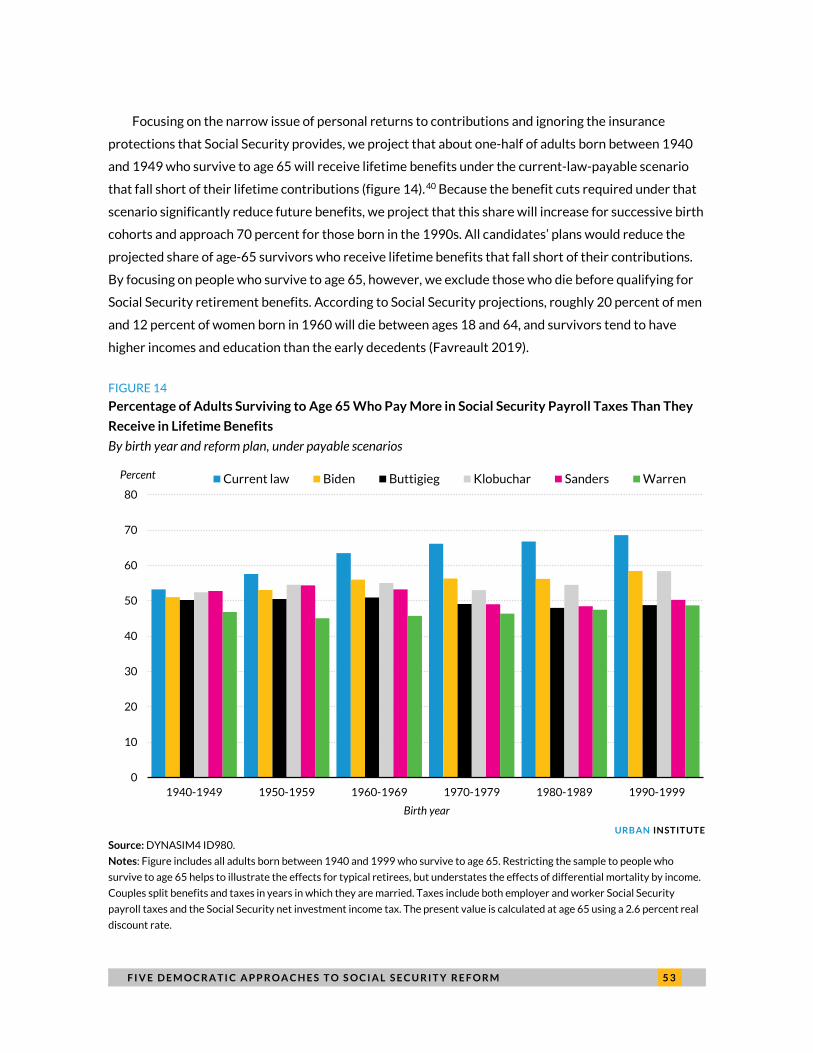
F I V E D E M O C R A T I C A P P R O A C H E S T O S O C I A L S E C U R I T Y R E F O R M 5 3
Focusing on the narrow issue of personal returns to contributions and ignoring the insurance
protections that Social Security provides, we project that about one-half of adults born between 1940
and 1949 who survive to age 65 will receive lifetime benefits under the current-law-payable scenario
that fall short of their lifetime contributions (figure 14).40 Because the benefit cuts required under that
scenario significantly reduce future benefits, we project that this share will increase for successive birth
cohorts and approach 70 percent for those born in the 1990s. All candidates’ plans would reduce the
projected share of age-65 survivors who receive lifetime benefits that fall short of their contributions.
By focusing on people who survive to age 65, however, we exclude those who die before qualifying for
Social Security retirement benefits. According to Social Security projections, roughly 20 percent of men
and 12 percent of women born in 1960 will die between ages 18 and 64, and survivors tend to have
higher incomes and education than the early decedents (Favreault 2019).
FIGURE 14
Percentage of Adults Surviving to Age 65 Who Pay More in Social Security Payroll Taxes Than They
Receive in Lifetime Benefits
By birth year and reform plan, under payable scenarios
URBAN INSTITUTE
Source: DYNASIM4 ID980.
Notes: Figure includes all adults born between 1940 and 1999 who survive to age 65. Restricting the sample to people who
survive to age 65 helps to illustrate the effects for typical retirees, but understates the effects of differential mortality by income.
Couples split benefits and taxes in years in which they are married. Taxes include both employer and worker Social Security
payroll taxes and the Social Security net investment income tax. The present value is calculated at age 65 using a 2.6 percent real
discount rate.
0
10
20
30
40
50
60
70
80
1940-1949 1950-1959 1960-1969 1970-1979 1980-1989 1990-1999
Current law Biden Buttigieg Klobuchar Sanders Warren
Birth year
Percent
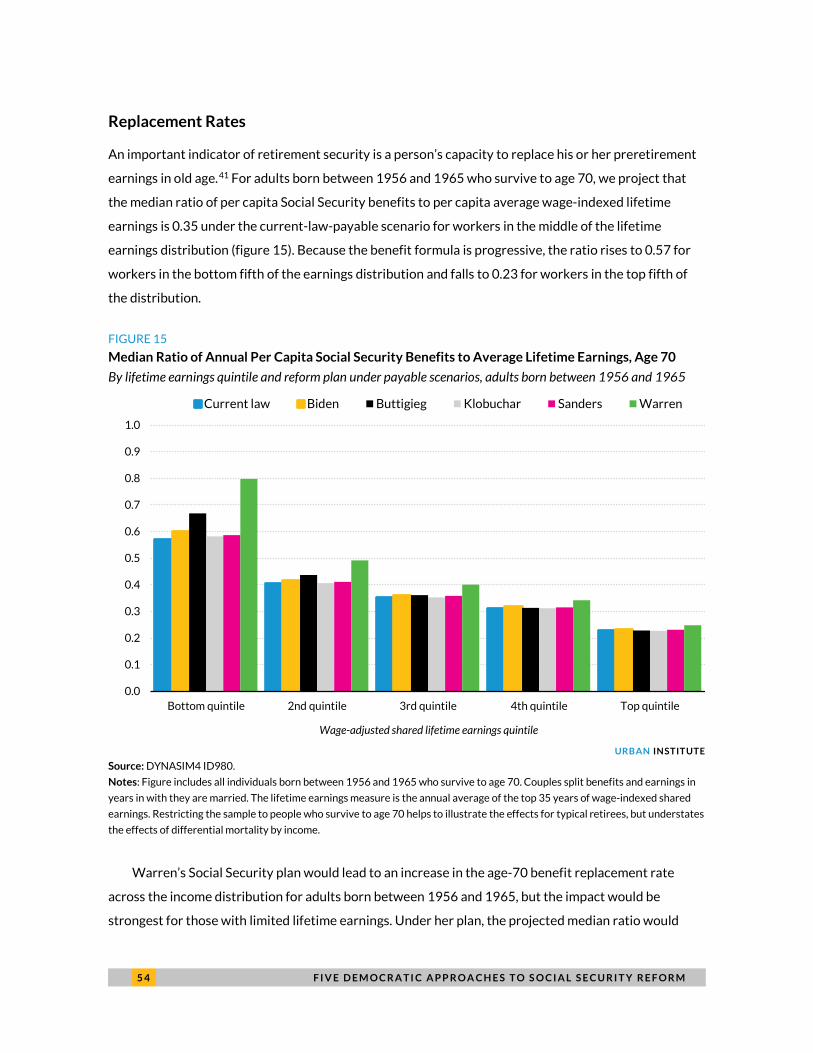
5 4 F I V E D E M O C R A T I C A P P R O A C H E S T O S O C I A L S E C U R I T Y R E F O R M
Replacement Rates
An important indicator of retirement security is a person’s capacity to replace his or her preretirement
earnings in old age.41 For adults born between 1956 and 1965 who survive to age 70, we project that
the median ratio of per capita Social Security benefits to per capita average wage-indexed lifetime
earnings is 0.35 under the current-law-payable scenario for workers in the middle of the lifetime
earnings distribution (figure 15). Because the benefit formula is progressive, the ratio rises to 0.57 for
workers in the bottom fifth of the earnings distribution and falls to 0.23 for workers in the top fifth of
the distribution.
FIGURE 15
Median Ratio of Annual Per Capita Social Security Benefits to Average Lifetime Earnings, Age 70
By lifetime earnings quintile and reform plan under payable scenarios, adults born between 1956 and 1965
URBAN INSTITUTE
Source: DYNASIM4 ID980.
Notes: Figure includes all individuals born between 1956 and 1965 who survive to age 70. Couples split benefits and earnings in
years in with they are married. The lifetime earnings measure is the annual average of the top 35 years of wage-indexed shared
earnings. Restricting the sample to people who survive to age 70 helps to illustrate the effects for typical retirees, but understates
the effects of differential mortality by income.
Warren’s Social Security plan would lead to an increase in the age-70 benefit replacement rate
across the income distribution for adults born between 1956 and 1965, but the impact would be
strongest for those with limited lifetime earnings. Under her plan, the projected median ratio would
0.0
0.1
0.2
0.3
0.4
0.5
0.6
0.7
0.8
0.9
1.0
Bottom quintile 2nd quintile 3rd quintile 4th quintile Top quintile
Current law Biden Buttigieg Klobuchar Sanders Warren
Wage-adjusted shared lifetime earnings quintile
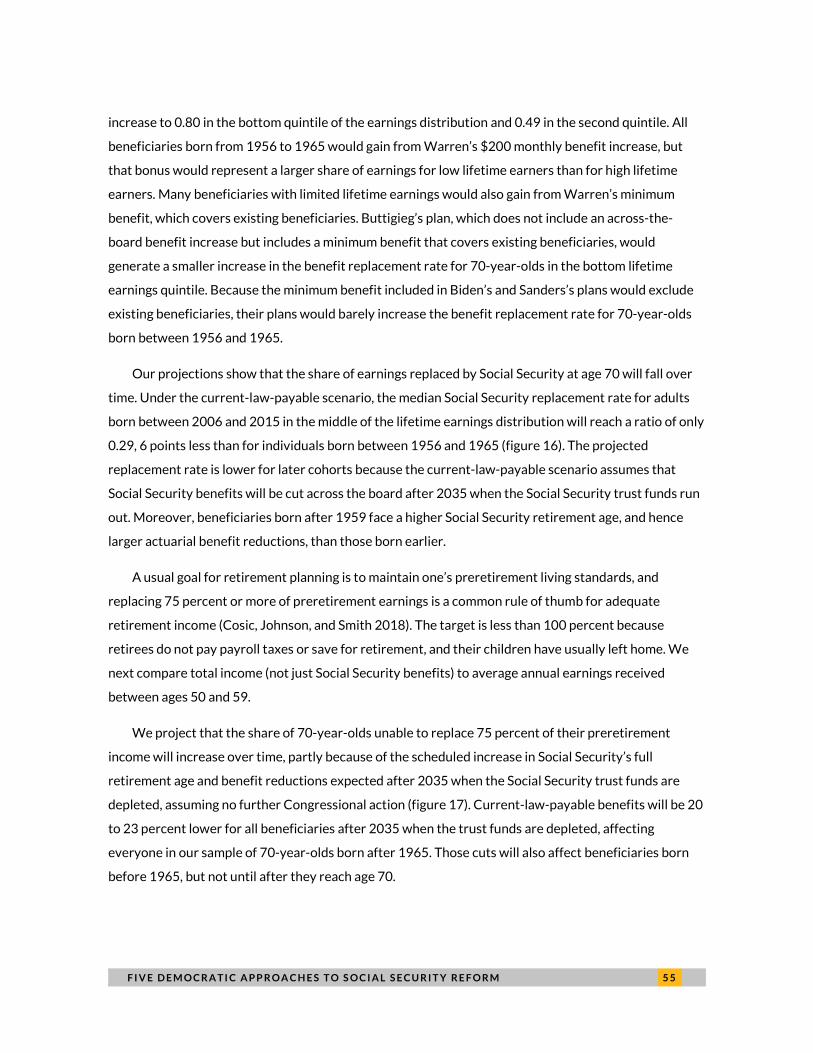
F I V E D E M O C R A T I C A P P R O A C H E S T O S O C I A L S E C U R I T Y R E F O R M 5 5
increase to 0.80 in the bottom quintile of the earnings distribution and 0.49 in the second quintile. All
beneficiaries born from 1956 to 1965 would gain from Warren’s $200 monthly benefit increase, but
that bonus would represent a larger share of earnings for low lifetime earners than for high lifetime
earners. Many beneficiaries with limited lifetime earnings would also gain from Warren’s minimum
benefit, which covers existing beneficiaries. Buttigieg’s plan, which does not include an across-the-
board benefit increase but includes a minimum benefit that covers existing beneficiaries, would
generate a smaller increase in the benefit replacement rate for 70-year-olds in the bottom lifetime
earnings quintile. Because the minimum benefit included in Biden’s and Sanders’s plans would exclude
existing beneficiaries, their plans would barely increase the benefit replacement rate for 70-year-olds
born between 1956 and 1965.
Our projections show that the share of earnings replaced by Social Security at age 70 will fall over
time. Under the current-law-payable scenario, the median Social Security replacement rate for adults
born between 2006 and 2015 in the middle of the lifetime earnings distribution will reach a ratio of only
0.29, 6 points less than for individuals born between 1956 and 1965 (figure 16). The projected
replacement rate is lower for later cohorts because the current-law-payable scenario assumes that
Social Security benefits will be cut across the board after 2035 when the Social Security trust funds run
out. Moreover, beneficiaries born after 1959 face a higher Social Security retirement age, and hence
larger actuarial benefit reductions, than those born earlier.
A usual goal for retirement planning is to maintain one’s preretirement living standards, and
replacing 75 percent or more of preretirement earnings is a common rule of thumb for adequate
retirement income (Cosic, Johnson, and Smith 2018). The target is less than 100 percent because
retirees do not pay payroll taxes or save for retirement, and their children have usually left home. We
next compare total income (not just Social Security benefits) to average annual earnings received
between ages 50 and 59.
We project that the share of 70-year-olds unable to replace 75 percent of their preretirement
income will increase over time, partly because of the scheduled increase in Social Security’s full
retirement age and benefit reductions expected after 2035 when the Social Security trust funds are
depleted, assuming no further Congressional action (figure 17). Current-law-payable benefits will be 20
to 23 percent lower for all beneficiaries after 2035 when the trust funds are depleted, affecting
everyone in our sample of 70-year-olds born after 1965. Those cuts will also affect beneficiaries born
before 1965, but not until after they reach age 70.
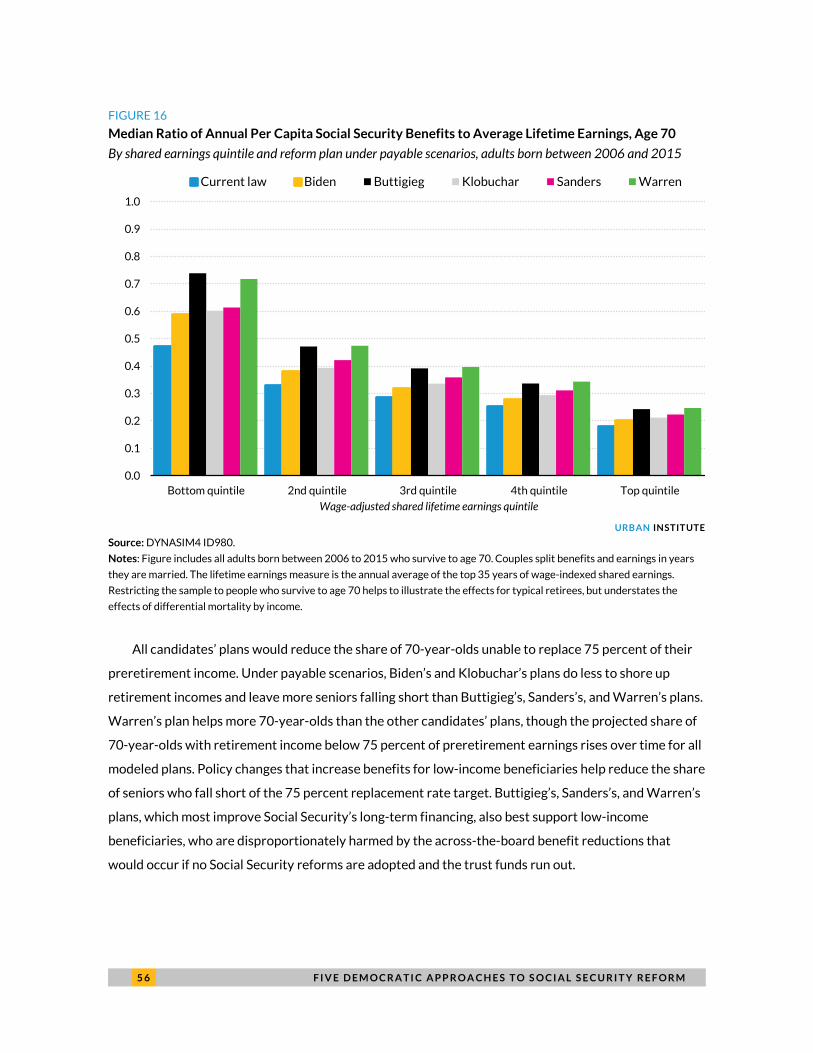
5 6 F I V E D E M O C R A T I C A P P R O A C H E S T O S O C I A L S E C U R I T Y R E F O R M
FIGURE 16
Median Ratio of Annual Per Capita Social Security Benefits to Average Lifetime Earnings, Age 70
By shared earnings quintile and reform plan under payable scenarios, adults born between 2006 and 2015
URBAN INSTITUTE
Source: DYNASIM4 ID980.
Notes: Figure includes all adults born between 2006 to 2015 who survive to age 70. Couples split benefits and earnings in years
they are married. The lifetime earnings measure is the annual average of the top 35 years of wage-indexed shared earnings.
Restricting the sample to people who survive to age 70 helps to illustrate the effects for typical retirees, but understates the
effects of differential mortality by income.
All candidates’ plans would reduce the share of 70-year-olds unable to replace 75 percent of their
preretirement income. Under payable scenarios, Biden’s and Klobuchar’s plans do less to shore up
retirement incomes and leave more seniors falling short than Buttigieg’s, Sanders’s, and Warren’s plans.
Warren’s plan helps more 70-year-olds than the other candidates’ plans, though the projected share of
70-year-olds with retirement income below 75 percent of preretirement earnings rises over time for all
modeled plans. Policy changes that increase benefits for low-income beneficiaries help reduce the share
of seniors who fall short of the 75 percent replacement rate target. Buttigieg’s, Sanders’s, and Warren’s
plans, which most improve Social Security’s long-term financing, also best support low-income
beneficiaries, who are disproportionately harmed by the across-the-board benefit reductions that
would occur if no Social Security reforms are adopted and the trust funds run out.
0.0
0.1
0.2
0.3
0.4
0.5
0.6
0.7
0.8
0.9
1.0
Bottom quintile 2nd quintile 3rd quintile 4th quintile Top quintile
Current law Biden Buttigieg Klobuchar Sanders Warren
Wage-adjusted shared lifetime earnings quintile
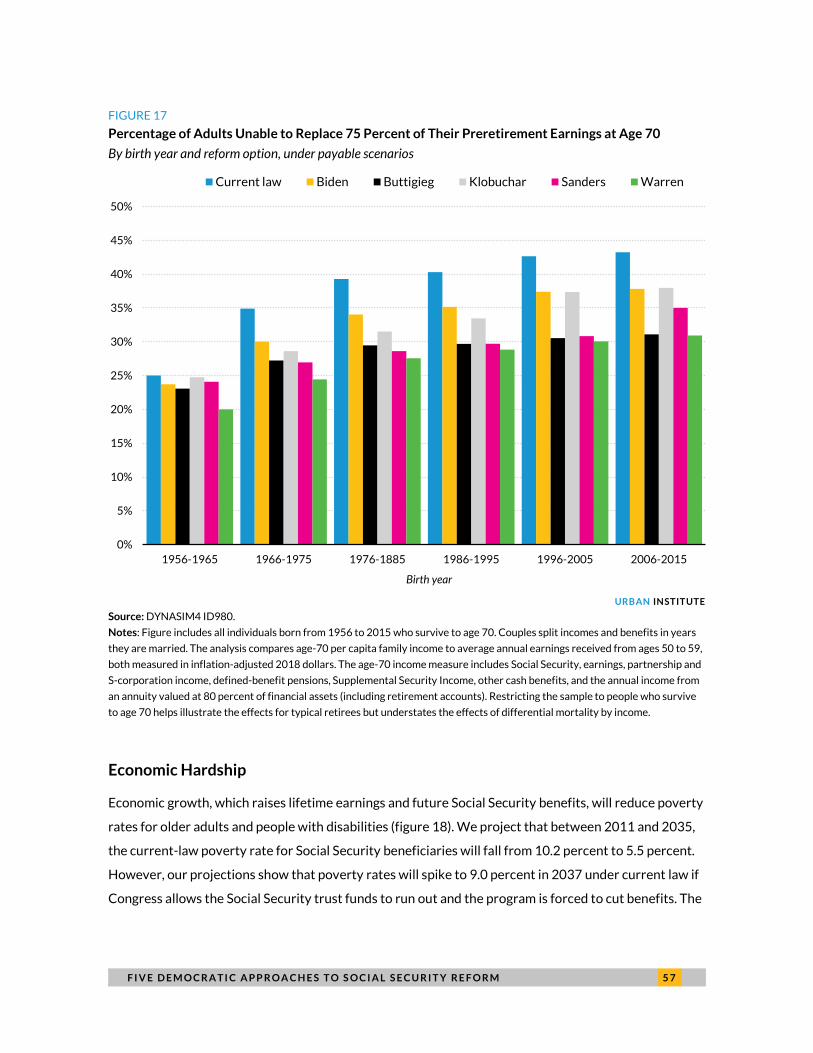
F I V E D E M O C R A T I C A P P R O A C H E S T O S O C I A L S E C U R I T Y R E F O R M 5 7
FIGURE 17
Percentage of Adults Unable to Replace 75 Percent of Their Preretirement Earnings at Age 70
By birth year and reform option, under payable scenarios
URBAN INSTITUTE
Source: DYNASIM4 ID980.
Notes: Figure includes all individuals born from 1956 to 2015 who survive to age 70. Couples split incomes and benefits in years
they are married. The analysis compares age-70 per capita family income to average annual earnings received from ages 50 to 59,
both measured in inflation-adjusted 2018 dollars. The age-70 income measure includes Social Security, earnings, partnership and
S-corporation income, defined-benefit pensions, Supplemental Security Income, other cash benefits, and the annual income from
an annuity valued at 80 percent of financial assets (including retirement accounts). Restricting the sample to people who survive
to age 70 helps illustrate the effects for typical retirees but understates the effects of differential mortality by income.
Economic Hardship
Economic growth, which raises lifetime earnings and future Social Security benefits, will reduce poverty
rates for older adults and people with disabilities (figure 18). We project that between 2011 and 2035,
the current-law poverty rate for Social Security beneficiaries will fall from 10.2 percent to 5.5 percent.
However, our projections show that poverty rates will spike to 9.0 percent in 2037 under current law if
Congress allows the Social Security trust funds to run out and the program is forced to cut benefits. The
0%
5%
10%
15%
20%
25%
30%
35%
40%
45%
50%
1956-1965 1966-1975 1976-1885 1986-1995 1996-2005 2006-2015
Current law Biden Buttigieg Klobuchar Sanders Warren
Birth year
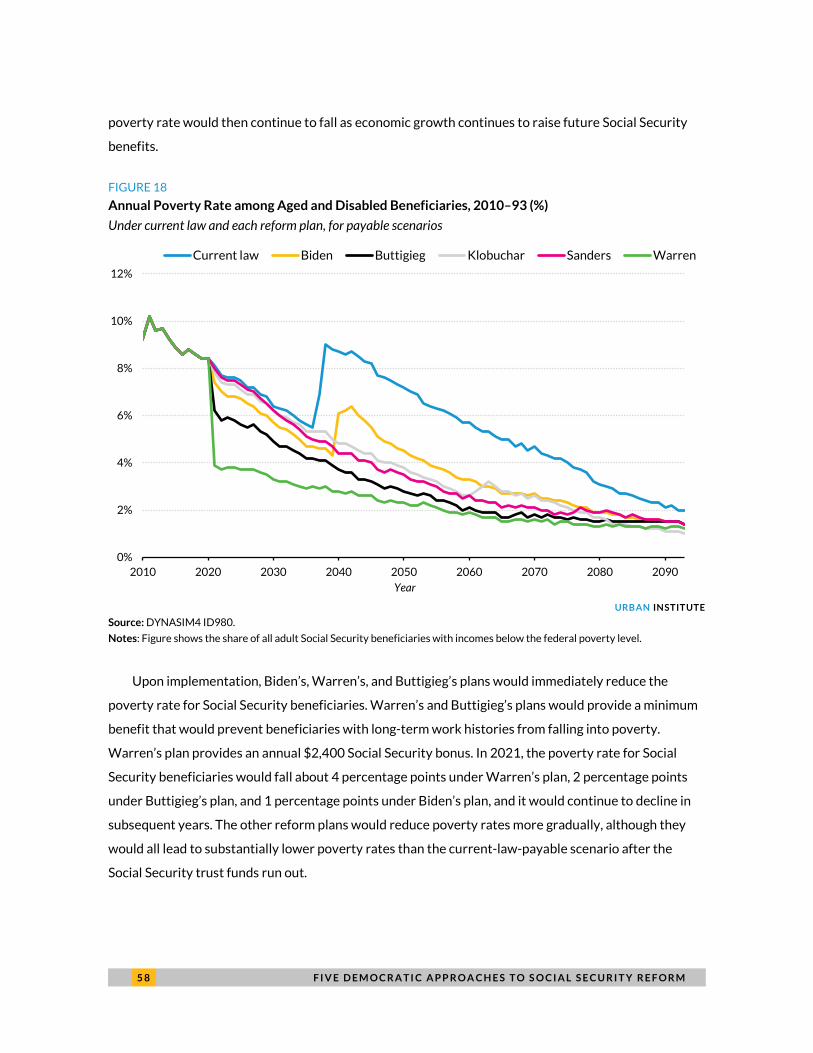
5 8 F I V E D E M O C R A T I C A P P R O A C H E S T O S O C I A L S E C U R I T Y R E F O R M
poverty rate would then continue to fall as economic growth continues to raise future Social Security
benefits.
FIGURE 18
Annual Poverty Rate among Aged and Disabled Beneficiaries, 2010–93 (%)
Under current law and each reform plan, for payable scenarios
URBAN INSTITUTE
Source: DYNASIM4 ID980.
Notes: Figure shows the share of all adult Social Security beneficiaries with incomes below the federal poverty level.
Upon implementation, Biden’s, Warren’s, and Buttigieg’s plans would immediately reduce the
poverty rate for Social Security beneficiaries. Warren’s and Buttigieg’s plans would provide a minimum
benefit that would prevent beneficiaries with long-term work histories from falling into poverty.
Warren’s plan provides an annual $2,400 Social Security bonus. In 2021, the poverty rate for Social
Security beneficiaries would fall about 4 percentage points under Warren’s plan, 2 percentage points
under Buttigieg’s plan, and 1 percentage points under Biden’s plan, and it would continue to decline in
subsequent years. The other reform plans would reduce poverty rates more gradually, although they
would all lead to substantially lower poverty rates than the current-law-payable scenario after the
Social Security trust funds run out.
0%
2%
4%
6%
8%
10%
12%
2010 2020 2030 2040 2050 2060 2070 2080 2090
Current law Biden Buttigieg Klobuchar Sanders Warren
Year
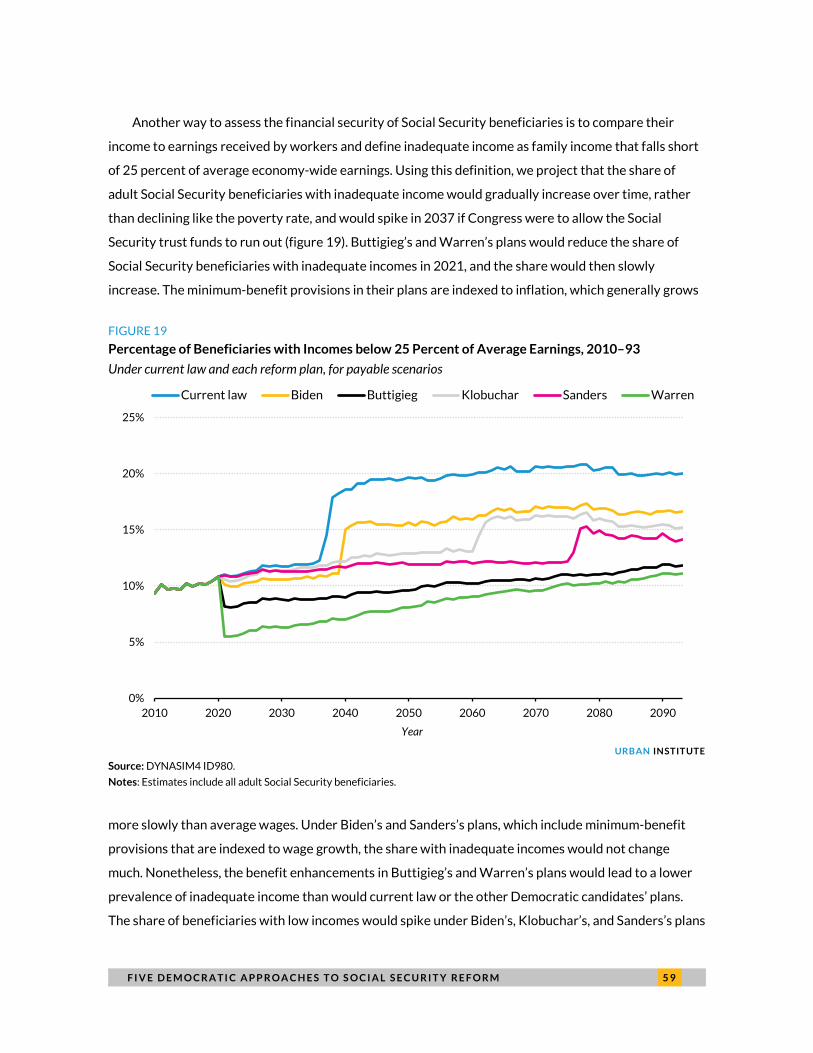
F I V E D E M O C R A T I C A P P R O A C H E S T O S O C I A L S E C U R I T Y R E F O R M 5 9
Another way to assess the financial security of Social Security beneficiaries is to compare their
income to earnings received by workers and define inadequate income as family income that falls short
of 25 percent of average economy-wide earnings. Using this definition, we project that the share of
adult Social Security beneficiaries with inadequate income would gradually increase over time, rather
than declining like the poverty rate, and would spike in 2037 if Congress were to allow the Social
Security trust funds to run out (figure 19). Buttigieg’s and Warren’s plans would reduce the share of
Social Security beneficiaries with inadequate incomes in 2021, and the share would then slowly
increase. The minimum-benefit provisions in their plans are indexed to inflation, which generally grows
FIGURE 19
Percentage of Beneficiaries with Incomes below 25 Percent of Average Earnings, 2010–93
Under current law and each reform plan, for payable scenarios
URBAN INSTITUTE
Source: DYNASIM4 ID980.
Notes: Estimates include all adult Social Security beneficiaries.
more slowly than average wages. Under Biden’s and Sanders’s plans, which include minimum-benefit
provisions that are indexed to wage growth, the share with inadequate incomes would not change
much. Nonetheless, the benefit enhancements in Buttigieg’s and Warren’s plans would lead to a lower
prevalence of inadequate income than would current law or the other Democratic candidates’ plans.
The share of beneficiaries with low incomes would spike under Biden’s, Klobuchar’s, and Sanders’s plans
0%
5%
10%
15%
20%
25%
2010 2020 2030 2040 2050 2060 2070 2080 2090
Current law Biden Buttigieg Klobuchar Sanders Warren
Year
6 0 F I V E D E M O C R A T I C A P P R O A C H E S T O S O C I A L S E C U R I T Y R E F O R M
when those plans require solvency-related benefit reductions, but those shares would remain well
below the share that would prevail under the current-law-payable scenario.
Income of Aged and Disabled Adults
Under the current-law-payable scenario, the projected median per capita net income of older adults and
people with disabilities in 2065 is $36,500 (table 12). Median incomes are lower for Black people,
Hispanic people, women, people age 85 or older, divorced or never-married adults, and people who
receive disability benefits, especially at younger ages. Outcomes also vary sharply by educational
attainment. Median income for college graduates is more than four times as high as the median for
adults who did not complete high school and more than twice as high as the median for high school
graduates who never attended college.
Our projections indicate that median per capita net income would increase under all the candidates’
plans. Median net income in 2065 would be 9 percent higher under Biden’s and Klobuchar’s plans, 20
percent higher under Sanders’s plan, 21 percent higher under Buttigieg’s plan, and 25 percent higher
under Warren’s plan. Each plan would increase median incomes across all demographic groups, but
certain groups would gain more than others. Although specific impacts vary by plan, the largest
percentage gains would generally go to beneficiaries with the lowest incomes and lowest lifetime
earnings, including Disability Insurance beneficiaries; Black people and Hispanic people; less-educated
adults; women; the oldest adults; and widowed, divorced, and never-married beneficiaries. Warren’s
plan generally would increase projected median income for the lowest-income subgroups more than the
other candidates’ plans, including a 63 percent increase for those in the bottom income quintile, a 61
percent increase for those in the bottom lifetime-earnings quintile, a 32 percent increase for individuals
with fewer than 10 years of work, and a 65 percent increase among individuals without a high school
diploma. These subgroups would benefit from Warren’s $200 monthly benefit increase, minimum-
benefit provisions, and caregiver credits. Buttigieg’s plan would also increase net incomes for the
lowest-income subgroups, but gains for each subgroup would generally be somewhat smaller than
under Warren’s plan. However, Buttigieg’s plan’s more generous caregiver credit increases net incomes
more for people with fewer work years than Warren’s plan.
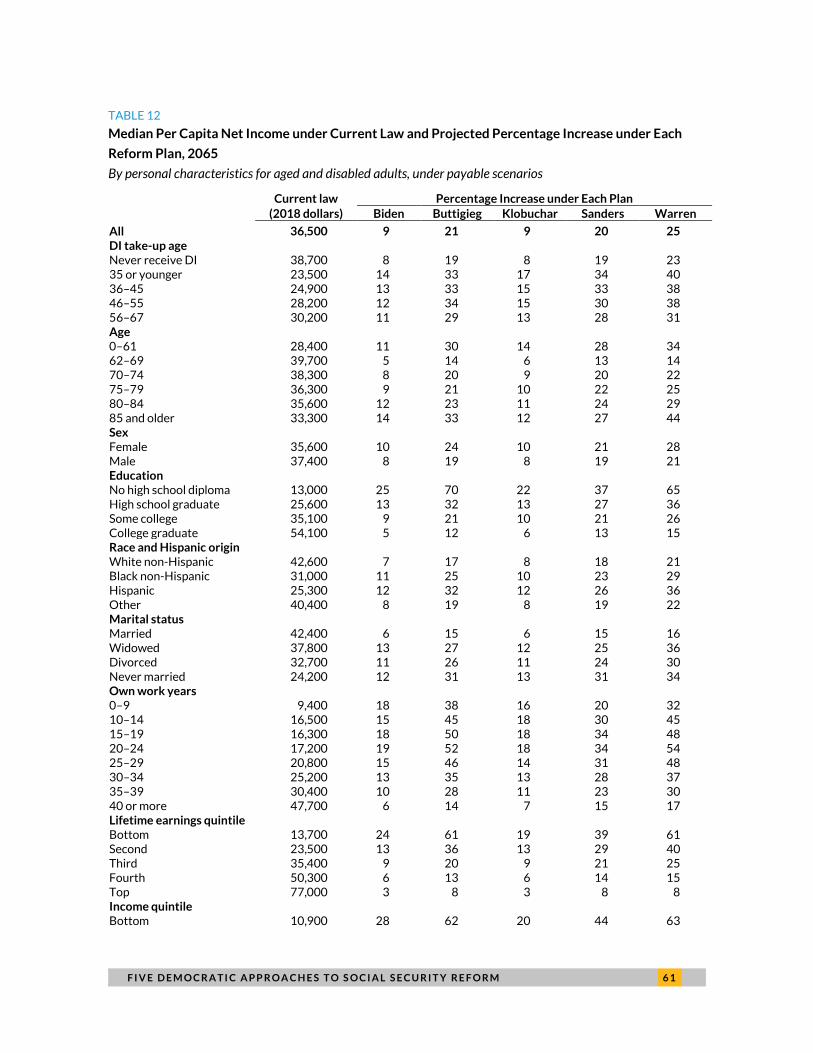
F I V E D E M O C R A T I C A P P R O A C H E S T O S O C I A L S E C U R I T Y R E F O R M 6 1
TABLE 12
Median Per Capita Net Income under Current Law and Projected Percentage Increase under Each
Reform Plan, 2065
By personal characteristics for aged and disabled adults, under payable scenarios
Current law Percentage Increase under Each Plan
(2018 dollars) Biden Buttigieg Klobuchar Sanders Warren
All 36,500 9 21 9 20 25 DI take-up age Never receive DI 38,700 8 19 8 19 23 35 or younger 23,500 14 33 17 34 40 36–45 24,900 13 33 15 33 38 46–55 28,200 12 34 15 30 38 56–67 30,200 11 29 13 28 31 Age 0–61 28,400 11 30 14 28 34 62–69 39,700 5 14 6 13 14 70–74 38,300 8 20 9 20 22 75–79 36,300 9 21 10 22 25 80–84 35,600 12 23 11 24 29 85 and older 33,300 14 33 12 27 44 Sex Female 35,600 10 24 10 21 28 Male 37,400 8 19 8 19 21 Education No high school diploma 13,000 25 70 22 37 65 High school graduate 25,600 13 32 13 27 36 Some college 35,100 9 21 10 21 26 College graduate 54,100 5 12 6 13 15 Race and Hispanic origin White non-Hispanic 42,600 7 17 8 18 21 Black non-Hispanic 31,000 11 25 10 23 29 Hispanic 25,300 12 32 12 26 36 Other 40,400 8 19 8 19 22 Marital status Married 42,400 6 15 6 15 16 Widowed 37,800 13 27 12 25 36 Divorced 32,700 11 26 11 24 30 Never married 24,200 12 31 13 31 34 Own work years 0–9 9,400 18 38 16 20 32 10–14 16,500 15 45 18 30 45 15–19 16,300 18 50 18 34 48 20–24 17,200 19 52 18 34 54 25–29 20,800 15 46 14 31 48 30–34 25,200 13 35 13 28 37 35–39 30,400 10 28 11 23 30 40 or more 47,700 6 14 7 15 17 Lifetime earnings quintile Bottom 13,700 24 61 19 39 61 Second 23,500 13 36 13 29 40 Third 35,400 9 20 9 21 25 Fourth 50,300 6 13 6 14 15 Top 77,000 3 8 3 8 8 Income quintile Bottom 10,900 28 62 20 44 63
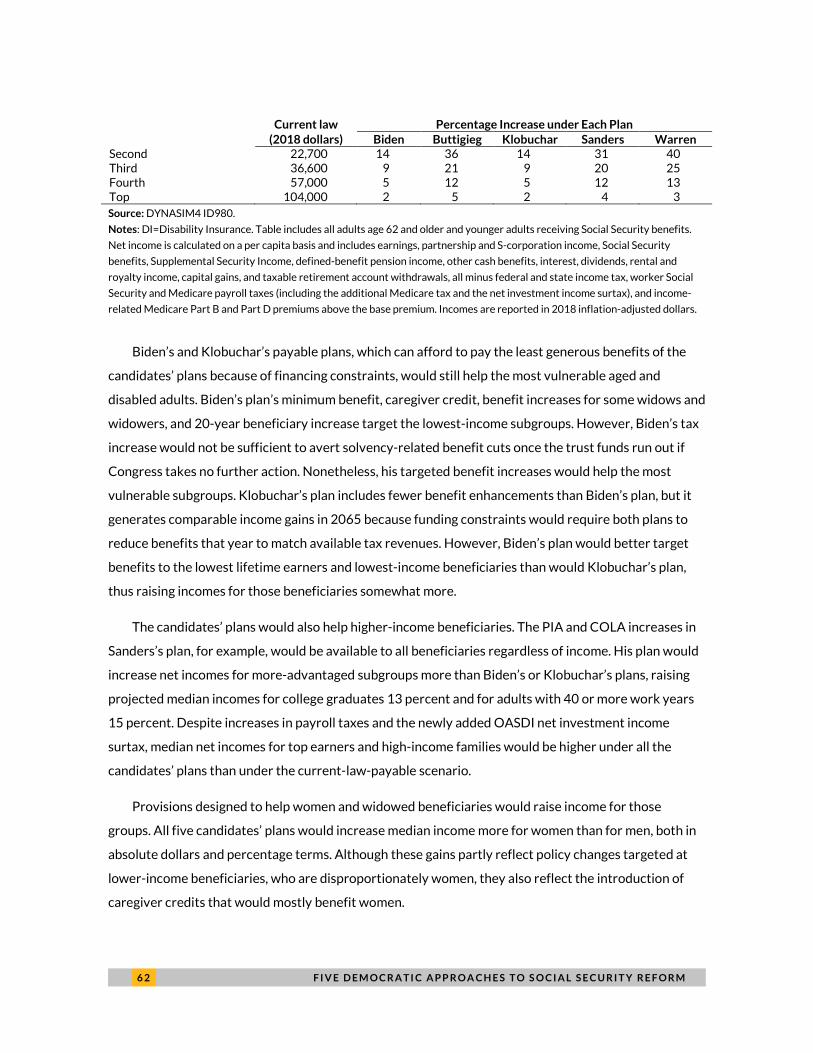
6 2 F I V E D E M O C R A T I C A P P R O A C H E S T O S O C I A L S E C U R I T Y R E F O R M
Current law Percentage Increase under Each Plan
(2018 dollars) Biden Buttigieg Klobuchar Sanders Warren Second 22,700 14 36 14 31 40 Third 36,600 9 21 9 20 25 Fourth 57,000 5 12 5 12 13 Top 104,000 2 5 2 4 3 Source: DYNASIM4 ID980.
Notes: DI=Disability Insurance. Table includes all adults age 62 and older and younger adults receiving Social Security benefits.
Net income is calculated on a per capita basis and includes earnings, partnership and S-corporation income, Social Security
benefits, Supplemental Security Income, defined-benefit pension income, other cash benefits, interest, dividends, rental and
royalty income, capital gains, and taxable retirement account withdrawals, all minus federal and state income tax, worker Social
Security and Medicare payroll taxes (including the additional Medicare tax and the net investment income surtax), and income-
related Medicare Part B and Part D premiums above the base premium. Incomes are reported in 2018 inflation-adjusted dollars.
Biden’s and Klobuchar’s payable plans, which can afford to pay the least generous benefits of the
candidates’ plans because of financing constraints, would still help the most vulnerable aged and
disabled adults. Biden’s plan’s minimum benefit, caregiver credit, benefit increases for some widows and
widowers, and 20-year beneficiary increase target the lowest-income subgroups. However, Biden’s tax
increase would not be sufficient to avert solvency-related benefit cuts once the trust funds run out if
Congress takes no further action. Nonetheless, his targeted benefit increases would help the most
vulnerable subgroups. Klobuchar’s plan includes fewer benefit enhancements than Biden’s plan, but it
generates comparable income gains in 2065 because funding constraints would require both plans to
reduce benefits that year to match available tax revenues. However, Biden’s plan would better target
benefits to the lowest lifetime earners and lowest-income beneficiaries than would Klobuchar’s plan,
thus raising incomes for those beneficiaries somewhat more.
The candidates’ plans would also help higher-income beneficiaries. The PIA and COLA increases in
Sanders’s plan, for example, would be available to all beneficiaries regardless of income. His plan would
increase net incomes for more-advantaged subgroups more than Biden’s or Klobuchar’s plans, raising
projected median incomes for college graduates 13 percent and for adults with 40 or more work years
15 percent. Despite increases in payroll taxes and the newly added OASDI net investment income
surtax, median net incomes for top earners and high-income families would be higher under all the
candidates’ plans than under the current-law-payable scenario.
Provisions designed to help women and widowed beneficiaries would raise income for those
groups. All five candidates’ plans would increase median income more for women than for men, both in
absolute dollars and percentage terms. Although these gains partly reflect policy changes targeted at
lower-income beneficiaries, who are disproportionately women, they also reflect the introduction of
caregiver credits that would mostly benefit women.
F I V E D E M O C R A T I C A P P R O A C H E S T O S O C I A L S E C U R I T Y R E F O R M 6 3
How Are Tax and Benefit Changes Distributed?
An important question when evaluating policy proposals is how the costs and benefits of the policy
option are distributed across the population. If the goal of the Democratic candidates’ Social Security
plans is to redistribute resources to needy retirees and people with disabilities, it is instructive to
measure the share of new benefits provided by each plan that go to low-income Social Security
beneficiaries and the share of new taxes that are paid by high-income taxpayers. Our analysis examines
the distribution of new taxes and benefits under each plan in 2065, when the candidates’ proposals
would be fully implemented.
Change in Taxes by Income
The change in tax revenues generated by each candidate’s plan varies because of differences in how
they would treat investment income and high-wage earners and how much they would increase taxable
Social Security benefits. On the low end, Biden’s plan would raise annual taxes by $209 billion in 2065
and Klobuchar’s plan would raise annual taxes by $212 billion (table 13). Klobuchar’s plan would
generate slightly more revenue because it would pay higher Social Security benefits, some of which
would be taxable, than Biden’s plan. The other plans would increase tax collection much more, with
Sanders’s plan collecting an additional $464 billion, Buttigieg’s collecting an additional $774 billion, and
Warren’s collecting an additional $915 billion relative to the current law. Sanders’s and Warren’s plans
would both tax investment income, but Warren’s would collect nearly twice as much additional tax as
Sanders’s because hers would impose a higher payroll and investment income tax rate (14.8 versus 12.4
percent) and would tax partnership and S corporation income, unlike the other plans. Buttigieg’s plan
would apply an additional 17 percent surtax on high earnings in 2065 to achieve Social Security
solvency.
All five candidates’ plans would concentrate tax increases among high-income taxpayers, with the
top 20 percent of taxpayers paying between 74 and 87 percent of the additional tax. In 2065, the top 20
percent of taxpayers would pay 78 percent of the additional tax under both Biden’s and Klobuchar’s
plans. The share of the burden borne by the top 20 percent would be higher under Buttigieg’s plan (87
percent) and Warren’s plan (84 percent) because Buttigieg’s plan would add a surtax on workers with
high earnings and Warren’s would add a surtax on investment income and partnership and S
corporation income, which are highly concentrated among high-income adults. The top 1 percent of
taxpayers would pay 62 percent of the additional taxes collected by both Warren’s and Buttigieg’s
plans. Although the payroll and investment income tax increases target upper-income taxpayers, some
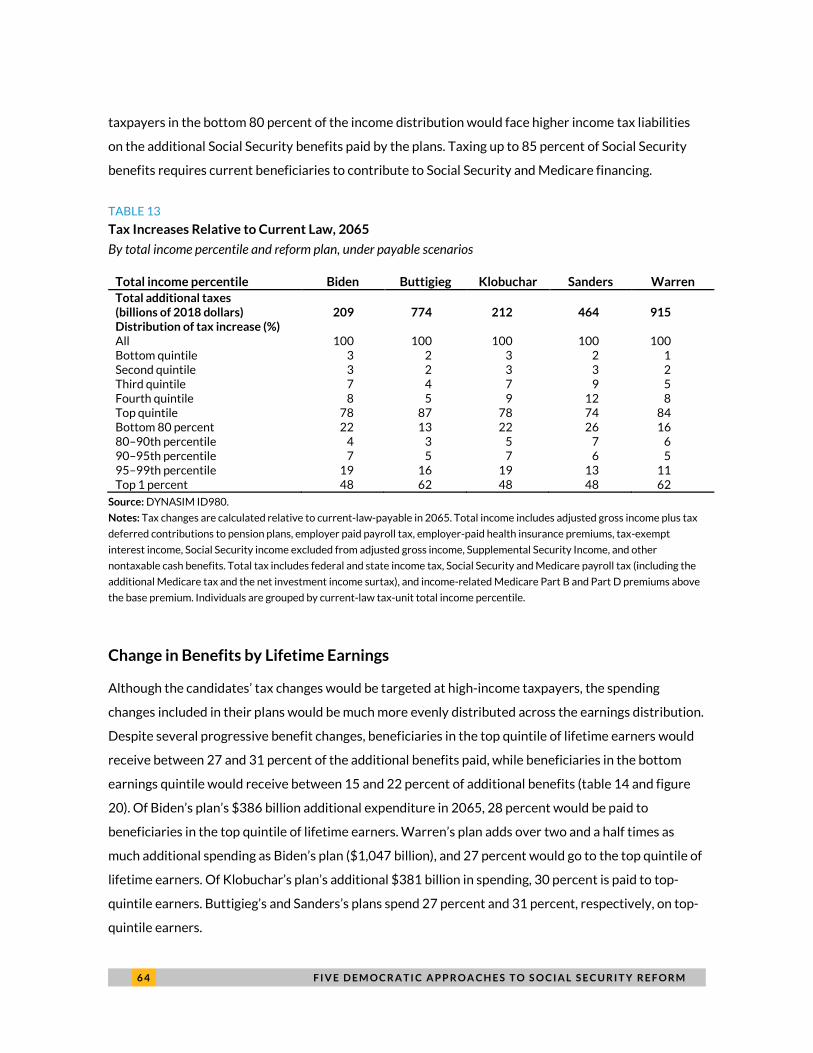
6 4 F I V E D E M O C R A T I C A P P R O A C H E S T O S O C I A L S E C U R I T Y R E F O R M
taxpayers in the bottom 80 percent of the income distribution would face higher income tax liabilities
on the additional Social Security benefits paid by the plans. Taxing up to 85 percent of Social Security
benefits requires current beneficiaries to contribute to Social Security and Medicare financing.
TABLE 13
Tax Increases Relative to Current Law, 2065
By total income percentile and reform plan, under payable scenarios
Total income percentile Biden Buttigieg Klobuchar Sanders Warren Total additional taxes (billions of 2018 dollars) 209 774 212 464 915 Distribution of tax increase (%) All 100 100 100 100 100 Bottom quintile 3 2 3 2 1 Second quintile 3 2 3 3 2 Third quintile 7 4 7 9 5 Fourth quintile 8 5 9 12 8 Top quintile 78 87 78 74 84 Bottom 80 percent 22 13 22 26 16 80–90th percentile 4 3 5 7 6 90–95th percentile 7 5 7 6 5 95–99th percentile 19 16 19 13 11 Top 1 percent 48 62 48 48 62
Source: DYNASIM ID980.
Notes: Tax changes are calculated relative to current-law-payable in 2065. Total income includes adjusted gross income plus tax
deferred contributions to pension plans, employer paid payroll tax, employer-paid health insurance premiums, tax-exempt
interest income, Social Security income excluded from adjusted gross income, Supplemental Security Income, and other
nontaxable cash benefits. Total tax includes federal and state income tax, Social Security and Medicare payroll tax (including the
additional Medicare tax and the net investment income surtax), and income-related Medicare Part B and Part D premiums above
the base premium. Individuals are grouped by current-law tax-unit total income percentile.
Change in Benefits by Lifetime Earnings
Although the candidates’ tax changes would be targeted at high-income taxpayers, the spending
changes included in their plans would be much more evenly distributed across the earnings distribution.
Despite several progressive benefit changes, beneficiaries in the top quintile of lifetime earners would
receive between 27 and 31 percent of the additional benefits paid, while beneficiaries in the bottom
earnings quintile would receive between 15 and 22 percent of additional benefits (table 14 and figure
20). Of Biden’s plan’s $386 billion additional expenditure in 2065, 28 percent would be paid to
beneficiaries in the top quintile of lifetime earners. Warren’s plan adds over two and a half times as
much additional spending as Biden’s plan ($1,047 billion), and 27 percent would go to the top quintile of
lifetime earners. Of Klobuchar’s plan’s additional $381 billion in spending, 30 percent is paid to top-
quintile earners. Buttigieg’s and Sanders’s plans spend 27 percent and 31 percent, respectively, on top-
quintile earners.
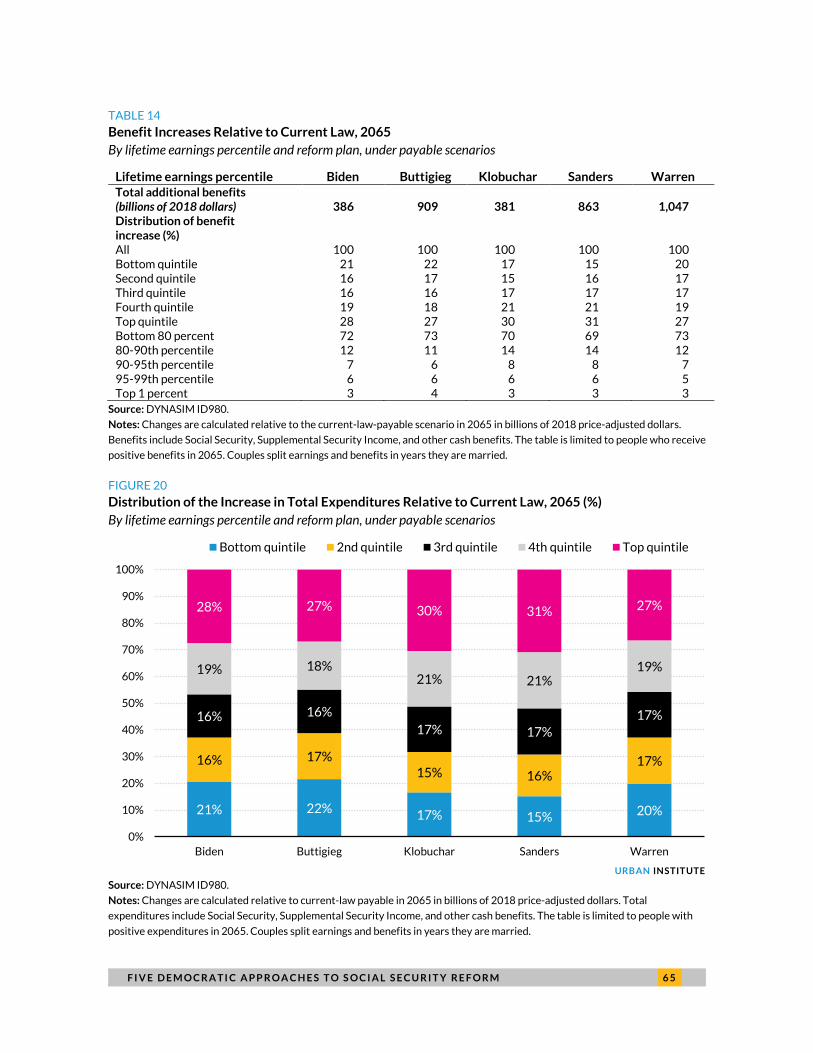
F I V E D E M O C R A T I C A P P R O A C H E S T O S O C I A L S E C U R I T Y R E F O R M 6 5
TABLE 14
Benefit Increases Relative to Current Law, 2065 By lifetime earnings percentile and reform plan, under payable scenarios
Lifetime earnings percentile Biden Buttigieg Klobuchar Sanders Warren Total additional benefits (billions of 2018 dollars) 386 909 381 863 1,047 Distribution of benefit increase (%) All 100 100 100 100 100 Bottom quintile 21 22 17 15 20 Second quintile 16 17 15 16 17 Third quintile 16 16 17 17 17 Fourth quintile 19 18 21 21 19 Top quintile 28 27 30 31 27 Bottom 80 percent 72 73 70 69 73 80-90th percentile 12 11 14 14 12 90-95th percentile 7 6 8 8 7 95-99th percentile 6 6 6 6 5 Top 1 percent 3 4 3 3 3
Source: DYNASIM ID980.
Notes: Changes are calculated relative to the current-law-payable scenario in 2065 in billions of 2018 price-adjusted dollars.
Benefits include Social Security, Supplemental Security Income, and other cash benefits. The table is limited to people who receive
positive benefits in 2065. Couples split earnings and benefits in years they are married.
FIGURE 20
Distribution of the Increase in Total Expenditures Relative to Current Law, 2065 (%) By lifetime earnings percentile and reform plan, under payable scenarios
URBAN INSTITUTE
Source: DYNASIM ID980.
Notes: Changes are calculated relative to current-law payable in 2065 in billions of 2018 price-adjusted dollars. Total
expenditures include Social Security, Supplemental Security Income, and other cash benefits. The table is limited to people with
positive expenditures in 2065. Couples split earnings and benefits in years they are married.
21% 22% 17% 15% 20%
16% 17%15% 16%
17%
16% 16%17% 17%
17%
19% 18%21% 21%
19%
28% 27% 30% 31% 27%
0%
10%
20%
30%
40%
50%
60%
70%
80%
90%
100%
Biden Buttigieg Klobuchar Sanders Warren
Bottom quintile 2nd quintile 3rd quintile 4th quintile Top quintile
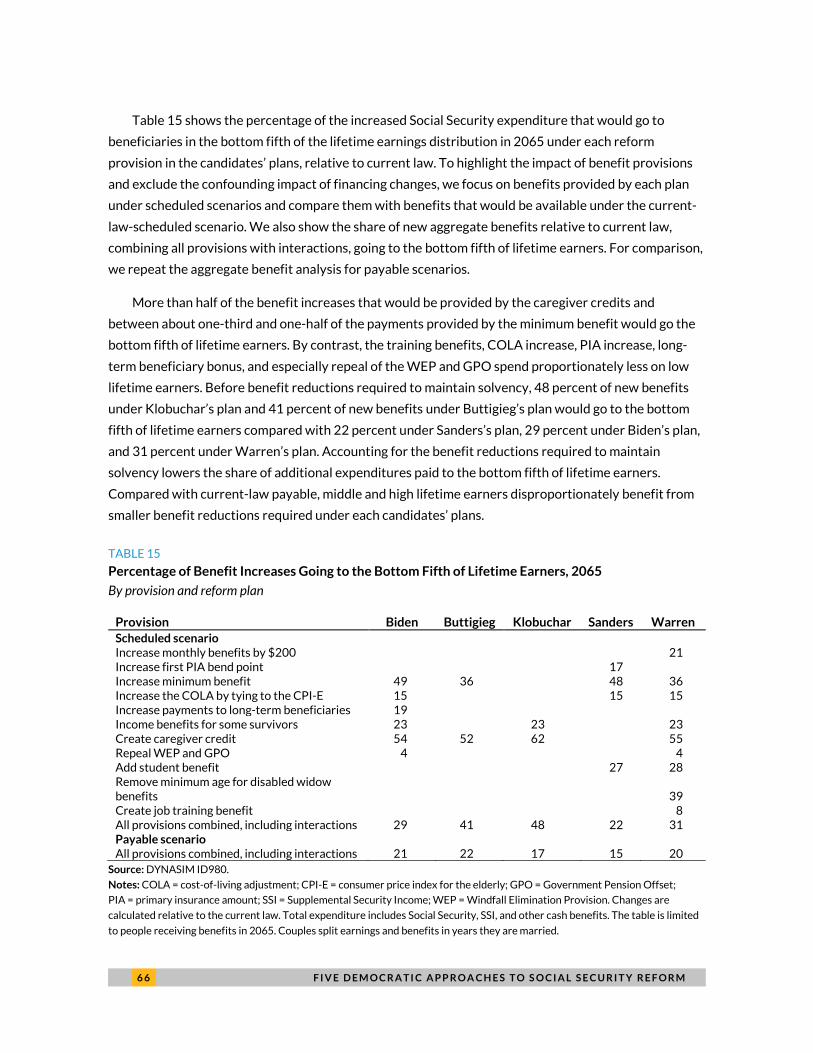
6 6 F I V E D E M O C R A T I C A P P R O A C H E S T O S O C I A L S E C U R I T Y R E F O R M
Table 15 shows the percentage of the increased Social Security expenditure that would go to
beneficiaries in the bottom fifth of the lifetime earnings distribution in 2065 under each reform
provision in the candidates’ plans, relative to current law. To highlight the impact of benefit provisions
and exclude the confounding impact of financing changes, we focus on benefits provided by each plan
under scheduled scenarios and compare them with benefits that would be available under the current-
law-scheduled scenario. We also show the share of new aggregate benefits relative to current law,
combining all provisions with interactions, going to the bottom fifth of lifetime earners. For comparison,
we repeat the aggregate benefit analysis for payable scenarios.
More than half of the benefit increases that would be provided by the caregiver credits and
between about one-third and one-half of the payments provided by the minimum benefit would go the
bottom fifth of lifetime earners. By contrast, the training benefits, COLA increase, PIA increase, long-
term beneficiary bonus, and especially repeal of the WEP and GPO spend proportionately less on low
lifetime earners. Before benefit reductions required to maintain solvency, 48 percent of new benefits
under Klobuchar’s plan and 41 percent of new benefits under Buttigieg’s plan would go to the bottom
fifth of lifetime earners compared with 22 percent under Sanders’s plan, 29 percent under Biden’s plan,
and 31 percent under Warren’s plan. Accounting for the benefit reductions required to maintain
solvency lowers the share of additional expenditures paid to the bottom fifth of lifetime earners.
Compared with current-law payable, middle and high lifetime earners disproportionately benefit from
smaller benefit reductions required under each candidates’ plans.
TABLE 15
Percentage of Benefit Increases Going to the Bottom Fifth of Lifetime Earners, 2065
By provision and reform plan
Provision Biden Buttigieg Klobuchar Sanders Warren Scheduled scenario Increase monthly benefits by $200 21 Increase first PIA bend point 17 Increase minimum benefit 49 36 48 36 Increase the COLA by tying to the CPI-E 15 15 15 Increase payments to long-term beneficiaries 19 Income benefits for some survivors 23 23 23 Create caregiver credit 54 52 62 55 Repeal WEP and GPO 4 4 Add student benefit 27 28 Remove minimum age for disabled widow benefits 39 Create job training benefit 8 All provisions combined, including interactions 29 41 48 22 31 Payable scenario All provisions combined, including interactions 21 22 17 15 20
Source: DYNASIM ID980.
Notes: COLA = cost-of-living adjustment; CPI-E = consumer price index for the elderly; GPO = Government Pension Offset;
PIA = primary insurance amount; SSI = Supplemental Security Income; WEP = Windfall Elimination Provision. Changes are
calculated relative to the current law. Total expenditure includes Social Security, SSI, and other cash benefits. The table is limited
to people receiving benefits in 2065. Couples split earnings and benefits in years they are married.
F I V E D E M O C R A T I C A P P R O A C H E S T O S O C I A L S E C U R I T Y R E F O R M 6 7
Conclusions
In response to Social Security’s long-term financing gap and the economic pressures squeezing some
older adults and people with disabilities, many candidates for the 2020 Democratic presidential
nomination developed detailed plans to reform the program. These plans embody many of the Social
Security reform ideas circulating among centrist and left-leaning policymakers and policy analysts.
All the plans we examined would improve Social Security’s finances by collecting more revenue
from high-income taxpayers, but the plans differ in how much they would raise tax rates and what
additional income sources they would tax to help fund Social Security. Biden’s plan would raise the least
amount of additional revenue, only extending Social Security’s payroll tax to earnings above $400,000 a
year. Warren’s plan would raise taxes most, extending the payroll tax on earnings above $250,000 a
year and imposing a higher tax rate on those earnings than on lower earnings. Her plan would also tax
investment income received by high-income people and distributions to active participants in
partnerships, S corporations, and limited-liability companies, income sources that are not currently
subject to Social Security taxes. We project that Warren’s plan would raise program revenues about 45
percent relative to current law in 2045 and that these changes would eliminate Social Security’s
financial shortfall over the next 75 years. Buttigieg’s plan, which would eventually tax high-earning
workers even more than Warren’s plan, is the only other plan we examine that would achieve long-term
Social Security solvency. Although the other plans we examine would not eliminate Social Security’s
long-term financing gap, they would significantly improve Social Security’s finances and delay the date
when the program trust funds are expected to run out and substantial benefit cuts would be necessary.
The significant tax hikes included in many of these plans could deter economic growth. In the short
run, tax increases would reduce disposable income and could limit consumer spending, depressing
employment, but this could be partially offset by benefit increases, which increase retirees’ disposable
income. In the long run, boosting marginal tax rates on wages and investment income can discourage
work, entrepreneurial activity, and savings, reducing economic growth. Our analysis does not account
for such macroeconomic impacts, which could affect our solvency estimates.
The Democratic plans we examine would use some of the additional revenues they collect to
significantly expand Social Security and increase payments to beneficiaries. In 2065, compared with the
current law under payable scenarios, program spending would increase about 50 percent under
Warren’s plan, more than 40 percent under Buttigieg’s and Sanders’s plans, and nearly 20 percent
under Klobuchar’s and Biden’s plans. The plans would boost median incomes and reduce economic
hardship for older adults and people with disabilities, increase lifetime benefits as a share of lifetime
earnings, and raise the share of preretirement earnings that Social Security replaces.
6 8 F I V E D E M O C R A T I C A P P R O A C H E S T O S O C I A L S E C U R I T Y R E F O R M
Many of the benefit enhancements, including the introduction of a significant minimum benefit and
caregiver credits, would target low-income adults. Other benefit provisions, such as the COLA increase,
Sanders’s PIA increase, and Warren’s $200 monthly benefit bonus, would boost payments to all
beneficiaries regardless of income. Biden’s benefit bump-up for long-term beneficiaries (who are more
likely to survive to older ages than younger beneficiaries) and the elimination of the WEP and GPO
would favor higher-income beneficiaries. Much of the increased spending provided by the candidates’
plans would result from avoiding, at least temporarily, potential benefit cuts prompted by the depletion
of Social Security’s trust funds. Because those cuts would hit beneficiaries receiving large payments
hardest, avoiding the cuts would favor high-income beneficiaries. Overall, more of the additional
benefits paid by the candidates’ plans would go to beneficiaries in the top fifth of the lifetime earnings
distribution than to beneficiaries in the bottom fifth of the distribution.
The timing of benefit increases relative to tax increases affects which generations pay for and
benefit from the reforms. Under most of the candidates’ plans, people born in the late 1950s and early
1960s would receive many of the added benefits without having to pay much of the cost. Collecting
added program revenue from workers largely exempts earlier generations from having to pay for a
better-funded system, but those earlier generations would receive higher benefits for much of their
retirement. Taxing investment income would force some of today’s high-income seniors to contribute to
Social Security financing. Plans that rely solely on earnings-based financing relegate more of the
financing burden to later cohorts.
Other plan details also matter. Minimum benefits that promise payments equal to 125 percent of
the FPL to workers with 30 or more years of work help current beneficiaries more than future
beneficiaries. Most people with 30 or more years of work currently receive or will receive incomes
above the FPL; most people with income below the FPL, including people with disabilities and
caregivers, have worked relatively few years (Favreault 2010, 2018). Reform plans that limit minimum
benefits to new beneficiaries help fewer low-income seniors than those that provide minimum benefits
to all beneficiaries.
Caregiver credits help many low-income beneficiaries, particularly those who care for disabled
spouses and children. These caregivers experience income losses from both their own reduced
employment and their disabled family member’s lack of employment. Caregiver credits paired with
enhanced minimum benefits increase both their own Social Security benefits and the spousal and
dependent benefits they generate for eligible family members.
Strengthening protections outside of Social Security could also help low-income older adults and
people with disabilities. Modest increases in SSI benefits could cost less than providing caregiver
F I V E D E M O C R A T I C A P P R O A C H E S T O S O C I A L S E C U R I T Y R E F O R M 6 9
credits, tying COLAs to the CPI-E, or guaranteeing a minimum benefit, but they could do more to reduce
the poverty rate for older adults and people with disabilities than any of those provisions.
Ultimately, the choice between more or less generous retirement and disability supports is a
political decision. All the Democratic candidates have opted for a more generous social insurance
system and avoid cutting scheduled payments to even the highest-income beneficiaries. Buttigieg’s,
Sanders’s, and Warren’s plans show that we can provide retirees and people with disabilities much more
generous benefits as long as we are willing to increase program funding. Biden’s and Klobuchar’s plans
are less generous in terms of new benefits but illustrate how modest changes in benefits and financing
can nonetheless improve the financial security of older and disabled Americans. Many of the
Democratic candidates, including Biden, also propose significant expansions to SSI. Increasing SSI
benefits and relaxing eligibility requirements could reduce poverty rates for older adults and people
with disabilities more than the minimum benefit increases in many of the candidates’ Social Security
plans because SSI does not impose a work history requirement.
Many Republican and centrist plans to deal with Social Security’s long-term financing gap include
benefit cuts, unlike the Democratic candidates’ plans. The Social Security Reform Act of 2016,
introduced by representative Sam Johnson (R-TX), would increase the program’s retirement age,
reduce benefits for high-wage workers, and eliminate federal income taxes on Social Security benefits
(among other changes).42 The Bipartisan Policy Center plan would achieve solvency through a mix of tax
increases and benefit reductions (Bipartisan Policy Center 2016). A plan proposed by the Committee
for a Responsible Federal Budget would reform Social Security to promote work and savings by
counting all work years, not just the 35 highest-earning years, in the benefit formula and creating
supplemental retirement accounts financed by additional payroll deductions (Goldwein, Macguineas,
and Towner 2019). President Donald Trump has recently proposed suspending Social Security payroll
taxes, which would further erode trust fund balances without Congressional action to hold the funds
harmless. He also proposed permanently eliminating payroll taxes if reelected, which would quickly
deplete trust fund reserves and make it impossible to pay Social Security benefits after 2023 (Goss
2020).
The decision about how to address Social Security’s long-term financing challenges must be made
within a larger budgetary context. Expanding Social Security and reducing the program’s shortfall solely
through increased revenues will leave federal policymakers with fewer resources to address other
budgetary shortfalls, such as Medicare’s long-term deficit and the broader federal debt, and to meet
other public priorities.
7 0 A P P E N D I X
Appendix: Estimated Long-Term Effects of Candidates’ Proposals on Social Security’s Finances Appendix tables A.1 to A.5 show our DYNASIM4 projections of how each candidate’s reform plan would
affect Social Security’s long-term finances. These projections are similar to the cost estimates provided
by the Social Security Administration’s Office of the Chief Actuary.
These tables also show how each plan would change net federal revenue (revenue minus
expenditure) from 2021 to 2030, in nominal dollars. Modeled revenues include the federal income tax,
Social Security and Medicare payroll tax, net investment income tax, additional Medicare tax, income-
related Medicare Part B and Part D premiums above the base premiums, and Social Security net
investment income surtax. Modeled expenditures include Social Security benefits, SSI benefits, and
other federal cash benefits.
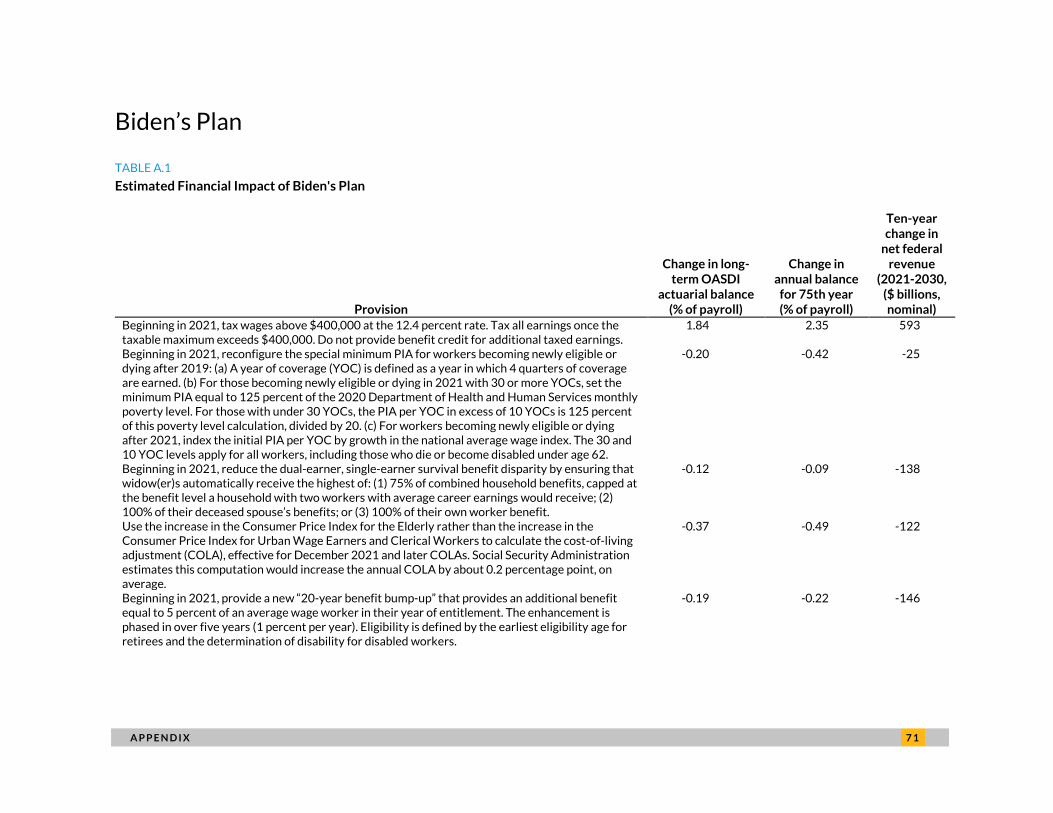
A P P E N D I X 7 1
Biden’s Plan
TABLE A.1
Estimated Financial Impact of Biden's Plan
Provision
Change in long-term OASDI
actuarial balance (% of payroll)
Change in annual balance
for 75th year (% of payroll)
Ten-year change in
net federal revenue
(2021-2030, ($ billions, nominal)
Beginning in 2021, tax wages above $400,000 at the 12.4 percent rate. Tax all earnings once the taxable maximum exceeds $400,000. Do not provide benefit credit for additional taxed earnings.
1.84 2.35 593
Beginning in 2021, reconfigure the special minimum PIA for workers becoming newly eligible or dying after 2019: (a) A year of coverage (YOC) is defined as a year in which 4 quarters of coverage are earned. (b) For those becoming newly eligible or dying in 2021 with 30 or more YOCs, set the minimum PIA equal to 125 percent of the 2020 Department of Health and Human Services monthly poverty level. For those with under 30 YOCs, the PIA per YOC in excess of 10 YOCs is 125 percent of this poverty level calculation, divided by 20. (c) For workers becoming newly eligible or dying after 2021, index the initial PIA per YOC by growth in the national average wage index. The 30 and 10 YOC levels apply for all workers, including those who die or become disabled under age 62.
-0.20 -0.42 -25
Beginning in 2021, reduce the dual-earner, single-earner survival benefit disparity by ensuring that widow(er)s automatically receive the highest of: (1) 75% of combined household benefits, capped at the benefit level a household with two workers with average career earnings would receive; (2) 100% of their deceased spouse’s benefits; or (3) 100% of their own worker benefit.
-0.12 -0.09 -138
Use the increase in the Consumer Price Index for the Elderly rather than the increase in the Consumer Price Index for Urban Wage Earners and Clerical Workers to calculate the cost-of-living adjustment (COLA), effective for December 2021 and later COLAs. Social Security Administration estimates this computation would increase the annual COLA by about 0.2 percentage point, on average.
-0.37 -0.49 -122
Beginning in 2021, provide a new “20-year benefit bump-up” that provides an additional benefit equal to 5 percent of an average wage worker in their year of entitlement. The enhancement is phased in over five years (1 percent per year). Eligibility is defined by the earliest eligibility age for retirees and the determination of disability for disabled workers.
-0.19 -0.22 -146
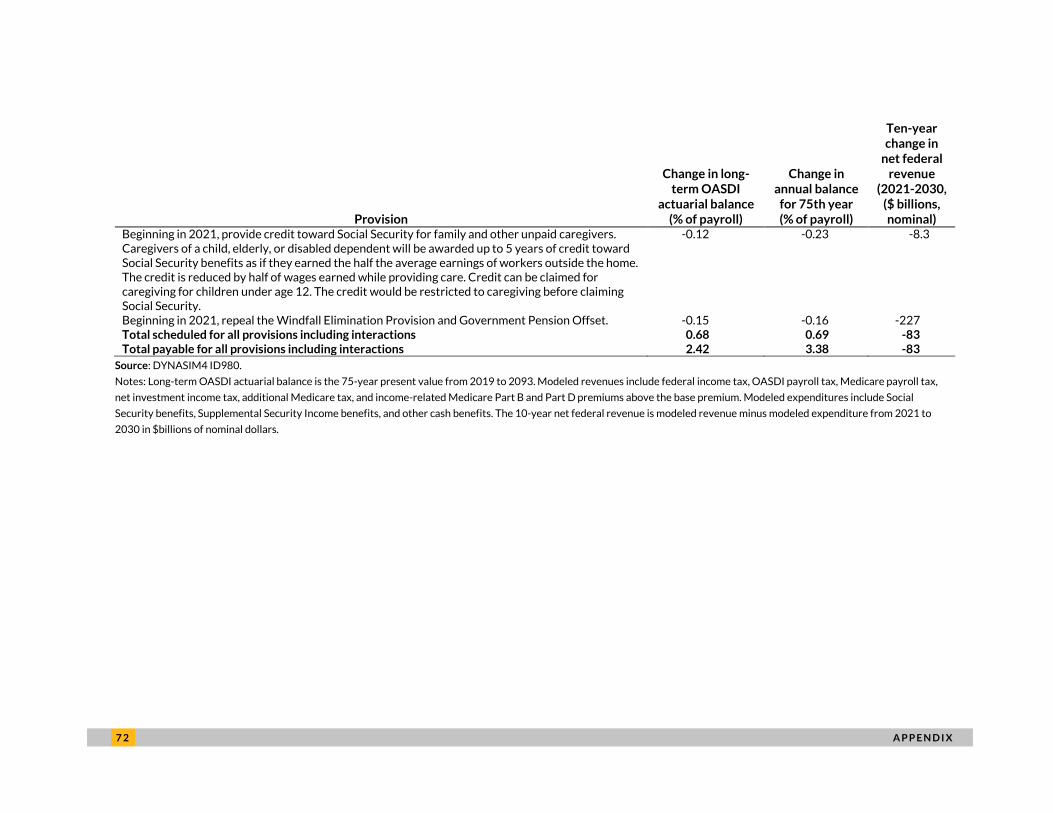
7 2 A P P E N D I X
Provision
Change in long-term OASDI
actuarial balance (% of payroll)
Change in annual balance
for 75th year (% of payroll)
Ten-year change in
net federal revenue
(2021-2030, ($ billions, nominal)
Beginning in 2021, provide credit toward Social Security for family and other unpaid caregivers. Caregivers of a child, elderly, or disabled dependent will be awarded up to 5 years of credit toward Social Security benefits as if they earned the half the average earnings of workers outside the home. The credit is reduced by half of wages earned while providing care. Credit can be claimed for caregiving for children under age 12. The credit would be restricted to caregiving before claiming Social Security.
-0.12 -0.23 -8.3
Beginning in 2021, repeal the Windfall Elimination Provision and Government Pension Offset. -0.15 -0.16 -227 Total scheduled for all provisions including interactions 0.68 0.69 -83 Total payable for all provisions including interactions 2.42 3.38 -83
Source: DYNASIM4 ID980.
Notes: Long-term OASDI actuarial balance is the 75-year present value from 2019 to 2093. Modeled revenues include federal income tax, OASDI payroll tax, Medicare payroll tax,
net investment income tax, additional Medicare tax, and income-related Medicare Part B and Part D premiums above the base premium. Modeled expenditures include Social
Security benefits, Supplemental Security Income benefits, and other cash benefits. The 10-year net federal revenue is modeled revenue minus modeled expenditure from 2021 to
2030 in $billions of nominal dollars.
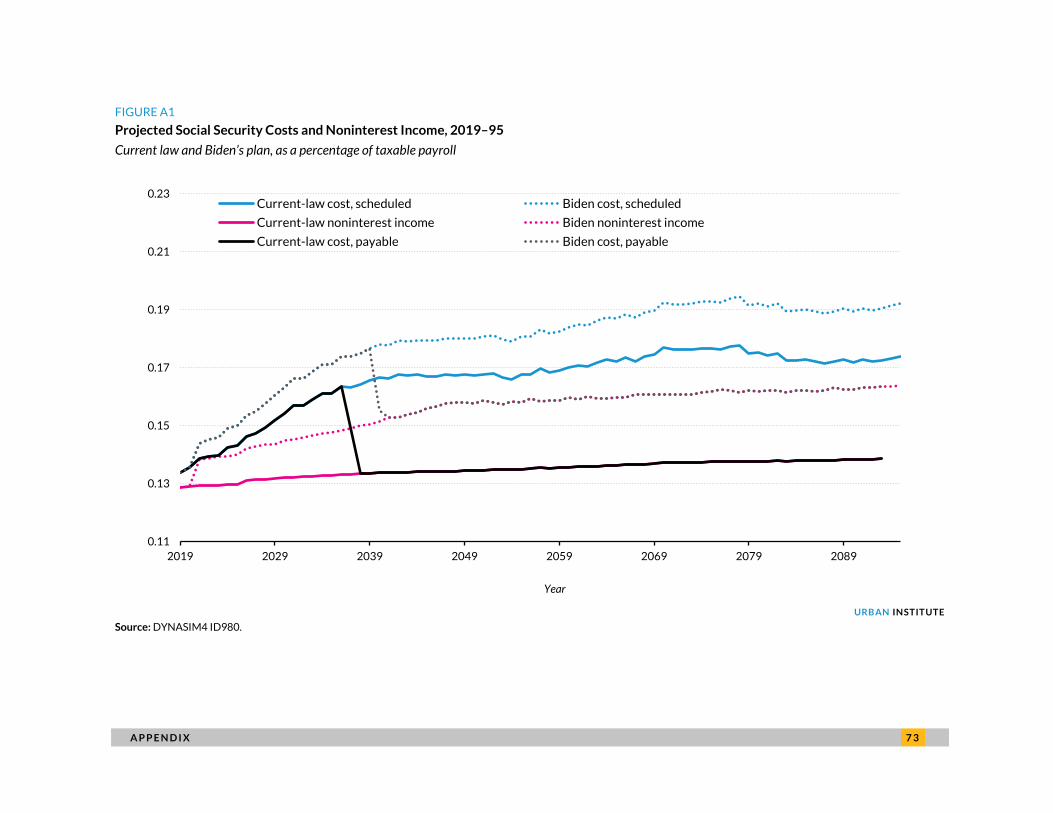
A P P E N D I X 7 3
FIGURE A1
Projected Social Security Costs and Noninterest Income, 2019–95
Current law and Biden’s plan, as a percentage of taxable payroll
URBAN INSTITUTE
Source: DYNASIM4 ID980.
0.11
0.13
0.15
0.17
0.19
0.21
0.23
2019 2029 2039 2049 2059 2069 2079 2089
Current-law cost, scheduled Biden cost, scheduled
Current-law noninterest income Biden noninterest income
Current-law cost, payable Biden cost, payable
Year
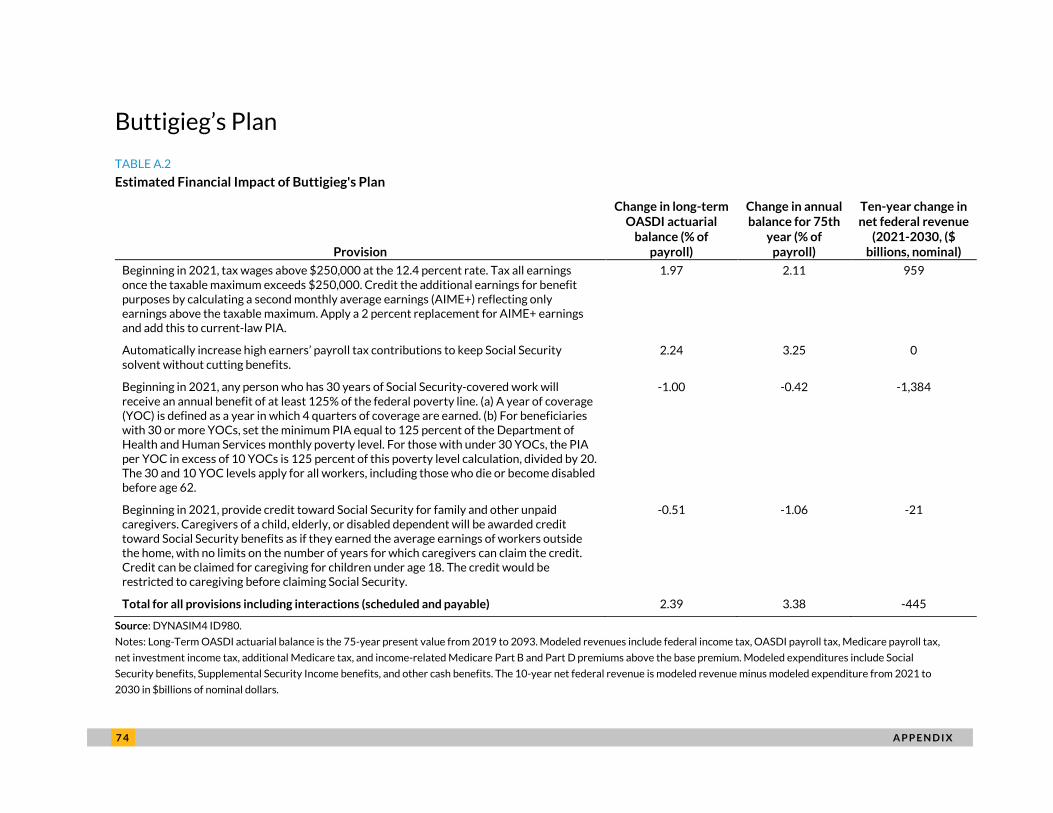
7 4 A P P E N D I X
Buttigieg’s Plan
TABLE A.2
Estimated Financial Impact of Buttigieg's Plan
Provision
Change in long-term OASDI actuarial
balance (% of payroll)
Change in annual balance for 75th
year (% of payroll)
Ten-year change in net federal revenue
(2021-2030, ($ billions, nominal)
Beginning in 2021, tax wages above $250,000 at the 12.4 percent rate. Tax all earnings once the taxable maximum exceeds $250,000. Credit the additional earnings for benefit purposes by calculating a second monthly average earnings (AIME+) reflecting only earnings above the taxable maximum. Apply a 2 percent replacement for AIME+ earnings and add this to current-law PIA.
1.97 2.11 959
Automatically increase high earners’ payroll tax contributions to keep Social Security solvent without cutting benefits.
2.24 3.25 0
Beginning in 2021, any person who has 30 years of Social Security-covered work will receive an annual benefit of at least 125% of the federal poverty line. (a) A year of coverage (YOC) is defined as a year in which 4 quarters of coverage are earned. (b) For beneficiaries with 30 or more YOCs, set the minimum PIA equal to 125 percent of the Department of Health and Human Services monthly poverty level. For those with under 30 YOCs, the PIA per YOC in excess of 10 YOCs is 125 percent of this poverty level calculation, divided by 20. The 30 and 10 YOC levels apply for all workers, including those who die or become disabled before age 62.
-1.00 -0.42 -1,384
Beginning in 2021, provide credit toward Social Security for family and other unpaid caregivers. Caregivers of a child, elderly, or disabled dependent will be awarded credit toward Social Security benefits as if they earned the average earnings of workers outside the home, with no limits on the number of years for which caregivers can claim the credit. Credit can be claimed for caregiving for children under age 18. The credit would be restricted to caregiving before claiming Social Security.
-0.51 -1.06 -21
Total for all provisions including interactions (scheduled and payable) 2.39 3.38 -445
Source: DYNASIM4 ID980.
Notes: Long-Term OASDI actuarial balance is the 75-year present value from 2019 to 2093. Modeled revenues include federal income tax, OASDI payroll tax, Medicare payroll tax,
net investment income tax, additional Medicare tax, and income-related Medicare Part B and Part D premiums above the base premium. Modeled expenditures include Social
Security benefits, Supplemental Security Income benefits, and other cash benefits. The 10-year net federal revenue is modeled revenue minus modeled expenditure from 2021 to
2030 in $billions of nominal dollars.
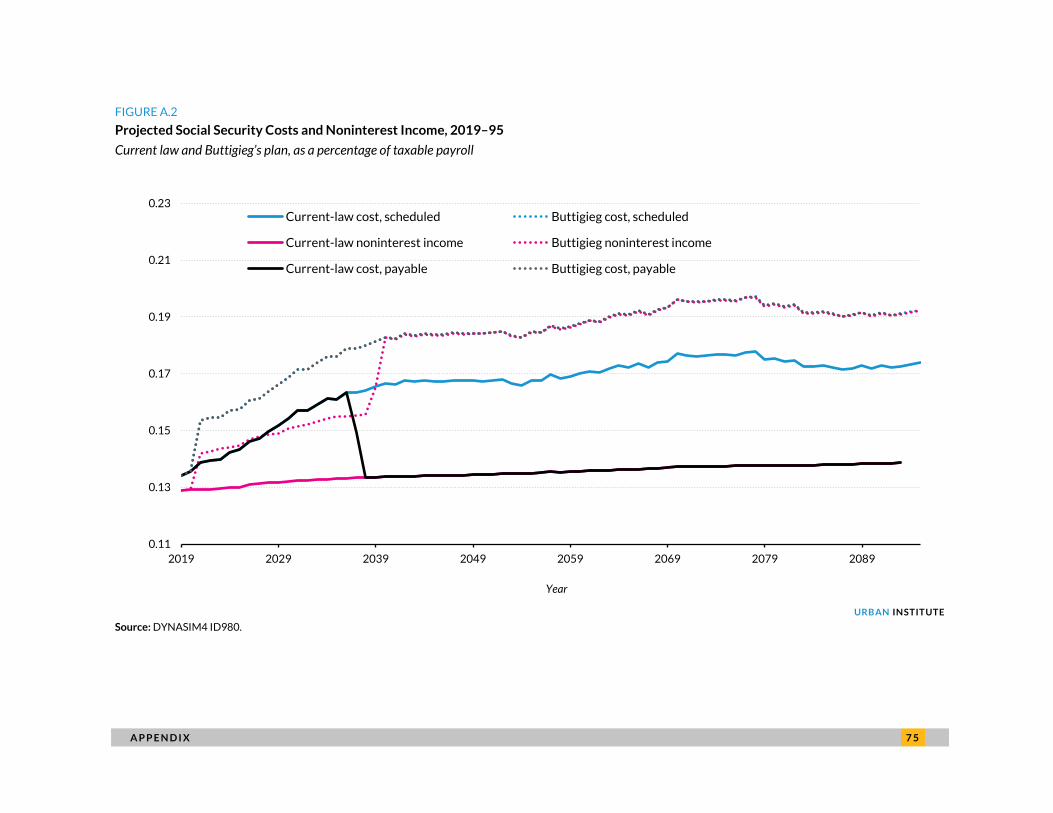
A P P E N D I X 7 5
FIGURE A.2
Projected Social Security Costs and Noninterest Income, 2019–95
Current law and Buttigieg’s plan, as a percentage of taxable payroll
URBAN INSTITUTE
Source: DYNASIM4 ID980.
0.11
0.13
0.15
0.17
0.19
0.21
0.23
2019 2029 2039 2049 2059 2069 2079 2089
Current-law cost, scheduled Buttigieg cost, scheduled
Current-law noninterest income Buttigieg noninterest income
Current-law cost, payable Buttigieg cost, payable
Year
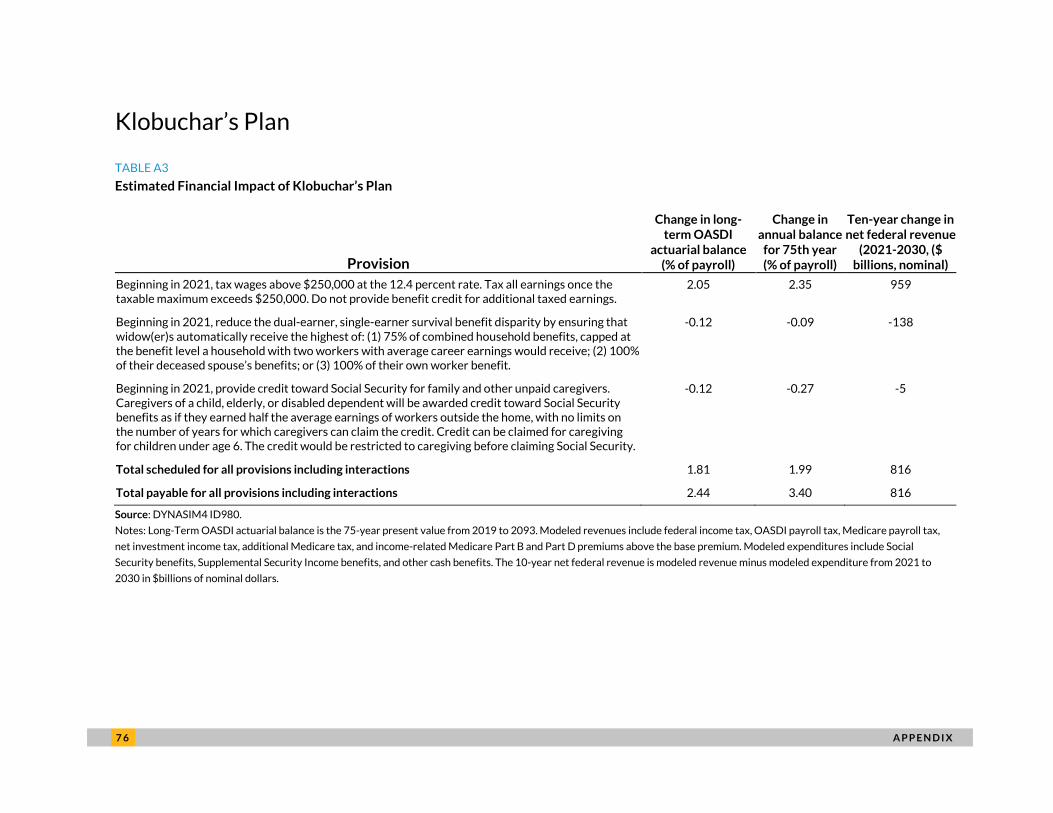
7 6 A P P E N D I X
Klobuchar’s Plan
TABLE A3
Estimated Financial Impact of Klobuchar’s Plan
Provision
Change in long-term OASDI
actuarial balance (% of payroll)
Change in annual balance
for 75th year (% of payroll)
Ten-year change in net federal revenue
(2021-2030, ($ billions, nominal)
Beginning in 2021, tax wages above $250,000 at the 12.4 percent rate. Tax all earnings once the taxable maximum exceeds $250,000. Do not provide benefit credit for additional taxed earnings.
2.05 2.35 959
Beginning in 2021, reduce the dual-earner, single-earner survival benefit disparity by ensuring that widow(er)s automatically receive the highest of: (1) 75% of combined household benefits, capped at the benefit level a household with two workers with average career earnings would receive; (2) 100% of their deceased spouse’s benefits; or (3) 100% of their own worker benefit.
-0.12 -0.09 -138
Beginning in 2021, provide credit toward Social Security for family and other unpaid caregivers. Caregivers of a child, elderly, or disabled dependent will be awarded credit toward Social Security benefits as if they earned half the average earnings of workers outside the home, with no limits on the number of years for which caregivers can claim the credit. Credit can be claimed for caregiving for children under age 6. The credit would be restricted to caregiving before claiming Social Security.
-0.12 -0.27 -5
Total scheduled for all provisions including interactions 1.81 1.99 816
Total payable for all provisions including interactions 2.44 3.40 816
Source: DYNASIM4 ID980.
Notes: Long-Term OASDI actuarial balance is the 75-year present value from 2019 to 2093. Modeled revenues include federal income tax, OASDI payroll tax, Medicare payroll tax,
net investment income tax, additional Medicare tax, and income-related Medicare Part B and Part D premiums above the base premium. Modeled expenditures include Social
Security benefits, Supplemental Security Income benefits, and other cash benefits. The 10-year net federal revenue is modeled revenue minus modeled expenditure from 2021 to
2030 in $billions of nominal dollars.
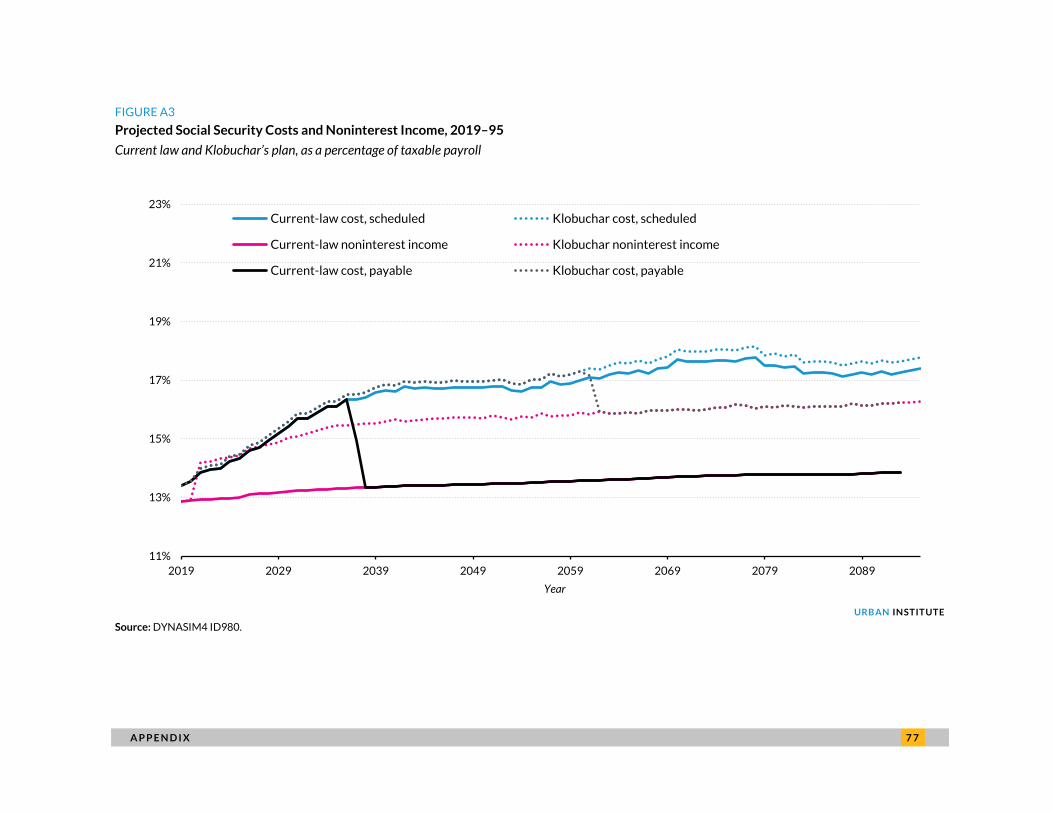
A P P E N D I X 7 7
FIGURE A3
Projected Social Security Costs and Noninterest Income, 2019–95
Current law and Klobuchar’s plan, as a percentage of taxable payroll
URBAN INSTITUTE
Source: DYNASIM4 ID980.
11%
13%
15%
17%
19%
21%
23%
2019 2029 2039 2049 2059 2069 2079 2089
Current-law cost, scheduled Klobuchar cost, scheduled
Current-law noninterest income Klobuchar noninterest income
Current-law cost, payable Klobuchar cost, payable
Year
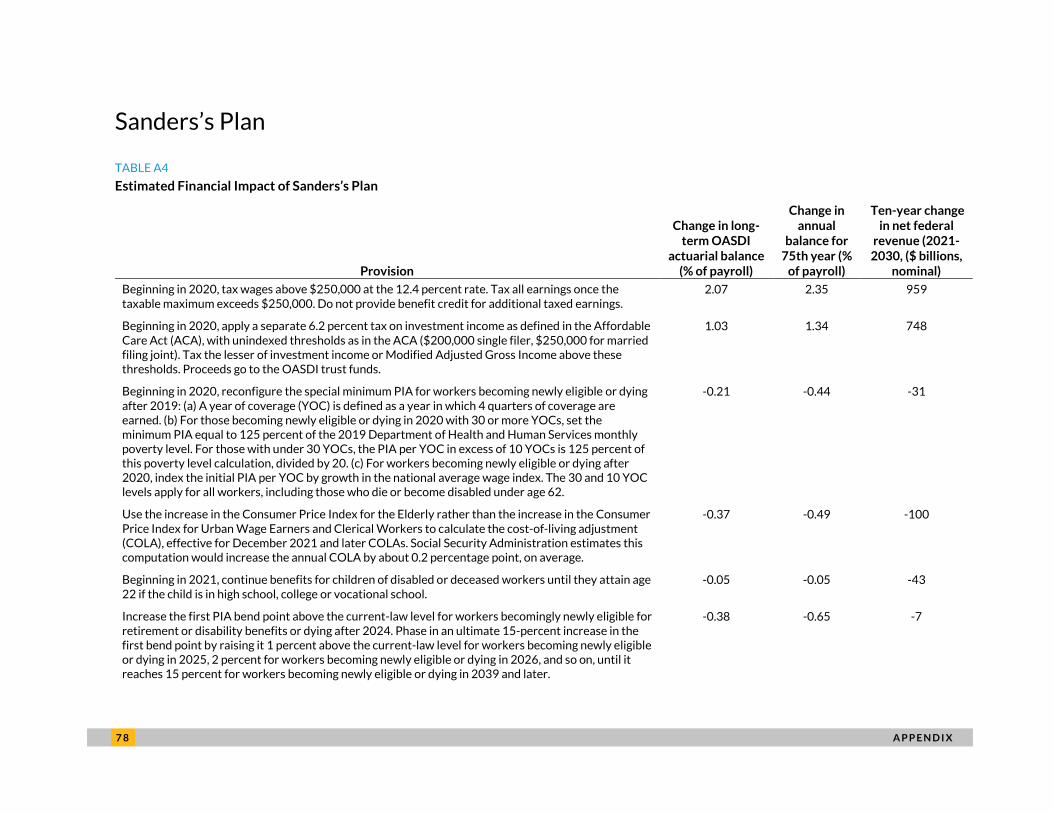
7 8 A P P E N D I X
Sanders’s Plan
TABLE A4
Estimated Financial Impact of Sanders’s Plan
Provision
Change in long-term OASDI
actuarial balance (% of payroll)
Change in annual
balance for 75th year (%
of payroll)
Ten-year change in net federal
revenue (2021-2030, ($ billions,
nominal)
Beginning in 2020, tax wages above $250,000 at the 12.4 percent rate. Tax all earnings once the taxable maximum exceeds $250,000. Do not provide benefit credit for additional taxed earnings.
2.07 2.35 959
Beginning in 2020, apply a separate 6.2 percent tax on investment income as defined in the Affordable Care Act (ACA), with unindexed thresholds as in the ACA ($200,000 single filer, $250,000 for married filing joint). Tax the lesser of investment income or Modified Adjusted Gross Income above these thresholds. Proceeds go to the OASDI trust funds.
1.03 1.34 748
Beginning in 2020, reconfigure the special minimum PIA for workers becoming newly eligible or dying after 2019: (a) A year of coverage (YOC) is defined as a year in which 4 quarters of coverage are earned. (b) For those becoming newly eligible or dying in 2020 with 30 or more YOCs, set the minimum PIA equal to 125 percent of the 2019 Department of Health and Human Services monthly poverty level. For those with under 30 YOCs, the PIA per YOC in excess of 10 YOCs is 125 percent of this poverty level calculation, divided by 20. (c) For workers becoming newly eligible or dying after 2020, index the initial PIA per YOC by growth in the national average wage index. The 30 and 10 YOC levels apply for all workers, including those who die or become disabled under age 62.
-0.21 -0.44 -31
Use the increase in the Consumer Price Index for the Elderly rather than the increase in the Consumer Price Index for Urban Wage Earners and Clerical Workers to calculate the cost-of-living adjustment (COLA), effective for December 2021 and later COLAs. Social Security Administration estimates this computation would increase the annual COLA by about 0.2 percentage point, on average.
-0.37 -0.49 -100
Beginning in 2021, continue benefits for children of disabled or deceased workers until they attain age 22 if the child is in high school, college or vocational school.
-0.05 -0.05 -43
Increase the first PIA bend point above the current-law level for workers becomingly newly eligible for retirement or disability benefits or dying after 2024. Phase in an ultimate 15-percent increase in the first bend point by raising it 1 percent above the current-law level for workers becoming newly eligible or dying in 2025, 2 percent for workers becoming newly eligible or dying in 2026, and so on, until it reaches 15 percent for workers becoming newly eligible or dying in 2039 and later.
-0.38 -0.65 -7
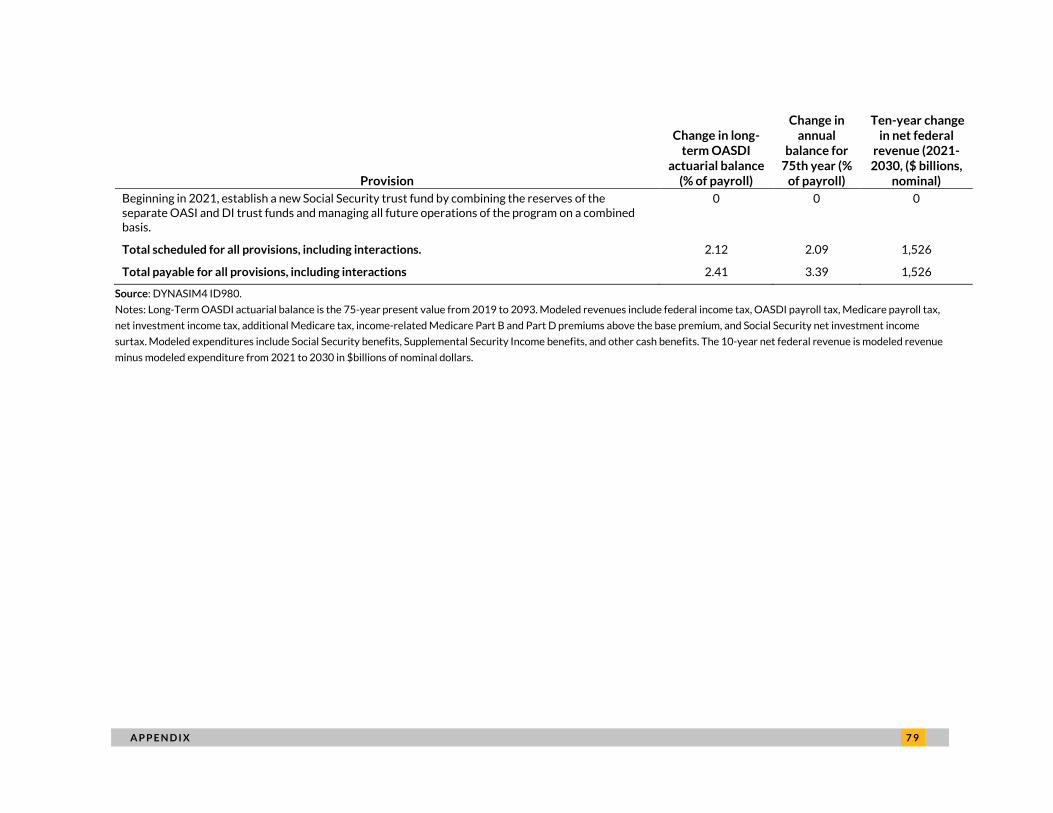
A P P E N D I X 7 9
Provision
Change in long-term OASDI
actuarial balance (% of payroll)
Change in annual
balance for 75th year (%
of payroll)
Ten-year change in net federal
revenue (2021-2030, ($ billions,
nominal) Beginning in 2021, establish a new Social Security trust fund by combining the reserves of the separate OASI and DI trust funds and managing all future operations of the program on a combined basis.
0 0 0
Total scheduled for all provisions, including interactions. 2.12 2.09 1,526
Total payable for all provisions, including interactions 2.41 3.39 1,526
Source: DYNASIM4 ID980.
Notes: Long-Term OASDI actuarial balance is the 75-year present value from 2019 to 2093. Modeled revenues include federal income tax, OASDI payroll tax, Medicare payroll tax,
net investment income tax, additional Medicare tax, income-related Medicare Part B and Part D premiums above the base premium, and Social Security net investment income
surtax. Modeled expenditures include Social Security benefits, Supplemental Security Income benefits, and other cash benefits. The 10-year net federal revenue is modeled revenue
minus modeled expenditure from 2021 to 2030 in $billions of nominal dollars.
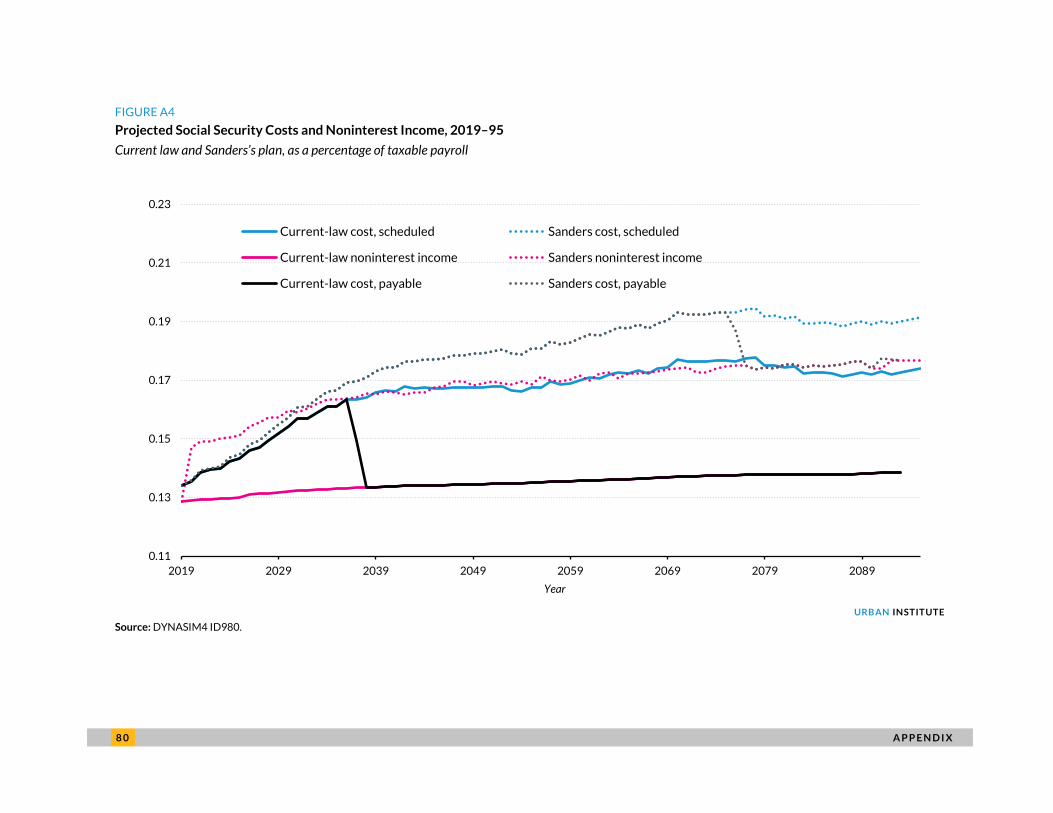
8 0 A P P E N D I X
FIGURE A4
Projected Social Security Costs and Noninterest Income, 2019–95
Current law and Sanders’s plan, as a percentage of taxable payroll
URBAN INSTITUTE
Source: DYNASIM4 ID980.
0.11
0.13
0.15
0.17
0.19
0.21
0.23
2019 2029 2039 2049 2059 2069 2079 2089
Current-law cost, scheduled Sanders cost, scheduled
Current-law noninterest income Sanders noninterest income
Current-law cost, payable Sanders cost, payable
Year
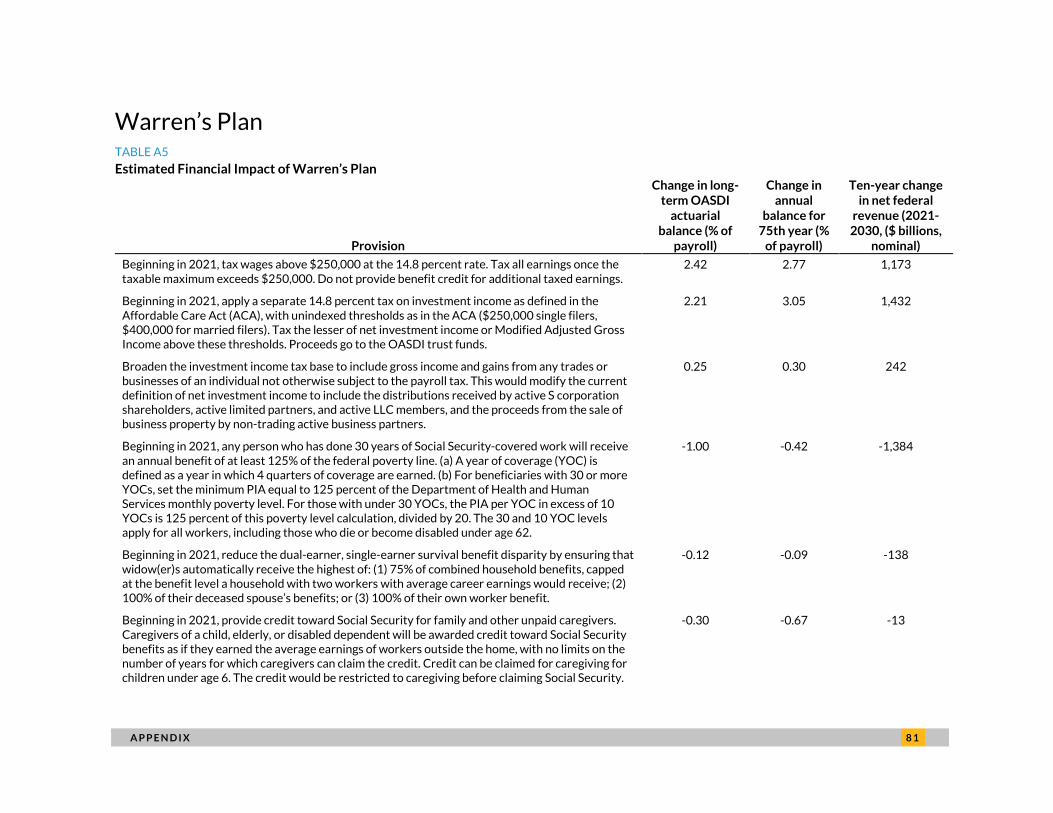
A P P E N D I X 8 1
Warren’s Plan TABLE A5
Estimated Financial Impact of Warren’s Plan
Provision
Change in long-term OASDI
actuarial balance (% of
payroll)
Change in annual
balance for 75th year (%
of payroll)
Ten-year change in net federal
revenue (2021-2030, ($ billions,
nominal)
Beginning in 2021, tax wages above $250,000 at the 14.8 percent rate. Tax all earnings once the taxable maximum exceeds $250,000. Do not provide benefit credit for additional taxed earnings.
2.42 2.77 1,173
Beginning in 2021, apply a separate 14.8 percent tax on investment income as defined in the Affordable Care Act (ACA), with unindexed thresholds as in the ACA ($250,000 single filers, $400,000 for married filers). Tax the lesser of net investment income or Modified Adjusted Gross Income above these thresholds. Proceeds go to the OASDI trust funds.
2.21 3.05 1,432
Broaden the investment income tax base to include gross income and gains from any trades or businesses of an individual not otherwise subject to the payroll tax. This would modify the current definition of net investment income to include the distributions received by active S corporation shareholders, active limited partners, and active LLC members, and the proceeds from the sale of business property by non-trading active business partners.
0.25 0.30 242
Beginning in 2021, any person who has done 30 years of Social Security-covered work will receive an annual benefit of at least 125% of the federal poverty line. (a) A year of coverage (YOC) is defined as a year in which 4 quarters of coverage are earned. (b) For beneficiaries with 30 or more YOCs, set the minimum PIA equal to 125 percent of the Department of Health and Human Services monthly poverty level. For those with under 30 YOCs, the PIA per YOC in excess of 10 YOCs is 125 percent of this poverty level calculation, divided by 20. The 30 and 10 YOC levels apply for all workers, including those who die or become disabled under age 62.
-1.00 -0.42 -1,384
Beginning in 2021, reduce the dual-earner, single-earner survival benefit disparity by ensuring that widow(er)s automatically receive the highest of: (1) 75% of combined household benefits, capped at the benefit level a household with two workers with average career earnings would receive; (2) 100% of their deceased spouse’s benefits; or (3) 100% of their own worker benefit.
-0.12 -0.09 -138
Beginning in 2021, provide credit toward Social Security for family and other unpaid caregivers. Caregivers of a child, elderly, or disabled dependent will be awarded credit toward Social Security benefits as if they earned the average earnings of workers outside the home, with no limits on the number of years for which caregivers can claim the credit. Credit can be claimed for caregiving for children under age 6. The credit would be restricted to caregiving before claiming Social Security.
-0.30 -0.67 -13
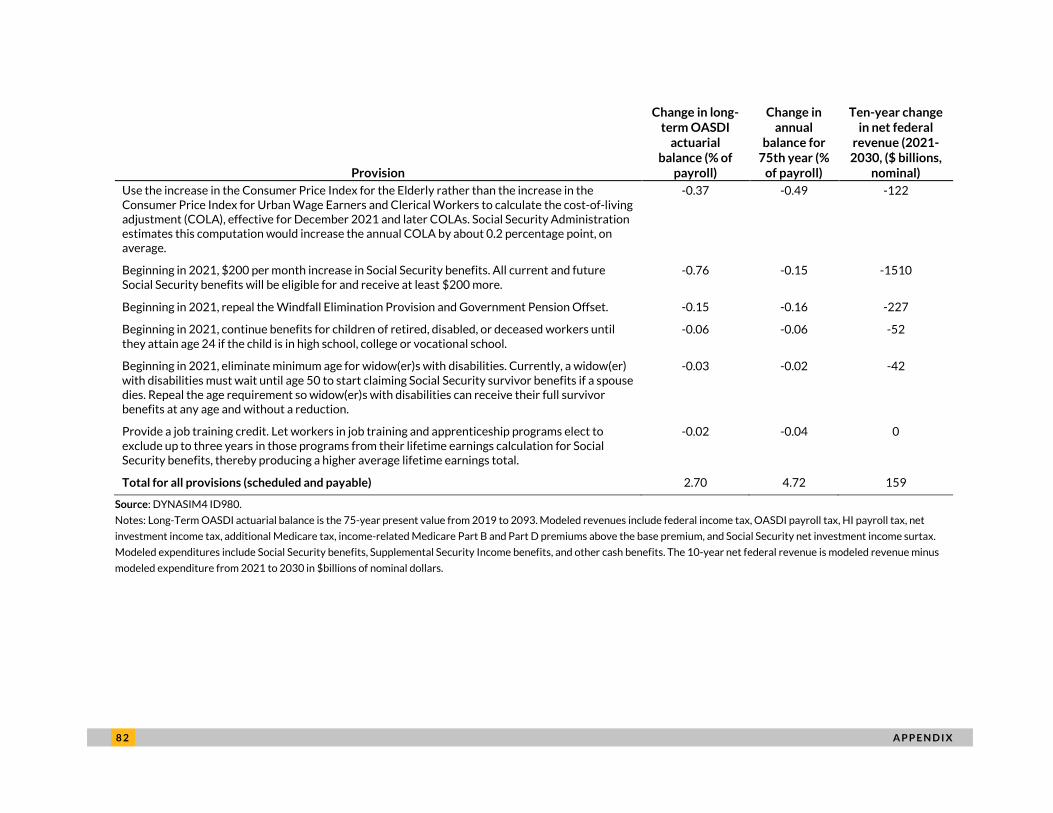
8 2 A P P E N D I X
Provision
Change in long-term OASDI
actuarial balance (% of
payroll)
Change in annual
balance for 75th year (%
of payroll)
Ten-year change in net federal
revenue (2021-2030, ($ billions,
nominal) Use the increase in the Consumer Price Index for the Elderly rather than the increase in the Consumer Price Index for Urban Wage Earners and Clerical Workers to calculate the cost-of-living adjustment (COLA), effective for December 2021 and later COLAs. Social Security Administration estimates this computation would increase the annual COLA by about 0.2 percentage point, on average.
-0.37 -0.49 -122
Beginning in 2021, $200 per month increase in Social Security benefits. All current and future Social Security benefits will be eligible for and receive at least $200 more.
-0.76 -0.15 -1510
Beginning in 2021, repeal the Windfall Elimination Provision and Government Pension Offset. -0.15 -0.16 -227
Beginning in 2021, continue benefits for children of retired, disabled, or deceased workers until they attain age 24 if the child is in high school, college or vocational school.
-0.06 -0.06 -52
Beginning in 2021, eliminate minimum age for widow(er)s with disabilities. Currently, a widow(er) with disabilities must wait until age 50 to start claiming Social Security survivor benefits if a spouse dies. Repeal the age requirement so widow(er)s with disabilities can receive their full survivor benefits at any age and without a reduction.
-0.03 -0.02 -42
Provide a job training credit. Let workers in job training and apprenticeship programs elect to exclude up to three years in those programs from their lifetime earnings calculation for Social Security benefits, thereby producing a higher average lifetime earnings total.
-0.02 -0.04 0
Total for all provisions (scheduled and payable) 2.70 4.72 159
Source: DYNASIM4 ID980.
Notes: Long-Term OASDI actuarial balance is the 75-year present value from 2019 to 2093. Modeled revenues include federal income tax, OASDI payroll tax, HI payroll tax, net
investment income tax, additional Medicare tax, income-related Medicare Part B and Part D premiums above the base premium, and Social Security net investment income surtax.
Modeled expenditures include Social Security benefits, Supplemental Security Income benefits, and other cash benefits. The 10-year net federal revenue is modeled revenue minus
modeled expenditure from 2021 to 2030 in $billions of nominal dollars.
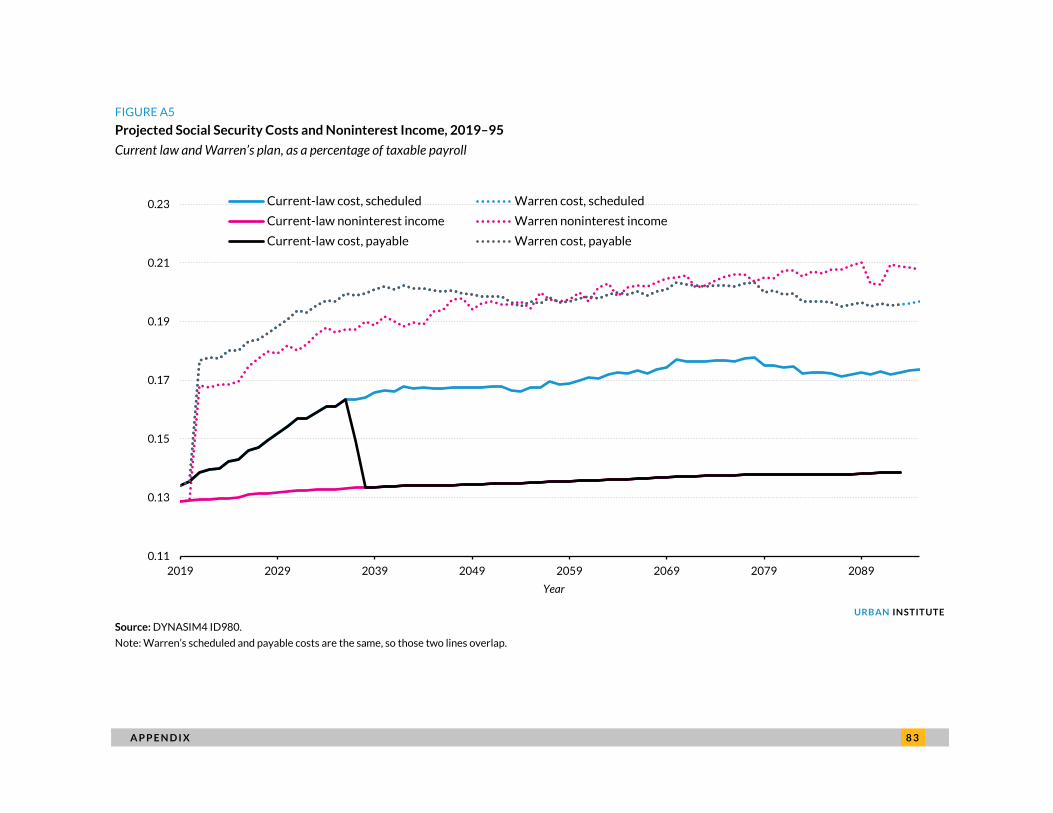
A P P E N D I X 8 3
FIGURE A5
Projected Social Security Costs and Noninterest Income, 2019–95
Current law and Warren’s plan, as a percentage of taxable payroll
URBAN INSTITUTE
Source: DYNASIM4 ID980.
Note: Warren’s scheduled and payable costs are the same, so those two lines overlap.
0.11
0.13
0.15
0.17
0.19
0.21
0.23
2019 2029 2039 2049 2059 2069 2079 2089
Current-law cost, scheduled Warren cost, scheduled
Current-law noninterest income Warren noninterest income
Current-law cost, payable Warren cost, payable
Year
8 4 N O T E S
Notes1 “Monthly Statistical Snapshot, July 2020,” Social Security Administration, August 2020,
https://www.ssa.gov/policy/docs/quickfacts/stat_snapshot/index.html?qs.
2 “Monthly Statistical Snapshot, July 2020,” Social Security Administration, August 2020.
3 The Social Security 2100 Act, H.R. 860, 116th Cong. (2019). The Senate version of the bill is S. 269, 116th Cong. (2019).
4 The Social Security discussion in a draft party platform, released in July 2020, closely mirrored text from the Biden-Sanders Unity task force recommendations. See “2020 Democratic Party Platform,” DemConvention.com, uploaded July 21, 2020, https://www.demconvention.com/wp-content/uploads/2020/07/2020-07-21-DRAFT-Democratic-Party-Platform.pdf ; and “Biden-Sanders Unity Task Force Recommendations,” Biden 2020 presidential campaign, accessed October 5, 2020, https://assets.documentcloud.org/documents/6983111/UNITY-TASK-FORCE-RECOMMENDATIONS.pdf.
5 The Trump administration has not proposed significant changes to Social Security. However, the president’s 2021 budget proposal, released in February 2020, would tighten eligibility for Social Security disability benefits and require the Social Security Administration to review disability beneficiaries more frequently to ensure that they remain unable to work and eligible for payments (Office of Management and Budget 2020).
6 See, for example, Diamond and Orszag (2004).
7 In years without a COLA, the maximum taxable earnings does not increase, even if the average wage index increases. This occurred in 2010, 2011, and 2016.
8 For the full retirement age schedule and reduction factors by birth year, see “Benefits Planner: Retirement | Retirement Age and Benefit Reduction | SSA,” US Social Security Administration, accessed October 8, 2020, https://www.ssa.gov/planners/retire/agereduction.html.
9 The Congressional Budget Office (2019) projected a larger shortfall, equivalent to 4.6 percent of taxable payroll. Those projections do not account for the COVID-19 pandemic.
10 “Social Security Expansion Act,” S. 478, 116th Cong. (2019).
11 Biden’s caregiver provisions are described in "The Biden Plan for Full Participation and Equality for People With Disabilities," and his Social Security provisions are described in "The Biden Plan for Older Americans," available on the campaign website (https://www.joebiden.com). Buttigieg’s provisions are described in “Dignity and Security in Retirement.” Klobuchar’s provisions are described in “Senator Klobuchar's Plan for Seniors.” Warren’s provisions are described in "Evaluating Senator Warren's Social Security Plan."
12 We did not receive a response from the Klobuchar campaign.
13 In 2019, the Social Security trustees projected that the taxable maximum would exceed $250,000 in 2035 and $400,000 in 2048 (Board of Trustees 2019).
14 S corporations are corporations with no more than 100 shareholders that elect to pass corporate income, losses, deductions, and credits through to their shareholders for federal tax purposes. See US Department of the Treasury (2016) for more information on investment income and the employment tax base.
15 The minimum benefit would be based on the poverty guidelines published each year by the US Department of Health and Human Services. The proposal defines a year of employment as a year in which a worker earns four quarters of coverage. In 2020, workers earned a quarter of coverage by earning $1,410 in covered employment. The minimum benefit would equal 6.25 percent of the FPL for beneficiaries with 10 years of covered
N O T E S 8 5
employment, and it would increase by 6.25 percent of the FPL with each additional year of covered employment, until it reaches 125 percent for those with 30 years of covered employment.
16 “Description of Proposed Provision: A6: Starting December 2021, Compute the COLA Using the Consumer Price Index for the Elderly (CPI-E),” Social Security Administration, accessed October 5, 2020, https://www.ssa.gov/oact/solvency/provisions/charts/chart_run092.html.
17 Whitman and Shoffner (2013) discuss differences between old-age benefit supplements that are tied to the average benefit compared to one’s own benefit.
18 Proposals seeking to reduce this type of inequity have been advanced since at least the 1970s (US Department of Health, Education, and Welfare 1979).
19 Caregiver credits may not increase payments to spouse and survivor beneficiaries who collect benefits based on their (deceased) spouse’s earnings or to workers whose credited earnings do not displace any of their top 35 years of earnings.
20 Equal Treatment of Public Servants Act, H.R. 6933, 115th Cong. (2018); Social Security 2100 Act, H.R. 860, 116th Cong. (2019).
21 Beginning in 1939, Social Security paid dependent benefits up to age 18, when children were no longer considered dependent. In 1965, Social Security expanded benefits to full-time students up to age 22, who often still depended on parental support. However, many observers perceived these student benefits, which totaled more than $1.3 million to almost 900,000 students in 1977, as a form of student aid. Although the benefit was popular among parents and students, it depended on self-reports of school enrollment and could be abused (DeWitt 2001). Social Security child benefits for full-time students older than 18 were eliminated in 1981.
22 In 2018, Social Security paid disabled widow and widower benefits to about 255,000 people, less than 1 percent of the Social Security beneficiary population (Social Security Administration 2019a, table 5.A1).
23 We make this adjustment for illustrative purposes. As Huston (2020) discusses, it is unclear what actions the Social Security Administration would take if the program becomes insolvent.
24 We classify the income-related portion of Medicare premiums as a tax because higher-income beneficiaries who pay higher premiums than lower-income beneficiaries do not receive any additional benefits.
25 Changes to Social Security can affect eligibility for SSI and spending on that program.
26 The federal government tracks two slightly different poverty measures. The poverty guidelines determine eligibility for income-based programs, and the poverty thresholds determine poverty rates. We follow that convention in our modeling.
27 For example, the National Academies of Sciences, Engineering, and Medicine (2015) and Favreault (2019) consider survivors to age 51. Other literature considers all people regardless of survival age.
28 The Social Security Advisory Board’s Technical Panel on Assumptions and Methods has highlighted the potential importance of this assumption (2011 Technical Panel on Assumptions and Methods 2011; 2019 Technical Panel on Assumptions and Methods 2019).
29 More information about DYNASIM4, including documentation, reports, and interactive validation tools, is available at https://www.urban.org/policy-centers/cross-center-initiatives/program-retirement-policy/projects/dynasim-projecting-older-americans-future-well-being.
30 “Brief Description of the Tax Model,” Urban-Brookings Tax Policy Center, last updated August 23, 2018, https://www.taxpolicycenter.org/resources/brief-description-tax-model.
31 Self-employed workers, who pay both halves of the payroll tax, may be especially responsive.
8 6 N O T E S
32 For workers facing a payroll tax increase of less than $10,000, we shift 1 percent of their earnings above the
second tier threshold to tax-exempt compensation. The rate increases by 1 percentage point for each additional $5,000 of payroll tax liability until it reaches 10 percent for payroll tax increases of $55,000 or more.
33 “Brief Description of the Tax Model,” Urban-Brookings Tax Policy Center, last updated August 23, 2018, https://www.taxpolicycenter.org/resources/brief-description-tax-model.
34 In 2019, the Social Security actuaries projected, based on their intermediate assumptions, that the program faces a 75-year actuarial deficit of 2.78 percent of taxable payroll and the trust funds will run out in 2035 (Board of Trustees 2019). DYNASIM projects more revenue from taxation of benefits than the actuaries, which generates a smaller actuarial deficit.
35 We assume that this surcharge would be collected through federal income tax filings without any employer contributions.
36 We use the training model developed for AARP’s Innovation Challenge to impute job training (Whitman 2018). This model uses estimates of the probability of receiving training from ages 30 to 64 estimated from the Panel Study of Income Dynamics. The probability of seeking and completing training is higher for younger adults, women, and people who attended college but did not earn a degree than for other people.
37 The Social Security actuaries (provision A3) assume the chained CPI will be 0.3 percentage points lower on average than the CPI-W.
38 DYNASIM4 models state income tax revenue, but our analysis of federal revenues generated by each reform plan considers only federal taxes.
39 The analysis considers only spending on Social Security benefits, SSI benefits, and other government benefit programs, including unemployment benefits, veteran’s benefits, sickness payments, worker’s compensation, and TANF and other welfare payments.
40 Leimer (1995) discusses how various analytical choices can affect estimates of money’s worth measures.
41 For further discussion of replacement rates and review of the literature on alternative specifications, see Johnson and Favreault (2020).
42 Social Security Reform Act of 2016, H.R. 6489, 114th Cong. (2016).

N O T E S 8 7
8 8 R E F E R E N C E S
References Altman, Nancy J., and Eric R. Kingson. 2015. Social Security Works! Why Social Security Isn’t Going Broke and How
Expanding It Will Help Us All. New York: The New Press.
Bee, Adam, and Joshua Mitchell. 2017. “Do Older Americans Have More Income Than We Think?” SESHD Working Paper #2017-39. Washington, DC: US Census Bureau.
Bipartisan Policy Center. 2016. Securing Our Financial Future: Report of the Commission on Retirement Security and Personal Savings. Washington DC: Bipartisan Policy Center.
Board of Trustees (Board of Trustees, Federal Old-Age and Survivors Insurance and the Federal Disability Insurance Trust Funds). 2019. The 2019 Annual Report of the Board of Trustees of the Federal Old-Age and Survivors Insurance and Federal Disability Insurance Trust Funds. Washington, DC: Board of Trustees.
———. 2020. The 2020 Annual Report of the Board of Trustees of the Federal Old-Age and Survivors Insurance and Federal Disability Insurance Trust Funds. Washington, DC: Board of Trustees.
Bosley, Tiffany, Michael Morris, and Karen Glenn. 2018. “Mortality by Career-Average Earnings Level.” Actuarial study 124. Baltimore, MD: Social Security Administration, Office of the Chief Actuary.
Bosworth, Barry, Gary Burtless, and Benjamin Keys. 2003. “Implications of the Bush Commission Pension Reforms for Married Couples.” CRR WP 2003-03. Chestnut Hill, MA: Center for Retirement Research at Boston College.
Boyens, Chantel, Erald Kolasi, and Jack Smalligan. 2019. Reforming the Social Security WEP Exposes Weaknesses in State and Local Pensions. Washington, DC: Urban Institute.
Bureau of Labor Statistics. 2012. “The Economics Daily, Consumer Price Index for the Elderly.” Washington, DC: US Department of Labor.
Burkhauser, Richard V. and Jennifer L. Warlick. 1981. “Disentangling the Annuity from the Redistributive Aspects of Social Security in the United States.” Review of Income and Wealth 27: 401–21.
Chetty, Raj, Michael Stepner, Sarah Abraham, Shelby Lin, Benjamin Scuderi, Nicholas Turner, Augustin Bergeron, and David Cutler. 2016. “The Association between Income and Life Expectancy in the United States, 2001–2014.” Journal of the American Medical Association 315 (15): 1750–66.
Clingman, Michael, Kyle Burkhalter, and Chris Chaplain. 2020. “Internal Rates of Return Under the OASDI Program for Hypothetical Workers.” Actuarial Note 2019.5. Baltimore, MD: Social Security Administration, Office of the Chief Actuary.
Congressional Budget Office. 2015. Social Security Policy Options, 2015. Washington, DC: Congressional Budget Office.
Congressional Budget Office. 2019. Long-Term Budget Outlook. Washington, DC: Congressional Budget Office.
Cosic, Damir, Richard W. Johnson, and Karen E. Smith. 2018. “Will Living Standards Decline for Future Retirees?” Washington, DC: Urban Institute.
Cubanski, Juliette, Wyatt Koma, Anthony Damico, and Tricia Neuman. 2019. “How Much Do Medicare Beneficiaries Spend Out of Pocket on Health Care?” Washington, DC: Kaiser Family Foundation.
DeWitt, Larry. 2001. “The History of Social Security ‘Student’ Benefits.” Research Note 11. Washington, DC: Social Security Administration.
Diamond, Peter A., and Peter R. Orszag. 2004. Saving Social Security: A Balanced Approach. Washington, DC: Brookings Institution Press.
R E F E R E N C E S 8 9
Favreault, Melissa. 2010. “Why Do Some Workers Have Low Social Security Benefits?” Retirement Policy Program Discussion Paper 10-03. Washington, DC: Urban Institute.
———. 2018. “How Might Earnings Patterns and Interactions among Certain Provisions in OASDI Solvency Packages Affect Financing and Distributional Goals?” CRR WP #2018-2, Chestnut Hill, MA: Center for Retirement Research at Boston College.
———. 2019. “Socioeconomic Disparities in Disabled and Disability-Free Life Expectancy: Implications for Our Fiscal Future.” Washington, DC: Urban Institute.
Favreault, Melissa M., Joshua H. Goldwyn, Karen E. Smith, Larry H. Thompson, Cori E. Uccello, and Sheila R. Zedlewski. 2004. Reform Model Two of the President’s Commission to Strengthen Social Security: Distributional Outcomes under Different Economic and Behavioral Assumptions. Washington, DC: Urban Institute.
Favreault, Melissa M., Richard W. Johnson, and Karen E. Smith. 2013. “How Important Is Social Security Disability to US Workers?” Program on Retirement Policy Brief No. 36. Washington, DC: Urban Institute.
Favreault, Melissa, and Nadia Karamcheva. 2011. How Would the President’s Fiscal Commission’s Social Security Proposals Affect Future Beneficiaries? Washington, DC: Urban Institute.
Favreault, Melissa M. and Gordon B.T. Mermin. 2008. “Are There Opportunities to Increase Social Security Progressivity despite Underfunding?” Discussion Paper No. 30. Washington, DC: Tax Policy Center.
Feinstein, Craig A. 2013. “Diminishing Effect of the Special Minimum PIA.” Actuarial Note No. 154. Baltimore, MD: Social Security Administration, Office of the Chief Actuary.
Fox, Liana. 2020. “The Supplemental Poverty Measure: 2019.” Current Population Reports P60-272. Washington, DC: US Census Bureau.
Goldwein, Marc, Maya Macguineas, and Chris Towner. 2019. “Promoting Economic Growth through Social Security Reform.” Washington, DC: Committee for a Responsible Federal Budget.
Goss, Stephen C. 2019. “Estimates of the Financial Effects on Social Security of the ‘Social Security Expansion Act,’ legislation introduced on February 13, 2019 by Senator Bernie Sanders and Representative Peter DeFazio.” Baltimore, MD: Social Security Administration, Office of the Chief Actuary.
———. 2020. “Estimates for Van Hollen, Sanders, Wyden, and Schumer request dated August 19,2020.” Baltimore, MD: Social Security Administration, Office of the Chief Actuary.
Harrington Meyer, Madonna, Douglas A. Wolf, and Christine L. Himes. 2004. “Linking Benefits to Marital Status: Race and Diminishing Access to Social Security Spouse and Widow Benefits in the U.S.” Working paper #2004-05. Chestnut Hill, MA: Center for Retirement Research at Boston College.
Hatfield, Laura A., Melissa M. Favreault, Thomas G. McGuire, and Michael E. Chernew. 2018. “Modeling Health Care Spending Growth of Older Adults.” Health Services Research 53 (1): 138–55.
Huston, Barry F. 2020. “Social Security: What Would Happen If the Trust Funds Ran Out?” Washington, DC: Congressional Research Service.
Johnson, Richard W. 2020a. “Financial Challenges at Older Ages and the Implications for Housing Options.” Generations Summer 2020.
———. 2020b. How Does Earnings Inequality Affect Social Security Financing? Washington, DC: AARP.
Johnson, Richard W. and Melissa M. Favreault. 2020. “Economic Hardship and Medicaid Enrollment in Later Life: Assessing the Impact of Disability, Health, and Marital Status Shocks.” Washington, DC: US Department of Health and Human Services.
Koenig, Gary, and Mikki Waid. 2012. Proposed Changes to Social Security’s Cost-of-Living Adjustment: What Would They Mean for Beneficiaries? Washington, DC: AARP Public Policy Institute.
9 0 R E F E R E N C E S
Leimer, Dean R. 1995. “A Guide to Social Security Money’s Worth Issues.” Social Security Bulletin 58(2): 3–20.
Leiserson, Greg. 2017. “If U.S. Tax Reform Delivers Equitable Growth, a Distribution Table Will Show It.” Washington, DC: Washington Center for Equitable Growth.
———. 2020. “Taxing Wealth.” In Tackling the Tax Code: Efficient and Equitable Ways to Raise Revenue, edited by Jay Shambaugh and Ryan Nunn (89–148). Washington, DC: Brookings Institution Press.
Li, Zhe. 2020. “Social Security: The Windfall Elimination Provision (WEP) and the Government Pension Offset (GPO).” Washington, DC: Congressional Research Service.
Livingston, Gretchen. 2018. “The Changing Profile of Unmarried Parents: A Growing Share Are Living with a Partner.” Washington, DC: Pew Research Center.
Morrissey, Monique. 2018. “Social Security Trustees Report Shows Why We Should Expand the Program—Not Look for Excuses to Cut It.” Working Economics Blog. Washington, DC: Economic Policy Institute.
National Academies of Sciences, Engineering, and Medicine. 2015. The Growing Gap in Life Expectancy by Income: Implications for Federal Programs and Policy Responses. Washington, DC: National Academies Press.
National Committee to Preserve Social Security and Medicare. 2017. “The CPI-E: A Better Option for Calculating Social Security COLAs.” Washington, DC: National Committee to Preserve Social Security and Medicare.
Office of Management and Budget. 2020. A Budget for America’s Future. Washington, DC: US Government Publishing Office.
Parker, Kim. 2015. “Women More than Men Adjust Their Careers for Family Life.” Washington, DC: Pew Research Center.
Penn Wharton Budget Model. 2019. “Options to Return Social Security to Financial Balance: The Impact on Economic Growth.” Philadelphia, PA: University of Pennsylvania.
Schulz, Richard, and Jill Eden (editors). 2016. Families Caring for an Aging America. Washington, DC: National Academies Press.
Short, Kathleen. 2013. “The Research Supplemental Poverty Measure: 2012.” P60-247. Washington, DC: US Census Bureau.
Shakin, Joshua and Kurt Seibert. 2015. “The Taxation of Social Security Benefits.” Washington, DC: U.S. Congressional Budget Office.
Smith, Karen E., Melissa M. Favreault, Damir Cosic, and Richard W. Johnson. 2018. “DYNASIM4 Validation Report: Comparing DYNASIM4 Outcomes with Administrative Data, Government Forecasts, and Scholarly Literature.” Washington DC: Urban Institute.
Social Security Administration. 1984. “Summary of P.L. 98-21, (H.R. 1900): Social Security Amendments of 1983-Signed on April 20, 1983.” Washington, DC: Social Security Administration.
———. 2009. “Methodology Changes for Estimates of Provisions That Affect Social Security.” Baltimore, MD: Social Security Administration, Office of the Chief Actuary.
———. 2016. Income of the Population 55 or Older, 2014. Washington, DC: Social Security Administration.
———. 2019a. Annual Statistical Supplement to the Social Security Bulletin, 2019. Washington, DC: Social Security Administration.
———. 2019b. “Government Pension Offset.” Publication No. 05-10007. Washington, DC: Social Security Administration.
———. 2019c. “Long-Range OASDI Projection Methodology: Intermediate Assumptions of the 2019 Trustees Report.” Baltimore, MD: Social Security Administration, Office of the Chief Actuary.
R E F E R E N C E S 9 1
———. 2019d. “Survivors Benefit.” Publication 05-10084. Washington, DC: Social Security Administration.
———. 2020a. Annual Statistical Supplement to the Social Security Bulletin, 2020. Washington, DC: Social Security Administration.
———. 2020b. “Windfall Elimination Provision.” Publication No. 05-10045. Washington, DC: Social Security Administration.
2011 Technical Panel on Assumptions and Methods. 2011. Report to the Social Security Advisory Board. Washington, DC: 2011 Technical Panel on Assumptions and Methods.
2019 Technical Panel on Assumptions and Methods. 2019. Report to the Social Security Advisory Board. Washington, DC: 2019 Technical Panel on Assumptions and Methods.
US Department of Health, Education, and Welfare. 1979. Social Security and the Changing Roles of Men and Women. Washington, DC: US Department of Health, Education, and Welfare.
US Department of the Treasury. 2016. “Gaps between the Net Investment Income Tax Base and the Employment Tax Base.” Washington, DC: United States Department of the Treasury, Office of Tax Analysis.
Waldron, Hillary. 2007. “Trends in Mortality Differentials and Life Expectancy for Male Social Security–Covered Workers, by Socioeconomic Status.” Social Security Bulletin 67(3): 1–28.
Watson, Garrett, and Colin Miller. 2020. “Analysis of Democratic Presidential Candidate Payroll Tax Proposals.” Fiscal Fact No. 694. Washington, DC: Tax Foundation.
Whitman, Debra. 2018. “Innovative Approaches to Improve Social Security Adequacy in the 21st Century.” Public Policy and Aging Report 28 (Supplement 1): 1–3.
Whitman, Kevin and Dave Shoffner. 2013. “The Projected Effects of Social Security Benefit Increase Options for Older Beneficiaries.” Policy Brief 2013-01. Washington, DC: Social Security Administration.
9 2 A B O U T T H E A U T H O R S
About the Authors
Karen E. Smith is a senior fellow in the Income and Benefits Policy Center at the Urban Institute, where
she is an internationally recognized expert in microsimulation. Over the past 30 years, she has
developed microsimulation models for evaluating Social Security, pensions, taxation, wealth and
savings, labor supply, charitable giving, health expenditure, student aid, and welfare reform. Smith has
played a lead role in the development of the Social Security Administration's Modeling Income in the
Near Term microsimulation model, Urban’s Dynamic Simulation of Income microsimulation model, and
the Social Security Administration’s Policy Simulation Model. Her recent work includes estimating the
impact of the Great Recession on retirement well-being; analyzing income and asset accumulation
patterns of the adult population; analyzing the retirement decision; evaluating the effect of disability on
earnings and mortality; and using statistical matching to impute earnings, taxes, and spouse
characteristics.
Smith has written extensively on demographic and economic trends, and their implications for the
retirement well-being of current and future cohorts. She has contributed chapters to numerous books,
including Closing the Deficit: How Much Can Later Retirement Help?; Redefining Retirement: How Will
Boomers Fare?; Reshaping Retirement Security: Lessons from the Global Financial Crisis; and Social Security
and the Family. She has also published articles in various scholarly journals, including the Social Security
Bulletin, National Tax Journal, and Journal of Aging & Social Policy. She has served on advisory panels for
the National Academy of Science, Canadian Employment and Social Development Department,
Brookings Institution, and Mathematica Policy Research.
Richard W. Johnson is a senior fellow in the Income and Benefits Policy Center at the Urban Institute,
where he directs the Program on Retirement Policy. His current research focuses on older Americans’
employment and retirement decisions, long-term services and supports for older adults with
disabilities, and state and local pensions. Recent studies have examined job loss at older ages,
occupational change after age 50, employment prospects for African Americans and Hispanics over age
50, and the impact of the 2007–09 recession and its aftermath on older workers and future retirement
incomes. He has also written extensively about retirement preparedness, including the financial and
health risks people face as they approach retirement, economic hardship in the years before Social
Security's early eligibility age, and the adequacy of the disability safety net.
Johnson’s long-term services and supports research focuses on financing options and uses
DYNASIM, Urban’s dynamic microsimulation model, to project demand for services under current and
A B O U T T H E A U T H O R S 9 3
alternative policies. His other major research thread involves state and local pension plans. He recently
directed a team of researchers evaluating public pension plans in all 50 states and the District of
Columbia, and he is examining how reforms might affect public-sector employees.
Johnson, who writes and speaks frequently about income and health security at older ages, earned
his AB from Princeton University and his PhD from the University of Pennsylvania, both in economics.
Melissa M. Favreault is a senior fellow in the Income and Benefits Policy Center at the Urban Institute,
where her work focuses on the economic well-being and health status of older Americans and people
with disabilities. She studies social insurance and social assistance programs and has written
extensively about Medicaid, Medicare, Social Security, and Supplemental Security Income. She
evaluates how well these programs serve Americans today and how various policy changes and ongoing
economic and demographic trends could alter outcomes for future generations. Much of her research
relies on dynamic microsimulation, distributional models that she develops to highlight how educational
and economic advantages shape financial outcomes, disability trajectories, health care needs, and
longevity. She has a special interest in the economic risks that people face over their lives and has
studied the lifetime costs of health care, including long-term services and supports, and of family
caregivers’ foregone earnings and employee benefits.
Favreault has published her research in Demography, Health Affairs, Health Services Research, and the
Journal of Gerontology: Social Sciences and coedited Social Security and the Family: Addressing Unmet Needs
in an Underfunded System with Frank Sammartino and C. Eugene Steuerle. She served on the Social
Security Advisory Board’s 2011 Technical Panel on Assumptions and Methods and now serves on the
board of the International Microsimulation Association.
Favreault earned her BA in political science and Russian from Amherst College and her MA and
PhD in sociology from Cornell University.
ST A T E M E N T O F I N D E P E N D E N C E
The Urban Institute strives to meet the highest standards of integrity and quality in its research and analyses and in the evidence-based policy recommendations offered by its researchers and experts. We believe that operating consistent with the values of independence, rigor, and transparency is essential to maintaining those standards. As an organization, the Urban Institute does not take positions on issues, but it does empower and support its experts in sharing their own evidence-based views and policy recommendations that have been shaped by scholarship. Funders do not determine our research findings or the insights and recommendations of our experts. Urban scholars and experts are expected to be objective and follow the evidence wherever it may lead.

500 L’Enfant Plaza SW
Washington, DC 20024
www.urban.org