Embed Size (px)
Citation preview
Fiscal Decentralisation Processes in the EU With Some Perspectives for Croatia
Giorgio Brosio University of Torino, Italy
andEU CARDS Programme for Croatia:Project on Fiscal Decentralisation
and
Gary O’CallaghanEU CARDS Programme for Croatia:Project on Fiscal Decentralisation
Presentation to Workshop onDecentralisation and Public Service Delivery
Zagreb, CroatiaJanuary 23, 2006

Brosio and O’Callaghan:Brosio and O’Callaghan: Fiscal Decentralisation Processes in the EU Fiscal Decentralisation Processes in the EU with with Some Some Perspectives for CroatiaPerspectives for Croatia
STRUCTURE OF THE PRESENTATION STRUCTURE OF THE PRESENTATION
THREE THREE MAIN THEMESMAIN THEMES::
1. Broad fiscal trends in 1. Broad fiscal trends in the EU in the EU in recent decadesrecent decades
2. Focus on revenue and equalisation2. Focus on revenue and equalisation
3. Focus on 3. Focus on the the fragmentation of local governmentfragmentation of local government
SOME (IMPORTANT) CAVEATSSOME (IMPORTANT) CAVEATS
No ideal model is suggested (it does not exist)No ideal model is suggested (it does not exist)
Rather, we stress need Rather, we stress need forfor consistency between: consistency between: Growth in expenditure and growth in revenueGrowth in expenditure and growth in revenue Tax revenues and grantsTax revenues and grants
Also, there must be a balance between the iAlso, there must be a balance between the intensity of ntensity of decentralidecentralissation and ation and the extent of the extent of reliance on small Lreliance on small Local ocal GGovernmentovernment units units
Brosio and O’Callaghan:Brosio and O’Callaghan: Fiscal Decentralisation Processes in the EU Fiscal Decentralisation Processes in the EU with with Some Some Perspectives for CroatiaPerspectives for Croatia
BROAD FISCAL TRENDSBROAD FISCAL TRENDS
Increased decentralisation in the EU over the past 15-20 Increased decentralisation in the EU over the past 15-20 years, with the exception of the federal years, with the exception of the federal statesstates
The cThe creation of regional systems is a sareation of regional systems is a salient feature (their feature (their diffusion is a reflection of the demand for decentralidiffusion is a reflection of the demand for decentralissation)ation)
Expansion of local expenditure has been somewhat Expansion of local expenditure has been somewhat constrained by the growth of pensions and social security constrained by the growth of pensions and social security payments (usually administered outside central and local payments (usually administered outside central and local government)government)
Brosio and O’Callaghan:Brosio and O’Callaghan: Fiscal Decentralisation Processes in the EU Fiscal Decentralisation Processes in the EU with with Some Some Perspectives for CroatiaPerspectives for Croatia
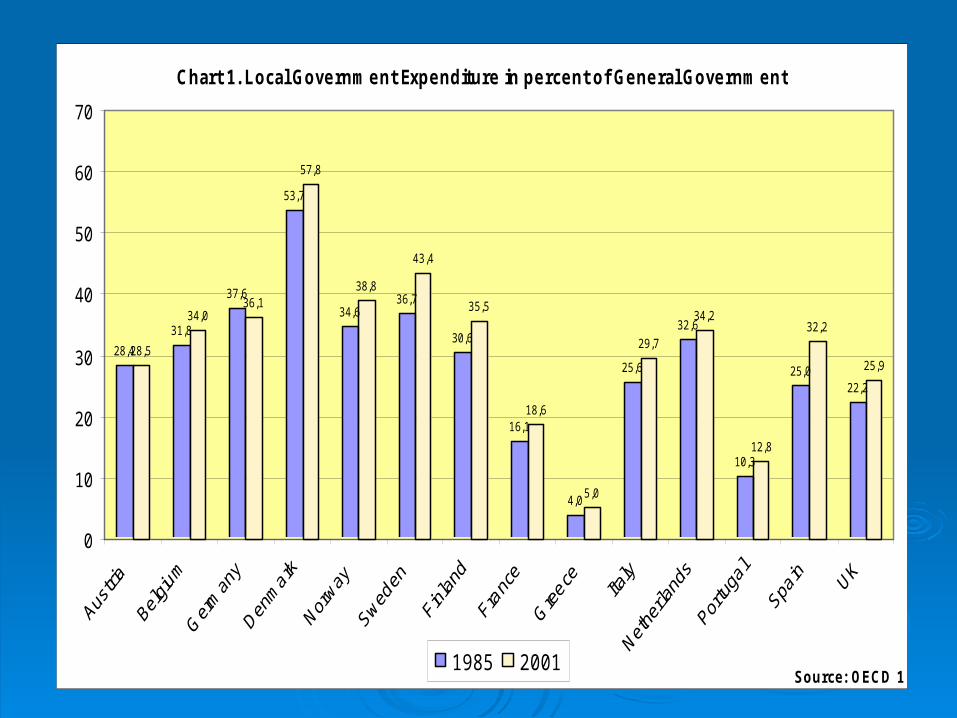
Chart 1. Local Governm ent Expenditure in percent of General Governm ent
28,4
31,8
37,6
53,7
34,636,7
30,6
16,1
4,0
25,6
32,6
10,3
25,022,2
28,5
34,036,1
57,8
38,8
43,4
35,5
18,6
5,0
29,7
34,2
12,8
32,2
25,9
0
10
20
30
40
50
60
70
Source: OECD 1 1985 2001
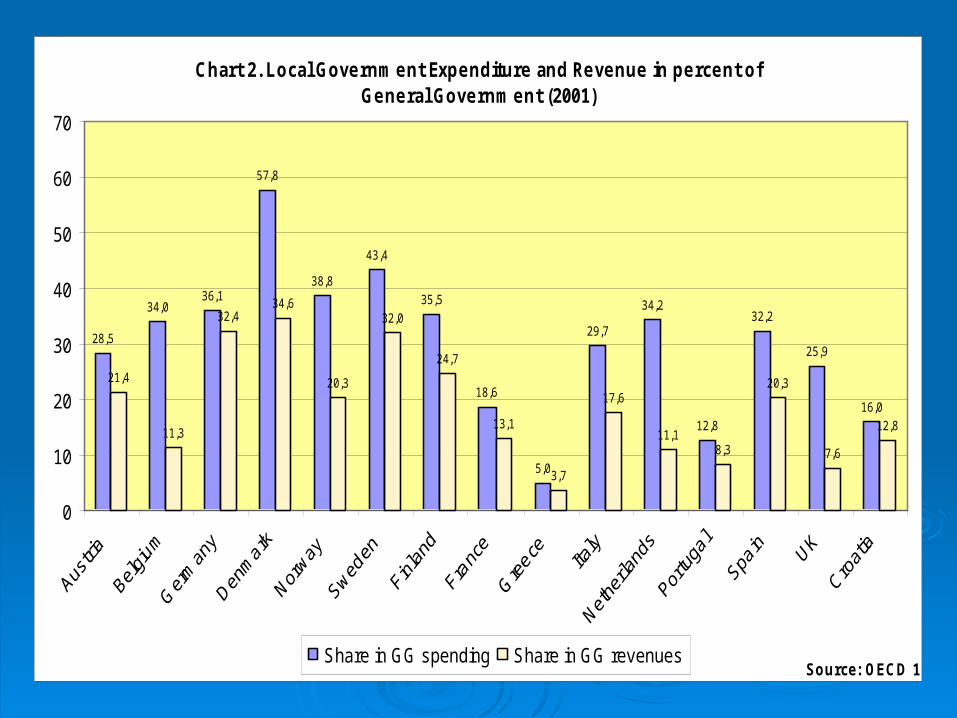
Chart 2. Local Governm ent Expenditure and Revenue in percent ofGeneral Governm ent (2001)
28,5
34,036,1
57,8
38,8
43,4
35,5
18,6
5,0
29,7
34,2
12,8
32,2
25,9
16,0
21,4
11,3
32,434,6
20,3
32,0
24,7
13,1
3,7
17,6
11,18,3
20,3
7,6
12,8
0
10
20
30
40
50
60
70
Source: OECD 1 Share in GG spending Share in GG revenues
THE THE STRUCTURE OF EXPENDITURESTRUCTURE OF EXPENDITURE
Delivery of education, social welfare andDelivery of education, social welfare and health services health services expands with decentralizationexpands with decentralization
Structure of LStructure of Local ocal GGovernmentovernment expenditure in Croatia expenditure in Croatia mirrorsmirrors that of unitary states, that of unitary states, but but withwith housing and economic housing and economic promotion being unusually importantpromotion being unusually important
Brosio and O’Callaghan:Brosio and O’Callaghan: Fiscal Decentralisation Processes in the EU Fiscal Decentralisation Processes in the EU with with Some Some Perspectives for CroatiaPerspectives for Croatia
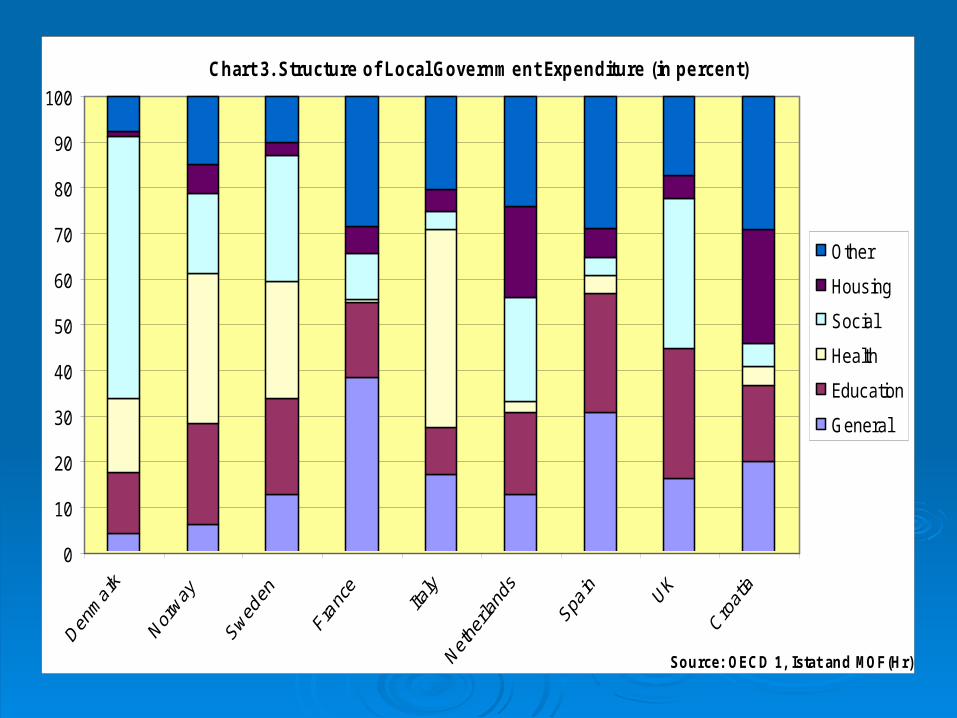
Chart 3. Structure of Local Governm ent Expenditure (in percent)
0
10
20
30
40
50
60
70
80
90
100
Source: OECD 1, Istat and MOF(Hr)
Other
Housing
Social
Health
Education
General
STRUCTURE OF REVENUESTRUCTURE OF REVENUE
Major differences in degree of reliance on taxes, non-tax Major differences in degree of reliance on taxes, non-tax revenues or grants—many different modelsrevenues or grants—many different models
As degree of decentralisation increases, reliance on non-As degree of decentralisation increases, reliance on non-tax revenues diminishes and countries seem to choose tax revenues diminishes and countries seem to choose between tax-based systems or grant-based systemsbetween tax-based systems or grant-based systems
Shared taxes in Croatia are the most importantShared taxes in Croatia are the most important source of source of revenue for Lrevenue for Local ocal GGovernmentovernments, while the level of grants s, while the level of grants is relatively low by international standardsis relatively low by international standards
Brosio and O’Callaghan:Brosio and O’Callaghan: Fiscal Decentralisation Processes in the EU Fiscal Decentralisation Processes in the EU with with Some Some Perspectives for CroatiaPerspectives for Croatia
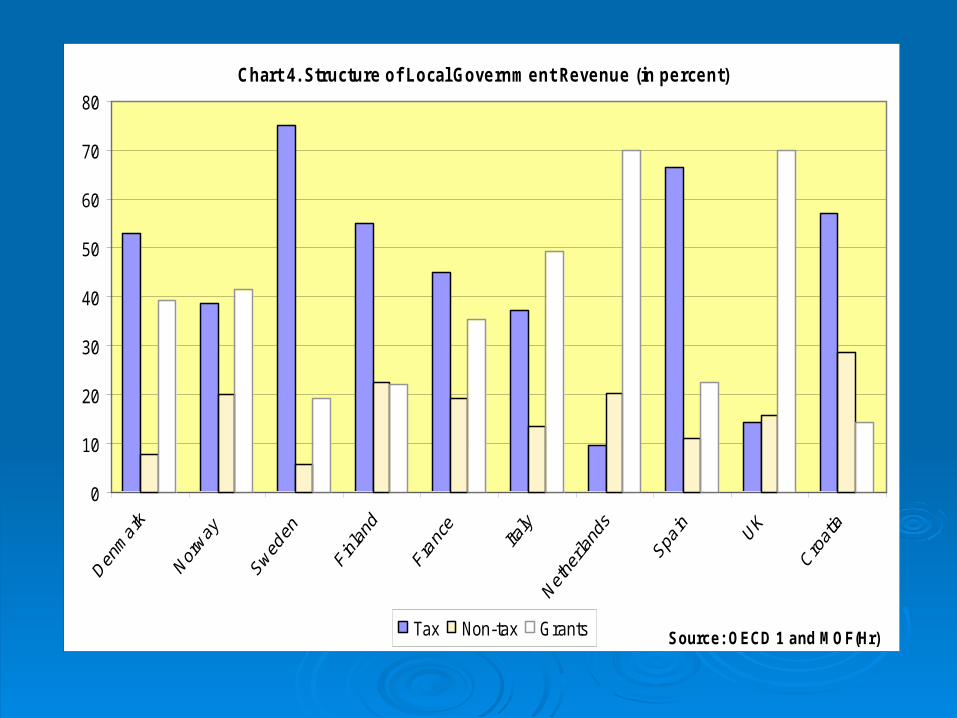
Chart 4. Structure of Local Governm ent Revenue (in percent)
0
10
20
30
40
50
60
70
80
Source: OECD 1 and MOF(Hr)Tax Non-tax Grants
THE THE STRUCTURE OF LOCAL TAXESSTRUCTURE OF LOCAL TAXES
Countries with Countries with a a high degree of decentralisation (such as in high degree of decentralisation (such as in Scandinavia) rely comparatively more heavily on the PIT Scandinavia) rely comparatively more heavily on the PIT
Countries with a lower degree of decentralisation rely more Countries with a lower degree of decentralisation rely more heavily on property and other taxesheavily on property and other taxes
Local surcharges on the PIT have become increasingly popularLocal surcharges on the PIT have become increasingly popular
However, countries relying on the PIT tend to apply a flat tax However, countries relying on the PIT tend to apply a flat tax rate to reduce progressivity rate to reduce progressivity inin collection and collection and minimise the minimise the resulting fiscal resulting fiscal disparities among local government unitsdisparities among local government units
Croatia is unusual: Croatia is unusual: a a low degree of decentralisation but a heavy low degree of decentralisation but a heavy reliance on the PIT (and CIT) to finance local government reliance on the PIT (and CIT) to finance local government
Brosio and O’Callaghan:Brosio and O’Callaghan: Fiscal Decentralisation Processes in the EU Fiscal Decentralisation Processes in the EU with with Some Some Perspectives for CroatiaPerspectives for Croatia
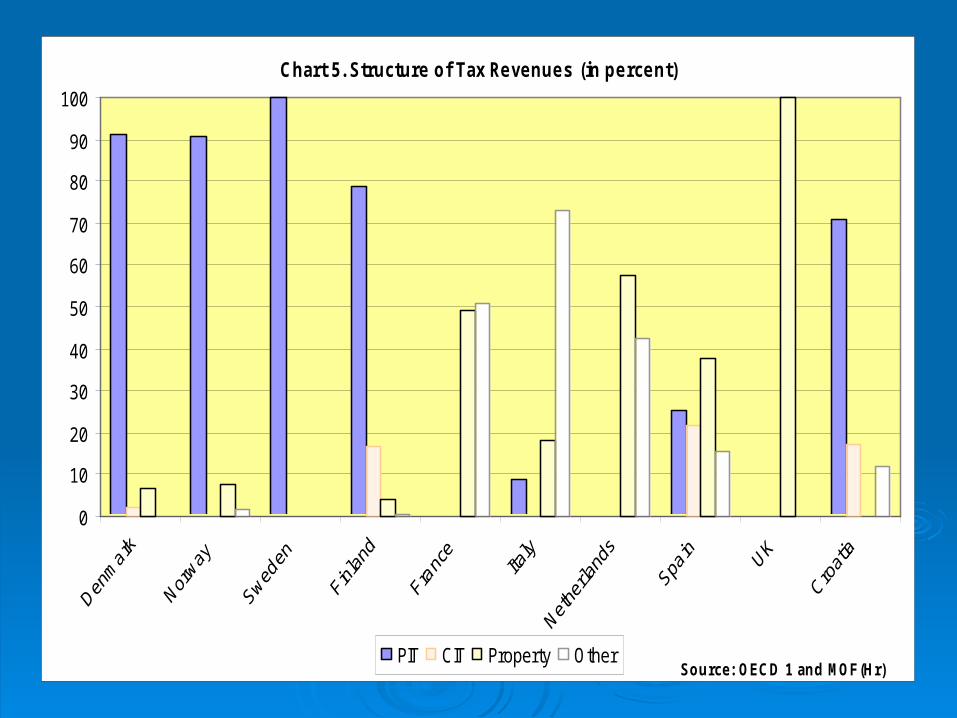
Chart 5. Structure of Tax Revenues (in percent)
0
10
20
30
40
50
60
70
80
90
100
Source: OECD 1 and MOF(Hr)PIT CIT Property Other
FOCUS ON EQUALISATION:FOCUS ON EQUALISATION:
REASONS FOR EQUALISATIONREASONS FOR EQUALISATION
Equalisation fosters national unityEqualisation fosters national unity—No —No area must perceive area must perceive aa disadvantage in its relations with the centredisadvantage in its relations with the centre
In Europe (at least), residence is no longer accepted as a factor In Europe (at least), residence is no longer accepted as a factor inin disparity disparity ofof access to public services access to public services
Migration of firms and individuals should not be Migration of firms and individuals should not be promptedprompted by by disparities in the levels of public services disparities in the levels of public services provided provided (net of their (net of their costs)costs)
Brosio and O’Callaghan:Brosio and O’Callaghan: Fiscal Decentralisation Processes in the EU Fiscal Decentralisation Processes in the EU with with Some Some Perspectives for CroatiaPerspectives for Croatia
THE POTENTIAL COSTS OF EQUALIZATION
Countries with a high degree of regional disparity will have a larger disparity of local government revenue
In the absence of an equalisation system, there will be more disparity in service provision
Equality of levels of service provision and/or implementation of minimum standards require some combination of a non-progressive local tax system and an effective grant system
Italy has high degree of regional income disparity (like Croatia)
Brosio and O’Callaghan:Brosio and O’Callaghan: Fiscal Decentralisation Processes in the EU Fiscal Decentralisation Processes in the EU with with Some Some Perspectives for CroatiaPerspectives for Croatia
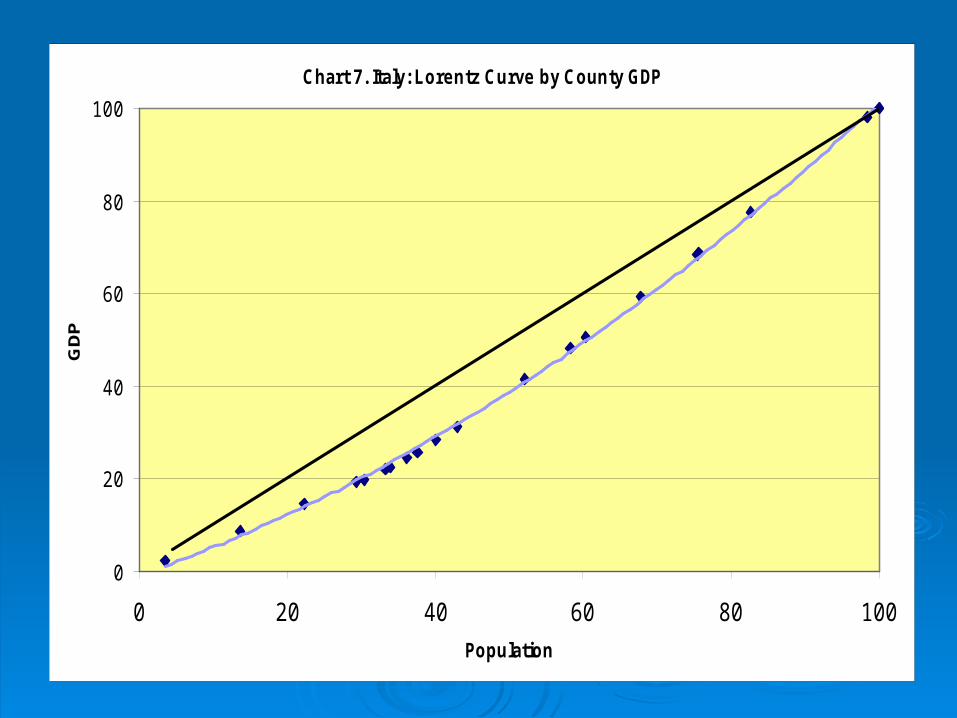
Chart 7. Italy: Lorentz Curve by County GDP
0
20
40
60
80
100
0 20 40 60 80 100
Population
GD
P
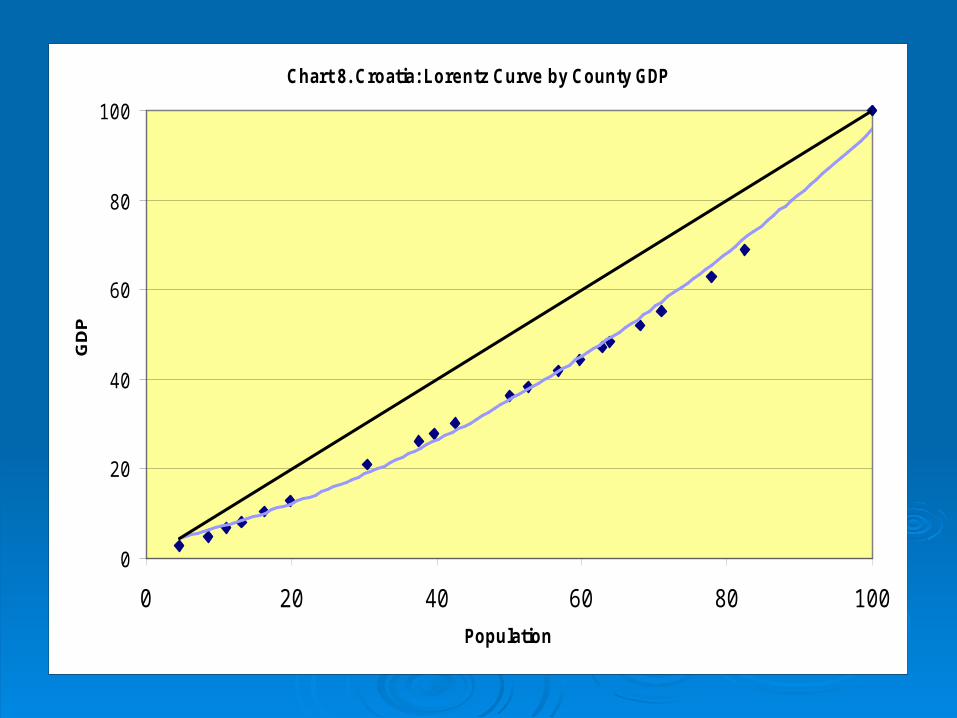
Chart 8. Croatia: Lorentz Curve by County GDP
0
20
40
60
80
100
0 20 40 60 80 100
Population
GD
P
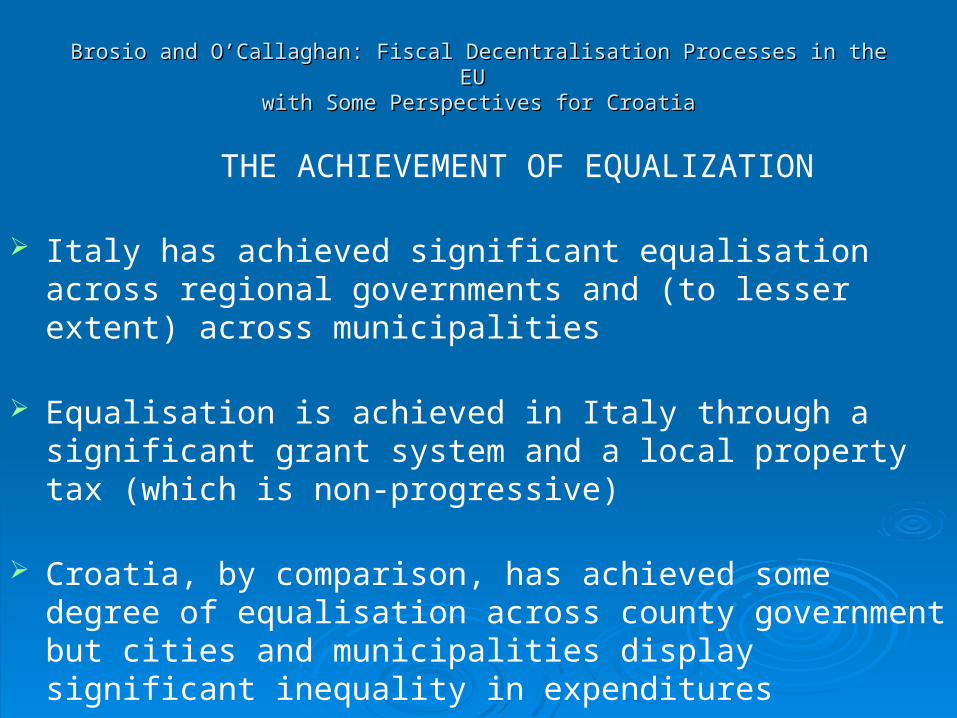
THE ACHIEVEMENT OF EQUALIZATION
Italy has achieved significant equalisation across regional governments and (to lesser extent) across municipalities
Equalisation is achieved in Italy through a significant grant system and a local property tax (which is non-progressive)
Croatia, by comparison, has achieved some degree of equalisation across county government but cities and municipalities display significant inequality in expenditures
Brosio and O’Callaghan:Brosio and O’Callaghan: Fiscal Decentralisation Processes in the EU Fiscal Decentralisation Processes in the EU with with Some Some Perspectives for CroatiaPerspectives for Croatia
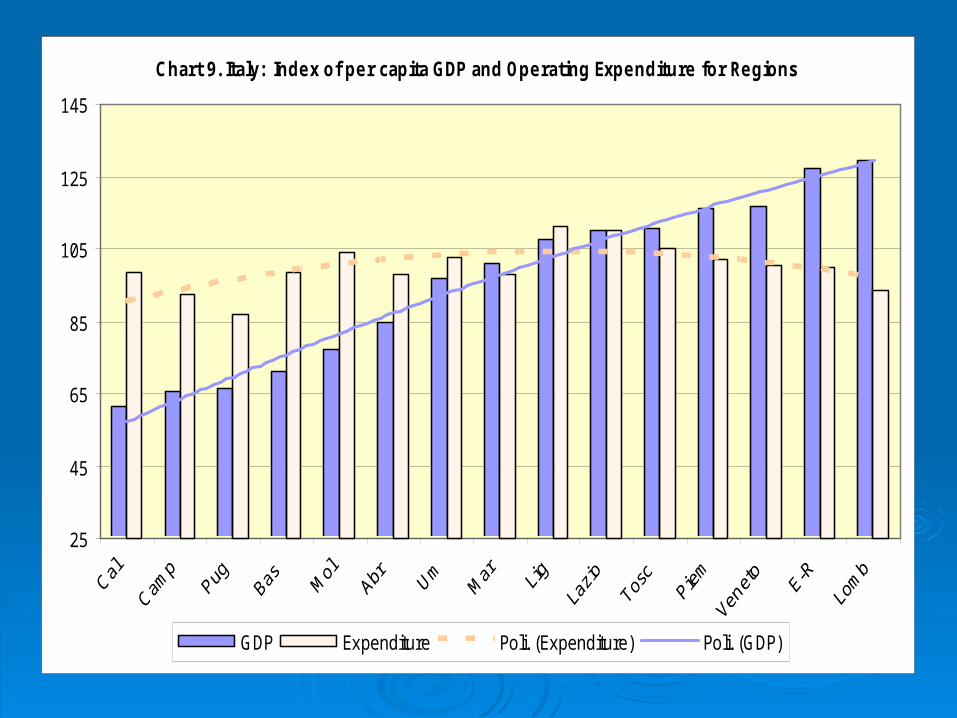
Chart 9. Italy: Index of per capita GDP and Operating Expenditure for Regions
25
45
65
85
105
125
145
GDP Expenditure Poli. (Expenditure) Poli. (GDP)
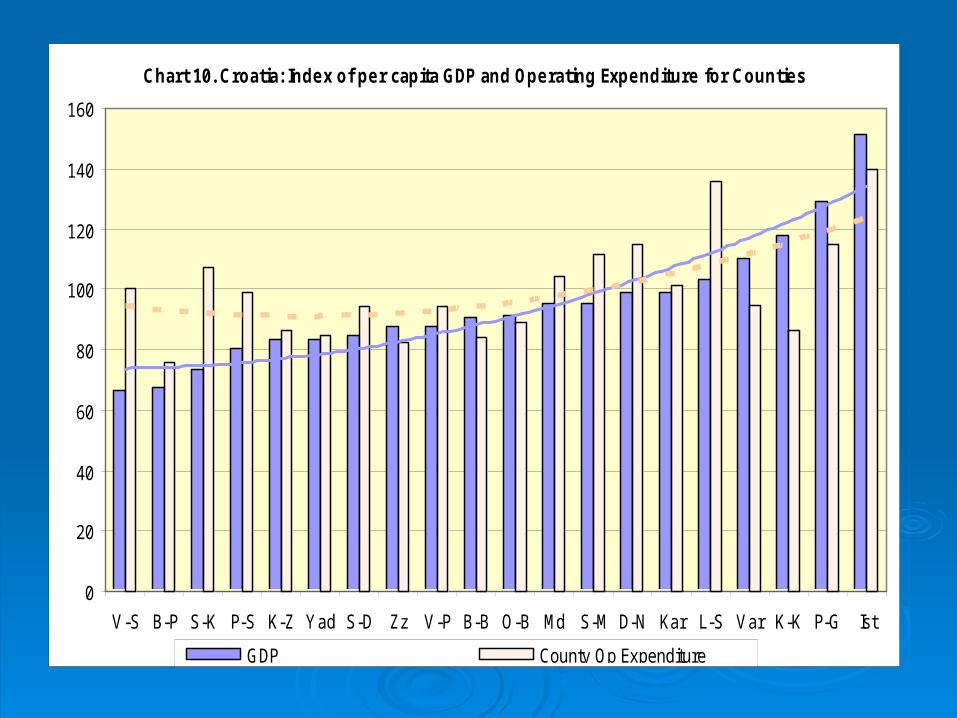
Chart 10. Croatia: Index of per capita GDP and Operating Expenditure for Counties
0
20
40
60
80
100
120
140
160
V-S B-P S-K P-S K-Z Yad S-D Zz V-P B-B O-B Md S-M D-N Kar L-S Var K-K P-G Ist
GDP County Op ExpenditurePoli. (GDP) Poli. (County Op Expenditure)
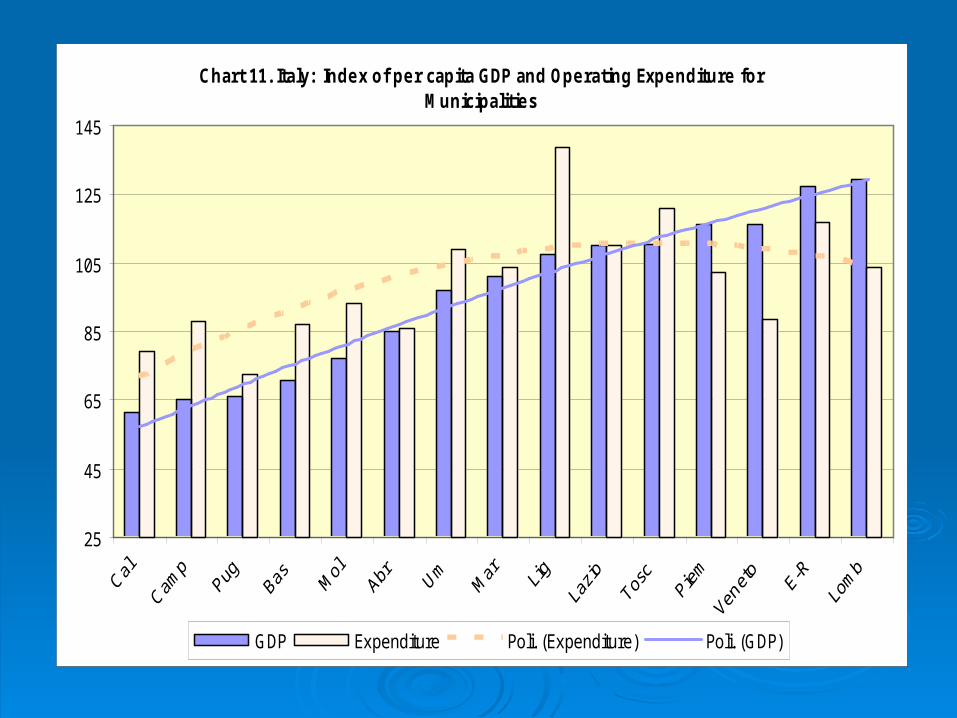
Chart 11. Italy: Index of per capita GDP and Operating Expenditure for Municipalities
25
45
65
85
105
125
145
GDP Expenditure Poli. (Expenditure) Poli. (GDP)
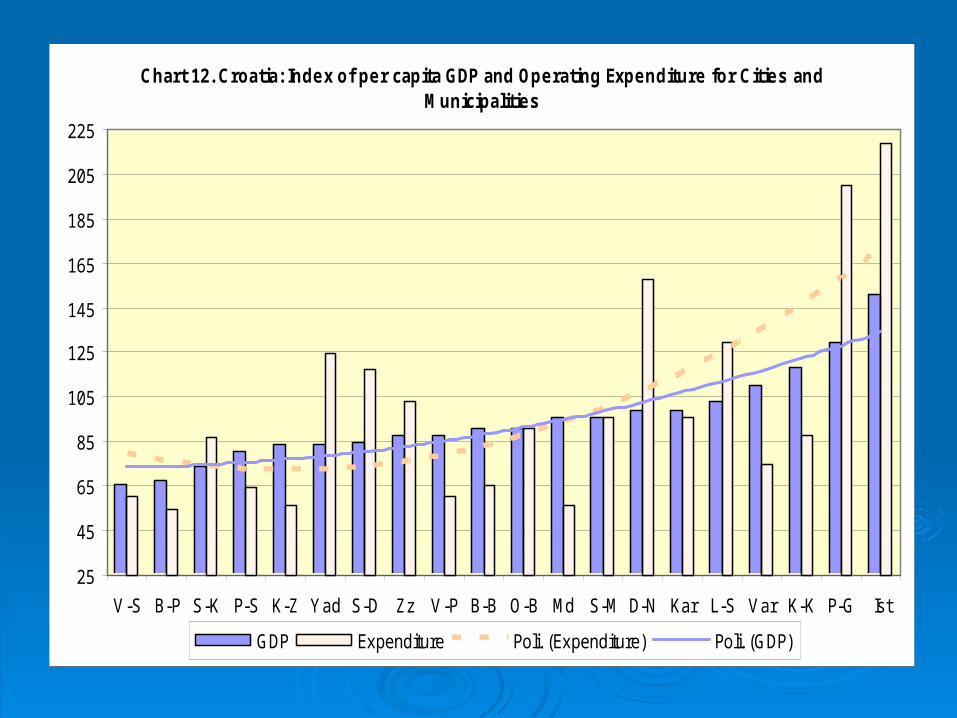
Chart 12. Croatia: Index of per capita GDP and Operating Expenditure for Cities and Municipalities
25
45
65
85
105
125
145
165
185
205
225
V-S B-P S-K P-S K-Z Yad S-D Zz V-P B-B O-B Md S-M D-N Kar L-S Var K-K P-G Ist
GDP Expenditure Poli. (Expenditure) Poli. (GDP)
FOCUS ON FOCUS ON FRAGMENTATIONFRAGMENTATION
Fragmentation Fragmentation traditional characteristic of local government traditional characteristic of local government in Europe but has three adverse consequences:in Europe but has three adverse consequences:
HHigher costs of service provision, due to the non-exploitation of igher costs of service provision, due to the non-exploitation of economies of scaleeconomies of scale
Provision of a smaller range of servicesProvision of a smaller range of services
MMore inequalities in service provision since disparities in fiscal ore inequalities in service provision since disparities in fiscal capacity are inversely correlated to the size of local government capacity are inversely correlated to the size of local government unitsunits
TThe more you merge units, the more you reduce disparities, he more you merge units, the more you reduce disparities, but but merging can be merging can be politically politically very difficultvery difficult
Brosio and O’Callaghan:Brosio and O’Callaghan: Fiscal Decentralisation Processes in the EU Fiscal Decentralisation Processes in the EU with with Some Some Perspectives for CroatiaPerspectives for Croatia
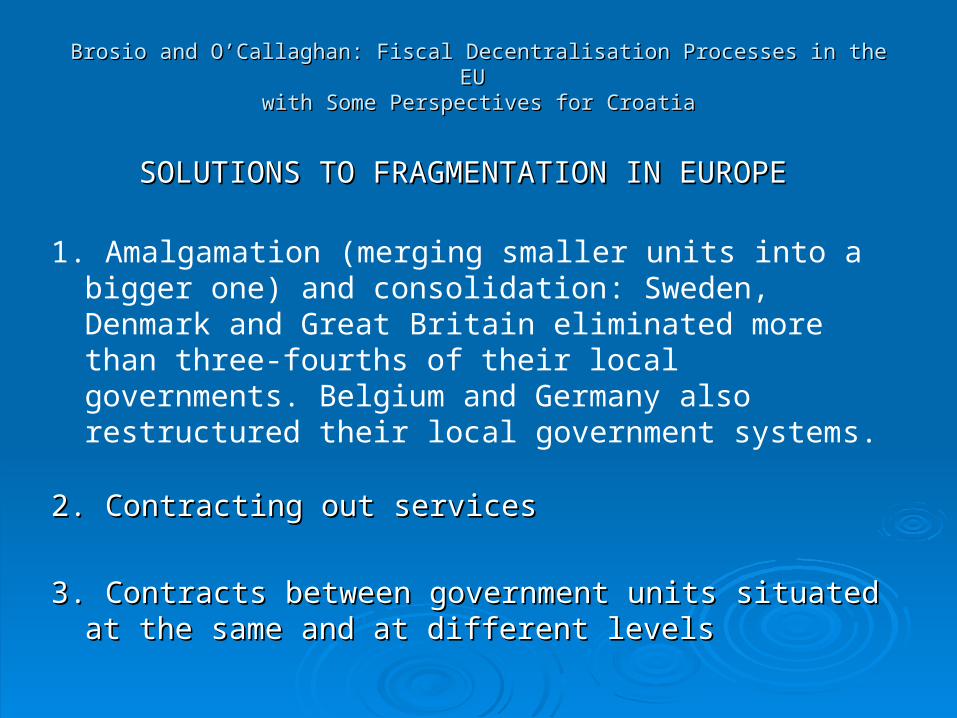
SOLUTIONS TO FRAGMENTATION IN EUROPESOLUTIONS TO FRAGMENTATION IN EUROPE
1. Amalgamation (merging smaller units into a bigger one) and consolidation: Sweden, Denmark and Great Britain eliminated more than three-fourths of their local governments. Belgium and Germany also restructured their local government systems.
2. 2. Contracting out servicesContracting out services
3. 3. Contracts between government units situated at the Contracts between government units situated at the same and at different levelssame and at different levels
Brosio and O’Callaghan:Brosio and O’Callaghan: Fiscal Decentralisation Processes in the EU Fiscal Decentralisation Processes in the EU with with Some Some Perspectives for CroatiaPerspectives for Croatia
Brosio and O’Callaghan:Brosio and O’Callaghan: Fiscal Decentralisation Processes in the EU Fiscal Decentralisation Processes in the EU with with Some Some Perspectives for CroatiaPerspectives for Croatia
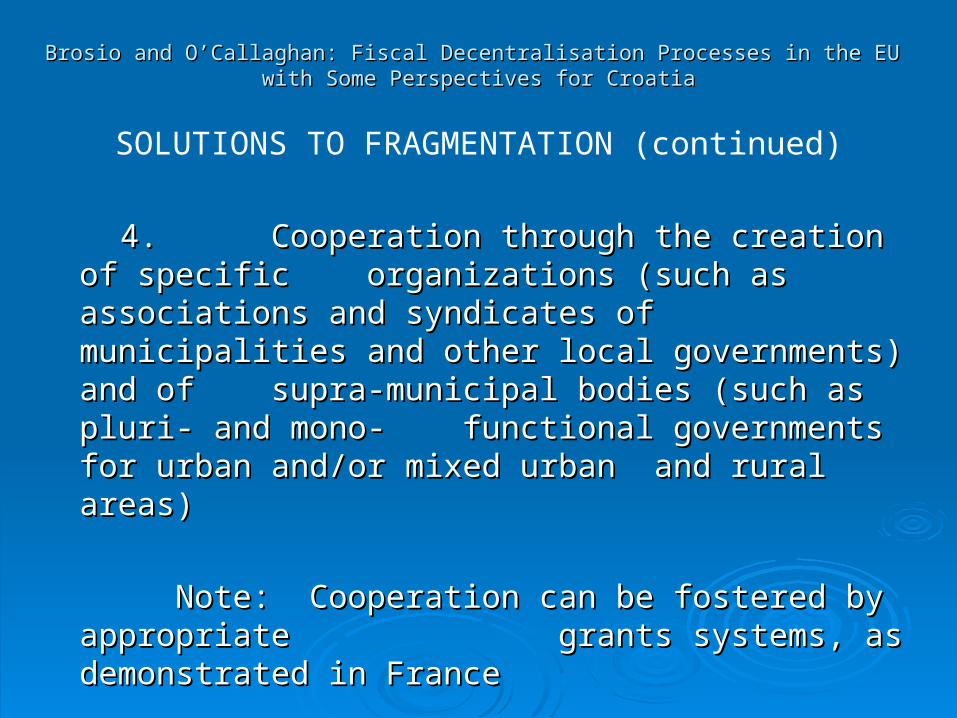
SOLUTIONS TO FRAGMENTATION (continued)
44. . Cooperation through the creation of specific Cooperation through the creation of specific organizations (such as associations and syndicates of organizations (such as associations and syndicates of
municipalities and other local governments) and of municipalities and other local governments) and of supra-municipal bodies (such as pluri- and mono-supra-municipal bodies (such as pluri- and mono-functional governments for urban and/or mixed functional governments for urban and/or mixed
urban urban and rural areas)and rural areas)
Note: Note: Cooperation can be fostered by appropriate Cooperation can be fostered by appropriate grants systemsgrants systems, as demonstrated in , as demonstrated in
FranceFrance