Embed Size (px)
Citation preview
© 2017. Published by The Company of Biologists Ltd. This is an Open Access article distributed under the terms of the Creative Commons Attribution License
(http://creativecommons.org/licenses/by/3.0), which permits unrestricted use, distribution and reproduction in any medium provided that the original work is properly attributed.
2Intestinal epithelial cell Caveolin 1 regulates fatty acid
and lipoprotein cholesterol plasma levels
Jessica P. Otis1, Meng-Chieh Shen1, Vanessa Quinlivan1,2,
Jennifer L. Anderson1, and Steven A. Farber1,2,*
1 Carnegie Institution for Science, Department of Embryology, Baltimore, MD, 21218, USA
2 Johns Hopkins University, Department of Biology, Baltimore, MD, 21218, USA
Keywords: Caveolin 1, caveolae, zebrafish, knockout mice, free fatty acids, LDL cholesterol
Summary Statement: Caveolae and Cav1 localize to the basolateral plasma membrane of
zebrafish enterocytes in vivo. Fluorescently labeled cargos visualize basolateral enterocyte
endocytosis. Intestinal epithelial CAV1 regulates mouse plasma FFA and LDL cholesterol
levels.
*Corresponding Author:
Steven A. Farber
Carnegie Institution for Science,
Department of Embryology,
3520 San Martin Dr.,
Baltimore, MD, 21218, USA
Telephone: (410) 246-3072
Fax: (410) 243-6311
Dis
ease
Mo
dels
& M
echa
nism
s •
DM
M •
Adv
ance
art
icle
http://dmm.biologists.org/lookup/doi/10.1242/dmm.027300Access the most recent version at DMM Advance Online Articles. Posted 26 January 2017 as doi: 10.1242/dmm.027300http://dmm.biologists.org/lookup/doi/10.1242/dmm.027300Access the most recent version at
First posted online on 26 January 2017 as 10.1242/dmm.027300
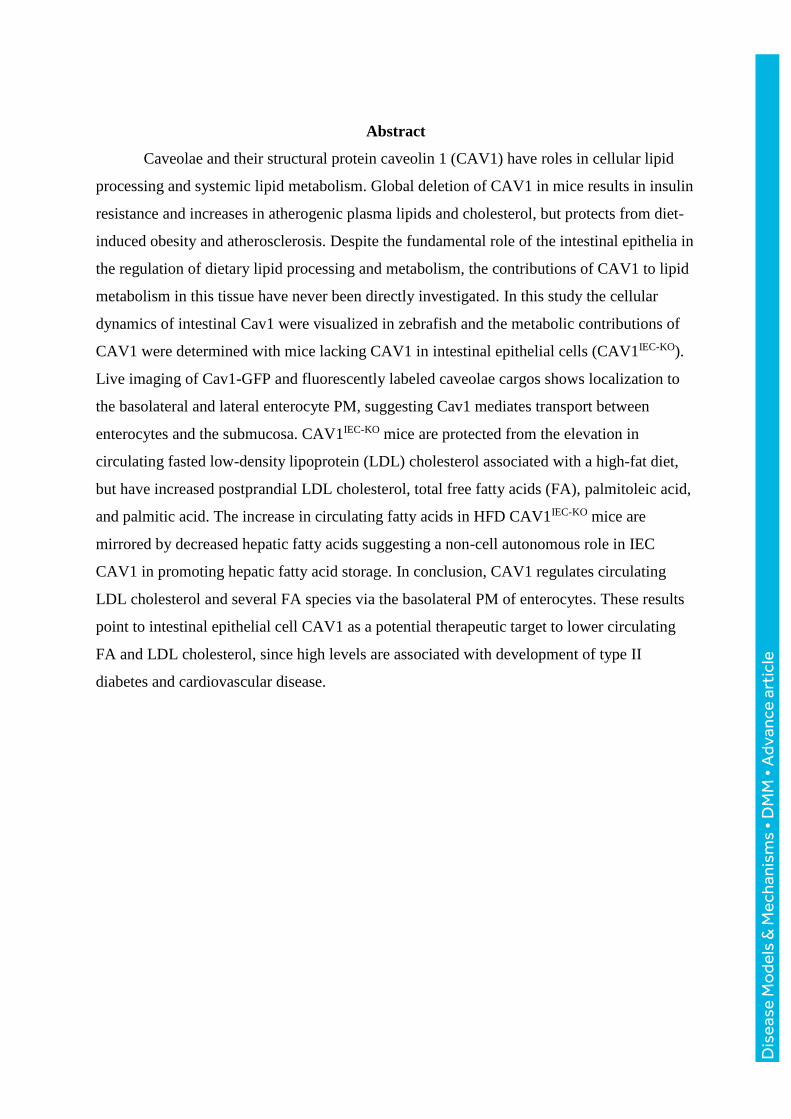
Abstract
Caveolae and their structural protein caveolin 1 (CAV1) have roles in cellular lipid
processing and systemic lipid metabolism. Global deletion of CAV1 in mice results in insulin
resistance and increases in atherogenic plasma lipids and cholesterol, but protects from diet-
induced obesity and atherosclerosis. Despite the fundamental role of the intestinal epithelia in
the regulation of dietary lipid processing and metabolism, the contributions of CAV1 to lipid
metabolism in this tissue have never been directly investigated. In this study the cellular
dynamics of intestinal Cav1 were visualized in zebrafish and the metabolic contributions of
CAV1 were determined with mice lacking CAV1 in intestinal epithelial cells (CAV1IEC-KO).
Live imaging of Cav1-GFP and fluorescently labeled caveolae cargos shows localization to
the basolateral and lateral enterocyte PM, suggesting Cav1 mediates transport between
enterocytes and the submucosa. CAV1IEC-KO mice are protected from the elevation in
circulating fasted low-density lipoprotein (LDL) cholesterol associated with a high-fat diet,
but have increased postprandial LDL cholesterol, total free fatty acids (FA), palmitoleic acid,
and palmitic acid. The increase in circulating fatty acids in HFD CAV1IEC-KO mice are
mirrored by decreased hepatic fatty acids suggesting a non-cell autonomous role in IEC
CAV1 in promoting hepatic fatty acid storage. In conclusion, CAV1 regulates circulating
LDL cholesterol and several FA species via the basolateral PM of enterocytes. These results
point to intestinal epithelial cell CAV1 as a potential therapeutic target to lower circulating
FA and LDL cholesterol, since high levels are associated with development of type II
diabetes and cardiovascular disease.
D
isea
se M
ode
ls &
Mec
hani
sms
• D
MM
• A
dvan
ce a
rtic
le

Introduction
Caveolae are flask-shaped pits, 50 to 100 nm in diameter, that form in lipid-rich
plasma membrane (PM) regions of most vertebrate cells (Parton and Simons, 2007).
Caveolae vesicle structure is formed by oligomers of caveolin proteins; approximately 144
caveolin proteins are present in a single caveolae (Parton and Simons, 2007). CAV1 is
synthesized in the endoplasmic reticulum, transported to the Golgi, and upon exit,
oligomerizes and associates with lipid-rich membrane regions (Parton and Simons, 2007). A
threshold level of membrane cholesterol is required for caveolae to form (Rothberg et al.,
1992) and CAV1 can directly bind cholesterol (Murata et al., 1995) and fatty acids (FA)
(Trigatti et al., 1999).
Historically recognized for their endocytic function, caveolae also regulate cell-
signaling pathways, internalization of cell surface receptors and ligands, cell adhesion
molecule expression, exocytosis, and transcytosis of caveolae cargos (Parton and Simons,
2007). Caveolae are also emerging players in lipid metabolism. Global CAV1 knockout mice
(CAV1KO) mice have severe alterations in circulating lipids, including decreased fasting free
FA (FFA), increased postprandial FFA (Razani et al., 2002), increased triglycerides (TG)
(Frank et al., 2008; Razani et al., 2002), and increased non-high density lipoprotein (HDL)
total, free, and esterified cholesterol (Frank et al., 2008; Heimerl et al., 2008; Razani et al.,
2002; Valasek et al., 2005). CAV1KO mice are insulin resistant (Cohen et al., 2003), but are
protected from diet-induced obesity (Razani et al., 2002) and atherosclerosis (Fernandez-
Hernando et al., 2009; Frank et al., 2004). The plasma lipid and body mass changes in
CAV1KO mice have been proposed to result from a variety of mechanisms including altered
lipid droplet architecture, reduced adipocyte lipid droplet formation (Cohen et al., 2004), and
impaired adipocyte metabolic flexibility (Asterholm et al., 2012), while protection from
atherosclerosis is likely due to decreased endothelial adhesion molecule expression.
The cells that line the intestinal epithelia, enterocytes, are highly specialized to
bidirectionally absorb, transport, and export large quantities of luminal contents and
basolateral plasma components. However, the mechanisms by which dietary lipids are
internalized, transported, and externalized by enterocytes, as well as how enterocytes receive
adequate lipids from adipose stores during fasting, remain incompletely understood. The
close association of CAV1 with cholesterol, FAs, lipid droplets, and lipid-rich PM regions
suggests a role for CAV1 and caveolae in intestinal lipid metabolism (Parton and del Pozo,
2013). CAV1 is expressed, and caveolae vesicles form, in the enterocytes of several species
including humans and mice (Badizadegan et al., 2000; Field et al., 1998; Marchiando et al.,
Dis
ease
Mo
dels
& M
echa
nism
s •
DM
M •
Adv
ance
art
icle

2010; McConnell et al., 2011; Morroni et al., 2007; Nabeyama and Leblond, 1974; Siddiqi et
al., 2013). Although it is known that CAV1 and caveolae are present in enterocytes, several
basic aspects of their biology, including subcellular localization and metabolic functions,
remain unclear.
Although intestinal cholesterol absorption is not disrupted in mice lacking CAV1
(Valasek et al., 2005), isolated intestinal caveolae contain dietary FA (Siddiqi et al., 2013)
and intestinal lipoprotein cholesterol export influences plasma cholesterol levels, so intestinal
CAV1 may significantly impact cholesterol metabolism. Cell culture studies have suggested
that CAV1 PM localization may be asymmetric in polarized cells such as intestinal
enterocytes; however, reports are conflicting. For example, in human intestinal cells CAV1
localizes asymmetrically, but the pattern varies by cell type: in human T84 colonic
adenocarcinoma cells, CAV1 was observed only on lateral membranes (Nusrat et al., 2000);
in human intestinal biopsies, CAV1 was found only on the basolateral surface (Badizadegan
et al., 2000); and in Caco2 cells, CAV1 localizes to the apical plasma membrane (Field et al.,
1998). This imprecise understanding of enterocyte CAV1 localization hampers understanding
of its functions in health and disease in the intestine.
A shortage of studies in live, intact animal models, has limited our understanding of
the contributions of intestinal CAV1 to enterocyte cell biology and global lipid metabolism.
Therefore, in this study we harnessed the genetic tractability and optical clarity of the larval
zebrafish (Danio rerio) to perform live imaging of intestinal Cav1 and caveolae-mediated
endocytosis for the first time. The zebrafish digestive system is similar to that of the human,
composed of a liver, gallbladder, and intestine (Carten and Farber, 2009), and lipid and
lipoprotein metabolism are highly conserved (Babin and Vernier, 1989; Otis et al., 2015).
Similar to humans and mice, the zebrafish genome contains one cav1 gene, with two major
splice transcripts, and it is expressed in the intestine (Nixon et al., 2007). Zebrafish have
previously enabled the elucidation of a role for Cav1 in embryonic organogenesis (Fang et
al., 2006; Nixon et al., 2007) and live super resolution imaging of Cav1 in the embryonic tail
(Gabor et al., 2015). Additionally, we employed the power of the mouse model to generate a
tissue-specific Cav1 deletion and determine its contribution to global lipid metabolism. Our
transgenic zebrafish and knockout mice, combined with a innovative approach to assay
enterocyte endocytosis in vivo, allows for an unprecedented understanding of enterocyte
CAV1 cell biology, the effects of enterocyte CAV1 on systemic lipid metabolism, and how
CAV1 in the intestinal epithelia influence metabolic disease risk through alterations in
circulating lipids.
Dis
ease
Mo
dels
& M
echa
nism
s •
DM
M •
Adv
ance
art
icle
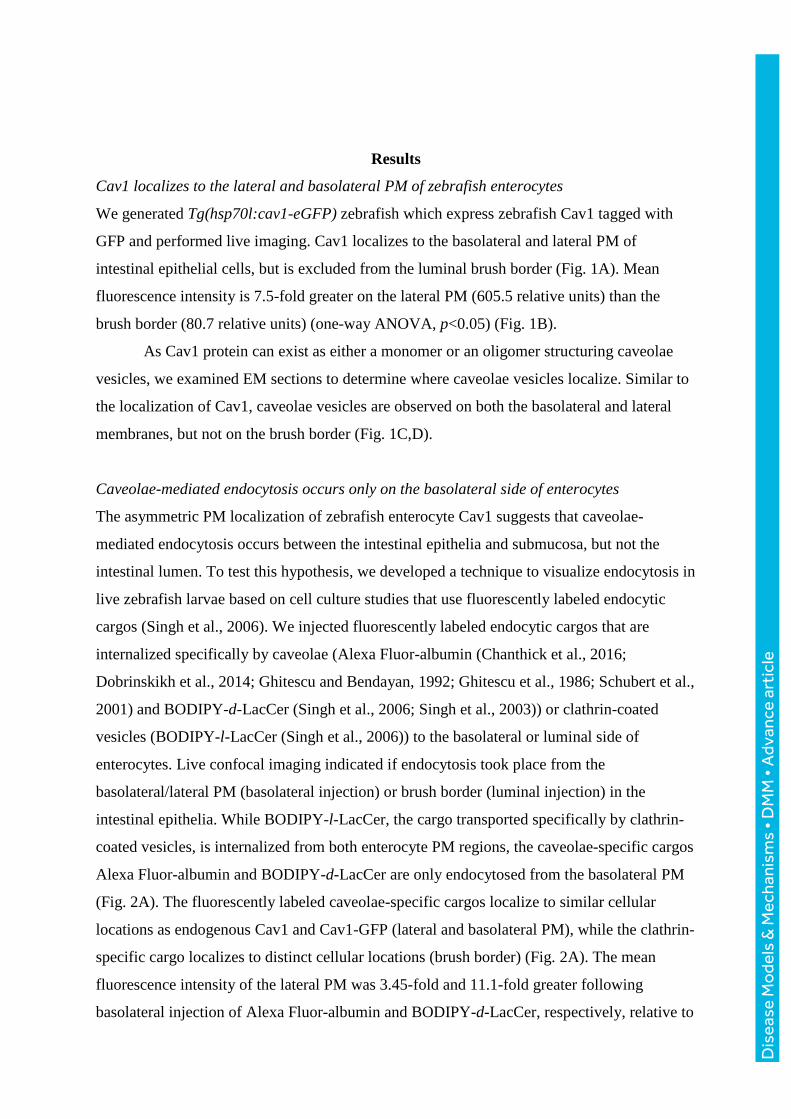
Results
Cav1 localizes to the lateral and basolateral PM of zebrafish enterocytes
We generated Tg(hsp70l:cav1-eGFP) zebrafish which express zebrafish Cav1 tagged with
GFP and performed live imaging. Cav1 localizes to the basolateral and lateral PM of
intestinal epithelial cells, but is excluded from the luminal brush border (Fig. 1A). Mean
fluorescence intensity is 7.5-fold greater on the lateral PM (605.5 relative units) than the
brush border (80.7 relative units) (one-way ANOVA, p<0.05) (Fig. 1B).
As Cav1 protein can exist as either a monomer or an oligomer structuring caveolae
vesicles, we examined EM sections to determine where caveolae vesicles localize. Similar to
the localization of Cav1, caveolae vesicles are observed on both the basolateral and lateral
membranes, but not on the brush border (Fig. 1C,D).
Caveolae-mediated endocytosis occurs only on the basolateral side of enterocytes
The asymmetric PM localization of zebrafish enterocyte Cav1 suggests that caveolae-
mediated endocytosis occurs between the intestinal epithelia and submucosa, but not the
intestinal lumen. To test this hypothesis, we developed a technique to visualize endocytosis in
live zebrafish larvae based on cell culture studies that use fluorescently labeled endocytic
cargos (Singh et al., 2006). We injected fluorescently labeled endocytic cargos that are
internalized specifically by caveolae (Alexa Fluor-albumin (Chanthick et al., 2016;
Dobrinskikh et al., 2014; Ghitescu and Bendayan, 1992; Ghitescu et al., 1986; Schubert et al.,
2001) and BODIPY-d-LacCer (Singh et al., 2006; Singh et al., 2003)) or clathrin-coated
vesicles (BODIPY-l-LacCer (Singh et al., 2006)) to the basolateral or luminal side of
enterocytes. Live confocal imaging indicated if endocytosis took place from the
basolateral/lateral PM (basolateral injection) or brush border (luminal injection) in the
intestinal epithelia. While BODIPY-l-LacCer, the cargo transported specifically by clathrin-
coated vesicles, is internalized from both enterocyte PM regions, the caveolae-specific cargos
Alexa Fluor-albumin and BODIPY-d-LacCer are only endocytosed from the basolateral PM
(Fig. 2A). The fluorescently labeled caveolae-specific cargos localize to similar cellular
locations as endogenous Cav1 and Cav1-GFP (lateral and basolateral PM), while the clathrin-
specific cargo localizes to distinct cellular locations (brush border) (Fig. 2A). The mean
fluorescence intensity of the lateral PM was 3.45-fold and 11.1-fold greater following
basolateral injection of Alexa Fluor-albumin and BODIPY-d-LacCer, respectively, relative to
Dis
ease
Mo
dels
& M
echa
nism
s •
DM
M •
Adv
ance
art
icle
luminal injection (Student’s t-test, p=0.018 and p=0.003) (Fig. 2B). Two lines of zebrafish
with mutations in cav1 have recently been published (Cao et al., 2016); we hypothesized that
uptake of caveolar cargos would be lost in the enterocytes of the fish. Basolateral albumin
injections were repeated in the larvae, however uptake Alexa Fluor-albumin was not
decreased in cav1PD1094, likely since total cav1 mRNA is not decreased in this line. This
experiment was also attempted in two clutches of cav1PD1104 larvae; although some fish were
viable to adulthood, homozygous mutant larvae did not survive the experimental treatment
(data not shown; fish generously provided by Michel Bagnat). These results suggest that
caveolae perform a polarized endocytic function in enterocytes, mediating transport between
enterocytes and the submucosa, but not the intestinal lumen.
Generation of intestinal epithelial cell Cav1 KO mice
While zebrafish are an ideal model to visualize Cav1 and endocytosis, it is extremely
challenging to perform tissue-specific gene deletion and measurements of plasma
metabolites. To address this challenge mice lacking CAV1 specifically in intestinal epithelial
cells (CAV1IEC-KO) were generated by crossing mice with floxed Cav1 (CAV1fl/fl) (Cao et al.,
2003) with Villin-Cre mice (Madison et al., 2002) (Fig. 3A).
PCR of gDNA from whole jejunum (a mixed tissue sample containing non-
genetically modified smooth muscle and vasculature endothelial cells in addition to intestinal
epithelial cells lacking CAV1) shows evidence that Cre recombination occurs in the intestine
of CAV1IEC-KO mice but not in wild type (WT) CAV1fl/fl littermates (Fig. 3B). RT-PCR of
jejunum (tissue includes epithelial cells as well as submucosa and muscle) demonstrates that
Cav1 mRNA is decreased ~70% in CAV1IEC-KO mouse relative to CAV1fl/fl WT (Student’s t-
test, p=0.01) (Fig. 3C) and not expressed in the jejunum of negative control CAV1KO mice
(data not shown). Cav2 mRNA is also decreased in CAV1IEC-KO mice, which have 75% less
Cav2 mRNA relative to CAV1fl/fl WT mice (Student’s t-test, p =0.01) (Fig. 3d)(Drab et al.,
2001; Razani et al., 2001). Western blot shows CAV1 protein expression is 55% lower in
CAV1IEC-KO mouse jejunum than in CAV1fl/fl WT littermates (Fig. 3E) and that CAV1 is lost
in the jejunum of negative control CAV1KO mice (Fig. 3F).
Loss of intestinal epithelial CAV1 does not affect body mass or glucose metabolism
High-fat diet (HFD) increases the body mass of male and female mice relative to mice fed a
low-fat diet (LFD), but CAV1IEC-KO does not protect against diet-induced obesity (16 wk on
diet, 22 wk old, linear regression, males: F=37.7689, p<0.0001 for diet, females: F=33.8792,
Dis
ease
Mo
dels
& M
echa
nism
s •
DM
M •
Adv
ance
art
icle
p<0.0001 for diet) (Fig. 3G,H). Fasting plasma glucose (Fig. S1A), glucose tolerance (Fig.
S1B,C), and insulin tolerance (Fig. S1D) are similarly unaffected by genotype. Thus, neither
body mass or glucose metabolism influence the following changes in lipid metabolism.
Deletion of intestinal epithelial CAV1 alters cholesterol levels
Deletion of CAV1 in the intestinal epithelia results in changes in fasting and postprandial
circulating total and lipoprotein cholesterol, especially when mice were challenged by 16 wk
HFD. Compared to CAV1fl/fl WTs, male CAV1IEC-KO mice have a greater increase in total
and esterified cholesterol upon HFD treatment relative to LFD controls (increase in total
cholesterol: 62.9 mg/dl CAV1IEC-KO vs. 24.3 mg/dl WT, two-way ANOVA, effect of diet:
F(1,24)=8.055, p=009; increase in esterified cholesterol: 54.4 mg/dl CAV1IEC-KO vs. 19.5 WT
mg/dl; two-way ANOVA, effect of diet: F(1,23)=7.610, p=.01) (Fig. 4A). A similar trend for
greater total cholesterol is observed in postprandial male mice maintained on chow diet (CD),
but only free cholesterol is significantly elevated by these conditions (34.6 mg/dl WT vs. 49.1
mg/dl CAV1IEC-KO increase, Student’s t-test, p<0.05) (Fig. 4C). It is well established that
plasma lipids can show sexual dimorphism; here the effects of intestinal CAV1 on plasma
cholesterol are sexually dimorphic: CAV1fl/fl WT females have greater HFD-associated
elevations in total cholesterol (WT: 55.1 mg/dl; CAV1IEC-KO: 10.8 mg/dl increase, two-way
ANOVA, effect of diet, F(1,26)=5.881, p=0.02), free cholesterol (WT: 10.9 mg/dl, CAV1IEC-
KO: 1.7 mg/dl increase, two-way ANOVA, effect of diet, F(1,26)=5.075, p=0.03), and
esterified cholesterol compared to CAV1IEC-KO females (WT: 44.3 mg/dl, IKO: 9.2 mg/dl
increase, two-way ANOVA, effect of diet, F(1,26)=4.707, p=0.04) (Fig. 4B).
Intestinal epithelial CAV1 deletion protects against HFD-induced LDL cholesterol increase
Male CAV1IEC-KO mice are protected against the HFD-associated increase in fasted (4 hr)
plasma low-density lipoprotein cholesterol (LDL-C) seen in CAV1fl/fl WT littermates (HFD
WT: 35.5 mg/dl, 5.5 mg/dl greater than LFD; HFD CAV1IEC-KO: 23.7, 6.3 mg/dl less than
LFD) (two-way ANOVA, significant interaction between diet and genotype, F(1,24)=5.261,
p=0.03) (Fig. 5A), though female mice do not exhibit this protection (Fig. 5B). Conversely,
postprandial LDL-C is elevated in male CAV1IEC-KO mice (23.4 mg/dl) compared to WT
(16.1 mg/dl) (Student’s t-test, p<0.05) (Fig. 5C). HDL-C is also altered in CAV1IEC-KO mice,
as female mice have a greater HFD-induced increase in HDL-C relative to LFD in CAV1IEC-
KO mice (13.3 mg/dl for males, 17.1 mg/dl females) compared to WT (9.6 mg/dl for males,
Dis
ease
Mo
dels
& M
echa
nism
s •
DM
M •
Adv
ance
art
icle

0.2 mg/dl for females) (two-way ANOVA, significant effect of diet F(1,28)=9.516, p=0.005,
and interaction between diet and genotype F(1,28)=5.684, p=0.024) (Fig. 5A,B).
Intestinal epithelial CAV1 deletion increases plasma free fatty acids
Loss of intestinal epithelial CAV1 increases plasma non-esterified fatty acids (NEFA) in
fasted male HFD CAV1IEC-KO mice (1.43 mmol/L) compared to HFD CAV1fl/fl WT
littermates (0.94 mmol/L) (two-way ANOVA, effect of diet, F(1,23)=13.15, p=0.0014) (Fig.
6A). NEFA are also greater in postprandial CD-fed male CAV1IEC-KO mice (0.42 mmol/L)
than WT mice (0.27 mmol/L) (Student’s t-test, p<0.05)(Fig. 6C). Moreover, serum NEFA
decreases less in CD-fed male CAV1IEC-KO mice upon feeding (0.44 fold-decrease) than WT
male mice (0.83 fold-decrease) (Student’s t-test, p<0.05).
HPLC Lipidomics
To investigate changes in the levels of specific species of plasma NEFA and cholesterol
esters we performed a lipidomics study. Using HPLC-CAD, we measured the relative levels
of several major plasma lipids including 8 FA species, free cholesterol, two cholesterol esters
(-oleate and -palmitate), and 5 putative lysophospholipids in the plasma of CAV1IEC-KO and
CAV1fl/fl WT male mice (16 wk HFD or LFD, 26 wk old, 4 hr fast). Strikingly, palmitoleic
acid (16:1) is altered in the same pattern by diet and genotype as total NEFA (two-way
ANOVA, effect of diet, F(1,20)=41.70, p<0.0001, effect of genotype, F(1,20)=5.438, p=0.03)
(Fig. 6E). Similarly, palmitic acid (16:0) is significantly affected by both diet and the
interaction between diet and genotype (two-way ANOVA, diet effect: F(1,20)=10.77,
p=0.0037; interaction effect F(1,20)=5.388, p=0.031) (Fig. 6E). Stearic acid (18:0) is
significantly elevated by HFD, compared to LFD, in CAV1IEC-KO mice (two-way-ANOVA,
F(1,20)=11.95, p=0.0025) (Fig. 6E). Oleic acid (18:1) and linolenic acid (18:3) are both
higher in LFD than HFD fed mice (diet effect found by two-way-ANOVA, oleic acid:
F(1,20)=7.664, p=0.0119, linolenic acid: F(1,20)=28.72, p<0.0001) (Fig. 6E). Neither diet
nor genotype affects any of the other FA measured (22:6, 20:4, and 18:2). In sum,
palmitoleic, palmitic, stearic, and oleic acid may contribute to the observed elevation of total
NEFA in LFD mice compared to HFD mice.
As described above, cholesterol assay kits found that diet affects total and esterified
plasma cholesterol in CAV1IEC-KO mice (Fig. 4). HPLC analysis identified a direct
contribution of free cholesterol (two-way ANOVA, effect of diet, F(1,20)=8.693, p=0.008)
and cholesterol palmitate (two-way ANOVA, effect of diet, F(1,20)=4.800, p=0.04), which
Dis
ease
Mo
dels
& M
echa
nism
s •
DM
M •
Adv
ance
art
icle

are both increased by HFD (Fig. 6E). Finally, one putative lysophospholipid (peak 10) which
could not be identified with standards is also increased by HFD (two-way ANOVA, effect of
diet, F(1,20)=33.25, p<0.0001) (Fig. 6E).
To investigate the mechanism underlying the elevation in plasma NEFAs in male
HFD CAV1IEC-KO relative to male HFD WT mice, liver and white adipose lipids were also
measured by HPLC in male HFD mice. Four of the fatty acids that were decreased in
CAV1IEC-KO plasma, palmitoleic, palmitic, stearic, oleic, and linolenic acids, were also
significantly decreased in the liver (Fig. 6F). It is striking that all of the fatty acids that are
decreased in the liver of CAV1IEC-KO mice, with the exception of stearic acid, have a trend to
be increased in the plasma where total NEFAs are increased. Additionally, hepatic cholesterol
is lower in HFD CAV1IEC-KO mice (Fig. 6F). No differences were observed in triglycerides,
cholesterol esters, or, similar to plasma, 22:6, 20:4, or 18:2 in the liver of HFD mice (data not
shown). Of all these lipids, only cholesterol oleate varied in the white adipose tissue, showing
a decrease in CAV1IEC-KO mice (Fig. 6G; data for other lipids not shown).
Discussion
The global obesity epidemic has caused an explosion in the prevalence of metabolic
diseases such as type II diabetes and cardiovascular disease. Intensive efforts have focused on
the identification of therapeutic targets to better prevent and treat metabolic syndrome.
Previous work had identified functional roles of adipocyte and endothelial CAV1 in
susceptibility to diet-induced obesity (Razani et al., 2002), insulin resistance (Cohen et al.,
2003), and atherosclerosis (Frank et al., 2004). In this study we expanded upon these findings
by visualizing the localization of enterocyte Cav1 and caveolar endocytosis and identifying a
role for CAV1 in the intestinal epithelia in the regulation of plasma FA and LDL cholesterol,
lipids that contribute to the development of several metabolic diseases.
Although it is known that CAV1 is expressed in the intestinal epithelium (Field et al.,
1998), the intracellular localization of this protein has remained ambiguous: lateral PM
localization in Caco-2 colon-derived cells (Vogel et al., 1998); either the brush border or
lateral and basolateral PM localization in Caco-2 cells depending on the fix, permeabilization
method, and antibody used (Field et al., 1998); lateral membrane of T84 colon derived cells
(Badizadegan et al., 2000); cytoplasmic vesicles and lateral PM at adherens and tight
junctions in mouse jejunum (Marchiando et al., 2010); low levels on the mouse small
intestine brush border (McConnell et al., 2011); cytoplasmic vesicles in mouse colon
(Nabeyama and Leblond, 1974); deep apical tubules in pig small intestine (Hansen et al.,
Dis
ease
Mo
dels
& M
echa
nism
s •
DM
M •
Adv
ance
art
icle
2003); human small intestine cytoplasmic vesicles (Morroni et al., 2007); and apical PM and
cytoplasmic vesicles in C. elegans intestine (Parker et al., 2009). Here our in vivo study
reveals that Cav1 localizes asymmetrically to lateral and basolateral enterocyte PM in larval
zebrafish. CAV1 is a FA- and cholesterol-binding protein and caveolae can only form in
lipid-rich PM regions. Although these lipid-rich regions do form on the enterocyte brush
border (Hansen et al., 2001), this membrane has a lipid composition distinct from the lateral
and basolateral PM, with more glycolipids and less cholesterol and sphigomyelin (Danielsen
and Hansen, 2006). It is possible that the relative scarcity of cholesterol in the brush border
excludes CAV1 and caveolae from this PM. Unfortunately, the cellular localization of mouse
CAV1 in the intestinal epithelia could not be determined due to non-specific antibody
binding which we observed in enterocytes.
Fluorescently labeled endocytic cargos are valuable tools to visualize various types of
endocytosis in cultured cells (Singh et al., 2007; Singh et al., 2006). Here, we extended this
technology to image the enterocyte PM regions that likely perform caveolae-mediated
endocytosis in vivo. The results suggesting that caveolae-mediated endocytic activity in
enterocytes is asymmetric points to a role for caveolae in vesicular transport between
enterocytes and the body, but not the intestinal lumen. The optical clarity of larval zebrafish
and advances in mouse vital imaging present the opportunity to extend this technique to
investigations of caveolae- and clathrin-mediated endocytosis in a multitude of tissues in the
context of health or disease.
Prior studies have reported increased fasting plasma cholesterol in male CAV1KO
mice, largely consisting of elevations in VLDL and LDL cholesterol resulting from adipocyte
lipid storage defects and decreased aortic and hepatic LDL uptake (Frank et al., 2008;
Valasek et al., 2005). Our studies find that the intestinal epithelium does not mediate these
changes, as we did not observe differences in plasma cholesterol or cholesterol palmitate in
CAV1IEC-KO mice. However, we did find that LDL cholesterol levels were increased
postprandially and decreased during fasting (when hepatic cholesterol is also decreased) in
male HFD CAV1IEC-KO mice; this is opposite of the pattern observed in CAV1KO mice.
Another striking observations is that male CAV1IEC-KO mice have increased fasting plasma
NEFA (HFD), mirrored by decreases in several hepatic fatty acids, and decreased
postprandial NEFA (CD). The literature regarding the effect of total body CAV1 deletion on
circulating FFA is conflicting, with reports of higher fasting and postprandial FFA
(Asterholm et al., 2012; Razani et al., 2002), decreased fasting FFA (Cohen et al., 2004), or
no changes (Valasek et al., 2005).
Dis
ease
Mo
dels
& M
echa
nism
s •
DM
M •
Adv
ance
art
icle
First, we hypothesized that the changes in LDL cholesterol and FFA could be mediated
by the cluster of differentiation 36 scavenger receptor (CD36). CD36 delays LDL clearance
(Luangrath et al., 2008), so impairment of its function in CAV1IEC-KO mice could accelerate
LDL clearance, causing the observed decrease in fasting LDL cholesterol. Increased
postprandial LDL cholesterol could also be explained, as CD36 facilitates cellular cholesterol
uptake (Nassir et al., 2007). Additionally, FFA could be increased due to impaired CD36
localization and function, since CD36 facilitates FA uptake (Nassir et al., 2007; Pepino et al.,
2014) and its deletion increases serum FFA (Febbraio et al., 1999). CD36 is highly expressed
in the proximal intestine (Poirier et al., 1996) and CAV1 is necessary for CD36 to properly
localize to the PM of mouse embryonic fibroblasts (Ring et al., 2006). Therefore, we
speculated that CD36 PM localization and or expression may be disregulated in CAV1IEC-KO
mice. However, contrary to the previous findings in mouse embryonic fibroblasts, no change
in CD36 localization was observed in the intestinal epithelia of HFD treated CAV1IEC-KO
mice (Fig. S2A) and no decrease in mRNA or protein expression were observed (data not
shown). In support of this conclusion, it would be expected that hepatic cholesterol would
increase if the CD36-medated LDL clearance delay was perturbed, but instead HPLC
analysis found a decrease in hepatic cholesterol.
Second, changes in circulating FFA in CAV1IEC-KO mice could be mediated by changes in
intestinal albumin uptake. Circulating FFA are transported by albumin, as much as 18% of
which is absorbed and catabolized by the intestine (Yedgar et al., 1983). Indeed, we showed
that Alexa Fluor-albumin is internalized by caveolae on the basolateral PM of enterocytes. If
this were true a concomitant increase in plasma albumin would be expected, however this
was not observed (Fig. S2B). As circulating albumin levels are tightly regulated, this
hypothesis cannot be ruled out lacking direct measurement of albumin flux from the liver.
Nonetheless, in further support of our conclusion, increased postprandial plasma lipids likely
do not result from altered intestinal processing because no changes in serum NEFA or TG
were observed by an oral lipid tolerance test (Fig. S3).
Third, we hypothesized that CAV1IEC-KO mice may have decreased intestinal insulin
signaling, and thus insulin stimulated plasma FA uptake, underlying the observed increase in
circulating NEFA. This hypothesis is supported by the fact that insulin signaling is present in
the intestine (Veilleux et al., 2014), the insulin receptor localizes to caveolae (Gustavsson et
al., 1999), and that global CAV1 knockout mice are insulin resistant (Cohen et al., 2003).
Substantiating this hypothesis insulin receptor mRNA is significantly decreased in the
jejunum of CAV1IEC-KO mice compared to controls (Fig. S4), but no change in insulin
Dis
ease
Mo
dels
& M
echa
nism
s •
DM
M •
Adv
ance
art
icle

receptor subunit β protein was observed by western blot (data not shown). Importantly, there
may be a non-IEC autonomous mechanism (insulin signaling or otherwise) by which hepatic
fatty acid uptake is decreased or secretion is increased leading to the observed decrease in
several hepatic fatty acids and corresponding increase in circulating NEFA. Similarly, loss of
CAV1 in IEC may underlie a non-cell autonomous mechanism by which hepatic cholesterol
is decreased, limiting the amount of LDL that can be secreted, causing the decrease in LDL-C
observed in CAV1IEC-KO mice.
HPLC determined that palmitoleic and palmitic acid contribute to the overall increase
in fasting NEFA observed in HFD CAV1IEC-KO mice. Palmitoleic acid is an omega-7 mono-
unsaturated FA that is enriched in endothelial caveolae (Gafencu et al., 1998). If palmitoleic
acid is also preferentially carried in enterocyte caveolae, it follows that loss of CAV1 could
result in decreased palmitoleic acid uptake, and the observed plasma elevation. Further
investigation of the detailed mechanism would be of interest since palmitoleic acid is a
bioactive lipid: dietary supplementation has plasma lipid lowering, anti-diabetic, and anti-
inflammatory activity (Cao et al., 2008), but elevated plasma palmitoleic acid is correlated
with increased heart failure (Djousse et al., 2012) and non-alcoholic fatty liver disease (Puri
et al., 2009). It is possible that no influence of genotype on plasma palmitoleic acid levels in
LFD mice was found simply because it comprises a much smaller proportion of the diet
(0.04% of total LFD vs. 0.44% of total HFD by mass). Caveolae are also enriched in palmitic
acid (Cai et al., 2013) so plasma palmitic acid may in higher in CAV1IEC-KO than WT mice
due to the mechanism proposed above. Since CAV1 is palmitoylated (Dietzen et al., 1995),
decreased activity in this pathway may contribute to the plasma palmitic acid elevation.
Finally, the sexual dimorphism observed in the changes in plasma lipids in CAV1IEC-
KO mice must be addressed. It is well established that male and female animals have
metabolic differences; in C57BL/6J mice, this includes differences in lipid and fatty acid
metabolism gene expression in multiple tissues (Yang et al., 2006). Moreover, sex-specific
metabolic differences have been observed previously in global CAV1 KO mice: decreased
body mass on chow diet compared to WT in male, but not female, mice and increased food
intake relative to WT in female, but not male, mice (Razani et al., 2002). However, neither
sex had increased circulating free fatty acids compared to WT, and LDL cholesterol was only
measured in male mice, where it was increased compared to WT (Razani et al., 2002). In
contrast to this previous study, we report that CAV1IEC-KO male, but not female, mice were
protected from the HFD-induced increase in plasma LDL cholesterol observed in WT.
Although the mechanism for this difference is unknown, it is possible that sexually
Dis
ease
Mo
dels
& M
echa
nism
s •
DM
M •
Adv
ance
art
icle
dimorphism in estrogen receptor signaling underlies this difference. When estrogen binds the
estrogen receptor α (ERα) transcription factor, ERα activates transcription of the LDL
receptor (LDLR), which takes up LDL from the circulation (Cooper, 1987). CAV1 has been
shown to potentiate the action of ERα in cultured cells (Schlegel, 1999). Additionally, female
mice of mixed genetic background (129/Pas x C57BL/6J, ~90% C57BL/6J) have higher Ldlr
and Cd36 hepatic gene expression compared to males (Lorbek et al., 2013). Therefore, since
estrogen levels are higher in females, differences in estrogen-stimulated LDLR transcription
and subsequent cellular uptake may underlie the observed sex-specific differences in LDL
cholesterol in CAV1IEC-KO mice. Furthermore, female CAV1IEC-KO mice had significantly
increased HDL cholesterol on HFD compared to LFD; this difference was not observed in
WT females, and the trend was non-significant in males. These findings are consistent with
Link et al.’s report on the role of sex chromosomes that mice with female (two X
chromosomes) have higher HDL cholesterol levels than male (XY) mice (Link et al., 2015).
The observed sexual dimorphism does not preclude intestinal epithelial CAV1 as a potential
therapeutic target for metabolic disease as many pharmaceuticals currently in use have
sexually dimorphic actions, including the LDL cholesterol lowering drug fenofibrate (Yoon
et al., 2002). Nor does the modest decrease in LDL cholesterol preclude intestinal epithelial
CAV1 as a therapeutic target, since even a 1% reduction in LDL cholesterol leads to a 1%
decrease in cardiovascular disease risk (Baigent et al., 2005).
In conclusion, this study demonstrated that CAV1 localizes to, and caveolar
endocytosis occurs on, the lateral and basolateral PM of intestinal enterocytes. Although the
detailed cellular mechanism remains to be elucidated, it is clear that CAV1 on enterocyte
basolateral membranes influences circulating levels of LDL cholesterol and NEFA,
specifically palmitoleic and palmitic acid. Elevated plasma FA and LDL cholesterol are
associated with metabolic disease, including type II diabetes and cardiovascular disease. The
results of this study indicate that CAV1 in the intestinal epithelium may serve as a therapeutic
target to lower circulating FA and LDL cholesterol and prevent disease in males.
Experimental Procedures
Generation of transgenic zebrafish
Zebrafish research was approved by the Carnegie Institution Department of Embryology
IACUC Committee (protocol #139). Zebrafish were housed at 28°C with a 14:10 light:dark
cycle. Tg(hsp70l:cav1-eGFP) zebrafish were created with the tol2-Gateway system (Kwan et
al., 2007). Zebrafish cav1 was cloned from Image Consortium plasmid #3719638 (fb95c12)
Dis
ease
Mo
dels
& M
echa
nism
s •
DM
M •
Adv
ance
art
icle

and Gateway cloning constructed hsp70l:cav1-eGFP: the zebrafish heat shock cognate 70-kd
protein, like (hsp70l) promoter driving cav1 tagged with eGFP (provided by Chi-bin Chien).
This plasmid was injected with tol2 transposase for genome integration with a microforged
glass needle (P-97 Flaming/Brown micropipette puller, Stutter Instruments, Novato, CA)
connected to a nitrogen gas pressure injector (PLI 100, Harvard Apparatus, Cambridge, MA)
into 1−2 cell zebrafish embryos (AB background). F0 larvae were heat shocked (45 min,
37°C, in 15 ml embryo media (EM)) at 6 day post-fertilization (6 dpf) and screened for
mosaic Cav1-eGFP expression 4−6 hours later. Three independent stable lines were
established and all further experimentation was undertaken in stable transgenic animals.
Live imaging of zebrafish larvae and quantification of fluorescence
Approximately 24 hr prior to imaging larvae were heat shocked as described above to induce
Cav1-eGFP expression. Larvae were anesthetized with tricaine (Sigma-Aldrich, St. Louis,
MO) and mounted in 3% methyl cellulose (Sigma-Aldrich, St. Louis, MO) under a coverslip
(Carten et al., 2011). Live Tg(hsp70:cav1-eGFP) larvae were imaged on a SP-2 confocal
microscope (Leica Microsytems, Deerfield, IL) with an argon laser under a 63x oil
immersion objective. Images were collected as 12 bit and analyzed with Metamorph software
(Molecular Devices, Sunnyvale, CA). Regions of the brush border, lateral, and basolateral
PM, as well as intracellular regions, were outlined for quantification of mean fluorescence
intensity (3 regions of interest for each cellular area, 3 images per fish, 3 fish per experiment,
for a total of 3 experiments or 9 fish).
Electron Microscopy and Immunofluorescence
Larval (6 dpf) zebrafish and intestines from adult zebrafish and were collected for EM. Prior
to euthanasia adult fish were fed on a lipid-rich, hard-boiled chicken egg yolk for 1 hr ad lib;
larvae studied were lecithotrophic (6 dpf) and thus were not provided exogenous food. EM
samples were fixed in 3% glutaraldehyde (Electron Microscopy Sciences, Hatfield, PA) and
1% formaldehyde, post-fixed in reduced osmium (Electron Microscopy Sciences), stained
with uranyl acetate (Fisher Scientific), embedded in Epon 812 resin (Ladd Research
Industries, Williston, VT), and imaged on a Technai-12 electron microscope (FEI, Hillsboro,
OR) with a 794 multiscan camera (Gatan, Pleasanton, CA).
Mouse CAV1 IF was attempted on paraffin sections and cryosections of jejunum
collected after a 4 hr fast, but non-specific fluorescence was observed in enterocytes, even in
the negative control, global CAV1 KO mice. The antibodies tested at a range of dilutions
Dis
ease
Mo
dels
& M
echa
nism
s •
DM
M •
Adv
ance
art
icle
were: BD Biosciences/Transduction labs #610059, 610057 and 610406, Santa Cruz
Biotechnology #sc-894, Abcam #ab2910, and Cell Signaling # 3238s. The antigen retrieval
methods tested were Tris-EDTA buffer, sodium-citrate buffer, and Diva Decloaker (Biocare
Medical, Concord, CA).
Imaging fluorescently labeled endocytic cargos in vivo
WT Larvae (6 dpf) were anesthetized in tricaine and mounted in 1.2% low melt agarose
(Sigma-Aldrich) in EM. A microforged glass needle was loaded with (4,4-difluoro-4-bora-3a,
4a-diaza-S-indacene)-l-threo-lactosylceramide (BODIPY-l-LacCer)) (provided by David
Marks) or BODIPY-d-erythro-LacCer (#895279, Invitrogen) at a concentration of 2.5 μg/μl
in 30% ethanol and 70% embryo media, or Alexa Fluor-594-albumin (#A13101, Fisher
Scientific, Pittsburg, PA) at a concentration of 5 μg/μl in PBS. A nitrogen-pressured injection
rig was used to inject 2 nl to the basolateral side of the intestine or into the intestinal lumen.
Larvae were freed from the agarose, allowed to recover for 30 min (LacCer) or 1 hr
(albumin) while swimming freely, re-anesthetized, mounted in 3% methyl cellulose under a
coverslip, placed on ice to stop endocytosis (Bourseau-Guilmain et al., 2016), imaged, and
the same sample size was analyzed with Metamorph software as described above.
Breeding CAV1IEC-KO mice
Mouse research was approved by the Carnegie Institution Department of Embryology
IACUC Committee (protocol #156). Mice were housed at 20-21°C with a 12:12 light cycle.
Mice with a floxed Cav1 allele (provided by Michael Elliot) (Cao et al., 2003) were crossed
with Tg(Vil-cre)997Gum/J mice (#004586, Jackson Labs, Bar Harbor, ME) which express
Cre recombinase specifically in the intestinal epithelium, producing mice lacking Cav1
specifically in the intestinal epithelium (CAV1IEC-KO)(back crossed to C57BL/6 6 times) (Fig.
1A). All experiments were performed with CAV1IEC-KO vs. Cav1fl/fl (WT) littermates.
Mice were genotyped for floxed Cav1 (350 bp band following PCR with F1:TTC
TGT GTG CAA GCC TTT CC and R1:GTG TGC GCG TCA TAC ACT TG) and Vil-Cre
PCR (1,100 bp band following PCR with F: GTG TGG GAC AGA GAA CAA ACC and
R:ACA TCT TCA GGT TCT GCG GG). The occurrence of Cre recombination in the
intestine of CAV1IEC-KO mice was verified by the presence of a 350 bp band (F1 primer
above, R2: GGG GAG GAG TAG AAG GTG GC) (Cao et al., 2003) on genomic DNA
isolated from whole jejunum segments by NaOH extraction (Truett et al., 2000). Cav1tm1Mls
Dis
ease
Mo
dels
& M
echa
nism
s •
DM
M •
Adv
ance
art
icle

(CAV1IEC-KO) mice lacking functional Cav1 in all tissues were used as controls (#007083,
Jackson Labs, Bar Harbor, ME).
RT-PCR
Cav1 and Cav2 mRNA levels were measured in whole jejunum by RT-PCR: mRNA was
isolated with Trizol (Invitrogen), cDNA was synthesized with AMV reverse transcriptase
(New England Biolabs, Ipswich, MA), and RT-PCR was run with the PrimePCR SYBR
Green assay for mouse Cav1 and Cav2 according to the manufacturer’s instructions (#100-
25636, BioRad Laboratories, Hercules, CA).
Western Blot
CAV1 protein was measured by western blot as previously described (Otis et al., 2011).
Briefly, cytosolic fractions of jejunum were run on denaturing SDS-Page gels with a Mini-
Protean system (BioRad Laboratories), transferred to nitrocellulose, blocked with blocking
grade blocker (BioRad Laboratories), and probed with antibodies to CAV1 (#610059, BD
Transduction Labs, Lexington, KY; 1:5,000 dilution), α-tubulin (#T6199, Sigma-Aldrich;
1:10,000 dilution), goat-anti-rabbit IgG-HRP (#170-6515, BioRad Laboatoris; 1:5,000
dilution), and goat-anti-mouse IgG-HRP (#170-6516, BioRad Laboratories; 1:10,000
dilution). Protein expression was imaged by chemiluminescence (SuperSignal West Pico
Chemiluminescent Substrate, Pierce, Rockford, IL). Data from 3 western blots, with 5 WT
and 5 IKO mice each, was analyzed with ImageJ software (NIH, Bethesda, MD).
Experimental diets
Upon weaning, mice were fed CD ad lib (#7012, Harlan Teklad, Fredrick, MD). At 10 wk of
age, mice were separated randomly into groups and either continued on CD, or fed a 60%
HFD or 10% fat, nutrient-matched LFD (#D12492 and #D12450J respectively, Research
Diets, New Bruswick, NJ) ad lib. Mice fed HFD and LFD were massed weekly until
euthanasia at 26 wk; n=10−15 mice per diet.
Plasma cholesterol and lipid analysis
Mice were euthanized by CO2 inhalation and blood was collected by cardiac puncture. Serum
was collected by centrifugation (15 min, 2,000 x g, 4°C) after allowing blood to clot on ice.
Plasma was collected by centrifugation (15 min, 2,000 x g, 4°C) in EDTA-treated tubes
(Sarstedt, Numbrecht, Germany). All serum and plasma samples were snap frozen and stored
Dis
ease
Mo
dels
& M
echa
nism
s •
DM
M •
Adv
ance
art
icle

at -80°C. Kits were used to measure total cholesterol (Infinity Total Cholesterol, Fisher
Scientific), free cholesterol (Free Cholesterol E, Wako Diagnostics, Richmond, VA), HDL
cholesterol (HDL-C E, Wako Diagnostics), LDL cholesterol (LDL-C Reagent L-type, Wako
Diagnostics), NEFA (HR Series NEFA-HR(2), Wako Diagnostics), and TGs (Infinity
Triglycerides, Fisher Scientific) according to the manufacture’s directions. For HFD and LFD
male mice n=5−8, for HFD and LFD female mice n=8−9; and for CD male mice, n=6−8.
HPLC
HPLC-CAD was implemented to measure levels of specific plasma lipids. Lipids were
extracted from plasma (50 μl; n=6), liver (10-50 mg; n=5), and white adipose tissue (15-40
mg; n=5) using a modified Bligh-Dyer procedure (Carten et al., 2011), dried under vacuum,
and resuspended in the injection solvent HPLC-grade 2-propanol. The investigator that
extracted the lipids blinded the samples from the investigator who completed the HPLC
experimentation and analysis.
HPLC-CAD was performed using a LPQ-3400RS quaternary pump, WPS-3000TRS
autosampler, TCC-3000RS column oven, Accucore C18 column (150 x 3.0 mm, 2.1 μm
particle size) and Dionex Corona Veo charged aerosol detector (all from Thermo Scientific).
Lipids were separated over 80 min in a multistep gradient as follows: 0-5 min at 0.8 mL/min
in 98.0% mobile phase A (methanol-water-acetic acid, 750:250:4) and 2.0% mobile phase B
(acetonitrile-acetic acid, 1000:4), 5-35 min at 0.8-1.0 mL/min, 98.0-30% A, 2.0-65.0% B, and
0-5.0% mobile phase C (2-propanol), 35-45 min at 1.0 mL/min, 30%-0% A, 65.0%-95.0% B,
and 5.0% C, 45-73 min at 1.0 mL/min, 95.0-60.0% B and 5.0-40.0% C, and 73-80 min at 1.0
mL/min, 60.0% B, and 40.0% C (adapted from pers. corr. with Marc Plante, Thermo
Scientific). Following the analytical portion of the gradient, the column was washed for 20
min with 100% mobile phase C at 0.4 mL/min, then returned to 98% A and 2% B at 0.8
mL/min for re-equilibration. Injection volume was between 5 and 25 μL and was adjusted for
each sample to produce optimum peak shape for quantitation. The autosampler tray was
maintained at 20.0oC and the column oven temperature at 40.0oC.
Chromatographic peaks were identified by comparison with standards (Sigma-
Aldrich). Early-eluting peaks not identified as FA were confirmed as polar lipids by acetone
precipitation (adapted from (Morris, 1972)), and based on their retention times when
compared with those of polar lipid standards, were determined to most likely be
lysophospholipids (data not shown). Quantitative comparison of the relative amounts of lipid
species of interest was performed blinded using Chromeleon 7.2 (Dionex, Sunnyvale, CA).
Dis
ease
Mo
dels
& M
echa
nism
s •
DM
M •
Adv
ance
art
icle

Peak baselines were drawn manually and areas (in picoamperes (pA)*min) were determined
automatically. For plasma samples, all peak areas were divided by the area of the second
lysophospholipid peak in the same sample. This lipid was chosen as it varied the least among
all of the samples after accounting for injection volume. For comparison between samples,
lipid amounts are expressed as [peak area (pA*min)]/[area of peak 2 (pA*min)]. For liver and
white adipose samples, all peak areas were normalized to percent of total signal to control for
unequal extraction efficiencies and differences in starting tissue mass between samples.
Glucose metabolism
Blood glucose was measured in mice fasted 4 hr by tail bleed using a glucometer
(AlphaTRAK glucose meter, VWR, Radnor, PA) just prior to euthanasia (n=6−10). For IP
GTT, mice fasted 4 hr were administered 2 g/kg sterilized glucose in water IP and blood
glucose was measured from the tail vein by glucometer at 0, 15, 30, 60, and 120 min
(n=9−14). For OGTT, the same dose of sterile glucose was administered by gavage and blood
glucose was monitored as described (n=7−9). ITT was performed by administering mice IP
insulin (#12585-014, Gibco, Gaithersburg, MD) at a dose of 0.76 U/kg for LFD mice and 1
U/kg for HFD mice; blood glucose was measured as described for GTT (n=7−13). GTT and
ITT results were analyzed by two-way, and OGTT by one-way repeated measures ANOVA
followed by Tukey’s post hoc test.
Lipid tolerance test
Male and female CAV1IEC-KO and WT littermates were housed on CD until 12 wk old, fasted
16 hr, and gavaged with 10 μl/g body mass 20% emulsified Intralipid (soybean oil) (Sigma).
Serum was collected from tail bleed at 0, 1, 2, 3, and 4 hours post gavage. TGs and NEFA
were assayed as described above.
Statistics
Differences in Cav1-eGFP fluorescence intensities were compared with a one-way ANOVA
followed by Tukey’s post hoc test. Student’s t-test was used to compare endocytic cargo
membrane fluorescence and RT-PCR measurements of jejunal mRNA. Western blot data
from each of 3 blots were adjusted by expression of the loading control and expressed
relative to WT levels, averaged together, and compared by Student’s t-test. Differences in
BM were compared by linear regression. Plasma lipids identified by HPLC were compared
by two-way ANOVA followed by Tukey’s post hoc test. Liver and white adipose lipids
Dis
ease
Mo
dels
& M
echa
nism
s •
DM
M •
Adv
ance
art
icle

measured by HPLC were compared by Student’s t-test. All data analyzed by ANOVA were
first confirmed for homogeneity of variance by Bartlett’s or Brown-Forsythe tests. Statistics
were performed with Prism software (GraphPad, La Jolla, Ca).
Acknowledgements
The authors are grateful to Michael Elliot, David Marks, Michel Bagnat, and the late Chi-bin
Chien for experimental reagents and animals, to Michael Wolfgang, Guang William Wong,
and Alex Bortvin for consultation on experimental design, to Blake Caldwell, Eugenia
Dikovsky, Amy Kowalski, Mike Sepanski, and Erin Zeituni for technical assistance, and to
Nada Abumrad for IF advice. This study was funded by NIDDK-NIH F32DK096786
(J.P.O.), RO1DK093399 (S.A.F.), and RO1GM63904 (The Zebrafish Functional Genomics
Consortium: PI Stephen Ekker and Co-PI S.A.F). This content is solely the responsibility of
the authors and does not necessarily represent the official views of NIH. Additional support
for this work was provided by the Carnegie Institution for Science endowment and the G.
Harold and Leila Y. Mathers Charitable Foundation (S.A.F).
Competing Interests
The authors have no financial or non-financial competing interests to declare.
Author Contributions
Conceptualization, J.P.O and S.A.F.; Methodology, J.P.O., V.Q.R., and S.A.F.; Formal
Analysis, J.P.O, J.L.A., and V.Q.R.; Investigation, J.P.O., M.C.S., and V.Q.R.; Writing −
Original Draft, J.P.O. and V.Q.R.; Writing − Review & Editing, J.P.O., J.L.A., S.A.F,
M.C.S., and V.Q.R.; Funding Acquisition, J.P.O. and S.A.F.
Dis
ease
Mo
dels
& M
echa
nism
s •
DM
M •
Adv
ance
art
icle

References
Asterholm, I. W., Mundy, D. I., Weng, J., Anderson, R. G. and Scherer, P. E.
(2012). Altered mitochondrial function and metabolic inflexibility associated with loss of
caveolin-1. Cell Metab 15, 171-85.
Babin, P. J. and Vernier, J. M. (1989). Plasma lipoproteins in fish. J Lipid Res 30,
467-89.
Badizadegan, K., Dickinson, B. L., Wheeler, H. E., Blumberg, R. S., Holmes, R.
K. and Lencer, W. I. (2000). Heterogeneity of detergent-insoluble membranes from human
intestine containing caveolin-1 and ganglioside G(M1). American journal of physiology.
Gastrointestinal and liver physiology 278, G895-904.
Baigent, C., Keech, A., Kearney, P. M., Blackwell, L., Buck, G., Pollicino, C.,
Kirby, A., Sourjina, T., Peto, R., Collins, R. et al. (2005). Efficacy and safety of
cholesterol-lowering treatment: prospective meta-analysis of data from 90,056 participants in
14 randomised trials of statins. Lancet 366, 1267-78.
Bourseau-Guilmain, E., Menard, J. A., Lindqvist, E., Indira Chandran, V.,
Christianson, H. C., Cerezo Magana, M., Lidfeldt, J., Marko-Varga, G., Welinder, C.
and Belting, M. (2016). Hypoxia regulates global membrane protein endocytosis through
caveolin-1 in cancer cells. Nature communications 7, 11371.
Cai, Q., Guo, L., Gao, H. and Li, X. A. (2013). Caveolar fatty acids and acylation of
caveolin-1. PLoS One 8, e60884.
Cao, G., Yang, G., Timme, T. L., Saika, T., Truong, L. D., Satoh, T., Goltsov, A.,
Park, S. H., Men, T., Kusaka, N. et al. (2003). Disruption of the caveolin-1 gene impairs
renal calcium reabsorption and leads to hypercalciuria and urolithiasis. Am J Pathol 162,
1241-8.
Dis
ease
Mo
dels
& M
echa
nism
s •
DM
M •
Adv
ance
art
icle

Cao, H., Gerhold, K., Mayers, J. R., Wiest, M. M., Watkins, S. M. and
Hotamisligil, G. S. (2008). Identification of a lipokine, a lipid hormone linking adipose
tissue to systemic metabolism. Cell 134, 933-44.
Cao, J., Navis, A., Cox, B. D., Dickson, A. L., Gemberling, M., Karra, R., Bagnat,
M. and Poss, K. D. (2016). Single epicardial cell transcriptome sequencing identifies
Caveolin 1 as an essential factor in zebrafish heart regeneration. Development 143, 232-43.
Carten, J. D., Bradford, M. K. and Farber, S. A. (2011). Visualizing digestive
organ morphology and function using differential fatty acid metabolism in live zebrafish. Dev
Biol 360, 276-85.
Carten, J. D. and Farber, S. A. (2009). A new model system swims into focus:
using the zebrafish to visualize intestinal metabolism in vivo. Clin Lipidol 4, 501.
Chanthick, C., Kanlaya, R., Kiatbumrung, R., Pattanakitsakul, S. N. and
Thongboonkerd, V. (2016). Caveolae-mediated albumin transcytosis is enhanced in dengue-
infected human endothelial cells: A model of vascular leakage in dengue hemorrhagic fever.
Sci Rep 6, 31855.
Cohen, A. W., Combs, T. P., Scherer, P. E. and Lisanti, M. P. (2003). Role of
caveolin and caveolae in insulin signaling and diabetes. Am J Physiol Endocrinol Metab 285,
E1151-60.
Cohen, A. W., Razani, B., Schubert, W., Williams, T. M., Wang, X. B., Iyengar,
P., Brasaemle, D. L., Scherer, P. E. and Lisanti, M. P. (2004). Role of caveolin-1 in the
modulation of lipolysis and lipid droplet formation. Diabetes 53, 1261-70.
Cooper, A. D., Nutik, R., Chen, J. (1987). Characterization of the esterogen-induced
lipoprotein receptor in rat liver. J Lipid Res 28, 59.
Danielsen, E. M. and Hansen, G. H. (2006). Lipid raft organization and function in
brush borders of epithelial cells. Molecular membrane biology 23, 71-9.
Dis
ease
Mo
dels
& M
echa
nism
s •
DM
M •
Adv
ance
art
icle
Dietzen, D. J., Hastings, W. R. and Lublin, D. M. (1995). Caveolin is palmitoylated
on multiple cysteine residues. Palmitoylation is not necessary for localization of caveolin to
caveolae. J Biol Chem 270, 6838-42.
Djousse, L., Weir, N. L., Hanson, N. Q., Tsai, M. Y. and Gaziano, J. M. (2012).
Plasma phospholipid concentration of cis-palmitoleic acid and risk of heart failure. Circ
Heart Fail 5, 703-9.
Dobrinskikh, E., Okamura, K., Kopp, J. B., Doctor, R. B. and Blaine, J. (2014).
Human podocytes perform polarized, caveolae-dependent albumin endocytosis. Am J Physiol
Renal Physiol 306, F941-51.
Drab, M., Verkade, P., Elger, M., Kasper, M., Lohn, M., Lauterbach, B., Menne,
J., Lindschau, C., Mende, F., Luft, F. C. et al. (2001). Loss of caveolae, vascular
dysfunction, and pulmonary defects in caveolin-1 gene-disrupted mice. Science 293, 2449-52.
Fang, P. K., Solomon, K. R., Zhuang, L., Qi, M., McKee, M., Freeman, M. R.
and Yelick, P. C. (2006). Caveolin-1alpha and -1beta perform nonredundant roles in early
vertebrate development. Am J Pathol 169, 2209-22.
Febbraio, M., Abumrad, N. A., Hajjar, D. P., Sharma, K., Cheng, W., Pearce, S.
F. and Silverstein, R. L. (1999). A null mutation in murine CD36 reveals an important role
in fatty acid and lipoprotein metabolism. J Biol Chem 274, 19055-62.
Fernandez-Hernando, C., Yu, J., Suarez, Y., Rahner, C., Davalos, A., Lasuncion,
M. A. and Sessa, W. C. (2009). Genetic evidence supporting a critical role of endothelial
caveolin-1 during the progression of atherosclerosis. Cell Metab 10, 48-54.
Field, F. J., Born, E., Murthy, S. and Mathur, S. N. (1998). Caveolin is present in
intestinal cells: role in cholesterol trafficking? J Lipid Res 39, 1938-50.
Dis
ease
Mo
dels
& M
echa
nism
s •
DM
M •
Adv
ance
art
icle

Frank, P. G., Lee, H., Park, D. S., Tandon, N. N., Scherer, P. E. and Lisanti, M.
P. (2004). Genetic ablation of caveolin-1 confers protection against atherosclerosis.
Arteriosclerosis, thrombosis, and vascular biology 24, 98-105.
Frank, P. G., Pavlides, S., Cheung, M. W., Daumer, K. and Lisanti, M. P. (2008).
Role of caveolin-1 in the regulation of lipoprotein metabolism. Am J Physiol Cell Physiol
295, C242-8.
Gabor, K. A., Kim, D., Kim, C. H. and Hess, S. T. (2015). Nanoscale imaging of
caveolin-1 membrane domains in vivo. PLoS One 10, e0117225.
Gafencu, A., Stanescu, M., Toderici, A. M., Heltianu, C. and Simionescu, M.
(1998). Protein and fatty acid composition of caveolae from apical plasmalemma of aortic
endothelial cells. Cell Tissue Res 293, 101-10.
Ghitescu, L. and Bendayan, M. (1992). Transendothelial transport of serum
albumin: a quantitative immunocytochemical study. J Cell Biol 117, 745-55.
Ghitescu, L., Fixman, A., Simionescu, M. and Simionescu, N. (1986). Specific
binding sites for albumin restricted to plasmalemmal vesicles of continuous capillary
endothelium: receptor-mediated transcytosis. J Cell Biol 102, 1304-11.
Gustavsson, J., Parpal, S., Karlsson, M., Ramsing, C., Thorn, H., Borg, M.,
Lindroth, M., Peterson, K. H., Magnusson, K. E. and Stralfors, P. (1999). Localization of
the insulin receptor in caveolae of adipocyte plasma membrane. FASEB J 13, 1961-71.
Hansen, G. H., Immerdal, L., Thorsen, E., Niels-Christiansen, L. L., Nystrom, B.
T., Demant, E. J. and Danielsen, E. M. (2001). Lipid rafts exist as stable cholesterol-
independent microdomains in the brush border membrane of enterocytes. J Biol Chem 276,
32338-44.
Dis
ease
Mo
dels
& M
echa
nism
s •
DM
M •
Adv
ance
art
icle
Hansen, G. H., Niels-Christiansen, L. L., Immerdal, L. and Danielsen, E. M.
(2003). Scavenger receptor class B type I (SR-BI) in pig enterocytes: trafficking from the
brush border to lipid droplets during fat absorption. Gut 52, 1424-31.
Heimerl, S., Liebisch, G., Le Lay, S., Bottcher, A., Wiesner, P., Lindtner, S.,
Kurzchalia, T. V., Simons, K. and Schmitz, G. (2008). Caveolin-1 deficiency alters plasma
lipid and lipoprotein profiles in mice. Biochem Biophys Res Commun 367, 826-33.
Kwan, K. M., Fujimoto, E., Grabher, C., Mangum, B. D., Hardy, M. E.,
Campbell, D. S., Parant, J. M., Yost, H. J., Kanki, J. P. and Chien, C. B. (2007). The
Tol2kit: a multisite gateway-based construction kit for Tol2 transposon transgenesis
constructs. Dev Dyn 236, 3088-99.
Link, J. C., Chen, X., Prien, C., Borja, M. S., Hammerson, B., Oda, M. N.,
Arnold, A. P. and Reue, K. (2015). Increased high-density lipoprotein cholesterol levels in
mice with XX versus XY sex chromosomes. Arterioscler Thromb Vasc Biol 35, 1778-86.
Lorbek, G., Perse, M., Horvat, S., Bjorkhem, I. and Rozman, D. (2013). Sex
differences in the hepatic cholesterol sensing mechanisms in mice. Molecules 18, 11067-85.
Luangrath, V., Brodeur, M. R., Rhainds, D. and Brissette, L. (2008). Mouse
CD36 has opposite effects on LDL and oxidized LDL metabolism in vivo. Arterioscler
Thromb Vasc Biol 28, 1290-5.
Madison, B. B., Dunbar, L., Qiao, X. T., Braunstein, K., Braunstein, E. and
Gumucio, D. L. (2002). Cis elements of the villin gene control expression in restricted
domains of the vertical (crypt) and horizontal (duodenum, cecum) axes of the intestine. J Biol
Chem 277, 33275-83.
Marchiando, A. M., Shen, L., Graham, W. V., Weber, C. R., Schwarz, B. T.,
Austin, J. R., 2nd, Raleigh, D. R., Guan, Y., Watson, A. J., Montrose, M. H. et al. (2010).
Dis
ease
Mo
dels
& M
echa
nism
s •
DM
M •
Adv
ance
art
icle
Caveolin-1-dependent occludin endocytosis is required for TNF-induced tight junction
regulation in vivo. J Cell Biol 189, 111-26.
McConnell, R. E., Benesh, A. E., Mao, S., Tabb, D. L. and Tyska, M. J. (2011).
Proteomic analysis of the enterocyte brush border. Am J Physiol Gastrointest Liver Physiol
300, G914-26.
Morris, K. (1972). Techniques of Lipidology: Isolation, Analysis, and Identification
of Lipids: Elsevier.
Morroni, M., Cangiotti, A. M. and Cinti, S. (2007). Brush cells in the human
duodenojejunal junction: an ultrastructural study. J Anat 211, 125-31.
Murata, M., Peranen, J., Schreiner, R., Wieland, F., Kurzchalia, T. V. and
Simons, K. (1995). VIP21/caveolin is a cholesterol-binding protein. Proc Natl Acad Sci U S
A 92, 10339-43.
Nabeyama, A. and Leblond, C. P. (1974). "Caveolated cells" characterized by deep
surface invaginations and abundant filaments in mouse gastro-intestinal epithelia. Am J Anat
140, 147-65.
Nassir, F., Wilson, B., Han, X., Gross, R. W. and Abumrad, N. A. (2007). CD36 Is
Important for Fatty Acid and Cholesterol Uptake by the Proximal but Not Distal Intestine. J
Biol Chem 282, 19493-501.
Nixon, S. J., Carter, A., Wegner, J., Ferguson, C., Floetenmeyer, M., Riches, J.,
Key, B., Westerfield, M. and Parton, R. G. (2007). Caveolin-1 is required for lateral line
neuromast and notochord development. J Cell Sci 120, 2151-61.
Nusrat, A., Parkos, C. A., Verkade, P., Foley, C. S., Liang, T. W., Innis-
Whitehouse, W., Eastburn, K. K. and Madara, J. L. (2000). Tight junctions are membrane
microdomains. J Cell Sci 113 ( Pt 10), 1771-81.
Dis
ease
Mo
dels
& M
echa
nism
s •
DM
M •
Adv
ance
art
icle
Otis, J. P., Sahoo, D., Drover, V. A., Yen, C. L. and Carey, H. V. (2011).
Cholesterol and lipoprotein dynamics in a hibernating mammal. PLoS One 6, e29111.
Otis, J. P., Zeituni, E. M., Thierer, J. H., Anderson, J. L., Brown, A. C., Boehm,
E. D., Cerchione, D. M., Ceasrine, A. M., Avraham-Davidi, I., Tempelhof, H. et al.
(2015). Zebrafish as a model for apolipoprotein biology: comprehensive expression analysis
and a role for ApoA-IV in regulating food intake. Disease models & mechanisms 8, 295-309.
Parker, S., Walker, D. S., Ly, S. and Baylis, H. A. (2009). Caveolin-2 is required
for apical lipid trafficking and suppresses basolateral recycling defects in the intestine of
Caenorhabditis elegans. Mol Biol Cell 20, 1763-71.
Parton, R. G. and del Pozo, M. A. (2013). Caveolae as plasma membrane sensors,
protectors and organizers. Nat Rev Mol Cell Biol 14, 98-112.
Parton, R. G. and Simons, K. (2007). The multiple faces of caveolae. Nat Rev Mol
Cell Biol 8, 185-94.
Pepino, M. Y., Kuda, O., Samovski, D. and Abumrad, N. A. (2014). Structure-
function of CD36 and importance of fatty acid signal transduction in fat metabolism. Annu
Rev Nutr 34, 281-303.
Poirier, H., Degrace, P., Niot, I., Bernard, A. and Besnard, P. (1996). Localization
and regulation of the putative membrane fatty-acid transporter (FAT) in the small intestine.
Comparison with fatty acid-binding proteins (FABP). Eur J Biochem 238, 368-73.
Puri, P., Wiest, M. M., Cheung, O., Mirshahi, F., Sargeant, C., Min, H. K.,
Contos, M. J., Sterling, R. K., Fuchs, M., Zhou, H. et al. (2009). The plasma lipidomic
signature of nonalcoholic steatohepatitis. Hepatology 50, 1827-38.
Razani, B., Combs, T. P., Wang, X. B., Frank, P. G., Park, D. S., Russell, R. G.,
Li, M., Tang, B., Jelicks, L. A., Scherer, P. E. et al. (2002). Caveolin-1-deficient mice are
Dis
ease
Mo
dels
& M
echa
nism
s •
DM
M •
Adv
ance
art
icle
lean, resistant to diet-induced obesity, and show hypertriglyceridemia with adipocyte
abnormalities. J Biol Chem 277, 8635-47.
Razani, B., Engelman, J. A., Wang, X. B., Schubert, W., Zhang, X. L., Marks, C.
B., Macaluso, F., Russell, R. G., Li, M., Pestell, R. G. et al. (2001). Caveolin-1 null mice
are viable but show evidence of hyperproliferative and vascular abnormalities. J Biol Chem
276, 38121-38.
Ring, A., Le Lay, S., Pohl, J., Verkade, P. and Stremmel, W. (2006). Caveolin-1 is
required for fatty acid translocase (FAT/CD36) localization and function at the plasma
membrane of mouse embryonic fibroblasts. Biochim Biophys Acta 1761, 416-23.
Rothberg, K. G., Heuser, J. E., Donzell, W. C., Ying, Y. S., Glenney, J. R. and
Anderson, R. G. (1992). Caveolin, a protein component of caveolae membrane coats. Cell
68, 673-82.
Schlegel, A., Wang, C., Katzenellenbogen, B.S., Pestell, R.G., Listanti, M.P.
(1999). Caveolin-1 potentiates estrogen receptor α (ERα) signaling. Journal of Biological
Chemistry 274, 33551-33556.
Schubert, W., Frank, P. G., Razani, B., Park, D. S., Chow, C. W. and Lisanti, M.
P. (2001). Caveolae-deficient endothelial cells show defects in the uptake and transport of
albumin in vivo. J Biol Chem 276, 48619-22.
Siddiqi, S., Sheth, A., Patel, F., Barnes, M. and Mansbach, C. M., 2nd. (2013).
Intestinal caveolin-1 is important for dietary fatty acid absorption. Biochim Biophys Acta
1831, 1311-21.
Singh, R. D., Holicky, E. L., Cheng, Z. J., Kim, S. Y., Wheatley, C. L., Marks, D.
L., Bittman, R. and Pagano, R. E. (2007). Inhibition of caveolar uptake, SV40 infection,
and beta1-integrin signaling by a nonnatural glycosphingolipid stereoisomer. The Journal of
cell biology 176, 895-901.
Dis
ease
Mo
dels
& M
echa
nism
s •
DM
M •
Adv
ance
art
icle
Singh, R. D., Liu, Y., Wheatley, C. L., Holicky, E. L., Makino, A., Marks, D. L.,
Kobayashi, T., Subramaniam, G., Bittman, R. and Pagano, R. E. (2006). Caveolar
endocytosis and microdomain association of a glycosphingolipid analog is dependent on its
sphingosine stereochemistry. The Journal of biological chemistry 281, 30660-8.
Singh, R. D., Puri, V., Valiyaveettil, J. T., Marks, D. L., Bittman, R. and Pagano,
R. E. (2003). Selective caveolin-1-dependent endocytosis of glycosphingolipids. Mol Biol
Cell 14, 3254-65.
Trigatti, B. L., Anderson, R. G. and Gerber, G. E. (1999). Identification of
caveolin-1 as a fatty acid binding protein. Biochem Biophys Res Commun 255, 34-9.
Truett, G. E., Heeger, P., Mynatt, R. L., Truett, A. A., Walker, J. A. and
Warman, M. L. (2000). Preparation of PCR-quality mouse genomic DNA with hot sodium
hydroxide and tris (HotSHOT). Biotechniques 29, 52, 54.
Valasek, M. A., Weng, J., Shaul, P. W., Anderson, R. G. and Repa, J. J. (2005).
Caveolin-1 is not required for murine intestinal cholesterol transport. J Biol Chem 280,
28103-9.
Veilleux, A., Grenier, E., Marceau, P., Carpentier, A. C., Richard, D. and Levy,
E. (2014). Intestinal lipid handling: evidence and implication of insulin signaling
abnormalities in human obese subjects. Arterioscler Thromb Vasc Biol 34, 644-53.
Vogel, U., Sandvig, K. and van Deurs, B. (1998). Expression of caveolin-1 and
polarized formation of invaginated caveolae in Caco-2 and MDCK II cells. J Cell Sci 111 (
Pt 6), 825-32.
Yang, X., Schadt, E. E., Wang, S., Wang, H., Arnold, A. P., Ingram-Drake, L.,
Drake, T. A. and Lusis, A. J. (2006). Tissue-specific expression and regulation of sexually
dimorphic genes in mice. Genome Res 16, 995-1004.
Dis
ease
Mo
dels
& M
echa
nism
s •
DM
M •
Adv
ance
art
icle

Yedgar, S., Carew, T. E., Pittman, R. C., Beltz, W. F. and Steinberg, D. (1983).
Tissue sites of catabolism of albumin in rabbits. Am J Physiol 244, E101-7.
Yoon, M., Jeong, S., Nicol, C. J., Lee, H., Han, M., Kim, J. J., Seo, Y. J., Ryu, C.
and Oh, G. T. (2002). Fenofibrate regulates obesity and lipid metabolism with sexual
dimorphism. Exp Mol Med 34, 481-8.
Dis
ease
Mo
dels
& M
echa
nism
s •
DM
M •
Adv
ance
art
icle
Figures
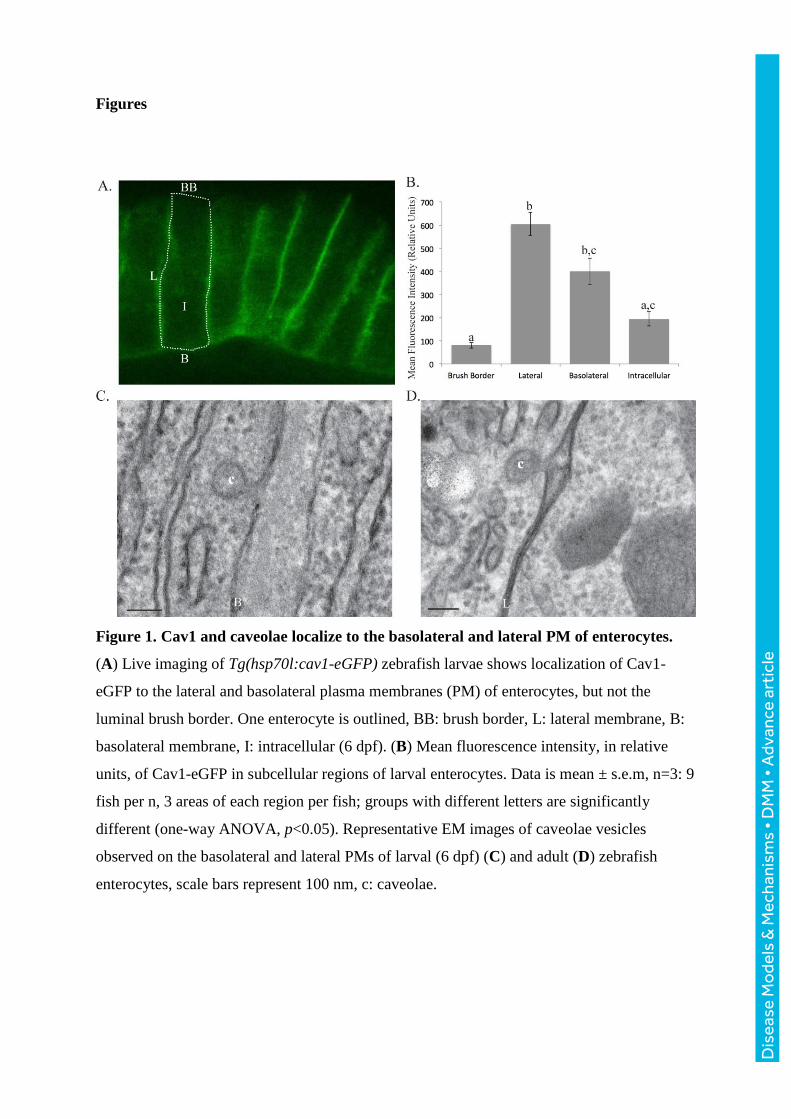
Figure 1. Cav1 and caveolae localize to the basolateral and lateral PM of enterocytes.
(A) Live imaging of Tg(hsp70l:cav1-eGFP) zebrafish larvae shows localization of Cav1-
eGFP to the lateral and basolateral plasma membranes (PM) of enterocytes, but not the
luminal brush border. One enterocyte is outlined, BB: brush border, L: lateral membrane, B:
basolateral membrane, I: intracellular (6 dpf). (B) Mean fluorescence intensity, in relative
units, of Cav1-eGFP in subcellular regions of larval enterocytes. Data is mean ± s.e.m, n=3: 9
fish per n, 3 areas of each region per fish; groups with different letters are significantly
different (one-way ANOVA, p<0.05). Representative EM images of caveolae vesicles
observed on the basolateral and lateral PMs of larval (6 dpf) (C) and adult (D) zebrafish
enterocytes, scale bars represent 100 nm, c: caveolae.
Dis
ease
Mo
dels
& M
echa
nism
s •
DM
M •
Adv
ance
art
icle

Figure 2. Fluorescently labeled endocytic cargos enable imaging of caveolar endocytosis
in the intact zebrafish intestine. (A) Representative images show that the caveolar specific
cargos Alexa Fluor-albumin and BODIPY-d-LacCer are internalized from the basolateral PM
of enterocytes, but not the intestinal lumen. In contrast, the cargo transported specifically by
clathrin-coated vesicles, BODIPY-l-LacCer, is transported into enterocytes from both the
basolateral and luminal PMs. BB: brush border, L: lateral membrane, B: basolateral
membrane, I: intracellular, N: nucleus, arrowhead: intracellular puncta. (B) The mean
fluorescence intensity of Alexa Fluor-albumin and BODIPY-d-LacCer on the lateral PM of
enterocytes is significantly greater following basolateral injection compared to luminal
injection. In contrast, the mean fluorescence intensity of BODIPY-l-LacCer on the lateral PM
of enterocytes is the same following basolateral and luminal injection. Data is presented
relative to lateral PM mean fluorescence intensity following luminal injection (mean ± s.e.m,
n=3: 9 fish per n, 3 areas of each region per fish, Student’s t-test, * signifies p<0.05).
Dis
ease
Mo
dels
& M
echa
nism
s •
DM
M •
Adv
ance
art
icle

Dis
ease
Mo
dels
& M
echa
nism
s •
DM
M •
Adv
ance
art
icle
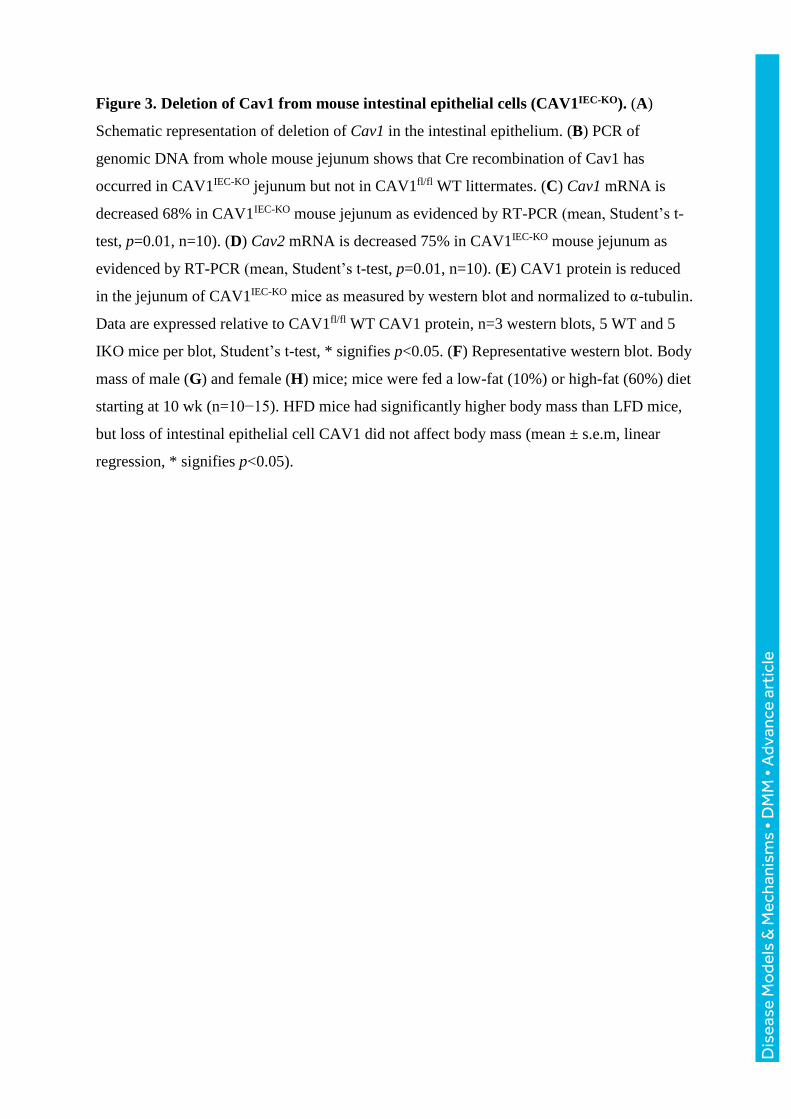
Figure 3. Deletion of Cav1 from mouse intestinal epithelial cells (CAV1IEC-KO). (A)
Schematic representation of deletion of Cav1 in the intestinal epithelium. (B) PCR of
genomic DNA from whole mouse jejunum shows that Cre recombination of Cav1 has
occurred in CAV1IEC-KO jejunum but not in CAV1fl/fl WT littermates. (C) Cav1 mRNA is
decreased 68% in CAV1IEC-KO mouse jejunum as evidenced by RT-PCR (mean, Student’s t-
test, p=0.01, n=10). (D) Cav2 mRNA is decreased 75% in CAV1IEC-KO mouse jejunum as
evidenced by RT-PCR (mean, Student’s t-test, p=0.01, n=10). (E) CAV1 protein is reduced
in the jejunum of CAV1IEC-KO mice as measured by western blot and normalized to α-tubulin.
Data are expressed relative to CAV1fl/fl WT CAV1 protein, n=3 western blots, 5 WT and 5
IKO mice per blot, Student’s t-test, * signifies p<0.05. (F) Representative western blot. Body
mass of male (G) and female (H) mice; mice were fed a low-fat (10%) or high-fat (60%) diet
starting at 10 wk (n=10−15). HFD mice had significantly higher body mass than LFD mice,
but loss of intestinal epithelial cell CAV1 did not affect body mass (mean ± s.e.m, linear
regression, * signifies p<0.05).
Dis
ease
Mo
dels
& M
echa
nism
s •
DM
M •
Adv
ance
art
icle
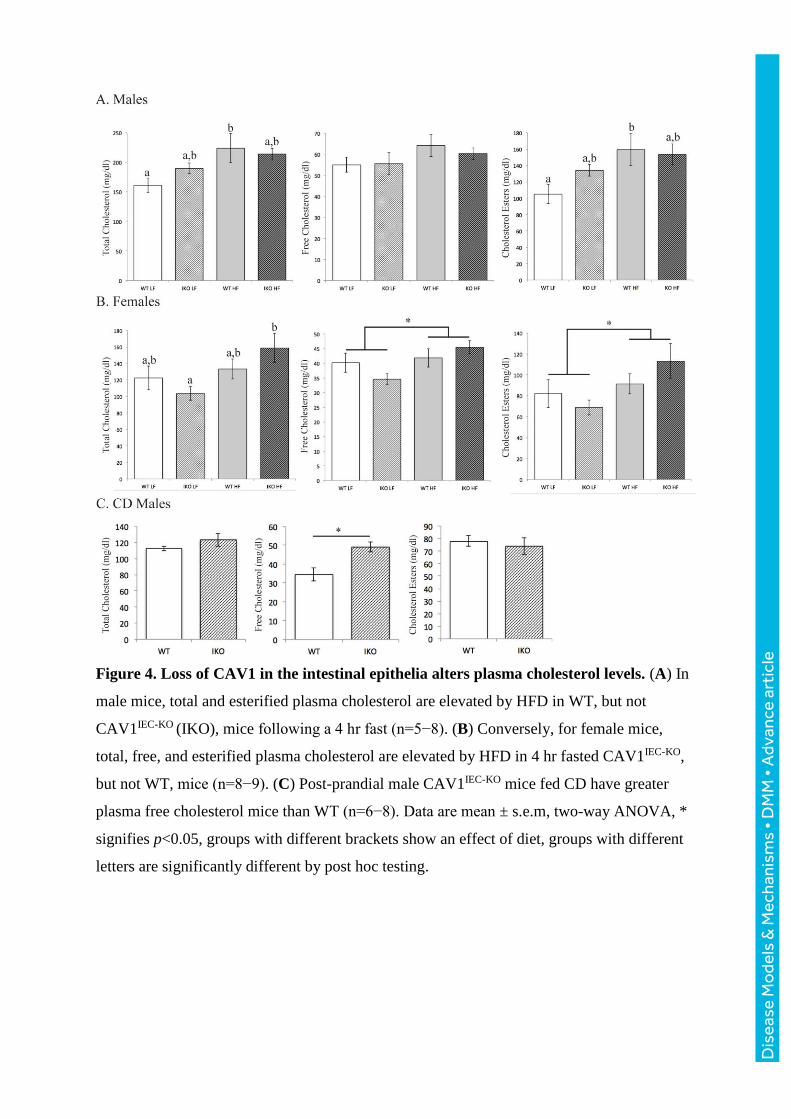
Figure 4. Loss of CAV1 in the intestinal epithelia alters plasma cholesterol levels. (A) In
male mice, total and esterified plasma cholesterol are elevated by HFD in WT, but not
CAV1IEC-KO (IKO), mice following a 4 hr fast (n=5−8). (B) Conversely, for female mice,
total, free, and esterified plasma cholesterol are elevated by HFD in 4 hr fasted CAV1IEC-KO,
but not WT, mice (n=8−9). (C) Post-prandial male CAV1IEC-KO mice fed CD have greater
plasma free cholesterol mice than WT (n=6−8). Data are mean ± s.e.m, two-way ANOVA, *
signifies p<0.05, groups with different brackets show an effect of diet, groups with different
letters are significantly different by post hoc testing.
Dis
ease
Mo
dels
& M
echa
nism
s •
DM
M •
Adv
ance
art
icle
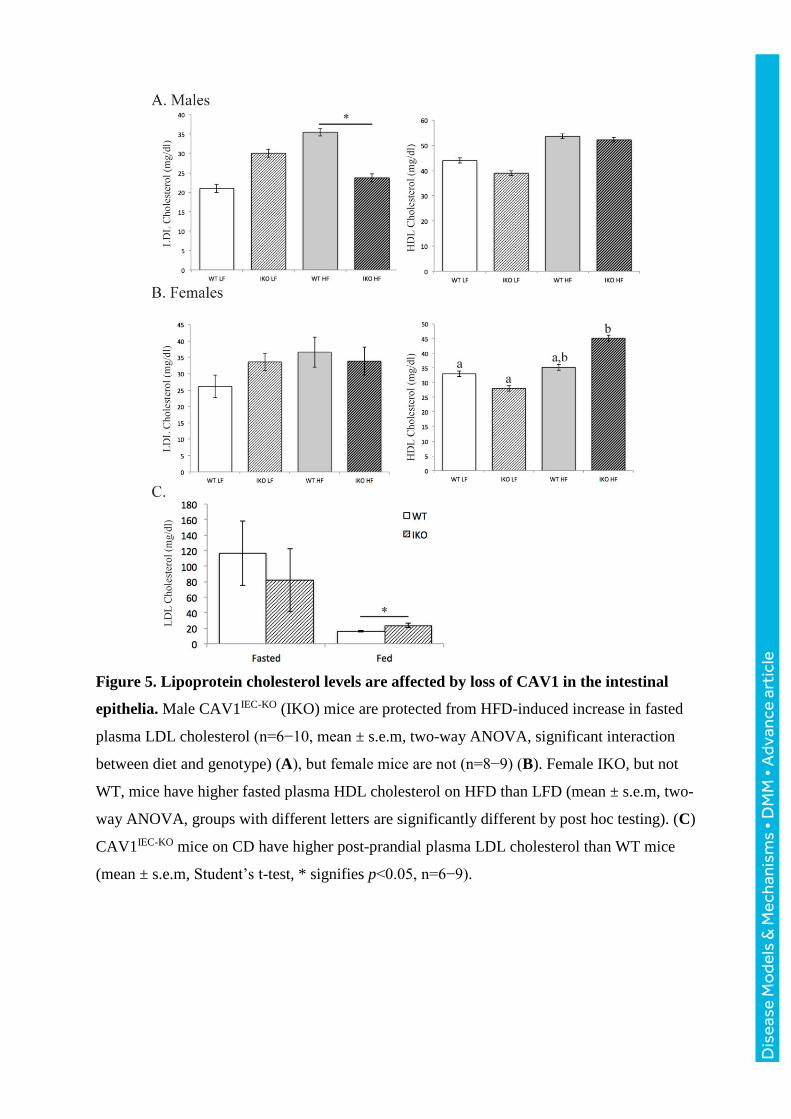
Figure 5. Lipoprotein cholesterol levels are affected by loss of CAV1 in the intestinal
epithelia. Male CAV1IEC-KO (IKO) mice are protected from HFD-induced increase in fasted
plasma LDL cholesterol (n=6−10, mean ± s.e.m, two-way ANOVA, significant interaction
between diet and genotype) (A), but female mice are not (n=8−9) (B). Female IKO, but not
WT, mice have higher fasted plasma HDL cholesterol on HFD than LFD (mean ± s.e.m, two-
way ANOVA, groups with different letters are significantly different by post hoc testing). (C)
CAV1IEC-KO mice on CD have higher post-prandial plasma LDL cholesterol than WT mice
(mean ± s.e.m, Student’s t-test, * signifies p<0.05, n=6−9).
Dis
ease
Mo
dels
& M
echa
nism
s •
DM
M •
Adv
ance
art
icle

Figure 6. Intestinal CAV1 deletion alters circulating FFA but not TG. (A) In male mice,
plasma NEFA are higher in HFD fed CAV1IEC-KO (IKO) mice than WT mice (means with
different letters are significantly different by post hoc testing, 4 hr fast, n=5−8, mean ± s.e.m,
two-way ANOVA, * signifies p<0.05). (B) Female mice showed no changes in fasted plasma
TG or NEFA (n=8−9). (C) NEFA are also higher in postprandial plasma of male CD
Dis
ease
Mo
dels
& M
echa
nism
s •
DM
M •
Adv
ance
art
icle
CAV1IEC-KO mice compared to WT controls and (D) show a greater fold decrease upon
feeding relative to fasting (n=6−8, mean ± s.e.m, student’s t-test, * signifies p<0.05). (E)
Lipids measured by HPLC in plasma of male mice fasted 4 hr. There are significant effects of
diet for all and, for palmitoleic and palmitic acid, the interaction between diet and genotype
(n=6, mean ± s.e.m, two-way ANOVA, means with different letters are significantly different
by post hoc testing, means with different brackets show only a diet effect). (F) Lipids
measured by HPLC in liver of male mice fasted 4 hr (n=5, mean ± s.e.m, student’s t-test, *
signifies p<0.05). (G) Cholesterol oleate measured by HPLC in white adipose tissue of male
mice fasted 4 hr (n=5, mean ± s.e.m, student’s t-test, * signifies p<0.05).
Dis
ease
Mo
dels
& M
echa
nism
s •
DM
M •
Adv
ance
art
icle
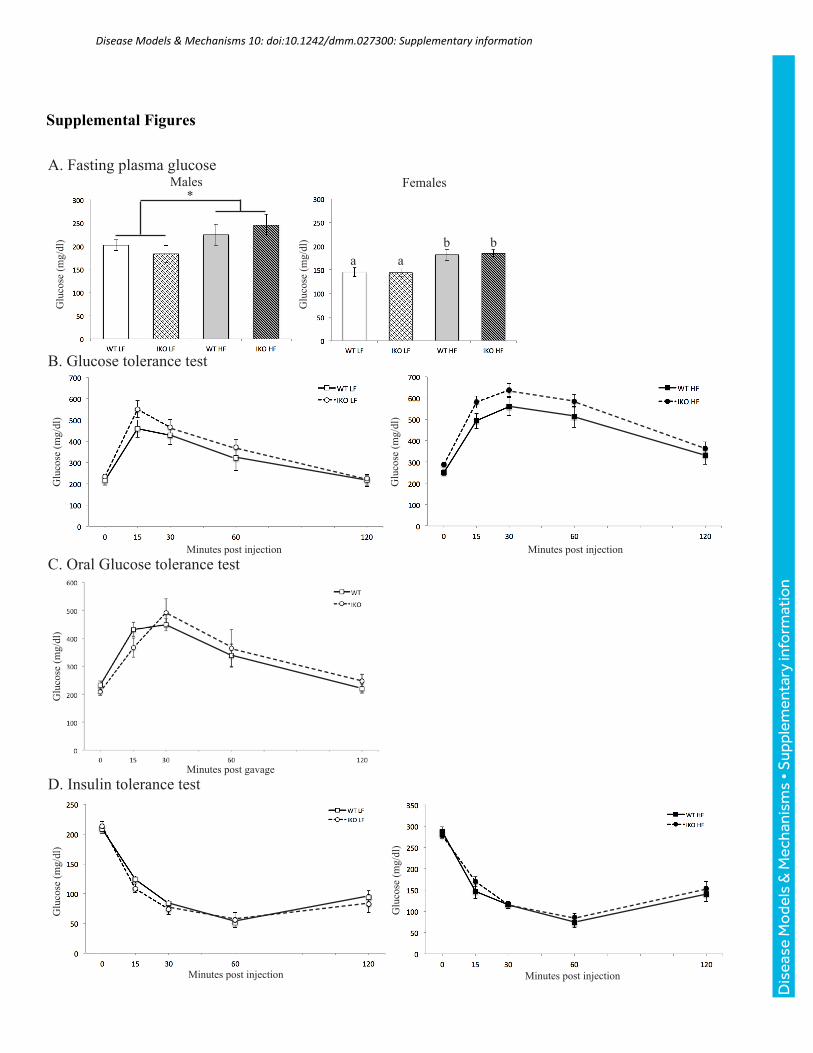
A. Fasting plasma glucose
Glu
cose
(mg/
dl)
Glu
cose
(mg/
dl)
Males Females
B. Glucose tolerance test
C. Oral Glucose tolerance test
D. Insulin tolerance test
Glu
cose
(mg/
dl)
Glu
cose
(mg/
dl)
Minutes post injection Minutes post injection
Glu
cose
(mg/
dl)
Minutes post gavage
Glu
cose
(mg/
dl)
Glu
cose
(mg/
dl)
Minutes post injection Minutes post injection
a ab b
*
Supplemental Figures
Dis
ease
Mo
dels
& M
echa
nism
s •
Sup
plem
enta
ry in
form
atio
n
Disease Models & Mechanisms 10: doi:10.1242/dmm.027300: Supplementary information

Figure S1. Glucose metabolism is unaltered in CAV1IEC-KO mice. (A) Fasting blood glucose
is elevated in male and female mice fed HFD relative to mice fed LFD similarly in CAV1IEC-KO
(IKO) mice and WT littermates (mean ± s.e.m, n=6−10, two-way ANOVA, p<0.05, groups with
different brackets show significant effect of diet, groups with different letters are significantly
different by post hoc testing). There were no differences in blood glucose between CAV1IEC-KO
(IKO) and WT mice during (B) IP or (C) oral glucose tolerance tests or (D) insulin tolerance test.
Data are shown as mean ± s.e.m, n=7−14, one- or two-way repeated measures ANOVA.
Dis
ease
Mo
dels
& M
echa
nism
s •
Sup
plem
enta
ry in
form
atio
n
Disease Models & Mechanisms 10: doi:10.1242/dmm.027300: Supplementary information

B. Plasma albumin
B. Intestinal CD36 localizaiton
CAV1IEC-KO WT (CAV1fl/ )
Alb
umin
(g/d
l)
Dis
ease
Mo
dels
& M
echa
nism
s •
Sup
plem
enta
ry in
form
atio
n
Disease Models & Mechanisms 10: doi:10.1242/dmm.027300: Supplementary information

Figure S2. (A) Deletion of CAV1 does not affect CD36 localization in the intestinal
epithelia. Representative images of CD36 immunofluorescence in the jejunum of HFD treated
CAV1IEC-KO and WT littermate mice show localization to the brush border and small, apical
punctae of enterocytes. Mice were fasted 4 hr, jejunum was fixed in 4% PFA overnight at 4°C,
imbedded in OCT, cut into 10 µ cryosections, treated with Diva Decloaker antigen retrieval,
probed with primary anti-CD36 (AF2519, R&D Systems) and secondary donkey-anti-goat (A-
11055, Life Technologies), and imaged on a Leica SP-5 confocal microscope with a 63x oil
immersion objective. (B) Plasma albumin is not affected by diet or genotype in male
CAV1IEC-KO (IKO) and WT littermates fed LFD or HFD. Mice were fasted 4 hr, plasma was
collected by cardiac puncture, and albumin was measured in duplicate with a BCG albumin
assay kit from Sigma-Aldrich (mean ± s.e.m, n=7−9).
Dis
ease
Mo
dels
& M
echa
nism
s •
Sup
plem
enta
ry in
form
atio
n
Disease Models & Mechanisms 10: doi:10.1242/dmm.027300: Supplementary information

A. Males
B. Females
TG NEFA
NEF
As (
mm
ol/L
)
Trig
lyce
rides
(mm
ol/L
)
TG NEFA
Trig
lyce
rides
(mm
ol/L
)
NEF
As (
mm
ol/L
)
Hours post gavage Hours post gavage
Hours post gavage Hours post gavage
Figure S3. Lipid tolerance test show no change in serum TG or NEFA in CAV1IEC-KO mice
following emulsified lipid gavage. Male and female CAV1IEC-KO (IKO) and WT littermates
were fed CD and fasted 16 hr prior to gavage (n=7−9).
Dis
ease
Mo
dels
& M
echa
nism
s •
Sup
plem
enta
ry in
form
atio
n
Disease Models & Mechanisms 10: doi:10.1242/dmm.027300: Supplementary information

Insulin Receptor
Rel
ativ
e m
RN
A e
xpre
ssio
n
CAV1IEC-KO LF CAV1IEC-KO HFWT LF WT HF
*
Figure S4. Deletion of Cav1 from the mouse intestinal epithelium (CAV1IEC-KO) decreases
insulin receptor expression. Insulin rector mRNA is decreased in the jejunum of CAV1IEC-KO
mice compared to wild type (WT) littermates. Means, 2-way ANOVA, significant effect of
genotype p=0.0106, F(1,26)=7.595), n=6-9.
Dis
ease
Mo
dels
& M
echa
nism
s •
Sup
plem
enta
ry in
form
atio
n
Disease Models & Mechanisms 10: doi:10.1242/dmm.027300: Supplementary information