Embed Size (px)
Citation preview
Information Technology Investment Intensity
Firm Size and theInformationTechnologyInvestment Intensityof Life Insurers
By: Sidney E. HardsPeter F. Drucker Management
CenterThe Claremont Graduate SchoolClaremont, California 91711
Joseph L. KatzDepartment of Decision SciencesCollege of Business AdministrationGeorgia State UniversityAtlanta, Georgia 30303
AbstractThis article is organized around two researchquestions: (1) do small insurers exhibit a higherdegree of information technology investmentintensity (i.e., the ratio of information technologyexpense to total operating expense) than largeinsurers? and (2) to what extent does the level spending on information technology explain thedegree of information technology investment inten-sity?. The article offers an interpretation of thedependent and independent variables and usesdata obtained from the life insurance industry. Thefindings on the whole indicate that small insurersspend a larger proportion of their operatingexpenses on information technology than do largeinsurers. Given the conditions prevailing in the lifeinsurance industry, this means that large finns werenot leaders in realizing the full potential of theeconomic benefits available. Contrary to expecta-tions, spending more on information technologydoes not lead to a higher ratio of informationtechnology expense to total operating expense.This finding is consistent with the observation byseveral academics and practitioners that how thetechnology is used and managed is an equal if notmore important consideration than the level ofspending.
Keywords:Management of information systems,organizational impacts, insuranceindustry
ACM: Categories: J.1, K.0, K.4.3, K.6.0
IntroductionThe relationship between the structural dimen-sions of an organization and its adoption and useof information systems technologies has receivedincreasing attention from economists, organiza-tional theorists, and information systems re-searchers (Ein-Dor and Segev, 1978; Kimberlyand Evanisko, 1981; Lind, et al., 1989; Mansfield,et al., 1977). Firm size has been the most fre-quently examined structural characteristic, part-ly because it is presumed that managers areaware of the economic and strategic incentives(i.e., market power) that favor the adoption anduse of information systems technology by largefirms (Gremillion, 1984; Steiner and Teixeira,1990; Turner, 1982). From an economic perspec-tive, the technology can influence: (1) scaleeconomies in production and policyholder servic-ing by decreasing the costs associated with eachtransaction or unit of work executed; and (2)scope economies in product-market loci anddistribution by facilitating the ability to offer com-plementary products and services at a lower cost.
The economic benefits of larger size, however,are seldom realized without both careful and pro-active management of the information technology(IT) itself and the way that technology is used an organization’s business processes (Chandler,1990). In many instances, organizational roles,responsibilities, structures, and the business pro-cesses of the firm must be fundamentallyredesigned in order to maximize the intendedbenefits (Hammer, 1990; Levinson, 1988; Zuboff,1988). Management’s delinquency or indif-ference to realizing the full potential of thetechnology can occur if any of several conditionsexist, e.g., the environment is munificent andfirms have the luxury of achieving their return oninvestment over a longer period of time, ormanagement’s attention is focused on other,more pressing issues. These conditions often ex-ist in practice and are not uncommon in large,fragmented industries (Blair, 1972).
Within this general perspective, this article ex-amines empirically the correlation between firm
MIS Quarterly~September 1991 333
Information Technology Investment Intensity
size and the ratio of information technology ex-pense to total operating expense, morespecifically information technology investment in-tensity in the life insurance industry. The impor-tant issue here for theoretical purposes is theextent to which firm size explains the degree ofinformation technology investment intensity. Thisquestion is particularly relevant in the life in-surance industry, because the industry is largeand fragmented and researchers have found thatinsurers with the highest ratio of informationtechnology expense to total operating expensetend to be more efficient (based on the ratio oftotal operating expense to premium income) thanother firms, even after controlling for product orfirm structure (Bender, 1986; Harris and Katz,1991; Life Office Management Association, 1984;1988). Given the conditions prevailing in the in-dustry, addressing this question will also enableus to consider whether large firms tended to beleaders in realizing the full benefits of the infor-mation technology-based scale and scopeeconomies available.
We also investigate whether the level of firmspending on IT is significantly correlated with thedegree of information technology investment in-tensity. Several academics and practitionershave cautioned that while the level of spendingon information technology is important, the wayin which this technology is used to pursueeconomic benefits may be even more significant(Grayson and O’Dell, 1988; Strassman, 1985;Whisler, 1967). By addressing these two ques-tions, we hope to sharpen our understanding ofthe factors that affect the extent to which infor-mation technology-based scale and scope econo-mies are exploited in the insurance industry.
Background and LiteratureReviewThere have been three types of organizationstudies that have used firm size as a correlateof information technology adoption and usage.Researchers have investigated: (1)the relation-ship between firm size and whether computerswere adopted (Cron and Sobel, 1983; DeLone,1988; Globerman, 1986; Lind, et al., 1989; Maha-jan and Schoeman, 1977; Mansfield, et al., 1977;Yap, 1990); (2) the relationship between firm sizeand the number of operations computerized
(DeBrabander, et al., 1972; Kimberly andEvanisko, 1981; Moch and Morse, 1977); and (3)the correlation between firm size and the ratio ofinformation technology expense to total operatingexpense (also referred to as "IT intensity" and"systems-intensiveness" in the literature)(Gremillion, 1984; Sippel, 1989; Turner, 1982).
With the exception of Globerman1 (1986), theevidence points to the existence of a direct rela-tionship between firm size and the adoption ofinformation systems technologies (Cron andSobel, 1983; DeLone, 1981; Lind, et al., 1989;Mansfield, et al., 1977; Yap, 1990). Beyond firmsize, the research in this area suggests that thereare several factors that could distinguish adoptersof information technology from non-adopters: (1)the anticipated profitability of the different typesof information systems technologies; (2) the pro-gressiveness of management; (3) the strategicpositioning of the firm within the industry; (4) theextent of competitive pressure; and (5) the ex-tent to which technology is available and is be-ing marketed to all segments of the industry atthe same time. More studies of a wider array ofinformation systems technologies and industriesare needed before we will have a clear under-standing of the structural (e.g., firm size, line ex-ecutive influence, etc.) and technical andeconomic factors (e.g., changes in the externalenvironment and how they interact with the firms’internal process and structures) affecting adop-tion (Cron and Sobel, 1983; DeLone, 1981;Globerman, 1986; Lind, et al., 1989; Mahajan andSchoeman, 1977; Mansfield, et al., 1977; Yap,1990).
Both Moch and Morse (1977) and Kimberly andEvanisko (1981) reported a positive relationshipbetween firm size and the number of applicationscomputerized for hospitals. The studies exam-ined the number of functions computerized ineight areas: accounting, admissions, discharges,personnel records, payroll, medical records,research, and patient care. Moch and Mooreused the log of the number of patient admissions
The "Home Office" of an insurance company provides mostof the functional processing of the business, except formarketing activities directly related to the agent. Home officefunctions typically include policy administration, productdesign, investments, actuarial, legal, and other corporatefunctions. Globerman (1986) found that large U.S. life insurerswere s~ower to computerize their home office operations thansmall insurers. His sample consisted of 104 insurers that soldlife insurance policies in Canada as of May 1, 1969.
334 MIS Quarterly~September 1991

Information Technology Investment Intensity
as the proxy measure for firm size; Kimberly andEvanisko used the number of hospital beds. Inthe (atter-study,. the authors found that thenumber of applications automated was positive-ly affected by the competition in the local areaand the degree to which hospital administratorswere. highly educated and cosmopolitan. De-Brabander, et al. (1972) reported a positive linkbetween size (as measured by the number ofwhite collar workers) and the firm’s investmentin computer hardware but found an insignificantlink between size and the number of applicationsautomated. The authors’ sample was taken in1968 and consisted of 173 industrial (e.g., min-ing, public utilities, food, chemicals, building, etc.)firms in Belgium.
These three studies have added to ourunderstanding of the relationship between firmsize and the extent of computerization. Questionsremain, however, concerning the relationship be-tween the number of functions computerized andthe changes taking place in several of the struc-tural characteristics of firms, i.e., number ofdepartments, number of hieramhic levels, andthe extent of functional specialization.
There have been three published studies thathave examined the correlation between firm sizeand the ratio of information technology expenseto total operating expense--the IT investment in-tensity. Turner (1982) analyzed the relationshipbetween firm size, performance, and computeruse in Mutual Savings Bank; Gremillion (1984)analyzed the extensiveness of computer use inthe National Forest System; and Steiner and Teix-eira (1990) analyzed the effects of informationtechnology "system-intensiveness" in commer-cial banks. McFarlan, et al. (1983) characterizethe IT investment intensity ratio as one measureof the degree of operating dependency on thetechnology. We believe that while the insuranceindustry’s early efforts at automation led to taskfragmentation and automation of existing clericalwork, information technology is now used to amuch greater extent to support process integra-tion and coordination.
Turner (1982) questions whether large bankswould make more "intensive use" of informationsystems resources than small banks, using asample of 38 U.S. mutual savings banks. Thedata for the study captured the operating condi-tion of the banks in 1978. Statistical analysis in-dicated that the sample was representative of the
overall population of 469 savings banks. Turnerargues that the ratio of information technologyexpense to total operating expense captures thefirms’ relative investment in computer resources.Firm size was measured using an index con-sisting of total bank assets, net income, and thenumber of full-time equivalent staff. Across the38 banks, information systems expenses aver-aged 8.35% of total operating expenses. Thefinding from the Pearson correlation (coefficient-- -.115, p = .258) analysis between the twovariables does not support the hypothesis thatlarge banks exhibit a higher degree of informa-tion technology investment intensity than smallbanks. Turner concludes that although largebanks had a greater incentive to use informationtechnology intensively (because high transactionvolumes make the use of the technology attrac-tive) it did not appear to have happened. Turner’s(1982) analysis, however, was limited in that did not test for the presence of a curvilinear rela-tionship between firm size and the ratio of IT ex-pense to total operating expense. As a result,some form of relationship between these twofactors cannot be completely ruled out.
Gremillion (1984) studied 66 of the approximately130 administrative units of the U.S. Forest Ser-vice. The administrative units of the Forest Ser-vice pursue a common mission "to manage thepublic lands within the forest so as to producethat mix of commodities (e.g., timber and graz-ing use) and amenities (e.g,, recreation oppor-tunities and wildlife habitat) which is the highestpublic interest" (Gremillion, 1984, p.7). Theforestry units differ in size, both in the quantitiesof the commodities they produced and the extentto which they were used for recreation. Gremillionfound that during the 1981 fiscal year, size (i.e.,number of employees, appropriated budget,number of ranger districts, etc.) was not a signifi-cant predictor of information technology intensi-ty for several measures of "intensiveness":computer charges as a fraction of the total forestbudget, computer charges as a fraction of the ad-ministrative budget, and systems expense perperson on the forest staff. Nor was there a rela-tionship between size and the specific types ofinformation systems used. While Gremillion ex-amined various transformations of the dependentvariable, he did not consider the possibilityof a non-linear relationship between the depen-dent and independent variables. Gremillion didgather qualitative case study data on five pairs
MIS Quarterly~September 1991 335
Information Technology Investment Intensity
of administrative units that were located in thesame region and were similar in size, but weresubstantially different in their use of computers.He reported that in all cases the discrepancy inthe intensiveness of computer use revolvedaround the presence (or absence) of one or twokey individuals who acted as champions for theuse of the system. In some cases, line managersrequired the use of the system; in other cases,staff individuals facilitated the use of the system.
Steiner and Teixeira (1990) provide the most ex-tensive documentation of the informationtechnology-related changes underway in thecommercial banking industry. They analyzed thefactors affecting the performance of 35 bankholding companies relative to the rest of the13,700 banks in the industry in 1989. Some ofthe firms in the 35-bank sample are well-knownfor exploiting technology as one of their centralstrategies: Banc One, State Street, Citibank, andFirst Wachovia. The commercial banking industryis a large, fragmented industry undergoingdramatic changes as a result of both regulatoryreforms and industry consolidation (Hanley, et al.,1987). For small banks, the loss of product,geography, and interest-rate protections havehad dramatic effects on their ability to compete;most of the industry’s net income growth wasgenerated by large banks during the 1980s. Inaddition, between 1980 and 1988, non-interestexpense ’in large banks increased at the rate of14 percent per year versus 6.6 percent per yearin small banks, and information systemstechnology expenses increased at the rate of 20.3percent per year in large banks versus 6.7 per-cent in small banks. As a result of these changesand others (i.e., mergers and acquisitions), 1988 the 35-bank holding company sampleemployed 47 percent of the industry’semployees, controlled 52 percent of the non-interest expense, 68 percent of the systemstechnology expense, and 49 percent of theassets. Steiner and Teixeira estimate that the ex-tent of "systems-intensiveness" in the 35-bankuniverse increased from 10 percent of non-inter-est expense (approximately) in 1980 to 15.2 per-cent in 1988.2 Steiner and Teixeira argue thatthe differential in these statistics is importantbecause it is setting the stage for large banks to
Hanley, et al. (1987) estimate the industry-wide average forthe ratio was 10.2% in 1985.
control an even larger share of the industry’sassets.
Steiner and Teixeira (1990) suggest that the trendtoward consolidation will continue in the futurebecause of the comparative advantage that largebanks now hold over small banks. There arethree reasons why small banks are at a disad-vantage: (1) the higher capital requirements the industry will favor banks that use capital effi-ciently; (2) securitization of mortgages and con-sumer loans will favor large banks that efficientlygenerate large loan volumes; and (3) the in-creased investments in information technologywill inevitably lead to stronger merger pressuresbecause of the considerable economies of scaleand scope.
In summary, the three studies that have examinedthe correlation between firm size and the ratioof information technology expense to total oper-ating expense suggest that both structural (e.g.,line management influence, differential ability toexecute a chosen strategy, quality of the supportinfrastructure) and technical and economic fac-tors may be important mediating variables (Gre-million, 1984; Steiner and Teixeira, 1990; Tumer,1982). The advantage of focusing on a single in-dustry is that inter-industry differences, whichtend to be large, cannot influence the results.However, additional research is needed to repli-cate these studies at different points in time, andlongitudinal designs are necessary to validate thefindings. Indeed, there is also a need to study awider array of industry settings. While Bender(1986) and Harris and Katz (1990; 1991) established the usefulness of the ratio of infor-mation technology expense to total operating ex-pense in the life insurance industry, thereremains a need for theoretical research to inter-pret the relationship with firm size and otherstructural dimensions, as well as empiricalresearch to evaluate statistical significance.
Theory and MotivationThe life insurance industry is a large, fragmentedindustry with over 2,200 competitors (Economist,1990). Until the mid-1970s, the industry wasstable, profitable, growth-oriented, anddistribution-driven (Economist, 1990; Life OfficeManagement Association, 1988). During the last15 years there have been significant Changes in
336 MIS Quarterly/September 1991
Information Technology Investment Intensity
the industry: the demand for the basic productdeclined; the rules regulating the boundaries ofthe industry were relaxed; the number of new en-trants increased; the number of insolvencies in-creased; industry consolidation increased; andthere has been an increase in the level of com-petitive intensity (Economist, 1990; Life OfficeManagement Association, 1988).
The changes in the life insurance industry haveresulted in greater product innovation and shorterproduct life cycles (Life Office ManagementAssociation, 1984).3 Life insurers have alsodiversified their product portfolio by expandinginto property and casualty insurance and into pro-ducts traditionally sold by banks and brokerages(e.g., home mortgages, trust services, mutualfunds, and cash management/money markettype accounts) (Economist, 1990; Life OfficeManagement Association, 1984; Sippel, 1989).Insurers diversified because they were respond-ing to the changes in customer values and theincreased degree of market segmentation (LifeOffice Management Association, 1988).
The criteria for buying insurance products havealso undergone tremendous change (Economist,1990; Life Office Management Association, 1984;Sippel, 1989). Buyers are now more: (1) pricesensitive; (2) interested in maximizing the returnon their investments; and (3) sophisticated comparing insurance products with productsfrom other financial institutions (e.g., banks,brokerages, etc.)(Economist, 1990; Life OfficeManagement Association, 1988). Consequently,more buyers are willing to switch companies, andthis has been reflected in an increase in volun-tary policy terminations and surrenders(Economist, 1990; Sippel, 1989). As a result ofthe wide array of changes in the industry, insurershave become more cost and service-oriented(Economist, 1990; Life Office ManagementAssociation, 1984). Increasing competition hasled some firms to take progressively riskier posi-tions in pursuit of higher yields, leading to recentproblems and well-publicized failures within theindustry.
Some of the new products that have been introduced includeuniversal life, variable life, flexible premium variable life, anddeferred annuities. In addition, some traditional products havebecome more flexible as a result of product conversion op-tions, interest-sensitive cash accumulation vehicles, and ex-panded premium payment options (Economist, 1990; LifeOffice Management Association, 1984).
Historically, life insurers focused their computerresources on the automation of transaction-drivenfunctions: policy underwriting, policymaintenance, billing and collection, claims andbenefits transactions, personnel recordsmanagement, and accounting. There is growingcase study evidence of changes since the earlyuse of computers in the industry, when they rein-forced the fragmentation of job tasks within func-tional hierarchies. Since the late 1970s,horizontally integrated systems--cross-functionsystems--are integrating fragmented tasks tocreate more new jobs while they eliminate oldones (Hartmann, et al., 1986). Increasingly, cross-functional systems are giving firms innovativeways to organize their business processes andchanging the rules of competition of the industry(Hammer, 1990; Life Office ManagementAssociation, 1988; Sippel, 1989).
Whisler’s (1967; 1970) research represents themost comprehensive analysis of informationtechnology impacts in the insurance industry. Us-ing the case study approach and a select groupof 20 to 25 insurance firms, Whisler found thatleading edge use of information technology wasassociated with greater job specialization and jobinterdependence, greater job variety, a shrinkagein the number of managerial and non-managerialpositions, reduction in the time discretion of in-dividuals as a result of the integration of activities,consolidation in the number of organizationallevels, reduction in the firms’ cost structure, andthe encapsulation of information technology in-to the control and coordination structure of thefirm.
HypothesesThere are two propositions considered in this ar-ticle. First, we investigate whether small insurersexhibit a higher degree of information technologyinvestment intensity (i.e., the ratio of informationtechnology expense to total operating expense)than large insurers. Second, we examine the ex-tent to which the level of spending on ITsignificantly explains the degree of IT investmentintensity. 4 We have formulated two researchhypotheses, discussed below.
While the statement of our hypotheses suggests that we viewfirm size and level of spending on information technology as"predictors" or "determinants" of IT investment intensity,technically speaking, we should refer to these variables ascorrelates, since the direction of causality is always in doubt.
MIS Quarterly~September 1991 337
Information Technology Investment Intensity
HI: The ratio of information technology ex-pense to total operating expense is sig-nificantly higher in small insurers than inlarge insurers.
There are several industry and firm-related fac-tors that would tend to support the direction ofthis hypothesis. First, there is some empiricalevidence, although not specific to the life in-surance industry, that changes in process designare more important strategic management con-cerns in small firms than in large firms (Robin-son and Pearce, 1976). As a result, small firmsmay be more open to using technology oppor-tunistically and strategically.
Second, the trend toward more powerful, faster,and cheaper computing lowers the minimum ef-ficient scale and reduces hardware as an entrybarrier (Gold, 1989). Other factors may also relevant. The technical staffs in small firms tendto be more visible; thus, the contribution of eachperson and group may be recognized muchsooner. In addition, inter-functional integrationand coordination should be easier to achieve insmall firms than in large firms because com-munications are not as inhibited and formalsystems and procedures are not as old as theyare in large firms. There are now several well-known examples of small to medium-sized firmsthat have successfully used informationtechnology to enter and penetrate establishedmarkets with innovative business processes:USAA, Batterymarch Financial Management, andRoadway Package System (Arthur D. Little, 1990)
Third, large firms tend to be more bureaucratic,inflexible, and rigid. Organizational researchershave consistently found a positive relationshipbetween firm size and structural differentiationor complexity in several dimensions--number ofdepartments, number of hierarchic levels, anddegree of functional specialization (Child andMansfield, 1972; Marsh and Mannari, 1981;Pugh, et al., 1969). These results suggest thatlarge firms tend to be more complex overall andrequire both more people and more levels ofhierarchy to approve new product or process in-novations. To the extent that large insurers aremore bureaucratic, they may be more likely to ex-pand the number of administrative employees in-stead of expanding the use of informationtechnology.
Fourth, the management hieramhy in small firmstends to be much simpler and flatter. The chiefexecutive officer, for example, tends to be closerto the day-to-day operations of the business andcan effect change easier, more quickly, and moreoften than managers in large firms because deci-sion making tends to be centralized and fewerstaff specialists are required (Miller and Friesen,1984). In addition, small technologically oppor-tunistic firms may take less time than large firmsto implement a new system once a decision hasbeen made (Yap, 1990).
There are also several counter arguments thatwould tend to alter the interpretation of the firsthypothesis (H1) that small firms are dispropor-tionately more information technology invest-ment-intensive than large firms. It can be arguedthat the capital markets confer an advantage tolarge firms in their ability to raise risk capital forinformation technology projects. Ein-Dor andSegev (1978) postulated that large firms wouldincur fewer MIS failures arising from insufficientresources. Second, the cost of hardware andespecially software may be more burdensome forsmall firms than large firms (DeLone, 1981).Third, as firm size increases so does the possibili-ty of structuring and programming the inter-re-lationship between activities and tasks (Marshand Mannari, 1981).’
H2: There is a positive relationship betweenthe level of spending on infomtation tech-nology and the ratio of Information tech-nology expense to total operatingexpense.
A higher level of spending on informationtechnology can increase the ratio of IT expensesto total expenses simply by increasing IT ex-penses faster than other expenses, or even byallowing other expenses to shrink. If this invest-ment in IT allows firms to reduce total expensesor to increase their market share without com-parable increase in total expense, this is clearlydesirable. While this hypothesis is intuitively ap-pealing, we are unaware of any prior empiricalsupport or test of the proposition.
DataThe data source for this study is the Life OfficeManagement Association (LOMA) Tracking Infor-mation Processing Expenses (TIPE) database.
338 MIS Quarterly/September 1991
Information Technology Investment Intensity
LOMA is the insurance industry trade associa-tion for life insurers. 5 The LOMA TIPE databasewas started in 1981, and the firms in the databaseare members of the association. LOMA beganreporting summarized information back to thecompanies in 1982. Annually, LOMA surveys themember firms to obtain expenditure informationon revenues by line of business, total cost by pro-duct category (e.g., life versus property andcasualty), and information technology expenses(e.g., hardware, software, personnel, miscellan-eous). The financial information in the databasecaptures only home office insurance operationsand is reported to LOMA consistent with in-surance company reporting for the U.S. AnnualStatement, the U.S. Consolidated Annual State-ment, and the Annual Statements as RespectsLife Insurance in Canada. All other expense itemsare reported consistent with the definitions pro-vided with the survey instrument. For inclusionin the LOMA database, firms must provide atleast two years of data. In a typical year, the firmsin the database account for more than 70 per-cent of the premium income in the life insuranceindustry and more than 95 percent of the totaladmitted assets in the industry,s
To protect the confidentiality of the data from in-dividual firms, LOMA summarizes the informa-tion before making it available to membercompanies. Each firm’s data is reported back tothe company, along with the summarized infor-mation from all firms, in a format that facilitatescomparisons with the~summarized information.Errors in individual company data are recognizedand corrected. The LOMA instrument documentsthe information technology expenditures in eachcompany and tracks key financial information.
The Life Office Management Association (LOMA), foundedin 1924, is the insurance industry association for life insurers.LOMA promotes information exchange, cooperative research,and education and training activities to help member com-panies deal with the challenges of management in financialplanning, operations and systems, and human resources.
We are aware of the limitations of using this database. Forexample, by focusing on home office operations, the LOMAsurvey may bias reported IT expenditures by under-reportingIT investments of firms with large commitments to IT in thefield. It is not clear whether this would result in systematical-ly underestimating expenses of large or small firms. TheLOMA database is, however, the best available for this in-dustry. Its utility in assessing the strategic impact of informa-tion technology and its use in the insurance industry has beenrepeatedly demonstrated (e.g., Harris and Katz, 1990; 1991).
The samples used in this study reflect more than60 percent of the premium income in the life in-surance industry (A.M. Best Co., 1984; 1985;1986; 1987). The hardware configuration com-plexity of the firms varied considerably, fromsingle processor/single location installations tomultiple processors connected across multiplelocations. Data management sophistication alsovaried widely, within and between firms, from filemanagement systems to database managementsystems. Overall, the firms in this study were veryrepresentative of the top 50 insurance companiesas measured by premium income: more than 10out of the top 20; more than 20 of the top 50.Premium income ranged from $5.6 million for thesmallest firm to $19.3 billion for the largest firm.The level of information technology spendingranged from $139.2 thousand for the smallestfirm in the sample to $381.2 million for the largestfirm.
Measures and MethodsDependent variable
The dependent variable and measure of informa-tion technology investment intensity used in thisstudy is the ratio of information technology coststo total operating costs (ITExpR), or the IT ex-pense ratio. A similar measure was used byGremillion (1984), Steiner and Texieira (1990),and Turner (1982).
Information technology costs captured in theLOMA survey include all expenses for informa-tion processing in the home office (e.g., hard-ware, software, personnel, data communications,miscellaneous) in both data processing andline/staff departments, including depreciation.Operating expenses include both informationtechnology costs as well as non-informationtechnology costs. Operating expenses do not in-clude sales commissions, investment expenses,or the payment of policyholder benefits as a partof costs. This definition of operating expenses isgenerally accepted in the industry and is consis-tent with insurance company financial reporting.
Independent variablesPremium income (PI) is the measure of firm sizeused in this study. It emphasizes the input
MIS Quarterly/September 1991 339

Information Technology Investment Intensity
workload level aspect of size, and it is positivelycorrelated with the number of policies and livescovered. Premium income also reflects both theunit price and reserves that are set aside to meetpolicyholder benefits; it is not a measure of netearnings. For the purposes of this study,however, premium income is a better measureof firm size than the number of employeesbecause using the latter measure could indicatethe extent to which IT is being used as asubstitute for labor and thus confound the results.
To test the first hypothesis (H1), we used a time-lagged regression research design to allow forthe fact that adjustments in the IT expense ratiomay be due to changes in the level of premiumincome that occurred in earlier periods. Thisanalysis takes into account the fact that changesin firm size in one period could provide the basisfor adjustments in the IT expense ratio in somefuture period (because firms often adjust theircapacity in response to changes in demand). Itdiffers from the traditional cross-sectional or con-temporaneous analysis, which assumes thatorganizational decision makers accurately an-ticipate changes in demand and that adjustmentsin the IT expense ratio occur simultaneously withthe changes in firm size. Because there is notheoretical justification at this time for one lagstructure over another, we tested the hypothesis(H1) using six different time-lagged models: (1)a one-year lagmthe 1986, 1985, and 1984 IT ex-pense ratio values were regressed on premiumincome from 1985, 1984, and 1983, respective-ly; (2) a two-year lag--the 1986 and 1985 IT ex-pense ratio values were regressed on premiumincome from 1984 and 1983, respectively; and(3) a three-year lag--the 1986 IT expense ratiowas regressed on premium income from 1983.Averages for premium income, informationtechnology expense, the IT expense ratio, andthe ratio of hardware expense to informationtechnology expense (i.e., the hardware ratio) arealso reported.
We also report the contemporaneous correlationsbetween premium income and the IT expenseratio. Because the values of size variables areoften skewed, zero order correlations for the logof premium income were also taken to: (1) ad-just for the variance in the distribution of premiumincome values across firms; and (2) allow for thepotential curvilinearity between premium incomeand the IT expense ratio (Kimberly, 1976).
Funds for information technology projects areusually budgeted many months before they areexpensed, and large and complex projects oftenrequire funds for time periods that exceed oneyear. To account for the fact that changes in theIT expense ratio may lag behind changes in thelevel of spending on IT, we tested the hypothesis(H2) using six different time-lagged models: (1)a one-year lag--the 1986, 1985, and 1984 IT ex-pense ratio values were regressed on the levelof IT spending from 1985, 1984, and 1983,respectively; (2) a two-year lag--the 1986 and1985 IT expense ratio values were regressed onthe level of IT spending from 1984 and 1983,respectively; and (3) a three-year lag--the 1986IT expense ratio is regressed on the level of ITspending from 1983.
While we know very little about the length of timeit takes an IT project to affect business operationsin the insurance industry, in a seven-year cross-industry study, Osterman (1986) reported that theexpansion of computer power had the largestdisplacement effect within the first two years afterthe expansion. The observations we havegathered in our case study research and in con-versations with leading insurance industry ex-ecutives tend to support this finding.Contemporaneous correlations between the levelof spending on IT and the log of the level of ITspending with the IT expense ratio are reportedin the next section
An alternative input measure to the lagged levelof information technology spending is thecumulative level of information technology spen-ding (CUMIT) across all years, 1983 to 1986.Whereas the level of information technologyspending is treated as a flow cost rather than aninvestment, the cumulative level of informationtechnology spending incorporates part of the ac-cumulation of knowledge and know-how that hasbeen built up in the firm over time.
FindingsTable 1 provides a comparison of the averagesfor premium income, IT expense, IT expenseratio, and the hardware ratio (i.e., ratio of hard-ware expense to information technology ex-pense) by premium income range, 1983 to 1986.The results indicate that hardware expenses asa proportion of information technology expenses
340 MIS Quarterly/September 1991

Information Technology Investment Intensity
Table 1. Comparison of Firms by Premium Income Range, 1983 to 1986
Premium Average Average Average ITIncome Premium IT ExpenseRange N = Income Expense Ratio
AverageHardwareRatio* * *
5-25M* 58 14.6M 0.8M25-75M 128 45.7M 1.9M75-300M 210 164.9M 5.1M300M-1B** 129 536.2M 12.8M1B-10B 113 2.6B 55.5MOver 10B 12 13.8B 301.1 M
.19 .31
.17 .33
.16 .36
.14 .39
.13 .39
.20 .49
* = millions of dollars.** = billions of dollars.
*** = ratio of hardware expense to information
were higher for large insurers than for smallinsurers.
Table 2 provides the contemporaneous correla-tions between the IT expense ratio for 1983 to1986, and some of the key variables used in thisstudy: premium income, log of premium income,IT spending, and log of IT spending.
The zero order correlations between premium in-come (PI) and the ratio of information technologyexpense to total operating expense (ITExpR)were negative each year (1983 to 1986) but were
Table 2. Zero Order
technology expense.
insignificant at the .05 level. The values variedfrom -.1013 to -.1238. While the negative sign inthe correlations between premium income andthe ratio of IT expense to total operating expensein Table 2 was consistent with the direction of thefirst hypothesis (H1), the correlations were notstatistically significant, which indicates thehypothesis was not supported.
The correlations between the log of premium in-come (LGPI) and ITExpR were negative andsignificant (at the .01 level) each year, 1983
Correlations: 1983 to 1986
IndependentVariables 1986 1985
TI Expense Ratio
1984 1983
Premium Income -.1013 -.1019 -.1238 -.1070(.2370) (.2799) (.1045) (.1763)
Log of -.2738* -.2224* -.2612" -.2639*Premium Income (.0012) (.0028) (.0005) (.0007)
IT Spending -.0887 -.0814 -.0865 -.0760(.3004) (.2799) (.257~ (.3376)
Log of -.1427"* -.1019 -.1428"* -.1022IT spending (.0948) (.1755) (.0609) (.1967)
N = 138 178 173 161
The number in the parenthesis under the correlation is the p-value.* = Correlations are significant at the .01 level.
** =Correlations are significant at the .10 level.
MIS Quarterly~September 1991 341
Information Technology Investment Intensity
1986. Thus, the correlations support the firsthypothesis (H1) that small insurers spend higher proportion of their operating expenses oninformation technology than do large insurers.These results also suggest a curvilinear relation-ship between premium income and the ITExpRratio values.
The zero order correlations between level ofspending on information technology and the ITintensity ratio (ITExpR) were negative and werenot significant at the .05 level for each year, 1983to 1986; similar results were found for the cor-relations between the log of IT (LGIT) andITExpR. These correlations do not support thesecond hypothesis (H2).
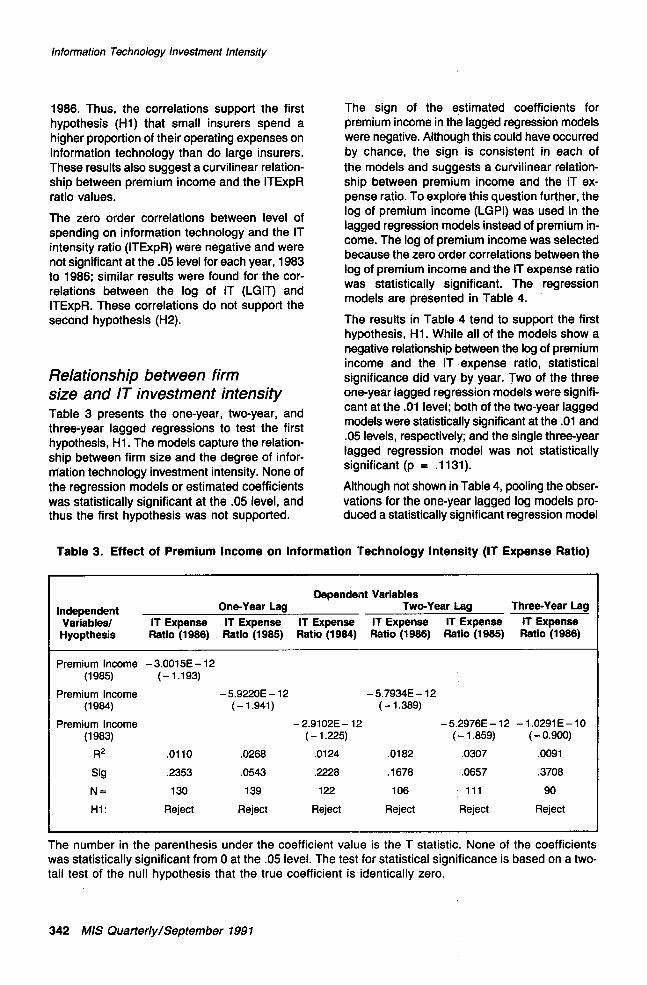
Relationship between firmsize and IT investment intensityTable 3 presents the one-year, two-year, andthree-year lagged regressions to test the firsthypothesis, H1. The models capture the relation-ship between firm size and the degree of infor-rrlation technology investment intensity. None ofthe regression models or estimated coefficientswas statistically significant at the .05 level, andthus the first hypothesis was not supported.
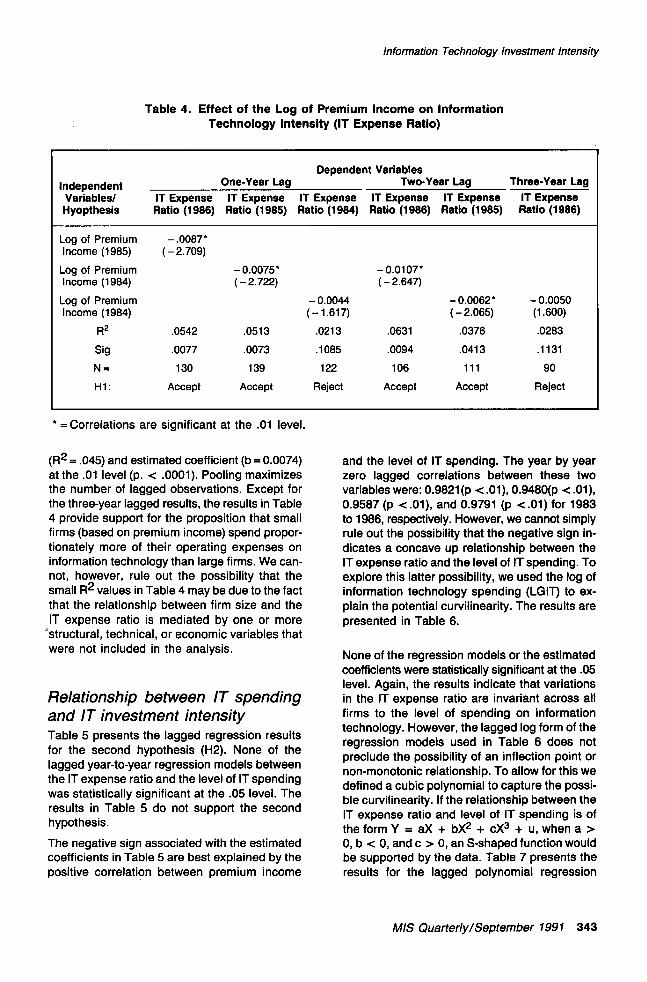
The sign of the estimated coefficients forpremium income in the lagged regression modelswere negative. Although this could have occurredby chance, the sign is consistent in each ofthe models and suggests a curvilinear relation-ship between premium income and the IT ex-pense ratio. To explore this question further, thelog of premium income (LGPI) was used in thelagged regression models instead of premium in-come. The log of premium income was selectedbecause the zero order correlations between thelog of premium income and the IT expense ratiowas statistically significant. The regressionmodels are presented in Table 4.
The results in Table 4 tend to support the firsthypothesis, HI. While all of the models show anegative relationship between the log of premiumincome and the IT expense ratio, statisticalsignificance did vary by year. Two of the threeone-year lagged regression models were signifi-cant at the .01 level; both of the two-year laggedmodels were statistically significant at the .01 and.05 levels, respectively; and the single three-yearlagged regression model was not statisticallysignificant (p = .1131).
Although not shown in Table 4, pooling the obser-vations for the one-year lagged log models pro-duced a statistically significant regression model
Table 3. Effect of Premium Income on Information Technology Intensity (IT Expense Ratio)
Dependent VariablesIndependent One-Year Lag Two-Year Lag Three-Year LagVariables/ IT Expense IT Expense IT Expense IT Expense IT Expense IT ExpenseHyopthesis Ratio (1986) Ratio (1985) Ratio (1984) Ratio (1986) Ratio (1985) Ratio
Premium Income - 3.0015E - 12(1985) ( - 1.193)
Premium Income - 5.9220E - 12 - 5.7934E - 12(1984) ( - 1.941) ( - 1.389)
Premium Income - 2.9102E - 12(1983) ( - 1.225)
R2 .0110 .0268 .0124 .0182
Sig .2353 .0543 .2228 .1678
N = 130 139 122 106
H 1: Reject Reject Reject Reject
-5.2976E-12 -1.0291E-10(- 1.85~ ( - 0.90~
.0307 .0091
.0657 .3708
111 90
R~ect R~ect
The number in the parenthesis under the coefficient value is the T statistic. None of the coefficientswas statistically significant from 0 at the .05 level. The test for statistical significance is based on a two-tail test of the null hypothesis that the true coefficient is identically zero.
342 MIS Quarterly/September 1991
Information Technology Investment Intensity
Table 4. Effect of the Log of Premium Income on InformationTechnology Intensity (IT Expense Ratio)
Dependent VariablesIndependent One-Year Lag Two-Year Lag Three-Year LegVariables/ IT Expense IT Expense IT Expense IT Expense IT Expense IT ExpenseHyopthesis Ratio (1986) Ratio (1985) Ratio (1984) Ratio (1986) Ratio (1985) Ratio
Log of Premium -.0087"Income (1985) (-2.709)
Log of Premium - 0.0075" - 0.0107"Income (1984) ( - 2.722) ( - 2.647)Log of Premium - 0.0044 - 0.0062* - 0.0050Income (1984) ( - 1.617) ( - 2.065) (1.600)
R2 .0542 .0513 .0213 .0631 .0376 .0283Sig .0077 .0073 .1085 .0094 .0413 .1131
N -- 130 139 122 106 111 90
H 1 : Accept Accept Reject Accept Accept Reject
* = Correlations are significant at the .01 level.
(R2 = .045) and estimated coefficient (b = 0.0074)at the .01 level (p, < .0001). Pooling maximizesthe number of lagged observations. Except forthe three-year lagged results, the results in Table4 provide support for the proposition that smallfirms (based on premium income) spend propor-tionately more of their operating expenses oninformation technology than large firms. We can-not, however, rule out the possibility that thesmall R2 values inTable 4 may be due to the factthat the relationship between firm size and theIT expense ratio is mediated by one or more
’structural, technical, or economic variables thatwere not included in the analysis.
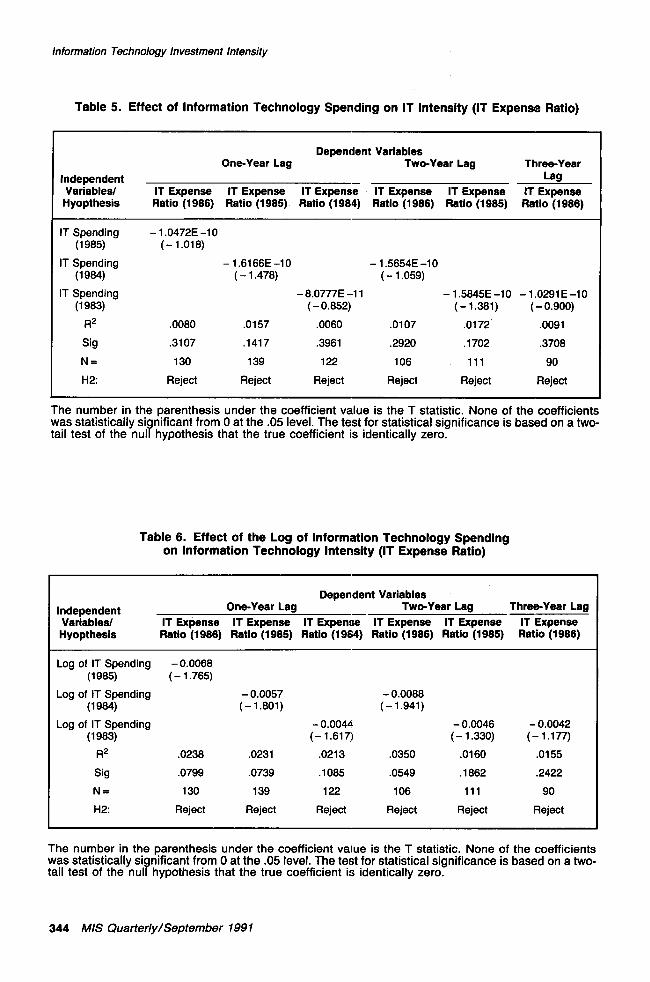
Relationship between IT spendingand IT investment intensityTable 5 presents the lagged regression resultsfor the second hypothesis (H2). None of thelagged year-to-year regression models betweenthe IT expense ratio and the level of IT spendingwas statistically significant at the .05 level. Theresults in Table 5 do not support the secondhypothesis.
The negative sign associated with the estimatedcoefficients in Table 5 are best explained by thepositive correlation between premium income
and the level of IT spending. The year by yearzero lagged correlations between these twovariables were: 0.9821(p < .01), 0.9480(p < .01),0.9587 (p <.01), and 0.9791 (p <.01) for to 1986, respectively. However, we cannot simplyrule out the possibility that the negative sign in-dicates a concave up relationship between theIT expense ratio and the level of IT spending. Toexplore this latter possibility, we used the log ofinformation technology spending (LGIT) to ex-plain the potential curvilinearity. The results arepresented in Table 6.
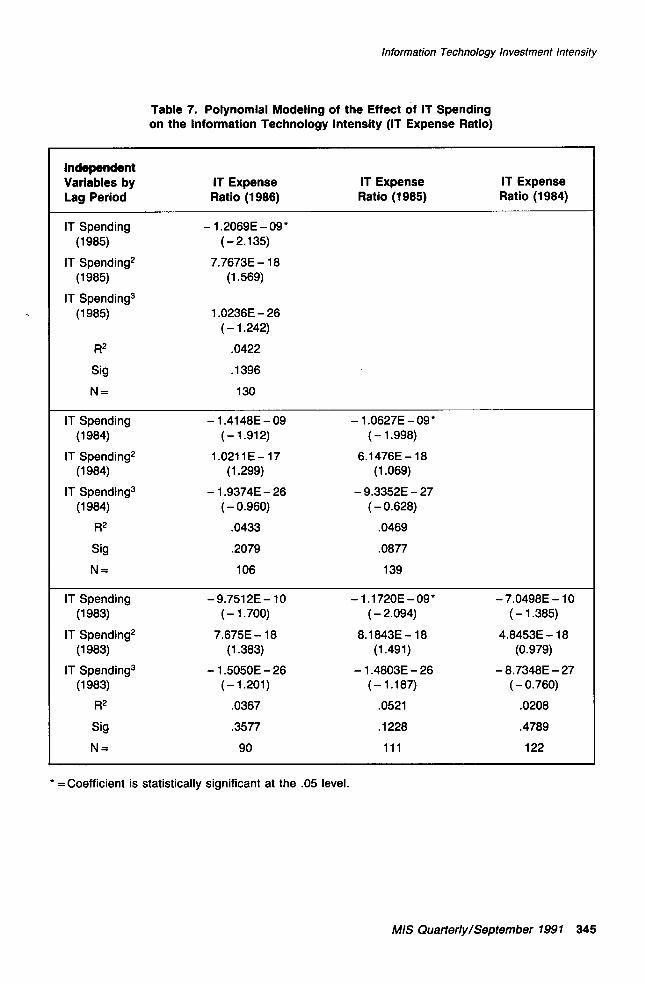
None of the regression models or the estimatedcoefficients were statistically significant at the .05level. Again, the results indicate that variationsin the IT expense ratio are invariant across allfirms to the level of spending on informationtechnology. However, the lagged log form of theregression models used in Table 6 does notpreclude the possibility of an inflection point ornon-monotonic relationship. To allow for this wedefined a cubic polynomial to capture the possi-ble curvilinearity. If the relationship between theIT expense ratio and level of IT spending is ofthe formY = aX + bX2 + cX3 + u, whena>0, b < 0, and c > 0, an S-shaped function wouldbe supported by the data. Table 7 presents theresults for the lagged polynomial regression
MIS Quarterly/September 1991 343
Information Technology Investment Intensity
Table 5. Effect of Information Technology Spending on IT Intensity (IT Expense Ratio)
Dependent VariablesOne-Year Leg Two-Year Lag Three’Year
Independent LagVariables/ IT Expense IT Expense IT Expense IT Expense IT Expense IT ExpenseHyopthesis Ratio (1986) Ratio (1985) Ratio (1984) Ratio (1986) Ratio (1985) Ratio
IT Spending - 1.0472E-10(1985) (- 1.018)
IT Spending - 1.6166E -10(1984) ( - 1.478)
IT Spending - 8.0777E -11(1983) ( - 0.852)
R2 .0080 .0157 .0060
Sig .3107 .1417 .3961
N -- 130 139 122H2: Reject Reject Reject
- 1.5654E -10(- 1.059)
- 1.5845E -10 - 1.0291 E -10( - 1.381) ( - 0.900)
.0107 ,0172 .0091
.2920 ,1702 .3708
106 111 90Reject R~ect R~ect
The number in the parenthesis under the coefficient value is the T statistic. None of the coefficientswas statistically significant from 0 at the .05 level. The test for statistical significance is based on a two-tail test of the null hypothesis that the true coefficient is identically zero.
Table 6. Effect of the Log of Information Technology Spendingon Information Technology Intensity (IT Expense Ratio)
Dependent VariablesIndependent One-Year Lag Two-Year Lag Three-Year LagVariables/ IT Expense IT Expense IT Expense IT Expense IT Expense IT ExpenseHyopthesis Ratio (1986) Ratio (1985) Ratio (1984) Ratio (1986) Ratio (1985) Ratio
Log of IT Spending -0.0068(1985) ( - 1.765)
Log of IT Spending -0.0057 -0.0088(1984) (- 1.801) (- 1.941)
Log of IT Spending - 0.0044 - 0.0046 - 0.0042(1983) (- 1.617) (- 1.330) (- 1.177)
R2 .0238 .0231 .0213 .0350 .0160 .0155Sig .0799 ,0739 .1085 .0549 .1862 .2422
N -- 130 139 122 106 111 90
H2: Reject Reject Reject Reject Reject Reject
The number in the parenthesis under the coefficient value is the T statistic. None of the coefficientswas statistically significant from 0 at the .05 level. The test for statistical significance is based on a two-tail test of the null hypothesis that the true coefficient is identically zero.
344 MIS Quarterly~September 1991
Information Technology Investment Intensity
Table 7. Polynomial Modeling of the Effect of IT Spendingon the Information Technology Intensity (IT Expense Ratio)
Indel=endentVariables byLag Period
IT Expense IT Expense IT ExpenseRatio (1986) Ratio (1985) Ratio (1984)
IT Spending(1985)
IT Spending2
(1985)
IT Spending3
(1985)
a2
Sig
N=
- 1.2069E - 09*(-2.135)
7.7673E - 18(1.569)
1.0236E-26(- 1.242)
.0422
.1396
130
IT Spending - 1.4148E - 09 - 1.0627E - 09*(1984) ( - 1.912) ( - 1.998)
IT Spending2 1.0211E - 17 6,1476E - 18(1984) (1.299) (1,069)
IT Spending3 - 1.9374E - 26 - 9.3352E - 27(1984) ( - 0.960) ( - 0.628)
R2 .0433 .0469
Sig .2079 .0877
N = 106 139
IT Spending - 9.7512E - 10 - 1.1720E - 09 * - 7.0498E - 10(1983) (- 1.700) (-2,094) (- 1,385)
IT Spending2 7.675E - 18 8.1843E - 18 4.8453E - 18(1983) (1.383) (1.491) (0.979)
IT Spending3 - 1.5050E - 26 - 1.4803E - 26 - 8.7348E - 27(1983) ( - 1.201) ( - 1.187) ( - 0.760)
R2 .0367 .0521 .0208
Sig .3577 .1228 .4789
N= 90 111 122
* = Coefficient is statistically significant at the .05 level.
MIS Quarterly~September 1991 345
Information Technology Investment Intensity
models. None of the models was statisticallysignificant, indicating that the existence of an in-flection point or non-monotonicity was not aproblem.
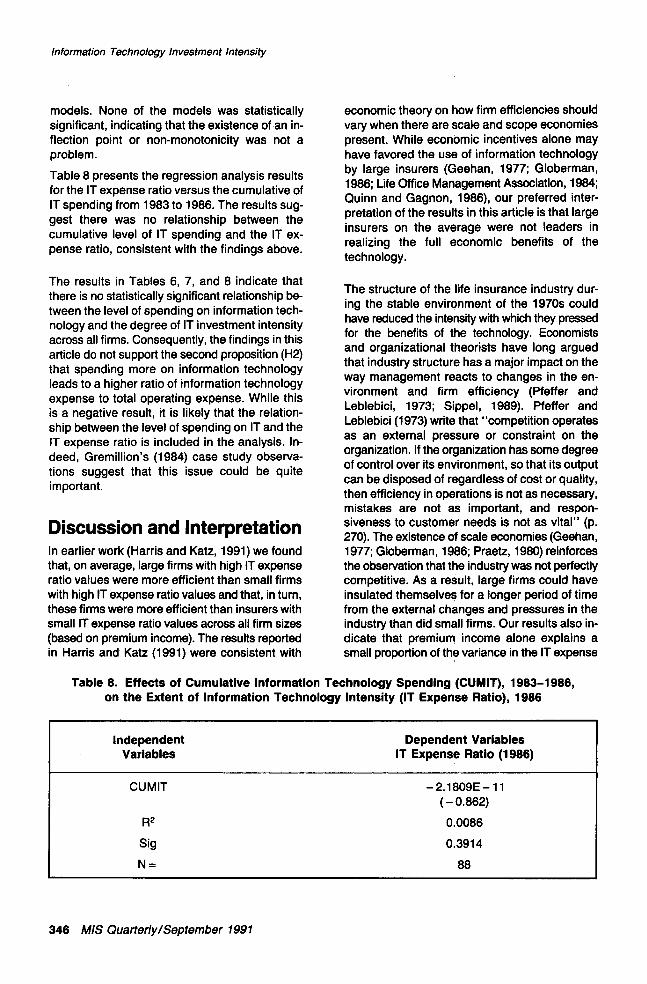
Table 8 presents the regression analysis resultsfor the IT expense ratio versus the cumulative ofIT spending from 1983 to 1986. The results sug-gest there was no relationship between thecumulative level of IT spending and the IT ex-pense ratio, consistent with the findings above.
The results in Tables 6, 7, and 8 indicate thatthere is no statistically significant relationship be-tween the level of spending on information tech-nology and the degree of IT investment intensityacross all firms. Consequently, the findings in thisarticle do not support the second proposition (H2)that spending more on information technologyleads to a higher ratio of information technologyexpense to total operating expense. While thisis a negative result, it is likely that the relation-ship between the level of spending on IT and theIT expense ratio is included in the analysis. In-deed, Gremillion’s (1984) case study observa-tions suggest that this issue could be quiteimportant.
Discussion and InterpretationIn earlier work (Harris and Katz, 1991) we foundthat, on average, large firms with high IT expenseratio values were more efficient than small firmswith high IT expense ratio values and that, in turn,these firms were more efficient than insurers withsmall IT expense ratio values across all firm sizes(based on premium income). The results reportedin Harris and’ Katz (1991) were consistent with
economic theory on how firm efficiencies shouldvary when there are scale and scope economiespresent. While economic incentives alone mayhave favored the use of information technologyby large insurers (Geehan, 1977; Globerman,1986; Life Office Management Association, 1984;Quinn and Gagnon, 1986), our preferred inter-pretation of the results in this article is that largeinsurers on the average were not leaders inrealizing the full economic benefits of thetechnology.
The structure of the life insurance industry dur-ing the stable environment of the 1970s couldhave reduced the intensity with which they pressedfor the benefits of the technology. Economistsand organizational theorists have long arguedthat industry structure has a major impact on theway management reacts to changes in the en-vironment and firm efficiency (Pfeffer andLeblebici, 1973; Sippel, 1989). Pfeffer andLeblebici (1973) write that "competition operatesas an external pressure or constraint on theorganization. If the organization has some degreeof control over its environment, so that its outputcan be disposed of regardless of cost or quality,then efficiency in operations is not as necessary,mistakes are not as important, and respon-siveness to customer needs is not as vital" (p.270). The existence of scale economies (Geehan,1977; Globerman, 1986; Praetz, 1980) reinforcesthe observation that the industry was not perfectlycompetitive. As a result, large firms could haveinsulated themselves for a longer period of timefrom the external changes and pressures in theindustry than did small firms. Our results also in-dicate that premium income alone explains asmall proportion of the variance in the IT expense
Table 8. Effects of Cumulative Information Technology Spending (CUMIT), 1983-1986,on the Extent of Information Technology Intensity (IT Expense Ratio), 1986
IndependentVariables
Dependent VariablesIT Expense Ratio (1986)
CUMIT - 2.1809E - 11( - 0.862)
R2 0,0086
Sig 0.3914
N = 88
346 MIS Quarterly~September 1991
Information Technology Investment Intensity
ratio values (R2 < .065). In general, our findingsare largely consistent with and tend to reinforcethe observations by Globerman (1986).
Of course, an alternative interpretation is consis-tent with the data, viz that large insurers enjoya very significant advantage in the use of infor-mation technology due to their significanteconomies of scale in application softwaredevelopment. This is consistent with findings bySteiner and Teixeira (1990) in banking, in par-ticular their observations concerning theeconomies of scale and scope available throughinformation technology. Their belief that IT scaleeconomies are a pressure toward mergers inbanking could also generalize to mergers in theinsurance industry, where firms like CIGNA mightbe seen to have lower information technology in-vestment intensity due to economies producedby the merger that led to the company’s forma-tion. However, values of IT investment intensitymay also be due to excess non-IT capacity.
This interpretation--that large firms enjoy in-creased benefits from their information tech-nology investments, due especially to economiesof scale in software production--is consistentwith the findings that hardware represents an in-creasingly large fraction of the technology bud-gets for large firms. That is, rather than arguingthat hardware is more burdensome, which ishardly an indication that large firms spend lessover all on IT, these data suggest that for largefirms software is relatively less burdensome. Thisis not surprising because the cost of softwaredevelopment is largely independent of the scaleof operations and of market share; thus, whilelarge firms would need more processing capaci-ty (hardware) than small firms, they might be ableto invest proportionally less for the same softwarefunctionality. Of course, this does not entirely ruleout our belief that large firms are under investing;these firms might still benefit from. developing ad-ditional functionality. Small firms may be able tocounter some of the application developmentscale advantage enjoyed by large firms by pur-chasing software and modifying it to meet theirneeds.
The evidence in the literature, we contend, sug-gests that economic and technological potentialalone does not adequately explain why somefirms use information technology more and othersless. This is primarily because the structure ofthe industry (e.g., level of competitive intensity,
customer values) is an important mediator thataffects the speed and timing of competitive en-try and response (Meyer, 1982; Pfeffer andLeblebici, 1973; Scherer, 1973).
In addition, contrary to expectations, we did notfind that spending more on informationtechnology leads to a higher ratio of informationtechnology expense to total operating expense.This suggests to us that insurers need to inten-sify their efforts to realize the productivity andcost substitution benefits that are availablethrough the technology. Investments in informa-tion technology represent a major source ofbusiness risk and this risk must be managed ef-fectively through the link with the firm’s strategy,the structure of the organization, the measure-ment and control system, the reward system, andthe characteristics of the technology (Morone,1989). This finding is consistent with the obser-vation of several academics and practitioners thathow the technology is used and managed is asimportant as the level of spending, if not moreso (Grayson and O’Dell, 1988; Hammer, 1990;Levinson, 1988; Strassman, 1985; Zuboff, 1988).
It is generally accepted in the academic literaturethat the structural parameters of organizationsvary widely, such that some firms are more like-ly than others to take the initiative and lead withnew product and process changes (Mintzberg,1979; 1989). In our five-year study of the life in-surance industry, we have come across two dif-ferent types of insurers that illustrate part of theextent of firm diversity in the industry. At one endof the spectrum are the innovative and en-trepreneurial firms that are willing to take the in-itiative and lead with new product and processchanges and diversify their product scope insearch of new market opportunities. This type offirm tends to be loosely similar to Miles andSnow’s (1978) "prospectors" and Mintzberg’s(1979) "entrepreneurial" organizations. At theother end of the spectrum are the ultra-conservative firms that are more willing to letother firms lead and take the initiative rather thanbe the leader. This type of firm tends to be looselysimilar to the "stagnant bureaucracy" of Millerand Friesen (1984) and Mintzberg’s (1979)"adapters." These differences between insurersexist for a variety of reasons, including the factthat firms will react differently to changes in thestructure of the industry.
MIS Quarterly~September 1991 347
Information Technology Investment Intensity
We contend, based on our experience in study-ing the insurance industry, that innovative andentrepreneurial insurers tend to be found amongsmall and medium-sized firms. However, somelarge insurers have become innovative with in-formation technology by decentralizing decisionmaking and by redesigning the organization totake advantage of inter-functional and inter-firmrelational synergies (Hammer, 1990; Zuboff,1988). Innovative firms tend to search con-tinuously for new opportunities where the com-petition is weak and markets are growing fast.In addition, management tends to state openlyvalues that would support change and resolveconflicts. As a result, these firms are more will-ing to modify processes and structures to achievetheir goals. The leadership style in these firmstends to be entrepreneurial and the managementdecision-making process less formal andbureaucratic, allowing for rapid response. In in-novative insurers, the proactive use of informa-tion technology is built into the strategy of thefirm, and they are constantly looking for ways touse the technology to improve their competitiveposition. These firms also tend to differ from otherinsurers in that the CEO’s vision and the goalsand strategy of the firm are often the primarybasis for using information technology ag-gressively instead of environmental pressure orindustry structure.
At the other end of the spectrum, ultra-conservative firms tend to be slower to respondto changes in technology and are less likely tomove aggressively to take advantage of theeconomic potential. Often these firms are well-established in their market with a long history ofpast successes. The management decision-making processes in these firms tend to moveslowly and cautiously, even after appropriate in-formation on the need for change has beenpresented. In part, this is because they have beensuccessful without having to make dramaticchanges. The culture in these insurers tends toreinfome the existing systems, procedures, andstructures, and acts as a barrier to technologicalchange. Indeed, management tends to see thetechnology as a tool that can be used to gaingreater efficiencies and control over existingtasks rather than as a way to fundamentallychange the business and how the organizationfunctions (Levinson, 1988). The effectivenessand/or efficiency of the MIS organization tends
to be weak. Ultra-conservative firms also tend tobe short-term oriented and budget and expense-driven. They may not have the technical skills andinfrastructure or cultural values and beliefs to usethe information technology as a strategic tool.However, if adequate resources are available tomake the product and process changes needed,these firms will tend to respond to environmen-tal pressure. If the resources available are insuf-ficient, little innovation in products or processeswill take place, and the firms will simply driftalong. Consequently, changes in strategy inthese insurers tend to be incremental and imita-tive rather than dramatic and innovative.
The differences between strategic archetypes isstriking, particularly in terms of their posturetoward taking advantage of the economic poten-tial of the technology. Based on the research inthe literature, the results in this article, and theobservations that we have gathered in our casestudy research, it is clear that the correlation be-tween the degree of information technology in-vestment intensity and firm size, or the level ofspending Qn IT, is mediated by several structural,technical, and economic factors. Furtherresearch is needed to identify the significant fac-tors, how they interact, how they change overtime, and under what conditions the structuralfactors are more significant than the technical oreconomic factors. As an example of the latter,if the environment is stable and munificent andthere is a high degree of technological sophistica-tion, it seems likely that the firm-specific factorswil! be more important than the market-specificfactors. However, if the industry is undergoingsignificant environmental change or technologi-cal change, it is unclear which type of factors willbe the most significant because different firmsrespond to and are driven by different forceswhen evaluating opportunities to use informationtechnology.
Limitations of the StudyThe conclusions drawn in this study are basedon industry data obtained from the Life OfficeManagement Association (1984; 1988). Theresults presented reflect the full array of productofferings among life insurers (e.g., life, group,credit, property and casualty), although theprimary products were life insurance.
348 MIS Quarterly~September 1991

Information Technology Investment Intensity
The findings in this article could be strengthenedand expanded by replicating the study at a dif-ferent point in time and in other industries andby using alternative measures of informationtechnology investment intensity (e.g., the ratio ofinformation technology expense to the totalnumber of employees). Measures are neededboth to evaluate technological change and to"determine which innovative efforts to push,which to reconsider, and which to abandon"(Drucker, 1985, p.167). Measurement is com-plicated because of the need to decide on whichfactors to systematically gather data and the needto map out the linkage between these factors andspecific elements of a firm’s strategy. Some ofthe other measures of firm size that should beconsidered include the total number ofemployees and total assets. If the firm sizemeasures are not proportional to each other, thefindings could change. The informed subjectiveinterpretations, which make up the bulk of thisarticle, could be strengthened with formal data.
The age of the firm may be a confounding factorin the interpretation of the results. Small, young,technologically opportunistic firms may be morelikely to purchase external services or turnkeysystems and adapt the managerial and organiza-tional work system to the technology. To the ex-tent there exists comparable hardware andsoftware across firm sizes, small firms couldrealize a higher level of IT investment intensitymore quickly than large firms. This in turn couldlead to more effort to leverage the benefits of thetechnology in the future. Alternatively, it may bethat young small firms that do not achieve a highlevel of IT intensiveness are at risk for their con-tinued survival. If, as a consequence, they fail ata higher rate than large firms, it could be (thoughnot likely) that they are not well-represented inthe LOMA sample.
The findings in this article were established withinsample bounds and may not be valid for verysmall firms. This article also did not address thepotential simultaneities between firm size and in-formation technology investment intensity. Futurestudies could extend this research by address-ing these issues directly.
Theoretically, information technology spendingdecisions could influence the level of premiumincome generated by the firm. This is primarilya second-order effect that results from the re-quirements for efficient production and the
capacity to both modify existing products and of-fer new ones. Conceptually, we might expect apositive relationship between the IT expense ratioin one period and premium income in a laterperiod if the industry were undergoing a stronggrowth cycle, which might encourage managersto accede to expansionary information technol-ogy policies in order to create excess capacity.There might also be a positive relationship be-tween the IT expense ratio and premium incomesimply because of the attractiveness of the IT in-vestment. Alternatively, munificence and stabili-ty might lead to less concern for efficiency andinvestments in the information processing needsof the firm. During the period of this study, 1983to 1986, demand was shifting from traditional lifeinsurance products, premium income growth wasslowing, and the cost pressures in the industrywere increasing. Consequently, it is unlikely thata significant positive relationship existed betweenthe IT expense ratio in one period and thepremium income level in a later period.Preliminary analysis of the data revealed that therelationship between the IT expense ratio andpremium income was positive but insignificant.
Our findings could have been influenced by thedata collection method. Firms were asked to sub-mit information consistent with the definitions thatwere specified in the survey instrument. Becausethe sample used in this study draws on a largenumber of firms that were in the database for aminimum of two years, we believe that this prob-lem is not as significant as it might be in a onetime period cross-sectional study. Multi-year dataprovide more opportunity to identify errors orproblems in the data collected and in the datacollection procedure.
ConclusionsThere is increasing empirical evidence that largeinsurers enjoy substantial economies of scale intheir home office activities (Geehan, 1977;Praetz, 1980). The source of scale and scopeeconomies is attributed generally to informationtechnology, and organizational know-how and ex-perience in certain management and marketingfunctions (Quinn and Gagnon, 1986). In earlierwork (Harris and Katz, 1990; 1991), we found thatthe ratio of information technology expense tototal operating expense was one of the factors
MIS Quarterly~September 1991 349
Information Technology Investment Intensity
discriminating the extent to which insurers real-ized scale and scope economies. We reported thatinsurance firms with high ratios of informationtechnology expense to total operating expensewere more efficient (based on the ratio ofoperating expense to premium income) thanother firms across all size rankings (based onpremium income) and, on the average, have higher ratio of information technology expenseto total operating expense than large insurers.As noted above, our preferred interpretation isthat large insurers were not leaders in realizingthe full potential of the economic benefitsavailable.
We believe that, in the most extreme cases, largefirms with a small ratio of information technologyexpense to total operating expense tend tooperate less efficiently (Bender, 1986; Harris andKatz, 1990; 1991) and potentially less flexiblyand, thus, may run the risk of endangering theirsurvival. The trend toward greater price competi-tion, increased consolidation of industryresources, and higher capital requirementsfavors large firms that are efficient in the use ofcapital with a strong product-market focus(Economist, 1990; Life Office ManagementAssociation, 1984; 1988; Sippel, 1989). Firms thatdo not recognize these trends and fail to respondto them are very likely to either exit the industryor see their market position destroyed. However,firms that seek to use information technology tomaximize the available economic benefits mustbe willing to think carefully through the restruc-turing of business processes and structural ar-rangements and be actively willing to manage theevents and outcomes in the implementationprocess.
AcknowledgementsThe authors would like to acknowledge thegenerous support of the Life Office ManagementAssociation, the Peter F. Drucker GraduateManagement Center, the Claremont GraduateSchool, and the College of Business Administra-tion at Georgia State University. We would alsolike to thank James F. Foley and Ann Purr ofLOMA for stimulating discussions during thecourse of the study. Inferences and recommen-dations drawn from the analysis and findings onlyreflect the views of the authors and not necessari-ly the views of the Life Office Management
Association. We would also like to thank SeevNeumann and the anonymous reviewers forhelpful comments on an earlier draft of thisarticle.
ReferencesA.M. Best Co. A.M. Best Reports, Oldwick, NJ,
1984.A.M. Best Co. A.M. Best Reports, Oldwick, NJ,
1985.A.M. Best Co. A.M. Best Reports, Oldwick, NJ,
1986.A.M. Best Co. A.M. Best Reports, Oldwick, NJ,
1987.Arthur D. Little Conference. Implementation of
the Information-Based Organization, RanchoMirage, CA, March 1990.
Bender, D.H. "Financial Impact of InformationProcessing," Journal of Management Infor-mation Systems (3:2), Fall 1986, pp. 22-32.
Blair, J.M. Economic Concentration, HarcourtBrace Jovanovich, Inc., New York, NY, 1972.
Chandler, A.D., Jr. Scale and Scope: TheDynamics of Industrial Capitalism, BelknapPress of Harvard University Press, Cam-bridge, MA, 1990.
Child, J. and Mansfield, R. "Technology, Sizeand Organizational Structure," Sociology (6),1972, pp. 369-393.
Cron, W.L. and Sobel, M.G. "The RelationshipBetween Computerization and Performance:A Strategy for Maximizing the EconomicBenefits of Computerization," Journal of Infor-mation and Management (6), 1983, pp.171-181.
DeBrabander, B., Deschoolmeester, D., Leyder,R., and Vanlommel, E. "The Effect of TaskVolume and Complexity Upon ComputerUse," Journal of Business (45), 1972, pp.56-84.
DeLone, W.H. "Firm Size and Characteristics ofComputer Use," MIS Quarterly (5:4),December 1981, pp. 65-77.
Drucker, P.F. Innovation and Entrepreneurship,Harper and Row, New York, NY, 1985.
Economist. "A Survey of American Insurance: AQuestion of Balance," October 27, 1990.
Ein-Dor, P. and Segev, E. "Organizational Con-text and the Success of Management Infor-mation Systems," Management Science(24:10), June 1978, pp. 1064-1077.
350 MIS Quarterly/September 1991
Information Technology Investment Intensity
Geehan, R. "Returns to Scale in the Life In-surance Industry," Bell Journal of Economics(8), 1977, pp. 497-514.
Globerman, S. "Firm Size and Dynamic Efficien-cy in the Life Insurance Industry," Journal ofRisk and Insurance (53:2), June 1986, pp.278-293.
Gold. B. "Forces Tending to Reduce Concentra-tion Levels in US Industries," Managerial andDecision Economics (10:2), June 1989, pp.115-119.
Grayson, C.J. and O’Dell, C. American Business:A Two Minute Warning, Free Press, NewYork, NY, 1988.
Gremillion, L.L. "Organization Size and Informa-tion System Use: An Empirical Study," Jour-nal of Management Information Systems (1:2),Fall 1984, pp. 4-17.
Hammer, M. "Reengineering Work: Don’t Auto-mate, Obliterate," Harvard Business Review(4), 1990, pp. 104-112.
Hanley, T.H., Rosenberg, J.M., D’Arista, C.A.,Krahmer, E.M., and Ross, M.H. Technologyand Banking: The Implications of Strategic Ex-penditures, Salomon Brothers, Inc., NewYork, NY, 1987.
Hartmann, H.I., Kraut, R.E., and Tilly, L.A. Com-puter Chips and Paper Clips: Technology andWomen’s Employment, National AcademyPress, Washington, D.C., 1986.
Harris, S.E. and Katz, J.L. "The Effect of FirmStructure on Performance in the Insurance In-dustry," Decision Sciences Institute Pro-ceedings, San Diego, CA, November 1990.
Harris, SoE. and Katz, J.L. "Organizational Per-formance and Information Technology Invest-ment Intensity in the Insurance Industry,"Organization Science (2:3), August 1991, pp.263-295.
Kimberly, J.R. "Organizational Size and theStructuralist Perspective: A Review, Critique,and Proposal," Administrative ScienceQuarterly (21), December 1976, pp. 571-597.
Kimberly, J.R. and Evanisko, M.J. "Organiza-tional Innovation: The Influence of Individual,Organizational, and Contextual Factors onHospital Adoption of Technological and Ad-ministrative Innovations," Academy ofManagement Journal (24:4), December 1981,pp. 689-713.
Levinson, E. "The Line Manager and SystemsInduced Organization Changes," Proceedingsof the Twenty First Annual Hawaii International
Conference on System Sciences, 1988, pp.181-190.
Life Office Management Association and ArthurAndersen Report. Changing Horizon for In-surance: Charting A Course for Success,Atlanta, GA, 1984.
Life Office Management Assocation and Till-inghast Report. The New Life InsuranceFinancial Management Structure, Atlanta, GA,1988.
Lind, M.R., Zmud, R.W., and Fischer, W.A."Microcomputer Adoption--The Impact ofOrganizational Size and Structure, Information& Management (16), 1989, pp. 157-162.
Mahajan, V. and Schoeman, M.F. "The Use ofComputers in Hospitals: An Analysis ofAdopters and Nonadopters," Interfaces (7:3),May 1977, pp. 95-107.
Mansfield, E., Rapoport, J., Romeo, A., Villani,E., Wagner, S., and Husic, F. The Productionand Application of New Industrial Technology,W.W. Norton & Company, New York, NY,1977.
Marsh, R.M. and Mannari, Ho "Technology andSize as Determinants of the OrganizationalStructures of Japanese Factories," Ad-ministrative Science Quarterly (26), March1981, pp. 33-57.
McFarlan, F.W., McKenney, J.L., and Pyburn, P."The Information Archipelago-Plotting theCourse," Harvard Business Review (61:1),January-February 1983, pp. 145-156.
Meyer, A. "Adapting to Environmental Jolts," Ad-ministrative Science Quarterly (27), 1982, pp.515-537.
Miles, R. and Snow, C. Organizational Strategy,Structure, and Process, McGraw-Hill, NewYork, NY, 1978.
Miller, D. and Friesen, P.H. Organizations: AQuantum View, Prentice-Hall, EnglewoodCliffs, N J, 1984.
Mintzberg, H. The Structuring of Organizations,Prentice-Hall, Engiewood Cliffs, NJ, 1979.
Mintzberg, H. Mintzberg on Management InsideOur Strange World of Organizations, FreePress, New York, N¥, 1989.
Moch, M.K. and Morse, EoV. "Size, Centraliza-tion and Organizational Adoption of Innova-tions," American Sociological Review (42),1977, pp. 716-725.
Morone, J. "Strategic Use of Technology,"California Management Review (31:4), Sum-mer 1989, pp. 91-110.
MIS Quarterly~September 1991 351
Information Technology Investment Intensity
Osterman, P. "The Impact of Computers onEmployment of Clerks and Managers," In-dustrial and Labor Relations Review (39:2),January 1986, pp. 175-186.
Pfeffer, J. and Leblebici, H. "The Effect of Com-petition on Some Dimensions of Organiza-tional Structure," Social Forces (52),December 1973, pp. 268-279.
Praetz, P. "Returns to Scale in the U.S. Life in-surance Industry," Journal of Risk and In-surance (47:3), 1980, pp. 525-533.
Pugh, D.S., Hickson, D.J., Hinings, C.R., andTurner, C. "The Context of OrganizationStructures," Administrative Science Quarterly(14), 1969, pp. 91-114.
Quinn, J.B. and Gagnon, C.E. "Will ServicesFollow Manufacturing Into Decline?" HarvardBusiness Review (64:6). November-December 1986, pp. 95-105.
Robinson, R.B. Jr., and Pearce, J.A. II. "ProductLife-Cycle Considerations and the Nature ofStrategic Activities in Entrepreneurial Firms,"Journal of Business Venturing (1), 1976, pp.207-224.
Scherer, F.M. Industrial Market Structure andEconomic Performance, Rand McNally,Chicago, IL, 1973.
~teiner, T.D. and Teixeira, D.B. Technology InBanking, Dow Jones Irwin, New York, NY,1990.
Sippel, E.W. "Change and Continuity in Finan-cial Services," California ManagementReview (31:3), 1989, pp. 51-74.
Strassman, P.A. Information Payoff, Free Press,New York, NY, 1985.
Turner, J.A. "Firm Size, Performance, and Com-puter Use," Proceeding of the Third Interna-tional Conference on Information Systems,Ann Arbor, MI, December 1982, pp. 109-120.
Whisler, T.L. "The Impact of InformationTechnology on Organizational Control," inThe Impact of Computers on Management,Charles A. Myers. (ed.), MIT Press, Cam-bridge, MA, 1967.
Whisler, T.L. Information Technology andOrganizational Change, Wadsworth, Belmont,CA. 1970.
Yap, C.S. "Distinguishing Characteristics ofOrganizations Using Computers," Information& Management (18), 1990, pp. 97-107.
Zuboff, S. In the Age of the Smart Machine: TheFuture of Work and Power, Basic Books, NewYork, NY, 1988.
About the Authors
Sidney E. Harris is dean of the Peter F. DruckerGraduate Management Center at the ClaremontGraduate School. He received his B.A. inmathematics from Morehouse College, and bothhis M.S. degree and his Ph.D. degree in opera-tions research from SORIE at Cornell University.He worked for three years at Bell TelephoneLaboratories, where he directed the developmentof marketing decision support systems. Hiscurrent research interests focus on the eco-nomics of investments in information technology,technological innovation and management, andtechnology-based strategies for information-intensive industries. He has consulted widely andis the author of numerous monographs, bookchapters, and papers about information technol-ogy in both practitioner and scholarly journals.He is an associate editor of MIS Quarterly andIEEE Office Knowledge Engineering and is amember of the editorial advisory board forBusiness Forum.
Joseph L. Katz is associate professor of deci-sion sciences at Georgia State University. Hereceived his Ph.D. in quantitative methods fromLouisiana State University in 1978. ProfessorKatz is a professional statistician who specializesin the areas of economic impact analysis anddiscrimination. He has testified as an expertwitness on statistics in litigation on racialdiscrimination in death sentencing and jury selec-tion. He has published articles in ManagementScience, Office Technology and People, Journalof Regional Science, and The AccountingReview.
352 MIS Quarterly/September 1991