Embed Size (px)
Citation preview

The views expressed are those of the author(s) and do not necessarily represent those of the funder, ERSA or the author’s affiliated
institution(s). ERSA shall not be liable to any person for inaccurate information or opinions contained herein.
The effects of technology intensity in
manufacturing on CO2 emissions: Evidence
from developing countries
Elvis Avenyo and Fiona Tregenna
Working paper 846
January 2021
The effects of technology intensity in
manufacturing on CO2 emissions: Evidence
from developing countries∗
Elvis Avenyo†and Fiona Tregenna‡
January 15, 2021
Abstract
Industrialisation is recognised as important for developing countries’growth and ‘catching up’ with advanced economies, but is also associatedwith harmful carbon dioxide (CO2) emissions and hence with climatechange. This poses a challenge to sustainable development, particularlyfor late industrialisers: how to industrialise while also mitigating CO2
emissions. This paper investigates the effect of technology intensity inmanufacturing on CO2 emissions: is high-technology manufacturing lessemitting than medium-technology and, in turn, low-technology manufac-turing? We analyse this for a panel of 56 developing economies overthe period 1991 to 2014, estimated using generalised method of moments(GMM). Methodologically, we adapt and synthesise the environmentalKuznets curve (EKC) and the stochastic effect by regression on popu-lation, affluence and technology (STIRPAT) approaches. We utilise twoalternative measures of emissions: absolute and per capita volumes. Ourresults show that medium- and high-technology manufacturing are as-sociated with higher emissions than low-technology manufacturing. Inrelation to the technology intensity of manufacturing exports, we findhigh-technology manufacturing to be associated with lower emissions thanmedium-technology manufacturing, and in turn low-technology manufac-turing. These findings have important policy implications, suggesting thata shift towards more technology-intensive manufacturing may be a more
∗Funding under the South African Research Chairs Initiative of the Department of Scienceand Technology and National Research Foundation of South Africa (Grant No. 110691),through the Community of Practice in Innovation and Inclusive Industrialisation under theDST/NRF South African Research Chair in Industrial Development, towards this research ishereby acknowledged. We thank Erika Kraemer-Mbula for helpful inputs and Isaiah Magambofor research assistance.
†Technology and Management Centre for Development, Oxford Department of Interna-tional Development, University of Oxford, United Kingdom and DST/NRF South AfricanResearch Chair in Industrial Development, College of Business and Economics, School ofEconomics, University of Johannesburg, South Africa; Email: [email protected]
‡DST/NRF South African Research Chair in Industrial Development, College of Businessand Economics, University of Johannesburg, South Africa; Email: [email protected]
1

environmentally sustainable industrialisation path for developing coun-tries.
Keywords: carbon dioxide (CO2) emissions, industrialisation, man-ufacturing, technology, developing countries
JEL codes: F18, O13, O14, O33, Q01, Q54, Q56
1 Introduction
The manufacturing sector is considered a key engine of growth in the develop-ment process, and a source of job creation, livelihoods and, ultimately, socialwellbeing (Athukorala & Menon, 1996; Chenery, 1955; Haraguchi, Cheng, &Smeets, 2017; Lall, 1999; Szirmai, 2012; Szirmai, Naudé, & Alcorta, 2013; Tre-genna, 2009, 2015, 2016; United Nations Industrial Development Organization[UNIDO], 2016). Industrialisation has been recognised as a key path for devel-oping countries to attain sustained high rates of economic growth and to ‘catchup’ with advanced economies. Structural change — the shift in the compositionof economies from low- to high-productivity activities — is associated specifi-cally with industrialisation. Industrialisation lies at the heart of the economicgrowth and development literature, especially from a structuralist perspective(Blankenburg, Palma, & Tregenna, 2008).
However, industrialisation is also often associated with environmental degra-dation in terms of industrial pollution. Industrialisation may evoke an imageof ‘smokestack industries’, with ‘dirty’ factories releasing dust, smoke, fumes,and toxic gas emissions. Indeed, industrialisation has been identified as oneof the main contributors to anthropogenic emissions of CO2 (Adom, Bekoe,Amuakwa-Mensah, Mensah, & Botchway, 2012; Appiah, Du, Yeboah, & Ap-piah, 2019; Han & Chatterjee, 1997). This is a key issue for consideration, sinceclimate change is now widely recognised as a central problem facing humanity.The importance of the climate problem, and the urgency with which greenhousegas (GHG) emissions need to be mitigated, are highlighted in various interna-tional responses to climate change. The United Nations Framework Conventionon Climate Change (1992) and the Kyoto Protocol (1997), followed by the DohaAgreement (2012) and, more recently, the Paris Agreement (2016), all set outtargets for and commitments from both developed and developing countries toreduce GHG emissions by producing and consuming with lower carbon foot-prints. Anthropogenic emissions of greenhouse gases are generally accepted asthe main cause of climate change (Appiah et al., 2019; Friedlingstein et al., 2010;Li & Lin, 2015; Tang & Tan, 2015), with carbon dioxide (CO2) emissions recog-nised as the major source of global warming (Balogh & Jámbor, 2017; Friedl &Getzner, 2003).
Industrial development, and the mitigation of emissions, are thus dual goalsfor many developing countries, but there can be a degree of tension betweenthese two imperatives. Industrialisation can be considered both a route to eco-nomic growth and catch-up and as a contributor to climate change. This conun-drum is particularly relevant for late industrialisers, since advanced economies
2

did not have to deal with the obligation of reducing emissions during their ownearlier phases of industrialisation.
In this paper, we analyse the extent to which harmful CO2 emissions frommanufacturing are conditional on the degree of technology intensity in manu-facturing. While recent industrial policies in developing countries target andpromote investments in technology-intensive manufacturing industries, there islittle empirical understanding of the environmental impact of low-, medium- andhigh-technology manufacturing industries. We thus compare the extent to whichlow-, medium- and high-tech manufacturing are CO2-emitting in developing andemerging economies, considering both the technology intensity of manufactur-ing value added and exports. The analysis covers 56 developing and emerg-ing countries over the period 1991 to 2014, using a panel dataset constructedfrom World Bank and UNIDO data and using generalised method of moments(GMM) estimation. We utilise two alternative measures of CO2 emissions, viz.CO2 emissions in kilotons and CO2 emissions in metric tons per capita.
Technology-intensive manufacturing activities generally take place in medium-and high-technology (MHT) industries that typically are reliant on advanced sci-entific and technological expertise, and high R&D expenditure (Seyoum, 2004)and are often considered ‘cleaner’ than traditional heavy industries based onprocessing resources. In this paper, the classification of activities by technol-ogy intensity is based on their sectoral classification following the classifica-tion of the Organisation for Economic Co-operation and Development (OECD)(2003) (see Table A.1). That is, certain sub-sectors of manufacturing are clas-sified as low-technology (e.g. food products, beverages, and tobacco), othersas medium-technology (e.g. electrical machinery and apparatus) and others ashigh-technology (e.g. pharmaceuticals).
Our baseline empirical results indicate a concave positive relationship be-tween manufacturing value added as a share of GDP and CO2 emissions. Wepresent two sets of results concerning the effects of technology intensity inmanufacturing on emissions. Firstly, in terms of manufacturing value added,medium- and high-tech manufacturing have a convex negative relationship withCO2 emissions, in contrast with the concave positive relationship between low-tech manufacturing value added and CO2 emissions. Secondly, for manufactur-ing exports, where data allows us to separate medium- and high-tech manu-facturing, we find a convex negative relationship between both of these andCO2 emissions, but with medium-tech manufacturing exports associated withhigher emissions than high-tech manufacturing exports. In contrast, low-techmanufacturing exports have a convex positive relationship with CO2 emissions.These findings suggest that technology intensity does matter for CO2 emissions.
Our primary contribution to the literature is thus in the new evidence forhow technology intensity in manufacturing affects CO2 emissions. The papermakes two secondary contributions to the literature. Firstly, we add to the lim-ited evidence for the relationship between industrial development (specificallymanufacturing, rather than industry as a whole) and emissions in developing andemerging economies. Not only are there empirical dimensions specific to devel-oping countries, but this evidence has particular policy implications. Secondly,
3

the paper makes a methodological contribution by adapting and synthesisingthe environmental Kuznets curve (EKC) and the stochastic impact by regres-sion on population, affluence, and technology (STIRPAT) models, rather thanutilising just one of these approaches.
The rest of the paper is structured as follows. The relevant literature isreviewed in Section 2. Section 3 presents our model, estimation methodology,and data. The results are presented in Section 4, while Section 5 discusses thefindings and concludes.
2 Literature review
We begin in Section 2.1 by reviewing the broad literature on the effects of indus-trialisation on climate change, including emerging discourse on the possibilitiesof a green industrialisation path. Next, in Section 2.2, we discuss empiricalstudies on country-level determinants of CO2 emissions, in particular the evi-dence for industrialisation as a determinant of emissions. In the third part ofthe literature review, Section 2.3, we consider the key literature on technologyintensity, in particular as it relates to industrial development and the mitigationof climate change.
2.1 Industrialisation, industrial policy, and CO2 emissions
Industrialisation and climate change
There is now a growing body of interdisciplinary literature on the effect ofhuman activities on global warming. While industrialisation is important as asource of sustained increases in productivity and economic growth, it has alsobeen identified as a major driver of anthropogenic emissions (Barca & Bridge,2015; Zhang, 2012). Evidence associating industrialisation with environmentaldegradation and carbon emissions has raised concerns about the possibility ofachieving sustainable development under paths involving heavy industrialisa-tion.
This literature shows that the stimulating effect of industrialisation on CO2emissions occurs mainly at lower stages of industrialisation, and that this ef-fect diminishes at more advanced stages of industrialisation where productionand consumption tend to be much cleaner and energy-efficient (the so-calledinverted U-shaped relationship) (see, among others, Appiah et al., 2019; Balogh& Jámbor, 2017; Li & Lin, 2015; Liu & Bae, 2018; Timmons Roberts & Grimes,1997).
Green industrial policy
An emerging approach recognises the dual importance of industrialisationand the need to mitigate emissions (and environmental damage more broadly)(see, for instance, Altenburg & Rodrik, 2017; Rodrik, 2014). Hence, there is agrowing push towards industrial development that, while generating productiv-ity growth and jobs, particularly in developing countries, is also environmentally
4

sustainable — the so-called ‘dual challenge’ (Altenburg & Rodrik, 2017; Fischer,2016).
Connected to this is the recognition that ‘green industrial policy’ could fosterthe transformation of production processes through the use of greener technolo-gies and methods, thereby encouraging sustainable industrialisation pathways(Harrison, Martin, & Nataraj, 2017; Matsuo & Schmidt, 2019; Okereke et al.,2019; Pollin, 2020; Rodrik, 2014). Green industrial policy has been consid-ered an essential tool to reduce greenhouse emissions by compensating for thepositive global externalities from green goods and building on the economic op-portunities generated by the production and consumption of green technologies(Fischer, 2016).
In the face of pressing development challenges, green industrial policy offersemerging and low-income countries enormous opportunities to industrialise sus-tainably and to create jobs and economic prosperity (Harrison et al., 2017; Kemp& Never, 2017). Given that environmental losses are global and irreversible be-yond a certain limit, and that developing countries are more vulnerable to theimmediate effects of climate change, there arguably is a more urgent need forpolicy aimed at abating the climate problem in developing countries (Padilla,2017). Understanding how de-carbonising industrialisation through technologi-cal progress affects CO2 emissions may be essential for green industrial policyand sustainable industrialisation pathways.
2.2 Empirical evidence of country-level determinants of
CO2 emissions
Here, we review the existing econometric evidence for the determinants of CO2emissions, with particular attention to the effects of industrialisation on emis-sions. After providing a general overview of econometric approaches, we reviewbodies of literature that use different econometric methods with a focus on theempirical findings.
Overview of key econometric approaches
From a methodological point of view, two main approaches are widely em-ployed to analyse the determinants of CO2 emissions: the EKCmodel/hypothesis(see, for example, Friedl & Getzner, 2003), and the stochastic impact by regres-sion on population, affluence and technology (STIRPAT) method (Dietz & Rosa,1997). The STIRPAT approach1 (Dietz & Rosa, 1997), developed on the basisof the impact on population, affluence, and technology (IPAT) method (Ehrlich& Holdren, 1971), is the most widely used approach in the industrialisation-CO2emissions literature (Appiah, Du, Musah, & Afriyie, 2017; Li & Lin, 2015; Liu& Bae, 2018; Raheem & Ogebe, 2017; Xu & Lin, 2015, 2017; Yassin & Aralas,2019; Zhu, Liu, Tian, Wang, & Zhang, 2017).
The STIRPAT method
In an implementation of the STIRPAT method using a non-parametric addi-tive regression model and provincial panel data from China, Xu and Lin (2015)
1See Li and Lin (2015) for an overview of the literature applying the STIRPAT model.
5
find a U-shaped relationship between CO2 emissions and industrialisation. Thissuggests that lower levels of industrialisation are associated with lower CO2emissions, while higher levels of industrialisation raise CO2 emissions. Sim-ilarly, Liu and Bae (2018), using the autoregressive distributed lag (ARDL)and vector error-correction model (VECM), also find industrialisation (shareof industrial value added in GDP) to be positively related to CO2 emissionsin China. Other studies that find similar results in other developing regionsinclude those by Appiah et al. (2019) and Lin, Omoju, and Okonkwo (2015).Using the ARDL approach, Appiah et al. (2019) find that, in the long run,industrialisation increased CO2 emissions in Uganda.
Related studies have found that the relationship between CO2 emissions andindustrialisation varies across development stages. For example, using differentestimation methods, including the dynamic panel threshold panel model, for 73countries between 1971 and 2010, Li and Lin (2015) find that industrialisation,measured as the ratio of secondary to primary industry, has different effectson CO2 emissions at different stages of economic development. The resultsof Poumanyvong and Kaneko (2010), based on pooled data for 99 countries,corroborate Li and Lin’s (2015) finding that the development stage matters inthe relationship between CO2 emissions and industrialisation. Analysing therelationship between CO2, urbanisation, and industrialisation for 20 Africaneconomies, Raheem and Ogebe (2016) find that, in the long run, industrialisa-tion leads to lower CO2 emissions through the income mechanism. That is, ascountries become wealthier, they pollute less and clean better through extensiveinvestment in efficient production and consumption systems.
The EKC approach
The EKC hypothesis strand of the literature mainly examines the relation-ship between CO2 emissions and countries’ levels of economic development (typ-ically measured in GDP per capita and its square), alongside other explanatoryvariables. Generally, the results from this body of literature point to an inverted-U relationship between economic development and CO2 emissions. This suggeststhat, as a stylised fact, levels of CO2 emissions generally rise as countries be-come more developed, but this is at decreasing rates and they even level off anddecline at higher levels of economic development (Adom et al., 2012; Balogh &Jámbor, 2017; De Souza, Freire, & Pires, 2018; Friedl & Getzner, 2003; Xu &Lin, 2015).
Testing the industrialisation-CO2 emissions nexus with the EKCmodel usingGMM and 24-year panel data from 168 countries, Balogh and Jámbor (2017)find an inverted-U relationship between industry as a share of countries’ GDPand CO2 emissions. This evidence is supported by other empirical studies.Using time-series data for Ghana, Senegal, and Morocco from 1971 to 2007,Adom et al. (2012) find a positive relationship between industrial structure andCO2 emissions across all three countries. Xu and Lin (2015) also confirm theEKC hypothesis for the case of China.
Analysis of the tertiarisation effect
Some studies decompose the structure of the economy, from agriculture tomanufacturing and service sectors, to determine their different impacts on CO2
6

emissions (see, for example, Kijima, Nishide, & Ohyama, 2010). The maintheoretical argument is that the shrinking of the share of the manufacturingsector, and the concomitant expansion of the service sector (tertiarisation), willlead to a reduction in carbon emissions (Marsiglio, Ansuategi, & Gallastegui,2016; Minx et al., 2011).
Several empirical studies confirm the tertiarisation effect in lowering CO2emissions. Using the STIRPAT analytical framework and dynamic commoncorrelated effects (DCCE) estimation method, Yassin and Aralas (2019) examinethe relationship between deindustrialisation, tertiarisation, and CO2 emissionsin Asian countries for the period 2012 to 2015, finding that deindustrialisationreduces CO2 emissions. This result is in line with Zhang, Liu, Zhang, and Tan(2014) and Zhu et al. (2017), who find that structural change in the sense of therelative growth of the services (tertiary) sector curbs CO2 emissions. In contrast,Friedl and Getzner (2003) find that tertiarisation of the Austrian economy hashad negative but insignificant effects on CO2 emissions.
Concluding remarks on econometric approaches
Overall, there is extensive literature that tests both the EKC and STIRPATmodels. However, both strands of the literature analyse the effect of industrial-isation on CO2 emissions only partially and do not control for all key variables.
In the first step in our empirical analysis, we adapt both the EKC andSTIRPAT models to examine the relationship between industrialisation andCO2 emissions in developing economies. In doing so, we use a modified formcombining insights from both the EKC and STIRPAT strands of the literature,and with the inclusion of additional covariates.
Furthermore, we examine the specific effect of manufacturing activity disag-gregated by technology intensity on emissions, instead of using industry valueadded as a percentage of GDP (see, for example, Balogh & Jámbor, 2017; Liu& Bae, 2017; Xu & Lin, 2015) and/or industrial structure (see, for example,Adom et al., 2012). While the available proxies of industrial activity are in-formative, industry value added as a percentage of GDP, for instance, is animprecise measure as it also includes mining, construction, and utilities. Ourproxies of industrial activity disaggregated by technology intensity provide amore granular understanding of the effect of manufacturing on CO2 emissions.
2.3 Technology intensity
The importance of technology intensity and technological upgrading
Technological progress is at the core of industrialisation (Lall, 1992; Rodrik,2014; Zhang, 2012). Technological upgrading, and in particular the transitionfrom low- to medium- and high-technology manufacturing, is seen as importantfor developing countries to enhance their competitiveness, develop their capa-bilities in products for which there is relative growth in global demand, andattain sustained structural transformation and economic growth (see, for exam-ple, UNIDO, 2016). ‘Keeping pace’ with technological change and innovationis important for countries to avoid a ‘middle-income technology trap’, and amiddle-income trap more broadly (Andreoni & Tregenna, 2020).
7
Medium- and high-tech (MHT) manufacturing industries are often at thefrontier of technological progress and represent a source of spillover effects andlinkages. MHT manufacturing industries produce complex products that havebeen identified as ‘growth catalysts’, particularly through the enhancement ofindustrial competitiveness, technological deepening and upgrading, investmentin research and development (R&D), and innovation activities (Hobday, 2013).These features have the potential to boost economic performance in the broadereconomy through backward and forward linkages to other sectors, as well asassociated positive externalities.
Technology-intensive manufacturing therefore has important implications fora country’s industrial value creation and addition, product diversification andsophistication, and the pushing of a country’s technological frontier. Moreover,there is extensive evidence that high-technology-intensive ?rms are typicallymore innovative, more ef?cient, pay higher wages, and are more successful thanlow-technology-intensive ?rms (Hatzigeorgiou, Polatidis, & Haralambopoulos,2011; Montobbio & Rampa, 2005). MHT exports also tend to have highercompetitive power in international commerce through efficiency in productionand resource distribution, leading to an increase in market size (associated withease of entry into new markets) and an increase in foreign investment (Fuchs& Kirchain, 2010; Pisano & Shih, 2012; Tassey, 2010). Furthermore, MHTmanufacturing industries do not follow the same path of deindustrialisationas do low-tech manufacturing industries (Tregenna & Andreoni, 2020). Thus,enhancing the technological content of exports has been recognised as importantin the industrialisation strategies and industrial policies of developing countries(UNIDO, 2005).
Technology intensity and the green transition
Of particular relevance here is the role of MHT manufacturing industries inde-carbonising industrialisation. MHT are generally characterised by advancedscientific and technological expertise and high R&D expenditure (Seyoum, 2004)that could stimulate and enable the global economy to produce and consumesustainably. With an understanding that technology-intensive manufacturing iscentral to the aspirations of the green economy and has the potential to drivesustainable economic prosperity, industrial policies in developing countries areincreasingly being re-oriented towards the promotion of technology-intensivemachinery and the sustainable production of complex and sophisticated prod-ucts.
Developing countries may be able to de-carbonise industrialisation and growsustainably through green technological progress (Altenburg & Assmann, 2017;Altenburg & Rodrik, 2017; Harrison et al., 2017; Nakicenovic, Kolp, Riahi,Kainuma, & Hanaoka, 2006; Zhang, 2012). Green technologies are relevant forsustainable economic growth paths (Pasche, 2002; Rodrik, 2014).
MHT manufacturing industries therefore have the potential to drive low-carbon industrialisation pathways in developing economies. MHT industriesgenerally may be greener and could be associated with lower CO2 emissions com-pared to low-tech manufacturing. Furthermore, high-technology-intensive man-ufacturing industries are expected to be less polluting than medium-technology-
8
intensive manufacturing industries.However, there is little empirical evidence concerning the relationship be-
tween the technology intensity of manufacturing industries and their effect onCO2 emissions, especially in developing economies. Our paper makes a keycontribution to the literature by estimating and comparing the extent to whichlow-, medium- and high-tech manufacturing are CO2-emitting in developing andemerging economies, considering the technology intensity of both manufacturingvalue added and exports.
3 Methodology and data
3.1 Empirical strategy
Model and specifications
In this section, we present and discuss the empirical method and data em-ployed in this paper. As noted, our empirical model is a modification of theEKC and STIRPAT models. The adaption of these models commonly used inthe existing literature on growth, industrialisation, and emissions enables us touniquely introduce and examine key variables. These are both the covariates(such as fossil fuel energy consumption and the relative size of the service sector)and, more importantly, our main variables of interest (low-tech and combinedmedium- and high-tech shares in manufacturing value added, and low-, medium-and high-tech shares in manufacturing exports).
Following Balogh and Jámbor (2017), Friedl and Getzner (2003), and Xuand Lin (2015), we specify our general empirical model as:
lnCO2it = f(lnCO2it−1, lnGDP it, MAN it, Zit) (1)
Based on the general model in equation (1), our basic model is specified as:
lnCO2it = γ1+γ2lnCO2it−1+γ3lnGDP it+γ4lnGDP2
it+γ5MAN it
+γ6MAN2
it+γ
7Zit+εit, (2)
where lnCO2it refers to CO2 emissions in country i in year t, while lnCO2it−1 capturesits lag, both in natural logarithm. Two main measures of CO2 emissions areused in the empirical literature: CO2 emissions per capita (Balogh & Jámbor,2017; De Souza et al., 2018; Liu & Bae, 2017; Raheem & Ogebe, 2016; Xu &Lin, 2015) and total CO2 emissions (Friedl & Getzner, 2003). Both of thesemeasures of emissions are relevant in different ways — analytically and for pol-icy — and we present estimation results for both, which also helps to test therobustness of our results. εit is a standard error term.
In our extended models that investigate the effects of technology intensity inmanufacturing on CO2 emissions, we replace the overall manufacturing variables(in linear and quadratic form) in our baseline specification with the shares ofdifferent categories of manufacturing by technology intensity. Firstly, for the
9

composition of manufacturing value added, we compare low-tech manufacturingwith combined medium- and high-tech manufacturing. These are formulated as:
lnCO2it = γ8+γ9lnCO2it−1+γ10lnGDP it+γ11lnGDP2
it+γ12MHTM it
+γ13MHT2
it+γ14Zit+u1it (3i)
lnCO2it = γ15+γ16lnCO2it−1+γ17lnGDP it+γ18lnGDP2
it+γ19LTM it
+γ20LT2
it+γ21Zit+u2it (3ii)
Secondly, for the composition of manufacturing exports, the data allows us toseparately estimate and compare low-, medium- and high-tech manufacturing.
lnCO2it = γ22+γ23lnCO2it−1+γ24lnGDP it+γ25lnGDP2
it+γ26LTEit
+γ27LT 2
it+γ
28Zit+u3it (4i)
lnCO2it = γ29+γ
30lnCO2it−1+γ31lnGDP it+γ32lnGDP
2
it+γ
33MTEit
+γ34MT2
it+γ35Zit+u4it (4ii)
lnCO2it = γ36+γ37lnCO2it−1+γ38lnGDP it+γ39lnGDP2
it+γ40HTEit
+γ41HT2
it+γ42Zit+u5it, (4iii)
where MHTM and LTM refer to medium-high-technology manufacturing andlow-technology manufacturing in country i in year t, respectively. LTE, MTEand HTE represent low-, medium- and high-technology exports in country i inyear t, respectively. u1it...u5it are the standard, independently distributed errorterms.lnGDP it and lnGDP
2
itmeasure the log of GDP per capita in constant 2011US$ and its squared term in country i in year t, respectively, in line with boththe EKC (see, for instance, Friedl & Getzner, 2003) and the STIRPAT (see, forinstance, Xu & Lin, 2015) models. MAN it refers to manufacturing value addedas a percentage of GDP in country i in year t.Zit is a vector of other exogenous variables identified from the EKC and
STIRPAT literature, as listed in Table 1. Energy use is considered a majordriver of CO2 emissions (Xu & Lin, 2015), and the use of renewable energysources is recognised as a critical avenue to reduce emissions sustainably (Liu& Bae, 2017). We include renewable energy consumption (De Souza et al.,2018; Liu & Bae, 2017) and fossil fuel energy consumption (De Souza et al.,2018) to capture the separate effects of renewable energy and fossil fuel energyconsumption on emissions. We expect lower use of renewable energy and higherfossil fuel energy consumption to be associated with higher CO2 emissions.
Developing countries are typically characterised by rapid urbanisation (Li &Lin, 2015). The rapid growth of cities leads to the rapid growth of transportsystems, the construction of drainage systems, and changes in land use, leadingto environmental pollution and higher CO2 emissions. In other words, urban
10

areas are ‘emission-intensive’, as argued by Xu and Lin (2015). We thereforecontrol for urbanisation (De Souza et al., 2018; Liu & Bae, 2017; Xu & Lin,2015), expecting a positive relationship between urbanisation and emissions.
The service sector accounts for the largest share of GDP in most developingcountries. Services activities are generally less energy-intensive than industry.We control for the share of service sector value added as a share of GDP tomeasure the tertiarisation of the economy (Yassin & Aralas, 2019). It is expectedthat a shift from industrial activity to service-based activities will lead to loweremissions.
We further introduce a proxy for trade (trade percentage of GDP) to captureopenness (Balogh & Jámbor, 2017; Bento, 2014; De Souza et al., 2018). Theglobal opening up of trade has led to increasing pressure to meet internationalstandards, particularly on goods coming from developing countries. We expecthigher trade openness to lead to higher adherence to international climate pro-tocols, thereby leading to lower CO2 emissions, in line with De Souza et al.(2018).
Finally, we include a covariate for domestic credit as an indicator of coun-tries’ levels of financial development (De Souza et al., 2018). While the effectson emissions are likely to be ambiguous, more developed financial sectors andgreater financial depth could provide easier access to cheaper private credit andloans, which may lead to greener energy use and lifestyles. εit is the idiosyncraticerror term.
Estimation
To estimate our models, we utilise Arellano and Bond’s (1991) dynamic paneldata estimation method, using the two-step GMM estimator to enhance the pre-cision of the estimates and also to reduce the bias identified in finite panels witha short time period (T) and large N (Blundell & Bond, 1998; Blundell, Bond, &Windmeijer, 2000). Biased two-step GMM standard errors are corrected for byreporting Windmeijer (2005) robust standard errors. We also report the orderautoregression to test the serial correlation between error terms.
Given the existing evidence suggesting that economic development has a non-linear relationship with CO2 emissions, we include quadratic terms in our basicand extended models to explore the non-linearity of the relationships betweenour manufacturing variables and emissions.
3.2 Data
Table 1 presents the descriptive statistics and data sources of our key vari-ables. The dataset employed for the analysis in this paper is built from twomain sources. All data, apart from that on the disaggregation of manufacturingvalue added by technology intensity, was sourced from the World Bank’s WorldDevelopment Indicators (WDI).2
Data on manufacturing value added by level of technology intensity (thevariables ‘Medium- and high-tech VA’ and ‘Low-tech VA’) was obtained from
2https://datacatalog.worldbank.org/dataset/world-development-indicators
11
the United Nations Industrial Development Organization (UNIDO) CompetitiveIndustrial Performance (CIP) database.3 This database classi?es manufacturingsectors into four technology levels — low, medium-low, medium-high and high— following the OECD (2003). These levels are consolidated here into threecategories: low-, medium-, and high-technology. See Table A.1 in the Appendixfor the OECD classification of industries according to their degree of technologyintensity.4 This categorisation of manufacturing by technology intensity is basedon the sectors of manufacturing, as set out in Table A.1. As such, no compositemeasure of the technology intensity of manufacturing as a whole is used here.Rather, we separately analyse the association between different categories ofmanufacturing by technology intensity, and CO2 emissions.
The UNIDO CIP covers 150 countries over the period 1990 to 2016. Thisserves as the parent database to determine the number of countries and periodsin our analysis. That is, the length of our panel is based primarily on the avail-ability of data, with variables such as renewable energy consumption availableonly from 1990. Furthermore, we dropped countries with very short periods ofdata coverage.
Our final dataset covers 56 developing and emerging economies (listed inTable A.2 in the Appendix) over the period 1991 to 2014. Country selectionis based on the IMF classification of ‘emerging and developing countries’ and‘low-income developing countries’, and data availability. Geographically, ourfinal country sample includes 13 countries from Africa, 16 from Latin Amer-ica and the Caribbean, eight from Eastern Europe and Central Asia, and 18from Asia (excluding Central Asia). By levels of industrialisation based on theUNIDO classification (Upadhyaya, 2013), we have two industrialised countries,21 emerging industrial economies (EIEs), 24 other developing countries (ODEs),and nine least developed countries (LDCs). On average, our sample countriesgenerated about 237 494 kilotons (kt) of CO2 emissions in the period under re-view. In per capita terms, our data shows that the developing countries in oursample generated about 2.9 metric tonnes (mt) of CO2 emissions per capita,with values ranging between 0.017 and 19.529.
In terms of MHT indicators, the data for our sample shows that, on average,about 22% of total manufacturing value added comes from medium- and high-tech industries, which is lower than that of advanced industrialised nationssuch as the United States of America (USA) (49%) and Germany (62%) in2014. Similarly, exports of medium- and high-tech manufacturing account forabout 28% of total manufactured exports for our sample countries on average,significantly less than in industrialised countries such as the USA (62%) andGermany (73%) in 2014. This shows that MHT industries are less developed
3https://stat.unido.org/cip/4 It is important to recognise that there is considerable heterogeneity in technology intensity
within each of the categories of low-, medium- and high-tech manufacturing. For instance,some activities within ‘food products, beverages and tobacco’ (which is classified as a low-techsector of manufacturing) are more technology intensive than some activities within ‘chemicalsexcluding pharmaceuticals’ (classified as medium-tech). See Lall (2000) and Pavitt (1984) forother commonly used technology classifications in the literature.
12
and play a less significant role among our sampled countries; the industrialstructure of the developing countries under consideration is dominated largelyby low-technology industries.
For other key explanatory variables, our data shows that about 37% of totalenergy consumption on average comes from renewable energy for our countrysample, while the remaining 63% comes from fossil fuels. Fossil fuels thereforedominate the energy mix of the sampled developing countries. On average, theservice sector contributes about half of total value added. Our data also showsthat about 24% of the total population in the sampled countries lives in urbanareas.
Figure 1 shows the evolution of CO2 emissions (using both our measuresof emissions) over time for selected countries in our sample. China producesby far the largest absolute volume of emissions (Figure 1a) as a function of itslarge population size and high levels of emissions-intensive production. Indiaovertook Russia as the second-highest emitter in absolute volumes, followed bySouth Africa and Brazil, with very low volumes from the other countries depictedhere. A different picture emerges for CO2 emissions per capita (Figure 1b), withChina ranked third (following Russia and South Africa) for the countries shownhere, having overtaken Argentina by 2005. As would be expected, low- andlower-middle-income countries (Ethiopia, Nigeria, India, and Vietnam) havethe lowest emissions per capita of those presented here.
4 Results
First, we present baseline estimations of the overall effects of manufacturingon CO2 emissions, using both linear and quadratic specifications (Table 2).Second, we examine the relationship between technology intensity in manu-facturing value added and CO2 emissions, comparing combined medium- andhigh-tech manufacturing with low-tech manufacturing (shares in total manu-facturing value added) (Table 3). Third, we analyse the relationship betweentechnology intensity in manufacturing exports and CO2 emissions; here, thedata allows us to separately compare high-, medium- and low-tech manufactur-ing (shares in total manufacturing exports) (Table 4). These second and thirdsets of results shed light on our central research question: how does technologyintensity in manufacturing affect the relationship between industrialisation andCO2 emissions?
All regressions are run with the same set of covariates and for a uniform sam-ple of developing countries (as discussed in Section 3; see also Table A.2 in theAppendix for the full sample country list), using the Arellano and Bond (1991)dynamic panel two-step GMM estimator. In all cases, results are presentedusing both our measures of CO2 emissions as alternative dependent variables.
13

4.1 Baseline estimations: effect of manufacturing on CO2
emissions
Table 2 shows the estimation results from our basic model where we regress CO2emissions on manufacturing value added (% of GDP) and relevant covariates.Columns 1 and 3 present the linear models, while columns 2 and 4 show theresults for the quadratic models, which are our preferred specifications. Resultsare shown for both measures of CO2 emissions: in kilotons (columns 1 and 2)and in metric tons per capita (columns 3 and 4).
The share of manufacturing in total value added (‘Manufacturing VA’) hasa significant positive effect on CO2 emissions (kilotons) (column 1), with thecoefficient becoming larger and even more significant in the quadratic specifi-cation (column 2). The square of manufacturing value added is negative andstatistically significant. This indicates a concave positive relationship betweenCO2 emissions (measured in kilotons) and manufacturing value added (% ofGDP). This is consistent with the results of scholars such as Balogh and Jám-bor (2017), De Souza et al. (2018), Friedl and Getzner (2003), and Xu and Lin(2015).
The overall positive relationship between the share of manufacturing in GDPand CO2 emissions is as expected, and confirms that industrialisation is associ-ated with higher emissions. The non-linearity in this relationship indicates thatemissions fall at a decreasing rate with more industrialisation. This flatteningout of the curve may be due to efficiency gains as a result of investment inenergy-saving technologies and production processes, energy-saving transportsystems, and strict environmental policies at advanced stages of manufacturing,thereby mitigating CO2 emissions. These emissions-mitigating innovations maybe uneconomical in the early stages of industrialisation, leading to the use ofold technologies in the production of energy-intensive products that generatehigher levels of CO2 emissions. Using CO2 emissions measured in metric tonsper capita as the dependent variable, the signs of the estimated coefficientsare the same as with CO2 emissions in kilotons, but are no longer statisticallysignificant; we explore this further in our extended models.
CO2 emissions are found to be path dependent, with lagged CO2 emissionshaving a significant positive effect on current CO2 emissions (see all columnsin Table 2). The results regarding covariates are consistent with the existingliterature. The estimation results from the quadratic models (columns 2 and 4of Table 2) show an inverted-U relationship between CO2 emissions and GDPper capita. Even though our sample is of developing countries, this result isconsistent with the EKC hypothesis literature, which finds that countries inthe early stages of development tend to have higher CO2 emissions, but thesehigh emission levels eventually fall at higher levels of development (Balogh &Jámbor, 2017; De Souza et al., 2018; Xu & Lin, 2015). This finding may be dueto the fact that our study analyses developing countries. Our estimation resultsreported across all columns of Table 2 indicate that services value added as apercentage of GDP has a significantly negative effect on CO2 emissions. Thisconfirms the ‘tertiarisation effect’ hypothesis, namely that an increasing share
14

of services in GDP mitigates CO2 emissions, in line with Yassin and Aralas(2019) and other studies. This may be because the service sector is less energyintensive than are the primary and secondary sectors.
Further, we find that the higher the share of fossil fuel energy consumptionin a country’s total energy mix, the higher the CO2 emissions, in line withDe Souza et al. (2018). Our results from the baseline regressions suggest thatrenewable energy consumption as a percentage of final energy consumption has anegative but mostly insignificant effect on CO2 emissions in the countries understudy. While perhaps surprising, this may due to the small to negligible shareof renewable energy consumption on average (about 37%) in the total energymix of our country sample. As a result, the clean effect of renewable energymay not yet be translating directly into a reduction in CO2 emissions in oursampled developing countries. A similar study on China by Liu and Bae (2017)also found renewable energy to have no significant effect on CO2 emissions.
While domestic credit provided by the financial sector as a percentage ofGDP is found to have the expected sign, it is only significant in the case ofCO2 emissions (kilotons), suggesting that developing countries with a developedfinancial sector produce less CO2 emissions per kiloton. Trade and urbanisationare insignificant across the different specifications in our baseline regressions.
4.2 Effect of technology intensity in manufacturing on CO2
emissions
Next, we explore how technology intensity in manufacturing affects CO2 emis-sions in developing countries. In this, we first consider the relationship betweenthe technology intensity of manufacturing value added and CO2 emissions. Weseparately analyse the effects of the share of low-tech manufacturing in totalmanufacturing value added, and the combined share of medium- and high-techmanufacturing in total manufacturing value added, on CO2 emissions. Second,we focus on how the technology intensity of manufacturing exports affects CO2emissions. In this respect, the data allows us to separately analyse the effectsof low-, medium- and high-tech manufacturing exports on CO2 emissions.
Table 3 shows our results for the technology intensity of manufacturingvalue added. The results for combined medium- and high-tech manufactur-ing (‘Medium- and high-tech VA’) in columns 1 and 2 can be compared withthose for low-tech manufacturing (‘Low-tech VA’) in columns 3 and 4. Again,we use two alternative measures of emissions as dependent variables: kilotons(columns 1 and 3) and metric tons per capita (columns 2 and 4).
The results are generally consistent across all specifications. Medium- andhigh-tech manufacturing have a significant negative coefficient on the linear termand a significant positive coefficient on the quadratic term for both measuresof emissions. This suggests a convex negative relationship. That is, a risingshare of MHT in manufacturing value added is associated with falling emis-sions, flattening out at higher shares of MHT in total manufacturing. In sharpcontrast, the share of low-technology value added in manufacturing has a signifi-cant positive effect on CO2 emissions (columns 3 and 4), with this positive effect
15
diminishing at higher shares of low-tech in manufacturing value added (i.e., aconcave positive relationship). These differences can be understood in termsof the types of activities classified within each of low-, medium- and high-techmanufacturing (see Table A.1), which vary considerably in how polluting theyare.
These results indicate that technology intensity in manufacturing does mat-ter for CO2 emissions. Whereas higher shares of low-tech manufacturing are as-sociated with higher (at a diminishing rate) emissions, higher shares of medium-and high-tech manufacturing are associated with lower (at a diminishing rate)emissions. Importantly, this implies that technology intensity in manufacturingin developing countries is associated with lower CO2 emissions.
The results for the covariates are generally consistent with our baseline re-gressions, but stronger here. In particular, renewable energy, trade, domesticcredit, and urbanisation are now generally significant across specifications inTable 3, as well as having the expected signs.
Next, we focus on the effect of technology intensity in manufacturing exportson CO2 emissions. Table 4 compares the results for the shares of high-tech(columns 1 and 2), medium-tech (columns 3 and 4) and low-tech (columns 5and 6) manufacturing exports in total manufacturing exports. As previously,these are shown for both measures of CO2 emissions as alternative dependentvariables.
Again, our results show technology intensity in manufacturing to be associ-ated with lower CO2 emissions. The patterns are even clearer here, as we areable to run separate regressions for medium- and high-tech manufacturing inthe case of exports and compare both to low-tech manufacturing. For low-techmanufacturing exports, both the linear and squared terms are positive (columns5 and 6 of Table 4), indicating that higher shares of low-tech manufacturing intotal manufacturing exports are associated with higher emissions, and at an in-creasing rate (convex positive). In direct contrast, for both high-tech (columns1 and 2) and medium-tech (columns 3 and 4) manufacturing exports, the linearcoefficient is negative and the quadratic coefficient is positive (convex negative),consistent with the results for manufacturing value added in Table 3.
Of additional interest here is the difference between high- and medium-techmanufacturing exports: high-tech manufacturing is associated with lower emis-sions than is medium-tech manufacturing. This underscores that emissions areconditional on technology intensity in manufacturing across all categories oftechnology intensity. This is intuitive when comparing the types of industriesclassified as high-tech (e.g. ‘medical, precision and optical instruments’ and‘electronics components’) with those classified as medium-tech (e.g. ‘rubber andplastics products’ and ‘basic metals and fabricated metal products’). A greaterorientation to exporting sophisticated and advanced technology-intensive man-ufactures is more environmentally friendly and leads to lower levels of pollution.
We ran two sets of supplementary regressions as robustness checks. Firstly,we re-estimated all regressions using fixed and random effects. Secondly, we re-estimated all ten of our regressions concerned with the technology intensity ofmanufacturing (as presented in Tables 3 and 4) with the shares of manufacturing
16
technology categories in GDP and in total exports. That is, we ran robustnesschecks for the estimations in Table 3, with the explanatory variables of interestas the shares of medium- and high-tech manufacturing value added in GDP(instead of in total manufacturing value added). For the estimations in Table4, our robustness check had each of the shares of medium- and high-tech manu-facturing exports in total exports (instead of in total manufacturing exports) asthe explanatory variables of interest. All these robustness checks yielded resultsthat are broadly consistent with and supportive of our main results.5
5 Discussion and conclusions
In developing countries, there is growing recognition of the need to re-orientindustrial production processes and structures towards technology-based man-ufacturing industries and to accelerate their technological upgrading in orderto add value and produce ‘complex’ products, but also to integrate into andbenefit from global value chains, international trade, and rapid globalisation.
Beyond the importance of technological upgrading for industrial develop-ment and growth, could it also be relevant in mitigating CO2 emissions frommanufacturing? While there is an established body of evidence showing a pos-itive relationship between industrialisation and emissions, there is a dearth ofevidence for how this relationship may be conditional on technology intensityin manufacturing. In an era of rapid technological development, along with theurgent need for sustainable modes of production, it becomes particularly impor-tant to explore the nexus between technology intensity, industrialisation, andCO2 emissions. This is of particular interest to developing economies as theystrive to catch up and to improve the well-being of their citizenry. In this study,we consider the technology intensity of manufacturing in terms of the OECD(2003) classification of sub-sectors of manufacturing into the categories of low,medium or high technology.
Using the GMM two-step estimator, we undertook an analysis of 56 devel-oping countries between 1991 and 2014. Our baseline results confirm a concavepositive relationship between manufacturing value added and CO2 emissions(kt). The non-linearity of this relationship indicates that the positive rela-tionship between industrialisation and emissions diminishes at higher levels ofindustrialisation.
One way in which our analysis contributes to the broad empirical literatureon the relationship between industrialisation and CO2 emissions is by analysingmanufacturing specifically (instead of industry in general, which includes min-ing, construction, and utilities). We also add to the limited literature on de-veloping and emerging economies; this is especially important in the light ofthe challenges of late industrialisation in the context of the need to mitigateclimate change. We also make a methodological contribution by adapting and
5Results from the robustness tests are not shown for reasons of space, but are availablefrom the authors on request.
17

synthesising the EKC and STIRPAT methodological approaches, whereas theextant literature employs only one or the other of these models.
Our primary contribution lies in the new evidence presented here regard-ing the relationship between the technology intensity of manufacturing andCO2 emissions in developing countries. This is important, as emissions varyconsiderably across different sub-sectors of manufacturing. In our analysis ofmanufacturing value added by technology intensity, we find a convex negativerelationship between medium- and high-tech manufacturing and CO2 emissions,in contrast to our results for manufacturing as a whole and for low-tech man-ufacturing. These differences are even clearer in our results for manufacturingexports, where we can compare low-, medium- and high-tech manufacturingexports. The convex positive effect of low-technology manufacturing exportson CO2 emissions may be explained in terms of the pollution haven hypothe-sis, where developing countries serve as the world’s factory for the productionof low-tech, dirty, and pollution-enhancing primary and intermediate products.High-technology manufacturing exports generate less CO2 emissions comparedwith medium-technology manufacturing exports. The convex negative relation-ship, for both of these categories, may be explained by structural change, that is,the trade-off between the tertiarisation and in/deindustrialisation of the econ-omy.
These striking findings can be understood in terms of the differences betweenMHT manufacturing and the rest of manufacturing, both in terms of what isproduced and how it is produced. MHT manufacturing generally tends to becleaner than low-tech manufacturing. Activities within low-tech manufacturing,such as pulp and paper production, and within medium-low-technology man-ufacturing, such as rubber and plastics production, are far more polluting perunit of value added than are high-technology manufacturing activities, such asthe manufacture of medical, precision, and optical instruments. This relates inpart to the intrinsic characteristics of production in such industries, which formost of the MHT sectors are not based on chemical processes. Furthermore,the typically high value-to-volume ratio of MHT activities (relative to low-techmanufacturing) implies that they are likely to be less polluting per unit of valueadded, and also that the adoption of cleaner technologies is more likely to beeconomically viable for producers.6
Based on the results of covariates across our regressions, we find support forthe EKC hypothesis of an inverted-U relationship between economic develop-ment and CO2 emissions. Our results also suggest that services value addedas a percentage of GDP and renewable energy consumption lead to lower CO2emissions, while increases in fossil fuel energy consumption lead to higher CO2emissions.
These findings have important policy implications, in particular at the nexus
6As noted earlier, categories of manufacturing by technology intensity are based on sec-tors within manufacturing, and not on the degree of technological advancement in particularprocesses and products. Despite these categories being broad, with considerable variation inthe degree of technology intensity within each, the differences in emissions by category arepronounced.
18
of industrial, technological, and environmental policies in developing countries.Shifting to more technology-intensive industries may be one way for developingcountries to navigate the dual challenges of industrialisation and mitigatingclimate change. This suggests that developing countries need to design industrialstrategies that target sector-specific ‘cleaner’ MHT industries that are able togenerate rapid and sustainable economic growth.
The advantages of upgrading to higher-technology manufacturing are alreadywell established for growth and catch-up. Our analysis also underscores the im-portance of moving towards more technology-intensive manufacturing in termsof environmental sustainability. This suggests that an industrialisation pathneed not be an environmentally destructive one: a shift to higher-technologyindustrialisation can provide a development trajectory that is both environ-mentally sustainable and can provide a basis for high growth and catch-up.
Our results are not intended to suggest that more technology-intensive manu-facturing does not contribute to harmful CO2 emissions, or that a more technology-intensive industrialisation path is the ‘silver bullet’ for addressing the challengeof climate change. Rather, we draw attention to the differences in emissionsbetween low-, medium- and high-tech manufacturing, suggesting that moretechnology-intensive manufacturing is less emissions intensive.
Of course, technological upgrading and a shift towards higher-technologymanufacturing are, in practice, not straightforward for developing countries.They require, among other things, significant effort and investment in humancapital and in upgrading productive capabilities. Even then, firms or countriespursuing technological upgrading face various constraints, including barriers toentry, domestic and international political economy factors, inadequate skills,limited domestic markets for high-tech manufactures, and so on. For low-incomecountries in particular, rapid technological upgrading is especially challenging;a rapid shift to high-technology manufacturing may not be feasible in the shortterm, nor may it generate large-scale employment opportunities for low- or semi-skilled workers.
This study opens several avenues for future research. Data limitations pre-cluded us from disaggregating MHT manufacturing value added to examinemedium- and high-technology shares separately, as was possible for exports.More disaggregated data for value added would shed additional light on therelationship between technology intensity in manufacturing and emissions. Sec-ondly, a sub-sectoral analysis, in which specific manufacturing industries areexamined separately, could also be interesting, especially taking into accountthe degree of heterogeneity within each of the categories of manufacturing bytechnology intensity. Thirdly, further research could investigate the channelsthrough which technology intensity affects the manufacturing-emissions rela-tionship, including through more micro-level analysis.
19

References
[1] Adom, P. K., Bekoe, W., Amuakwa-Mensah, F., Mensah, J. T., & Botch-way, E. (2012). Carbon dioxide emissions, economic growth, industrialstructure, and technical efficiency: Empirical evidence from Ghana, Sene-gal, and Morocco on the causal dynamics. Energy, 47 (1), 314-325.
[2] Altenburg, T., & Assmann, C. (eds.). (2017). Green industrial policy. Con-cept, policies, country experiences. Geneva & Bonn: UN Environment;German Development Institute/Deutsches Institut für Entwicklungspolitik(DIE).
[3] Altenburg, T., & Rodrik, D. (2017). Green industrial policy: Acceleratingstructural change towards wealthy green economies. In T. Altenburg & C.Assmann (Eds.), Green industrial policy: Concepts, policies, country expe-riences (pp. 2-20). Geneva, Bonn: UN Environment; German DevelopmentInstitute/Deutsches Institut für Entwicklungspolitik (DIE).
[4] Andreoni, A., & Tregenna, F. (2020). Escaping the middle-income technol-ogy trap: A comparative analysis of industrial policies in China, Brazil andSouth Africa. Structural Change and Economic Dynamics, 54, 324-340.
[5] Appiah, K., Du, J., Musah, A. A. I., & Afriyie, S. (2017). Investigationof the relationship between economic growth and carbon dioxide (CO2)emissions as economic structure changes: Evidence from Ghana. Resourcesand Environment, 7 (6), 160-167.
[6] Appiah, K., Du, J., Yeboah, M., & Appiah, R. (2019). Causal relationshipbetween industrialization, energy intensity, economic growth and carbondioxide emissions: Recent evidence from Uganda. International Journal ofEnergy Economics and Policy, 9 (1), 237-245.
[7] Arellano, M., & Bond, S. (1991). Some tests of specification for panel data:Monte Carlo evidence and an application to employment equations. Reviewof Economic Studies, 58 (1), 277-297.
[8] Athukorala, P., & Menon, J. (1996). Foreign investment and industrial-ization in Malaysia: Exports, employment and spillovers. Asian EconomicJournal, 10 (1), 29-44.
[9] Balogh, J. M., & Jámbor, A. (2017). Determinants of CO2 emission: Aglobal evidence. International Journal of Energy Economics and Policy,7 (5), 217-226.
[10] Barca, S., & Bridge, G. (2015). Industrialisation and environmental change.In T. Perreault, G. Bridge, & J. A. McCarthy (Eds.), The Routledge hand-book of political ecology (pp. 366-377). Oxon: Routledge.
20

[11] Bento, J. P. C. (2014). The determinants of CO2 emissions: Empiricalevidence from Italy. Munich Personal RePEc Archive Paper Number 59166.Retrieved from http://mpra.ub.uni-muenchen.de/59166/
[12] Blankenburg, S., Palma, G., & Tregenna, F. (2008). Structuralism. In L.Blume & S. Durlauf (Eds.), The new Palgrave: A dictionary of economics
(2nd ed., pp. 69-74). Basingstoke: Palgrave Macmillan.
[13] Blundell, R., & Bond, S. (1998). Initial conditions and moment restrictionsin dynamic panel data models. Journal of Econometrics, 87 (1), 115-143.
[14] Blundell, R., Bond, S., & Windmeijer, F. (2000). Estimation in dynamicpanel data models: Improving on the performance of the standard GMMestimator. IFS Working Papers W00/12, Institute for Fiscal Studies, Lon-don.
[15] Chenery, H. (1955). The role of industrialization in development pro-grams. The American Economic Review, 45 (1), 40-57.
[16] De Souza, E. S., Freire, F., & Pires, J. (2018). Determinants of CO2 emis-sions in the MERCOSUR: The role of economic growth, and renewable andnon-renewable energy. Journal of Environmental Science and Pollution Re-search, 25, 20769-20781.
[17] Dietz, T., & Rosa, E. A. (1997). Effects of population and affluence onCO2 emissions. Proceedings of the National Academy of Sciences, 94 (1),175-179.
[18] Ehrlich, P. R., & Holdren, J. P. (1971). Impact of population growth. Sci-ence, 171 (3977), 1212-1217.
[19] Fischer, C. (2016). Environmental protection for sale: Strategic greenindustrial policy and climate finance. Environmental and Resource Eco-nomics, 66 (3), 553-575.
[20] Friedl, B., & Getzner, M. (2003). Determinants of CO2 emissions in a smallopen economy. Ecological Economics, 45 (1), 133-148.
[21] Friedlingstein, P., Houghton, R., Marland, G., Hackler, J., Boden, T. A.,Conway, T., Canadell, J., Raupach, M., Ciais, P., & Le Quere, C. (2010).Update on CO2 emissions. Nature Geoscience, 3 (12), 811-812.
[22] Fuchs, E., & Kirchain, R. (2010). Design for location? The impact of man-ufacturing off-shore on technology competitiveness in the optoelectronicsindustry. Management Science, 56 (12), 2323-2349.
[23] Han, X., & Chatterjee, L. (1997). Impacts of growth and structural changeon CO2 emissions of developing countries.World Development, 25 (3), 395-407.
21

[24] Haraguchi, N., Cheng, C. F. C., & Smeets, E. (2017). The importanceof manufacturing in economic development: Has this changed?’ World
Development, 93, 293-315.
[25] Harrison, A., Martin, L., & Nataraj, S. (2017). Green industrial policy inemerging markets. Annual Review of Resource Economics, 9, 253-274.
[26] Hatzigeorgiou, E., Polatidis, H., & Haralambopoulos, D. (2011). CO2 emis-sions, GDP and energy intensity: A multivariate cointegration and causal-ity analysis for Greece, 1977-2007. Applied Energy, 88 (4), 1377-1385.
[27] Hobday, M. (2013). Learning from Asia’s success: Beyond simplistic ‘lesson-making’. In A. Szirmai, W. Naudé, & L. Alcorta (Eds.), Pathways to in-dustrialization in the twenty-first century: New challenges and emerging
paradigms (pp. 133-153). Oxford: Oxford University Press.
[28] Kemp, R., & Never, B. (2017). Green transition, industrial policy, andeconomic development. Oxford Review of Economic Policy, 33 (1), 66-84.
[29] Kijima, M., Nishide, K., & Ohyama, A. (2010). Economic models for theenvironmental Kuznets curve: A survey. Journal of Economic Dynamicsand Control, 34 (7), 1187-1201.
[30] Lall, S. (1992). Technological capabilities and industrialization. World De-velopment, 20 (1), 165-186.
[31] Lall, S. (1999). Introduction and setting. In S. Lall (Ed.), The technologicalresponse to import liberalization in Sub Saharan Africa (pp. 1-25). London:Palgrave Macmillan.
[32] Lall, S. (2000). The technological structure and performance of develop-ing country manufactured exports, 1985-98. Oxford Development Stud-ies, 28 (3), 337-369.
[33] Li, K., & Lin, B. (2015). Impacts of urbanization and industrialization onenergy consumption/CO2 emissions: Does the level of development matter?Renewable and Sustainable Energy Reviews, 52, 1107-1122.
[34] Lin, B., Omoju, O. E., & Okonkwo, J. U. (2015). Impact of industrialisationon CO2 emissions in Nigeria. Renewable and Sustainable Energy Reviews,52, 1228-1239.
[35] Liu, X., & Bae, J. (2018). Urbanization and industrialization impact ofCO2 emissions in China. Journal of Cleaner Production, 172, 178-186.
[36] Marsiglio, S., Ansuategi, A., & Gallastegui, M. C. (2016). The environmen-tal Kuznets curve and the structural change hypothesis. Environmental andResource Economics, 63 (1), 265-288.
22
[37] Matsuo, T., & Schmidt, T. S. (2019). Managing tradeoffs in green industrialpolicies: The role of renewable energy policy design. World Development,122, 11-26.
[38] Minx, J. C., Baiocchi, G., Peters, G. P., Weber, C. L., Guan, D., &Hubacek, K. (2011). A carbonizing dragon: China’s fast growing CO2 emis-sions revisited. Environmental Science & Technology, 45 (21), 9144-9153.
[39] Montobbio, F., & Rampa, F. (2005). The impact of technology and struc-tural change on export performance in nine developing countries. WorldDevelopment, 33 (4), 527-547.
[40] Nakicenovic, N., Kolp, P., Riahi, K., Kainuma, M., & Hanaoka, T. (2006).Assessment of emissions scenarios revisited. Environmental Economics andPolicy Studies, 7, 137-173.
[41] Okereke, C., Coke, A., Geebreyesus, M., Ginbo, T., Wakeford, J. J., & Mu-lugetta, Y. (2019). Governing green industrialisation in Africa: Assessingkey parameters for a sustainable socio-technical transition in the contextof Ethiopia. World Development, 115, 279-290.
[42] Organisation for Economic Co-operation and Development (OECD).(2003). OECD Science, Technology and Industry Scoreboard 2003. Paris:OECD Publishing.
[43] Padilla, E. (2017). What can developing countries gain from a green trans-formation? In T. Altenburg & C. Assmann (Eds.), Green industrial policy.Concept, policies, country experiences (pp. 22-37). Geneva & Bonn: UNEnvironment; German Development Institute/Deutsches Institut für En-twicklungspolitik (DIE).
[44] Pasche, M. (2002). Technical progress, structural change, and the environ-mental Kuznets curve. Ecological Economics, 42 (3), 381-389.
[45] Pavitt, K. (1984). Sectoral patterns of technical change: Towards a taxon-omy and a theory. Research Policy, 13 (6), 343-373.
[46] Pisano, G., & Shih, W. (2012). Producing prosperity: Why America needs amanufacturing renaissance. Boston, MA: Harvard Business Review Press.
[47] Pollin, R. (2020). An industrial policy framework to advance a global greennew deal. In J.-J. Chang, C. Cramer, R. Kozul-Wright, & A. Oqubay (Eds.),The Oxford handbook of industrial policy. Oxford: Oxford University Press.
[48] Poumanyvong, P., & Kaneko, S. (2010). Does urbanization lead to lessenergy use and lower CO2 emissions? A cross-country analysis. EcologicalEconomics, 70 (1), 434-444.
[49] Raheem, I. D., & Ogebe, J. O. (2017). CO2 emissions, urbanization andindustrialization: Evidence from a direct and indirect heterogeneous panelanalysis. Management of Environmental Quality, 28 (6), 851-867.
23

[50] Rodrik, D. (2014). Green industrial policy. Oxford Review of Economic
Policy, 30 (3), 469-491.
[51] Seyoum, B. (2004). The role of factor conditions in high-technology exports:An empirical examination. The Journal of High Technology ManagementResearch, 15 (1), 145-162.
[52] Szirmai, A. (2012). Industrialisation as an engine of growth in developingcountries, 1950-2005. Structural Change and Economic Dynamics, 23 (4),406-420.
[53] Szirmai, A., Naudé, W., & Alcorta, L. (2013). Introduction and overview:The past, present, and future of industrialization. In A. Szirmai, W. Naudé,& L. Alcorta (Eds.), Pathways to industrialization in the twenty-first cen-tury: New challenges and emerging paradigms (pp. 1-61). Oxford: OxfordUniversity Press.
[54] Tang, C. F., & Tan, B. W. (2015). The impact of energy consumption, in-come and foreign direct investment on carbon dioxide emissions in Vietnam.Energy, 79, 447-454.
[55] Tassey, G. (2010). Rationales and mechanisms for revitalizing U.S. man-ufacturing R&D strategies. The Journal of Technology Transfer, 35 (3),283-333.
[56] Timmons Roberts, J., & Grimes, P. E. (1997). Carbon intensity and eco-nomic development 1962—1991: A brief exploration of the environmentalKuznets curve. World Development, 25 (1), 191-198.
[57] Tregenna, F. (2009). Characterising deindustrialisation: An analysis ofchanges in manufacturing employment and output internationally. Cam-bridge Journal of Economics, 33 (3), 433-466.
[58] Tregenna, F. (2015). Deindustrialisation, structural change and sustainableeconomic growth. MERIT Working Papers 032, Maastricht Economic andSocial Research Institute on Innovation and Technology (MERIT), UnitedNations University.
[59] Tregenna, F. (2016). Deindustrialisation and premature deindustrialization.In J. Ghosh, R. Kattel, & E. Reinert (Eds.), Elgar handbook of alternativetheories of economic development (pp. 710-728).Cheltenham: Edward El-gar.
[60] Tregenna, F., & Andreoni, A. (2020). Deindustrialisation reconsid-ered: Structural shifts and sectoral heterogeneity. Working Paper Se-ries (IIPP WP 2020-06), UCL Institute for Innovation and Pub-lic Purpose, University College London, London. Retrieved fromhttps://www.ucl.ac.uk/bartlett/public-purpose/wp2020-06
24
[61] United Nations Industrial Development Organization (UNIDO). (2005).Capability building for catching-up: Historical, empirical and policy dimen-
sions. Industrial Development Report, UNIDO, Vienna.
[62] United Nations Industrial Development Organization (UNIDO). (2016).Industrialization in Africa and least developed countries. Boosting growth,
creating jobs, promoting inclusiveness and sustainability. A report to theG20 Development Working Group, Vienna.
[63] Upadhyaya, S. (2013). Country grouping in UNIDO statistics. DevelopmentPolicy, Statistics and Research Branch Working Paper 1/2013, UNIDO,Vienna.
[64] Windmeijer, F. (2005). A finite sample correction for the variance of linearefficient two-step GMM estimators. Journal of Econometrics, 126 (1), 25-51.
[65] Xu, B., & Lin, B. (2015). How industrialization and urbanization processimpacts on CO2 emissions in China: Evidence from nonparametric additiveregression models. Energy Economics, 48, 188-202.
[66] Xu, R., & Lin, B. (2017). Why are there large regional differences inCO2 emissions? Evidence from China’s manufacturing industry. Journalof Cleaner Production, 140, 1330-1343.
[67] Yassin, J., & Aralas, S. (2019). Does the de-industrialization and tertiariza-tion process decarbonize emissions in Asian countries? International Jour-nal of Accounting, 4 (17), 76-85.
[68] Zhang, L. Y. (2012). Does climate change make industrialization an ob-solete development strategy for cities in the South? In D. Hoornweg, M.Frieire, J. M. Lee, P. Bpada-Tata, & B. Yueh (Eds.), Cities and climatechange: Responding to an urgent agenda (pp. 564-581). Washington, DC:The World Bank.
[69] Zhang, Y. Z., Liu, Z., Zhang, H., & Tan, T. D. (2014). The impact ofeconomic growth, industrial structure and urbanization on carbon emissionintensity in China. Natural Hazards, 73 (1), 579-595.
[70] Zhu, Z., Liu, Y., Tian, X., Wang, Y., & Zhang, Y. (2017). CO2 emissionsfrom the industrialization and urbanization processes in the manufacturingcenter Tianjin in China. Journal of Cleaner Production, 168, 867-875.
25
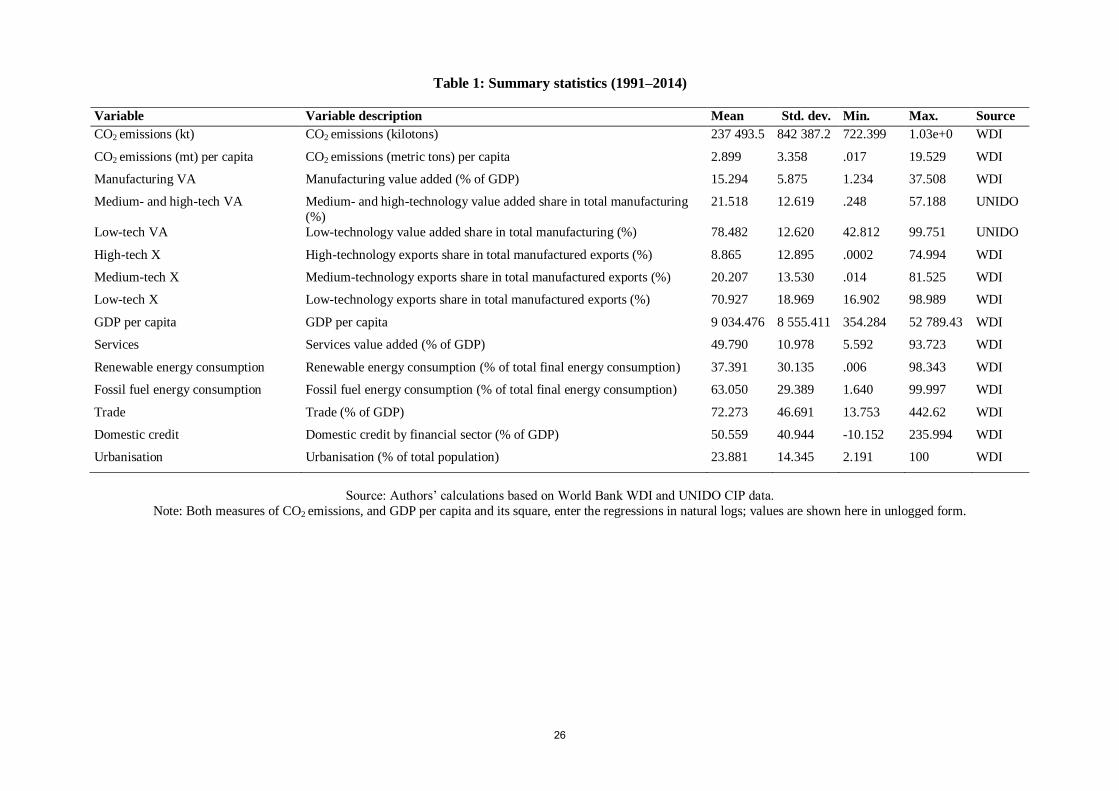
Table 1: Summary statistics (1991–2014)
Variable Variable description Mean Std. dev. Min. Max. Source
CO2 emissions (kt) CO2 emissions (kilotons) 237 493.5 842 387.2 722.399 1.03e+0 WDI
CO2 emissions (mt) per capita CO2 emissions (metric tons) per capita 2.899 3.358 .017 19.529 WDI
Manufacturing VA Manufacturing value added (% of GDP) 15.294 5.875 1.234 37.508 WDI
Medium- and high-tech VA Medium- and high-technology value added share in total manufacturing
(%)
21.518 12.619 .248 57.188 UNIDO
Low-tech VA Low-technology value added share in total manufacturing (%) 78.482 12.620 42.812 99.751 UNIDO
High-tech X High-technology exports share in total manufactured exports (%) 8.865 12.895 .0002 74.994 WDI
Medium-tech X Medium-technology exports share in total manufactured exports (%) 20.207 13.530 .014 81.525 WDI
Low-tech X Low-technology exports share in total manufactured exports (%) 70.927 18.969 16.902 98.989 WDI
GDP per capita GDP per capita 9 034.476 8 555.411 354.284 52 789.43 WDI
Services Services value added (% of GDP) 49.790 10.978 5.592 93.723 WDI
Renewable energy consumption Renewable energy consumption (% of total final energy consumption) 37.391 30.135 .006 98.343 WDI
Fossil fuel energy consumption Fossil fuel energy consumption (% of total final energy consumption) 63.050 29.389 1.640 99.997 WDI
Trade Trade (% of GDP) 72.273 46.691 13.753 442.62 WDI
Domestic credit Domestic credit by financial sector (% of GDP) 50.559 40.944 -10.152 235.994 WDI
Urbanisation Urbanisation (% of total population) 23.881 14.345 2.191 100 WDI
Source: Authors’ calculations based on World Bank WDI and UNIDO CIP data.
Note: Both measures of CO2 emissions, and GDP per capita and its square, enter the regressions in natural logs; values are shown here in unlogged form.
26
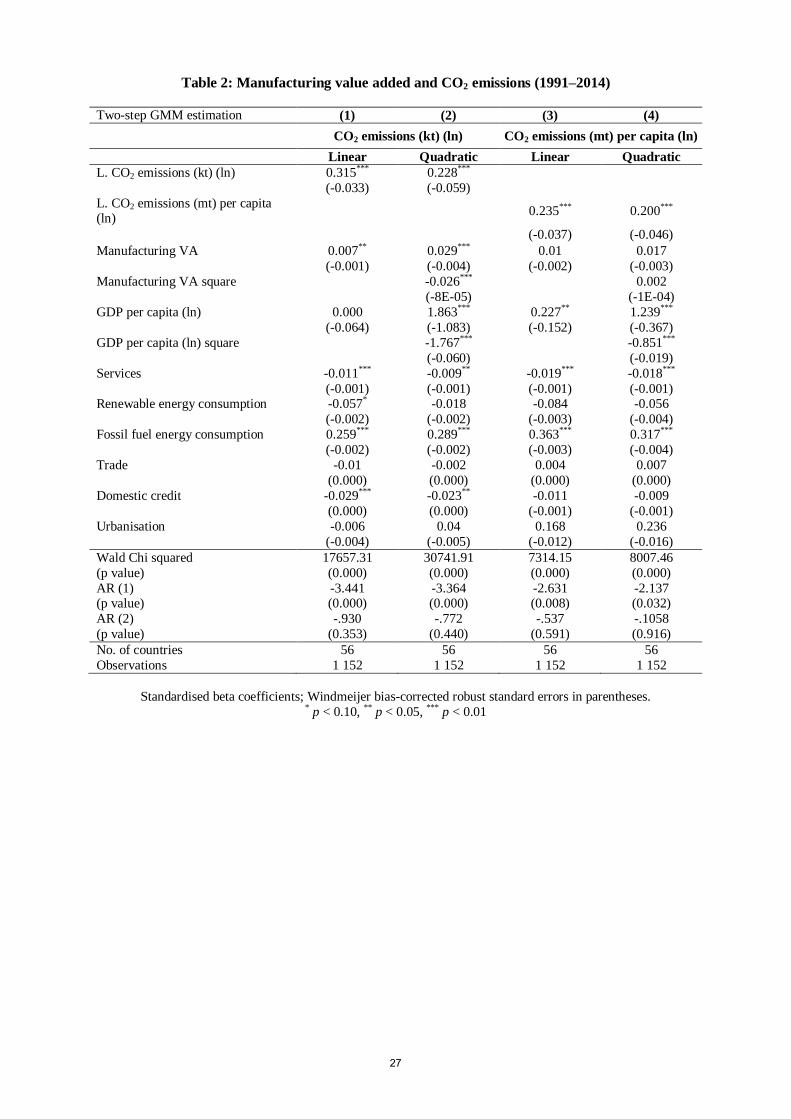
Table 2: Manufacturing value added and CO2 emissions (1991–2014)
Two-step GMM estimation (1) (2) (3) (4)
CO2 emissions (kt) (ln) CO2 emissions (mt) per capita (ln)
Linear Quadratic Linear Quadratic
L. CO2 emissions (kt) (ln) 0.315*** 0.228***
(-0.033) (-0.059)
L. CO2 emissions (mt) per capita (ln)
0.235*** 0.200***
(-0.037) (-0.046)
Manufacturing VA 0.007** 0.029*** 0.01 0.017
(-0.001) (-0.004) (-0.002) (-0.003)
Manufacturing VA square -0.026*** 0.002
(-8E-05) (-1E-04)
GDP per capita (ln) 0.000 1.863*** 0.227** 1.239***
(-0.064) (-1.083) (-0.152) (-0.367)
GDP per capita (ln) square -1.767*** -0.851***
(-0.060) (-0.019)
Services -0.011*** -0.009** -0.019*** -0.018***
(-0.001) (-0.001) (-0.001) (-0.001) Renewable energy consumption -0.057* -0.018 -0.084 -0.056
(-0.002) (-0.002) (-0.003) (-0.004)
Fossil fuel energy consumption 0.259*** 0.289*** 0.363*** 0.317***
(-0.002) (-0.002) (-0.003) (-0.004)
Trade -0.01 -0.002 0.004 0.007
(0.000) (0.000) (0.000) (0.000)
Domestic credit -0.029*** -0.023** -0.011 -0.009
(0.000) (0.000) (-0.001) (-0.001)
Urbanisation -0.006 0.04 0.168 0.236
(-0.004) (-0.005) (-0.012) (-0.016)
Wald Chi squared 17657.31 30741.91 7314.15 8007.46
(p value) (0.000) (0.000) (0.000) (0.000)
AR (1) -3.441 -3.364 -2.631 -2.137 (p value) (0.000) (0.000) (0.008) (0.032)
AR (2) -.930 -.772 -.537 -.1058
(p value) (0.353) (0.440) (0.591) (0.916)
No. of countries 56 56 56 56
Observations 1 152 1 152 1 152 1 152
Standardised beta coefficients; Windmeijer bias-corrected robust standard errors in parentheses. * p < 0.10, ** p < 0.05, *** p < 0.01
27

Table 3: Manufacturing value added and CO2 emissions, by technology intensity (1991–2014)
Two-step GMM estimation (1) (2) (3) (4)
CO2 emissions
(kt) (ln)
CO2 emissions
(mt) per capita (ln)
CO2 emissions
(kt) (ln)
CO2 emissions
(mt) per capita (ln)
L. CO2 emissions (kt) (ln) 0.478*** 0.396***
(0.009) (0.0212)
L. CO2 emissions (mt) per capita
(ln)
0.190*** 0.302***
(0.041) (0.0219)
Medium- and high-tech VA -0.059*** -0.062**
(0.002) (0.003)
Medium- and high-tech VA square 0.034*** 0.039*
(0.000) (0.000)
Low-tech VA 0.268*** 0.148***
(7.02e-15) (6.61e-15)
Low-tech VA square -0.187** -0.248**
(1.26e-28) (1.21e-28)
GDP per capita (ln) 0.586*** 0.984*** 1.290*** 1.093***
(0.382) (0.362) (0.299) (0.205)
GDP per capita (ln) square -0.445** -0.665*** -1.135*** -0.900***
(0.021) (0.021) (0.0167) (0.0115)
Services -0.016*** -0.022*** -0.011** -0.028***
(0.000) (0.001) (0.000847) (0.000811)
Renewable energy consumption -0.122*** -0.046 -0.073** -0.119***
(0.001) (0.003) (0.00190) (0.00182)
Fossil fuel energy consumption 0.145*** 0.363*** 0.179*** 0.234***
(0.001) (0.004) (0.00187) (0.00178)
Trade 0.025*** 0.012 0.033*** 0.008
(0.000) (0.003) (0.000260) (0.000258)
Domestic credit -0.014*** -0.006 -0.012* -0.025***
(0.000) (0.000) (0.000286) (0.000266)
Urbanisation 0.229*** 0.314** 0.181*** 0.097**
(0.004) (0.014) (0.00422) (0.00380)
Wald Chi squared 109 490.44 15 207.70 2 542.98 1 664.62
(p-value) 0.000 0.000 0.000 0.000
AR (1) -3.982 -1.280 -3.825 -3.618
(p-value) 0.000 0.000 0.000 0.000
AR (2) -.7566 .530 -.741 -1.096 (p-value) 0.449 0.595 0.458 0.273
No. of countries 56 56 56 56
Observations 1152 1152 1152 1152
Standardised beta coefficients; Windmeijer bias-corrected robust standard errors in parentheses. * p < 0.10, ** p <
0.05, *** p < 0.01
Note: In columns 1 and 2, the explanatory variables of interest are the linear and quadratic terms of ‘Medium- and high-
tech VA’ (Medium- and high-technology value added share in total manufacturing (%)). In columns 3 and 4, the
explanatory variables of interest are the equivalent terms for ‘Low-tech VA’. In each case, results are shown for the two
alternative dependent variables: CO2 emissions (kilotons) (columns 1 and 3) and CO2 emissions (metric tons) per capita
(columns 2 and 4), both in natural logs.
28
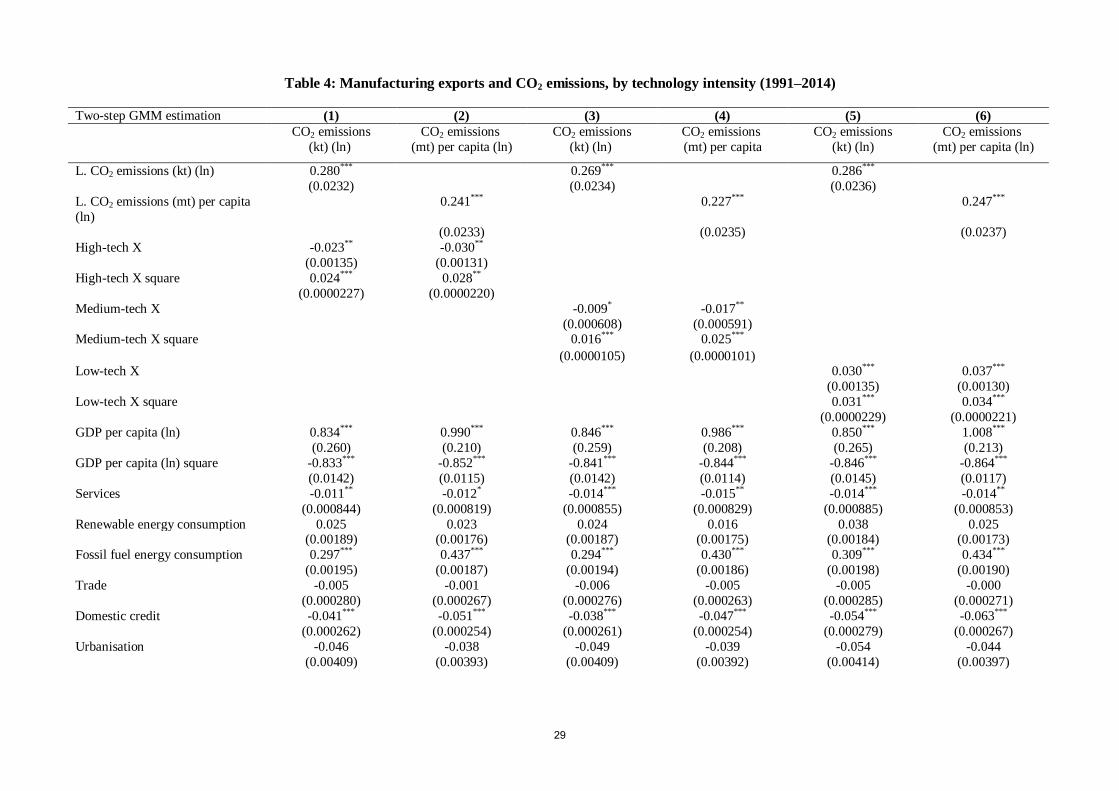
Table 4: Manufacturing exports and CO2 emissions, by technology intensity (1991–2014)
Two-step GMM estimation (1) (2) (3) (4) (5) (6)
CO2 emissions
(kt) (ln)
CO2 emissions
(mt) per capita (ln)
CO2 emissions
(kt) (ln)
CO2 emissions
(mt) per capita
CO2 emissions
(kt) (ln)
CO2 emissions
(mt) per capita (ln)
L. CO2 emissions (kt) (ln) 0.280*** 0.269*** 0.286***
(0.0232) (0.0234) (0.0236)
L. CO2 emissions (mt) per capita
(ln)
0.241*** 0.227*** 0.247***
(0.0233) (0.0235) (0.0237)
High-tech X -0.023** -0.030**
(0.00135) (0.00131)
High-tech X square 0.024*** 0.028**
(0.0000227) (0.0000220)
Medium-tech X -0.009* -0.017**
(0.000608) (0.000591) Medium-tech X square 0.016*** 0.025***
(0.0000105) (0.0000101) Low-tech X 0.030*** 0.037***
(0.00135) (0.00130)
Low-tech X square 0.031*** 0.034***
(0.0000229) (0.0000221)
GDP per capita (ln) 0.834*** 0.990*** 0.846*** 0.986*** 0.850*** 1.008***
(0.260) (0.210) (0.259) (0.208) (0.265) (0.213)
GDP per capita (ln) square -0.833*** -0.852*** -0.841*** -0.844*** -0.846*** -0.864***
(0.0142) (0.0115) (0.0142) (0.0114) (0.0145) (0.0117)
Services -0.011** -0.012* -0.014*** -0.015** -0.014*** -0.014**
(0.000844) (0.000819) (0.000855) (0.000829) (0.000885) (0.000853)
Renewable energy consumption 0.025 0.023 0.024 0.016 0.038 0.025 (0.00189) (0.00176) (0.00187) (0.00175) (0.00184) (0.00173)
Fossil fuel energy consumption 0.297*** 0.437*** 0.294*** 0.430*** 0.309*** 0.434***
(0.00195) (0.00187) (0.00194) (0.00186) (0.00198) (0.00190)
Trade -0.005 -0.001 -0.006 -0.005 -0.005 -0.000
(0.000280) (0.000267) (0.000276) (0.000263) (0.000285) (0.000271)
Domestic credit -0.041*** -0.051*** -0.038*** -0.047*** -0.054*** -0.063***
(0.000262) (0.000254) (0.000261) (0.000254) (0.000279) (0.000267)
Urbanisation -0.046 -0.038 -0.049 -0.039 -0.054 -0.044
(0.00409) (0.00393) (0.00409) (0.00392) (0.00414) (0.00397)
29
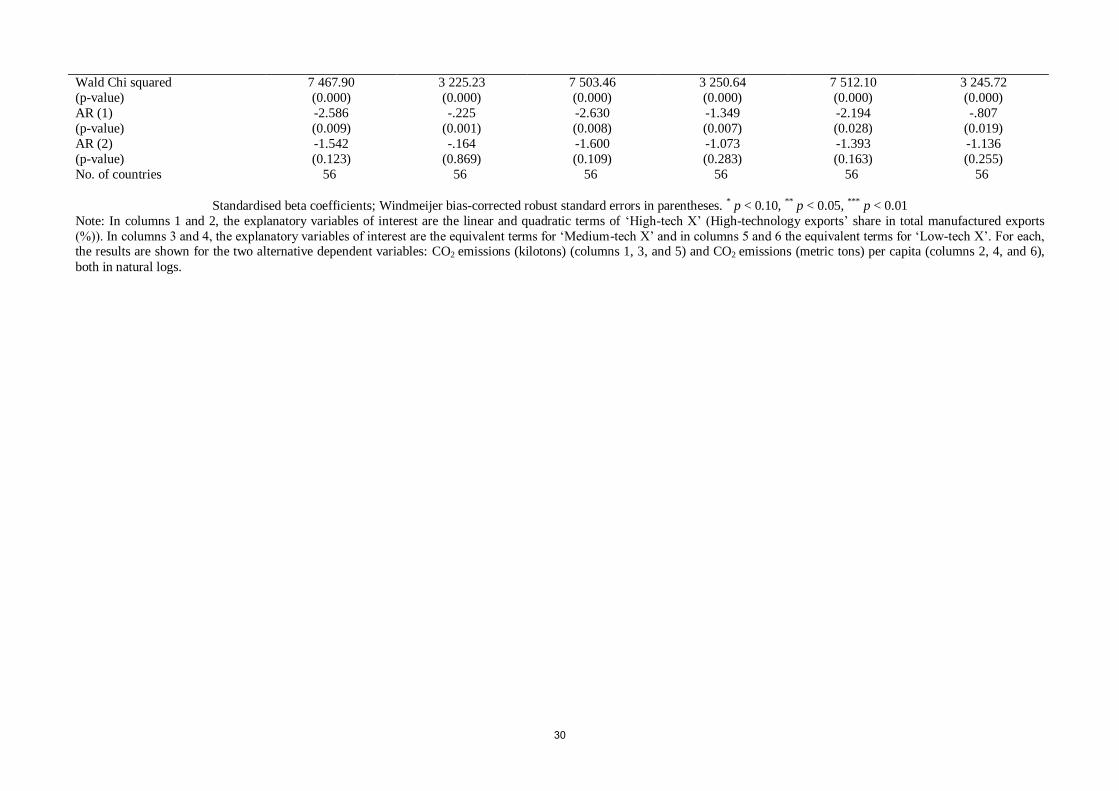
Standardised beta coefficients; Windmeijer bias-corrected robust standard errors in parentheses. * p < 0.10, ** p < 0.05, *** p < 0.01
Note: In columns 1 and 2, the explanatory variables of interest are the linear and quadratic terms of ‘High-tech X’ (High-technology exports’ share in total manufactured exports
(%)). In columns 3 and 4, the explanatory variables of interest are the equivalent terms for ‘Medium-tech X’ and in columns 5 and 6 the equivalent terms for ‘Low-tech X’. For each, the results are shown for the two alternative dependent variables: CO2 emissions (kilotons) (columns 1, 3, and 5) and CO2 emissions (metric tons) per capita (columns 2, 4, and 6),
both in natural logs.
Wald Chi squared 7 467.90 3 225.23 7 503.46 3 250.64 7 512.10 3 245.72
(p-value) (0.000) (0.000) (0.000) (0.000) (0.000) (0.000)
AR (1) -2.586 -.225 -2.630 -1.349 -2.194 -.807
(p-value) (0.009) (0.001) (0.008) (0.007) (0.028) (0.019)
AR (2) -1.542 -.164 -1.600 -1.073 -1.393 -1.136
(p-value) (0.123) (0.869) (0.109) (0.283) (0.163) (0.255)
No. of countries 56 56 56 56 56 56
30

Figure 1: CO2 emissions in selected developing countries (1991 to 2014)
1a: CO2 emissions (kt)
Note: The lower series are for Argentina, Vietnam, Nigeria and Ethiopia; labels not shown due to space.
1b: CO2 emissions (mt) per capita
Source: Authors’ calculations from WDI.
0
2
4
6
8
10
12
14
199
1
199
2
199
3
199
4
199
5
199
6
199
7
199
8
199
9
200
0
200
1
200
2
200
3
200
4
200
5
200
6
200
7
200
8
200
9
201
0
201
1
201
2
201
3
201
4
CO
2e
mis
sio
ns
(mt)
pe
r ca
pit
a
YearYear
China
Russia
South Africa
Argentina
Brazil
Nigeria
Ethiopia
India
Viet Nam
31

Appendix
Table A.1: Classification of manufacturing industries according to their technology intensity
Category of technology intensity Industries
High-technology industries Aircraft and spacecraft; pharmaceuticals; electronics
components; office, accounting, and computing
machinery; radio, TV, and communications
equipment; medical, precision and optical
instruments.
Medium-technology industries Electrical machinery and apparatus; motor vehicles;
trailers and semi-trailers; chemicals excluding
pharmaceuticals; railroad equipment and transport
equipment; machinery equipment; building and
repairing of ships and boats; rubber and plastics
products; coke, refined petroleum products, and
nuclear fuel; other non-metallic mineral products;
basic metals and fabricated metal products.
Low-technology industries Manufacturing, n.e.c.; recycling wood, pulp, paper,
paper products, printing, and publishing; food
products, beverages, and tobacco; textiles, textile
products, leather, and footwear.
Source: OECD (2003)
32
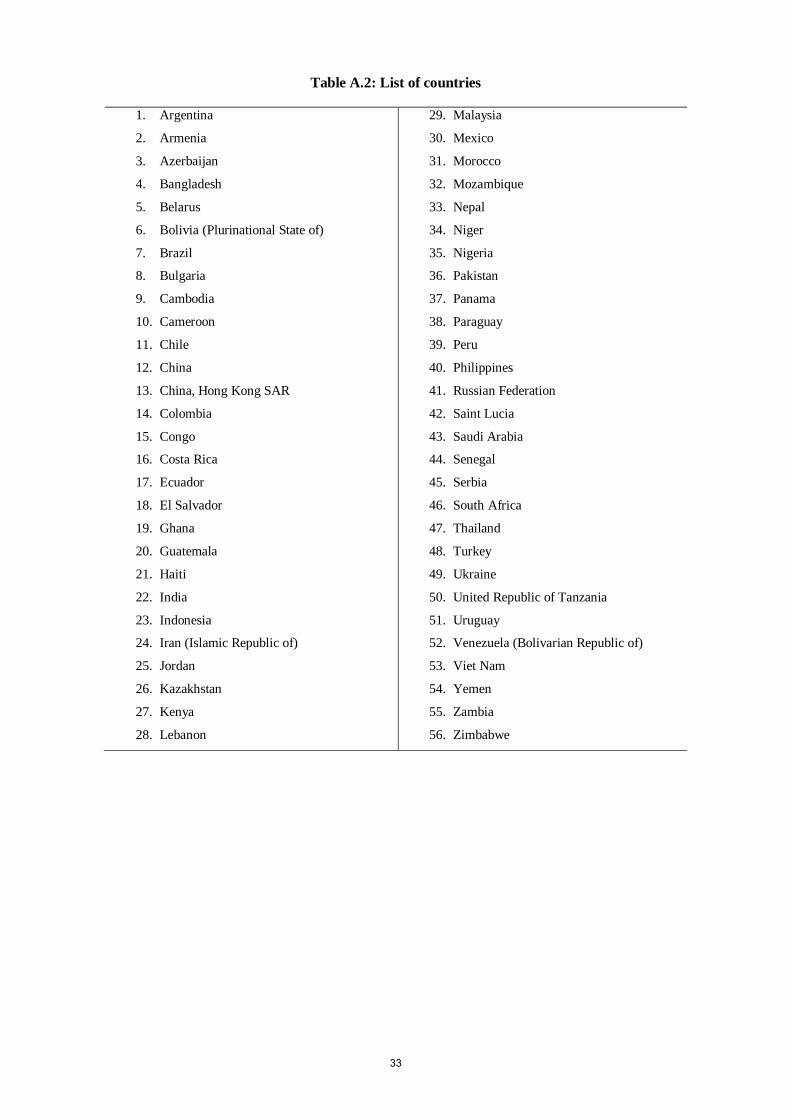
Table A.2: List of countries
1. Argentina
2. Armenia
3. Azerbaijan
4. Bangladesh
5. Belarus
6. Bolivia (Plurinational State of)
7. Brazil
8. Bulgaria
9. Cambodia
10. Cameroon
11. Chile
12. China
13. China, Hong Kong SAR
14. Colombia
15. Congo
16. Costa Rica
17. Ecuador
18. El Salvador
19. Ghana
20. Guatemala
21. Haiti
22. India
23. Indonesia
24. Iran (Islamic Republic of)
25. Jordan
26. Kazakhstan
27. Kenya
28. Lebanon
29. Malaysia
30. Mexico
31. Morocco
32. Mozambique
33. Nepal
34. Niger
35. Nigeria
36. Pakistan
37. Panama
38. Paraguay
39. Peru
40. Philippines
41. Russian Federation
42. Saint Lucia
43. Saudi Arabia
44. Senegal
45. Serbia
46. South Africa
47. Thailand
48. Turkey
49. Ukraine
50. United Republic of Tanzania
51. Uruguay
52. Venezuela (Bolivarian Republic of)
53. Viet Nam
54. Yemen
55. Zambia
56. Zimbabwe
33