Embed Size (px)
Citation preview

Firm Size and Efficient EntrepreneurialActivity: A Reformulation of the SchumpeterHypothesis
Albert N. LinkAuburn UniveTSity
This paper examines empirically the relationship between innovativeactivity, as measured by the rate of return to research-and-development expenditures, and firm size using a sample of firmsfrom tbe chemicals and allied products industry (SIC 28). We findthat size is a prerequisite for successful innovative activity. Tbeestimated rate of return to research and development for the smallerfirms is 30 percent, while for the larger size firms it is 78 percent.Statistical tests for structural stability were used to divide the sampleinto these two behavioral regimes.
Since the writing of Capitalism, Socialism, and Democracy (Schumpeter1947), economists have increasingly been willing to associate eco-nomic growth through innovation with monopoly power and largehrm size. This so-called Schumpeterian hypothesis is posited on theview that in a capitalistic system, economic growth occurs through aprocess of "creative destruction" whereby the "old" industrialstructure—its product, its process, or its organization—is continuallychanged by "new" innovative industrial activity. This "industrial mu-tation . . . that incessantly revolutionizes the economic structure/romwithin . . . is the essential fact [of] capitalism" (Schumpeter 1947, p.83). The motivating force behind the process of creative destruction isthe promise of economic profit achieved through innovative activity.According to Schumpeter, large firm size is essential to the success of
I am grateful to Robert Hebert, Richard Higgins, and several anonymous refereesfor comments on earlier versions of tbis paper.
{Journal of PohlKol Economy. 1980, vol 88, no 4 |© 1980 by The University of Chicago. 0022.3808/80/88O4-0OO7$01.50
771

JOURNAL OF POLITICAL ECONOMY
such innovative activity. Larger firms can provide economies of scalein production and innovation which make available sufficient re-sources necessary for successful completion of this process.'
During the past 2 decades, statistical tests of the Schumpeterianhypothesis have focused on two relationships: (1) between firm sizeand innovative activity and (2) between market concentration andinnovative activity. Recently, Kamien and Schwartz (1975) have sur-veyed these studies and have concluded that the statistical evidencesupporting Schumpeter's hypothesis is, in general, "wanting."*Perhaps the lack of empirical verification results from the inadequacyof data to measure innovative activity or from the fact that the largeindustrial research complexes of today have changed the structure ofcapitalism that Schumpeter envisioned.* An alternative explanationwas first offered by Markham (1965) and more recently by Fisber andTemin (1973). They contend that the existing empirical literaturerelating innovative activity, as measured by some absolute index likeR & D expenditures, to firm size or market concentration is a test of ahypothesis different from tbat suggested by Schumpeter.*
In this study, innovative activity is viewed as an entrepreneurialprocess. Tbe process notion of innovation is clear from Scbumpeter'sdiscussion of creative destruction wherein the entrepreneur is con-tinually creating disequilibria from equilibrium states.* Wbenever aprocess notion is considered, the question arises as to what is the bestcriterion to evaluate its success. Here we suggest that the rate ofreturn earned on R & D expenditures is conceptually more appropri-ate as a measure of innovative activity than those measures used
' Schumpeter claimed that the monopoly firm will have a greater demand for innova-tive activity than will the competitive firm since it can profit from the innovation as aresult of its market power. Arrow (1962) first demonstrated that this demand argumentis incorrect. Arrow's analysis has been criticized by Demsetz (1969), but the more recentwork of Ng (1971) and Hu (1973) seems to resubstantiate Arrow's argument. Mostanalyses of Schumpeter's hypothesis, however, focus on the supply of innovations.
' In particular, note the studies by Worley (1961), Hamberg (1964), Comanor (1965),Scherer (1965a, 19656), Grabowski (1968), Rosenberg (1976), and Loeband Lin (1977).
' See Grabowski and Mueller (1970) for a detailed discussion of data problemsassociated with empirical tests of the Schumpeterian hypothesis.
* The quantitative arguments developed by Fisher and Temin are basically that apositive and increasing relationship between innovative inputs and firm size (the gen-eral empirical test) is neither necessary nor sufficient to imply a positive and increasingrelationship between innovative output and firm size (the Fisher-Temin interpretationof Schumpeter's hypothesis), given economies of scale in production of output and inproduction of innovations. Scherer (1973), however, strongly disagrees with tbeFisher-Temin conclusion. In support of Fisher and Temin, Kamien and Schwartz(1969) have demonstrated theoretically and Link (1978) has shown empirically that thetransformation between R & D inputs and innovative output is not necessarilymonotonic.
' The more modern views of entrepreneurship stress perception (not creation) ofdisequilibria and tben adjustment to an equilibrium (Kirzner 1973; Schultz 1975).

ENTREPRENEURIAL ACTIVITY 7 7 3
previously. We thus formulate an empirical test of Schumpeter bytesting whether the rate of return to R & D is a function of firm size.
The remainder of this paper is outlined as follows. In Section I anempirical model for measuring the rate of return to R & D activity isformulated and estimated using a cross section of firms from thechemicals industry. Then the Brown and Durbin (1968; Brown, Dur-bin, and Evans 1975) and Quandt (1958, 1960) tests for structuralchange are employed to test the hypothesis that the rate of return to R& D increases with absolute firm size. In Section II these results areinterpreted and some concluding remarks are offered.
I. The Analytical Framework
The Empirical Model
An important function in the entrepreneur's decision-making processis the successful use of R & D investments for innovation. A commonmodel for estimating the rate of return to these expenditures isgenerally formulated on the assumption that the firm operates ac-cording to a three-factor production function:
Y = AF{L,K,T), (1)
where Y is output; A is a neutral disembodied shift parameter; L andK are measures ofthe stock of labor and capital, respectively; and T isa stock of technical capital or technical knowledge (Mansfield 1965;Griliches 1973; Terleckyj 1974). In turn, T is written as a function ofthe relevant research capital, C, and "other" factors affecting itsproduction, 0:
T = G{C,O), (2)
where research capital, C, is some weighted accumulation of previousR & D investments, R:
C = 2aA_,. (3)
The accumulation weights, Oj, reflect the influence of both a distrib-uted lag effect of i periods on past R & D and the rate of obsoles-cence on research capital.
If equation (1) has the form of a Cobb-Douglas production func-tion, the model becomes
Y = A^e*^T°'L^IC^-^\ (4)
where /4o is a constant, X is a disembodied rate of growth parameter,and a and j8 are output elasticities. Constant returns to scale areassumed with respect to L and K (Griliches 1973, 1975; Terleckyj

774 JOURNAL OF POLITICAL ECONOMY
1974). Differentiating equation (4) with respect to time, "residual"productivity growth is defined as:
FIF = {YIY) - piLIL) - (1 - ^WIK) = X + a{tlT\ (5)
where the dot notation represents a time rate of change {F = dF/dt)and F/F represents those productivity changes not attributable to L orK. The parameter a is the output elasticity of technical capital,
a = (dYldT) • (T/Y). (6)
Thus, using this definition of a, equation (5) becomes
F/F = k + p(T/Y), (7)
where p = (dY/dT) is the marginal product of technical capital, and(T/Y) is the net private investment in R & D per unit of output. If, fora given industry or firm, equation (7) is not deterministic but, rather,stochastic.
F/F = d + yiJrlY) + IM, (8)
where I^ = T and /oi is a random disturbance term. The slopecoefficient, y, will be an empirical estimate of the marginal rate ofreturn to R & D assuming that per period R & D expendituresrepresent the relevant net investments {Ij) into the firm's stock oftechnical capital.
The Data Set and Empirical Estimates
Equation (8) was estimated using a sample of 101 firms from thechemicals and allied-products industry (SIC 28) for 1975. This in-dustry was selected for two reasons. First, it has been an industryextensively investigated in other empirical studies of Schumpeter'shypothesis (Hamberg 1964; Comanor 1965; Mansfield 1965; Scherer1965^; Grabowski 1968). Second, it is one of the four leading man-ufacturing industries in R & D activity, but it is that industry leastdependent on government R & D support. Implicit in our model isthe assumption that the entrepreneur directs R & D investmentstoward activity that will increase the firm's technological growth. Thegreater the percentage of R & D which is federally financed, the lessthe discretionary power of the entrepreneur. As well, in these feder-ally supported industries their R & D "output" (as space exploration)is sold directly to the public sector. Since these outputs are con-ventionally valued at cost by the selling industry, they have a zerocontribution to residually measured productivity {F'/F) (Griliches1973). Thus y will understate the true rate of return the greater isgovernment support. In 1975 less than 9 percent of R & D activity in

ENTREPRENEURIAL ACTIVITY 7 7 5
the chemicals industry was federally supported, compared with 45percent support in electrical equipment and 79 percent in aircraft andmissiles. The chemicals industry seems to relate more closely to theunderlying assumptions of equation (8) than do the other industrialR & D leaders.
Data were taken from the COMPUSTAT tapes of Investor's Man-agement Sciences, Inc., a subsidiary of Standard & Poor's Corpora-tion. The sample available represents 73 percent coverage of theindustry in terms of sales and 71 percent of tbe industry in terms ofR & D expenditures.
The estimation of equation (8) requires data for the rate of growthin residual productivity, FIF; for net investments in R & D, /y-; and forcurrent output, Y\ FIF was computed according to equation (5) as anannual average rate over the period 1970-75:
FIF = l/5[(ln K75 - In K,, - In PD) - /3(ln L,^ - In L™) ^ ^
X,5 - In
Few firms reported R & D data to COMPUSTAT prior to 1970; hence thisperiod defines the availability of data. In equation (9) output, Y, ismeasured as net sales of tbe firm defined as gross sales and otheroperating revenue less discounts, returns, and allowances. Theindustry-specific wholesale price deflator (1970 = 100), PD, is pub-lisbed by the Bureau of Labor Statistics in Wholesale Prices and PriceIndexes. Tbe average share of labor in total sales, /3, over tbe period1970-75 was calculated as the total labor expenditures of the firm in1973 per unit of 1973 sales. Many of the firms did not report tbeirlabor-related expenditures; therefore these data were approximatedby the product of tbe average two-digit manufacturing wage for eachgrouping as reported in tbe Census of Manufactures and the totalnumber of workers for each firm in 1973. Labor, L, was measured astbe total number of employees as reported to stockholders. Thecapital stock, K , was measured as the historic book value of gross plantrepresenting tangible fixed property such as land, buildings, andequipment. Tbe average share of capital in total sales is (1 - /8).
Theoretically, /^ represents the time derivative of the stock oftechnical knowledge, T; but having no estimate ofthe lag between R &D expenditures and tbe resulting change in T or of the rate ofobsolescence on innovations, any measure of /y will be subject toerror. In addition, there exist tbe usual caveats associated with ac-counting inconsistencies regarding that which is actually includedunder the heading R & D (Griliches 1973). The COMPUSTAT definitionof R & D includes all private costs, sucb as salaries and departmentalexpenses, charged to operations as research expense. Being unable to
7 7 6 JOURNAL OF POLITICAL ECONOMY
offer any substantial alternative to these data problems associatedwith R & D measures, I have measured (ITIY) conventionally as 1975R & D expenditures per unit of 1975 sales.
The estimated least-squares results from equation (8) are:
F-/F = - 0.07 + 0.62(IT/Y),
(-10.42) (5.43)
vfhereR^ = .ll,F = 11.79, andAf= 101; numbers in parentheses are^-statistics. The estimated rate of return to R & D is 62 percent, whichis not inconsistent with the empirical findings of others (Hamberg1964; Mansfield 1965; Griliches 1973, 1975; Terleckyj 1974; Link1978). Our interest here, however, is to test for structural changes inequation (8) over varying levels of firm size in order to determine ifthe rate of return to R & D, our measure of successful innovativeactivity, increases with firm size.
Estimates of Structural Change in theRate-of-Retum Equation
To determine, statistically, if the rate of return to R & D varies overalternative size firms, equation (8) was first tested using the Brownand Durbin (1968; Brown et al. 1975) test for structural stability.* Ifthe structure of equation (8) changes over the ranking of the re-gressor by firm size, this will result in a shift of the residuals whencompared with a model assuming constant coefficients. The teststatistic, Sr, is based on the normalized cumulative sum (cusum) ofsquared residuals from a recursive estimation model:
=k+l N, (11)
where Wi are the orthogonalized recursive residuals, k is the numberof independent variables in the equation, and N is the number ofobservations; Sr has a beta distribution with mean (r — k)/{N — k). Ifthe regression coefficients are constant, a plot of S^ will lie along itsmean value line within the confidence limits {± Co + [(r — k)l{N — k)\\defined by Pyke's modified Kolmogorov-Smirnov statistic, CQ.
In our case, the null hypothesis is that the structure of equation (8)is constant over all levels (\, . . . ,N) of firm size:
81 = 82 ~ • • • ~ 8jv = S,
Ho: r , = 72 = • • • = 7^ = y, (12)
(j\= a\= . . . = 0%= a"^,
' See Khan (1974) for a discussion of the Brown-Durbin test vis-a-vis other tests ofstructural change.
ENTREPRENEURIAL ACTIVITY 777
for o"? (i = 1 A ) being the variance of the error term in equation(8), /If. The alternative hypothesis is that a threshold effect exists andthat the estimated slope coefficient increases over alternative sizeregimes—Schumpeter's hypothesis.
The plot of the Sr's against the observation numbers of {IT/Y),ranked in ascending order of firm size, is shown in figure 1. Size hasbeen measured by other researchers as either the dollar value of salesor of total assets, or by the firm's total employment; we have used1975 sales measured in millions of dollars for our ranking. Departureof Sr from its mean denotes that observation where the structural shiftbecomes significant. It does not necessarily denote that observationwhere the shift initially began or that where only one shift occurred.Clearly, the null hypothesis of structural stability can be rejected at the99 percent level. It remains as a methodological problem to determinethat size level for dividing the data.'
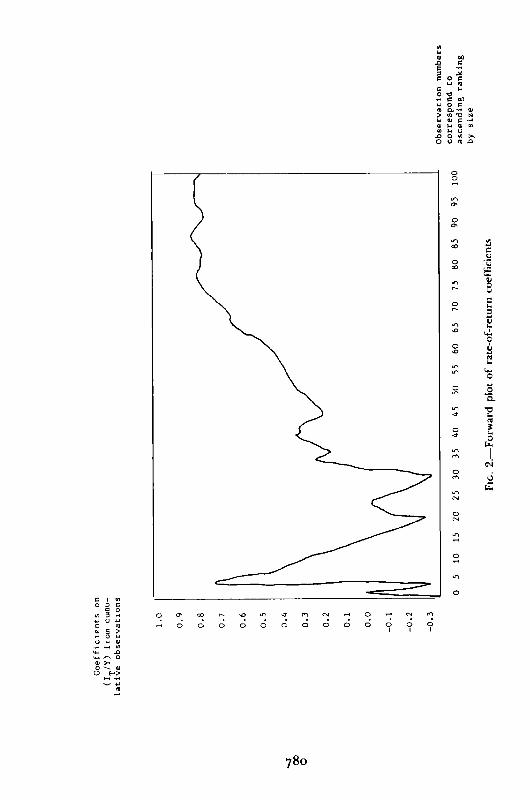
In order to determine that firm size for dividing the data intoalternative regimes, the plot of the estimated rate of returncoefficients over cumulated observations of {IT/Y) corresponding tosuccessively larger firms was examined. This forward plot is shown infigure 2. Two characteristics of the plot are immediately evident: (1)The sporadic nature of the regression slope coefficient over the initialobservations reflects the sensitivity of regression analysis to additionaldegrees of freedom, and (2) beyond observation 77 the additionalinfluence of data from successively larger firms does not seem toaffect the value of the estimated rate of return coefficient. From aninspection of figure 2, the exact division(s) of the data is strictly amatter of judgment.* The criterion used here, however, is based onQuandt's likelihood test (1958, 1960) under the maintained hypothe-sis of two regimes.* The likelihood function obtained a "maximum
' Tbe Brown-Durbin test bas been applied in several otber studies (Kban 1974;Hodgson and Holmes 1977), but tbe question of dividing the data and reestimatingeacb structural regime has not been addressed.
' Tbe backward plot of estimated rate-of-return coefficients was also examined. Itwas sporadic over initial observations but was not useful in isolating a clear point(s) ofdivision.
• I am grateful to James Durbin for pointing out that the likelibood test should beused as tbe dominant criterion for dividing tbe data and for stressing that individualjudgment and inspection of tbe specific data may, in some instances, be the moreaccurate method to employ. Postulating the existence of two regimes, FIF = 8, +y,(/r/>') + Ml and F/F = 62 + ytylr/y) + /AJ. where ft, (i = 1, 2) is normally andindependently distributed with zero mean and variance erf, Quandt's likelihood testestimates, over a total of N observations, those points where the system switches fromone regime to another (1958). Methodologically, it seems appropriate to employ thistest only after the assumption of structural stability has been statistically rejected. Thelikelihood function is L(n,) = -N log VSir - n, log &t - n, log &, - (N/2), for allpossible values of n, (n, + n, = N and n, » 3). From inspection of figure 2 it is notunreasonable to suspect that three regimes of behavior are present: a division for thesmallest firms near observation 30 and a division for the larger firms near observation

778 JOURNAL OF POLITICAL ECONOMY
maximorum" at observation 42 (in an ascending ranking) corre-sponding to a firm size of $297.2 million. Given this point of division,equation (8) was reestimated using a dummy variable, D, = 1 for firmswith sales greater than or equal to $297.2 million, interacted with(IT/Y) to estimate the rate of return in each size regime.'" Theseestimated least-squares results are:
F/F = -0.07 + 0.30(IT/Y) + 0.48D, • (/^/K);f-10.50) (1.32) (2.32) ^ '
R^ = .15, F = 8.85, and A = 101; numbers in parentheses are^-statistics. The estimated rate of return to R & D for the smaller firmsis 30 percent (significant at the 80 percent level) and for the largerfirms it is 78 percent (significant at the 99 percent level)."
II. Interpretation of the Empirical Findingsand Conclusions
The estimated results in equation (13) suggest that efficient innovativeactivity, as measured by the rate of return to R &: D expenditures, is afunction of firm size. The estimated rate of return in the larger sizegrouping is significantly greater than in the smaller firms.
The estimated threshold level for the smaller firms is $297,2 mil-lion. This level is relatively small compared with the sample's medianlevel of sales of $451 million or to its mean level of $912 million.'^ Theimportance of economies of scale in the efficiency of innovative activ-ity becomes evident at a relatively small size, but its effect appears toremain constant as firm size increases beyond that level. It does notappear that "gigantic" firm size is a prerequisite for R & D efficiencyin the chemicals industry.
The methodology employed in this paper makes it difficult tocompare our findings with those of other researchers. For example,Scherer (19656) finds from his study of the chemicals industry that
77. Accordingly, Quandt's lest was generalized to three regimes The likelihood func-tion reached an absolute maximum atn, = 46,n^ = 4, andnj = 51 corresponding to anascending ranking of firms by size. This implies either that the medium region isextremely small or that only two regimes are statistically evident. On reestimatingequation (8) with dummy variables interacted with {ITIY), it was concluded that thesmaller two regions did not behave significantly different from each other. Con-sequently, the assumption of two regimes was accepted.
'° The reestimation initially accounted for separate intercepts as well as slopecoefficients for each size regime. The intercepts were not significantly different fromeach other and thus were omitted.
" The estimated standard error for the rate-of-return coefficient in the larger sizegrouping is 0.17.
" The range of firm sales in the chemicals industry is $10.1 million to $7,221.5million, with SD of $1,298.0 million.

in oc a>P C N01 -H H
~ O wW 3 U
.3.2 c- o
•5 ° u•o -2 °
"i .-gt
o ^
3 ii.-
•g ^-E
lO Ol 1)
ia § I(in K O
779
_0Q.
-O
780

ENTREPRENEURIAL ACTIVITY 781
there is a positive and increasing relationship between R & D ex-penditures and increasing levels of firm size, and he therefore con-cludes that larger firm size is a prerequisite for innovative activity. We,on the other hand, conclude that large firm size is a prerequisite forefficient innovative activity only to a point, and then the influence ofsize remains constant. If the findings of these forms of research areimportant to antitrust "thinking" about the benefits and costs of largefirm size and even of market dominance, the contrasting conclusionsreached here may warrant a rethinking of methodology and of therelevant interpretations and implications of Schumpeter's hypothesis.
References
Arrow, Kenneth J. "Economic Welfare and the Allocation of Resources forInvention." In The Rate and Direction of Inventive Activity. Princeton, N.J.:Princeton Univ. Press (for Nat. Bur. Econ. Res.), 1962.
Brown, R. L., and Durbin, J. "Methodsof Investigating Whether a RegressionRelationship Is Constant over Time." Paper presented at the EuropeanStatistical Meeting, Amsterdam, 1968.
Brown, R. L.; Durhin, J.; and Evans, J. M. "Techniques for Testing theConstancy of Regression Relationships over Time."/. Royal Statis. Soc., ser.B 37 (December 1975): 149-63.
Comanor, William S. "Research and Technical Change in the PharmaceuticalIndustry." «?i;. Econ. and Statis. 47 (May 1965): 182-90.
Demsetz, Harold. "Information and Efficiency: Another Viewpoint."7. Lawand Econ. 12 (April 1969): 1-22.
Fisher, Franklin M., and Temin, Peter. "Returns to Scale in Research andDevelopment: What Does the Schumpeterian Hypothesis Imply?"7.P.£.81, no. 1 (January/February 1973): 56-70.
Grabowski, Henry G. "The Determinants of Industrial Research and Devel-opment: A Study of the Chemical, Drug, and Petroleum Industries."/.P.fi.76, no. 2 (March/April 1968): 292-306.
Grabowski, Henry G., and Mueller, Dennis C. "Industrial Organization: TheRole and Contrihution of Econometrics." A.E.R. Papers and Proc. 60 (May1970): 100-104.
Griliches, Zvi. "Research Expenditures and Growth Accounting." In Scienceand Technology in Economic Growth, edited by B. R. Williams. London: Mac-millan, 1973.
. "Returns to Research and Development Expenditures in the PrivateSector." Paper presented at the conference on Research in Income andWealth, New York City, November 13-14, 1975.
Hamberg, Daniel. "Size of Firm, Oligopoly, and Research: The Evidence."Canadian f. Econ. and Polit. Sci. 30 (February 1964): 62-75.
Hodgson, John S., and Holmes, Alexander B. "Structural Stability of Inter-national Capital Mobility: An Analysis of Short-Term U.S.-Canadian BankClaims." Rev. Econ. and Statis. 59 (November 1977): 465-73.
Hu, Sheng Cheng. "On the Incentive to Invent: A Clarificatory Note."/. Lawand Econ. 16 (April 1973): 169-77.
Kamien, Morton I., and Schwartz, Nancy L. "Induced Factor Augmenting

7 8 2 JOURNAL OF POLITICAL ECONOMY
Technical Progress from a Microeconomic Viewpoint." Econometrica 37(October 1969): 668-84.
-. "Market Structure and Innovation: A Survey."/. Econ. Literature 13(March 1975): 1-37.
Khan, Mohsin S. "The Stability of the Demand-for-Money Function in theUnited States 1901-1965." J.P.E. 82, no. 6 (November/December 1974):1205-19.
Kirzner, Israel M. Competition and Entrepreneurship. Chicago: Univ. ChicagoPress, 1973.
Link, Albert N. "Rates of Induced Technology from Investments in Researchand Development." Southern Econ. J. 45 (October 1978): 370-79.
Loeb, Peter D., and Lin, Vincent. "Research and Development in the Phar-maceutical Industry: A Specification Error Approach."/. Indus. Econ. 26(September 1977): 45-51.
Mansfield, Edwin. "Rates of Return from Industrial Research and Develop-ment." A.f.fl. Papers and Proc. 55 (May 1965): 310-22.
Markfiam, Jesse W. "Market Structure, Business Conduct, and Innovation."A.E.R. Papers and Proc. 55 (May 1965): 323-32.
Needham, Douglas. "Market Structure and Firms' R & D Behavior."/ Indus.Econ. 23 Qune 1975): 241-55.
Ng, Yew-Kwang. "Competition, Monopoly, and the Incentive to Invent."Australian Econ. Papers 10 Qune 1971): 45-49.
Quandt, Richard E. "The Estimation of tfie Parameters of a Linear Regres-sion System Obeying Two Separate Regimes."/. American Statis. Assoc. 53(December 1958): 873-80.
. "Tests of Hypothesis That a Linear Regression System Obeys TwoSeparate Regimes."/. American Statis. Assoc. 55 (June 1960): 324-30.
Rosenberg, J. B. "Research and Market Share: A Reappraisal of tfieScfiumpeter Hypotfiesis."/. Indus. Econ. 25 (December 1976): 101-12.
Scherer, Frederic M. "Firm Size, Market Structure, Opportunity, and theOutput of Patented Inventions." A.£.i?. 55 (December 1965): 1097-1125.(a)
. "Size of Firm, Oligopoly, and Research: A Comment." Canadian J.Econ. andPolit. Sci. 31 (May 1965): 256-66. (6)
-. "Researcfi and Development Returns to Scale and the ScfiumpeterianHypotfiesis: Comment." Mimeographed. Berlin: Internat. Inst. Manage-ment, 1973.
Scfiultz, Tfieodore W. "Tfie Value of tfie Ability to Deal witfi Disequilibria."/.Econ. Literature 13 (September 1975): 827-46.
Schumpeter, Joseph A. Capitalism, Socialism, and Democracy. 2d ed. New York:Harper & Bros., 1947.
Terleckyj, Nestor E. "Tfie Effects of R & D on tfie Productivity Growtfi ofIndustries: An Exploratory Study." Wasfiington: Nat. Planning Assoc,1974.
Worley, James S. "Industrial Researcfi and New Competition."/./'.^. 69, no.2 (April 1961): 183-86.