Embed Size (px)
Citation preview
The Consequences of Entrepreneurial Firm Founding on Innovation
Michael Ewens and Christian Fons-Rosen∗
April 2014
Abstract
This paper studies if and how individual-level patenting activity changes as an employee
transitions to entrepreneurial firm founder. Using a large database of employment and innovative
histories of over 1110 spinoff firm founders, the empirical strategy tracks both founders and her
co-inventors who remain at her previous employer. There are significant changes in patenting
focus and quality. Founders are relatively more likely to focus on fewer industry patent classes
as the lead patent author, while citing their previous work less. Their patent quality increases
after spinoff firm founding in several ways. Non-self citations received increase and the types of
patent applications point to a move towards longer-term projects. Finally, a higher probability
of producing a patent in the extremes of the quality distribution and a move to citations of
younger patents suggests that spinoff founders switch to pursuing riskier projects after firm
founding.
∗Ewens: Carnegie Mellon University, Tepper School of Business, [email protected]. Fons-Rosen: UniversitatPompeu Fabra, Barcelona GSE, and Centre for Economic Performance, [email protected]. We thankAjay Agrawal, Shai Berstein, Lee Branstetter, Wes Cohen, Deepak Hegde, Thomas Hellmann, Steven Klepper,Ines Macho-Stadler, Rajarishi Nahata, Matthew Rhodes-Kropf, Antoinette Schoar, Rosemarie Ziedonis and seminarparticipants at the SET Change Seminar (CMU), MIT TIES Group, Sixth Annual Conference on Innovation andEntrepreneurship, Fourth Entrepreneurial Finance and Innovation Conference, 6th Conference on the Economics ofEntrepreneurship and Innovation, the Barcelona GSE workshop on Economics of Science and Innovation and theNBER Entrepreneurship Working Group (SI 2013) for their comments. We also thank Correlation Ventures and DowJones VentureSource for access to the data. Gurinder Kaur provided valuable research assistance. All errors are ourown.
1
Introduction
The employees of large, established firms are a prominent source of new firm founders. These spinoff
firms dominate many industries and play an important role in the economy. Extant empirical studies
primarily study the firms that have spinoffs or explain the spinoff’s superior performance relative
to other new firms. This paper uses the patenting and employment history of the spinoff founder
to ask how her innovative output changes as she transitions to entrepreneurial firm founder. Our
aim is to understand the unique features of entrepreneurial firm innovation.
This paper makes a number of contributions. First, we build a novel database of employee to
founder mobility for a representative set of industries over 25 years that tracks patenting activity
at the inventor level. The database extends earlier work that mostly relied on firm-level data or
alternatively was limited to a few specific industries or short time period. Second, we study if and
how patenting changes in its scope and quality after spinoff formation. Understanding such changes
informs our understanding of why good employees and their ideas leave established firms. Finally,
the paper provides the first large sample evidence that riskier innovative projects leave established
firms with mobile employees.
How, if at all, should innovative activity change as an inventive employee transitions to a spinoff
firm founder? We consider three classes of changes: focus, quality and risk. The founder’s post-
spinoff patents could stray away from the core of their past employer (parent) and enter newer
industries. Surveys of spinoff founders (Bhide (2000)) and industry case studies (e.g. Klepper
and Sleeper (2005)) suggest an alternative. Here, the founder remains in the same industry and
patent classes as they were at the parent firm. Evidence for either type of focus change can reveal
motivations for the employee to founder decision. The quality of innovations produced can also
change. Most models of spinoff formation would predict higher average quality innovations due to
selection of employees to entrepreneurs, a small firm effect or signaling to investors. If patenting in
the new spinoff is instead defensive, then quality should remain unchanged. The third possibility
concerns unexplored predictions about the distribution and types of innovation. In particular, some
classes of employee mobility models posit incomplete compensation contracts or managerial time
preference as frictions that lead to exit. These models imply changes to tail of the spinoff founder’s
2
patent quality distribution and the length of the patent research project. We use rich panel data
on spinoff founder patenting to test these focus and quality change predictions.
Any attempt to compare spinoff innovation to that of established firms using firm-level data
faces several empirical challenges. The spinoffs we observe are non-random as they are a selected
set of all firms which typically outperform other new firms.1 Next, employee composition differs
substantially across types of firms. It is thus difficult to disentangle whether firm-level results are
driven by selection of individuals into firms or rather by firm-level characteristics like regulation
or management practices. A within-firm analysis can avoid these issues; however, one would need
pre-founding data for spinoffs which is obviously non-existent. Fortunately, most theories of new
firm formation through spinoffs put the firm’s founder at the center of the model.
Analysis of individual-level patenting overcomes some of the empirical challenges as we can track
patenting before and after firm founding. However, two new identification concerns arise. First,
employees who decide to found a spinoff company are not a random sample of a firm’s employees.
Second, the timing of exit depends on expectations of future success or poor performance at the
established firm. Several models and empirical studies of spinoffs (e.g. Klepper and Sleeper (2005))
show that anticipated or realized changes at the parent or industry impact exit rates. Such trends
would bias even a standard fixed effects specification.
To overcome these two issues, we want to observe the spinoff founder’s patenting activity in
the absence of the spinoff founding. Employment histories and inventor-level patenting data for
both founders and non-founders in a firm provides a potential solution to the first issue. Firm-level
shocks can help alleviate concerns about certain forms of endogenous exit timing.
Consider a researcher working at an R&D lab at IBM. She has a long patenting history, which
includes many patents co-invented with co-workers. She exits IBM to start a new firm and continues
to patent. Her past co-workers remain at the IBM lab and continue research. This collection of
inventors forms the base of our counter-factual sample and provides a plausible path of innovation
the founder would have taken had she remained at IBM. Finally, observables can aid in selecting
the best matches on pre-trends of patent outcomes (detailed below). Although this estimation
1See Klepper and Thompson (2010).
3
technique cannot determine the causal impact of the spinoff founding, it can narrow down the real
changes and possible mechanisms for such changes.
We build a database of founder employment histories, innovation activity and patent co-
inventors that uses a combination of several large datasets. We first identify the founders of the
over 21,000 entrepreneurial firms in the venture capital database VentureSource.2 Next, this infor-
mation is merged with the inventor-level patent data of Lai et al. (2011) using the entrepreneurial
founder’s employment history. These employers form the basis for an additional search of spinoffs
that do not receive venture capital finance. Our strategy requires estimating changes around the
founding event. We therefore measure patent outcomes four years prior and five years after the
entrepreneurial firm founding. Additionally, we require patent activity and co-inventorship in the
pre-founding period. These restrictions narrow the sample of founders to 3,036 VC- and non-VC-
backed founders with at least one patent (with a co-inventor at the same firm) in the four year
period prior to the startup event. Next, we find a set of matches for a difference-in-difference
specification.
Within the pool of pre-founding co-inventor/co-workers, we select our comparison group to
best represent what would have occurred had the founder stayed. These inventors must remain
at the firm and continue to patent.3 The goal is to find past co-inventors and co-workers with
similar pre-trends in patenting rate, citations made characteristics, age of patent portfolio and
citations received quality as the founder. Using a standard distance metric matching procedure
(see Imbens (2004)), we compute the distance between each potential match and the founder
(within the same firm and co-inventor network). The final sample has 9-year patenting histories
for 1131 entrepreneurial founders and 2929 matched controls. Importantly, the standard matching
diagnostics – tests of pre-treatment variables and visual pre-trend analysis – are each satisfied,
while the difference-in-difference specification mitigates many of the matching biases issues in such
estimators (see Heckman et al. (1998)).4
2Gompers, Lerner and Scharfstein (2005) use the same data that covered 1987 - 1999 to ask what characteristicsof firms explain the exit of employees to spinoffs.
3The results are unchanged if we allow matched controls to move to another firm that is not the entrepreneurialfirm, however, this setting is not our ideal counter-factual.
4Intuitively, if matching bias is time-invariant, we difference it away. Also, Heckman, Ichimura and Todd (1997)and others found improved matching procedures on labor data when matches were constrained to within geography
4
The difference-in-differences estimates show a strong tendency for spinoff founders to narrow
their innovative activity across several dimensions while working away from their patents at the
parent firm. The founder invents in fewer patent classes after founding, while increasing the rate
at which they use old references. They file fewer patents, but are relatively more likely to be the
lead inventor on any applications. We find no evidence that the typical founder enters new areas of
research through newer or previously unexplored areas. The major avenue for knowledge diffusion
is not through citations of their own patents, but rather an increased intensity of previously cited
work. These results are the first suggestion that part of the motivation for employee exit is the
ability to focus research and patenting. Next, we investigate how the quality of patents change
after spinoff firm founding.
Under this new research approach, the founders perform successfully in multiple dimensions.
First, their patents tend to be more fundamental and broad as illustrated by increases in both
originality and generality indices. The former captures the diversity of the body of knowledge a
patent builds on, while increased generality implies that founders write patents with broad impact
across multiple industries. Second, founders shift to a long-term innovation strategy as proxied by
an increase in “continuation-in-parts” (CIP) patents. Hegde, Mowery and Graham (2009) show
that these patents signal both “pioneering innovations” and projects that are slower to move to
the marketplace. We find that the founders with the slowest time to first patent are in fact those
inventors with the highest rate of CIP production.
After investigating the mean differences in focus and quality, we ask whether the variability of
the patent projects’ quality also changes after founding. A quantile regression of changes in non-self
citations received reveals a higher propensity for founders to produce patents that end up in the
extremes of the quality distribution. Such a fact is consistent with spinoff founders pursuing riskier
projects with higher failure rates at the entrepreneurial firm. These ex-post outcomes coincide
with an ex-ante change in the types of patents cited and in turn the body of knowledge supporting
the average founder. In particular, startup founders cite younger patents after firm founding. The
body of results point to a shift in innovation strategy towards riskier, long-term projects built on
or other groupings.
5
new ideas.
A picture emerges from these results and provides insights into the decision to leave an estab-
lished firm to form a spinoff. While employed, the typical inventive employee works on multiple
projects in several patent classes. She comes upon a new idea while working at the parent firm
and must decide how to proceed. The pattern of differences in our sample suggest that founders
whose innovation requires a narrow focus, a longer time frame to completion and higher failure
tolerance are more likely done outside of the parent and conducted at the spinoff. Although we
cannot conclusively show this is the sole reason for exit, the results imply that retention of inventive
employees could increase with a longer window for project completion and the high failure tolerance
(e.g. Manso (2011) and Nanda and Rhodes-Kropf (2012)).
The results are robust to several alternative explanations. For example, changes in patenting
could stem from defensive rather than innovative choices. First, the slower rate of patenting suggests
that founders are not aggressively protecting themselves. Further, sub-sample of VC-backed spinoffs
that receive capital from their parent firms shows little change in results. An alternative form of
patent application called a “continuation” is often used as a way to protect rather than innovate.
Spinoff founders do not increase their use of these patent types after founding. Overall, the evidence
shows that defensive patenting cannot completely explain the differences in innovative activity.
Next, the exit of the founder could negatively impact her past co-inventors and drive the
estimates of the difference-in-difference.5 In a sub-sample analysis, we recreate the matched sample
by re-sorting the best matches by those that have the least pre-spinoff interactions with the founder.
For example, a past co-inventor may have only written two of her 10 patents with the founder and
is thus unlikely to be impacted by the exit. The main results are unchanged with this alternative
matching distance criterion. We conclude that the estimates are not driven by a patent version of
“superstar extinction.”
Next we address some endogenous exit timing concerns. Research shows higher intra-industry
spinoff rates around the time of acquisitions and CEO changes.6 For example, the founder could
anticipate worse innovation success after a CEO replacement and leave to maintain her innovative
5See Azoulay, Zivin and Wang (2010) for an example in medical publishing.6See Klepper (2009) for a survey and Eriksson and Moritz Kuhn (2006) for an example using Danish firms.
6
output. We consider a set of founders exits that do not occur within a year of an acquisition or
CEO change. If the previous results could be explained by these lifecycle effects, this sub-sample
should have weaker estimates. The smaller sample limits power, however, generality and the rate of
CIP are slightly lower. The results overall suggest that major corporate events are not driving our
results. Last, we rule out whether the estimates could have happened by chance with a standard
matching falsification test that reassigns founders as non-founders.
The results contribute to a literature on new firms and spinoffs. Gompers, Lerner and Scharf-
stein (2005) take similar employment histories of entrepreneurial firm executives and show a strong
predictor of exit at an established firm was previous VC-backing. Their evidence that spinoffs
differ in patent classes from parents relates to our evidence on patent focus for founders. We ex-
tend their work by studying the ex-post differences in individual-level innovation around employee
exits rather than their antecedents. Our empirical analysis reveals significant differences in patent
output with close connections through citations, providing support for the model of Cassiman and
Ueda (2006).7 Singh and Agrawal (2011) also study mobility in the patent data with a focus on
movement between existing firms, while Chatterji (2008) studies similar movement in the medical
device industry. Our study differs with a focus on new firm formation and inventor-level patent
portfolio changes. Importantly, the observed knowledge diffusion occurs between the founder and
the non-self knowledge references in her pre-spinoff patent stock.
The paper also contributes to the literature on the role of venture capital in innovation. Hellman
and Puri (2000) find that venture capitalists select more innovative firms (i.e. products in untested
markets) and help those firms move to market quickly. Our founder to employee estimation reveals
how these innovative firms distinguish themselves. Kortum and Lerner (2000) study the causal effect
of VC financing on patenting rates and find increases in patenting after a random shock to the supply
of VC. The current paper provides a lens on the micro-level relationship between VC and innovation
and details how the innovation differs from other firms. The changes in innovation around founding
are consistent with the Bernstein (2013) study of firm-level innovation and IPOs. Whereas this
switch from private to public firm negatively effects innovation, the analysis of established to
7Other theories that provide a rational explanation for exits of quality innovation from firms include Hellmann(2007) and Klepper and Thompson (2010).
7

private (i.e. entrepreneurial firm) here finds the converse. Last, our empirical strategy extends that
of Lerner, Sorensen and Stromberg (2011) who study the change in patenting around leveraged
buyouts. We investigate new firm formation through spinoffs, while our identification strategy
highlights new features about innovative activity in another part of private equity.
1 Data
Our goal is to document the employment and patenting histories of entrepreneurial founders who
leave established firms in the U.S. The data construction begins with a rich set of entrepreneurial
firms and their founders who are backed by venture capital and extends to a set of firms that do not
raise VC. We start with the VentureSource dataset of venture capital financings, entrepreneurs and
investors provided by Dow Jones. This database covers a near-population of U.S. venture capital
financings from 1990 to the present. The important entrepreneurial firm characteristics for this
study are founder(s), founding year, first venture capital financing and industry. We stop tracking
founders and entrepreneurial firms were founded after 2007 so we have ample time to track the
post-founding characteristics.8 Entrepreneurial firms also exit the sample when they have an initial
public offering, are acquired or failed. This restrictions avoids comparing established firms to others
of the same type after ownership changes.
We have the full management and founding team for over 80% of the 21,000 VC-backed en-
trepreneurial firms in the full sample. From these, we first identify the founder using the firm’s
website, Capital IQ and web searches we identify 31,160 (co-)founders. The VentureSource data
also provides an employment history of these newly identified founders as of the time they start
the firm, which we take to the Lai et al. (2011) inventor-level database.9
Matching entrepreneurial founder to inventor of a particular patent requires several steps,
greatly facilitated by (i) the employment histories and (ii) the unique inventor identifiers in Lai
et al. (2011). A fuzzy string match of the unique past employers associated with founders and
8We filled in 55% of missing founding years with searches of both the California and Delaware secretary of statewebsites that list articles of incorporation information. Any remaining missing founding dates were assumed to beat the first VC financing event.
9Many were missing, so another data collection exercise similar to the founder identification was required to findemployment histories.
8
company name on the patent application (i.e. assignee) retrieves the firm identifier from the patent
data.10 For example, a founder has an employment history of “Lead engineer, IBM; Software ar-
chitect, Sun.” This identifier in hand, the task of finding the founder’s name in the inventor pool
is simplified and more accurate by narrowing the search to within the founder’s full set of past
employers. The weakest matches and all possible false negatives – 17,000 founders – were then
hand-checked with Google Patent Search.11 Some 20% of founders have a patent, although many
of these are single patents over a long career. When we focus on the years four years prior to the
entrepreneurial firm founding, there are 3,036 founders with at least one patent.
1.1 Non-VC-backed spinoffs
For many of these VC-backed entrepreneurial firm founders, we can identify the employer for which
they patented immediately prior to the spinoff firm founding.12 The pool of these established firms
forms the basis of an additional search for non-VC backed spinoffs. The Appendix provides details
on the data collection process, which we briefly summarize here. Starting with these “parent”
firms, we isolate inventors who switch to other firms (i.e. assignees) in the patent data. Next, these
potential founders are required to be on one of the firm’s first three patents. We now have a large list
of over 11,000 potential spinoffs that spawned from our parent sample. We identify firm founding
dates using the Delaware and California Secretary of State websites that list incorporation dates.
These two states are very popular locations to incorporate new firms and also provide relatively
easy access to firm information online. In the end, we find 6,329 incorporation dates (over 50% of
the sample).13 In the last step, we require that the potential founder patented at most one year
prior or two years after the incorporation date. If the inventor satisfies all of these criteria, we
label her a founder of the firm and the firm a spinoff or spawn of the parent firm. We find 1,591
non-VC-backed spinoff founders.
10A random set of 1000 of these matches were hand-checked manually using the more detailed founder biographiesavailable on websites or in Capital IQ.
11An RA searched for the inventor’s full name and the employer name. If they found a match, we saved availablepatent numbers and merged back with Lai et al. (2011). Confirmation of the merge was done using the year ofentrepreneurial firm founding to remove false positives.
12Some founders have pre-founding patents at firms that lack an identifier in the patent data.13The data is available at: https://github.com/michaelewens/inventor-data-more.
9
Combined with the VC-backed founders, this additional set of founders forms the basis of the
major sample of analysis. Section 2 details the construction of this sample, which will end up
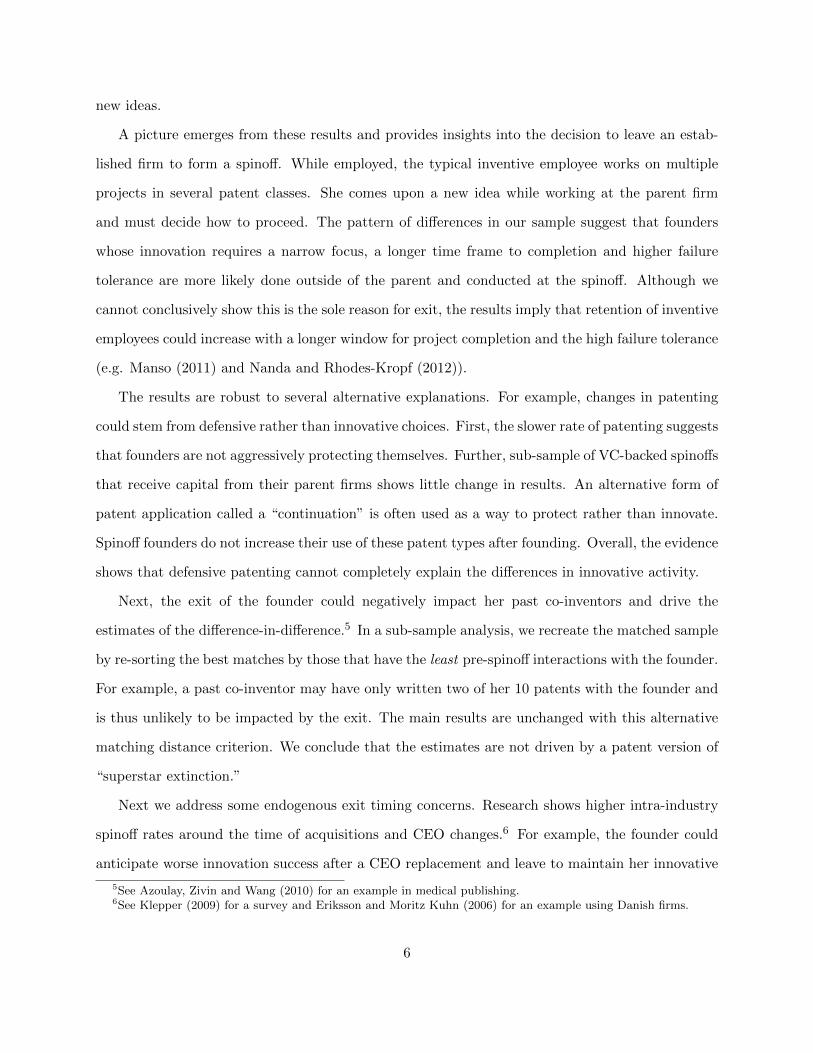
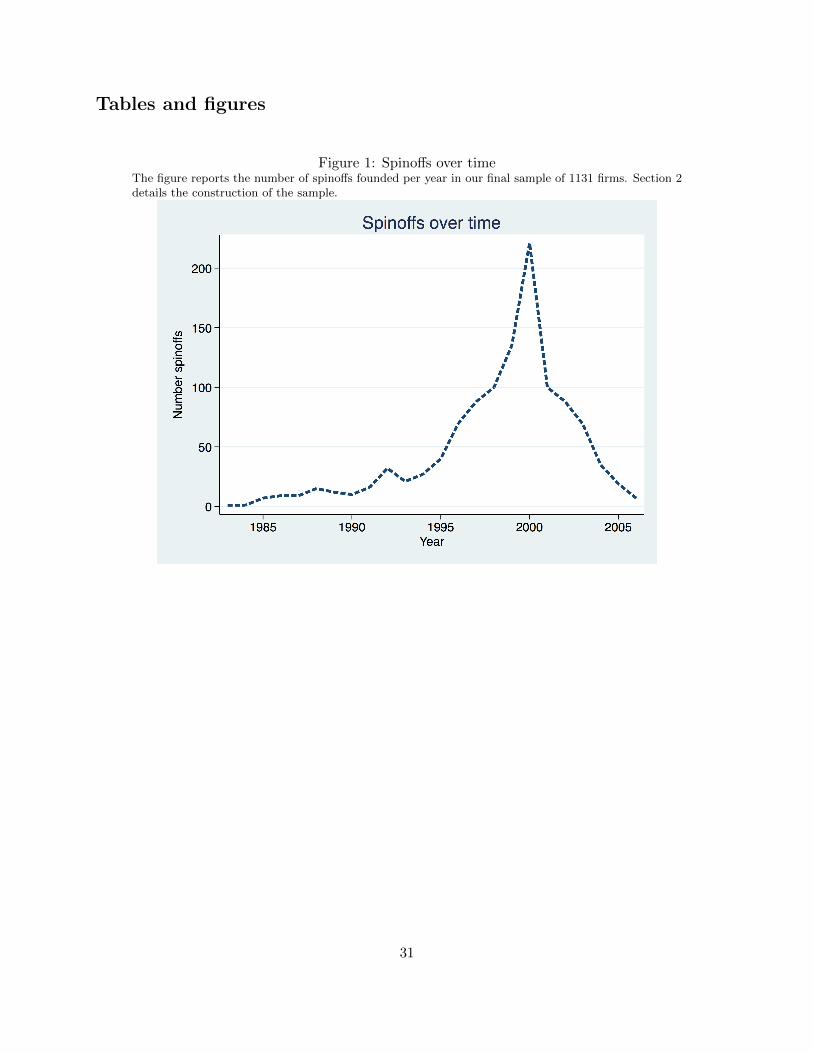
including 1131 founders and their spinoff firms. Figure 1 shows the rate of spinoff formation in the
final sample. At its peak, over 250 firms formed in 2000, while an average of 35 firms were founded
each year.
1.2 Parents and analysis timeframe
The top pre-founding employers for all the founders in our final analysis sample are listed in Table
3.14 The largest source of new entrepreneurial firms is IBM followed by many well-known firms
in technology, biotech and communications. For these spinoffs, some 48% founded in California,
while Massachusetts and Texas account for 10% and 6% respectively. The time period of interest
for each founder and her entrepreneurial firm is four years prior to five years after the founding
year.15 We chose five years after as the average entrepreneurial firm in the VentureSource database
exits without failure in approximately five years. The pre-startup period was chosen to balance the
matching goals and any age issues with patent variables. The results are insensitive to a choice of
five or three years prior to the founding. With the time period set, we then eliminate any patents
that are filed with the parent firm after the founding date of the spinoff, which could be due to a
lag in patent filing.
1.3 Patent variables
We consider a diverse set of patent characteristics to capture two broad features of the innovation
process around spinoff formation. The first set considers how the patents look at the time of
application. The first variable “# active patent classes” tracks the unique number of the seven
major patent classes an inventor patents in during a period of time. Next, “% repeat cites made”
tracks the fraction of an inventor’s cites made in year t that were cited by that inventor in the
previous two years (including self-cites). This variable measures the use of the same body of
14This set of firms is a similar to those used in Gompers, Lerner and Scharfstein (2005), however, they study allmanagers of entrepreneurial firms who left publicly-held companies.
15Again, if the firm has an IPO or other exit this latter interval stops.
10
knowledge over time. The “# patents” variable counts the total patent applications in a time
period, while “% self-cites” computes the fraction of cites made that reference any of the inventor’s
previous patents. The average patent has at least two inventors and one or many of them can be
labeled a “Lead.” Over a time period, we calculate the fraction of patents for which the inventor
is listed as a lead. Last, we construct a measure of patent technology class age using the original
patent classification system in the NBER data.16 For the major subclasses of the seven patent
classes, the age measure is normalized to be zero when they first appear in the database and one
at the end (2007). This normalization attempts to capture variation in the speed of a patent class’
use over time.
The second set of patent variables broadly capture innovation quality. We start with the
standard count on non-self citations received, which we measure year by year for the inventor’s
patent stock. Citations received are often zero, while a few patents can receive thousands of
citations. To address any concerns that the mean cites received is uninformative, we also conduct
a quantile regression analysis. Here, we ask whether the relative impact of a founder on citations
received differs in the right and left tails of quality distribution. For example, does the founder and
founding choice also impact the 90th percentile of the cites received distribution?
The final quality measure captures commercialization activity and long-term research projects.
The patent data contains a type of filing called a “continuation-in-part”(CIP) that proxies for this
activity. CIPs are often used to build off of an already patented idea that is still in the application
process to stake claims to particular commercial uses of an invention. Hegde, Mowery and Graham
(2009) also show that CIPs are a good proxy for “pioneering innovation” and are more likely used
by R&D-intensive firms. In particular, they cite industry surveys and provide empirical analysis
that show continuations help provide additional protections for products that “take a relatively
long time to reach the marketplace” (pp 1214). The variable “%CIP” is the fraction of all patents
in an inventor’s portfolio that have this designation over a given time period.
16The patent office often re-classifies existing patents to a new system, making simple patent age difficult.
11
2 Empirical strategy
To address if and how the patenting activity of entrepreneurial firm founders changes, we first
construct a sample of control inventors. We then detail a difference-in-difference strategy to estimate
changes after the firm founding.
2.1 Finding controls
Even with knowledge of the full patenting and employment histories of the entrepreneurial founder,
any analysis of simple within-founder changes in patenting around spinoff founding is confounded
by a host of unobservables. A within-founder analysis centered on the spinoff founding lacks a
benchmark or comparison group, particularly if the set of founders are non-random. Fortunately,
the co-inventorship and co-worker network in our merged dataset presents a solution. These con-
nections invite an analysis of how the same inventor patents in two different firms. Our goal is
to collect inventors that approximate what would have happened had the entrepreneurial founder
remained at the firm.
For each of the entrepreneurial founders with a patent around the spinoff founding, we select
all co-inventors on patents associated with the last assignee that appears in their patent portfolio
the year immediately prior to the founding event. Restricting our potential controls to this set
alleviates many issues in matching estimators that have few observables available (see Heckman,
Ichimura and Todd (1997)). The final difference-in-difference estimation requires that the “best
matches” have parallel trends to that of the founder, so we include pre-trends of our variables of
interest. Section 1.3 details the patent variables, many of which are measured years after patent
application. We narrow the set of match variables to patenting rate, generality, originality and
citations received and calculate their growth rates with the terminal date set to the year prior to
the founding event. The final matching procedure uses one year and two year rates. Additionally,
we want to ensure that the founders and co-inventors are similar by age and speciality, so we include
year they first appeared in the patent data and the share of patents in each patent class.
We follow the common approach in the matching literature and measure the Mahalonobis
12
distance for each potential match.17 To select the best matches, we use a version of caliper matching,
where the distance threshold is set by the full sample mean distance. That is, a potential match
is kept if the distance between her and the founder is less than the average distance across all
matches. Many inventors collaborate on patents that combine disparate skill sets. For example, a
semiconductor is often a combination of software and hardware. Co-inventors on such patents are
in fact quite dissimilar in their skill sets and choice of exit decision. Thus, our caliper threshold
eliminates some patenting founders whose best matches are quite poor relative to the typical match.
If a founder lacks at least one control below the mean threshold, however, we select the closest match
if that match’s distance is below the 75th percentile of match distance.
Additional requirements of the estimator change the sample. Some founder’s controls have
insufficient patenting activity in the five years after spinoff, while some founders stop patenting
themselves at the spinoff. The matching distance threshold and these two constraints leave us with
1131 founders with at least one matched co-inventor in the pre- and post-spinoff period. There are
2929 non-founder inventors for an average of 2.6 matches per founder.
Diagnostics
How well do the matches perform? Table 2 presents the means of the match inputs and other
observables, where the mean is computed across all groups. As the differences and t-tests demon-
strate, the samples are statistically similar in the pre-startup period. Founders entered the patent
data approximately one year prior to the average control and had more general patents as of the
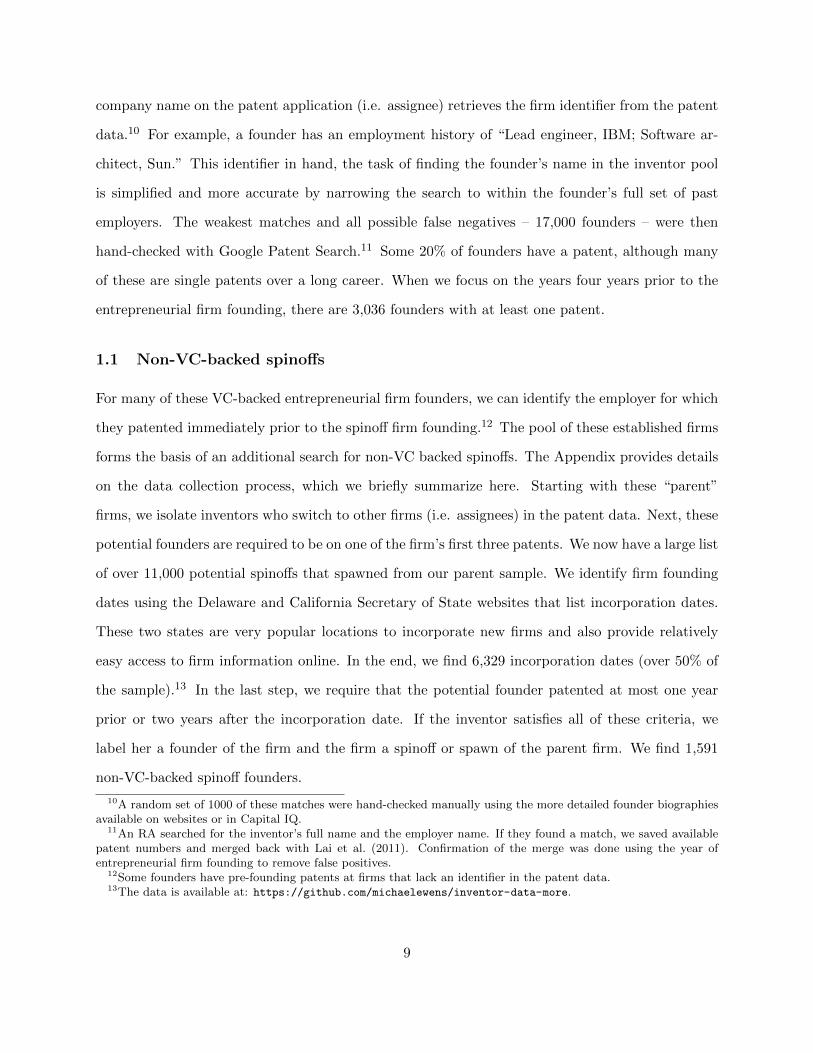
founding year. Second, Figure 3 previews one of the main empirical estimates and demonstrates
the efficacy of the match. The figure shows the coefficients and 95% confidence intervals of the nine
interaction terms of years around spinoff founding and a founder dummy variable. The estimates
exhibit no strong trend (the excluded category is the year prior to startup). Plots for other variables
are similar in a lack of pre-trends. The strong match on observables is encouraging and perhaps not
surprising given our narrow focus within the co-inventorship and co-worker group. These matched
founder-co-inventor groups (hereafter, cohorts) can now address our questions.
17This distance behaves like a Euclidean norm, but assigns weights to variables that are inverse to their variances.The results are insensitive to using the Abadie and Imbens (2006) distance metric.
13
2.2 Empirical model
The main specification is a difference-in-difference estimator with a founder-matched co-inventor
group. The number of controls vary for each founder, so we follow Abadie, Diamond and Hain-
mueller (2010) and create a “synthetic control.” Simply, each variable of interest (e.g. patenting
rate) is averaged across controls where the weight is the inverse of the calculated match distance.18
Let Pit be one of the patent variables described in Section 1 where the event time is defined in the
range t ∈ [−4, 5]:
Pilt = γ0 + Founderi +5∑
t=−4,t 6=−1
βtTt +5∑
t=−4,t 6=−1
ρtFounderiTt + εit (1)
where i indexes inventor.19 The dummy Founderi is one if inventor i a founder and Tt are the event
time dummies with T−1 the excluded categories. If the average founder differs from her matched
co-inventors after startup, then we expect ρs 6= 0 for s ≥ 0.
Estimates from equation (1) provide a test of the parallel trends assumption of the matching
algorithm. As discussed, patenting rate and other measures demonstrate a good pre-founding
match (Figure 3 and Table 2). Our main estimation uses a variant of (1) because disaggregation
of patenting variables by year results in noisy estimates, while the long time series raises serial
correlation issues (see Bertrand, Duflo and Mullainathan (2000)).
For each founder and group of controls, we calculate averages of the patent variables in two
intervals. The first is four years prior to the firm founding ([−4,−1]) and the second is the startup
year up to five years after ([0, 5]). The averages are weighted by the number of patents applied in
each year (if relevant). The new estimation becomes:
Pit = β0 + β1 ∗Afterit + β2Founderi + β3Founderi ∗Afterit + εit (2)
where indices are as in (1), t ∈ {0, 1} for the pre- and post-founding periods and “After” is a
dummy equal to one for the latter. The parameter of interest is β3, which measures the difference
18Results are similar when we have one observation per control, however, this approach gives relatively more weightto founders with more controls.
19An inventor i may be matched with multiple founders for the control sample.
14
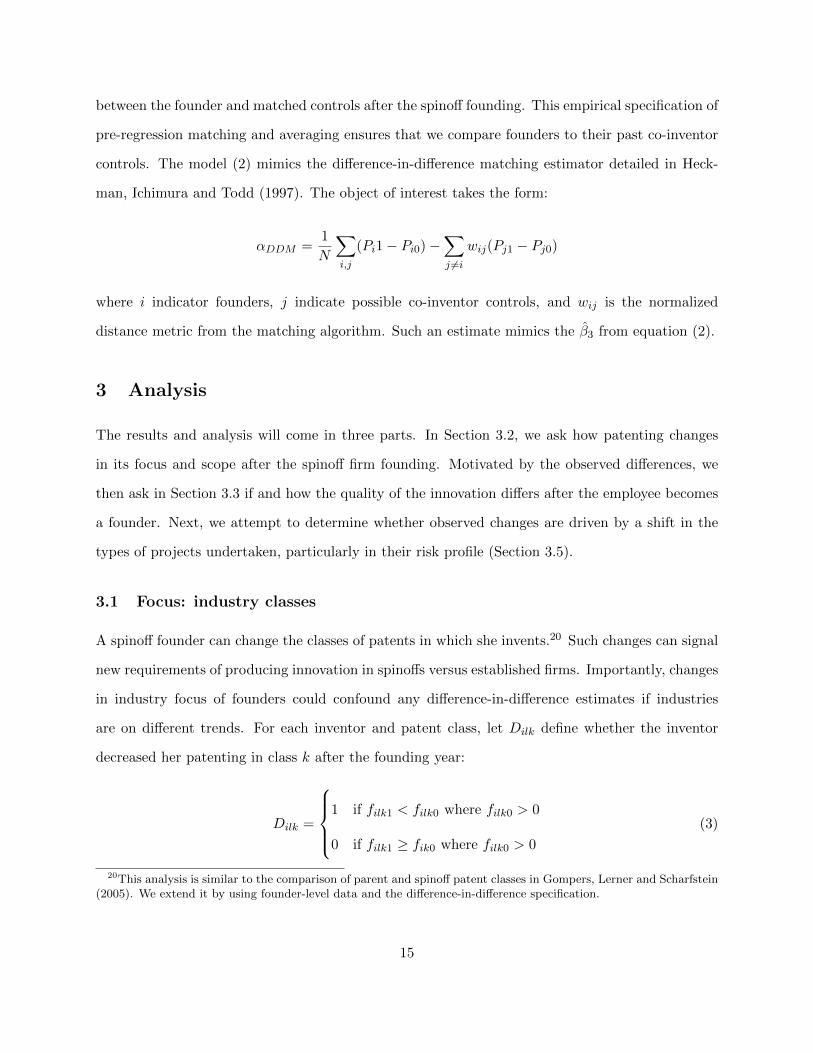
between the founder and matched controls after the spinoff founding. This empirical specification of
pre-regression matching and averaging ensures that we compare founders to their past co-inventor
controls. The model (2) mimics the difference-in-difference matching estimator detailed in Heck-
man, Ichimura and Todd (1997). The object of interest takes the form:
αDDM =1
N
∑i,j
(Pi1− Pi0)−∑j 6=i
wij(Pj1 − Pj0)
where i indicator founders, j indicate possible co-inventor controls, and wij is the normalized
distance metric from the matching algorithm. Such an estimate mimics the β3 from equation (2).
3 Analysis
The results and analysis will come in three parts. In Section 3.2, we ask how patenting changes
in its focus and scope after the spinoff firm founding. Motivated by the observed differences, we
then ask in Section 3.3 if and how the quality of the innovation differs after the employee becomes
a founder. Next, we attempt to determine whether observed changes are driven by a shift in the
types of projects undertaken, particularly in their risk profile (Section 3.5).
3.1 Focus: industry classes
A spinoff founder can change the classes of patents in which she invents.20 Such changes can signal
new requirements of producing innovation in spinoffs versus established firms. Importantly, changes
in industry focus of founders could confound any difference-in-difference estimates if industries
are on different trends. For each inventor and patent class, let Dilk define whether the inventor
decreased her patenting in class k after the founding year:
Dilk =
1 if filk1 < filk0 where filk0 > 0
0 if filk1 ≥ fik0 where filk0 > 0
(3)
20This analysis is similar to the comparison of parent and spinoff patent classes in Gompers, Lerner and Scharfstein(2005). We extend it by using founder-level data and the difference-in-difference specification.
15
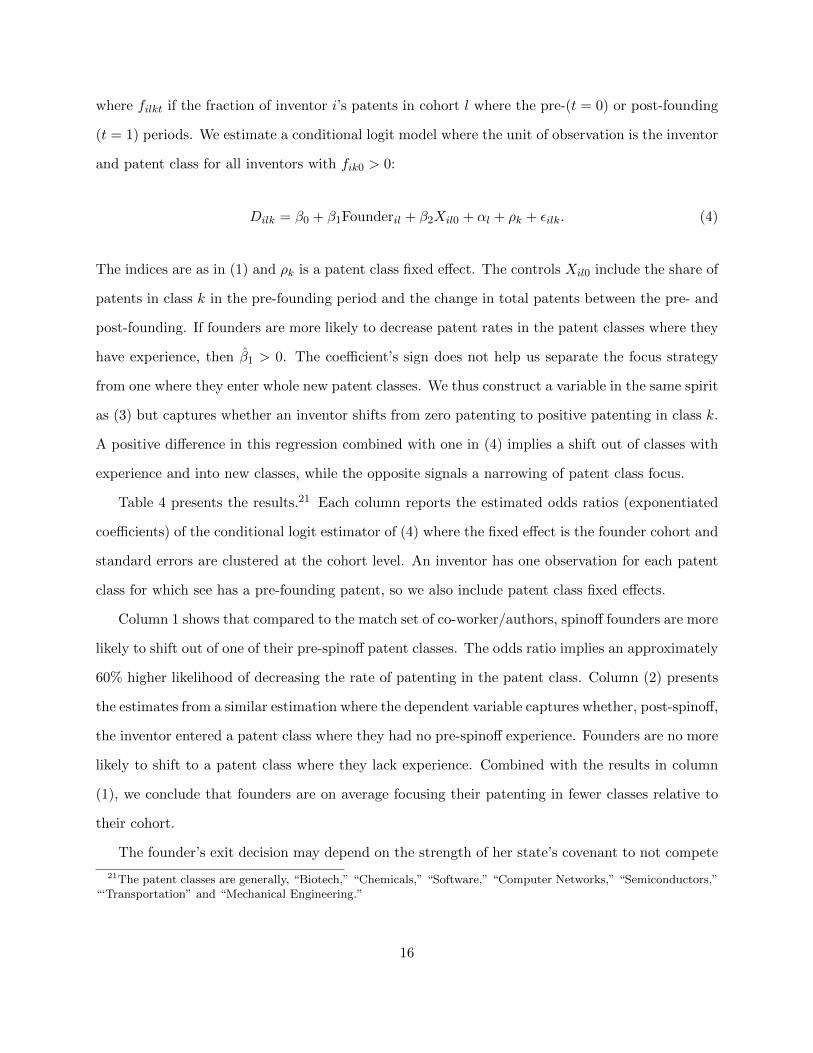
where filkt if the fraction of inventor i’s patents in cohort l where the pre-(t = 0) or post-founding
(t = 1) periods. We estimate a conditional logit model where the unit of observation is the inventor
and patent class for all inventors with fik0 > 0:
Dilk = β0 + β1Founderil + β2Xil0 + αl + ρk + εilk. (4)
The indices are as in (1) and ρk is a patent class fixed effect. The controls Xil0 include the share of
patents in class k in the pre-founding period and the change in total patents between the pre- and
post-founding. If founders are more likely to decrease patent rates in the patent classes where they
have experience, then β1 > 0. The coefficient’s sign does not help us separate the focus strategy
from one where they enter whole new patent classes. We thus construct a variable in the same spirit
as (3) but captures whether an inventor shifts from zero patenting to positive patenting in class k.
A positive difference in this regression combined with one in (4) implies a shift out of classes with
experience and into new classes, while the opposite signals a narrowing of patent class focus.
Table 4 presents the results.21 Each column reports the estimated odds ratios (exponentiated
coefficients) of the conditional logit estimator of (4) where the fixed effect is the founder cohort and
standard errors are clustered at the cohort level. An inventor has one observation for each patent
class for which see has a pre-founding patent, so we also include patent class fixed effects.
Column 1 shows that compared to the match set of co-worker/authors, spinoff founders are more
likely to shift out of one of their pre-spinoff patent classes. The odds ratio implies an approximately
60% higher likelihood of decreasing the rate of patenting in the patent class. Column (2) presents
the estimates from a similar estimation where the dependent variable captures whether, post-spinoff,
the inventor entered a patent class where they had no pre-spinoff experience. Founders are no more
likely to shift to a patent class where they lack experience. Combined with the results in column
(1), we conclude that founders are on average focusing their patenting in fewer classes relative to
their cohort.
The founder’s exit decision may depend on the strength of her state’s covenant to not compete
21The patent classes are generally, “Biotech,” “Chemicals,” “Software,” “Computer Networks,” “Semiconductors,”“‘Transportation” and “Mechanical Engineering.”
16
laws (see Marx, Strumsky and Fleming (2009)). That is, these laws’ strength increase the likelihood
a new firm starts in an industry that differs from the parent firm. Although the results go in
the opposite direction of what such restrictions would predict, columns (3) and (4) repeat these
regressions on the subset of states that have weak covenant to not compete laws (see Malsberger
(2008) for the index). The robustness check illustrates these legal restrictions are not a first-order
concern. Overall, we find no evidence of a shift to new industries, but rather a focus on patent
classes that are connected to both the founder and established firm’s past. Additional analysis of
the other patent characteristics will help us understand the changes at founding.
3.2 Focus: patenting activity
We next study if and how the scope of patenting activity changes for the entrepreneurial firm
founders after they exit the parent firm. We consider two basic scenarios. In the first, the spinoff and
its founder work on ideas and innovations that are closely tied to the parent firm. The Bhide (2000)
survey of small firm founder showed that the vast majority used ideas that they arrived at while
working at their parent firm. Similarly, research shows that in both the laser and semiconductor
industry, spinoffs are likely to enter the same industry and produce product similar to those of the
parent firm (see Klepper (2009) for a review). Alternatively, the spinoff founder could have an idea
at the parent firm that is tangential to the parent’s product space and innovation capabilities. Here,
the spinoff founder’s patents will enter new, possibly younger patent classes while her post-spinoff
patents build off of a different knowledge base than what she used at the parent.
Table 5 presents estimates from equation (2) for the six focus variables discussed in Section 1.3.
There is no evidence that the founder moves into newer patent classes after the startup (“# active
patent classes”) as found in Table 4. The rate of citing the founder’s early work falls relatively
more after founding, however, she increasingly uses the same body of references that are not her
own. Simply, it appears that founders do not build directly on their old work, but rather increase
their focus in the same area of research. This result extends that of Chatterji (2008) who finds the
superior performance of spinoffs in the medical device industry is not driven by parent-to-spinoff
diffusion. Next, the rate of patenting falls and founders are relatively more likely to be lead authors.
17
Last, consistent with the decrease in active patent classes, founders do not focus their energies on
relatively younger patent sub-class areas.
This collection of results reveals that founders increasingly exploit the same knowledge base
that they used at their parent firm, while simultaneously focusing on a more narrow range of ideas.
We find no evidence of the average founder innovating in newer industries or shifting to relatively
unknown areas. The lack of dramatic change in industry class or focus ensures that the diff-in-diff
results discussed below are not primarily driven by new industry trends after spinoff founding. A
simple explanation for these changes is the shift from a large to small firm, where the latter has
fewer resources such as co-workers. Alternatively, the spinoff firm provides the opportunity to work
on a new, single project is familiar areas. We next ask if and how this more focused innovative
translates into higher quality and more impactful patents.
3.3 Quality hypotheses
Our sample of entrepreneurial founders likely choose to exit their parent firm and did so with
an expectation that their innovative activity would improve. Nonetheless, there are a range of
predictions about if and how innovation quality should change. Nearly all stories of the spinoff
founding choice involve a new, high quality idea. Independent of any effects of moving to a new
firm with this idea, it is clear that innovation would increase. We call this the “good ideas leaving”
scenario. This prediction is consistent with a large body of work that shows spinoffs are of higher
quality than other new entrants. Models of patents as signals for investors (e.g. VCs) also predict
a higher level of innovation quality after founding (see Hsu and Ziedonis (2007)). Patent quality
does not necessarily have to increase. For example, the patenting activity of spinoffs could be
primarily driven by legal concerns or the employee could have proposed a new product that would
simply cannibalize the parent’s revenues. In these scenarios, it is plausible that no change in quality
occurs. More nuanced predictions about innovation quality stem from reasons why the parent let
the invention leave.
A major change when an employee becomes a founder is the simultaneous change from employer-
to employee-owned innovations. Ownership of innovation plays a role in many models of employee
18
spinoffs (e.g. Hellmann (2007)). Further, Anton and Yao (1995) and Manso (2011) provide ad-
ditional justification employee exit from the parent firm with a new idea. An idea may require a
very long research period and have a high failure rate. As Manso (2011) frames the problem, there
are often differing mechanisms available to motivate and contract on exploitative versus exploratory
innovation. These agency explanations for spinoff formation provide some predictions on additional
dimensions for quality changes. Pioneering, long-term research – exploration – is more likely to
suffer contracting problems. Recall that CIPs have been shown to be good proxies for “pioneering
innovations” and used by R&D-intensive firms with slow-to-market projects (see Hegde, Mowery
and Graham (2009)). Large, established firms are often burdened by short-term financial goals,
while typical compensation contracts are limited in their ability to incentivize employees to exert
effort towards these innovations. The small firm with inventor-owned patents can potentially solve
this problem and lead to exit. Next, high failure rate innovative projects may be too risky for large
parent firms. If these risk conflicts are a source of spinoffs, then we would expect both the right
and left tail of patent quality distribution to change. An analysis of the relative impact of founding
on the upper and lower parts of the cites received distribution can help answer this question. We
take these predictions to the data.
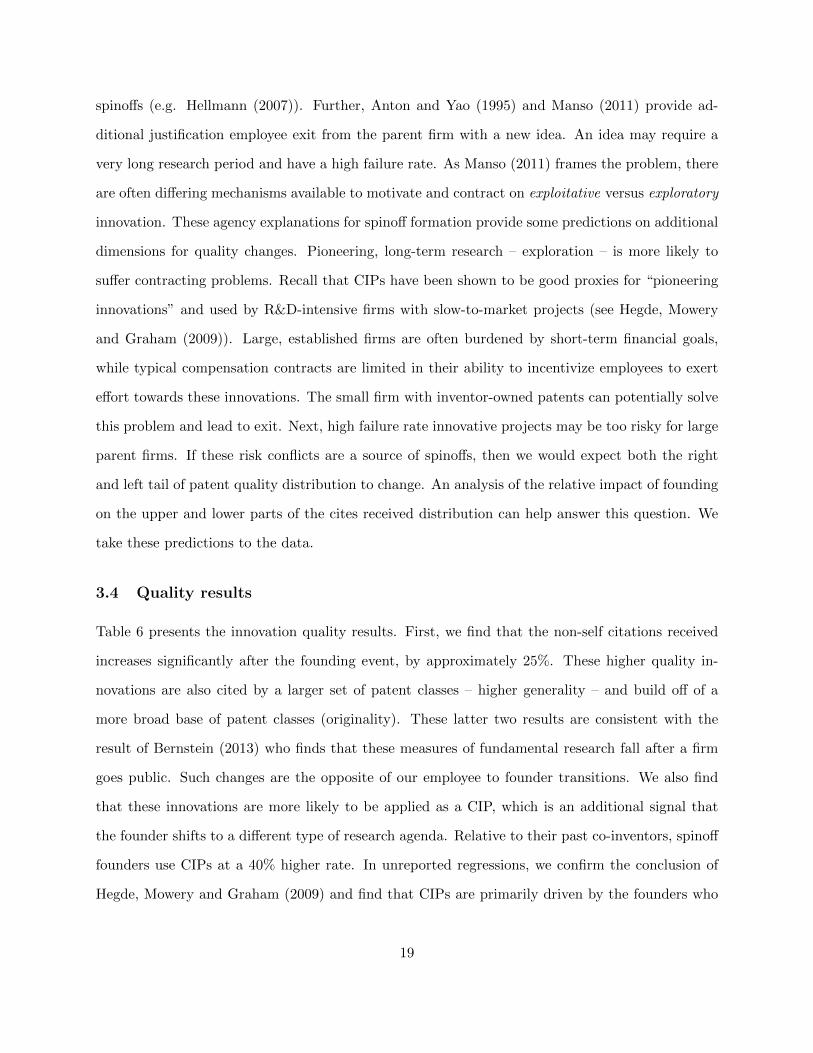
3.4 Quality results
Table 6 presents the innovation quality results. First, we find that the non-self citations received
increases significantly after the founding event, by approximately 25%. These higher quality in-
novations are also cited by a larger set of patent classes – higher generality – and build off of a
more broad base of patent classes (originality). These latter two results are consistent with the
result of Bernstein (2013) who finds that these measures of fundamental research fall after a firm
goes public. Such changes are the opposite of our employee to founder transitions. We also find
that these innovations are more likely to be applied as a CIP, which is an additional signal that
the founder shifts to a different type of research agenda. Relative to their past co-inventors, spinoff
founders use CIPs at a 40% higher rate. In unreported regressions, we confirm the conclusion of
Hegde, Mowery and Graham (2009) and find that CIPs are primarily driven by the founders who
19
take the longest to complete their first patent. Overall, the average founder is as predicted: higher
quality.
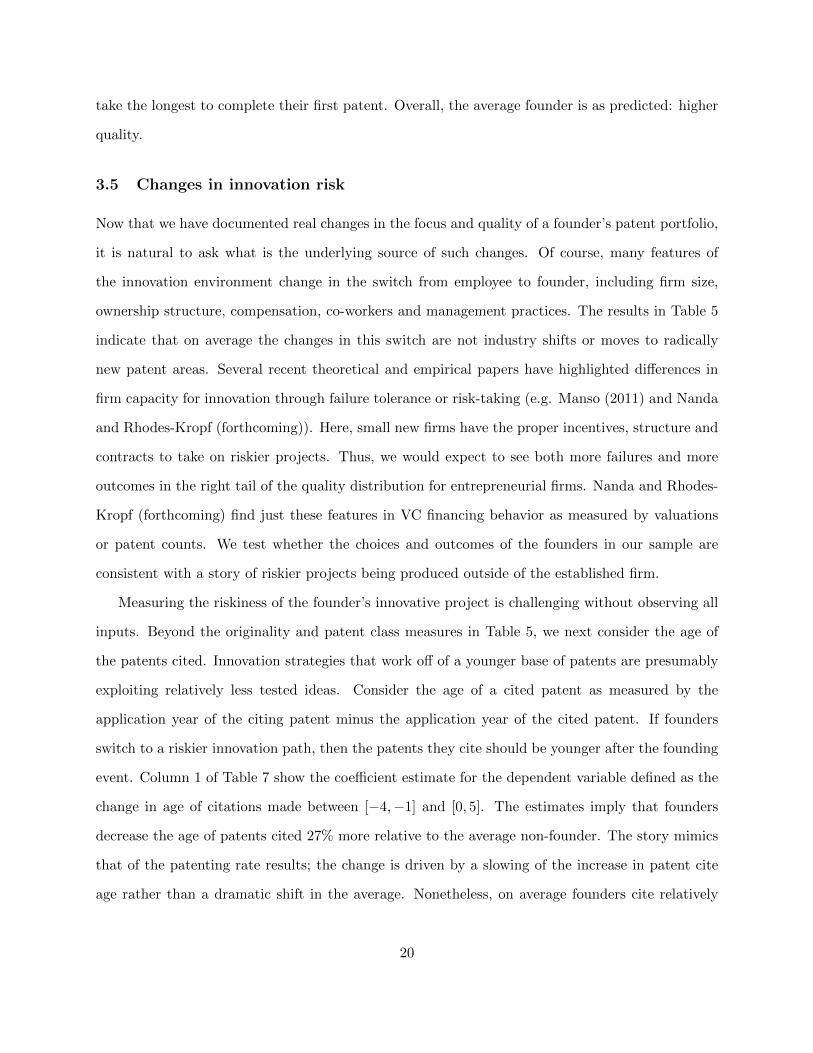
3.5 Changes in innovation risk
Now that we have documented real changes in the focus and quality of a founder’s patent portfolio,
it is natural to ask what is the underlying source of such changes. Of course, many features of
the innovation environment change in the switch from employee to founder, including firm size,
ownership structure, compensation, co-workers and management practices. The results in Table 5
indicate that on average the changes in this switch are not industry shifts or moves to radically
new patent areas. Several recent theoretical and empirical papers have highlighted differences in
firm capacity for innovation through failure tolerance or risk-taking (e.g. Manso (2011) and Nanda
and Rhodes-Kropf (forthcoming)). Here, small new firms have the proper incentives, structure and
contracts to take on riskier projects. Thus, we would expect to see both more failures and more
outcomes in the right tail of the quality distribution for entrepreneurial firms. Nanda and Rhodes-
Kropf (forthcoming) find just these features in VC financing behavior as measured by valuations
or patent counts. We test whether the choices and outcomes of the founders in our sample are
consistent with a story of riskier projects being produced outside of the established firm.
Measuring the riskiness of the founder’s innovative project is challenging without observing all
inputs. Beyond the originality and patent class measures in Table 5, we next consider the age of
the patents cited. Innovation strategies that work off of a younger base of patents are presumably
exploiting relatively less tested ideas. Consider the age of a cited patent as measured by the
application year of the citing patent minus the application year of the cited patent. If founders
switch to a riskier innovation path, then the patents they cite should be younger after the founding
event. Column 1 of Table 7 show the coefficient estimate for the dependent variable defined as the
change in age of citations made between [−4,−1] and [0, 5]. The estimates imply that founders
decrease the age of patents cited 27% more relative to the average non-founder. The story mimics
that of the patenting rate results; the change is driven by a slowing of the increase in patent cite
age rather than a dramatic shift in the average. Nonetheless, on average founders cite relatively
20
younger patents after founding than their past co-inventors.
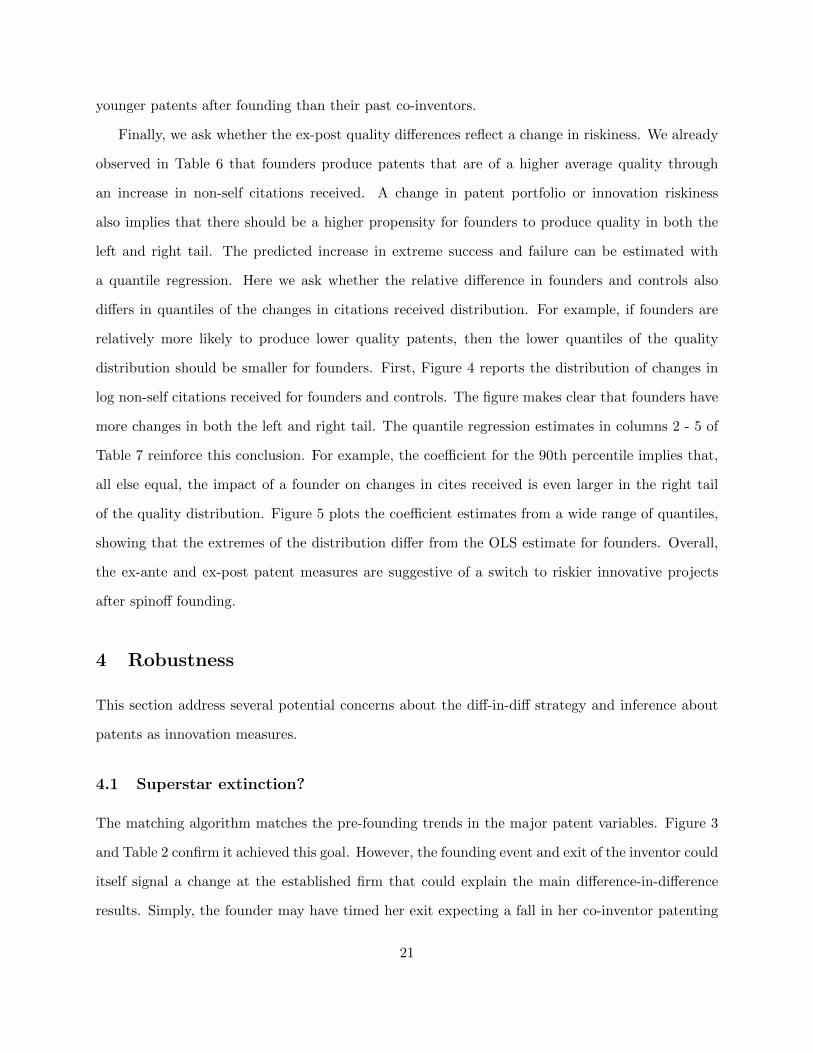
Finally, we ask whether the ex-post quality differences reflect a change in riskiness. We already
observed in Table 6 that founders produce patents that are of a higher average quality through
an increase in non-self citations received. A change in patent portfolio or innovation riskiness
also implies that there should be a higher propensity for founders to produce quality in both the
left and right tail. The predicted increase in extreme success and failure can be estimated with
a quantile regression. Here we ask whether the relative difference in founders and controls also
differs in quantiles of the changes in citations received distribution. For example, if founders are
relatively more likely to produce lower quality patents, then the lower quantiles of the quality
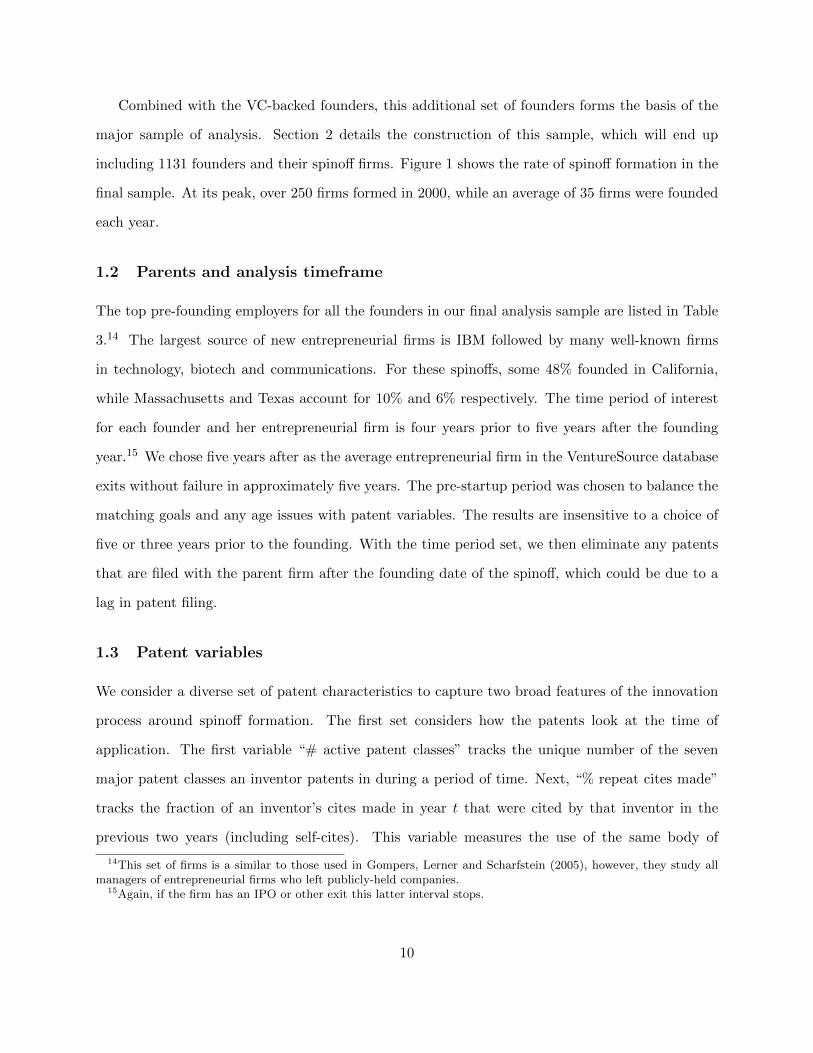
distribution should be smaller for founders. First, Figure 4 reports the distribution of changes in
log non-self citations received for founders and controls. The figure makes clear that founders have
more changes in both the left and right tail. The quantile regression estimates in columns 2 - 5 of
Table 7 reinforce this conclusion. For example, the coefficient for the 90th percentile implies that,
all else equal, the impact of a founder on changes in cites received is even larger in the right tail
of the quality distribution. Figure 5 plots the coefficient estimates from a wide range of quantiles,
showing that the extremes of the distribution differ from the OLS estimate for founders. Overall,
the ex-ante and ex-post patent measures are suggestive of a switch to riskier innovative projects
after spinoff founding.
4 Robustness
This section address several potential concerns about the diff-in-diff strategy and inference about
patents as innovation measures.
4.1 Superstar extinction?
The matching algorithm matches the pre-founding trends in the major patent variables. Figure 3
and Table 2 confirm it achieved this goal. However, the founding event and exit of the inventor could
itself signal a change at the established firm that could explain the main difference-in-difference
results. Simply, the founder may have timed her exit expecting a fall in her co-inventor patenting
21
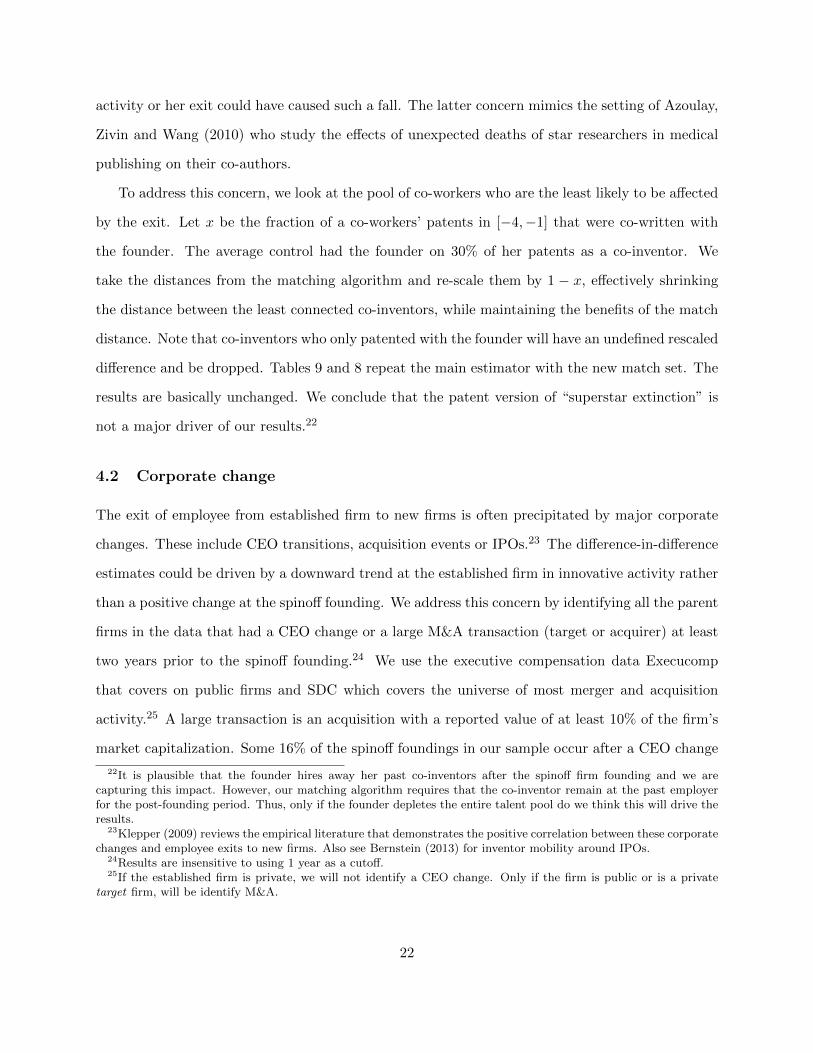
activity or her exit could have caused such a fall. The latter concern mimics the setting of Azoulay,
Zivin and Wang (2010) who study the effects of unexpected deaths of star researchers in medical
publishing on their co-authors.
To address this concern, we look at the pool of co-workers who are the least likely to be affected
by the exit. Let x be the fraction of a co-workers’ patents in [−4,−1] that were co-written with
the founder. The average control had the founder on 30% of her patents as a co-inventor. We
take the distances from the matching algorithm and re-scale them by 1 − x, effectively shrinking
the distance between the least connected co-inventors, while maintaining the benefits of the match
distance. Note that co-inventors who only patented with the founder will have an undefined rescaled
difference and be dropped. Tables 9 and 8 repeat the main estimator with the new match set. The
results are basically unchanged. We conclude that the patent version of “superstar extinction” is
not a major driver of our results.22
4.2 Corporate change
The exit of employee from established firm to new firms is often precipitated by major corporate
changes. These include CEO transitions, acquisition events or IPOs.23 The difference-in-difference
estimates could be driven by a downward trend at the established firm in innovative activity rather
than a positive change at the spinoff founding. We address this concern by identifying all the parent
firms in the data that had a CEO change or a large M&A transaction (target or acquirer) at least
two years prior to the spinoff founding.24 We use the executive compensation data Execucomp
that covers on public firms and SDC which covers the universe of most merger and acquisition
activity.25 A large transaction is an acquisition with a reported value of at least 10% of the firm’s
market capitalization. Some 16% of the spinoff foundings in our sample occur after a CEO change
22It is plausible that the founder hires away her past co-inventors after the spinoff firm founding and we arecapturing this impact. However, our matching algorithm requires that the co-inventor remain at the past employerfor the post-founding period. Thus, only if the founder depletes the entire talent pool do we think this will drive theresults.
23Klepper (2009) reviews the empirical literature that demonstrates the positive correlation between these corporatechanges and employee exits to new firms. Also see Bernstein (2013) for inventor mobility around IPOs.
24Results are insensitive to using 1 year as a cutoff.25If the established firm is private, we will not identify a CEO change. Only if the firm is public or is a private
target firm, will be identify M&A.
22
or large M&A transaction.
This robustness test assumes that founders who do not leave after major corporate change are
less likely to be timing an exit before falling innovation. We divide the sample into those firms with
and without corporate changes for which we could find a public firm identifier. If the results are
driven by major corporate changes, then the sub-sample without such changes should have weaker
or non-existent results. Tables 10 and 11 repeat the main regressions for these two subsamples. The
“No change” columns exhibit no strong differences from the main results in Table 5 and 6, which
an unreported triple difference confirms. This result supports our claim that the major conclusions
above are not driven by corporate changes.
4.3 Defensive patenting
A large literature shows that some patenting activity by large and small firms is done for defensive
reasons (e.g. Hall and Ziedonis (2001)). A concern, therefore, is that the set of differences found
in our sample are not measures of innovation, but rather consequences of a legal environment.
Similarly, small firms may have a greater incentive or propensity to patent ideas, rather than say,
use trade secrets. To start, defensive patenting should result in a relative increase in the rate
of patenting, which we do not find. Next, the legal literature and case law also demonstrates
that the threat of parents suing spinoffs is relatively low. Merges (1999) discusses the legal issues
surrounding mobility of employee-inventors. The major conclusion is that it is actually quite
difficult for past employers to successfully restrict inventive employees from starting new firms.
Third, in unreported regressions we estimate the propensity of spinoff founders to use standard
“continuation applications.” Hegde, Mowery and Graham (2009) find that these applications are
more likely used for defensive purposes. Founders are no more likely to use this patent strategy
than their past co-inventors. The sub-sample of VC-backed founders provides a final test of the
defensive patenting explanation.
We attempt to address this concern empirically with a partition of the VC-backed spinoffs
sample into those who received equity capital from their parent firm and those that did not. Of
the 715 that received VC, 41 received corporate venture capital (CVC). These spawned firms
23
presumably have much less concern for being sued by their parent firm and can therefore help us
isolate defensive patenting behavior. In unreported regressions, we split the VC-backed sample into
non-CVC and CVC. Given the small size of the latter sample, we focus on any changes in sign from
the main specification. Only two changes stand out. First, CVC-backed firms have relatively fewer
CIP patents and do not decrease their rate of self-citation. One could interpret the self-citation
difference as a consequence of the parent firm’s investment: IBM invests in ideas that are related to
their inventors’ past work. Alternatively, the fall in self-citations for the non-CVC is a consequence
of defensive patenting and an attempt to avoid strong connections with a potential legal foe. This
ambiguity and lack of other differences lead us to conclude that defensive patenting cannot fully
explain our results.
4.4 Matching process
Conditional on finding a match distance between a past co-worker and the founder, we consider
only the set of all matches that are below the full sample mean distance and if none are found, take
the best match if it is below the 75th percentile. The general results are insensitive to altering the
cutoff to the median distance, however, we lose power with a smaller sample. The main specification
of below mean distance appears to be a good choice for the tradeoff between precision and bias.
4.5 Falsification tests
What are the chances that our matching process and estimation resulted purely from chance?
We address this concern in two ways. In the first, we consider the full set of founders and co-
inventors with the required patenting around the founding event. A non-founder co-inventor and
founder are randomly switched. We then rerun the matching algorithm with these false founders
and co-inventors. In unreported tables, the main results from the difference-in-difference estimator
disappear. In the second robustness check, we perform the matching algorithm on the true founder
and co-inventor inventors and instead randomly reassign the founder to one of the matched co-
inventors. Again, the results nearly all disappear.26 The collection of evidence suggests that the
26One would expect one out of 20 to have a p-value of 5%, so some may be significant.
24
results are not driven by chance or a misspecification in the matching process.
4.6 VC vs. non-VC-backed spinoffs
Recall that the sample of founders includes both VC and non-VC-backed firms. This paper fo-
cuses on the entrepreneurial firm founding decision and its consequences, however, there are some
interesting differences between the two samples of founders worth discussion. Table 12 details the
characteristics of founders at the time of founding for these two sub-samples. VC investors back
founders that are younger, have more patents and are significantly more likely to be a lead author
on their patents. In an unreported set of regressions, the focus and quality estimates for these two
sub-samples differ in several ways, but neither sample drives the major conclusions.
5 Conclusion
The founding of a spinoff firm coincides with many changes to innovative activity. Founders focus
their research, take the lead on patenting and are no more likely to enter new, unexplored industries.
The quality of innovative output follows this change in focus. The increase in the average patent
quality confirms the predictions of many models of spinoff formation. An analysis of the tails of
the patent quality around the spinoff founding reveal these founders also change their extreme
success and failure rates. Such changes coincide with the founder switching to a younger body of
knowledge relative to her past co-inventors. Overall, a picture emerges – thus far undocumented
across industry or time – about the entrepreneurial firm founding decision.
The spinoff firm appears to excel at implementing long-term, riskier innovative projects than
their parent firms. Where these advantages stem from is an open question. We believe one mech-
anism suggested by the results are incentive structures and firm investment policies that limit the
parent firm’s ability to accept high failure rate, but potential right-tail innovations.
There are several interesting areas for future research. Richer detail on the post-spinoff connec-
tions between the parent and spinoff through relationship such as strategic alliances could improve
the analysis. With new ideas in the spinoff firm, one could follow the path of Furman and Stern
(2011) to ask whether ideas in the spinoff have differing impacts than those inside the parent firm.
25

Finally, it would be interesting to study how the entrepreneurial founder builds an team to produce
innovation.
26
References
Abadie, A., and G.W. Imbens. 2006. “Large sample properties of matching estimators for
average treatment effects.” Econometrica, 74(1): 235–267.
Abadie, Alberto, Alexis Diamond, and Jens Hainmueller. 2010. “Synthetic control methods
for comparative case studies: Estimating the effect of California’s tobacco control program.”
Journal of the American Statistical Association, 105(490).
Anton, James J, and Dennis A Yao. 1995. “Start-ups, spin-offs, and internal projects.” Journal
of Law, Economics, & Organization, 362–378.
Azoulay, Pierre, J. Graff Zivin, and Jialan Wang. 2010. “Superstar Extinction.” The Quar-
terly Journal of Economics, 125(2): 549–589.
Bernstein, Shai. 2013. “Does Going Public Affect Innovation?”
Bertrand, M., E. Duflo, and S. Mullainathan. 2000. “How Much Should We Trust Differences-
in-Differences Estimates?” The Quarterly Journal of Economics, 119(1): 249–275.
Bhide, Amar. 2000. The origin and evolution of new businesses. Oxford University Press.
Cassiman, Bruno, and Masako Ueda. 2006. “Optimal Project Rejection and New Firm Start-
ups.” Management Science, 52(2): 262–275.
Chatterji, Aaron K. 2008. “Spawned with a silver spoon? Entrepreneurial performance and
innovation in the medical device industry.” Strategic Management Journal, 30(2): 185–206.
Eriksson, T., and J. Moritz Kuhn. 2006. “Firm spin-offs in Denmark 1981–2000—patterns of
entry and exit.” International Journal of Industrial Organization, 24(5): 1021–1040.
Furman, Jeffrey L, and Scott Stern. 2011. “Climbing atop the Shoulders of Giants: The Impact
of Institutions on Cumulative Research.” The American Economic Review, 101(5): 1933–1963.
27
Gompers, Paul, Josh Lerner, and David Scharfstein. 2005. “Entrepreneurial Spawning:
Public Corporations and the Genesis of New Ventures, 1986 to 1999.” Journal of Finance,
60(2): 577–614.
Hall, Bronwyn H., Adam B. Jaffe, and Manuel Trajtenberg. 2001. “The NBER Patent
Citation Data File: Lessons, Insights and Methodological Tools.”
Hall, Bronwyn H, and Rosemarie Ziedonis. 2001. “The patent paradox revisited: an empirical
study of patenting in the US semiconductor industry, 1979-1995.” RAND Journal of Economics,
101–128.
Heckman, James, Hidehiko Ichimura, Jeffrey Smith, and Petra Todd. 1998. “Character-
izing Selection Bias Using Experimental Data.” Econometrica, 66(5): 1017–1098.
Heckman, James J, Hidehiko Ichimura, and Petra E Todd. 1997. “Matching as an Econo-
metric Evaluation Estimator: Evidence from Evaluating a Job Training Programme.” Review of
Economic Studies, 64(4): 605–54.
Hegde, Deepak, David C Mowery, and Stuart JH Graham. 2009. “Pioneering Inventors
or Thicket Builders: Which US Firms Use Continuations in Patenting?” Management Science,
55(7): 1214–1226.
Hellmann, Thomas. 2007. “When do employees become entrepreneurs?” Management science,
53(6): 919–933.
Hellman, T., and M. Puri. 2000. “The interaction between product market and financing
strategy: The role of venture capital.” Review of Financial Studies, 13(4): 959–984.
Hsu, D.H., and R.H. Ziedonis. 2007. “Patents as quality signals for entrepreneurial ventures.”
Unpublished working paper, University of Michigan.
Imbens, Guido W. 2004. “Nonparametric Estimation of Average Treatment Effects Under Exo-
geneity: A Review.” The Review of Economics and Statistics, 86(1): 4–29.
28
Klepper, S. 2009. “Spinoffs: A review and synthesis.” European Management Review, 6(3): 159–
171.
Klepper, Steven, and Peter Thompson. 2010. “Disagreements and intra-industry spinoffs.”
International Journal of Industrial Organization, 28(5): 526–538.
Klepper, Steven, and Sally Sleeper. 2005. “Entry by Spinoffs.” Management Science,
51(8): 1291–1306.
Kortum, Samuel, and Josh Lerner. 2000. “Assessing the Contribution of Venture Capital to
Innovation.” RAND Journal of Economics, 31(4): 674–692.
Lai, Ronald, Alexander D’Amour, Amy Yu, Ye Sun, and Lee Fleming. 2011. “Disam-
biguation and Co-authorship Networks of the U.S. Patent Inventor Database (1975 - 2010).”
Lerner, J., M. Sorensen, and P. Stromberg. 2011. “Private Equity and Long-Run Investment:
The Case of Innovation.” The Journal of Finance, 66(2): 445–477.
Malsberger, Brian. 2008. Covenants Not to Compete : A State-by-State Survey. BNA Books.
Manso, Gustavo. 2011. “Motivating innovation.” The Journal of Finance, 66(5): 1823–1860.
Marx, M., D. Strumsky, and L. Fleming. 2009. “Mobility, skills, and the Michigan non-
compete experiment.” Management Science, 55(6): 875–889.
Merges, Robert P. 1999. “The Law and Economics of Employee Inventions.” Harvard Journal
of Law and Technology, 13: 1.
Nanda, Ramana, and Matthew Rhodes-Kropf. 2012. “Innovation and the Financial Guillo-
tine.” Harvard Business School.
Nanda, R., and M. Rhodes-Kropf. forthcoming. “Financing risk and innovation.” Journal of
Financial Economics.
29
Papke, Leslie E., and Jeffrey M. Wooldridge. 2008. “Panel data methods for fractional
response variables with an application to test pass rates.” Journal of Econometrics, 145(1-2): 121–
133.
Singh, Jasjit, and Ajay Agrawal. 2011. “Recruiting for Ideas: How Firms Exploit the Prior
Inventions of New Hires.” Management Science, 57(1): 129–150.
30
Tables and figures
Figure 1: Spinoffs over timeThe figure reports the number of spinoffs founded per year in our final sample of 1131 firms. Section 2details the construction of the sample.
31
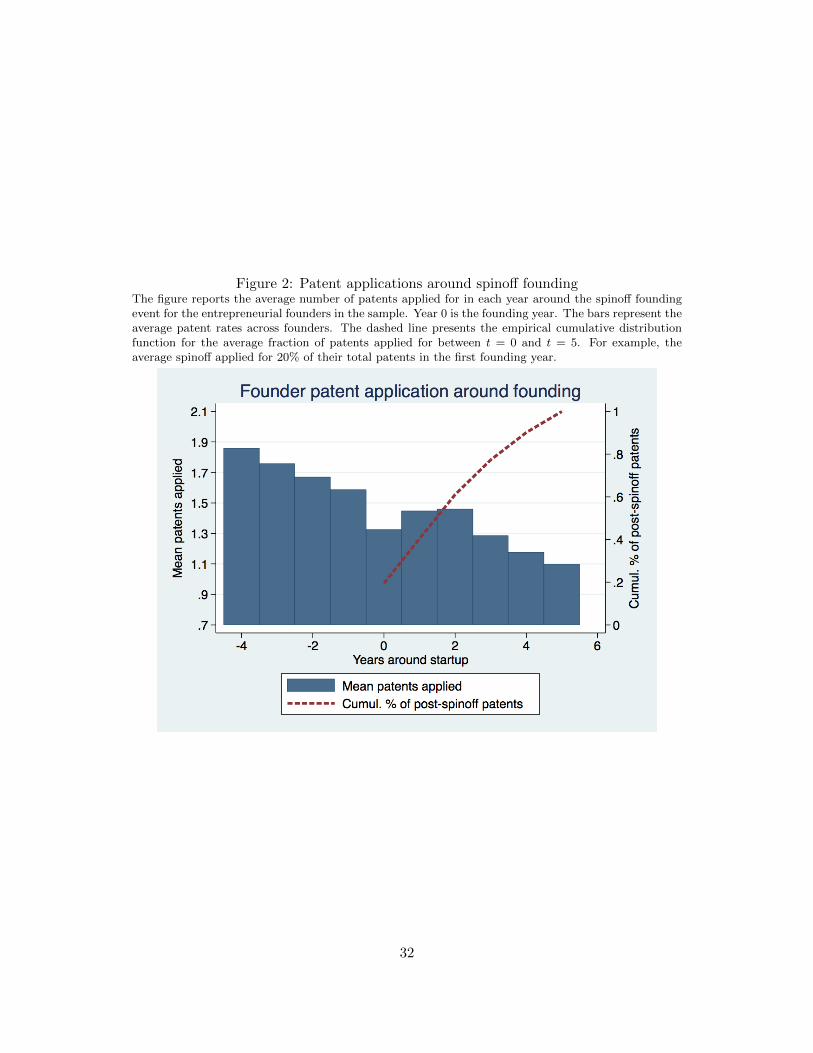
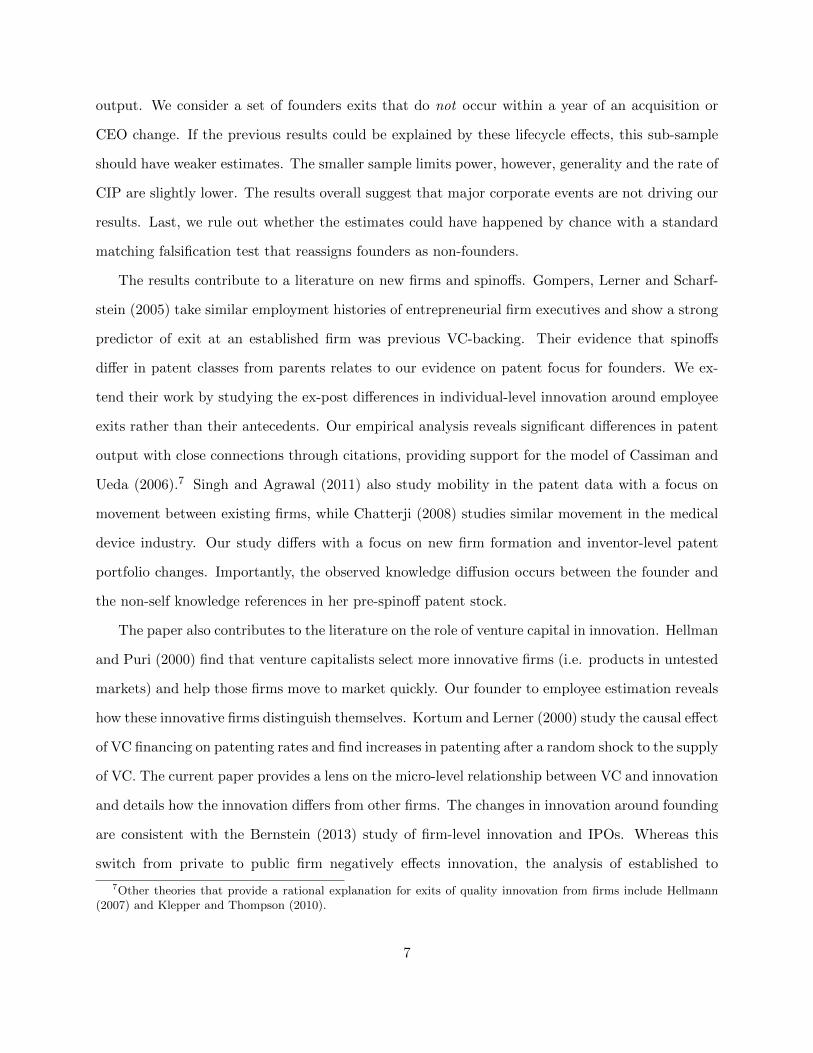
Figure 2: Patent applications around spinoff foundingThe figure reports the average number of patents applied for in each year around the spinoff foundingevent for the entrepreneurial founders in the sample. Year 0 is the founding year. The bars represent theaverage patent rates across founders. The dashed line presents the empirical cumulative distributionfunction for the average fraction of patents applied for between t = 0 and t = 5. For example, theaverage spinoff applied for 20% of their total patents in the first founding year.
32
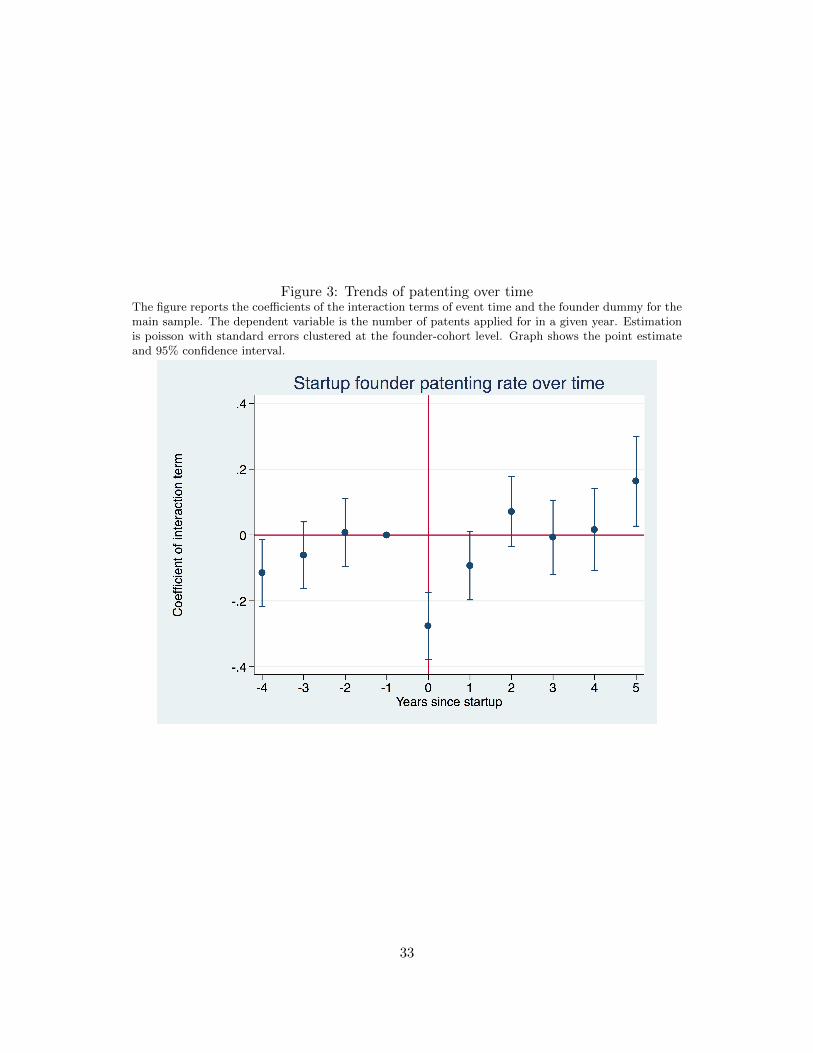
Figure 3: Trends of patenting over timeThe figure reports the coefficients of the interaction terms of event time and the founder dummy for themain sample. The dependent variable is the number of patents applied for in a given year. Estimationis poisson with standard errors clustered at the founder-cohort level. Graph shows the point estimateand 95% confidence interval.
33
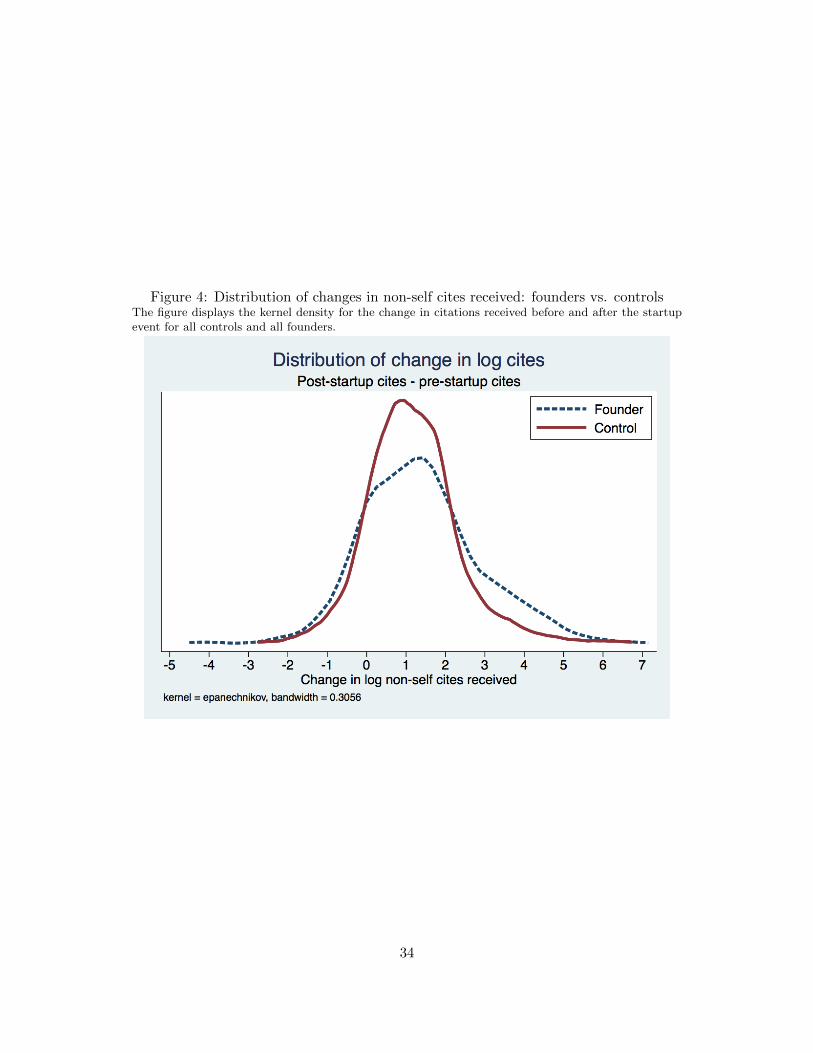
Figure 4: Distribution of changes in non-self cites received: founders vs. controlsThe figure displays the kernel density for the change in citations received before and after the startupevent for all controls and all founders.
34
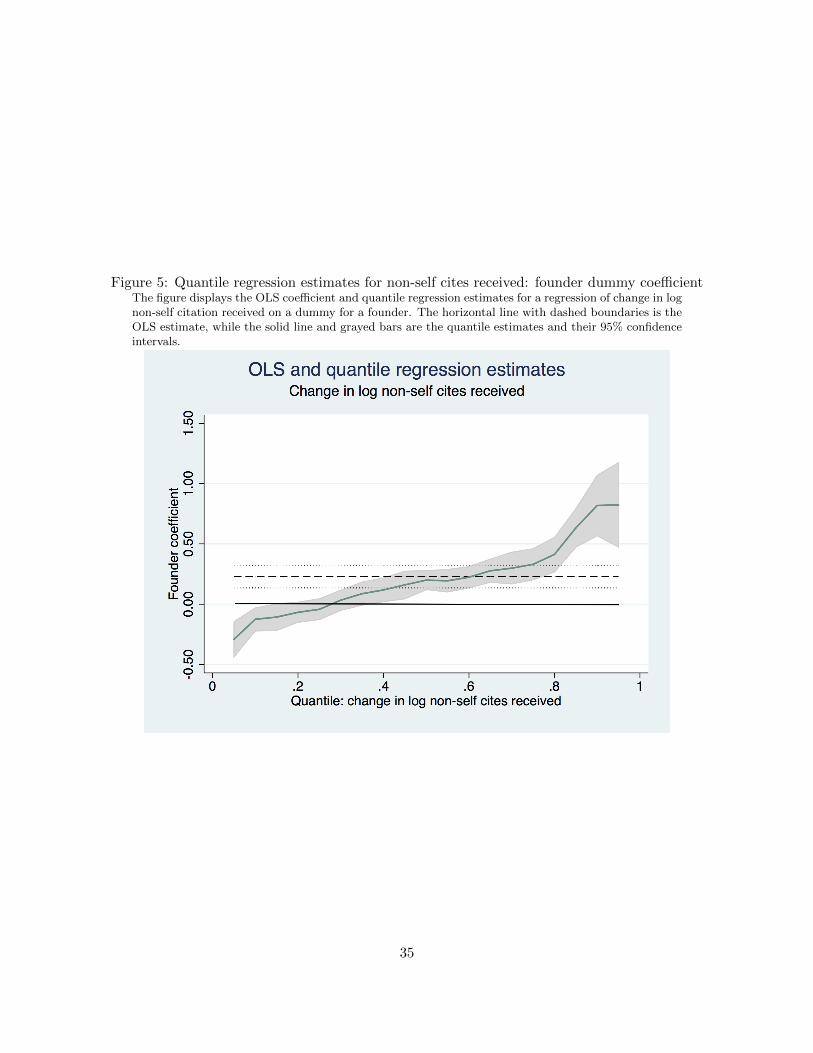
Figure 5: Quantile regression estimates for non-self cites received: founder dummy coefficientThe figure displays the OLS coefficient and quantile regression estimates for a regression of change in lognon-self citation received on a dummy for a founder. The horizontal line with dashed boundaries is theOLS estimate, while the solid line and grayed bars are the quantile estimates and their 95% confidenceintervals.
35
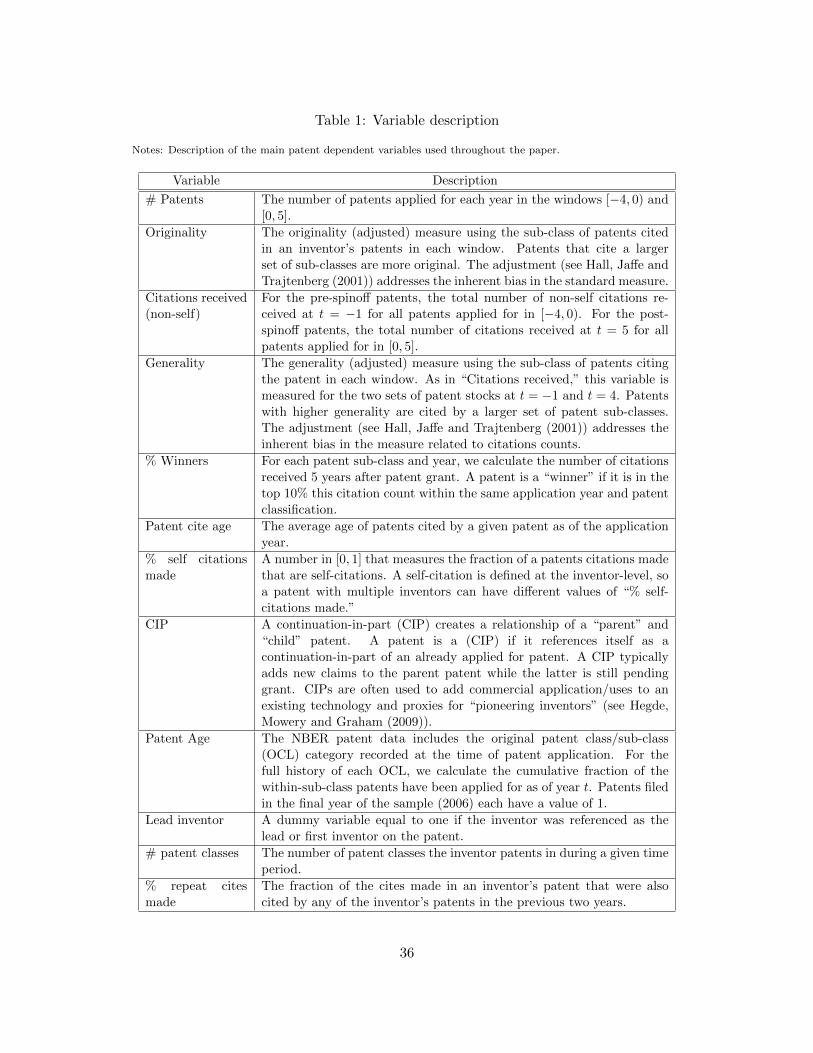
Table 1: Variable description
Notes: Description of the main patent dependent variables used throughout the paper.
Variable Description
# Patents The number of patents applied for each year in the windows [−4, 0) and[0, 5].
Originality The originality (adjusted) measure using the sub-class of patents citedin an inventor’s patents in each window. Patents that cite a largerset of sub-classes are more original. The adjustment (see Hall, Jaffe andTrajtenberg (2001)) addresses the inherent bias in the standard measure.
Citations received(non-self)
For the pre-spinoff patents, the total number of non-self citations re-ceived at t = −1 for all patents applied for in [−4, 0). For the post-spinoff patents, the total number of citations received at t = 5 for allpatents applied for in [0, 5].
Generality The generality (adjusted) measure using the sub-class of patents citingthe patent in each window. As in “Citations received,” this variable ismeasured for the two sets of patent stocks at t = −1 and t = 4. Patentswith higher generality are cited by a larger set of patent sub-classes.The adjustment (see Hall, Jaffe and Trajtenberg (2001)) addresses theinherent bias in the measure related to citations counts.
% Winners For each patent sub-class and year, we calculate the number of citationsreceived 5 years after patent grant. A patent is a “winner” if it is in thetop 10% this citation count within the same application year and patentclassification.
Patent cite age The average age of patents cited by a given patent as of the applicationyear.
% self citationsmade
A number in [0, 1] that measures the fraction of a patents citations madethat are self-citations. A self-citation is defined at the inventor-level, soa patent with multiple inventors can have different values of “% self-citations made.”
CIP A continuation-in-part (CIP) creates a relationship of a “parent” and“child” patent. A patent is a (CIP) if it references itself as acontinuation-in-part of an already applied for patent. A CIP typicallyadds new claims to the parent patent while the latter is still pendinggrant. CIPs are often used to add commercial application/uses to anexisting technology and proxies for “pioneering inventors” (see Hegde,Mowery and Graham (2009)).
Patent Age The NBER patent data includes the original patent class/sub-class(OCL) category recorded at the time of patent application. For thefull history of each OCL, we calculate the cumulative fraction of thewithin-sub-class patents have been applied for as of year t. Patents filedin the final year of the sample (2006) each have a value of 1.
Lead inventor A dummy variable equal to one if the inventor was referenced as thelead or first inventor on the patent.
# patent classes The number of patent classes the inventor patents in during a given timeperiod.
% repeat citesmade
The fraction of the cites made in an inventor’s patent that were alsocited by any of the inventor’s patents in the previous two years.
36
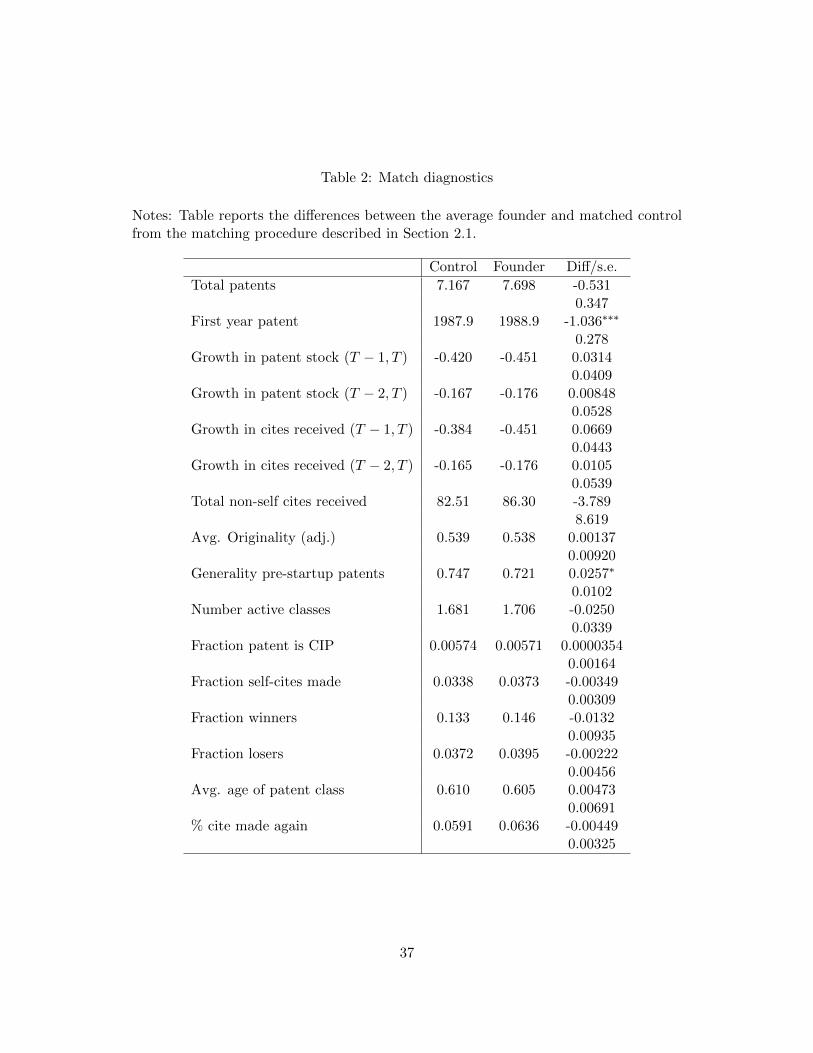
Table 2: Match diagnostics
Notes: Table reports the differences between the average founder and matched controlfrom the matching procedure described in Section 2.1.
Control Founder Diff/s.e.
Total patents 7.167 7.698 -0.5310.347
First year patent 1987.9 1988.9 -1.036∗∗∗
0.278Growth in patent stock (T − 1, T ) -0.420 -0.451 0.0314
0.0409Growth in patent stock (T − 2, T ) -0.167 -0.176 0.00848
0.0528Growth in cites received (T − 1, T ) -0.384 -0.451 0.0669
0.0443Growth in cites received (T − 2, T ) -0.165 -0.176 0.0105
0.0539Total non-self cites received 82.51 86.30 -3.789
8.619Avg. Originality (adj.) 0.539 0.538 0.00137
0.00920Generality pre-startup patents 0.747 0.721 0.0257∗
0.0102Number active classes 1.681 1.706 -0.0250
0.0339Fraction patent is CIP 0.00574 0.00571 0.0000354
0.00164Fraction self-cites made 0.0338 0.0373 -0.00349
0.00309Fraction winners 0.133 0.146 -0.0132
0.00935Fraction losers 0.0372 0.0395 -0.00222
0.00456Avg. age of patent class 0.610 0.605 0.00473
0.00691% cite made again 0.0591 0.0636 -0.00449
0.00325
37

Table 3: Sources of entrepreneurial founders with patents
Notes: Tabulation of the assignees associated with the entrepreneurial firm founders who have a matched co-inventor and at least one patent before and after the spinoff founding event who have at least 4 employee exitsto spinoffs.
Parent firm Count
International Business Machines Corporation 53Intel Corporation 36Lucent Technologies Inc 30Sun Microsystems Inc 27Microsoft Corporation 243Com Corporation 16General Electric Company 14Motorola Inc 14Xerox Corporation 14Advanced Micro Devices Inc 13Cisco Technology Inc 13National Semiconductor Corporation 12Apple Inc 11Applied Materials Inc 11Hewlettpackard Company 11Lsi Logic Corporation 10Agilent Technologies Inc 9Att Corp 9Hoechst Celanese Corporation 7Hughes Electronics Corporation 7Micron Technology Inc 7Polaroid Corporation 7Affymetrix Inc 6Broadcom Corporation 6Silicon Graphics Inc 6Texas Instruments Incorporated 6Advanced Cardiovascular Systems Inc 5Agere Systems Inc 5Baxter International Inc 5Ciena Corporation 5Cirrus Logic Inc 5Compaq Computer Corporation Inc 5Eastman Kodak Company 5Genentech Inc 5Heartport Inc 5Kopin Corporation 5Medtronic Inc 5Synopsys Inc 5Unisys Corporation 5Abbott Laboratories 4Alza Corporation 4Cabletron Systems Inc 4Digital Equipment Corporation 4Gilead Sciences Inc 4Headway Technologies Inc 4Hughes Aircraft Company 4Human Genome Sciences Inc 4Juniper Networks Inc 4Koninklijke Philips Electronics Nv 4Litton Systems Inc 4Merck Co Inc 4Nexabit Networks Inc 4Nortel Networks Limited 4Pfizer Inc 4Scimed Life Systems Inc 4Sdl Inc 4Seagate Technology Llc 4Silicon Image Inc 4
38
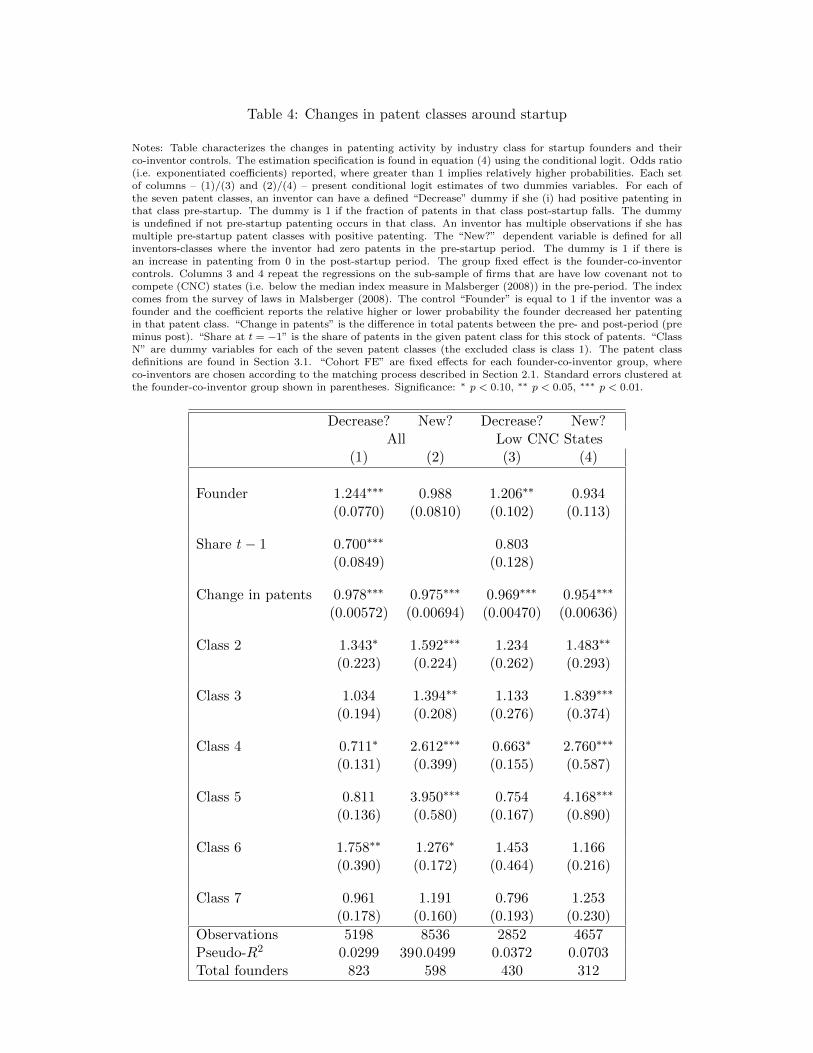
Table 4: Changes in patent classes around startup
Notes: Table characterizes the changes in patenting activity by industry class for startup founders and theirco-inventor controls. The estimation specification is found in equation (4) using the conditional logit. Odds ratio(i.e. exponentiated coefficients) reported, where greater than 1 implies relatively higher probabilities. Each setof columns – (1)/(3) and (2)/(4) – present conditional logit estimates of two dummies variables. For each ofthe seven patent classes, an inventor can have a defined “Decrease” dummy if she (i) had positive patenting inthat class pre-startup. The dummy is 1 if the fraction of patents in that class post-startup falls. The dummyis undefined if not pre-startup patenting occurs in that class. An inventor has multiple observations if she hasmultiple pre-startup patent classes with positive patenting. The “New?” dependent variable is defined for allinventors-classes where the inventor had zero patents in the pre-startup period. The dummy is 1 if there isan increase in patenting from 0 in the post-startup period. The group fixed effect is the founder-co-inventorcontrols. Columns 3 and 4 repeat the regressions on the sub-sample of firms that are have low covenant not tocompete (CNC) states (i.e. below the median index measure in Malsberger (2008)) in the pre-period. The indexcomes from the survey of laws in Malsberger (2008). The control “Founder” is equal to 1 if the inventor was afounder and the coefficient reports the relative higher or lower probability the founder decreased her patentingin that patent class. “Change in patents” is the difference in total patents between the pre- and post-period (preminus post). “Share at t = −1” is the share of patents in the given patent class for this stock of patents. “ClassN” are dummy variables for each of the seven patent classes (the excluded class is class 1). The patent classdefinitions are found in Section 3.1. “Cohort FE” are fixed effects for each founder-co-inventor group, whereco-inventors are chosen according to the matching process described in Section 2.1. Standard errors clustered atthe founder-co-inventor group shown in parentheses. Significance: ∗ p < 0.10, ∗∗ p < 0.05, ∗∗∗ p < 0.01.
Decrease? New? Decrease? New?All Low CNC States
(1) (2) (3) (4)
Founder 1.244∗∗∗ 0.988 1.206∗∗ 0.934(0.0770) (0.0810) (0.102) (0.113)
Share t− 1 0.700∗∗∗ 0.803(0.0849) (0.128)
Change in patents 0.978∗∗∗ 0.975∗∗∗ 0.969∗∗∗ 0.954∗∗∗
(0.00572) (0.00694) (0.00470) (0.00636)
Class 2 1.343∗ 1.592∗∗∗ 1.234 1.483∗∗
(0.223) (0.224) (0.262) (0.293)
Class 3 1.034 1.394∗∗ 1.133 1.839∗∗∗
(0.194) (0.208) (0.276) (0.374)
Class 4 0.711∗ 2.612∗∗∗ 0.663∗ 2.760∗∗∗
(0.131) (0.399) (0.155) (0.587)
Class 5 0.811 3.950∗∗∗ 0.754 4.168∗∗∗
(0.136) (0.580) (0.167) (0.890)
Class 6 1.758∗∗ 1.276∗ 1.453 1.166(0.390) (0.172) (0.464) (0.216)
Class 7 0.961 1.191 0.796 1.253(0.178) (0.160) (0.193) (0.230)
Observations 5198 8536 2852 4657Pseudo-R2 0.0299 0.0499 0.0372 0.0703Total founders 823 598 430 312
39
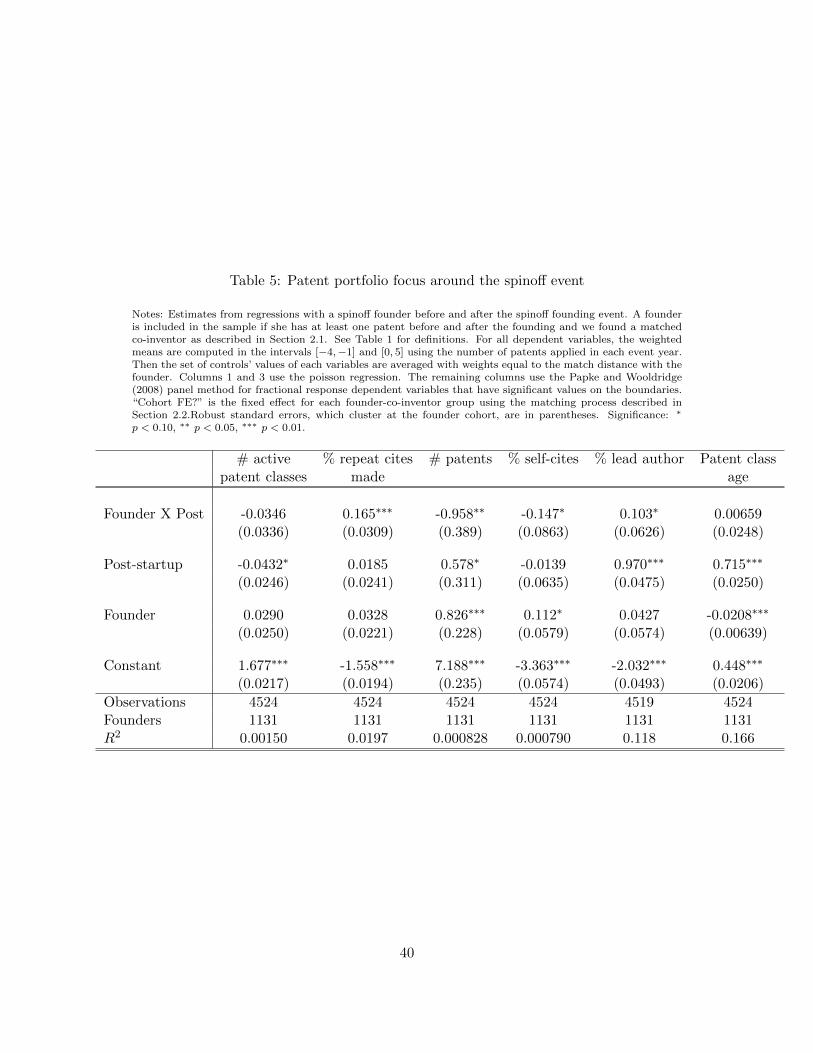
Table 5: Patent portfolio focus around the spinoff event
Notes: Estimates from regressions with a spinoff founder before and after the spinoff founding event. A founderis included in the sample if she has at least one patent before and after the founding and we found a matchedco-inventor as described in Section 2.1. See Table 1 for definitions. For all dependent variables, the weightedmeans are computed in the intervals [−4,−1] and [0, 5] using the number of patents applied in each event year.Then the set of controls’ values of each variables are averaged with weights equal to the match distance with thefounder. Columns 1 and 3 use the poisson regression. The remaining columns use the Papke and Wooldridge(2008) panel method for fractional response dependent variables that have significant values on the boundaries.“Cohort FE?” is the fixed effect for each founder-co-inventor group using the matching process described inSection 2.2.Robust standard errors, which cluster at the founder cohort, are in parentheses. Significance: ∗
p < 0.10, ∗∗ p < 0.05, ∗∗∗ p < 0.01.
# active % repeat cites # patents % self-cites % lead author Patent classpatent classes made age
Founder X Post -0.0346 0.165∗∗∗ -0.958∗∗ -0.147∗ 0.103∗ 0.00659(0.0336) (0.0309) (0.389) (0.0863) (0.0626) (0.0248)
Post-startup -0.0432∗ 0.0185 0.578∗ -0.0139 0.970∗∗∗ 0.715∗∗∗
(0.0246) (0.0241) (0.311) (0.0635) (0.0475) (0.0250)
Founder 0.0290 0.0328 0.826∗∗∗ 0.112∗ 0.0427 -0.0208∗∗∗
(0.0250) (0.0221) (0.228) (0.0579) (0.0574) (0.00639)
Constant 1.677∗∗∗ -1.558∗∗∗ 7.188∗∗∗ -3.363∗∗∗ -2.032∗∗∗ 0.448∗∗∗
(0.0217) (0.0194) (0.235) (0.0574) (0.0493) (0.0206)
Observations 4524 4524 4524 4524 4519 4524Founders 1131 1131 1131 1131 1131 1131R2 0.00150 0.0197 0.000828 0.000790 0.118 0.166
40
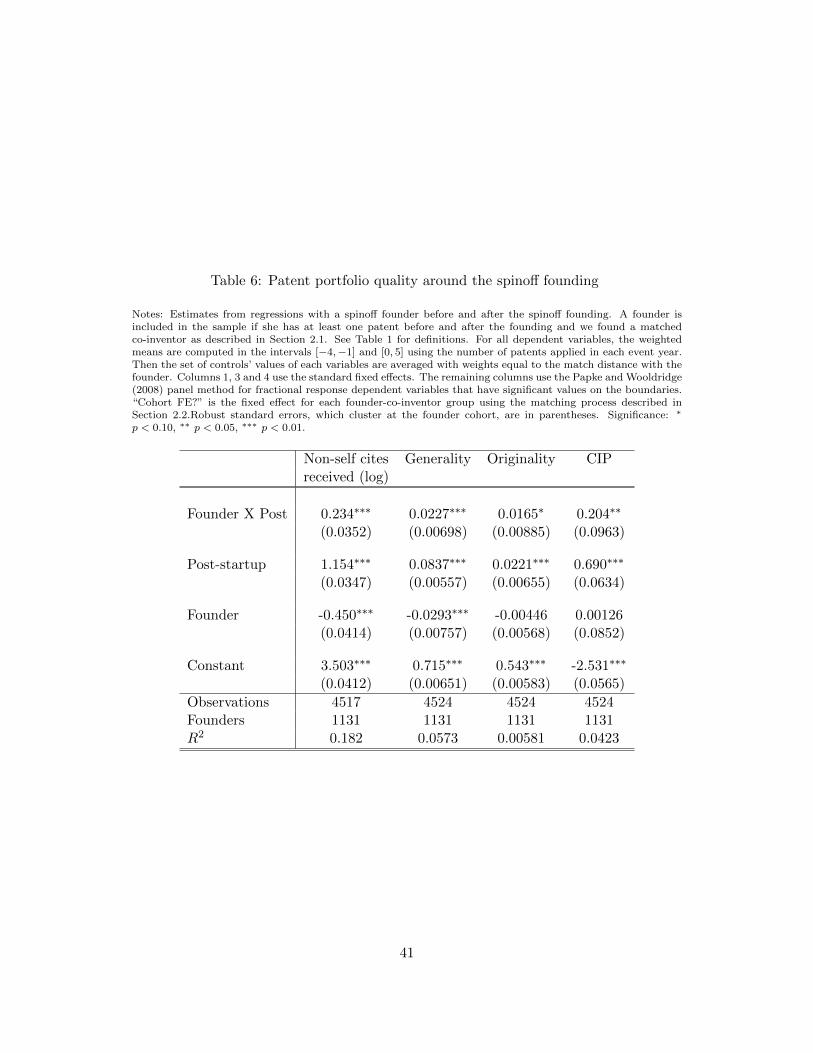
Table 6: Patent portfolio quality around the spinoff founding
Notes: Estimates from regressions with a spinoff founder before and after the spinoff founding. A founder isincluded in the sample if she has at least one patent before and after the founding and we found a matchedco-inventor as described in Section 2.1. See Table 1 for definitions. For all dependent variables, the weightedmeans are computed in the intervals [−4,−1] and [0, 5] using the number of patents applied in each event year.Then the set of controls’ values of each variables are averaged with weights equal to the match distance with thefounder. Columns 1, 3 and 4 use the standard fixed effects. The remaining columns use the Papke and Wooldridge(2008) panel method for fractional response dependent variables that have significant values on the boundaries.“Cohort FE?” is the fixed effect for each founder-co-inventor group using the matching process described inSection 2.2.Robust standard errors, which cluster at the founder cohort, are in parentheses. Significance: ∗
p < 0.10, ∗∗ p < 0.05, ∗∗∗ p < 0.01.
Non-self cites Generality Originality CIPreceived (log)
Founder X Post 0.234∗∗∗ 0.0227∗∗∗ 0.0165∗ 0.204∗∗
(0.0352) (0.00698) (0.00885) (0.0963)
Post-startup 1.154∗∗∗ 0.0837∗∗∗ 0.0221∗∗∗ 0.690∗∗∗
(0.0347) (0.00557) (0.00655) (0.0634)
Founder -0.450∗∗∗ -0.0293∗∗∗ -0.00446 0.00126(0.0414) (0.00757) (0.00568) (0.0852)
Constant 3.503∗∗∗ 0.715∗∗∗ 0.543∗∗∗ -2.531∗∗∗
(0.0412) (0.00651) (0.00583) (0.0565)
Observations 4517 4524 4524 4524Founders 1131 1131 1131 1131R2 0.182 0.0573 0.00581 0.0423
41
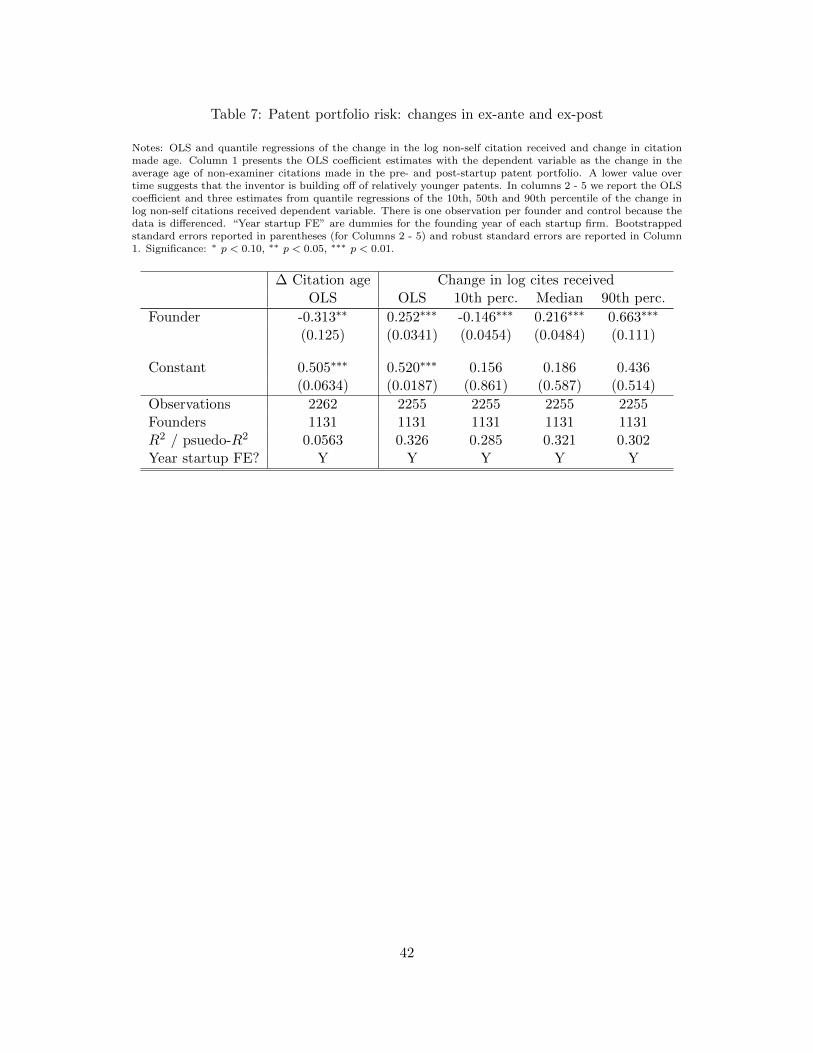
Table 7: Patent portfolio risk: changes in ex-ante and ex-post
Notes: OLS and quantile regressions of the change in the log non-self citation received and change in citationmade age. Column 1 presents the OLS coefficient estimates with the dependent variable as the change in theaverage age of non-examiner citations made in the pre- and post-startup patent portfolio. A lower value overtime suggests that the inventor is building off of relatively younger patents. In columns 2 - 5 we report the OLScoefficient and three estimates from quantile regressions of the 10th, 50th and 90th percentile of the change inlog non-self citations received dependent variable. There is one observation per founder and control because thedata is differenced. “Year startup FE” are dummies for the founding year of each startup firm. Bootstrappedstandard errors reported in parentheses (for Columns 2 - 5) and robust standard errors are reported in Column1. Significance: ∗ p < 0.10, ∗∗ p < 0.05, ∗∗∗ p < 0.01.
∆ Citation age Change in log cites receivedOLS OLS 10th perc. Median 90th perc.
Founder -0.313∗∗ 0.252∗∗∗ -0.146∗∗∗ 0.216∗∗∗ 0.663∗∗∗
(0.125) (0.0341) (0.0454) (0.0484) (0.111)
Constant 0.505∗∗∗ 0.520∗∗∗ 0.156 0.186 0.436(0.0634) (0.0187) (0.861) (0.587) (0.514)
Observations 2262 2255 2255 2255 2255Founders 1131 1131 1131 1131 1131R2 / psuedo-R2 0.0563 0.326 0.285 0.321 0.302Year startup FE? Y Y Y Y Y
42
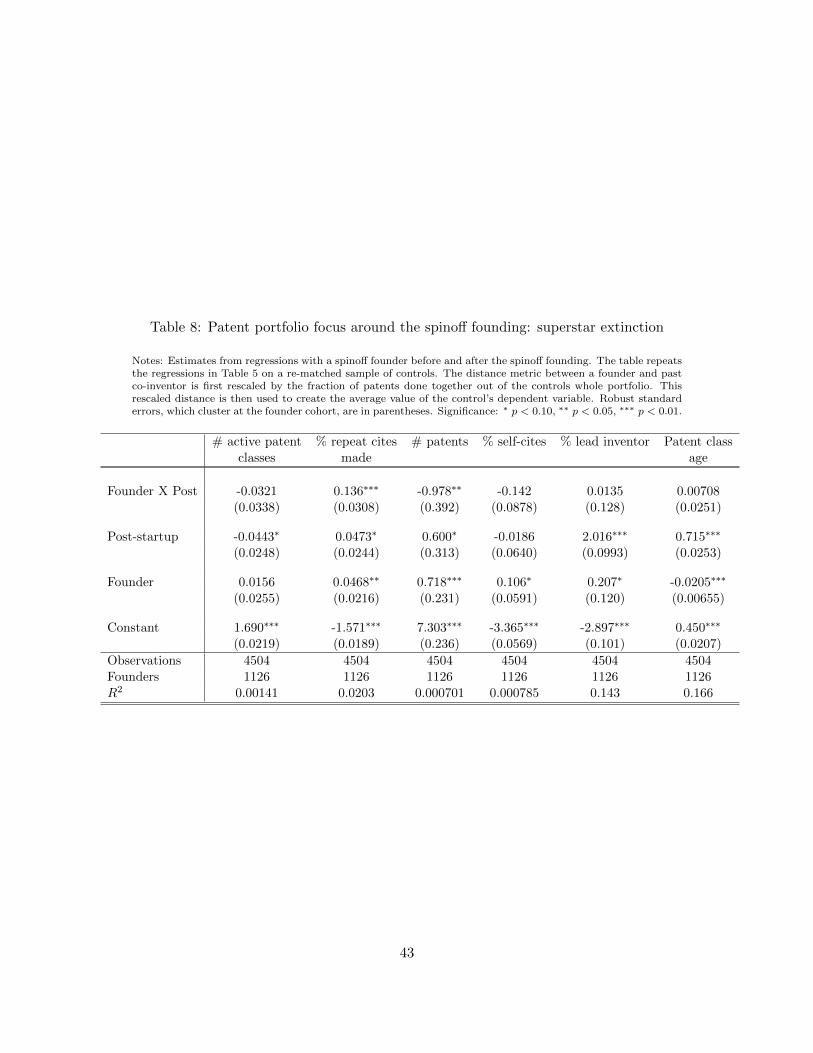
Table 8: Patent portfolio focus around the spinoff founding: superstar extinction
Notes: Estimates from regressions with a spinoff founder before and after the spinoff founding. The table repeatsthe regressions in Table 5 on a re-matched sample of controls. The distance metric between a founder and pastco-inventor is first rescaled by the fraction of patents done together out of the controls whole portfolio. Thisrescaled distance is then used to create the average value of the control’s dependent variable. Robust standarderrors, which cluster at the founder cohort, are in parentheses. Significance: ∗ p < 0.10, ∗∗ p < 0.05, ∗∗∗ p < 0.01.
# active patent % repeat cites # patents % self-cites % lead inventor Patent classclasses made age
Founder X Post -0.0321 0.136∗∗∗ -0.978∗∗ -0.142 0.0135 0.00708(0.0338) (0.0308) (0.392) (0.0878) (0.128) (0.0251)
Post-startup -0.0443∗ 0.0473∗ 0.600∗ -0.0186 2.016∗∗∗ 0.715∗∗∗
(0.0248) (0.0244) (0.313) (0.0640) (0.0993) (0.0253)
Founder 0.0156 0.0468∗∗ 0.718∗∗∗ 0.106∗ 0.207∗ -0.0205∗∗∗
(0.0255) (0.0216) (0.231) (0.0591) (0.120) (0.00655)
Constant 1.690∗∗∗ -1.571∗∗∗ 7.303∗∗∗ -3.365∗∗∗ -2.897∗∗∗ 0.450∗∗∗
(0.0219) (0.0189) (0.236) (0.0569) (0.101) (0.0207)
Observations 4504 4504 4504 4504 4504 4504Founders 1126 1126 1126 1126 1126 1126R2 0.00141 0.0203 0.000701 0.000785 0.143 0.166
43
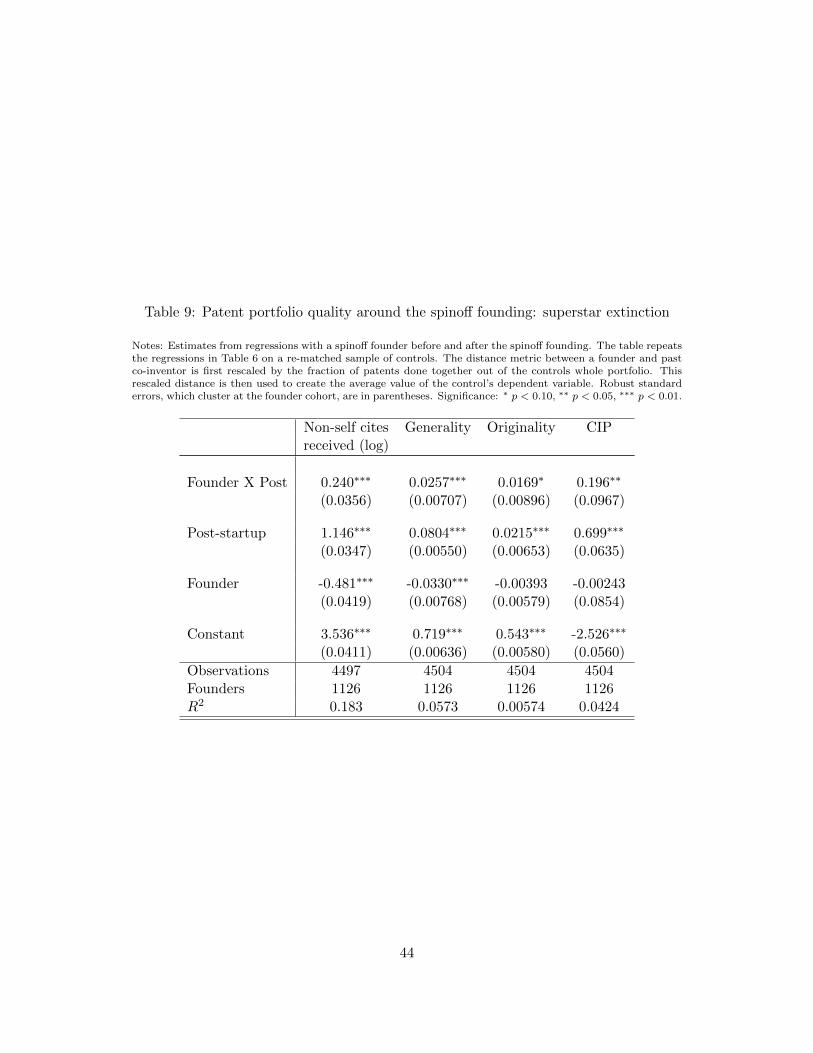
Table 9: Patent portfolio quality around the spinoff founding: superstar extinction
Notes: Estimates from regressions with a spinoff founder before and after the spinoff founding. The table repeatsthe regressions in Table 6 on a re-matched sample of controls. The distance metric between a founder and pastco-inventor is first rescaled by the fraction of patents done together out of the controls whole portfolio. Thisrescaled distance is then used to create the average value of the control’s dependent variable. Robust standarderrors, which cluster at the founder cohort, are in parentheses. Significance: ∗ p < 0.10, ∗∗ p < 0.05, ∗∗∗ p < 0.01.
Non-self cites Generality Originality CIPreceived (log)
Founder X Post 0.240∗∗∗ 0.0257∗∗∗ 0.0169∗ 0.196∗∗
(0.0356) (0.00707) (0.00896) (0.0967)
Post-startup 1.146∗∗∗ 0.0804∗∗∗ 0.0215∗∗∗ 0.699∗∗∗
(0.0347) (0.00550) (0.00653) (0.0635)
Founder -0.481∗∗∗ -0.0330∗∗∗ -0.00393 -0.00243(0.0419) (0.00768) (0.00579) (0.0854)
Constant 3.536∗∗∗ 0.719∗∗∗ 0.543∗∗∗ -2.526∗∗∗
(0.0411) (0.00636) (0.00580) (0.0560)
Observations 4497 4504 4504 4504Founders 1126 1126 1126 1126R2 0.183 0.0573 0.00574 0.0424
44
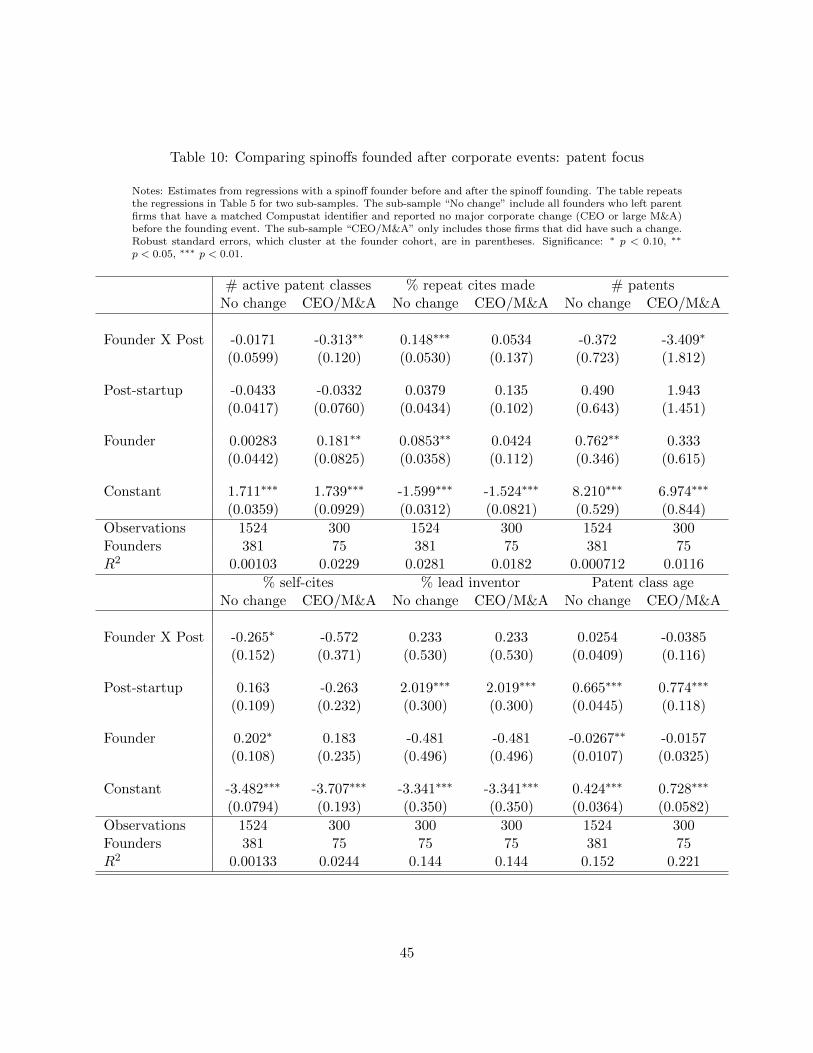
Table 10: Comparing spinoffs founded after corporate events: patent focus
Notes: Estimates from regressions with a spinoff founder before and after the spinoff founding. The table repeatsthe regressions in Table 5 for two sub-samples. The sub-sample “No change” include all founders who left parentfirms that have a matched Compustat identifier and reported no major corporate change (CEO or large M&A)before the founding event. The sub-sample “CEO/M&A” only includes those firms that did have such a change.Robust standard errors, which cluster at the founder cohort, are in parentheses. Significance: ∗ p < 0.10, ∗∗
p < 0.05, ∗∗∗ p < 0.01.
# active patent classes % repeat cites made # patentsNo change CEO/M&A No change CEO/M&A No change CEO/M&A
Founder X Post -0.0171 -0.313∗∗ 0.148∗∗∗ 0.0534 -0.372 -3.409∗
(0.0599) (0.120) (0.0530) (0.137) (0.723) (1.812)
Post-startup -0.0433 -0.0332 0.0379 0.135 0.490 1.943(0.0417) (0.0760) (0.0434) (0.102) (0.643) (1.451)
Founder 0.00283 0.181∗∗ 0.0853∗∗ 0.0424 0.762∗∗ 0.333(0.0442) (0.0825) (0.0358) (0.112) (0.346) (0.615)
Constant 1.711∗∗∗ 1.739∗∗∗ -1.599∗∗∗ -1.524∗∗∗ 8.210∗∗∗ 6.974∗∗∗
(0.0359) (0.0929) (0.0312) (0.0821) (0.529) (0.844)
Observations 1524 300 1524 300 1524 300Founders 381 75 381 75 381 75R2 0.00103 0.0229 0.0281 0.0182 0.000712 0.0116
% self-cites % lead inventor Patent class ageNo change CEO/M&A No change CEO/M&A No change CEO/M&A
Founder X Post -0.265∗ -0.572 0.233 0.233 0.0254 -0.0385(0.152) (0.371) (0.530) (0.530) (0.0409) (0.116)
Post-startup 0.163 -0.263 2.019∗∗∗ 2.019∗∗∗ 0.665∗∗∗ 0.774∗∗∗
(0.109) (0.232) (0.300) (0.300) (0.0445) (0.118)
Founder 0.202∗ 0.183 -0.481 -0.481 -0.0267∗∗ -0.0157(0.108) (0.235) (0.496) (0.496) (0.0107) (0.0325)
Constant -3.482∗∗∗ -3.707∗∗∗ -3.341∗∗∗ -3.341∗∗∗ 0.424∗∗∗ 0.728∗∗∗
(0.0794) (0.193) (0.350) (0.350) (0.0364) (0.0582)
Observations 1524 300 300 300 1524 300Founders 381 75 75 75 381 75R2 0.00133 0.0244 0.144 0.144 0.152 0.221
45
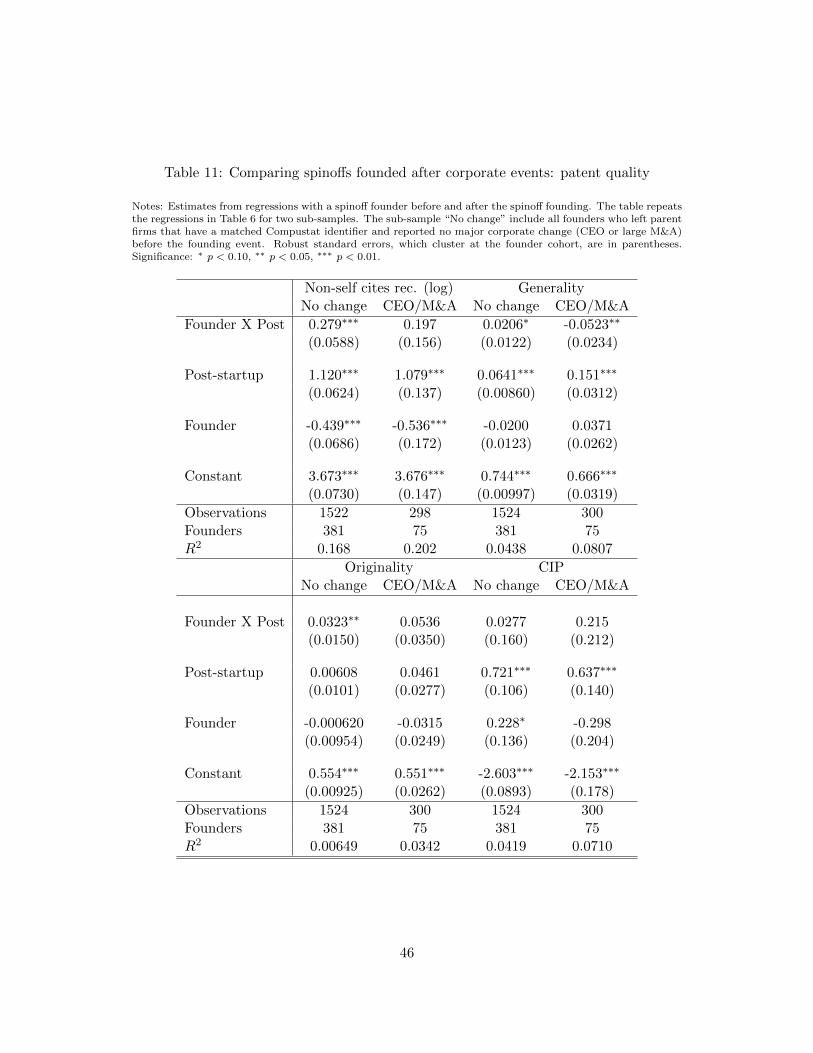
Table 11: Comparing spinoffs founded after corporate events: patent quality
Notes: Estimates from regressions with a spinoff founder before and after the spinoff founding. The table repeatsthe regressions in Table 6 for two sub-samples. The sub-sample “No change” include all founders who left parentfirms that have a matched Compustat identifier and reported no major corporate change (CEO or large M&A)before the founding event. Robust standard errors, which cluster at the founder cohort, are in parentheses.Significance: ∗ p < 0.10, ∗∗ p < 0.05, ∗∗∗ p < 0.01.
Non-self cites rec. (log) GeneralityNo change CEO/M&A No change CEO/M&A
Founder X Post 0.279∗∗∗ 0.197 0.0206∗ -0.0523∗∗
(0.0588) (0.156) (0.0122) (0.0234)
Post-startup 1.120∗∗∗ 1.079∗∗∗ 0.0641∗∗∗ 0.151∗∗∗
(0.0624) (0.137) (0.00860) (0.0312)
Founder -0.439∗∗∗ -0.536∗∗∗ -0.0200 0.0371(0.0686) (0.172) (0.0123) (0.0262)
Constant 3.673∗∗∗ 3.676∗∗∗ 0.744∗∗∗ 0.666∗∗∗
(0.0730) (0.147) (0.00997) (0.0319)
Observations 1522 298 1524 300Founders 381 75 381 75R2 0.168 0.202 0.0438 0.0807
Originality CIPNo change CEO/M&A No change CEO/M&A
Founder X Post 0.0323∗∗ 0.0536 0.0277 0.215(0.0150) (0.0350) (0.160) (0.212)
Post-startup 0.00608 0.0461 0.721∗∗∗ 0.637∗∗∗
(0.0101) (0.0277) (0.106) (0.140)
Founder -0.000620 -0.0315 0.228∗ -0.298(0.00954) (0.0249) (0.136) (0.204)
Constant 0.554∗∗∗ 0.551∗∗∗ -2.603∗∗∗ -2.153∗∗∗
(0.00925) (0.0262) (0.0893) (0.178)
Observations 1524 300 1524 300Founders 381 75 381 75R2 0.00649 0.0342 0.0419 0.0710
46
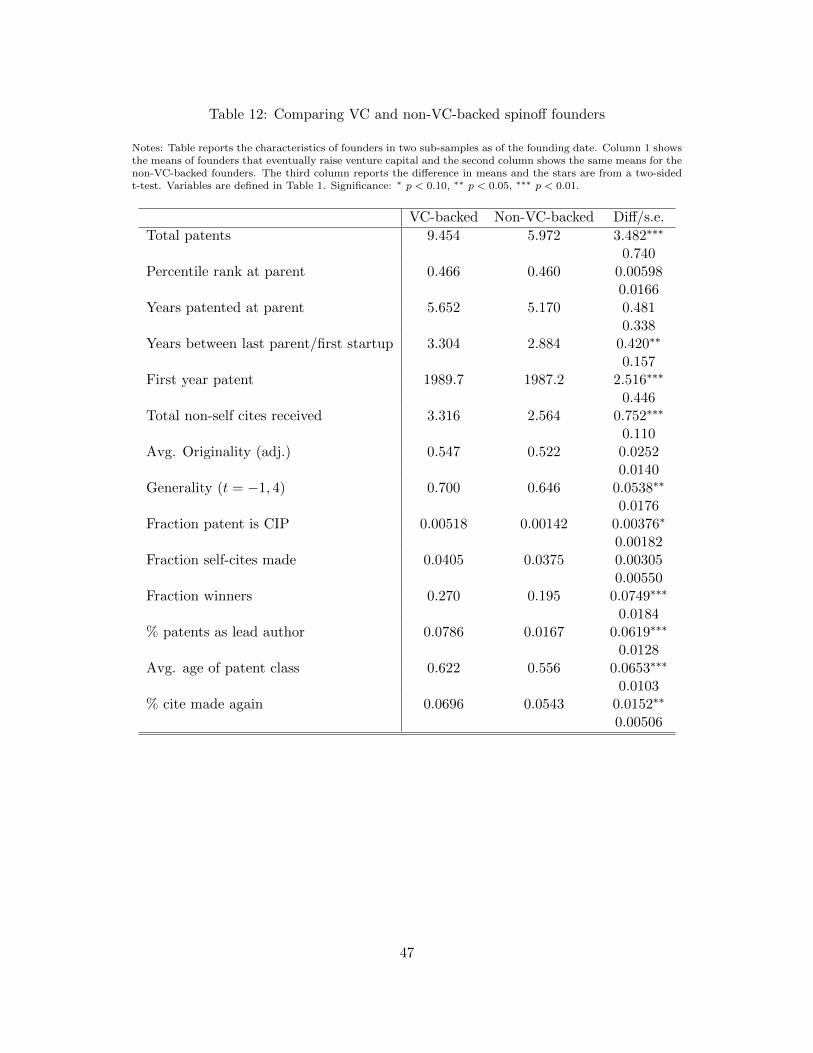
Table 12: Comparing VC and non-VC-backed spinoff founders
Notes: Table reports the characteristics of founders in two sub-samples as of the founding date. Column 1 showsthe means of founders that eventually raise venture capital and the second column shows the same means for thenon-VC-backed founders. The third column reports the difference in means and the stars are from a two-sidedt-test. Variables are defined in Table 1. Significance: ∗ p < 0.10, ∗∗ p < 0.05, ∗∗∗ p < 0.01.
VC-backed Non-VC-backed Diff/s.e.
Total patents 9.454 5.972 3.482∗∗∗
0.740Percentile rank at parent 0.466 0.460 0.00598
0.0166Years patented at parent 5.652 5.170 0.481
0.338Years between last parent/first startup 3.304 2.884 0.420∗∗
0.157First year patent 1989.7 1987.2 2.516∗∗∗
0.446Total non-self cites received 3.316 2.564 0.752∗∗∗
0.110Avg. Originality (adj.) 0.547 0.522 0.0252
0.0140Generality (t = −1, 4) 0.700 0.646 0.0538∗∗
0.0176Fraction patent is CIP 0.00518 0.00142 0.00376∗
0.00182Fraction self-cites made 0.0405 0.0375 0.00305
0.00550Fraction winners 0.270 0.195 0.0749∗∗∗
0.0184% patents as lead author 0.0786 0.0167 0.0619∗∗∗
0.0128Avg. age of patent class 0.622 0.556 0.0653∗∗∗
0.0103% cite made again 0.0696 0.0543 0.0152∗∗
0.00506
47
6 Appendix
6.1 Finding non-VC-backed spinoffs
As discussed in Section 1.1, we supplement the set of VC-backed spinoffs with a collection of firms
that were plausibly formed by inventors leaving the same parent firms as those from the main
sample. Some of these parent firms lack an identifier in the patent data (pdpass), which we have
to ignore for this sample creation. For each of these parent firms, we isolate all the inventors – not
in the VC sample – that switch firms and where the switch occurs after 1984.27 Later steps in this
process will require a unique firm identifier, so we cannot study inventors that leave to start firms
that do not have a “pdpass.” Many potential switches are in fact inventors patenting in their own
name or under a subsidiary of the parent firm. So we have to restrict the sample of switches to
those that are persistent: the potential spinoff has to have at least 4 patents in the data. We are
ultimately interested in identifying both new firms and their founders, so consider only inventors
who leave these parent firms are patent at new firms in one of the firms first three patents. Of
course, this is not enough to identify a founder because we do not know when a firm is founded.
Private firm founding dates are difficult to find. Those firms that decide to incorporate in
either Delaware or California provide some useful information. Delaware is a very popular location
to incorporate because of the friendliness of its courts, quick bureaucracy and typical corporate
lawyer’s familiarity with the state’s institution. From the patent data, we have potentially several
versions of the firms name. We take these strings to one of these two state’s secretary of state
websites.28 A combination of manual searches and a web scraping script searched for the 11,000
potential new firm founding dates on these websites. If the Delaware site had a perfect match, then
it was assumed to be the correct date, while the California result was only used if the Delaware
return zero or multiple results. This data collection recovered over 60% of the potential spinoffs
incorporation dates. These dates are imperfect measures of founding dates, which informs the final
step to identify founders.
27This date restriction is simply to ensure the time of the VC and non-VC-backed firm foundings is approximatelythe same.
28Delaware: https://delecorp.delaware.gov/tin/GINameSearch.jsp. California: http://kepler.sos.ca.gov/.
48
We now have a collection of potential spinoffs, potential founders and incorporation dates.
Labeling an inventor as a founder requires the incorporation date occur within one year prior to
two years after the first observed patent at the firm. This condition will of course eliminate some
firms that patent many years after founding, however, we are interested in mapping to both spinoff
and its founder. Further, this condition helps rule out some incorrect incorporation date results
where the date occurs many years after the first patent. For the set of inventors that have one of a
firm’s first three patents in this [−1, 2] year window around the incorporation date, we label them
as founders. The final sample includes 1,319 unique firms and 1,529 unique founders. Future work
could take this process to all potential new firms in the patent data.
49