Embed Size (px)
Citation preview
New Zealand Fire Service Commission Research Report Number 58 ISBN Number 1-877349-29-1 © Copyright New Zealand Fire Service Commission
Fire Loss Reduction in Industrial Buildings - Risk Cost Benefit Study
BRANZ
July 2006
This project investigated the cost-effectiveness of different fire protection strategies for use in industrial buildings in New Zealand, and developed a risk cost benefit model using @RISK to estimate the cost of fire in industrial buildings. Fire protection options included sprinklers, detection with manual suppression, and compartmentation. The risk model was probabilistic and accounted for variability and uncertainty in the input data by incorporating probability distributions for inputs. Input data for the model relied on previous research on the cost of industrial fires in New Zealand carried out by Business and Economic Research Ltd (BERL) and supplemented with other data from the literature as well as engineering judgement. Latin hypercube simulation was used to generate an output distribution for the cost of fire. Twenty-five thousand iterations were conducted for each option. Based on the upper 95% confidence level for the expected cost of fire per building per year, it is concluded that no change to the fire protection system requirements in the New Zealand building code compliance documents for industrial buildings is warranted. However, if buildings of more than 1000 m² in floor area are targeted, then it is recommended that automatic fire detection with manual suppression is the preferred option, closely followed by fire sprinklers. The study demonstrates a methodology that addresses uncertainty and provides a more robust analysis for decision-making about Building Code requirements. It also helps identify those parameters that most affect the outcome of interest and those where better data would reduce uncertainty in the results.
Date of Issue: 7 July 2006 Project Number FQ5014
Review Date: indefinite Page 1 of 1 Pages
FQ 5014
Fire Loss Reduction in Industrial Buildings – Risk Cost Benefit Study
Author: CA Wade Principal Scientist
Reviewer: Ian Page Manager Economics
Contact: BRANZ Limited Moonshine Road Judgeford Private Bag 50908 Porirua City New Zealand Tel: +64 4 237 1170 Fax: +64 4 237 1171 www.branz.co.nz
This research was jointly funded by the New Zealand Fire Service Commission and
the Building Research Levy.
Report number: FQ5014 Date of Issue: 7 July 2006 Page 2 of 2 Pages
Fire Loss Reduction in Industrial Buildings – Risk Cost Benefit Study
ABSTRACT
This project investigated the cost-effectiveness of different fire protection strategies for use in industrial buildings in New Zealand, and developed a risk cost benefit model using @RISK to estimate the cost of fire in industrial buildings. Fire protection options included sprinklers, detection with manual suppression, and compartmentation. The risk model was probabilistic and accounted for variability and uncertainty in the input data by incorporating probability distributions for inputs. Input data for the model relied on previous research on the cost of industrial fires in New Zealand carried out by Business and Economic Research Ltd (BERL) and supplemented with other data from the literature as well as engineering judgement. Latin hypercube simulation was used to generate an output distribution for the cost of fire. Twenty-five thousand iterations were conducted for each option. Based on the upper 95% confidence level for the expected cost of fire per building per year, it is concluded that no change to the fire protection system requirements in the New Zealand building code compliance documents for industrial buildings is warranted. However, if buildings of more than 1000 m² in floor area are targeted, then it is recommended that automatic fire detection with manual suppression is the preferred option, closely followed by fire sprinklers. The study demonstrates a methodology that addresses uncertainty and provides a more robust analysis for decision-making about Building Code requirements. It also helps identify those parameters that most affect the outcome of interest and those where better data would reduce uncertainty in the results.
CW ICP
Report number: FQ5014 Date of Issue: 7 July 2006 Page 3 of 3 Pages
Table of Contents ABSTRACT ............................................................................................................................................. 2 1. CLIENT............................................................................................................................................ 6 2. INTRODUCTION............................................................................................................................ 6
2.1 Background............................................................................................................................. 6 2.2 Aims and objectives................................................................................................................ 6 2.3 Definition of industrial buildings............................................................................................ 6
3. LITERATURE REVIEW................................................................................................................. 7 3.1 An economic assessment of industrial fires in New Zealand ................................................. 7 3.2 Risk – informed, performance-based industrial fire protection .............................................. 7 3.3 Fire protection in agricultural facilities................................................................................... 8 3.4 FIERAsystem.......................................................................................................................... 8 3.5 Cost-benefit and risk analysis – basis for decisions in the fire safety design process ............ 8 3.6 Serious fires in industrial premises ......................................................................................... 9 3.7 Fire Sprinkler Incentive Act 2005 (USA) ............................................................................... 9 3.8 The US fire problem overview report – storage, industrial and manufacturing properties... 10 3.9 US experience with sprinklers and other fire extinguishing equipment ............................... 10 3.10 Assessment of benefits of fire compartmentation in chemical warehouses.......................... 12 3.11 The ignition frequency of structural fires in Finland 1996–1999 ......................................... 13 3.12 Statistical determination of ignition frequency..................................................................... 14 3.13 Decision Analysis in Fire Safety Engineering – Analysing Investments in Fire Safety....... 15
4. INDUSTRIAL BUILDING STOCK IN NEW ZEALAND........................................................... 15 5. FIRE PROTECTION SYSTEMS PROBABILITY DATA ........................................................... 18
5.1 General.................................................................................................................................. 18 5.2 Fire separations ..................................................................................................................... 19 5.3 Fire detection systems and manual suppression ................................................................... 20 5.4 Fire sprinkler systems ........................................................................................................... 21
6. FIRE PROTECTION SYSTEMS COSTING DATA .................................................................... 22 7. NEW ZEALAND FIRE INCIDENT STATISTICS ...................................................................... 23
7.1 General.................................................................................................................................. 23 8. NZBC REQUIREMENTS FOR INDUSTRIAL BUILDINGS ..................................................... 27 9. RISK COST BENEFIT MODEL ................................................................................................... 29
9.1 Model overview .................................................................................................................... 29 9.2 Model inputs and their distributions ..................................................................................... 31
9.2.1 Fire loss area for buildings without fire protection systems............................................. 31 9.2.2 Fire loss area for buildings with automatic fire sprinkler systems ................................... 32 9.2.3 Fire loss area for buildings with fire detection and manual suppression.......................... 33 9.2.4 Fire loss area for buildings with fire compartmentation................................................... 33 9.2.5 Fire incident rate............................................................................................................... 33 9.2.6 Fire protection system probability of success................................................................... 34 9.2.7 New Zealand industrial building stock characteristics ..................................................... 36 9.2.8 Fire detection system installation and maintenance costs ................................................ 38 9.2.9 Fire sprinkler system installation and maintenance costs................................................. 40 9.2.10 Cost of firecell compartmentation................................................................................ 40 9.2.11 Cost-benefit parameters................................................................................................ 41 9.2.12 Cost of industrial fires .................................................................................................. 41
9.3 Dependencies between input variables ................................................................................. 45 9.4 Results................................................................................................................................... 47 9.5 Comparing the model results to historical data..................................................................... 51 9.6 Sensitivity analysis................................................................................................................ 52 9.7 Filtering results by building floor area.................................................................................. 55 9.8 Model limitations .................................................................................................................. 55
CW ICP
Report number: FQ5014 Date of Issue: 7 July 2006 Page 4 of 4 Pages
10. CONCLUSIONS....................................................................................................................... 56 11. RECOMMENDATIONS .......................................................................................................... 56 12. REFERENCES.......................................................................................................................... 57 APPENDIX: MODEL SCENARIOS AND EVENT TREES................................................................ 59
List of Figures
Figure 1. Fire development event tree (extracted from Houlding and Rew 2003)................................. 13 Figure 2. Ignition frequency observations (dots) in industrial buildings and warehouses 1996–1999
Finland and a generalised Barrios model fitted to the data (solid line). Extracted from Tillander and Keski-Rahkonen (2003) .................................................................................................................... 14
Figure 3. All industrial buildings – numbers by floor area .................................................................... 16 Figure 4. Heavy manufacturing buildings – numbers by floor area....................................................... 16 Figure 5. Light manufacturing buildings – numbers by floor area......................................................... 16 Figure 6. Service industry buildings – numbers by floor area................................................................ 17 Figure 7. Warehouse buildings – numbers by floor area........................................................................ 17 Figure 8. All industrial buildings (excluding service industries) - numbers by floor area ..................... 18 Figure 9. Example of primary FPS success measures (extracted from Barry 2002).............................. 19 Figure 10. Structure fires in industrial buildings (Challands 2005) ....................................................... 23 Figure 11. Structure fires in industrial buildings by property use 1986–2005 (Challands 2005) .......... 25 Figure 12. Structure fires in industrial buildings by extent of flame damage 1986–2005 (Challands
2005) ................................................................................................................................................. 25 Figure 13. Purpose group definition (extracted from C/AS1) ................................................................ 28 Figure 14. Event tree representation of the risk cost benefit model ....................................................... 30 Figure 15. Cumulative distribution function of the fire loss area for an unprotected building .............. 32 Figure 16. Probability density function for the fire loss area with sprinklers ........................................ 32 Figure 17. Probability density function for the fire loss area with detection and manual suppression .. 33 Figure 18. Probability distribution for the number of expected fires per year ....................................... 34 Figure 19. Probability density function for fire sprinkler success.......................................................... 34 Figure 20. Probability density function for firewall success .................................................................. 35 Figure 21. Probability density function for fire detection success ......................................................... 35 Figure 22. Probability density function for manual suppression success given detection ..................... 36 Figure 23. Cumulative density distribution for the building floor area.................................................. 36 Figure 24. Probability density function for building floor area.............................................................. 37 Figure 25. Probability density function for building height ................................................................... 37 Figure 26. Probability density function for building plan aspect ratio ................................................... 38 Figure 27. Probability density function for detection installation fixed cost ......................................... 39 Figure 28. Probability density function for detection installation variable cost..................................... 39 Figure 29. Probability density function for sprinkler installation cost ................................................... 40 Figure 30. Probability density function for firewall installation cost..................................................... 41 Figure 31. Probability density function for the cost of business interruption ........................................ 43 Figure 32. Probability density function for the cost of direct property losses........................................ 43 Figure 33. Probability density function for the cost of the fire service .................................................. 44 Figure 34. Probability density function for indirect economic costs...................................................... 44 Figure 35. Probability density function for cost of reduced consumption ............................................. 45 Figure 36. Probability density function for social cost........................................................................... 45 Figure 37. Model output distribution for cost of fire per building per year– unprotected building ....... 47 Figure 38. Model output distribution for cost of fire per building per year – sprinklered building ....... 48 Figure 39. Model output distribution for cost of fire per building per year – with detection................. 48 Figure 40. Model output distribution for cost of fire per building per year – with fire cells max 1000 m²
........................................................................................................................................................... 49
CW ICP
Report number: FQ5014 Date of Issue: 7 July 2006 Page 5 of 5 Pages
Figure 41. Model output distribution for cost of fire per building per year – with fire cells max 2000 m²........................................................................................................................................................... 49
Figure 42. Model output distribution for cost of fire per building per year – with sprinklers and detection ............................................................................................................................................ 50
Figure 43. Comparison of ascending cumulative frequency for the cost of fire per building (pa) of different fire protection options......................................................................................................... 51
Figure 44. Tornado chart for unprotected buildings............................................................................... 52 Figure 45. Tornado chart for sprinklered buildings................................................................................ 53 Figure 46. Tornado chart for buildings with detectors/man suppression ............................................... 53 Figure 47. Tornado chart for compartmented buildings (1000 m² fire cells) ......................................... 54 Figure 48. Tornado chart for compartmented buildings (2000 m² fire cells) ......................................... 54
List of Tables
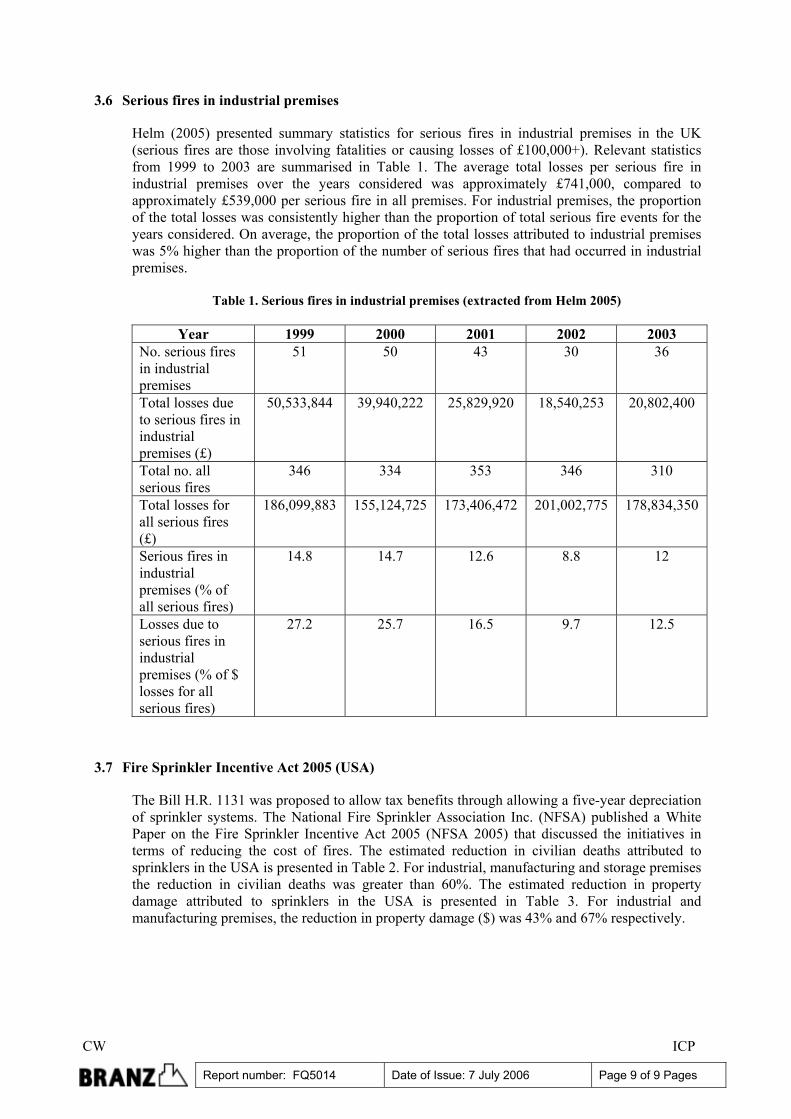
Table 1. Serious fires in industrial premises (extracted from Helm 2005)............................................... 9 Table 2. Civilian deaths per thousand fires based on NFIRS and NFPA 1988–1998 survey (Extracted
from NFSA 2005 and NFIRS version 5.0)........................................................................................ 10 Table 3. Estimated reduction in property damage per fire based on NFIRS and NFPA 1988–1998
survey (Extracted from NFSA 2005) ................................................................................................ 10 Table 4. Storage property structure fires in the US from 1994 to 1998 ................................................. 11 Table 5. Type of automatic extinguishing system present, excluding confined fires, 1999–2002
(extracted from NFIRS version 5.0.)................................................................................................. 11 Table 6. Automatic extinguishing system performance (extracted from NFIRS version 5.0) ............... 12 Table 7. Estimated reduction in civilian deaths per thousand fires due to sprinklers (extracted from
NFIRS version 5.0) ........................................................................................................................... 12 Table 8. Number of premises and fires and the combined floors area in different building categories.
Extracted from Sandberg (2004) ....................................................................................................... 14 Table 9 Classification of various decision analysis methods employed earlier in fire safety engineering
(extracted from Johansson, 2003) ..................................................................................................... 15 Table 10. Estimates of fire separation operational reliability................................................................. 20 Table 11. Estimates of compartment penetrations operational reliability .............................................. 20 Table 12. Probabilities of success of wall construction ......................................................................... 20 Table 13. Estimates of detection system operational reliability ............................................................. 21 Table 14. Type of automatic detection that first raised the alarm for industrial buildings 2000–2004
(Challands 2005) ............................................................................................................................... 24 Table 15. Structure fires in industrial buildings by extent of flame damage 1986–2005 (Challands
2005) grouped into defined damage categories................................................................................. 24 Table 16. Structure fires in industrial buildings by percentage of property saved 1986–2006 (part)
(Challands 2005) ............................................................................................................................... 26 Table 17. Percentage of property saved 1986–2006 (part) compared with BERL Report..................... 26 Table 18 Fire safety precautions required for single storey WM and WH purpose groups ................... 27 Table 19 Fire safety precautions required for single storey WF purpose groups................................... 27 Table 20. Composition of property damage in 2000 adapted from BERL (2002) ................................. 31 Table 21. Correlation between input variables....................................................................................... 46 Table 22. Cost of fire per building as calculated by model simulations ................................................ 50 Table 23. Cost of fire per building of 1000 m² or more as calculated by model simulations ................ 55
CW ICP
Report number: FQ5014 Date of Issue: 7 July 2006 Page 6 of 6 Pages
Fire Loss Reduction in Industrial Buildings – Risk Cost Benefit Study
1. CLIENT
New Zealand Fire Service P O Box 2133 Wellington New Zealand Building Research Inc PO Box 50-127 Porirua New Zealand
2. INTRODUCTION
2.1 Background
The New Zealand Building Code compliance documents currently contain relatively few requirements for the fire protection of industrial buildings. In line with the focus on protecting life and neighbouring property, the potentially devastating effects of large industrial fires on the lives of those who work in them and their families, and on the surrounding community has not been a major consideration in setting the minimum requirements in code compliance documents. Given more recent changes to the Building Act (2004), in future, greater emphasis will be placed on sustainability. This study explores the cost-effectiveness of different fire protection strategies in industrial building taking a wider view of community benefit than previously considered.
2.2 Aims and objectives
The aim of this project is to develop a cost benefit model that would allow the effects (including overall benefit to the community) of increasing the level of fire protection systems in industrial buildings to be evaluated. Specifically, the objectives of this study are to:
• Investigate the cost of a range of additional fire protection measures in industrial buildings and assess their likely impact on the fire losses.
• Develop a cost benefit model that allows these fire protection measures to be compared in financial terms. Economy-wide effects will be included as well as business costs and benefits.
• Understand the sensitivity of the results to uncertainties in the input parameters. • Draw conclusions about the cost-benefit of providing higher levels of property protection in
single storey industrial buildings.
2.3 Definition of industrial buildings
For the purpose of this study, and considering the overall objectives, it is considered that “industrial buildings” are those buildings that would fall into the “W” purpose groups of C/AS1 (DBH, 2005), but
CW ICP
Report number: FQ5014 Date of Issue: 7 July 2006 Page 7 of 7 Pages
excluding business and personal services. In the main, this group of buildings would include manufacturing, processing and storage occupancies.
3. LITERATURE REVIEW
3.1 An economic assessment of industrial fires in New Zealand
BERL (2002) described an economic impact assessment (EIA) to measure the direct and indirect economic costs associated with industrial fires in New Zealand. In addition to analysis of the available fire incident records, the researchers also obtained insurance claims information from the insurance industry. Their study was based on the year 2000 in New Zealand, where 1,100 industrial structure fires were reported. They determined that the total economic and social cost of industrial fires in Zealand (year 2000) was $86 million ($78,200 per fire). This comprised:
• Direct economic costs to business of $44M or $40,000 per fire (this included $8M
for business interruption costs). This represented the value of economic losses experienced by the industry as a result of industrial fires. These costs were estimated using the value of material damage and business interruption insurance claims.
• $23M or $20,909 per fire for Fire Service costs. The cost of the fire service resource represents a share of the total expenditure on emergency response services attributed to industrial fires.
• Indirect economic costs – $10.5M or $9,545 per fire. This represented the value of the economic losses to upstream firms supplying goods or services to the business affected by fire and the resulting decline in consumption that occurs as a result of a decline in sales adversely impacting on wages and profits.
• Social costs dues to injuries and fatalities of $8.5M or $7,727 per fire. The value of a statistical life (VOSL) used was $2,469,900. The average loss of life quality due to serious and minor injuries was estimated to be 10% and 0.4% of the VOSL respectively (following LTSA (2000) methodology). In the year 2000, there were 3 fatalities, 3 life-threatening injuries and 25 non-life threatening injuries.
This study was one of the first attempts at measuring the impact of industrial fire incidents in New Zealand. One of the findings was that although industrial fires account for just 5% of all incidents, they use a disproportionately large amount of the total resource. BERL (2002) have used a wider definition of industrial structure fires than will be used in this study. They included service and retailing industries that are not included here. Comparing the FIRS incident data (discussed later) for manufacturing and storage property uses with the dataset presented by BERL, we can see that the manufacturing and storage property uses account for around 54% of the ‘industrial structure fires’ based on the year 2000 fires presented by BERL. Therefore we can surmise that the expected contribution to the total economic costs for the manufacturing and storage property use subset would be $46 million per year (in year 2000 dollars).
3.2 Risk – informed, performance-based industrial fire protection
Barry (2002) discussed concepts of fire risk analysis, risk assessment and probability modelling within a performance code environment. He defined risk-informed performance-based fire protection engineering as an integration of decision analysis and quantitative risk assessment
CW ICP
Report number: FQ5014 Date of Issue: 7 July 2006 Page 8 of 8 Pages
with a defined step approach for quantifying the performance success of fire protection systems. He describes various methodologies for conducting fire risk analysis in industrial buildings.
3.3 Fire protection in agricultural facilities
Research and industry practices for the fire protection of agricultural buildings (with particular reference to Canada) have been reviewed by Torvi (2003). Since these buildings are often located in remote rural areas, they present a challenge for fire protection. Large quantities of animals, crops and equipment can lead to severe fires and issues relating to animal safety and evacuation. As many agricultural facilities are located in smaller communities, the effects of a severe fire on a major employer can be devastating. There has been relatively little research carried out on fire protection in agricultural buildings (which will not be specifically addressed in the current study).
3.4 FIERAsystem
Benichou et al (2005) described a fire risk model called FIERAsystem (FIre Evaluation and Risk Assessment System) for evaluating fire protection systems in industrial buildings. There are various related papers e.g. Benichou et al (2002, 2003). The model is designed to conduct hazard and risk analyses related to fire protection systems in industrial buildings (it was developed primarily with warehouses and aircraft hangars in mind). The model extends the risk assessment concepts previously developed in FiRECAM (Yung et al 1996) to industrial buildings. FIERAsystem uses time-dependent deterministic and probabilistic models to evaluate the impact of selected fire scenarios on life, property and business interruption. The model requires the user to select the fire scenarios and their probability. For each scenario, four variants are also considered – they are sprinkler system success or failure and fire department suppression success or failure. The expected number of deaths per year and fire losses per year is calculated and summed over all the possible fire scenarios to arrive at an expected risk to life (ERL) and fire cost expectation (FCE) for the building. It was considered that FIERAsystem may be a suitable tool for use in this current study, however it was not currently available for use. Further work is required before a beta version will be available. The FIERAsystem Downtime Model (Benichou et al 2003) was developed to evaluate the likely business interruption as a result of fire damage to a building or its components. The calculation includes parameters such as: total capital cost ($), total replacement duration (person days), total property loss ($), total business interruption (person days).
3.5 Cost-benefit and risk analysis – basis for decisions in the fire safety design process
Lundin (2002) discusses cost-benefit analyses as a tool for the engineer to choose between alternative fire protection measures. Cost-effectiveness is relative to the perspective of the decision-maker i.e. a cost-effective solution for the building owner might not be for the building contractor. It is therefore important to define who is the decision maker? And what information is the decision to be based on?
CW ICP
Report number: FQ5014 Date of Issue: 7 July 2006 Page 9 of 9 Pages
3.6 Serious fires in industrial premises
Helm (2005) presented summary statistics for serious fires in industrial premises in the UK (serious fires are those involving fatalities or causing losses of £100,000+). Relevant statistics from 1999 to 2003 are summarised in Table 1. The average total losses per serious fire in industrial premises over the years considered was approximately £741,000, compared to approximately £539,000 per serious fire in all premises. For industrial premises, the proportion of the total losses was consistently higher than the proportion of total serious fire events for the years considered. On average, the proportion of the total losses attributed to industrial premises was 5% higher than the proportion of the number of serious fires that had occurred in industrial premises.
Table 1. Serious fires in industrial premises (extracted from Helm 2005)
Year 1999 2000 2001 2002 2003
No. serious fires in industrial premises
51 50 43 30 36
Total losses due to serious fires in industrial premises (£)
50,533,844 39,940,222 25,829,920 18,540,253 20,802,400
Total no. all serious fires
346 334 353 346 310
Total losses for all serious fires (£)
186,099,883 155,124,725 173,406,472 201,002,775 178,834,350
Serious fires in industrial premises (% of all serious fires)
14.8 14.7 12.6 8.8 12
Losses due to serious fires in industrial premises (% of $ losses for all serious fires)
27.2 25.7 16.5 9.7 12.5
3.7 Fire Sprinkler Incentive Act 2005 (USA)
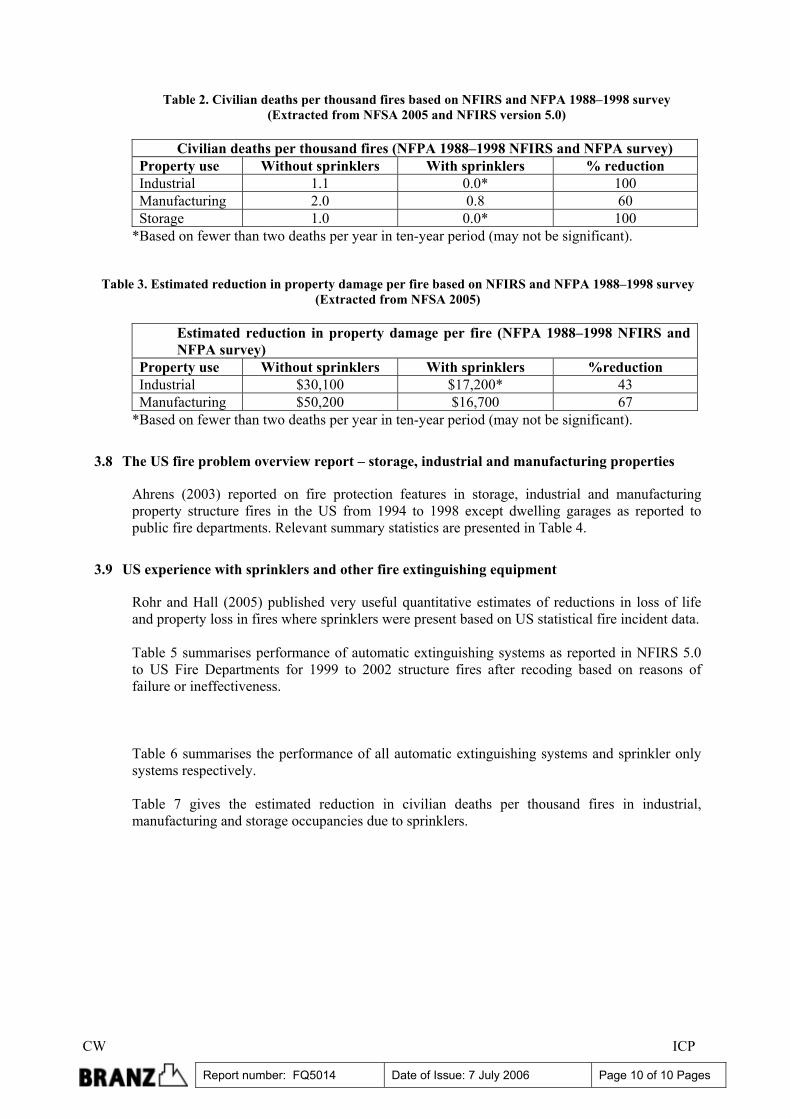
The Bill H.R. 1131 was proposed to allow tax benefits through allowing a five-year depreciation of sprinkler systems. The National Fire Sprinkler Association Inc. (NFSA) published a White Paper on the Fire Sprinkler Incentive Act 2005 (NFSA 2005) that discussed the initiatives in terms of reducing the cost of fires. The estimated reduction in civilian deaths attributed to sprinklers in the USA is presented in Table 2. For industrial, manufacturing and storage premises the reduction in civilian deaths was greater than 60%. The estimated reduction in property damage attributed to sprinklers in the USA is presented in Table 3. For industrial and manufacturing premises, the reduction in property damage ($) was 43% and 67% respectively.
CW ICP
Report number: FQ5014 Date of Issue: 7 July 2006 Page 10 of 10 Pages
Table 2. Civilian deaths per thousand fires based on NFIRS and NFPA 1988–1998 survey (Extracted from NFSA 2005 and NFIRS version 5.0)
Civilian deaths per thousand fires (NFPA 1988–1998 NFIRS and NFPA survey)
Property use Without sprinklers With sprinklers % reduction Industrial 1.1 0.0* 100 Manufacturing 2.0 0.8 60 Storage 1.0 0.0* 100
*Based on fewer than two deaths per year in ten-year period (may not be significant).
Table 3. Estimated reduction in property damage per fire based on NFIRS and NFPA 1988–1998 survey
(Extracted from NFSA 2005)
Estimated reduction in property damage per fire (NFPA 1988–1998 NFIRS and NFPA survey)
Property use Without sprinklers With sprinklers %reduction Industrial $30,100 $17,200* 43 Manufacturing $50,200 $16,700 67
*Based on fewer than two deaths per year in ten-year period (may not be significant).
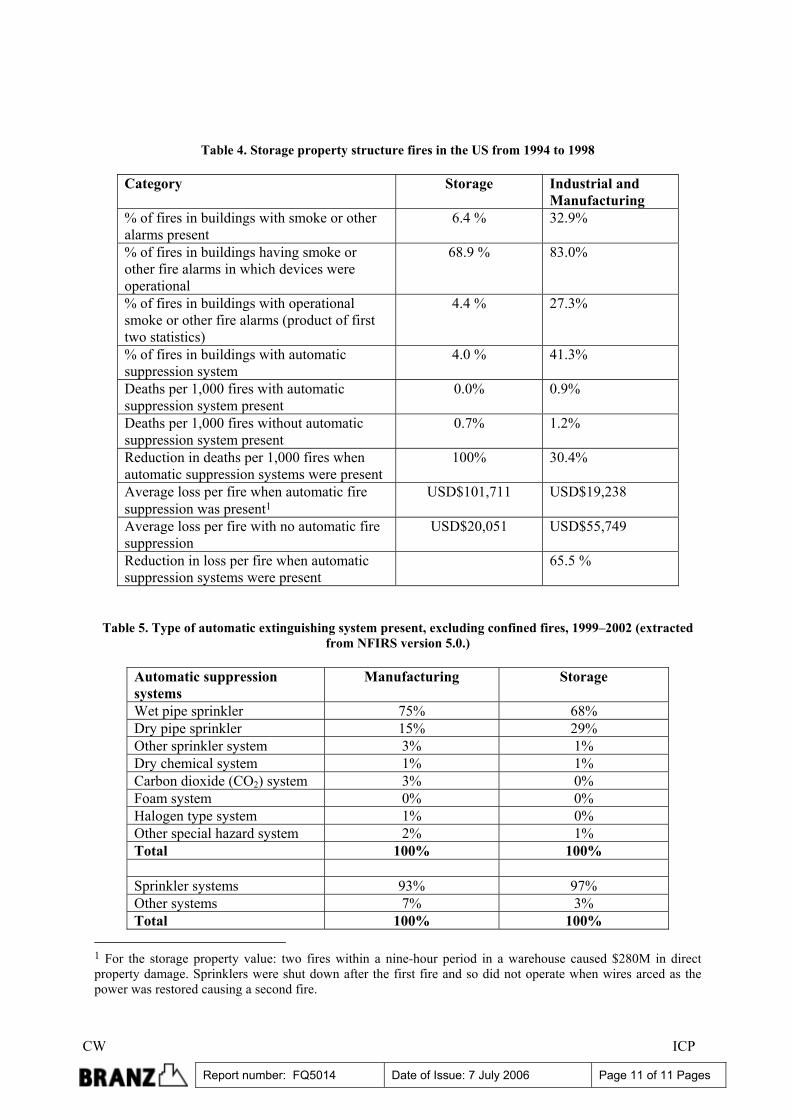
3.8 The US fire problem overview report – storage, industrial and manufacturing properties
Ahrens (2003) reported on fire protection features in storage, industrial and manufacturing property structure fires in the US from 1994 to 1998 except dwelling garages as reported to public fire departments. Relevant summary statistics are presented in Table 4.
3.9 US experience with sprinklers and other fire extinguishing equipment
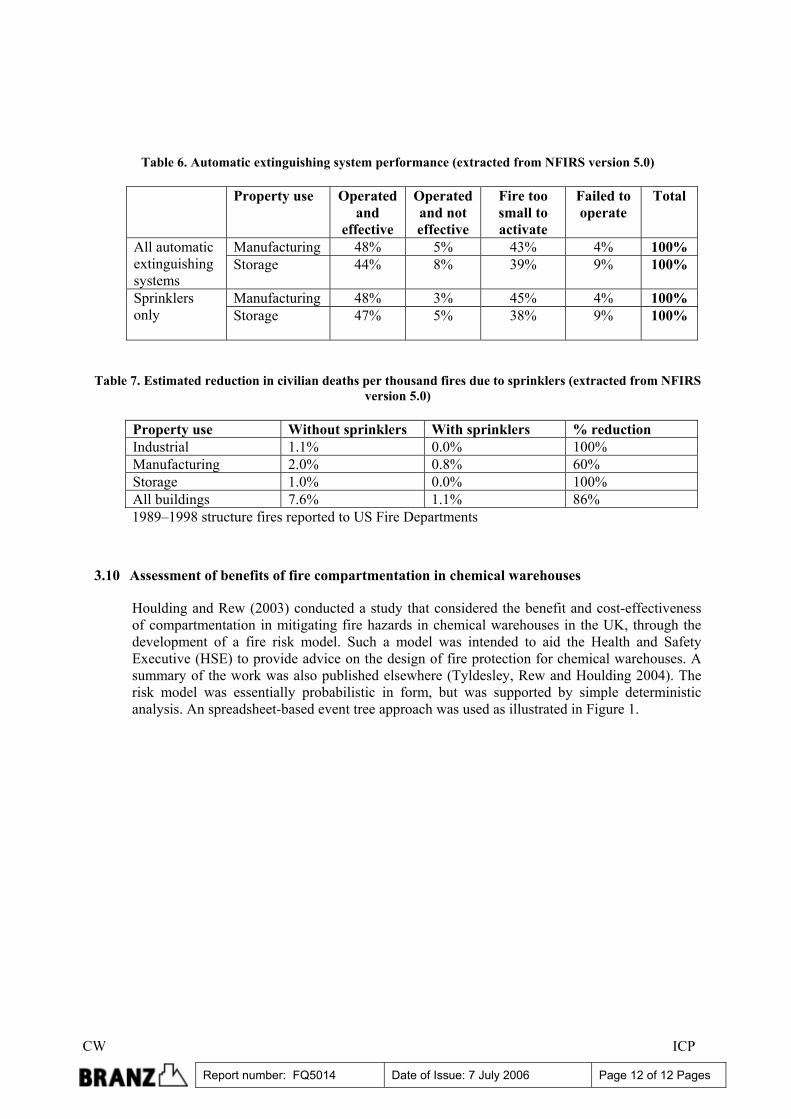
Rohr and Hall (2005) published very useful quantitative estimates of reductions in loss of life and property loss in fires where sprinklers were present based on US statistical fire incident data. Table 5 summarises performance of automatic extinguishing systems as reported in NFIRS 5.0 to US Fire Departments for 1999 to 2002 structure fires after recoding based on reasons of failure or ineffectiveness. Table 6 summarises the performance of all automatic extinguishing systems and sprinkler only systems respectively. Table 7 gives the estimated reduction in civilian deaths per thousand fires in industrial, manufacturing and storage occupancies due to sprinklers.
CW ICP
Report number: FQ5014 Date of Issue: 7 July 2006 Page 11 of 11 Pages
Table 4. Storage property structure fires in the US from 1994 to 1998
Category Storage Industrial and Manufacturing
% of fires in buildings with smoke or other alarms present
6.4 % 32.9%
% of fires in buildings having smoke or other fire alarms in which devices were operational
68.9 % 83.0%
% of fires in buildings with operational smoke or other fire alarms (product of first two statistics)
4.4 % 27.3%
% of fires in buildings with automatic suppression system
4.0 % 41.3%
Deaths per 1,000 fires with automatic suppression system present
0.0% 0.9%
Deaths per 1,000 fires without automatic suppression system present
0.7% 1.2%
Reduction in deaths per 1,000 fires when automatic suppression systems were present
100% 30.4%
Average loss per fire when automatic fire suppression was present1
USD$101,711 USD$19,238
Average loss per fire with no automatic fire suppression
USD$20,051 USD$55,749
Reduction in loss per fire when automatic suppression systems were present
65.5 %
Table 5. Type of automatic extinguishing system present, excluding confined fires, 1999–2002 (extracted from NFIRS version 5.0.)
Automatic suppression systems
Manufacturing Storage
Wet pipe sprinkler 75% 68% Dry pipe sprinkler 15% 29% Other sprinkler system 3% 1% Dry chemical system 1% 1% Carbon dioxide (CO2) system 3% 0% Foam system 0% 0% Halogen type system 1% 0% Other special hazard system 2% 1% Total 100% 100% Sprinkler systems 93% 97% Other systems 7% 3% Total 100% 100%
1 For the storage property value: two fires within a nine-hour period in a warehouse caused $280M in direct property damage. Sprinklers were shut down after the first fire and so did not operate when wires arced as the power was restored causing a second fire.
CW ICP
Report number: FQ5014 Date of Issue: 7 July 2006 Page 12 of 12 Pages
Table 6. Automatic extinguishing system performance (extracted from NFIRS version 5.0) Property use Operated
and effective
Operated and not effective
Fire too small to activate
Failed to operate
Total
Manufacturing 48% 5% 43% 4% 100% All automatic extinguishing systems
Storage 44% 8% 39% 9% 100%
Manufacturing 48% 3% 45% 4% 100% Sprinklers only
Storage 47% 5% 38% 9% 100%
Table 7. Estimated reduction in civilian deaths per thousand fires due to sprinklers (extracted from NFIRS version 5.0)
Property use Without sprinklers With sprinklers % reduction Industrial 1.1% 0.0% 100% Manufacturing 2.0% 0.8% 60% Storage 1.0% 0.0% 100% All buildings 7.6% 1.1% 86% 1989–1998 structure fires reported to US Fire Departments
3.10 Assessment of benefits of fire compartmentation in chemical warehouses
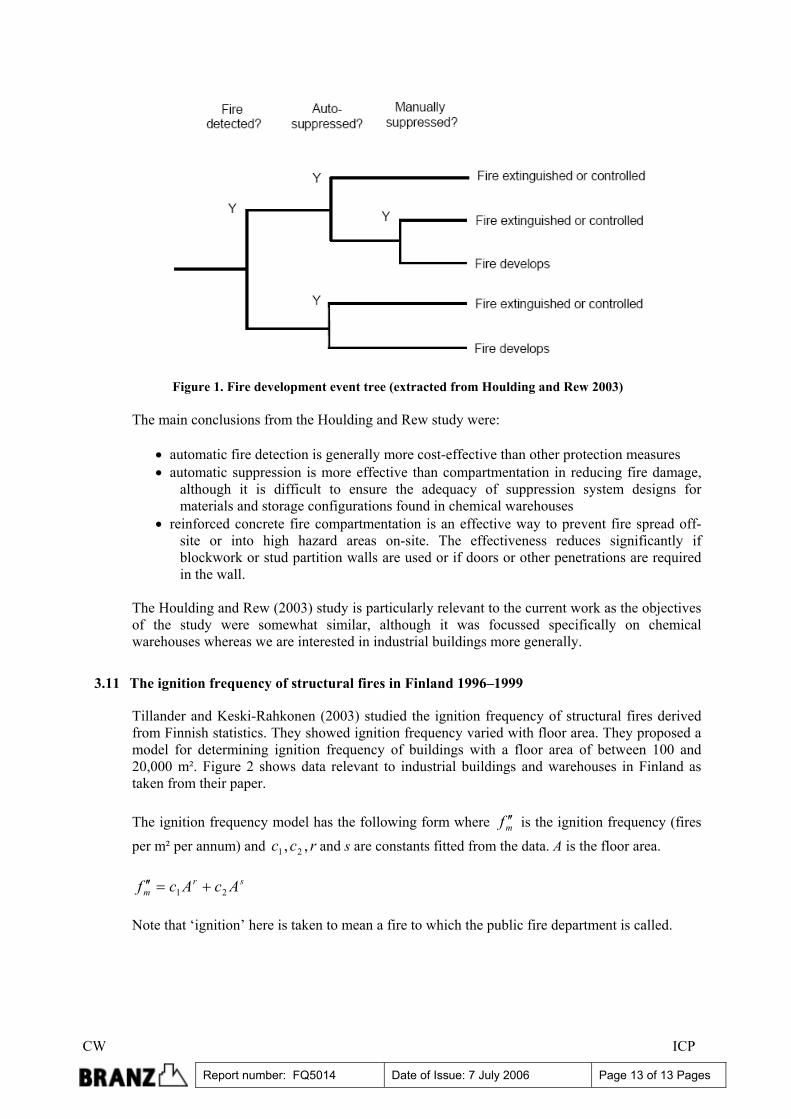
Houlding and Rew (2003) conducted a study that considered the benefit and cost-effectiveness of compartmentation in mitigating fire hazards in chemical warehouses in the UK, through the development of a fire risk model. Such a model was intended to aid the Health and Safety Executive (HSE) to provide advice on the design of fire protection for chemical warehouses. A summary of the work was also published elsewhere (Tyldesley, Rew and Houlding 2004). The risk model was essentially probabilistic in form, but was supported by simple deterministic analysis. An spreadsheet-based event tree approach was used as illustrated in Figure 1.
CW ICP
Report number: FQ5014 Date of Issue: 7 July 2006 Page 13 of 13 Pages
Figure 1. Fire development event tree (extracted from Houlding and Rew 2003)
The main conclusions from the Houlding and Rew study were:
• automatic fire detection is generally more cost-effective than other protection measures • automatic suppression is more effective than compartmentation in reducing fire damage,
although it is difficult to ensure the adequacy of suppression system designs for materials and storage configurations found in chemical warehouses
• reinforced concrete fire compartmentation is an effective way to prevent fire spread off-site or into high hazard areas on-site. The effectiveness reduces significantly if blockwork or stud partition walls are used or if doors or other penetrations are required in the wall.
The Houlding and Rew (2003) study is particularly relevant to the current work as the objectives of the study were somewhat similar, although it was focussed specifically on chemical warehouses whereas we are interested in industrial buildings more generally.
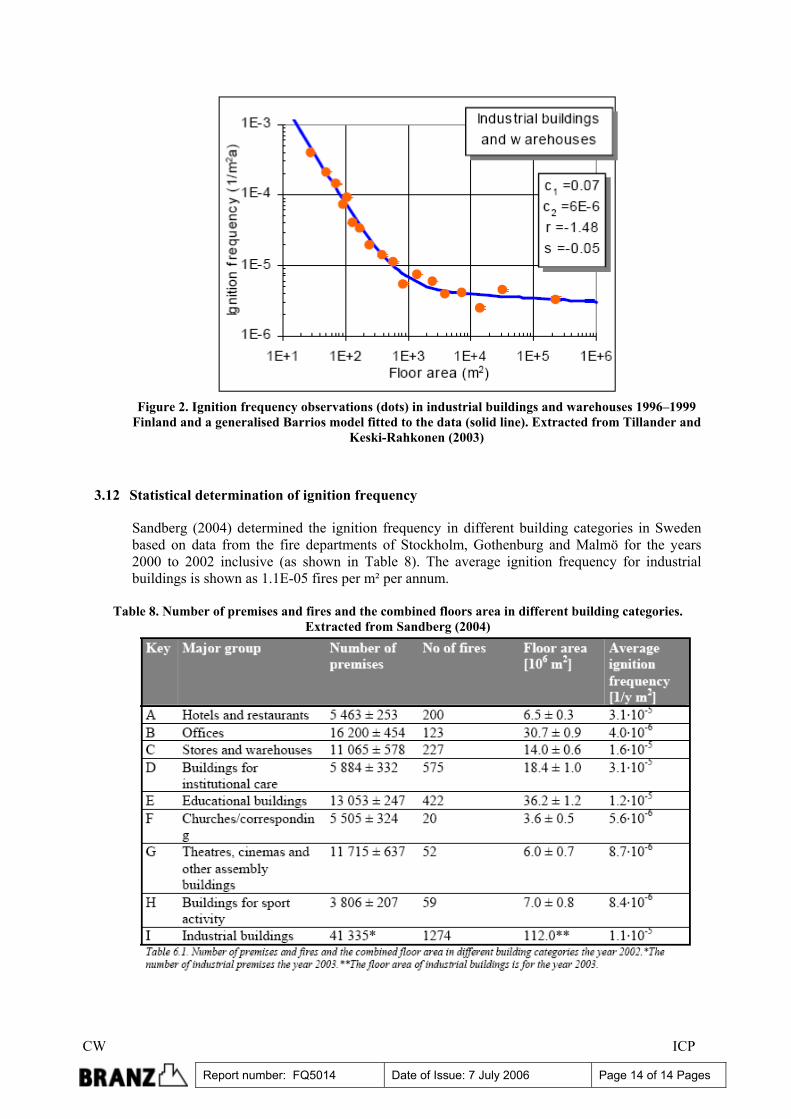
3.11 The ignition frequency of structural fires in Finland 1996–1999
Tillander and Keski-Rahkonen (2003) studied the ignition frequency of structural fires derived from Finnish statistics. They showed ignition frequency varied with floor area. They proposed a model for determining ignition frequency of buildings with a floor area of between 100 and 20,000 m². Figure 2 shows data relevant to industrial buildings and warehouses in Finland as taken from their paper. The ignition frequency model has the following form where mf ′′ is the ignition frequency (fires
per m² per annum) and rcc ,, 21 and s are constants fitted from the data. A is the floor area.
srm AcAcf 21 +=′′
Note that ‘ignition’ here is taken to mean a fire to which the public fire department is called.
CW ICP
Report number: FQ5014 Date of Issue: 7 July 2006 Page 14 of 14 Pages
Figure 2. Ignition frequency observations (dots) in industrial buildings and warehouses 1996–1999
Finland and a generalised Barrios model fitted to the data (solid line). Extracted from Tillander and Keski-Rahkonen (2003)
3.12 Statistical determination of ignition frequency
Sandberg (2004) determined the ignition frequency in different building categories in Sweden based on data from the fire departments of Stockholm, Gothenburg and Malmö for the years 2000 to 2002 inclusive (as shown in Table 8). The average ignition frequency for industrial buildings is shown as 1.1E-05 fires per m² per annum.
Table 8. Number of premises and fires and the combined floors area in different building categories.
Extracted from Sandberg (2004)
CW ICP
Report number: FQ5014 Date of Issue: 7 July 2006 Page 15 of 15 Pages
3.13 Decision Analysis in Fire Safety Engineering – Analysing Investments in Fire Safety
Johansson (2003) presented a summary of various decision analysis methods employed in fire safety engineering prior to 2003 (Table 9). Each of the decision analysis methods were classified as to the types of buildings (i.e. specific or general) that the method was to be applied to and the type of method (i.e. index, expected-cost or expected-utility). Johansson (2002, 2003) described a methodology for conducting decision analysis concerned with investments in fire safety. He put forward an approach that involves decision rules based on maximising the expected utility but also including analysis of the uncertainty regarding the probabilities and consequences of different fire scenarios. This allowed conclusions to be drawn about the robustness of the decision to choose one alternative over another.
Table 9 Classification of various decision analysis methods employed earlier in fire safety engineering (extracted from Johansson, 2003)
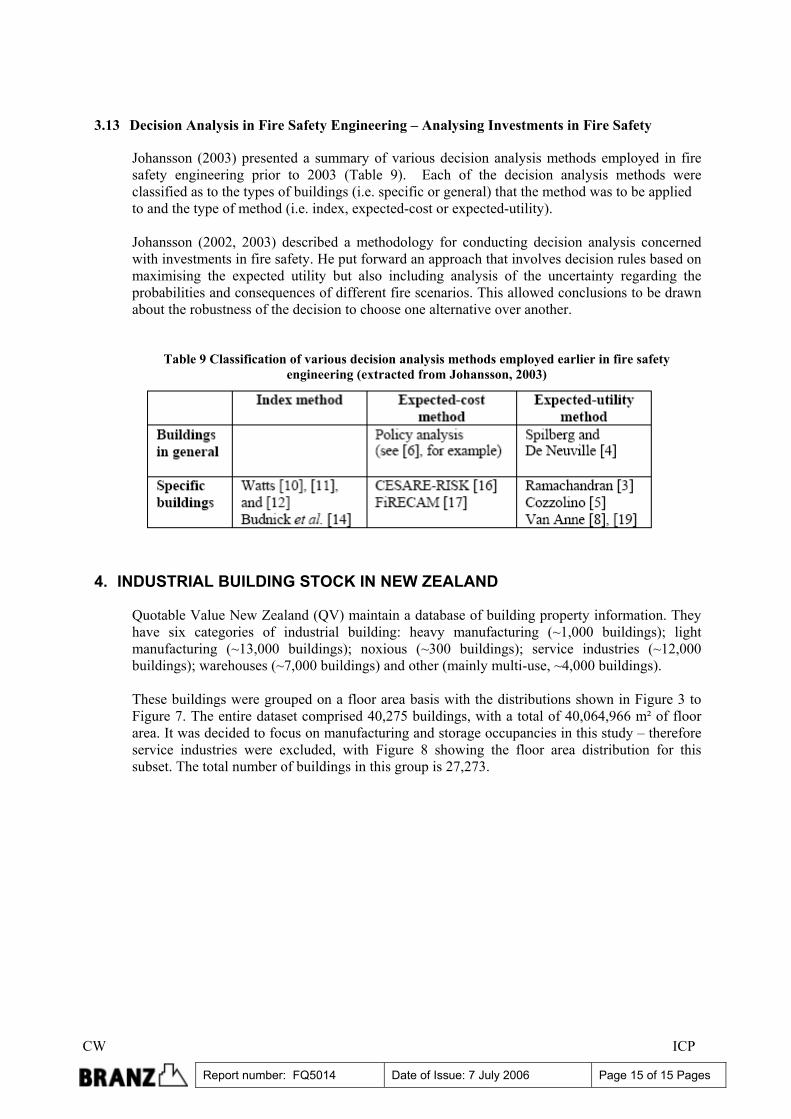
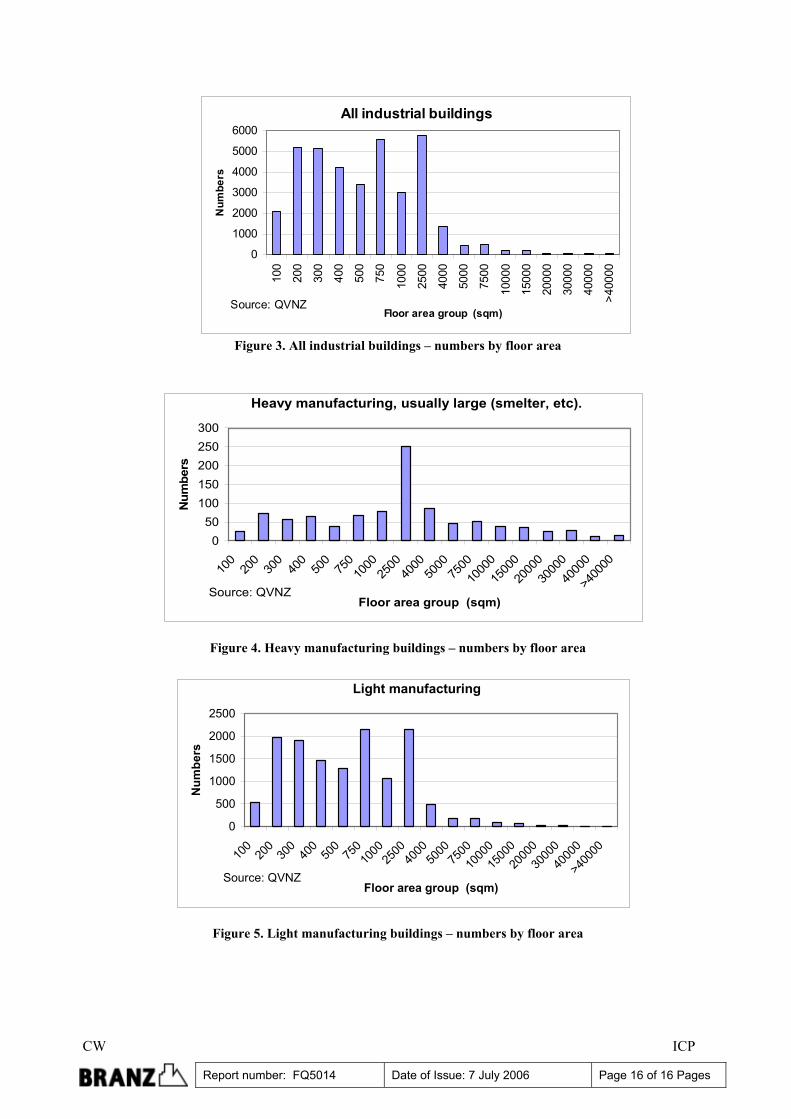
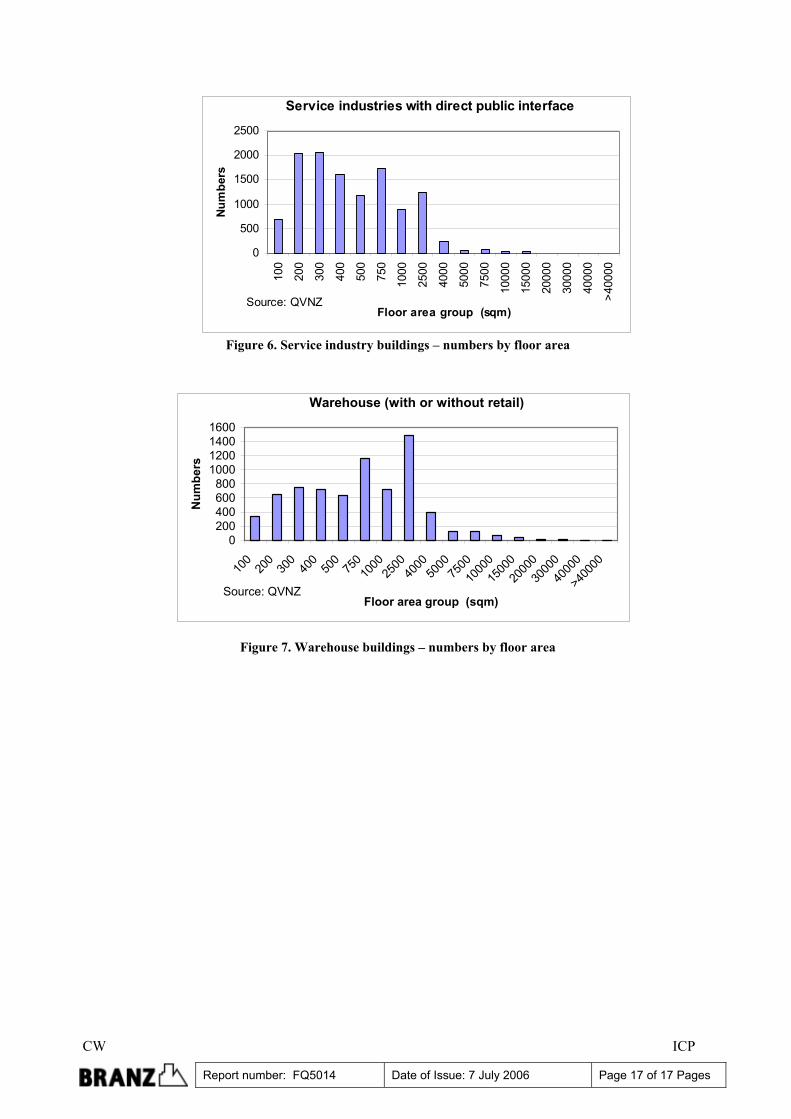
4. INDUSTRIAL BUILDING STOCK IN NEW ZEALAND
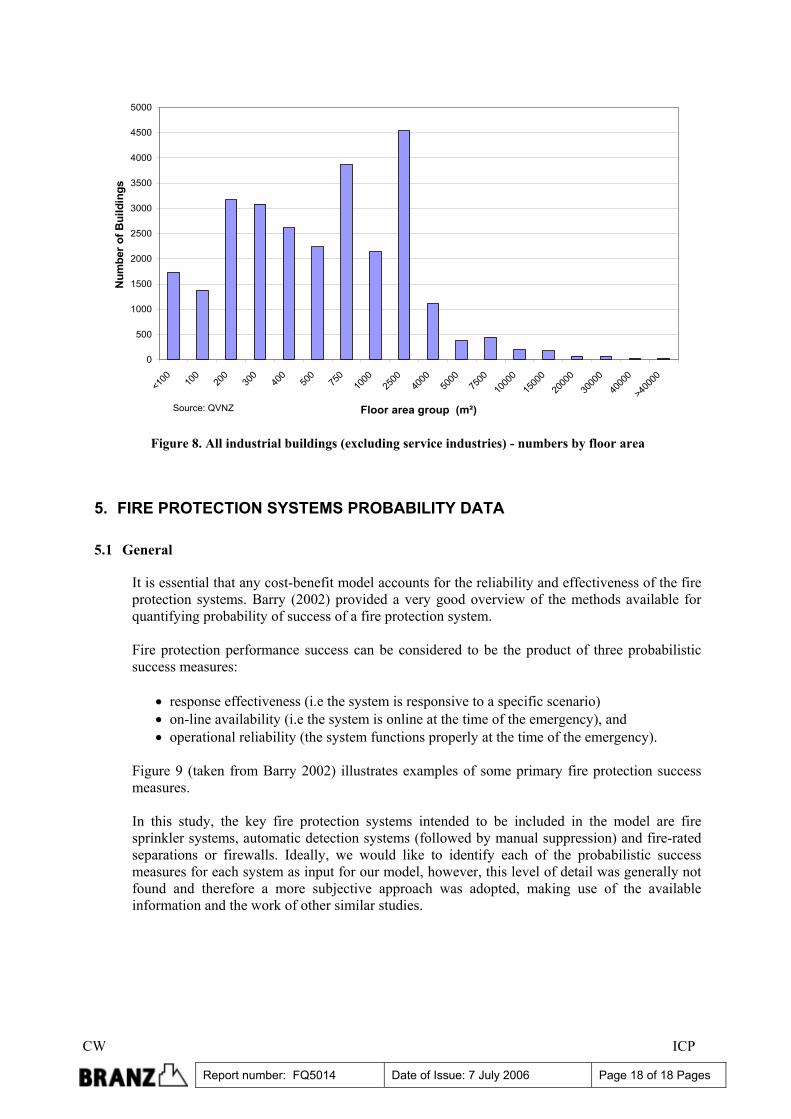
Quotable Value New Zealand (QV) maintain a database of building property information. They have six categories of industrial building: heavy manufacturing (~1,000 buildings); light manufacturing (~13,000 buildings); noxious (~300 buildings); service industries (~12,000 buildings); warehouses (~7,000 buildings) and other (mainly multi-use, ~4,000 buildings). These buildings were grouped on a floor area basis with the distributions shown in Figure 3 to Figure 7. The entire dataset comprised 40,275 buildings, with a total of 40,064,966 m² of floor area. It was decided to focus on manufacturing and storage occupancies in this study – therefore service industries were excluded, with Figure 8 showing the floor area distribution for this subset. The total number of buildings in this group is 27,273.
CW ICP
Report number: FQ5014 Date of Issue: 7 July 2006 Page 16 of 16 Pages
All industrial buildings
0
1000
2000
3000
4000
5000
6000
100
200
300
400
500
750
1000
2500
4000
5000
7500
1000
0
1500
0
2000
0
3000
0
4000
0
>400
00
Floor area group (sqm)
Num
bers
Source: QVNZ
Figure 3. All industrial buildings – numbers by floor area
050
100150200250300
100
200
300
400
500
750
1000
2500
4000
5000
7500
1000
015
00020
00030
00040
000
>400
00
Floor area group (sqm)
Num
bers
Heavy manufacturing, usually large (smelter, etc).
Source: QVNZ
Figure 4. Heavy manufacturing buildings – numbers by floor area
0
500
1000
1500
2000
2500
100
200
300
400
500
750
1000
2500
4000
5000
7500
1000
015
00020
00030
00040
000
>4000
0
Floor area group (sqm)
Num
bers
Light manufacturing
Source: QVNZ
Figure 5. Light manufacturing buildings – numbers by floor area
CW ICP
Report number: FQ5014 Date of Issue: 7 July 2006 Page 17 of 17 Pages
0
500
1000
1500
2000
2500
100
200
300
400
500
750
1000
2500
4000
5000
7500
1000
0
1500
0
2000
0
3000
0
4000
0
>400
00
Floor area group (sqm)
Num
bers
Service industries with direct public interface
Source: QVNZ
Figure 6. Service industry buildings – numbers by floor area
0200400600800
1000120014001600
100
200
300
400
500
750
1000
2500
4000
5000
7500
1000
015
00020
00030
00040
000
>4000
0
Floor area group (sqm)
Num
bers
Warehouse (with or without retail)
Source: QVNZ
Figure 7. Warehouse buildings – numbers by floor area
CW ICP
Report number: FQ5014 Date of Issue: 7 July 2006 Page 18 of 18 Pages
0
500
1000
1500
2000
2500
3000
3500
4000
4500
5000
<100 10
020
030
040
050
075
010
0025
0040
0050
0075
0010
000
1500
020
000
3000
040
000
>400
00
Floor area group (m²)
Num
ber o
f Bui
ldin
gs
Source: QVNZ
Figure 8. All industrial buildings (excluding service industries) - numbers by floor area
5. FIRE PROTECTION SYSTEMS PROBABILITY DATA
5.1 General
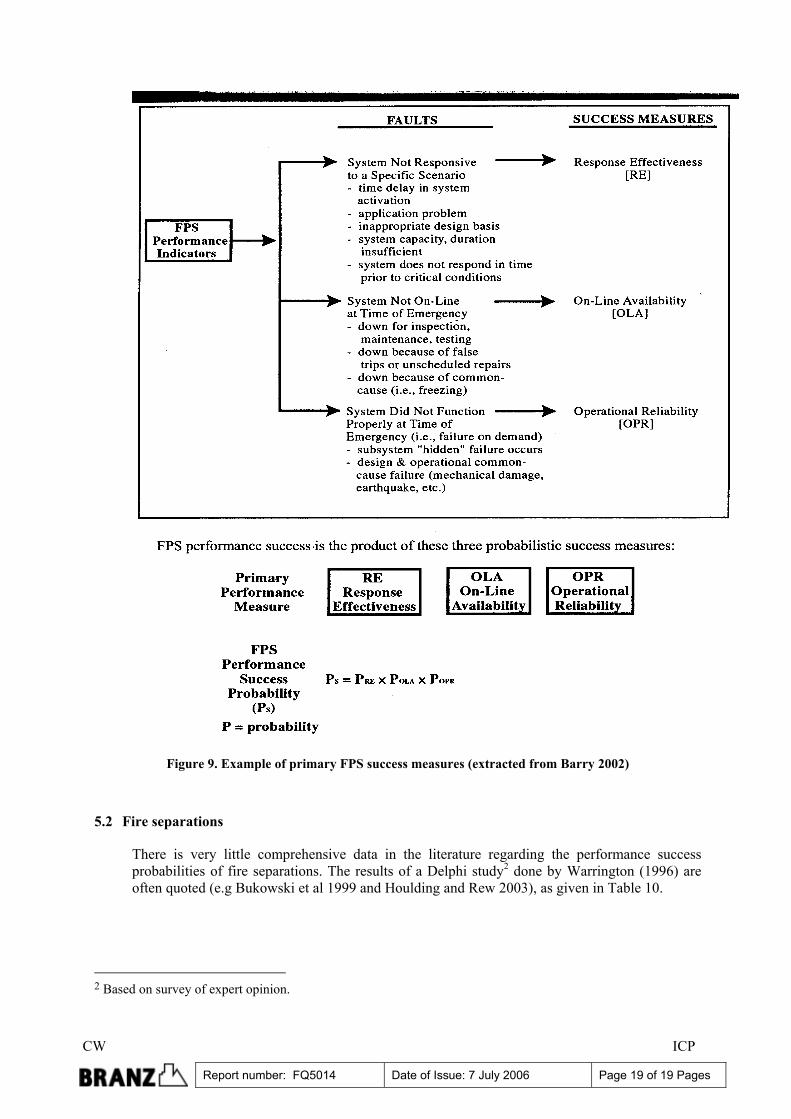
It is essential that any cost-benefit model accounts for the reliability and effectiveness of the fire protection systems. Barry (2002) provided a very good overview of the methods available for quantifying probability of success of a fire protection system. Fire protection performance success can be considered to be the product of three probabilistic success measures:
• response effectiveness (i.e the system is responsive to a specific scenario) • on-line availability (i.e the system is online at the time of the emergency), and • operational reliability (the system functions properly at the time of the emergency).
Figure 9 (taken from Barry 2002) illustrates examples of some primary fire protection success measures. In this study, the key fire protection systems intended to be included in the model are fire sprinkler systems, automatic detection systems (followed by manual suppression) and fire-rated separations or firewalls. Ideally, we would like to identify each of the probabilistic success measures for each system as input for our model, however, this level of detail was generally not found and therefore a more subjective approach was adopted, making use of the available information and the work of other similar studies.
CW ICP
Report number: FQ5014 Date of Issue: 7 July 2006 Page 19 of 19 Pages
Figure 9. Example of primary FPS success measures (extracted from Barry 2002)
5.2 Fire separations
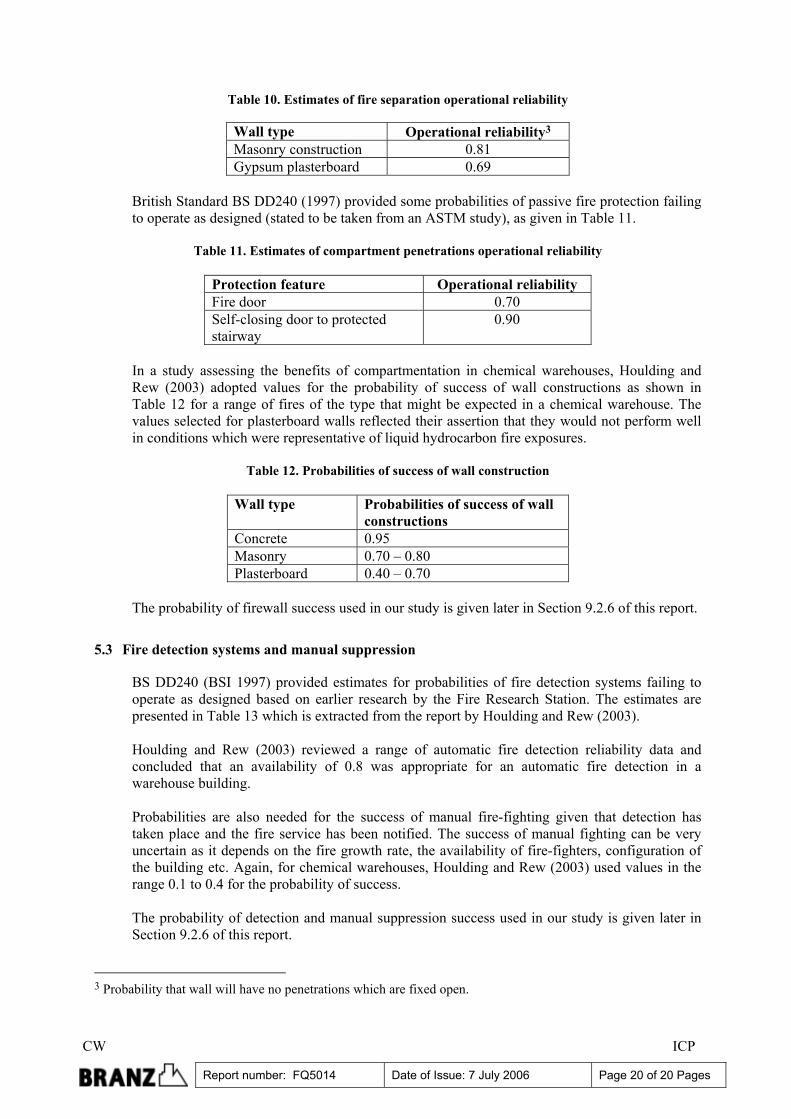
There is very little comprehensive data in the literature regarding the performance success probabilities of fire separations. The results of a Delphi study2 done by Warrington (1996) are often quoted (e.g Bukowski et al 1999 and Houlding and Rew 2003), as given in Table 10.
2 Based on survey of expert opinion.
CW ICP
Report number: FQ5014 Date of Issue: 7 July 2006 Page 20 of 20 Pages
Table 10. Estimates of fire separation operational reliability
Wall type Operational reliability3 Masonry construction 0.81 Gypsum plasterboard 0.69
British Standard BS DD240 (1997) provided some probabilities of passive fire protection failing to operate as designed (stated to be taken from an ASTM study), as given in Table 11.
Table 11. Estimates of compartment penetrations operational reliability
Protection feature Operational reliability Fire door 0.70 Self-closing door to protected stairway
0.90
In a study assessing the benefits of compartmentation in chemical warehouses, Houlding and Rew (2003) adopted values for the probability of success of wall constructions as shown in Table 12 for a range of fires of the type that might be expected in a chemical warehouse. The values selected for plasterboard walls reflected their assertion that they would not perform well in conditions which were representative of liquid hydrocarbon fire exposures.
Table 12. Probabilities of success of wall construction
Wall type Probabilities of success of wall constructions
Concrete 0.95 Masonry 0.70 – 0.80 Plasterboard 0.40 – 0.70
The probability of firewall success used in our study is given later in Section 9.2.6 of this report.
5.3 Fire detection systems and manual suppression
BS DD240 (BSI 1997) provided estimates for probabilities of fire detection systems failing to operate as designed based on earlier research by the Fire Research Station. The estimates are presented in Table 13 which is extracted from the report by Houlding and Rew (2003). Houlding and Rew (2003) reviewed a range of automatic fire detection reliability data and concluded that an availability of 0.8 was appropriate for an automatic fire detection in a warehouse building. Probabilities are also needed for the success of manual fire-fighting given that detection has taken place and the fire service has been notified. The success of manual fighting can be very uncertain as it depends on the fire growth rate, the availability of fire-fighters, configuration of the building etc. Again, for chemical warehouses, Houlding and Rew (2003) used values in the range 0.1 to 0.4 for the probability of success. The probability of detection and manual suppression success used in our study is given later in Section 9.2.6 of this report.
3 Probability that wall will have no penetrations which are fixed open.
CW ICP
Report number: FQ5014 Date of Issue: 7 July 2006 Page 21 of 21 Pages
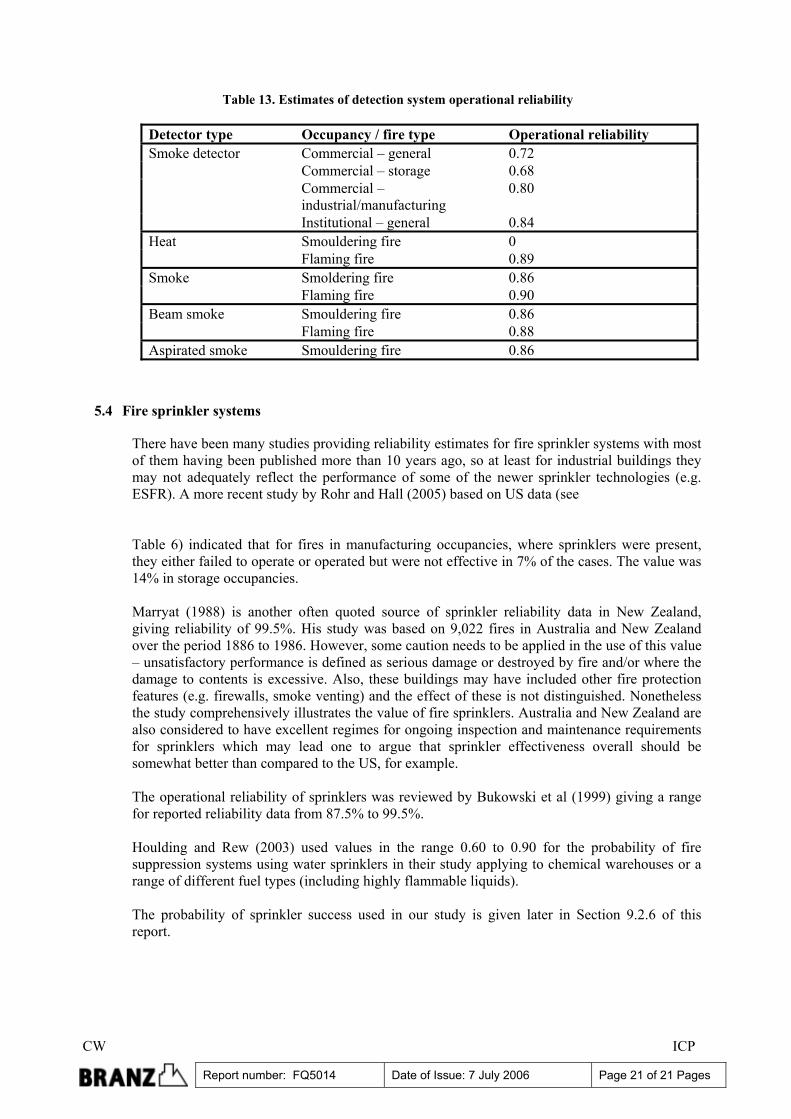
Table 13. Estimates of detection system operational reliability
Detector type Occupancy / fire type Operational reliability Commercial – general 0.72 Commercial – storage 0.68 Commercial – industrial/manufacturing
0.80
Smoke detector
Institutional – general 0.84 Smouldering fire 0 Heat Flaming fire 0.89 Smoldering fire 0.86 Smoke Flaming fire 0.90 Smouldering fire 0.86 Beam smoke Flaming fire 0.88
Aspirated smoke Smouldering fire 0.86
5.4 Fire sprinkler systems
There have been many studies providing reliability estimates for fire sprinkler systems with most of them having been published more than 10 years ago, so at least for industrial buildings they may not adequately reflect the performance of some of the newer sprinkler technologies (e.g. ESFR). A more recent study by Rohr and Hall (2005) based on US data (see Table 6) indicated that for fires in manufacturing occupancies, where sprinklers were present, they either failed to operate or operated but were not effective in 7% of the cases. The value was 14% in storage occupancies. Marryat (1988) is another often quoted source of sprinkler reliability data in New Zealand, giving reliability of 99.5%. His study was based on 9,022 fires in Australia and New Zealand over the period 1886 to 1986. However, some caution needs to be applied in the use of this value – unsatisfactory performance is defined as serious damage or destroyed by fire and/or where the damage to contents is excessive. Also, these buildings may have included other fire protection features (e.g. firewalls, smoke venting) and the effect of these is not distinguished. Nonetheless the study comprehensively illustrates the value of fire sprinklers. Australia and New Zealand are also considered to have excellent regimes for ongoing inspection and maintenance requirements for sprinklers which may lead one to argue that sprinkler effectiveness overall should be somewhat better than compared to the US, for example. The operational reliability of sprinklers was reviewed by Bukowski et al (1999) giving a range for reported reliability data from 87.5% to 99.5%. Houlding and Rew (2003) used values in the range 0.60 to 0.90 for the probability of fire suppression systems using water sprinklers in their study applying to chemical warehouses or a range of different fuel types (including highly flammable liquids). The probability of sprinkler success used in our study is given later in Section 9.2.6 of this report.
CW ICP
Report number: FQ5014 Date of Issue: 7 July 2006 Page 22 of 22 Pages
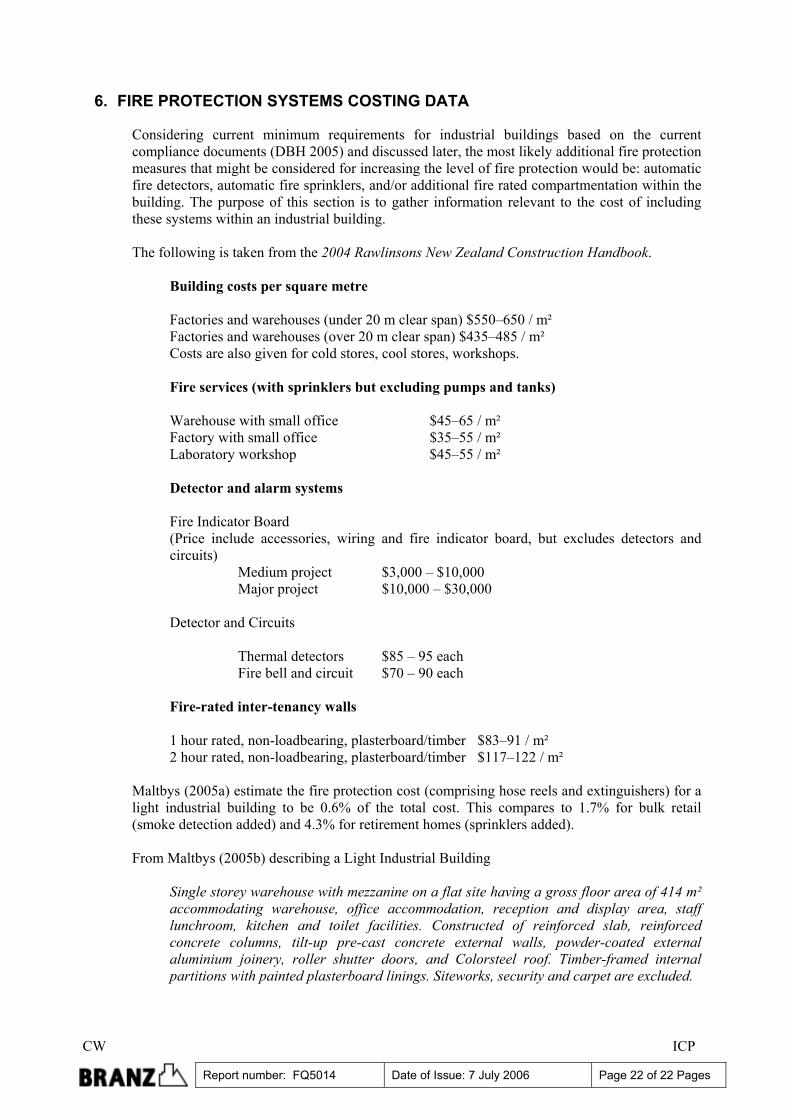
6. FIRE PROTECTION SYSTEMS COSTING DATA
Considering current minimum requirements for industrial buildings based on the current compliance documents (DBH 2005) and discussed later, the most likely additional fire protection measures that might be considered for increasing the level of fire protection would be: automatic fire detectors, automatic fire sprinklers, and/or additional fire rated compartmentation within the building. The purpose of this section is to gather information relevant to the cost of including these systems within an industrial building.
The following is taken from the 2004 Rawlinsons New Zealand Construction Handbook.
Building costs per square metre Factories and warehouses (under 20 m clear span) $550–650 / m² Factories and warehouses (over 20 m clear span) $435–485 / m² Costs are also given for cold stores, cool stores, workshops. Fire services (with sprinklers but excluding pumps and tanks) Warehouse with small office $45–65 / m² Factory with small office $35–55 / m² Laboratory workshop $45–55 / m² Detector and alarm systems Fire Indicator Board (Price include accessories, wiring and fire indicator board, but excludes detectors and circuits) Medium project $3,000 – $10,000 Major project $10,000 – $30,000 Detector and Circuits Thermal detectors $85 – 95 each Fire bell and circuit $70 – 90 each Fire-rated inter-tenancy walls 1 hour rated, non-loadbearing, plasterboard/timber $83–91 / m² 2 hour rated, non-loadbearing, plasterboard/timber $117–122 / m²
Maltbys (2005a) estimate the fire protection cost (comprising hose reels and extinguishers) for a light industrial building to be 0.6% of the total cost. This compares to 1.7% for bulk retail (smoke detection added) and 4.3% for retirement homes (sprinklers added). From Maltbys (2005b) describing a Light Industrial Building
Single storey warehouse with mezzanine on a flat site having a gross floor area of 414 m² accommodating warehouse, office accommodation, reception and display area, staff lunchroom, kitchen and toilet facilities. Constructed of reinforced slab, reinforced concrete columns, tilt-up pre-cast concrete external walls, powder-coated external aluminium joinery, roller shutter doors, and Colorsteel roof. Timber-framed internal partitions with painted plasterboard linings. Siteworks, security and carpet are excluded.
CW ICP
Report number: FQ5014 Date of Issue: 7 July 2006 Page 23 of 23 Pages
Cost of an industrial building as at July 2005 – $1005–1074/m². The rates are per m² of gross floor area for each building type and include GST. “The unit construction costs are built up from current commercial prices of materials and labour along with current allowances for contractor’s overheads and margins. Pricing is based on a model building for the region and consequently allowances will need to be made where recognition is deemed necessary for particular and specific conditions.”
Estimates of the cost of an automatic fire detection and alarm system (Type 3) for industrial buildings was provided by Clark (2006). The estimates were: Fixed cost per building of $5,000 for the alarm panel. Variable cost of $9 per m² of floor area for the detectors, sounders and callpoints. Annual maintenance per building of $700 for monthly testing and annual survey. Fire service connection costs per building of $1,000 per year.
7. NEW ZEALAND FIRE INCIDENT STATISTICS
7.1 General
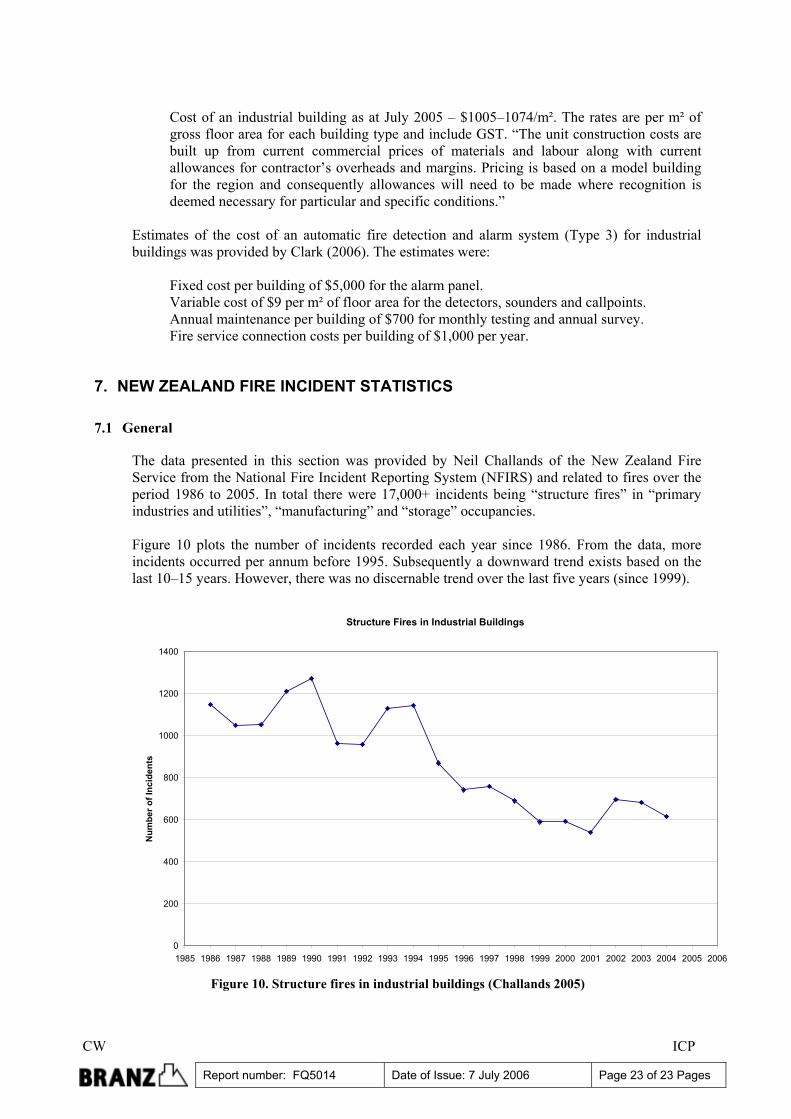
The data presented in this section was provided by Neil Challands of the New Zealand Fire Service from the National Fire Incident Reporting System (NFIRS) and related to fires over the period 1986 to 2005. In total there were 17,000+ incidents being “structure fires” in “primary industries and utilities”, “manufacturing” and “storage” occupancies.
Figure 10 plots the number of incidents recorded each year since 1986. From the data, more incidents occurred per annum before 1995. Subsequently a downward trend exists based on the last 10–15 years. However, there was no discernable trend over the last five years (since 1999).
Structure Fires in Industrial Buildings
0
200
400
600
800
1000
1200
1400
1985 1986 1987 1988 1989 1990 1991 1992 1993 1994 1995 1996 1997 1998 1999 2000 2001 2002 2003 2004 2005 2006
Num
ber o
f Inc
iden
ts
Figure 10. Structure fires in industrial buildings (Challands 2005)
CW ICP
Report number: FQ5014 Date of Issue: 7 July 2006 Page 24 of 24 Pages
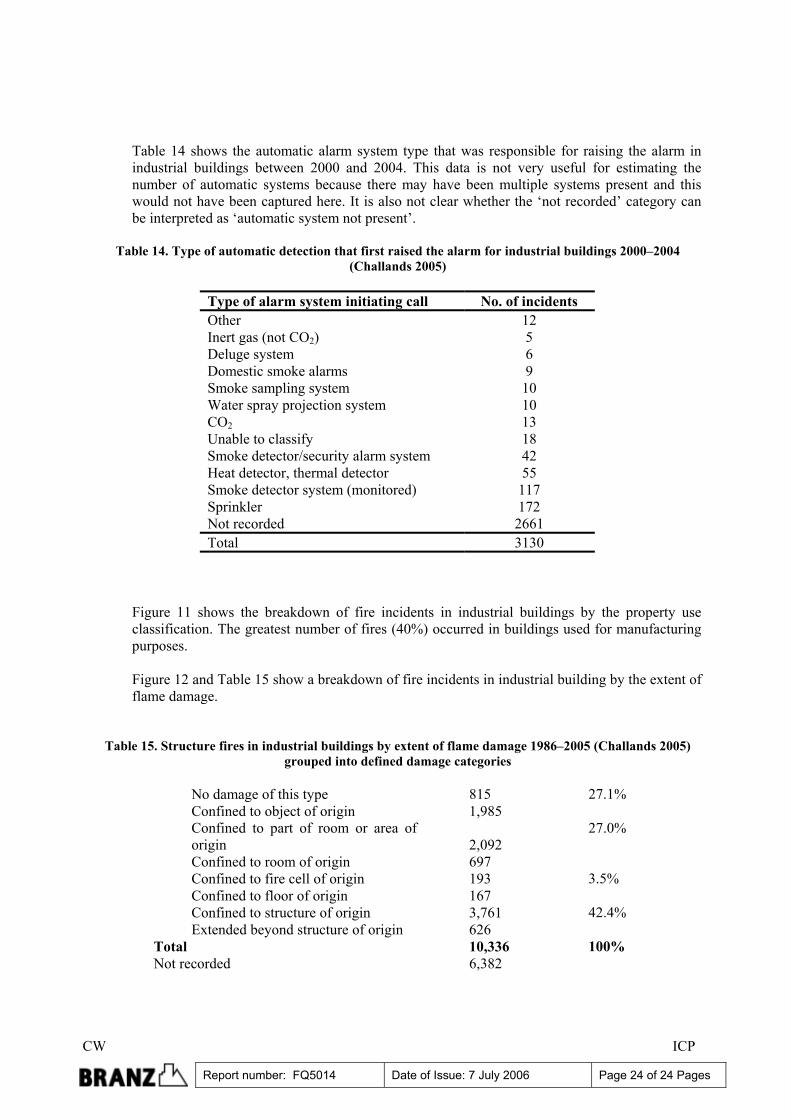
Table 14 shows the automatic alarm system type that was responsible for raising the alarm in industrial buildings between 2000 and 2004. This data is not very useful for estimating the number of automatic systems because there may have been multiple systems present and this would not have been captured here. It is also not clear whether the ‘not recorded’ category can be interpreted as ‘automatic system not present’.
Table 14. Type of automatic detection that first raised the alarm for industrial buildings 2000–2004 (Challands 2005)
Type of alarm system initiating call No. of incidents Other 12 Inert gas (not CO2) 5 Deluge system 6 Domestic smoke alarms 9 Smoke sampling system 10 Water spray projection system 10 CO2 13 Unable to classify 18 Smoke detector/security alarm system 42 Heat detector, thermal detector 55 Smoke detector system (monitored) 117 Sprinkler 172 Not recorded 2661 Total 3130
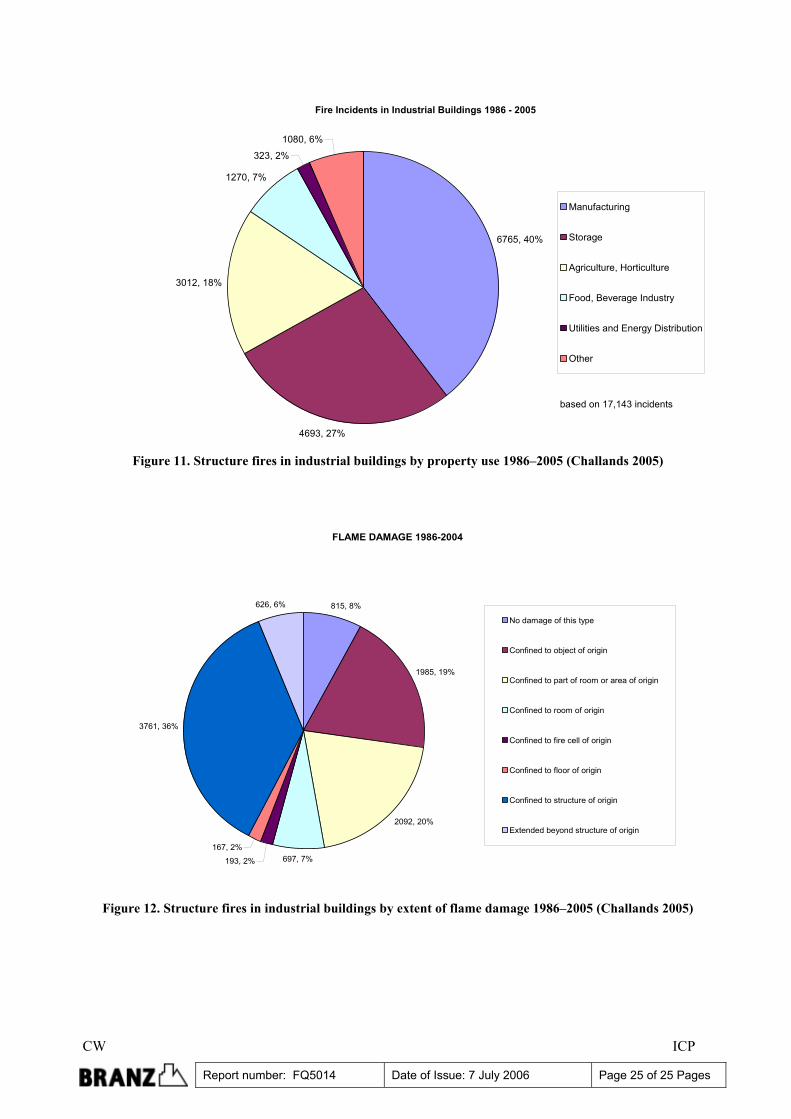
Figure 11 shows the breakdown of fire incidents in industrial buildings by the property use classification. The greatest number of fires (40%) occurred in buildings used for manufacturing purposes.
Figure 12 and Table 15 show a breakdown of fire incidents in industrial building by the extent of flame damage.
Table 15. Structure fires in industrial buildings by extent of flame damage 1986–2005 (Challands 2005) grouped into defined damage categories
No damage of this type 815 Confined to object of origin 1,985
27.1%
Confined to part of room or area of origin 2,092 Confined to room of origin 697
27.0%
Confined to fire cell of origin 193 Confined to floor of origin 167
3.5%
Confined to structure of origin 3,761 Extended beyond structure of origin 626
42.4%
Total 10,336 100% Not recorded 6,382
CW ICP
Report number: FQ5014 Date of Issue: 7 July 2006 Page 25 of 25 Pages
Fire Incidents in Industrial Buildings 1986 - 2005
6765, 40%
4693, 27%
3012, 18%
1270, 7%
323, 2%
1080, 6%
Manufacturing
Storage
Agriculture, Horticulture
Food, Beverage Industry
Utilities and Energy Distribution
Other
based on 17,143 incidents
Figure 11. Structure fires in industrial buildings by property use 1986–2005 (Challands 2005)
FLAME DAMAGE 1986-2004
815, 8%
1985, 19%
2092, 20%
697, 7%193, 2%
167, 2%
3761, 36%
626, 6%
No damage of this type
Confined to object of origin
Confined to part of room or area of origin
Confined to room of origin
Confined to fire cell of origin
Confined to floor of origin
Confined to structure of origin
Extended beyond structure of origin
Figure 12. Structure fires in industrial buildings by extent of flame damage 1986–2005 (Challands 2005)
CW ICP
Report number: FQ5014 Date of Issue: 7 July 2006 Page 26 of 26 Pages
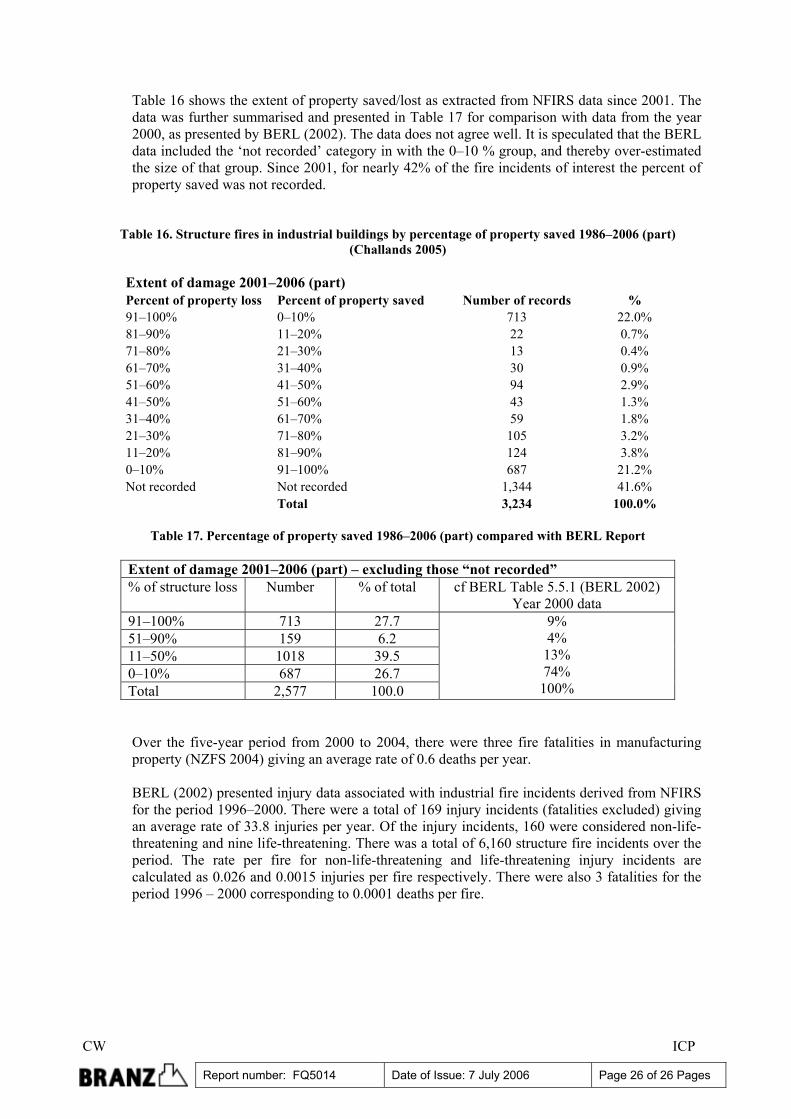
Table 16 shows the extent of property saved/lost as extracted from NFIRS data since 2001. The data was further summarised and presented in Table 17 for comparison with data from the year 2000, as presented by BERL (2002). The data does not agree well. It is speculated that the BERL data included the ‘not recorded’ category in with the 0–10 % group, and thereby over-estimated the size of that group. Since 2001, for nearly 42% of the fire incidents of interest the percent of property saved was not recorded.
Table 16. Structure fires in industrial buildings by percentage of property saved 1986–2006 (part) (Challands 2005)
Extent of damage 2001–2006 (part) Percent of property loss Percent of property saved Number of records % 91–100% 0–10% 713 22.0% 81–90% 11–20% 22 0.7% 71–80% 21–30% 13 0.4% 61–70% 31–40% 30 0.9% 51–60% 41–50% 94 2.9% 41–50% 51–60% 43 1.3% 31–40% 61–70% 59 1.8% 21–30% 71–80% 105 3.2% 11–20% 81–90% 124 3.8% 0–10% 91–100% 687 21.2% Not recorded Not recorded 1,344 41.6% Total 3,234 100.0%
Table 17. Percentage of property saved 1986–2006 (part) compared with BERL Report
Extent of damage 2001–2006 (part) – excluding those “not recorded” % of structure loss Number % of total cf BERL Table 5.5.1 (BERL 2002)
Year 2000 data 91–100% 713 27.7 51–90% 159 6.2 11–50% 1018 39.5 0–10% 687 26.7 Total 2,577 100.0
9% 4%
13% 74%
100%
Over the five-year period from 2000 to 2004, there were three fire fatalities in manufacturing property (NZFS 2004) giving an average rate of 0.6 deaths per year. BERL (2002) presented injury data associated with industrial fire incidents derived from NFIRS for the period 1996–2000. There were a total of 169 injury incidents (fatalities excluded) giving an average rate of 33.8 injuries per year. Of the injury incidents, 160 were considered non-life-threatening and nine life-threatening. There was a total of 6,160 structure fire incidents over the period. The rate per fire for non-life-threatening and life-threatening injury incidents are calculated as 0.026 and 0.0015 injuries per fire respectively. There were also 3 fatalities for the period 1996 – 2000 corresponding to 0.0001 deaths per fire.
CW ICP
Report number: FQ5014 Date of Issue: 7 July 2006 Page 27 of 27 Pages
8. NZBC REQUIREMENTS FOR INDUSTRIAL BUILDINGS
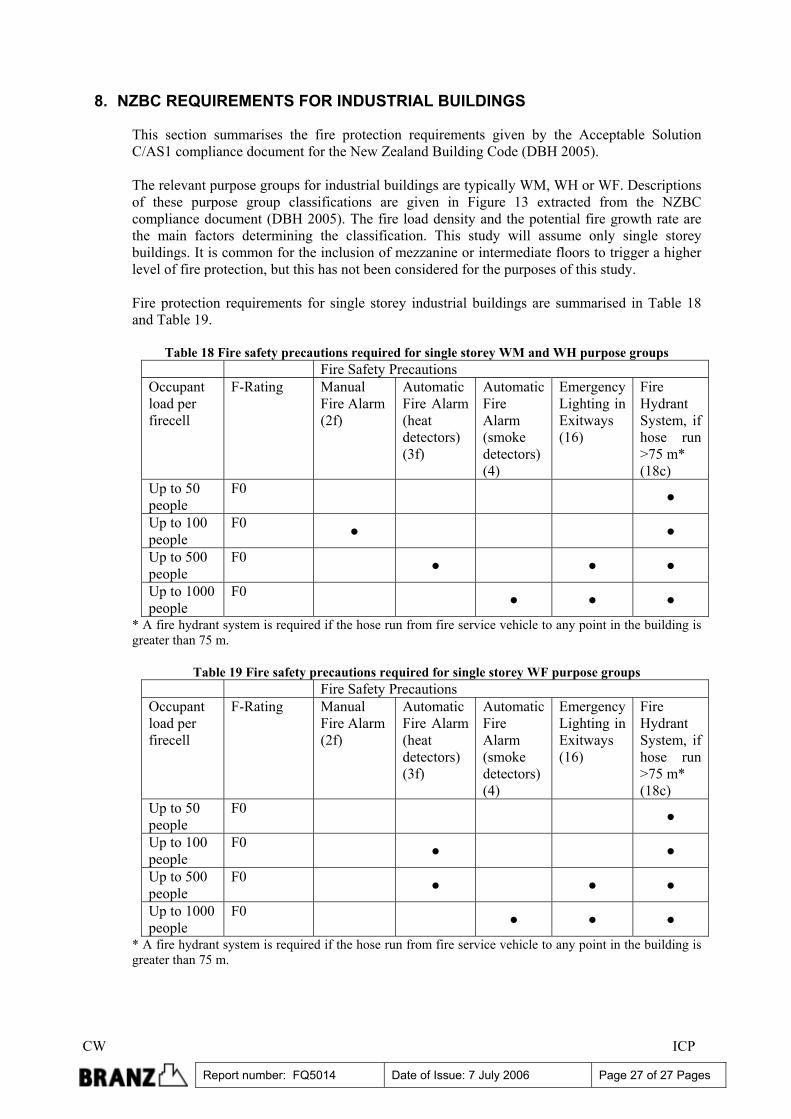
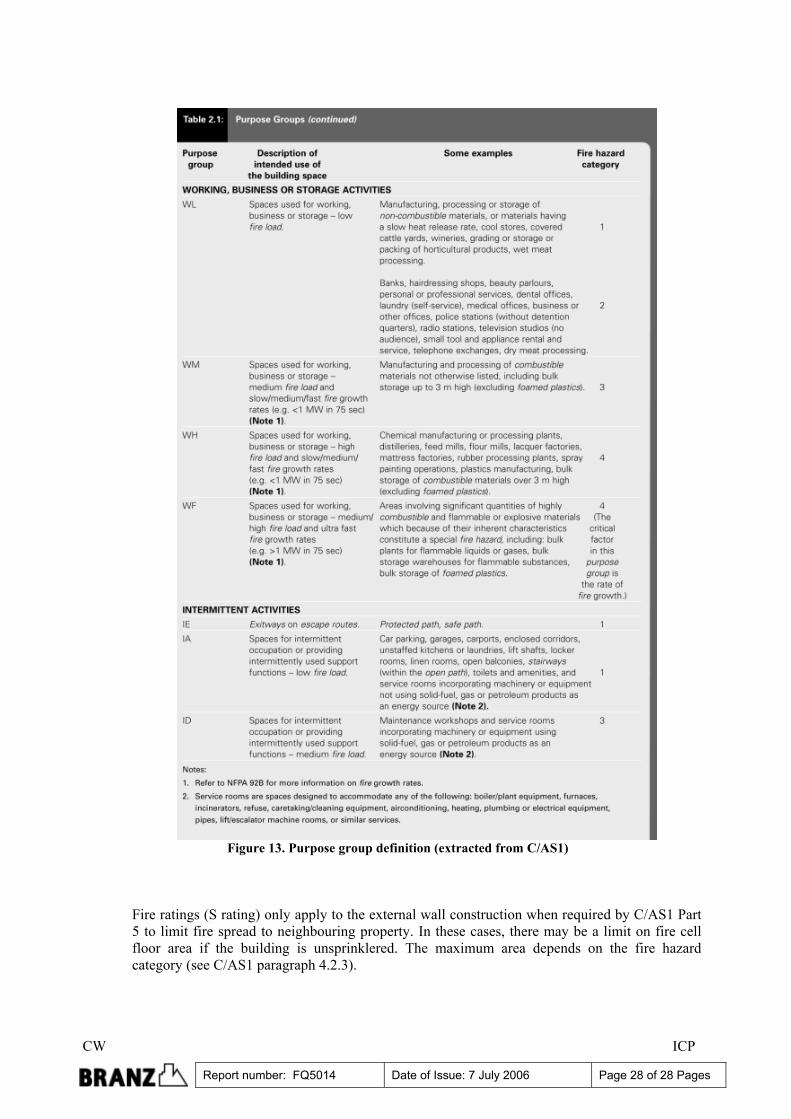
This section summarises the fire protection requirements given by the Acceptable Solution C/AS1 compliance document for the New Zealand Building Code (DBH 2005). The relevant purpose groups for industrial buildings are typically WM, WH or WF. Descriptions of these purpose group classifications are given in Figure 13 extracted from the NZBC compliance document (DBH 2005). The fire load density and the potential fire growth rate are the main factors determining the classification. This study will assume only single storey buildings. It is common for the inclusion of mezzanine or intermediate floors to trigger a higher level of fire protection, but this has not been considered for the purposes of this study. Fire protection requirements for single storey industrial buildings are summarised in Table 18 and Table 19.
Table 18 Fire safety precautions required for single storey WM and WH purpose groups
Fire Safety Precautions Occupant load per firecell
F-Rating Manual Fire Alarm (2f)
Automatic Fire Alarm (heat detectors) (3f)
Automatic Fire Alarm (smoke detectors) (4)
Emergency Lighting in Exitways (16)
Fire Hydrant System, if hose run >75 m* (18c)
Up to 50 people
F0 ●
Up to 100 people
F0 ● ●
Up to 500 people
F0 ● ● ●
Up to 1000 people
F0 ● ● ●
* A fire hydrant system is required if the hose run from fire service vehicle to any point in the building is greater than 75 m.
Table 19 Fire safety precautions required for single storey WF purpose groups
Fire Safety Precautions Occupant load per firecell
F-Rating Manual Fire Alarm (2f)
Automatic Fire Alarm (heat detectors) (3f)
Automatic Fire Alarm (smoke detectors) (4)
Emergency Lighting in Exitways (16)
Fire Hydrant System, if hose run >75 m* (18c)
Up to 50 people
F0 ●
Up to 100 people
F0 ● ●
Up to 500 people
F0 ● ● ●
Up to 1000 people
F0 ● ● ●
* A fire hydrant system is required if the hose run from fire service vehicle to any point in the building is greater than 75 m.
CW ICP
Report number: FQ5014 Date of Issue: 7 July 2006 Page 28 of 28 Pages
Figure 13. Purpose group definition (extracted from C/AS1)
Fire ratings (S rating) only apply to the external wall construction when required by C/AS1 Part 5 to limit fire spread to neighbouring property. In these cases, there may be a limit on fire cell floor area if the building is unsprinklered. The maximum area depends on the fire hazard category (see C/AS1 paragraph 4.2.3).
CW ICP
Report number: FQ5014 Date of Issue: 7 July 2006 Page 29 of 29 Pages
Fire hazard category (from C/AS1Table 2.1) Maximum fire cell floor area (m²) 1 5,000 2 2,500 3 1,500 4 Specific fire engineering design required In addition, a floor area limit does not apply if 15% of the roof area is designed for effective roof venting. Therefore, in the event that compartmentation is required by C/AS1, it would only be provided for the purpose of limiting fire spread to neighbouring property, and not to enhance life safety or owner’s property protection (although there could be flow-on benefits in that regard). For most single-storey industrial buildings, remote from a boundary, no fire ratings are needed; no automatic detection is needed (unless more than 50 people for WF or 100 people for WL and WM purpose groups), and unlimited firecell area is often permissible. In the event of a major fire in such a building, total loss of the building and its contents could be expected.
9. RISK COST BENEFIT MODEL
The purpose of the model is to provide a methodology for comparing the risk reductions associated with the introduction of additional compartmentation, fire detection or fire suppression in industrial buildings compared to the minimum fire protection measures required by the NZBC.
9.1 Model overview
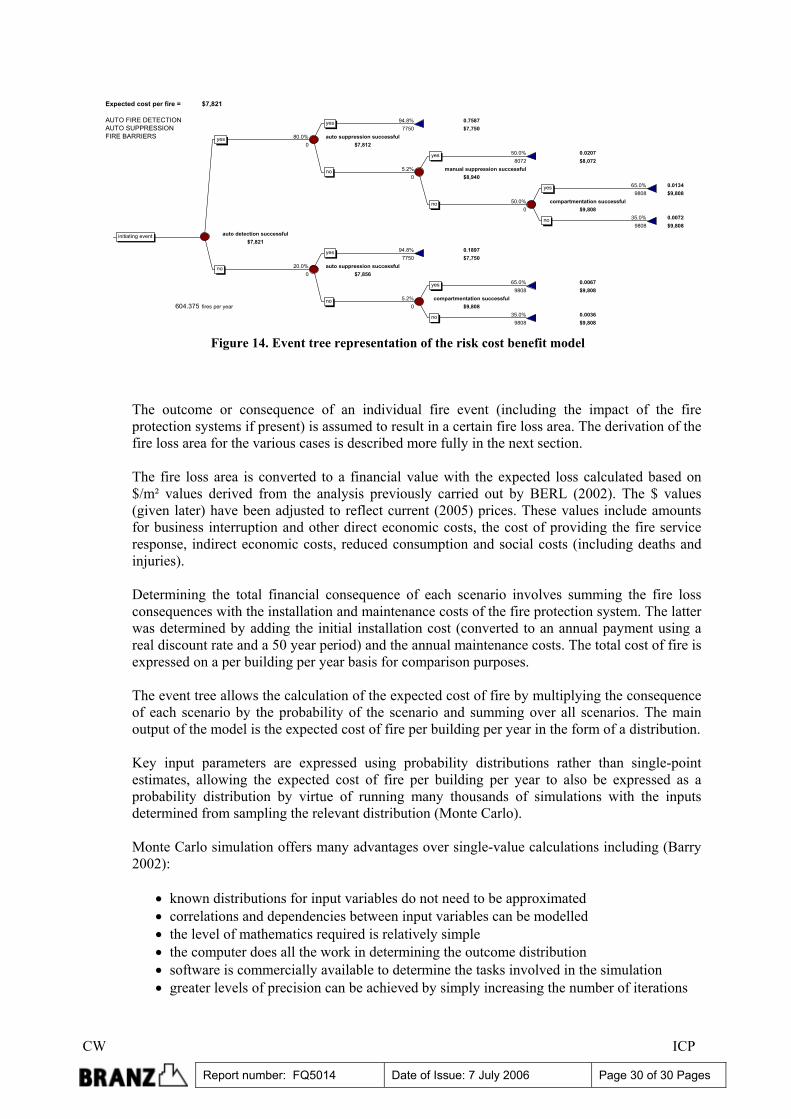
The model described in this report is intended to estimate the total cost to the nation of fires in industrial buildings (used for warehousing, manufacturing or processing), providing a tool for the regulator to evaluate the costs and benefits of different fire protection strategies for industrial buildings that are currently incorporated or may be considered in the future for inclusion in the Building Code compliance documents. The model is based on a simple event tree structure, that includes the impact of automatic and manual suppression systems, automatic fire detection and compartmentation. The model is applied to a population of industrial buildings in general rather than any specific individual building.
The model is probabilistic in nature including uncertainty by use of Latin Hypercube simulation (similar to Monte Carlo) and has been developed using Excel and the Excel add-in @Risk 4.0.5 (Palisade Corporation 2000). Figure 14 shows the structure of the model using a simple event tree. The event tree shows possible scenarios based on the presence of automatic fire detection with manual suppression, automatic fire sprinklers, and fire compartmentation in the building. Each system has a certain probability of success and if successful (or not) a certain consequence results. When a system is not present the probability of success is forced to zero in the event tree. The consequence is expressed in financial terms ($) and comprises a summation of the expected fire-related direct and indirect losses and the cost of installing and maintaining the various fire protection systems, if present over the life of those systems.
CW ICP
Report number: FQ5014 Date of Issue: 7 July 2006 Page 30 of 30 Pages
Expected cost per fire = $7,821
AUTO FIRE DETECTION 94.8% 0.7587AUTO SUPPRESSION 7750 $7,750FIRE BARRIERS 80.0% auto suppression successful
0 $7,81250.0% 0.0207
8072 $8,0725.2% manual suppression successful
0 $8,94065.0% 0.0134
9808 $9,80850.0% compartmentation successful
0 $9,80835.0% 0.0072
9808 $9,808auto detection successful
$7,82194.8% 0.1897
7750 $7,75020.0% auto suppression successful
0 $7,85665.0% 0.0067
9808 $9,8085.2% compartmentation successful
604.375 fires per year 0 $9,80835.0% 0.0036
9808 $9,808
initiating event
yes
no
yes
no
yes
no
yes
no
yes
no
yes
no
Figure 14. Event tree representation of the risk cost benefit model
The outcome or consequence of an individual fire event (including the impact of the fire protection systems if present) is assumed to result in a certain fire loss area. The derivation of the fire loss area for the various cases is described more fully in the next section. The fire loss area is converted to a financial value with the expected loss calculated based on $/m² values derived from the analysis previously carried out by BERL (2002). The $ values (given later) have been adjusted to reflect current (2005) prices. These values include amounts for business interruption and other direct economic costs, the cost of providing the fire service response, indirect economic costs, reduced consumption and social costs (including deaths and injuries). Determining the total financial consequence of each scenario involves summing the fire loss consequences with the installation and maintenance costs of the fire protection system. The latter was determined by adding the initial installation cost (converted to an annual payment using a real discount rate and a 50 year period) and the annual maintenance costs. The total cost of fire is expressed on a per building per year basis for comparison purposes. The event tree allows the calculation of the expected cost of fire by multiplying the consequence of each scenario by the probability of the scenario and summing over all scenarios. The main output of the model is the expected cost of fire per building per year in the form of a distribution.
Key input parameters are expressed using probability distributions rather than single-point estimates, allowing the expected cost of fire per building per year to also be expressed as a probability distribution by virtue of running many thousands of simulations with the inputs determined from sampling the relevant distribution (Monte Carlo). Monte Carlo simulation offers many advantages over single-value calculations including (Barry 2002):
• known distributions for input variables do not need to be approximated • correlations and dependencies between input variables can be modelled • the level of mathematics required is relatively simple • the computer does all the work in determining the outcome distribution • software is commercially available to determine the tasks involved in the simulation • greater levels of precision can be achieved by simply increasing the number of iterations
CW ICP
Report number: FQ5014 Date of Issue: 7 July 2006 Page 31 of 31 Pages
• complex mathematics can be included with no extra difficulty • Monte Carlo is widely recognised as a valid technique.
In this study, simulation is used and this allows for a better informed situation for any decision-making that may be based on the results of the analysis as it allows the uncertainty in the estimate to be quantified.
9.2 Model inputs and their distributions
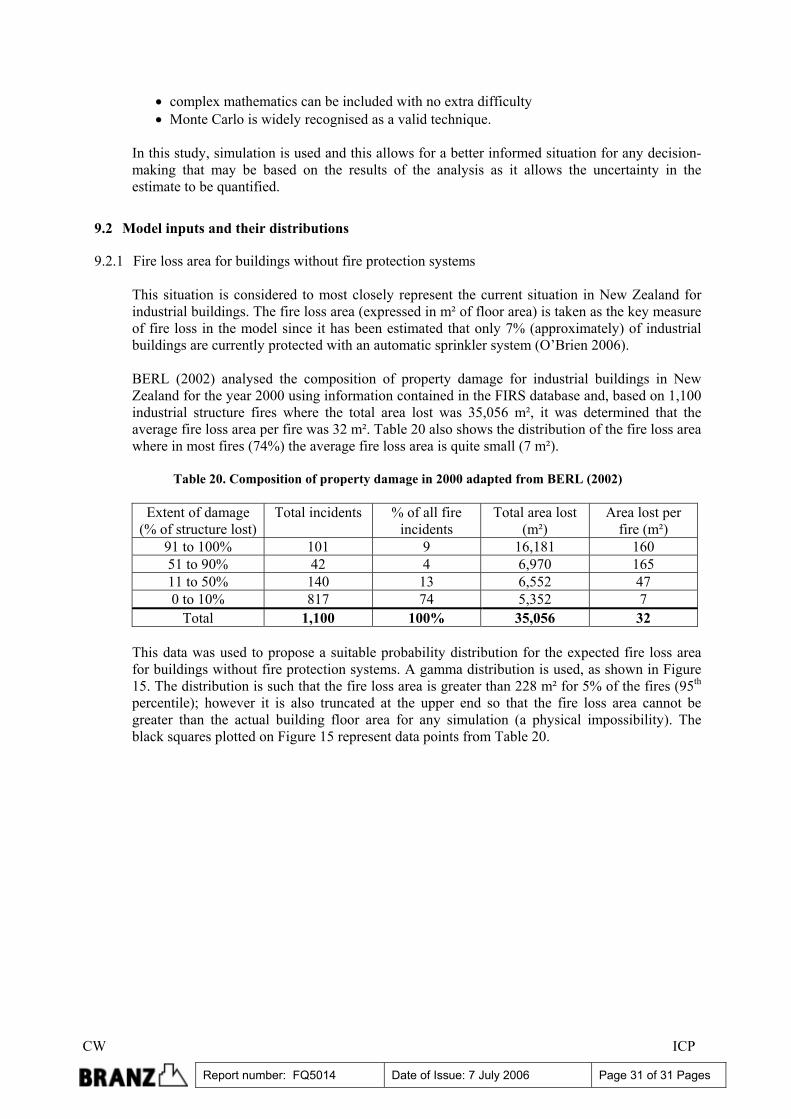
9.2.1 Fire loss area for buildings without fire protection systems This situation is considered to most closely represent the current situation in New Zealand for industrial buildings. The fire loss area (expressed in m² of floor area) is taken as the key measure of fire loss in the model since it has been estimated that only 7% (approximately) of industrial buildings are currently protected with an automatic sprinkler system (O’Brien 2006). BERL (2002) analysed the composition of property damage for industrial buildings in New Zealand for the year 2000 using information contained in the FIRS database and, based on 1,100 industrial structure fires where the total area lost was 35,056 m², it was determined that the average fire loss area per fire was 32 m². Table 20 also shows the distribution of the fire loss area where in most fires (74%) the average fire loss area is quite small (7 m²).
Table 20. Composition of property damage in 2000 adapted from BERL (2002)
Extent of damage (% of structure lost)
Total incidents % of all fire incidents
Total area lost (m²)
Area lost per fire (m²)
91 to 100% 101 9 16,181 160 51 to 90% 42 4 6,970 165 11 to 50% 140 13 6,552 47 0 to 10% 817 74 5,352 7
Total 1,100 100% 35,056 32 This data was used to propose a suitable probability distribution for the expected fire loss area for buildings without fire protection systems. A gamma distribution is used, as shown in Figure 15. The distribution is such that the fire loss area is greater than 228 m² for 5% of the fires (95th percentile); however it is also truncated at the upper end so that the fire loss area cannot be greater than the actual building floor area for any simulation (a physical impossibility). The black squares plotted on Figure 15 represent data points from Table 20.
CW ICP
Report number: FQ5014 Date of Issue: 7 July 2006 Page 32 of 32 Pages
Gamma(0.0792483582369941, 495.237438744346) Shift=+0.016878042437825
X <= 228.1495.0%
X <= 0.0168785.0%
0.0
0.1
0.2
0.3
0.4
0.5
0.6
0.7
0.8
0.9
1.0
0 100 200 300 400 500 600 700 800
Fire loss area (m²)
Gamma
BERL
Figure 15. Cumulative distribution function of the fire loss area for an unprotected building
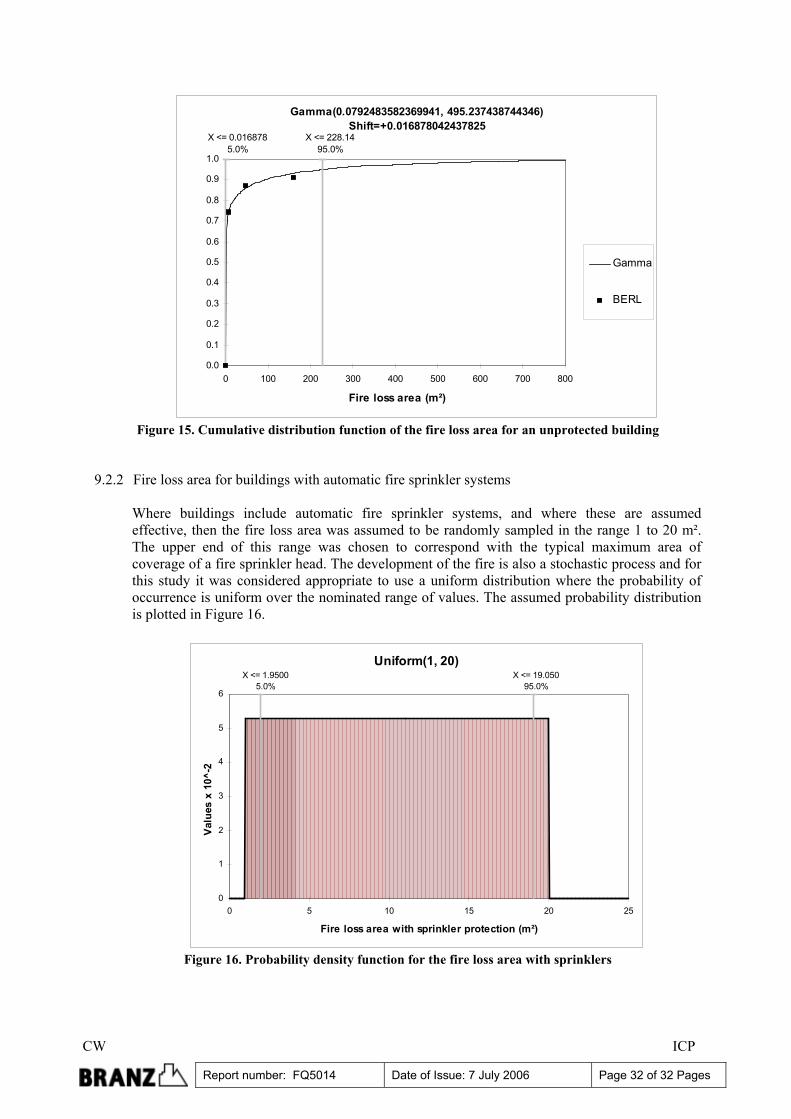
9.2.2 Fire loss area for buildings with automatic fire sprinkler systems Where buildings include automatic fire sprinkler systems, and where these are assumed effective, then the fire loss area was assumed to be randomly sampled in the range 1 to 20 m². The upper end of this range was chosen to correspond with the typical maximum area of coverage of a fire sprinkler head. The development of the fire is also a stochastic process and for this study it was considered appropriate to use a uniform distribution where the probability of occurrence is uniform over the nominated range of values. The assumed probability distribution is plotted in Figure 16.
Uniform(1, 20)X <= 1.9500
5.0%X <= 19.050
95.0%
0
1
2
3
4
5
6
0 5 10 15 20 25
Fire loss area with sprinkler protection (m²)
Valu
es x
10^
-2
Figure 16. Probability density function for the fire loss area with sprinklers
CW ICP
Report number: FQ5014 Date of Issue: 7 July 2006 Page 33 of 33 Pages
9.2.3 Fire loss area for buildings with fire detection and manual suppression
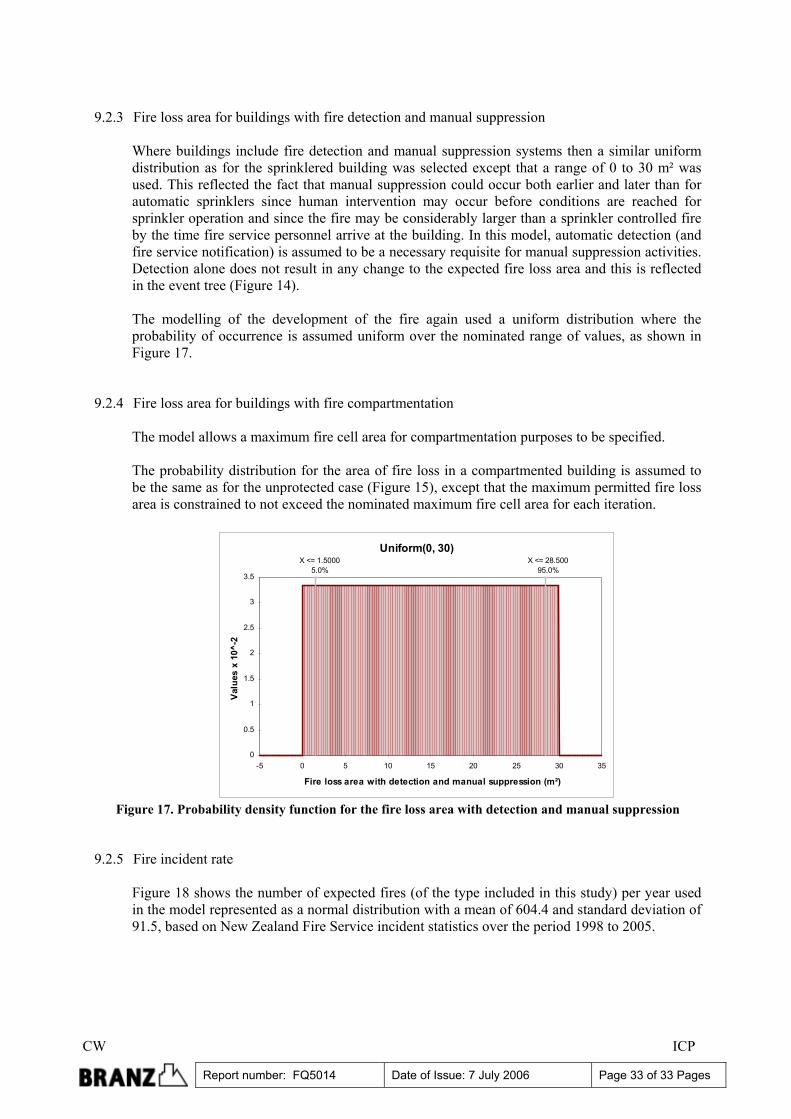
Where buildings include fire detection and manual suppression systems then a similar uniform distribution as for the sprinklered building was selected except that a range of 0 to 30 m² was used. This reflected the fact that manual suppression could occur both earlier and later than for automatic sprinklers since human intervention may occur before conditions are reached for sprinkler operation and since the fire may be considerably larger than a sprinkler controlled fire by the time fire service personnel arrive at the building. In this model, automatic detection (and fire service notification) is assumed to be a necessary requisite for manual suppression activities. Detection alone does not result in any change to the expected fire loss area and this is reflected in the event tree (Figure 14). The modelling of the development of the fire again used a uniform distribution where the probability of occurrence is assumed uniform over the nominated range of values, as shown in Figure 17.
9.2.4 Fire loss area for buildings with fire compartmentation The model allows a maximum fire cell area for compartmentation purposes to be specified.
The probability distribution for the area of fire loss in a compartmented building is assumed to be the same as for the unprotected case (Figure 15), except that the maximum permitted fire loss area is constrained to not exceed the nominated maximum fire cell area for each iteration.
Uniform(0, 30)X <= 28.500
95.0%X <= 1.5000
5.0%
0
0.5
1
1.5
2
2.5
3
3.5
-5 0 5 10 15 20 25 30 35
Fire loss area with detection and manual suppression (m²)
Val
ues
x 10
^-2
Figure 17. Probability density function for the fire loss area with detection and manual suppression
9.2.5 Fire incident rate
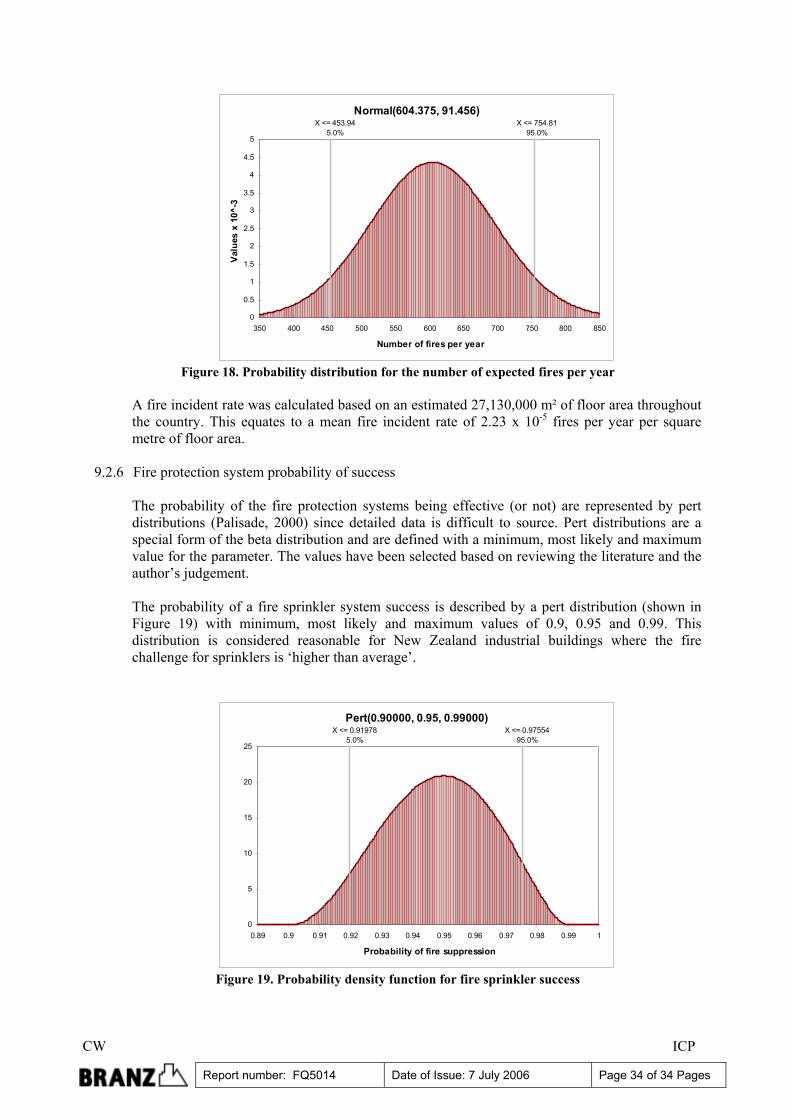
Figure 18 shows the number of expected fires (of the type included in this study) per year used in the model represented as a normal distribution with a mean of 604.4 and standard deviation of 91.5, based on New Zealand Fire Service incident statistics over the period 1998 to 2005.
CW ICP
Report number: FQ5014 Date of Issue: 7 July 2006 Page 34 of 34 Pages
Normal(604.375, 91.456)X <= 754.81
95.0%X <= 453.94
5.0%
0
0.5
1
1.5
2
2.5
3
3.5
4
4.5
5
350 400 450 500 550 600 650 700 750 800 850
Number of fires per year
Val
ues
x 10
^-3
Figure 18. Probability distribution for the number of expected fires per year
A fire incident rate was calculated based on an estimated 27,130,000 m² of floor area throughout the country. This equates to a mean fire incident rate of 2.23 x 10⁻⁵ fires per year per square metre of floor area.
9.2.6 Fire protection system probability of success
The probability of the fire protection systems being effective (or not) are represented by pert distributions (Palisade, 2000) since detailed data is difficult to source. Pert distributions are a special form of the beta distribution and are defined with a minimum, most likely and maximum value for the parameter. The values have been selected based on reviewing the literature and the author’s judgement.
The probability of a fire sprinkler system success is described by a pert distribution (shown in Figure 19) with minimum, most likely and maximum values of 0.9, 0.95 and 0.99. This distribution is considered reasonable for New Zealand industrial buildings where the fire challenge for sprinklers is ‘higher than average’.
Pert(0.90000, 0.95, 0.99000)X <= 0.97554
95.0%X <= 0.91978
5.0%
0
5
10
15
20
25
0.89 0.9 0.91 0.92 0.93 0.94 0.95 0.96 0.97 0.98 0.99 1
Probability of fire suppression
Figure 19. Probability density function for fire sprinkler success
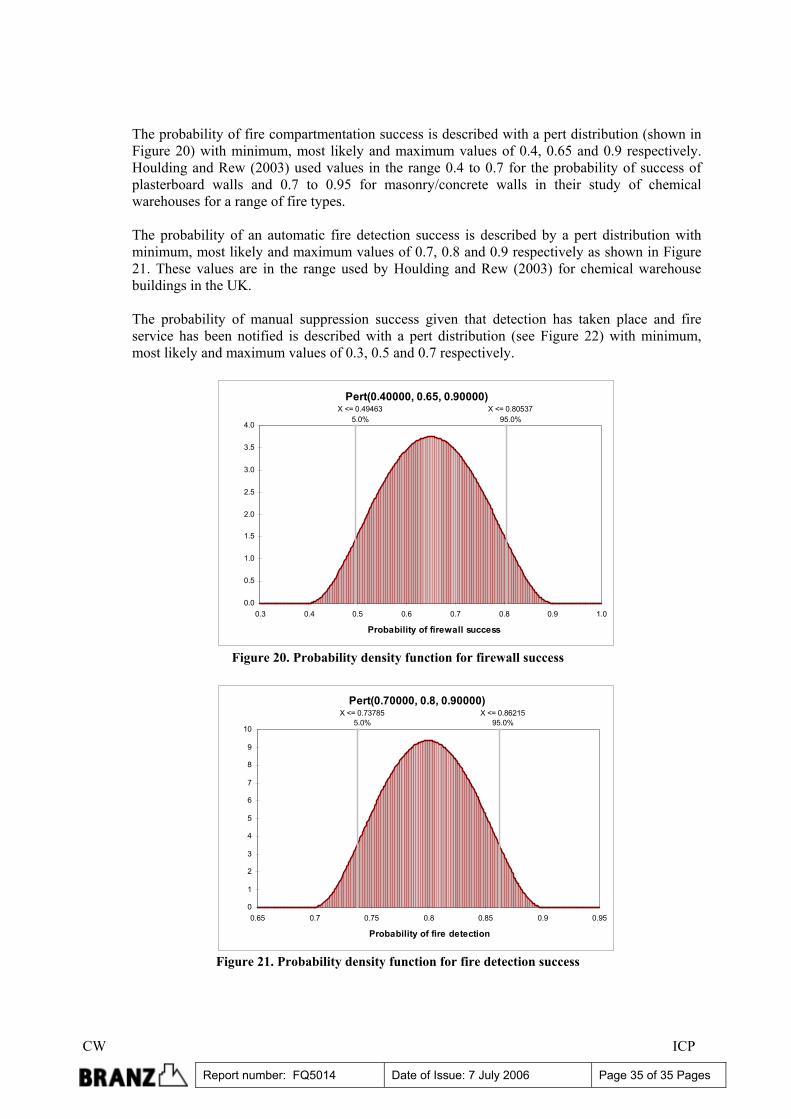
CW ICP
Report number: FQ5014 Date of Issue: 7 July 2006 Page 35 of 35 Pages
The probability of fire compartmentation success is described with a pert distribution (shown in Figure 20) with minimum, most likely and maximum values of 0.4, 0.65 and 0.9 respectively. Houlding and Rew (2003) used values in the range 0.4 to 0.7 for the probability of success of plasterboard walls and 0.7 to 0.95 for masonry/concrete walls in their study of chemical warehouses for a range of fire types. The probability of an automatic fire detection success is described by a pert distribution with minimum, most likely and maximum values of 0.7, 0.8 and 0.9 respectively as shown in Figure 21. These values are in the range used by Houlding and Rew (2003) for chemical warehouse buildings in the UK. The probability of manual suppression success given that detection has taken place and fire service has been notified is described with a pert distribution (see Figure 22) with minimum, most likely and maximum values of 0.3, 0.5 and 0.7 respectively.
Pert(0.40000, 0.65, 0.90000)X <= 0.49463
5.0%X <= 0.80537
95.0%
0.0
0.5
1.0
1.5
2.0
2.5
3.0
3.5
4.0
0.3 0.4 0.5 0.6 0.7 0.8 0.9 1.0
Probability of firewall success
Figure 20. Probability density function for firewall success
Pert(0.70000, 0.8, 0.90000)X <= 0.86215
95.0%X <= 0.73785
5.0%
0
1
2
3
4
5
6
7
8
9
10
0.65 0.7 0.75 0.8 0.85 0.9 0.95
Probability of fire detection
Figure 21. Probability density function for fire detection success
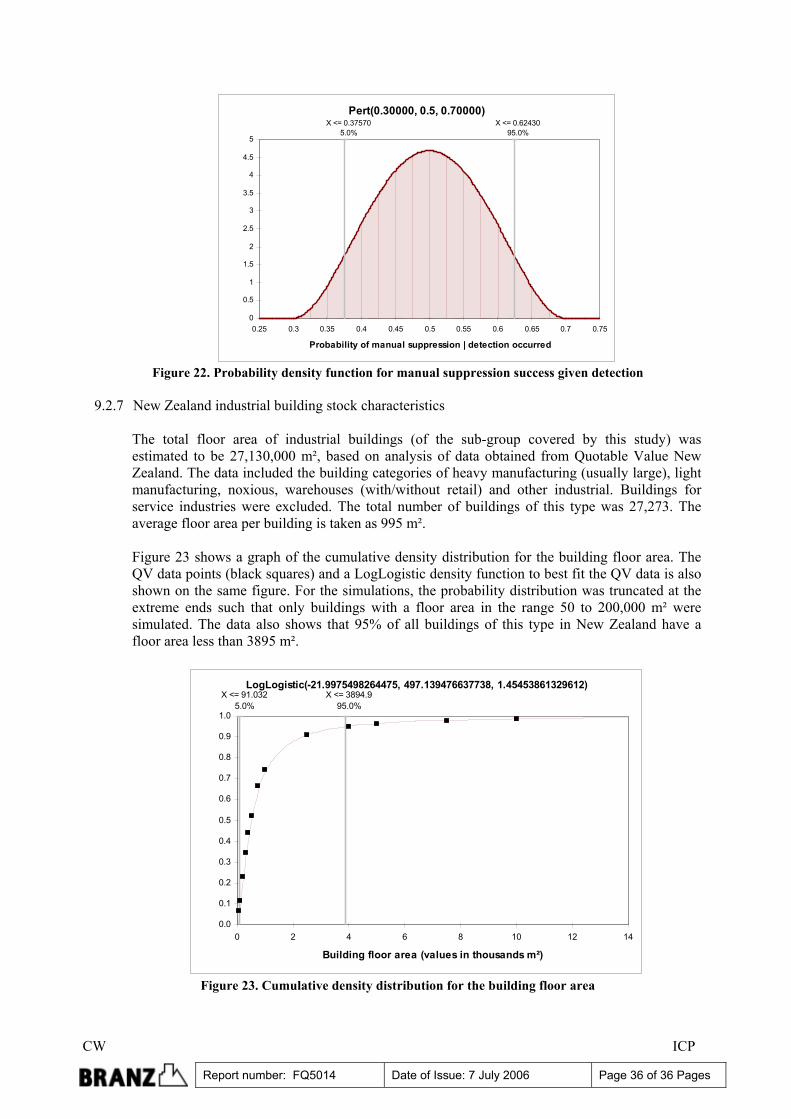
CW ICP
Report number: FQ5014 Date of Issue: 7 July 2006 Page 36 of 36 Pages
Pert(0.30000, 0.5, 0.70000)X <= 0.37570
5.0%X <= 0.62430
95.0%
0
0.5
1
1.5
2
2.5
3
3.5
4
4.5
5
0.25 0.3 0.35 0.4 0.45 0.5 0.55 0.6 0.65 0.7 0.75
Probability of manual suppression | detection occurred
Figure 22. Probability density function for manual suppression success given detection
9.2.7 New Zealand industrial building stock characteristics
The total floor area of industrial buildings (of the sub-group covered by this study) was estimated to be 27,130,000 m², based on analysis of data obtained from Quotable Value New Zealand. The data included the building categories of heavy manufacturing (usually large), light manufacturing, noxious, warehouses (with/without retail) and other industrial. Buildings for service industries were excluded. The total number of buildings of this type was 27,273. The average floor area per building is taken as 995 m². Figure 23 shows a graph of the cumulative density distribution for the building floor area. The QV data points (black squares) and a LogLogistic density function to best fit the QV data is also shown on the same figure. For the simulations, the probability distribution was truncated at the extreme ends such that only buildings with a floor area in the range 50 to 200,000 m² were simulated. The data also shows that 95% of all buildings of this type in New Zealand have a floor area less than 3895 m².
LogLogistic(-21.9975498264475, 497.139476637738, 1.45453861329612)X <= 3894.9
95.0%X <= 91.032
5.0%
0.0
0.1
0.2
0.3
0.4
0.5
0.6
0.7
0.8
0.9
1.0
0 2 4 6 8 10 12 14
Building floor area (values in thousands m²)
Figure 23. Cumulative density distribution for the building floor area
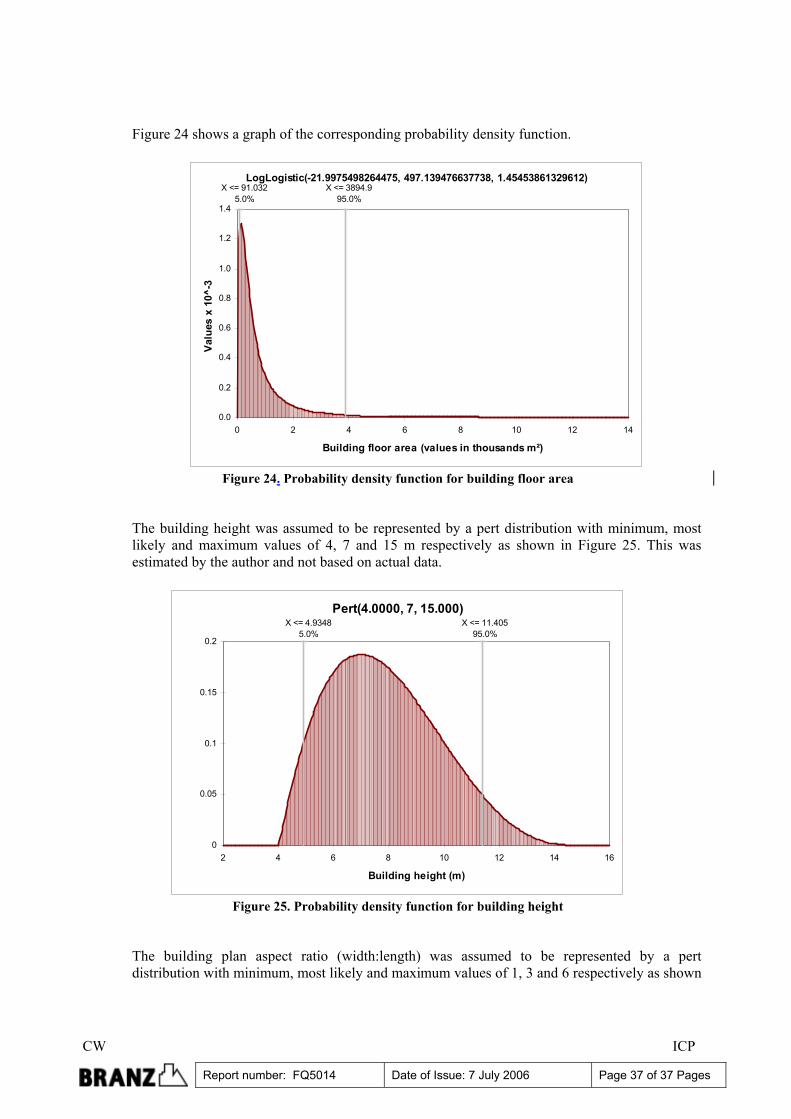
CW ICP
Report number: FQ5014 Date of Issue: 7 July 2006 Page 37 of 37 Pages
Figure 24 shows a graph of the corresponding probability density function.
LogLogistic(-21.9975498264475, 497.139476637738, 1.45453861329612)X <= 3894.9
95.0%X <= 91.032
5.0%
0.0
0.2
0.4
0.6
0.8
1.0
1.2
1.4
0 2 4 6 8 10 12 14
Building floor area (values in thousands m²)
Valu
es x
10^
-3
Figure 24. Probability density function for building floor area
The building height was assumed to be represented by a pert distribution with minimum, most likely and maximum values of 4, 7 and 15 m respectively as shown in Figure 25. This was estimated by the author and not based on actual data.
Pert(4.0000, 7, 15.000)X <= 11.405
95.0%X <= 4.9348
5.0%
0
0.05
0.1
0.15
0.2
2 4 6 8 10 12 14 16
Building height (m)
Figure 25. Probability density function for building height
The building plan aspect ratio (width:length) was assumed to be represented by a pert distribution with minimum, most likely and maximum values of 1, 3 and 6 respectively as shown
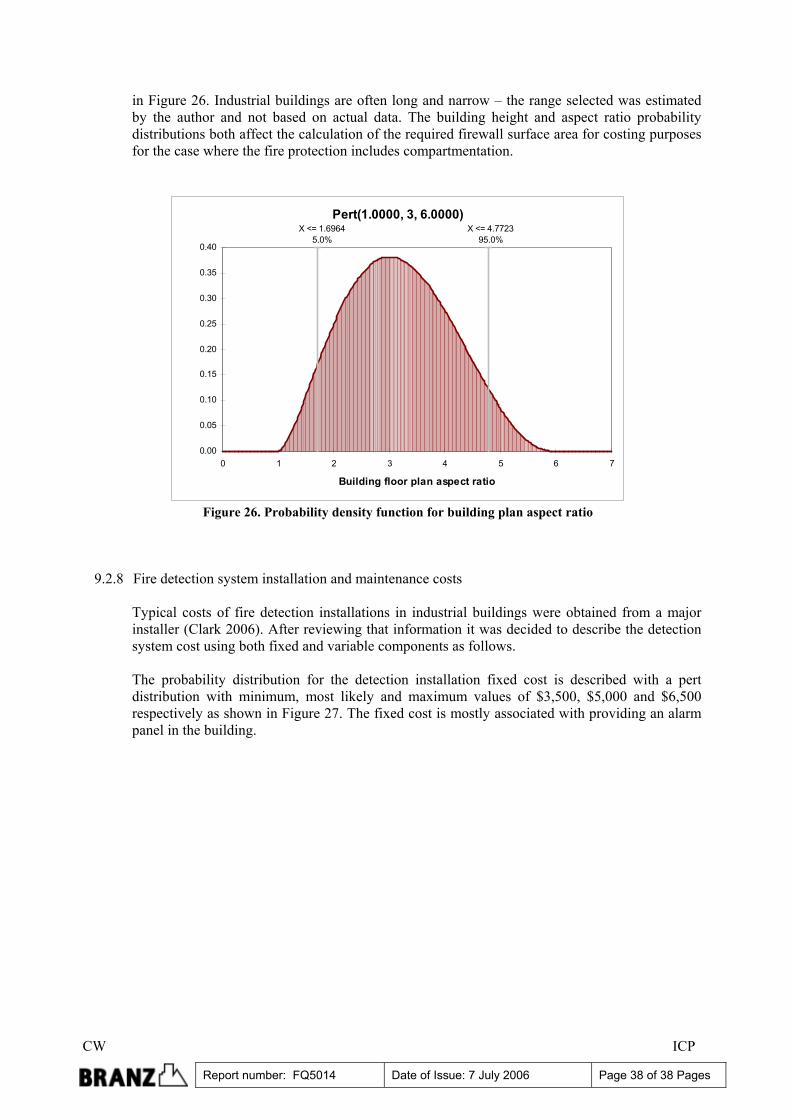
CW ICP
Report number: FQ5014 Date of Issue: 7 July 2006 Page 38 of 38 Pages
in Figure 26. Industrial buildings are often long and narrow – the range selected was estimated by the author and not based on actual data. The building height and aspect ratio probability distributions both affect the calculation of the required firewall surface area for costing purposes for the case where the fire protection includes compartmentation.
Pert(1.0000, 3, 6.0000)X <= 4.7723
95.0%X <= 1.6964
5.0%
0.00
0.05
0.10
0.15
0.20
0.25
0.30
0.35
0.40
0 1 2 3 4 5 6 7
Building floor plan aspect ratio
Figure 26. Probability density function for building plan aspect ratio
9.2.8 Fire detection system installation and maintenance costs Typical costs of fire detection installations in industrial buildings were obtained from a major installer (Clark 2006). After reviewing that information it was decided to describe the detection system cost using both fixed and variable components as follows. The probability distribution for the detection installation fixed cost is described with a pert distribution with minimum, most likely and maximum values of $3,500, $5,000 and $6,500 respectively as shown in Figure 27. The fixed cost is mostly associated with providing an alarm panel in the building.
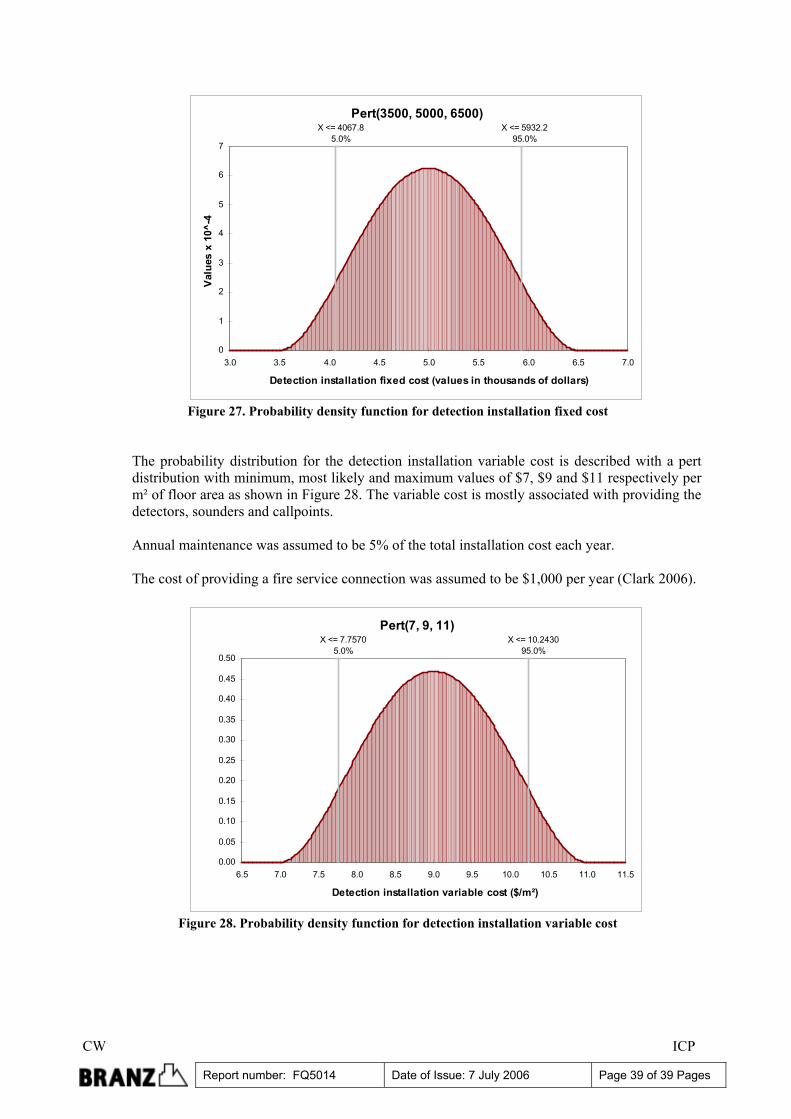
CW ICP
Report number: FQ5014 Date of Issue: 7 July 2006 Page 39 of 39 Pages
Pert(3500, 5000, 6500)X <= 5932.2
95.0%X <= 4067.8
5.0%
0
1
2
3
4
5
6
7
3.0 3.5 4.0 4.5 5.0 5.5 6.0 6.5 7.0
Detection installation fixed cost (values in thousands of dollars)
Valu
es x
10^
-4
Figure 27. Probability density function for detection installation fixed cost
The probability distribution for the detection installation variable cost is described with a pert distribution with minimum, most likely and maximum values of $7, $9 and $11 respectively per m² of floor area as shown in Figure 28. The variable cost is mostly associated with providing the detectors, sounders and callpoints.
Annual maintenance was assumed to be 5% of the total installation cost each year. The cost of providing a fire service connection was assumed to be $1,000 per year (Clark 2006).
Pert(7, 9, 11)X <= 10.2430
95.0%X <= 7.7570
5.0%
0.00
0.05
0.10
0.15
0.20
0.25
0.30
0.35
0.40
0.45
0.50
6.5 7.0 7.5 8.0 8.5 9.0 9.5 10.0 10.5 11.0 11.5
Detection installation variable cost ($/m²)
Figure 28. Probability density function for detection installation variable cost
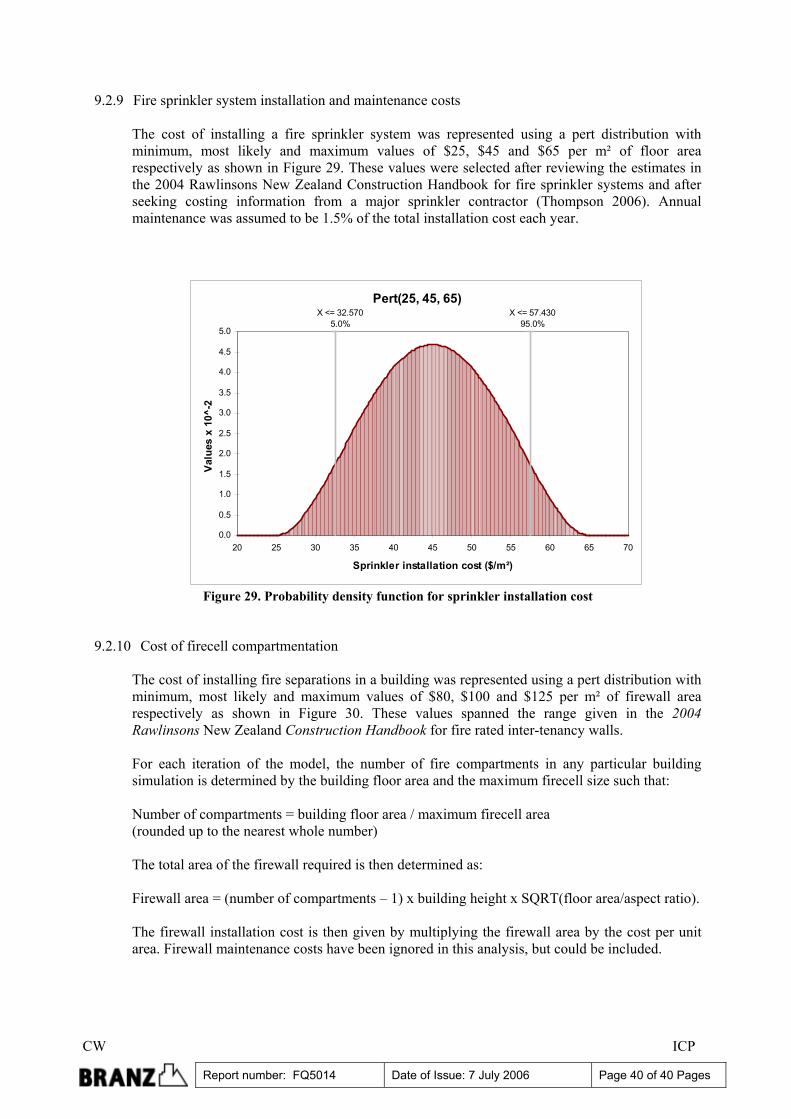
CW ICP
Report number: FQ5014 Date of Issue: 7 July 2006 Page 40 of 40 Pages
9.2.9 Fire sprinkler system installation and maintenance costs The cost of installing a fire sprinkler system was represented using a pert distribution with minimum, most likely and maximum values of $25, $45 and $65 per m² of floor area respectively as shown in Figure 29. These values were selected after reviewing the estimates in the 2004 Rawlinsons New Zealand Construction Handbook for fire sprinkler systems and after seeking costing information from a major sprinkler contractor (Thompson 2006). Annual maintenance was assumed to be 1.5% of the total installation cost each year.
Pert(25, 45, 65)X <= 57.430
95.0%X <= 32.570
5.0%
0.0
0.5
1.0
1.5
2.0
2.5
3.0
3.5
4.0
4.5
5.0
20 25 30 35 40 45 50 55 60 65 70
Sprinkler installation cost ($/m²)
Valu
es x
10^
-2
Figure 29. Probability density function for sprinkler installation cost
9.2.10 Cost of firecell compartmentation
The cost of installing fire separations in a building was represented using a pert distribution with minimum, most likely and maximum values of $80, $100 and $125 per m² of firewall area respectively as shown in Figure 30. These values spanned the range given in the 2004 Rawlinsons New Zealand Construction Handbook for fire rated inter-tenancy walls. For each iteration of the model, the number of fire compartments in any particular building simulation is determined by the building floor area and the maximum firecell size such that: Number of compartments = building floor area / maximum firecell area (rounded up to the nearest whole number) The total area of the firewall required is then determined as: Firewall area = (number of compartments – 1) x building height x SQRT(floor area/aspect ratio). The firewall installation cost is then given by multiplying the firewall area by the cost per unit area. Firewall maintenance costs have been ignored in this analysis, but could be included.
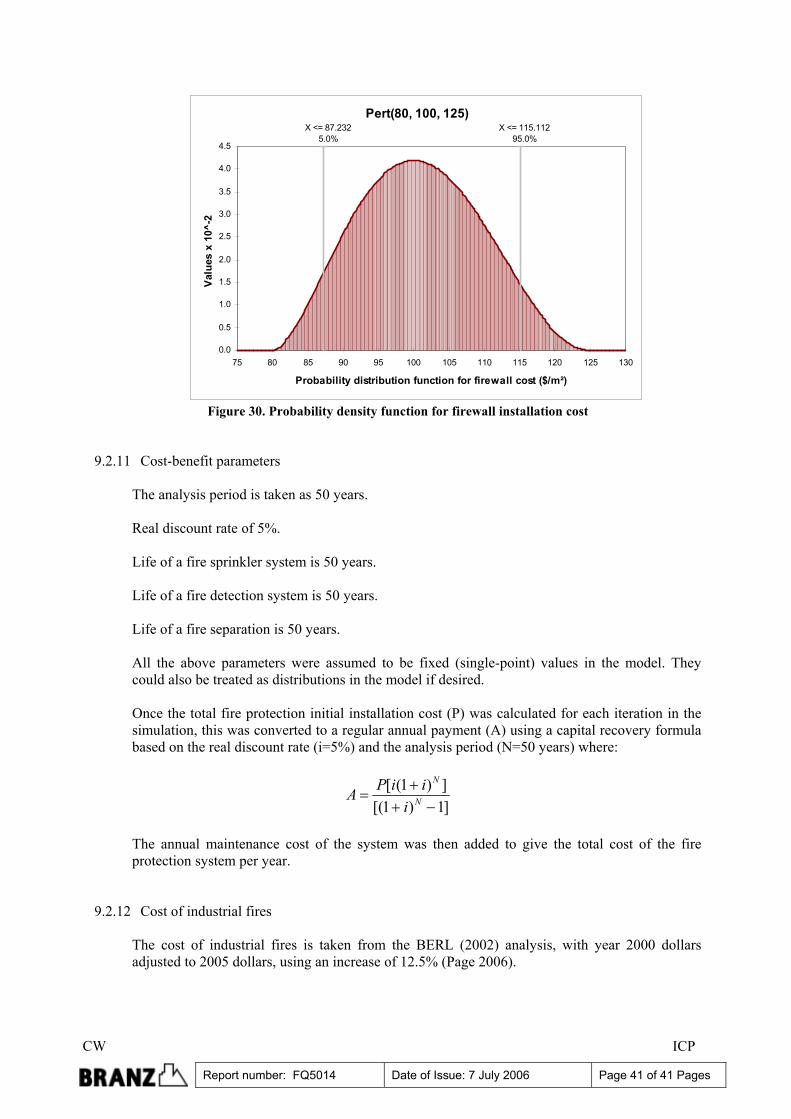
CW ICP
Report number: FQ5014 Date of Issue: 7 July 2006 Page 41 of 41 Pages
Pert(80, 100, 125)X <= 115.112
95.0%X <= 87.232
5.0%
0.0
0.5
1.0
1.5
2.0
2.5
3.0
3.5
4.0
4.5
75 80 85 90 95 100 105 110 115 120 125 130
Probability distribution function for firewall cost ($/m²)
Valu
es x
10^
-2
Figure 30. Probability density function for firewall installation cost
9.2.11 Cost-benefit parameters The analysis period is taken as 50 years. Real discount rate of 5%. Life of a fire sprinkler system is 50 years. Life of a fire detection system is 50 years. Life of a fire separation is 50 years. All the above parameters were assumed to be fixed (single-point) values in the model. They could also be treated as distributions in the model if desired. Once the total fire protection initial installation cost (P) was calculated for each iteration in the simulation, this was converted to a regular annual payment (A) using a capital recovery formula based on the real discount rate (i=5%) and the analysis period (N=50 years) where:
]1)1[(])1([
−++
= N
N
iiiPA
The annual maintenance cost of the system was then added to give the total cost of the fire protection system per year.
9.2.12 Cost of industrial fires The cost of industrial fires is taken from the BERL (2002) analysis, with year 2000 dollars adjusted to 2005 dollars, using an increase of 12.5% (Page 2006).
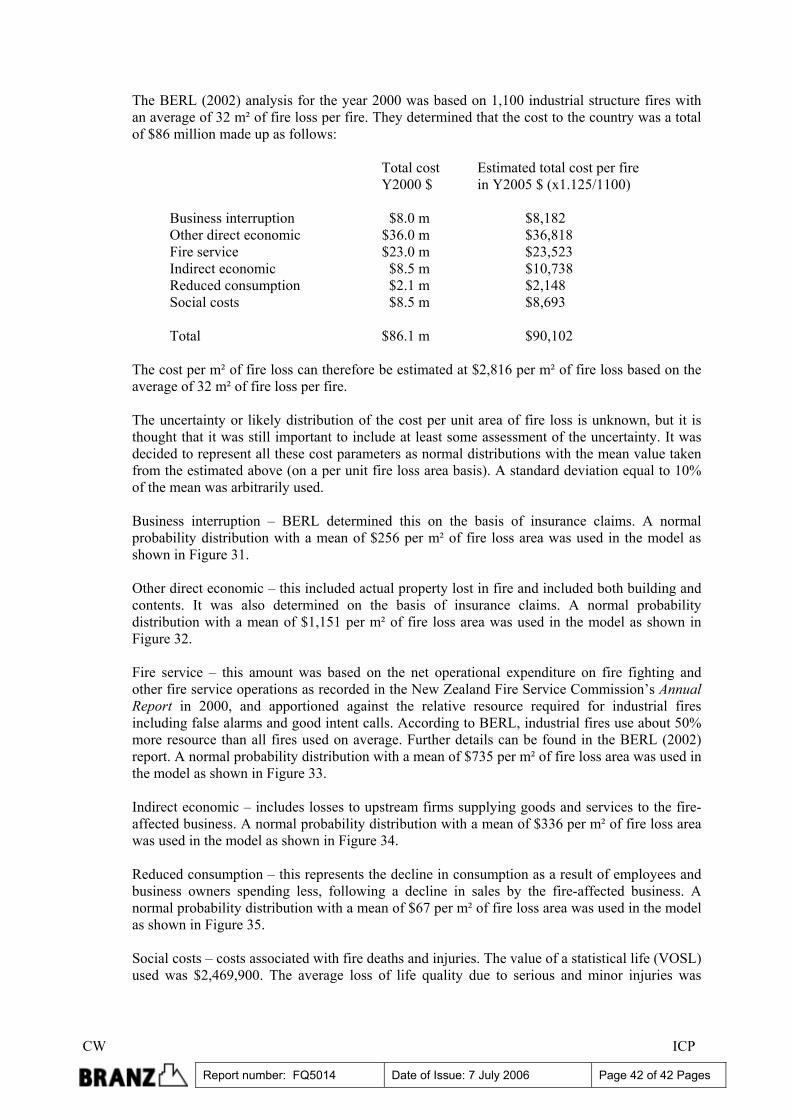
CW ICP
Report number: FQ5014 Date of Issue: 7 July 2006 Page 42 of 42 Pages
The BERL (2002) analysis for the year 2000 was based on 1,100 industrial structure fires with an average of 32 m² of fire loss per fire. They determined that the cost to the country was a total of $86 million made up as follows: Total cost Estimated total cost per fire Y2000 $ in Y2005 $ (x1.125/1100) Business interruption $8.0 m $8,182 Other direct economic $36.0 m $36,818 Fire service $23.0 m $23,523 Indirect economic $8.5 m $10,738 Reduced consumption $2.1 m $2,148 Social costs $8.5 m $8,693 Total $86.1 m $90,102 The cost per m² of fire loss can therefore be estimated at $2,816 per m² of fire loss based on the average of 32 m² of fire loss per fire. The uncertainty or likely distribution of the cost per unit area of fire loss is unknown, but it is thought that it was still important to include at least some assessment of the uncertainty. It was decided to represent all these cost parameters as normal distributions with the mean value taken from the estimated above (on a per unit fire loss area basis). A standard deviation equal to 10% of the mean was arbitrarily used. Business interruption – BERL determined this on the basis of insurance claims. A normal probability distribution with a mean of $256 per m² of fire loss area was used in the model as shown in Figure 31. Other direct economic – this included actual property lost in fire and included both building and contents. It was also determined on the basis of insurance claims. A normal probability distribution with a mean of $1,151 per m² of fire loss area was used in the model as shown in Figure 32. Fire service – this amount was based on the net operational expenditure on fire fighting and other fire service operations as recorded in the New Zealand Fire Service Commission’s Annual Report in 2000, and apportioned against the relative resource required for industrial fires including false alarms and good intent calls. According to BERL, industrial fires use about 50% more resource than all fires used on average. Further details can be found in the BERL (2002) report. A normal probability distribution with a mean of $735 per m² of fire loss area was used in the model as shown in Figure 33.
Indirect economic – includes losses to upstream firms supplying goods and services to the fire-affected business. A normal probability distribution with a mean of $336 per m² of fire loss area was used in the model as shown in Figure 34.
Reduced consumption – this represents the decline in consumption as a result of employees and business owners spending less, following a decline in sales by the fire-affected business. A normal probability distribution with a mean of $67 per m² of fire loss area was used in the model as shown in Figure 35. Social costs – costs associated with fire deaths and injuries. The value of a statistical life (VOSL) used was $2,469,900. The average loss of life quality due to serious and minor injuries was
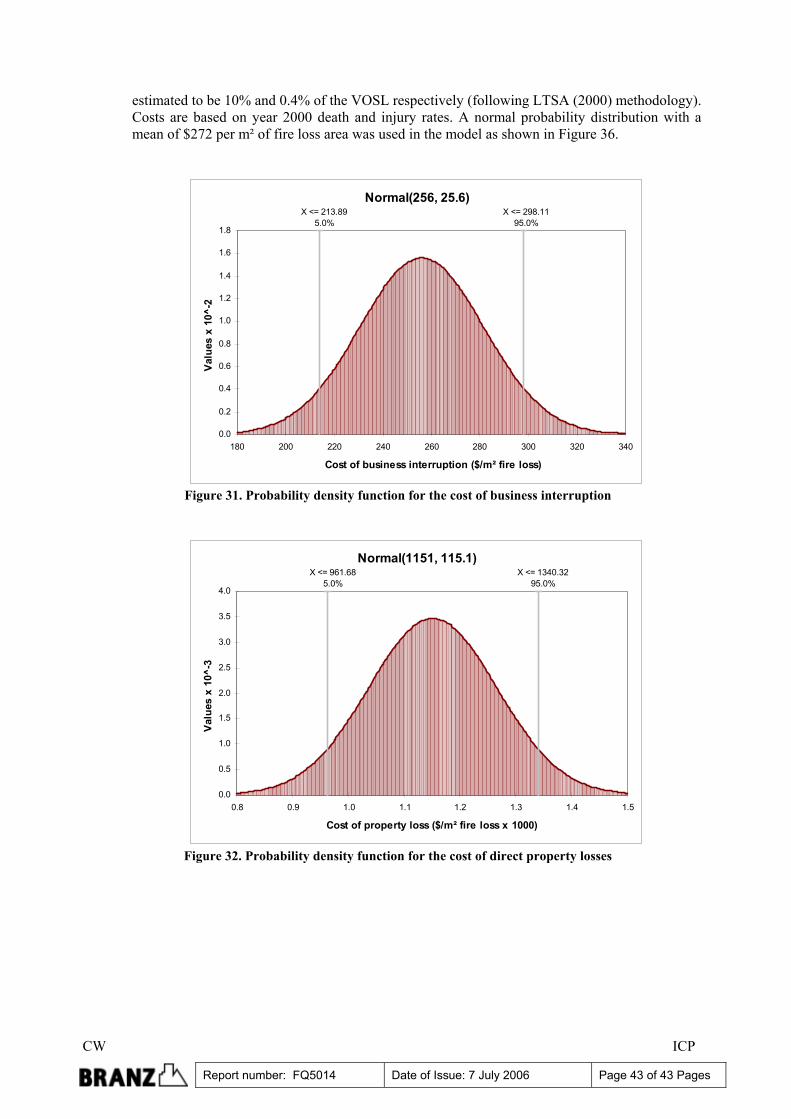
CW ICP
Report number: FQ5014 Date of Issue: 7 July 2006 Page 43 of 43 Pages
estimated to be 10% and 0.4% of the VOSL respectively (following LTSA (2000) methodology). Costs are based on year 2000 death and injury rates. A normal probability distribution with a mean of $272 per m² of fire loss area was used in the model as shown in Figure 36.
Normal(256, 25.6)X <= 298.11
95.0%X <= 213.89
5.0%
0.0
0.2
0.4
0.6
0.8
1.0
1.2
1.4
1.6
1.8
180 200 220 240 260 280 300 320 340
Cost of business interruption ($/m² fire loss)
Valu
es x
10^
-2
Figure 31. Probability density function for the cost of business interruption
Normal(1151, 115.1)X <= 1340.32
95.0%X <= 961.68
5.0%
0.0
0.5
1.0
1.5
2.0
2.5
3.0
3.5
4.0
0.8 0.9 1.0 1.1 1.2 1.3 1.4 1.5
Cost of property loss ($/m² fire loss x 1000)
Valu
es x
10^
-3
Figure 32. Probability density function for the cost of direct property losses
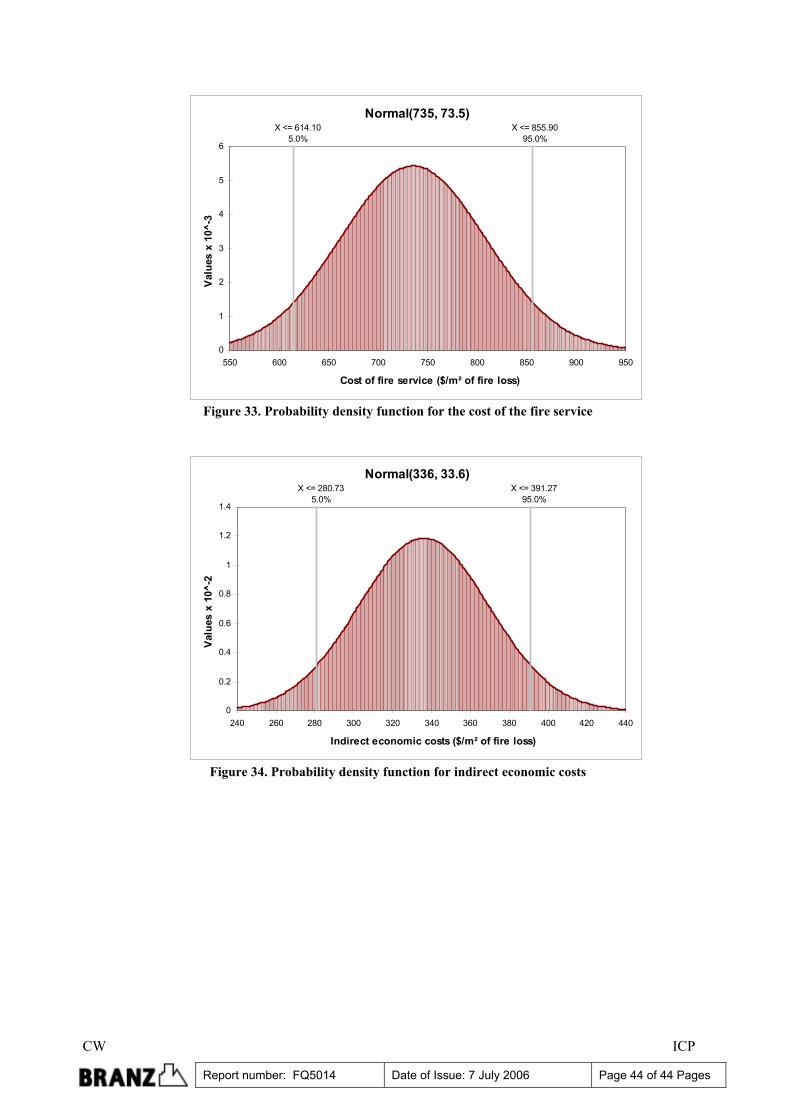
CW ICP
Report number: FQ5014 Date of Issue: 7 July 2006 Page 44 of 44 Pages
Normal(735, 73.5)X <= 855.90
95.0%X <= 614.10
5.0%
0
1
2
3
4
5
6
550 600 650 700 750 800 850 900 950
Cost of fire service ($/m² of fire loss)
Valu
es x
10^
-3
Figure 33. Probability density function for the cost of the fire service
Normal(336, 33.6)X <= 391.27
95.0%X <= 280.73
5.0%
0
0.2
0.4
0.6
0.8
1
1.2
1.4
240 260 280 300 320 340 360 380 400 420 440
Indirect economic costs ($/m² of fire loss)
Valu
es x
10^
-2
Figure 34. Probability density function for indirect economic costs
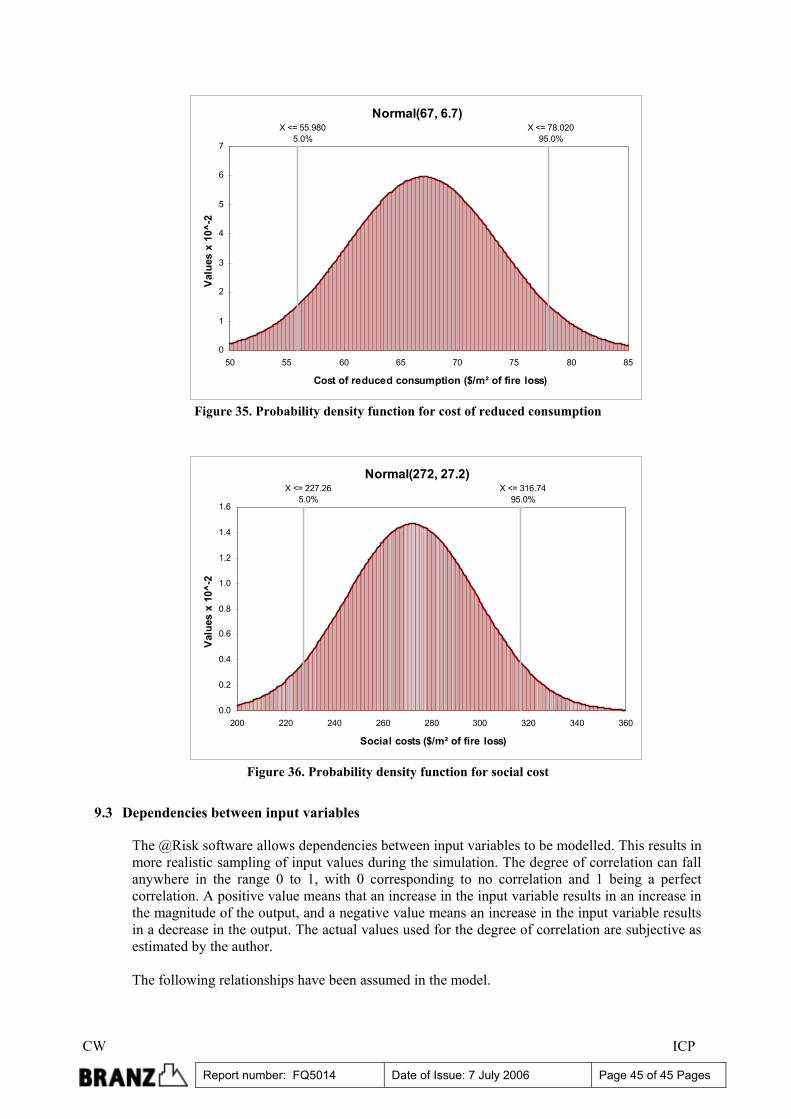
CW ICP
Report number: FQ5014 Date of Issue: 7 July 2006 Page 45 of 45 Pages
Normal(67, 6.7)X <= 78.020
95.0%X <= 55.980
5.0%
0
1
2
3
4
5
6
7
50 55 60 65 70 75 80 85
Cost of reduced consumption ($/m² of fire loss)
Valu
es x
10^
-2
Figure 35. Probability density function for cost of reduced consumption
Normal(272, 27.2)X <= 316.74
95.0%X <= 227.26
5.0%
0.0
0.2
0.4
0.6
0.8
1.0
1.2
1.4
1.6
200 220 240 260 280 300 320 340 360
Social costs ($/m² of fire loss)
Valu
es x
10^
-2
Figure 36. Probability density function for social cost
9.3 Dependencies between input variables
The @Risk software allows dependencies between input variables to be modelled. This results in more realistic sampling of input values during the simulation. The degree of correlation can fall anywhere in the range 0 to 1, with 0 corresponding to no correlation and 1 being a perfect correlation. A positive value means that an increase in the input variable results in an increase in the magnitude of the output, and a negative value means an increase in the input variable results in a decrease in the output. The actual values used for the degree of correlation are subjective as estimated by the author. The following relationships have been assumed in the model.
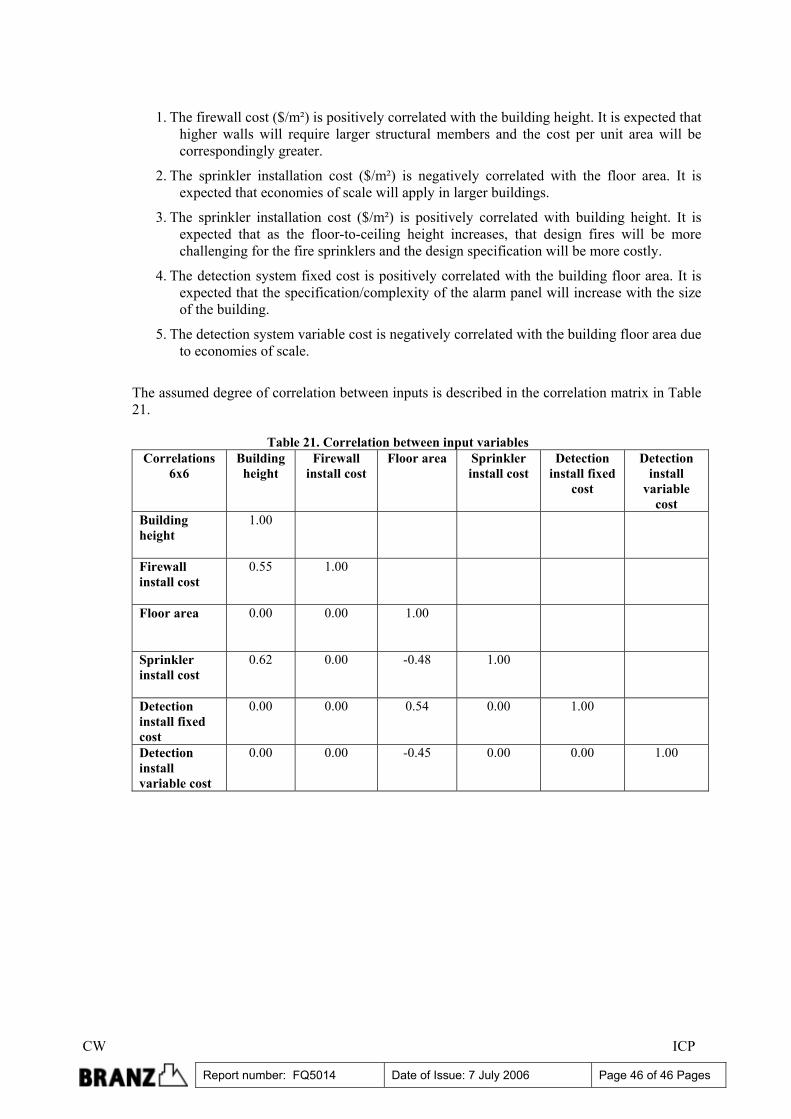
CW ICP
Report number: FQ5014 Date of Issue: 7 July 2006 Page 46 of 46 Pages
1. The firewall cost ($/m²) is positively correlated with the building height. It is expected that
higher walls will require larger structural members and the cost per unit area will be correspondingly greater.
2. The sprinkler installation cost ($/m²) is negatively correlated with the floor area. It is expected that economies of scale will apply in larger buildings.
3. The sprinkler installation cost ($/m²) is positively correlated with building height. It is expected that as the floor-to-ceiling height increases, that design fires will be more challenging for the fire sprinklers and the design specification will be more costly.
4. The detection system fixed cost is positively correlated with the building floor area. It is expected that the specification/complexity of the alarm panel will increase with the size of the building.
5. The detection system variable cost is negatively correlated with the building floor area due to economies of scale.
The assumed degree of correlation between inputs is described in the correlation matrix in Table 21.
Table 21. Correlation between input variables
Correlations 6x6
Building height
Firewall install cost
Floor area Sprinkler install cost
Detection install fixed
cost
Detection install
variable cost
Building height
1.00
Firewall install cost
0.55 1.00
Floor area
0.00 0.00 1.00
Sprinkler install cost
0.62 0.00 -0.48 1.00
Detection install fixed cost
0.00 0.00 0.54 0.00 1.00
Detection install variable cost
0.00 0.00 -0.45 0.00 0.00 1.00
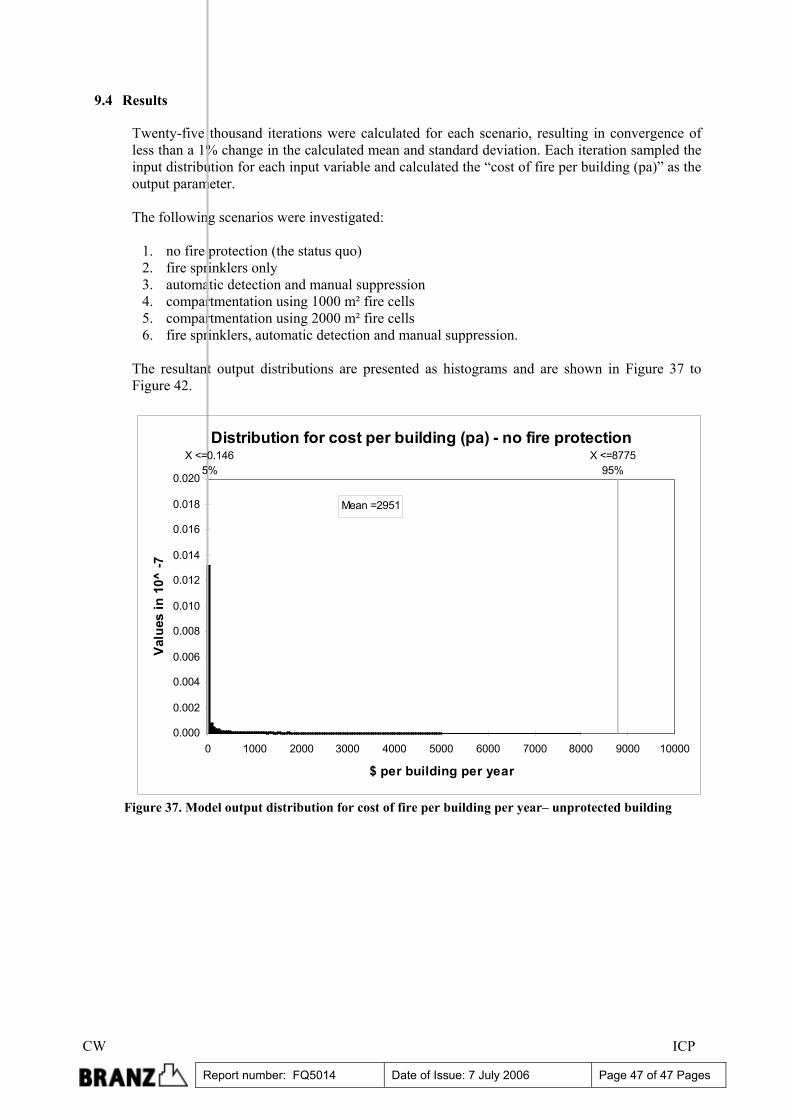
CW ICP
Report number: FQ5014 Date of Issue: 7 July 2006 Page 47 of 47 Pages
9.4 Results
Twenty-five thousand iterations were calculated for each scenario, resulting in convergence of less than a 1% change in the calculated mean and standard deviation. Each iteration sampled the input distribution for each input variable and calculated the “cost of fire per building (pa)” as the output parameter. The following scenarios were investigated:
1. no fire protection (the status quo) 2. fire sprinklers only 3. automatic detection and manual suppression 4. compartmentation using 1000 m² fire cells 5. compartmentation using 2000 m² fire cells 6. fire sprinklers, automatic detection and manual suppression.
The resultant output distributions are presented as histograms and are shown in Figure 37 to Figure 42.
Distribution for cost per building (pa) - no fire protection
Mean =2951
X <=877595%
X <=0.1465%
0.000
0.002
0.004
0.006
0.008
0.010
0.012
0.014
0.016
0.018
0.020
0 1000 2000 3000 4000 5000 6000 7000 8000 9000 10000
$ per building per year
Valu
es in
10^
-7
Figure 37. Model output distribution for cost of fire per building per year– unprotected building
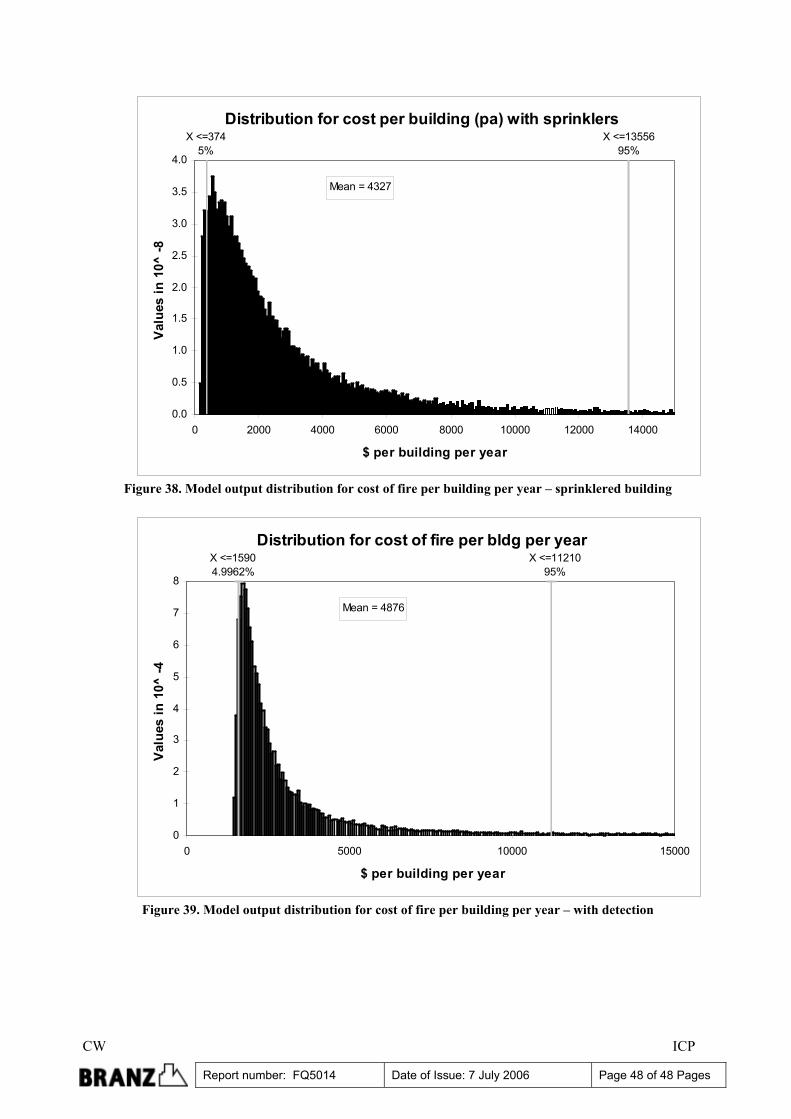
CW ICP
Report number: FQ5014 Date of Issue: 7 July 2006 Page 48 of 48 Pages
Distribution for cost per building (pa) with sprinklers
Mean = 4327
X <=3745%
X <=1355695%
0.0
0.5
1.0
1.5
2.0
2.5
3.0
3.5
4.0
0 2000 4000 6000 8000 10000 12000 14000
$ per building per year
Valu
es in
10^
-8
Figure 38. Model output distribution for cost of fire per building per year – sprinklered building
Distribution for cost of fire per bldg per year
Mean = 4876
X <=1121095%
X <=15904.9962%
0
1
2
3
4
5
6
7
8
0 5000 10000 15000
$ per building per year
Valu
es in
10^
-4
Figure 39. Model output distribution for cost of fire per building per year – with detection
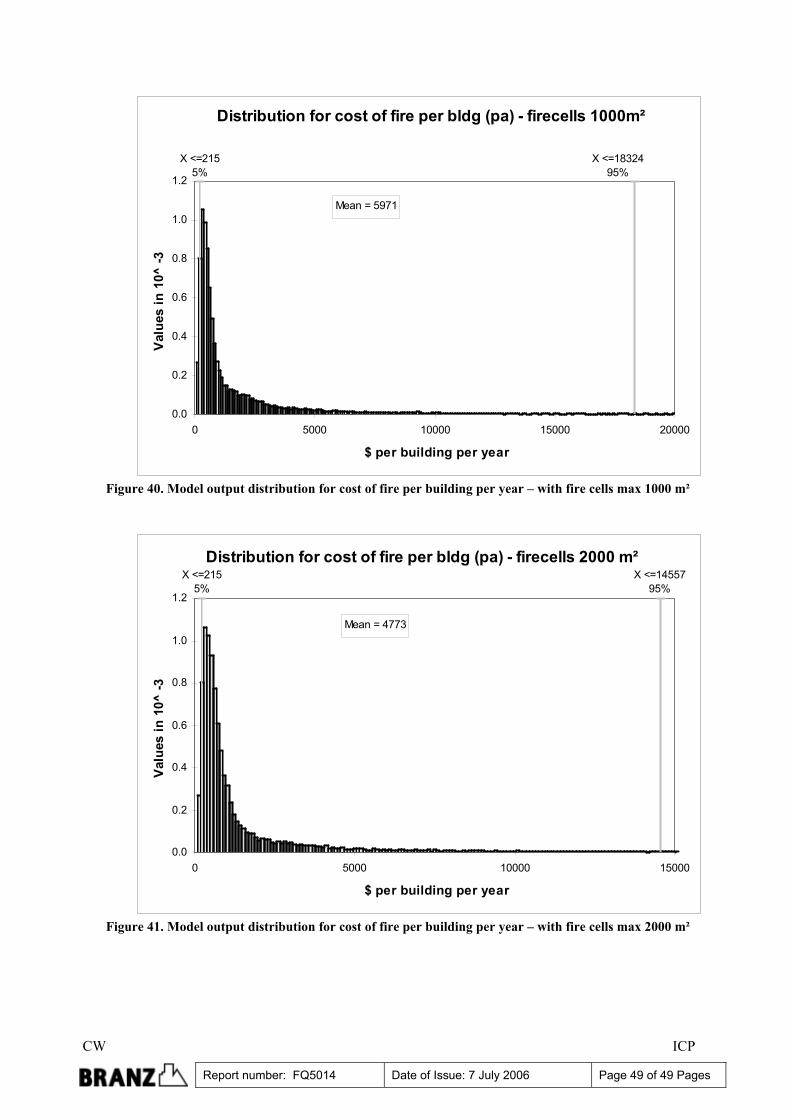
CW ICP
Report number: FQ5014 Date of Issue: 7 July 2006 Page 49 of 49 Pages
Distribution for cost of fire per bldg (pa) - firecells 1000m²
Mean = 5971
X <=1832495%
X <=2155%
0.0
0.2
0.4
0.6
0.8
1.0
1.2
0 5000 10000 15000 20000
$ per building per year
Val
ues
in 1
0^ -3
Figure 40. Model output distribution for cost of fire per building per year – with fire cells max 1000 m²
Distribution for cost of fire per bldg (pa) - firecells 2000 m²
Mean = 4773
X <=1455795%
X <=2155%
0.0
0.2
0.4
0.6
0.8
1.0
1.2
0 5000 10000 15000
$ per building per year
Valu
es in
10^
-3
Figure 41. Model output distribution for cost of fire per building per year – with fire cells max 2000 m²
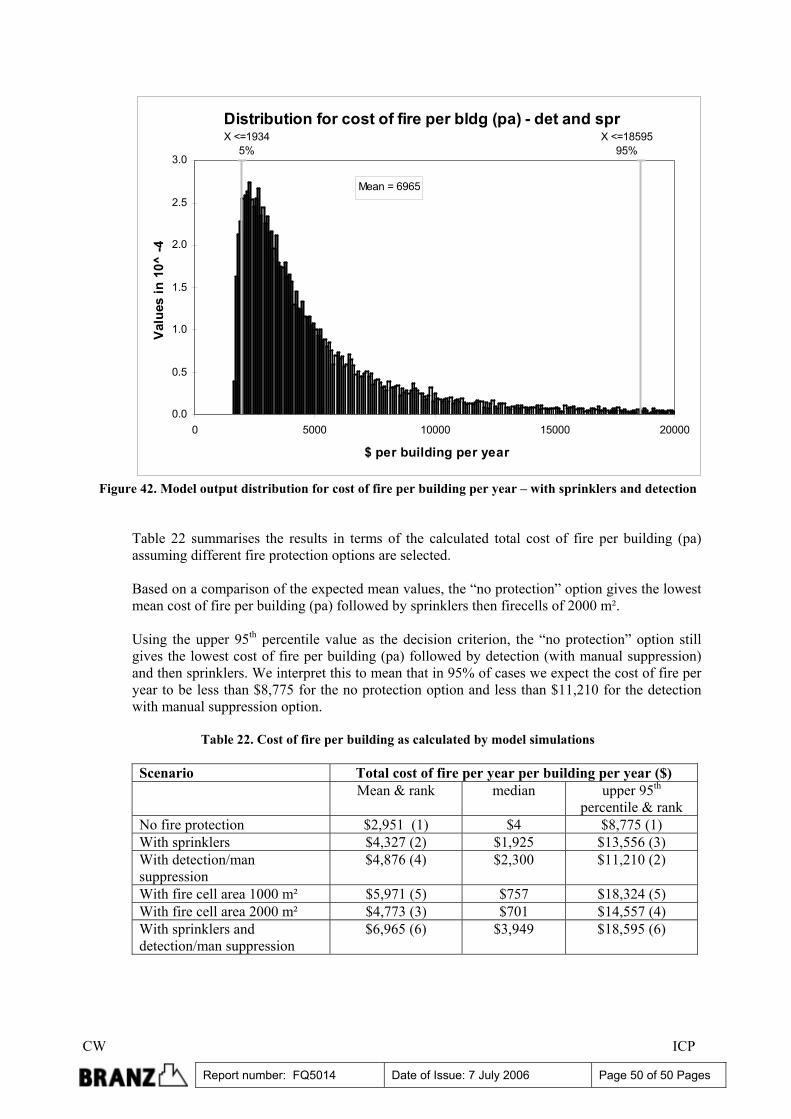
CW ICP
Report number: FQ5014 Date of Issue: 7 July 2006 Page 50 of 50 Pages
Distribution for cost of fire per bldg (pa) - det and spr
Mean = 6965
X <=1859595%
X <=19345%
0.0
0.5
1.0
1.5
2.0
2.5
3.0
0 5000 10000 15000 20000
$ per building per year
Valu
es in
10^
-4
Figure 42. Model output distribution for cost of fire per building per year – with sprinklers and detection
Table 22 summarises the results in terms of the calculated total cost of fire per building (pa) assuming different fire protection options are selected. Based on a comparison of the expected mean values, the “no protection” option gives the lowest mean cost of fire per building (pa) followed by sprinklers then firecells of 2000 m². Using the upper 95th percentile value as the decision criterion, the “no protection” option still gives the lowest cost of fire per building (pa) followed by detection (with manual suppression) and then sprinklers. We interpret this to mean that in 95% of cases we expect the cost of fire per year to be less than $8,775 for the no protection option and less than $11,210 for the detection with manual suppression option.
Table 22. Cost of fire per building as calculated by model simulations
Scenario Total cost of fire per year per building per year ($) Mean & rank median upper 95th
percentile & rank No fire protection $2,951 (1) $4 $8,775 (1) With sprinklers $4,327 (2) $1,925 $13,556 (3) With detection/man suppression
$4,876 (4) $2,300 $11,210 (2)
With fire cell area 1000 m² $5,971 (5) $757 $18,324 (5) With fire cell area 2000 m² $4,773 (3) $701 $14,557 (4) With sprinklers and detection/man suppression
$6,965 (6) $3,949 $18,595 (6)
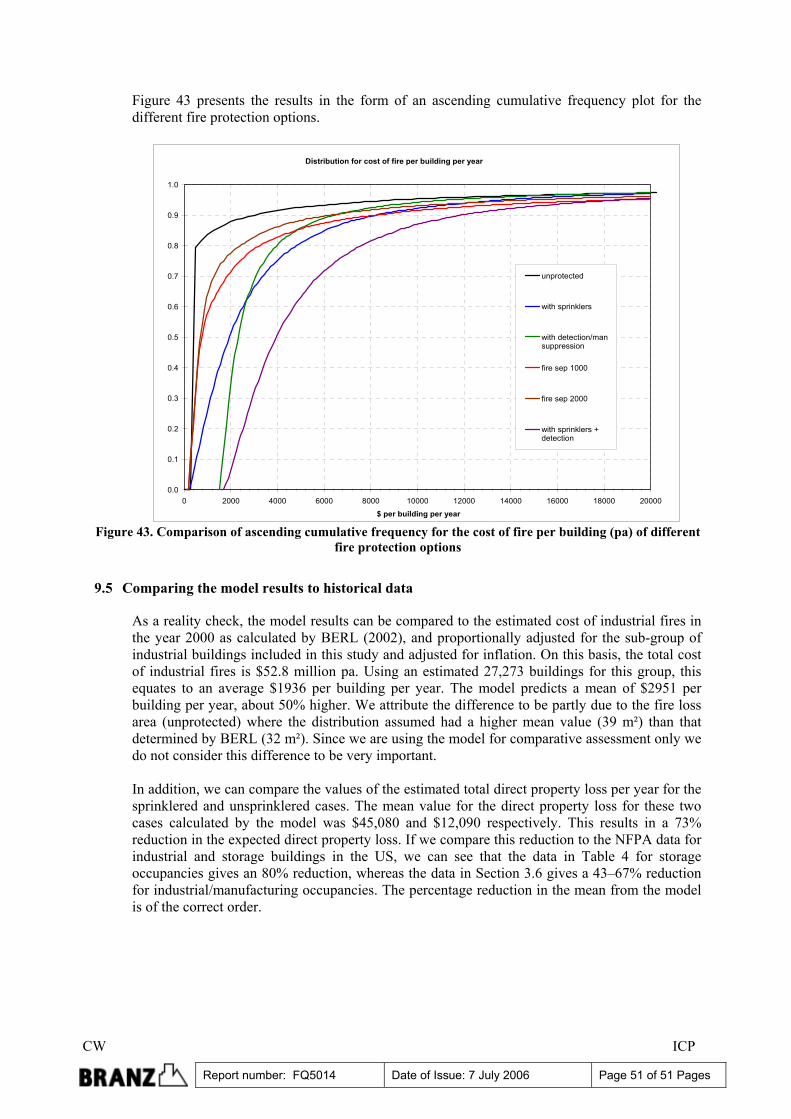
CW ICP
Report number: FQ5014 Date of Issue: 7 July 2006 Page 51 of 51 Pages
Figure 43 presents the results in the form of an ascending cumulative frequency plot for the different fire protection options.
Distribution for cost of fire per building per year
0.0
0.1
0.2
0.3
0.4
0.5
0.6
0.7
0.8
0.9
1.0
0 2000 4000 6000 8000 10000 12000 14000 16000 18000 20000
$ per building per year
unprotected
with sprinklers
with detection/mansuppression
fire sep 1000
fire sep 2000
with sprinklers +detection
Figure 43. Comparison of ascending cumulative frequency for the cost of fire per building (pa) of different
fire protection options
9.5 Comparing the model results to historical data
As a reality check, the model results can be compared to the estimated cost of industrial fires in the year 2000 as calculated by BERL (2002), and proportionally adjusted for the sub-group of industrial buildings included in this study and adjusted for inflation. On this basis, the total cost of industrial fires is $52.8 million pa. Using an estimated 27,273 buildings for this group, this equates to an average $1936 per building per year. The model predicts a mean of $2951 per building per year, about 50% higher. We attribute the difference to be partly due to the fire loss area (unprotected) where the distribution assumed had a higher mean value (39 m²) than that determined by BERL (32 m²). Since we are using the model for comparative assessment only we do not consider this difference to be very important. In addition, we can compare the values of the estimated total direct property loss per year for the sprinklered and unsprinklered cases. The mean value for the direct property loss for these two cases calculated by the model was $45,080 and $12,090 respectively. This results in a 73% reduction in the expected direct property loss. If we compare this reduction to the NFPA data for industrial and storage buildings in the US, we can see that the data in Table 4 for storage occupancies gives an 80% reduction, whereas the data in Section 3.6 gives a 43–67% reduction for industrial/manufacturing occupancies. The percentage reduction in the mean from the model is of the correct order.
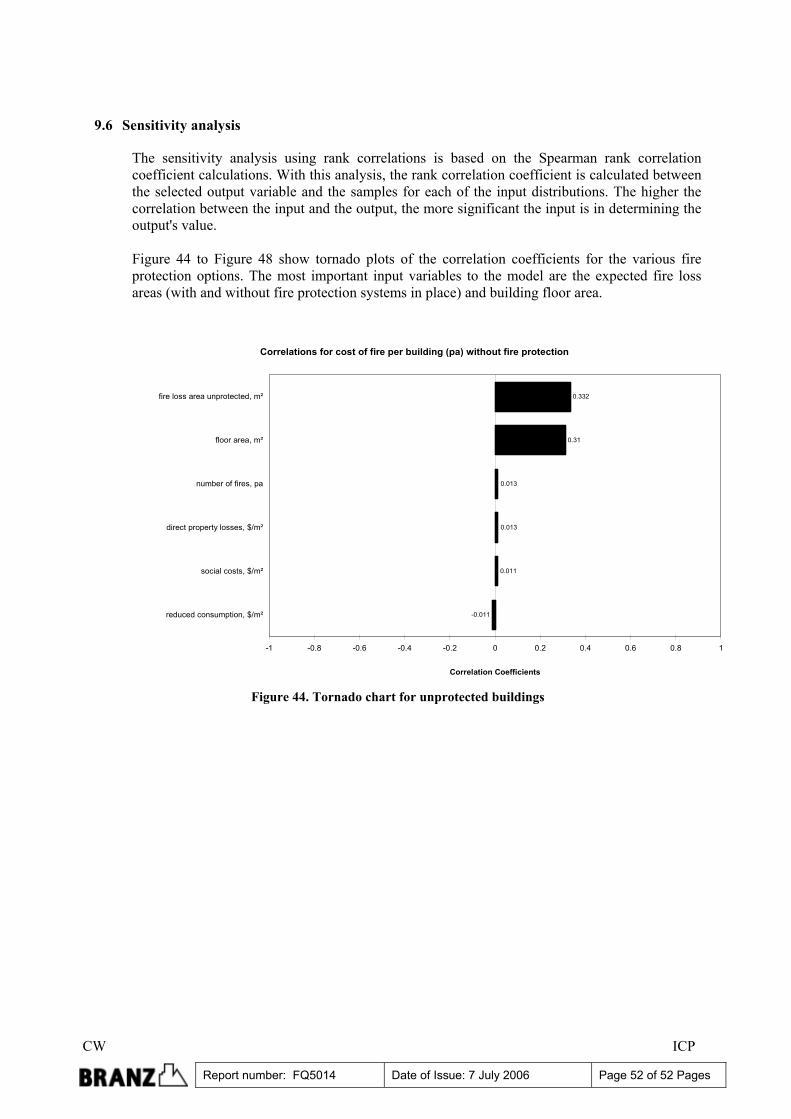
CW ICP
Report number: FQ5014 Date of Issue: 7 July 2006 Page 52 of 52 Pages
9.6 Sensitivity analysis
The sensitivity analysis using rank correlations is based on the Spearman rank correlation coefficient calculations. With this analysis, the rank correlation coefficient is calculated between the selected output variable and the samples for each of the input distributions. The higher the correlation between the input and the output, the more significant the input is in determining the output's value. Figure 44 to Figure 48 show tornado plots of the correlation coefficients for the various fire protection options. The most important input variables to the model are the expected fire loss areas (with and without fire protection systems in place) and building floor area.
Correlations for cost of fire per building (pa) without fire protection
0.332
0.31
0.013
0.013
0.011
-0.011
-1 -0.8 -0.6 -0.4 -0.2 0 0.2 0.4 0.6 0.8 1
fire loss area unprotected, m²
floor area, m²
number of fires, pa
direct property losses, $/m²
social costs, $/m²
reduced consumption, $/m²
Correlation Coefficients
Figure 44. Tornado chart for unprotected buildings
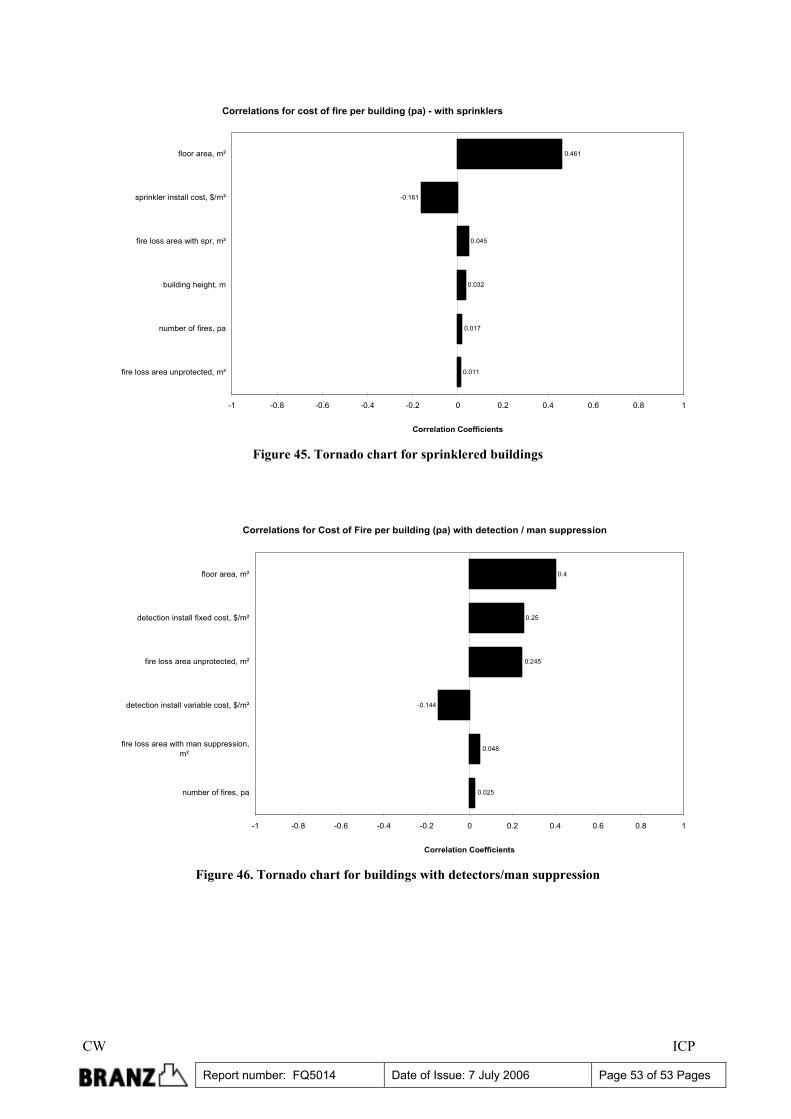
CW ICP
Report number: FQ5014 Date of Issue: 7 July 2006 Page 53 of 53 Pages
Correlations for cost of fire per building (pa) - with sprinklers
0.461
-0.161
0.045
0.032
0.017
0.011
-1 -0.8 -0.6 -0.4 -0.2 0 0.2 0.4 0.6 0.8 1
floor area, m²
sprinkler install cost, $/m²
fire loss area with spr, m²
building height, m
number of fires, pa
fire loss area unprotected, m²
Correlation Coefficients
Figure 45. Tornado chart for sprinklered buildings
Correlations for Cost of Fire per building (pa) with detection / man suppression
0.4
0.25
0.245
-0.144
0.048
0.025
-1 -0.8 -0.6 -0.4 -0.2 0 0.2 0.4 0.6 0.8 1
floor area, m²
detection install fixed cost, $/m²
fire loss area unprotected, m²
detection install variable cost, $/m²
fire loss area with man suppression,m²
number of fires, pa
Correlation Coefficients
Figure 46. Tornado chart for buildings with detectors/man suppression
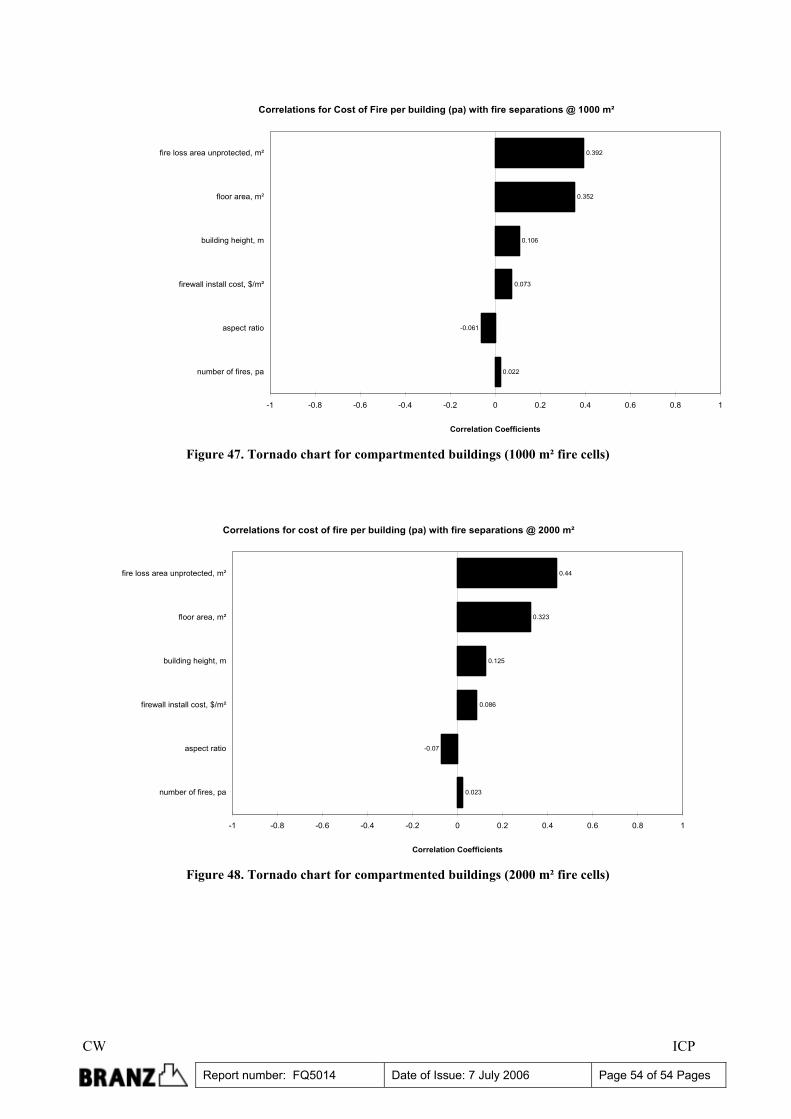
CW ICP
Report number: FQ5014 Date of Issue: 7 July 2006 Page 54 of 54 Pages
Correlations for Cost of Fire per building (pa) with fire separations @ 1000 m²
0.392
0.352
0.106
0.073
-0.061
0.022
-1 -0.8 -0.6 -0.4 -0.2 0 0.2 0.4 0.6 0.8 1
fire loss area unprotected, m²
floor area, m²
building height, m
firewall install cost, $/m²
aspect ratio
number of fires, pa
Correlation Coefficients
Figure 47. Tornado chart for compartmented buildings (1000 m² fire cells)
Correlations for cost of fire per building (pa) with fire separations @ 2000 m²
0.44
0.323
0.125
0.086
-0.07
0.023
-1 -0.8 -0.6 -0.4 -0.2 0 0.2 0.4 0.6 0.8 1
fire loss area unprotected, m²
floor area, m²
building height, m
firewall install cost, $/m²
aspect ratio
number of fires, pa
Correlation Coefficients
Figure 48. Tornado chart for compartmented buildings (2000 m² fire cells)
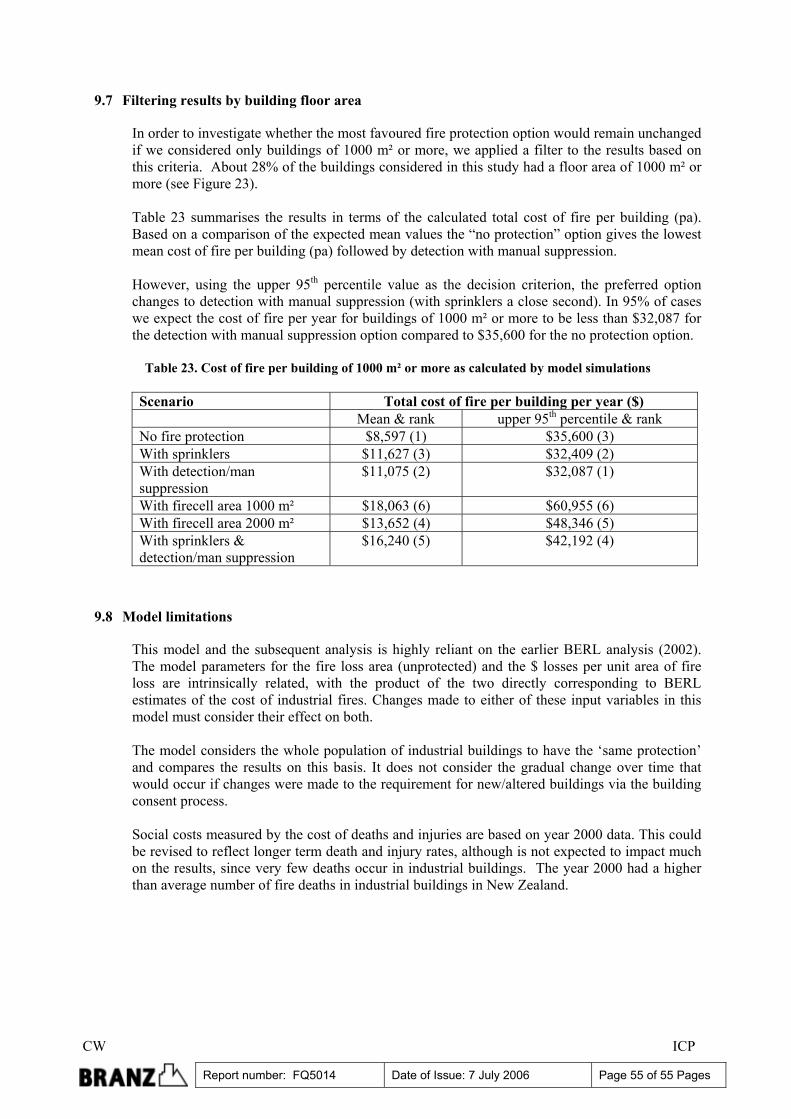
CW ICP
Report number: FQ5014 Date of Issue: 7 July 2006 Page 55 of 55 Pages
9.7 Filtering results by building floor area
In order to investigate whether the most favoured fire protection option would remain unchanged if we considered only buildings of 1000 m² or more, we applied a filter to the results based on this criteria. About 28% of the buildings considered in this study had a floor area of 1000 m² or more (see Figure 23). Table 23 summarises the results in terms of the calculated total cost of fire per building (pa). Based on a comparison of the expected mean values the “no protection” option gives the lowest mean cost of fire per building (pa) followed by detection with manual suppression. However, using the upper 95th percentile value as the decision criterion, the preferred option changes to detection with manual suppression (with sprinklers a close second). In 95% of cases we expect the cost of fire per year for buildings of 1000 m² or more to be less than $32,087 for the detection with manual suppression option compared to $35,600 for the no protection option.
Table 23. Cost of fire per building of 1000 m² or more as calculated by model simulations
Scenario Total cost of fire per building per year ($) Mean & rank upper 95th percentile & rank No fire protection $8,597 (1) $35,600 (3) With sprinklers $11,627 (3) $32,409 (2) With detection/man suppression
$11,075 (2) $32,087 (1)
With firecell area 1000 m² $18,063 (6) $60,955 (6) With firecell area 2000 m² $13,652 (4) $48,346 (5) With sprinklers & detection/man suppression
$16,240 (5) $42,192 (4)
9.8 Model limitations
This model and the subsequent analysis is highly reliant on the earlier BERL analysis (2002). The model parameters for the fire loss area (unprotected) and the $ losses per unit area of fire loss are intrinsically related, with the product of the two directly corresponding to BERL estimates of the cost of industrial fires. Changes made to either of these input variables in this model must consider their effect on both. The model considers the whole population of industrial buildings to have the ‘same protection’ and compares the results on this basis. It does not consider the gradual change over time that would occur if changes were made to the requirement for new/altered buildings via the building consent process. Social costs measured by the cost of deaths and injuries are based on year 2000 data. This could be revised to reflect longer term death and injury rates, although is not expected to impact much on the results, since very few deaths occur in industrial buildings. The year 2000 had a higher than average number of fire deaths in industrial buildings in New Zealand.
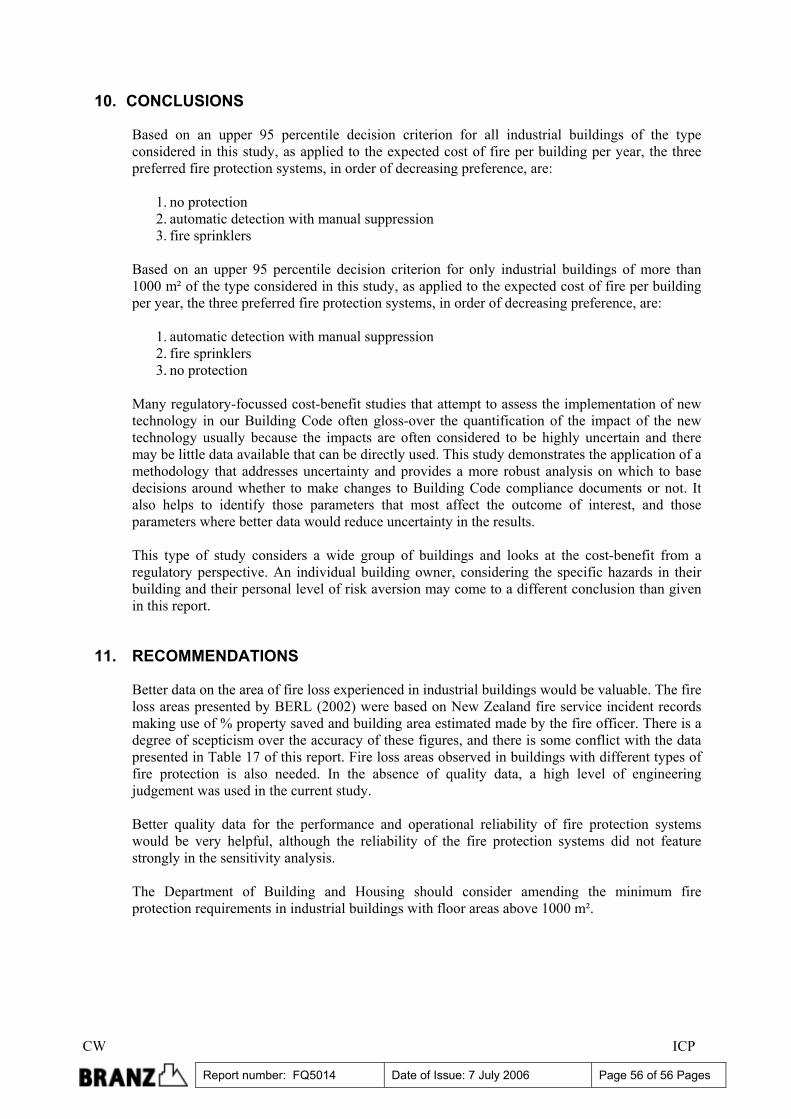
CW ICP
Report number: FQ5014 Date of Issue: 7 July 2006 Page 56 of 56 Pages
10. CONCLUSIONS
Based on an upper 95 percentile decision criterion for all industrial buildings of the type considered in this study, as applied to the expected cost of fire per building per year, the three preferred fire protection systems, in order of decreasing preference, are:
1. no protection 2. automatic detection with manual suppression 3. fire sprinklers
Based on an upper 95 percentile decision criterion for only industrial buildings of more than 1000 m² of the type considered in this study, as applied to the expected cost of fire per building per year, the three preferred fire protection systems, in order of decreasing preference, are:
1. automatic detection with manual suppression 2. fire sprinklers 3. no protection
Many regulatory-focussed cost-benefit studies that attempt to assess the implementation of new technology in our Building Code often gloss-over the quantification of the impact of the new technology usually because the impacts are often considered to be highly uncertain and there may be little data available that can be directly used. This study demonstrates the application of a methodology that addresses uncertainty and provides a more robust analysis on which to base decisions around whether to make changes to Building Code compliance documents or not. It also helps to identify those parameters that most affect the outcome of interest, and those parameters where better data would reduce uncertainty in the results. This type of study considers a wide group of buildings and looks at the cost-benefit from a regulatory perspective. An individual building owner, considering the specific hazards in their building and their personal level of risk aversion may come to a different conclusion than given in this report.
11. RECOMMENDATIONS
Better data on the area of fire loss experienced in industrial buildings would be valuable. The fire loss areas presented by BERL (2002) were based on New Zealand fire service incident records making use of % property saved and building area estimated made by the fire officer. There is a degree of scepticism over the accuracy of these figures, and there is some conflict with the data presented in Table 17 of this report. Fire loss areas observed in buildings with different types of fire protection is also needed. In the absence of quality data, a high level of engineering judgement was used in the current study. Better quality data for the performance and operational reliability of fire protection systems would be very helpful, although the reliability of the fire protection systems did not feature strongly in the sensitivity analysis. The Department of Building and Housing should consider amending the minimum fire protection requirements in industrial buildings with floor areas above 1000 m².
CW ICP
Report number: FQ5014 Date of Issue: 7 July 2006 Page 57 of 57 Pages
12. REFERENCES
Ahrens M. 2003. Selection From The US Fire Problem Overview Report Leading Causes and Other Patterns and Trends Industrial and Manufacturing Properties. NFPA, Quincy MA, US.
Barry T. 2002. Risk-Informed, Performance-Based Industrial Fire Protection. Tennessee Valley Publishing, US. Benichou N., Kashef A, Hadjisophoceleous G., Torvi D and Reid I. 2002. ‘FIERAsystem: A Fire Risk Assessment Model for Light Industrial Building Fire Safety Evaluation’. Research Report 120. Institute for Research in Construction, National Research Council of Canada, Ottawa, Canada. Benichou N, Kashef A., Reid I, and Hum J. 2003. ‘FIERAsystem Downtime Model (DNTM) Theory’. IRC-RR-135. National Research Council of Canada, Ottawa, Canada. Benichou N, Kashef A, Reid I, Hadjisophoceleous G, Torvi D and Morinville G. 2005. ‘FIERAsystem: A Fire Risk Assessment Tool to Evaluate Fire Safety in Industrial Buildings and Large Spaces’. Journal of Fire Protection Engineering 15 (August 2005). British Standards Institution. 1997. DD240. Fire Safety in buildings – Part 1. Guide to The Application of Fire Safety Engineering Principles. London, UK. Bukowski RW, Budnick EK and Schemel CF. 1999. Estimates of the Operational Reliability of Fire Protection Systems. Proceedings of Third International Conference of Fire Research and Engineering. Bethesda, MD, US. Business and Economic Research Ltd (BERL). 2002. An Economic Assessment of Industrial Fires in New Zealand. New Zealand Fire Service Commission Research Report Number 28. Wellington, New Zealand. Clark F. 2006. Personal communication. Fire Security Services Ltd, Lower Hutt, New Zealand. Department of Building and Housing (DBH). 2005. Compliance Document for New Zealand Building Code: Clauses C1, C2, C3, C4 Fire Safety. Wellington, New Zealand. Helm, K. 2005. ‘Serious Fires in Industrial Premises’. Fire Prevention and Fire Engineers Journal (September 2005). Houlding RC and Rew PJ. 2003. ‘Assessment of the Benefits of Fire Compartmentation in Chemical Warehouses’. Research Report 152. Health and Safety Executive, Suffolk, UK. Johansson, Henrik. 2002. Decision Analysis Concerned with Investments in Fire Safety. 7th International Symposium on Fire Safety Science, Worcester, MA, US. Johansson, Henrik. 2003. ‘Decision Analysis in Fire Safety Engineering – Analysing Investments in Fire Safety’. Report 1027. Department of Fire Safety Engineering, Lund University, Sweden. Land Transport Safety Authority. 2000. The Social Cost of Road Crashes and Injuries: June 2000 Update. Wellington, New Zealand.
CW ICP
Report number: FQ5014 Date of Issue: 7 July 2006 Page 58 of 58 Pages
Lundin J and Frantzich H. 2002. Cost-Benefit and Risk Analysis – Basis for Decisions in the Fire Safety Design Process. Proceedings 4th International Conference on Performance-based Codes and Fire Safety Design Methods. Melbourne, Australia. Maltbys. 2005a. Percentage Allocation of Cost of Building Elements for the New Zealand Property Institute. www.property.org.nz/Files/costpercentall05.pdf. Maltbys. 2005b. Costs and Indices of Building Construction. www.maltby.co.nz/costindices.html Marryat HW. 1988. Fire: A Century of Automatic Sprinkler Protection in Australia and New Zealand 1886–1986. Australian Fire Protection Association, Melbourne, Australia. National Fire Sprinkler Association, Inc. 2005. Fire Sprinkler Incentive Act of 2005. www.nfsa.org/fsia/FireSprinklerIncentiveAct.pdf New Zealand Fire Service. 2004. Emergency Incident Statistics 2003-–2004. Wellington, New Zealand. O’Brien T. 2006. Personal communication. Verifire, Auckland, New Zealand. Palisade Corporation. 2000. Guide to Using @Risk. Risk Analysis and Simulation Add-in for Microsoft Excel. Version 4 March 2000. Newfield, NY, US.
Ramachandran G. 1998. The Economics of Fire Protection. E & F N Spon, London, UK. Rawlinsons Media Ltd. 2004. 2004 Rawlinsons New Zealand Construction Handbook, 19th Edition. Auckland, New Zealand Sandberg, Martin. 2004. Statistical Determination of Ignition Frequency. Master’s thesis 2004:E27. Lund Institute of Technology, Centre for Mathematical Sciences, Lund University, Sweden. Thompson G. (2006). Personal communication. Wormald, Auckland, New Zealand. Tillander, Kati and Keski-Rahkonen, Olavi. 2003. ‘The Ignition Frequency of Structural Fires in Finland 1996-1999’. In Fire Safety Science Proceedings of the Seventh International Symposium. Worcester 16-21 June 2002, International Association for Fire Safety Science. Torvi DA. 2003. ‘Fire Protection in Agricultural Facilities: A Review of Research, Resources and Practices’. Journal of Fire Protection Engineering 13 (2). Tyldesley, Alan., Rew, Peter and Houlding, Richard. 2004. ‘Counting the Cost’. Fire Engineering Journal & Fire Prevention (November 2004). Warrington Fire Research. 1996. Probabilistic Risk Assessment Data – Delphi Exercise. (place?) Yung D., Hadjisophocleous GV, Proulx G and Kyle BR 1996. Cost-effective Fire-Safety Upgrade Options for a Canadian Government Office Building. Proceedings, International Conference on Performance-Based Codes and Design Methods, Ottawa, Canada.
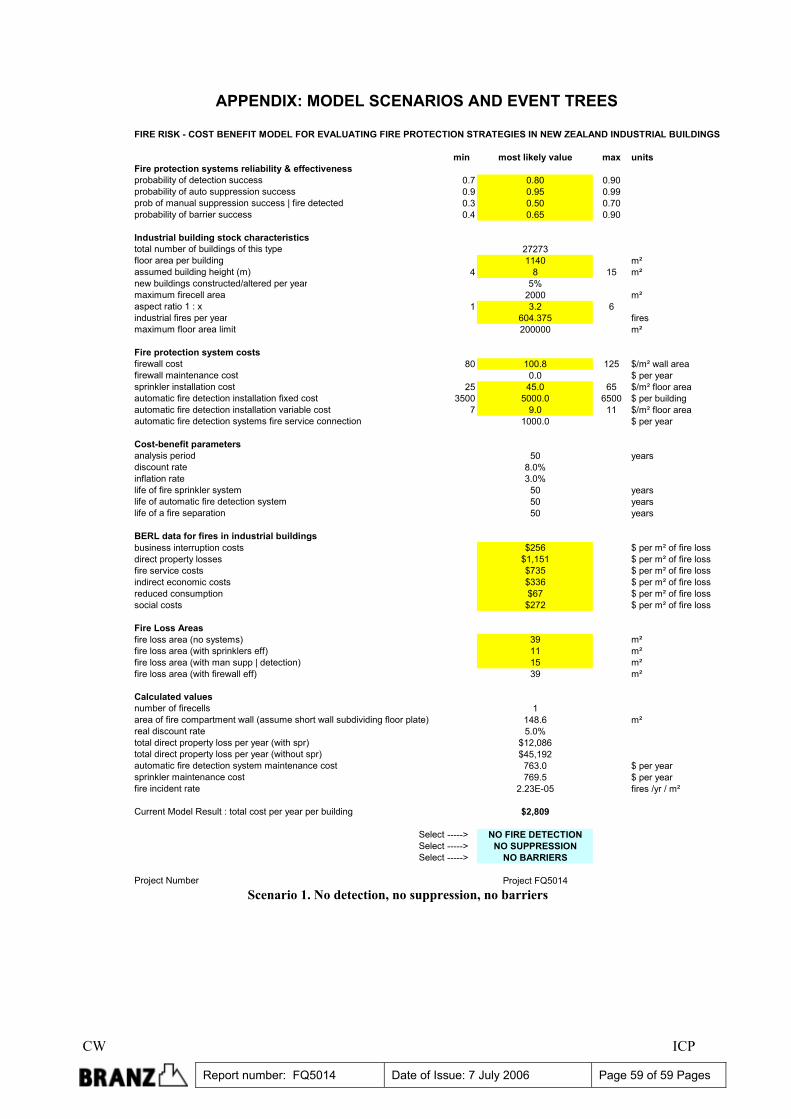
CW ICP
Report number: FQ5014 Date of Issue: 7 July 2006 Page 59 of 59 Pages
APPENDIX: MODEL SCENARIOS AND EVENT TREES
FIRE RISK - COST BENEFIT MODEL FOR EVALUATING FIRE PROTECTION STRATEGIES IN NEW ZEALAND INDUSTRIAL BUILDINGS
min most likely value max unitsFire protection systems reliability & effectivenessprobability of detection success 0.7 0.80 0.90probability of auto suppression success 0.9 0.95 0.99prob of manual suppression success | fire detected 0.3 0.50 0.70probability of barrier success 0.4 0.65 0.90
Industrial building stock characteristicstotal number of buildings of this type 27273floor area per building 1140 m²assumed building height (m) 4 8 15 m²new buildings constructed/altered per year 5%maximum firecell area 2000 m²aspect ratio 1 : x 1 3.2 6industrial fires per year 604.375 fires maximum floor area limit 200000 m²
Fire protection system costsfirewall cost 80 100.8 125 $/m² wall areafirewall maintenance cost 0.0 $ per yearsprinkler installation cost 25 45.0 65 $/m² floor areaautomatic fire detection installation fixed cost 3500 5000.0 6500 $ per buildingautomatic fire detection installation variable cost 7 9.0 11 $/m² floor areaautomatic fire detection systems fire service connection 1000.0 $ per year
Cost-benefit parametersanalysis period 50 yearsdiscount rate 8.0%inflation rate 3.0%life of fire sprinkler system 50 yearslife of automatic fire detection system 50 yearslife of a fire separation 50 years
BERL data for fires in industrial buildingsbusiness interruption costs $256 $ per m² of fire lossdirect property losses $1,151 $ per m² of fire lossfire service costs $735 $ per m² of fire lossindirect economic costs $336 $ per m² of fire lossreduced consumption $67 $ per m² of fire losssocial costs $272 $ per m² of fire loss
Fire Loss Areasfire loss area (no systems) 39 m²fire loss area (with sprinklers eff) 11 m²fire loss area (with man supp | detection) 15 m²fire loss area (with firewall eff) 39 m²
Calculated valuesnumber of firecells 1area of fire compartment wall (assume short wall subdividing floor plate) 148.6 m²real discount rate 5.0%total direct property loss per year (with spr) $12,086total direct property loss per year (without spr) $45,192automatic fire detection system maintenance cost 763.0 $ per yearsprinkler maintenance cost 769.5 $ per yearfire incident rate 2.23E-05 fires /yr / m²
Current Model Result : total cost per year per building $2,809
Select -----> NO FIRE DETECTIONSelect -----> NO SUPPRESSIONSelect -----> NO BARRIERS
Project Number Project FQ5014 Scenario 1. No detection, no suppression, no barriers

CW ICP
Report number: FQ5014 Date of Issue: 7 July 2006 Page 60 of 60 Pages
FIRE RISK - COST BENEFIT MODEL FOR EVALUATING FIRE PROTECTION STRATEGIES IN NEW ZEALAND INDUSTRIAL BUILDINGS
min most likely value max unitsFire protection systems reliability & effectivenessprobability of detection success 0.7 0.80 0.90probability of auto suppression success 0.9 0.95 0.99prob of manual suppression success | fire detected 0.3 0.50 0.70probability of barrier success 0.4 0.65 0.90
Industrial building stock characteristicstotal number of buildings of this type 27273floor area per building 1140 m²assumed building height (m) 4 8 15 m²new buildings constructed/altered per year 5%maximum firecell area 2000 m²aspect ratio 1 : x 1 3.2 6industrial fires per year 604.375 fires maximum floor area limit 200000 m²
Fire protection system costsfirewall cost 80 100.8 125 $/m² wall areafirewall maintenance cost 0.0 $ per yearsprinkler installation cost 25 45.0 65 $/m² floor areaautomatic fire detection installation fixed cost 3500 5000.0 6500 $ per buildingautomatic fire detection installation variable cost 7 9.0 11 $/m² floor areaautomatic fire detection systems fire service connection 1000.0 $ per year
Cost-benefit parametersanalysis period 50 yearsdiscount rate 8.0%inflation rate 3.0%life of fire sprinkler system 50 yearslife of automatic fire detection system 50 yearslife of a fire separation 50 years
BERL data for fires in industrial buildingsbusiness interruption costs $256 $ per m² of fire lossdirect property losses $1,151 $ per m² of fire lossfire service costs $735 $ per m² of fire lossindirect economic costs $336 $ per m² of fire lossreduced consumption $67 $ per m² of fire losssocial costs $272 $ per m² of fire loss
Fire Loss Areasfire loss area (no systems) 39 m²fire loss area (with sprinklers eff) 11 m²fire loss area (with man supp | detection) 15 m²fire loss area (with firewall eff) 39 m²
Calculated valuesnumber of firecells 1area of fire compartment wall (assume short wall subdividing floor plate) 148.6 m²real discount rate 5.0%total direct property loss per year (with spr) $12,086total direct property loss per year (without spr) $45,192automatic fire detection system maintenance cost 763.0 $ per yearsprinkler maintenance cost 769.5 $ per yearfire incident rate 2.23E-05 fires /yr / m²
Current Model Result : total cost per year per building $3,630
Select -----> NO FIRE DETECTIONSelect -----> NO SUPPRESSIONSelect -----> FIRE BARRIERS
Project Number Project FQ5014
Scenario 2. No detection, no suppression, barriers
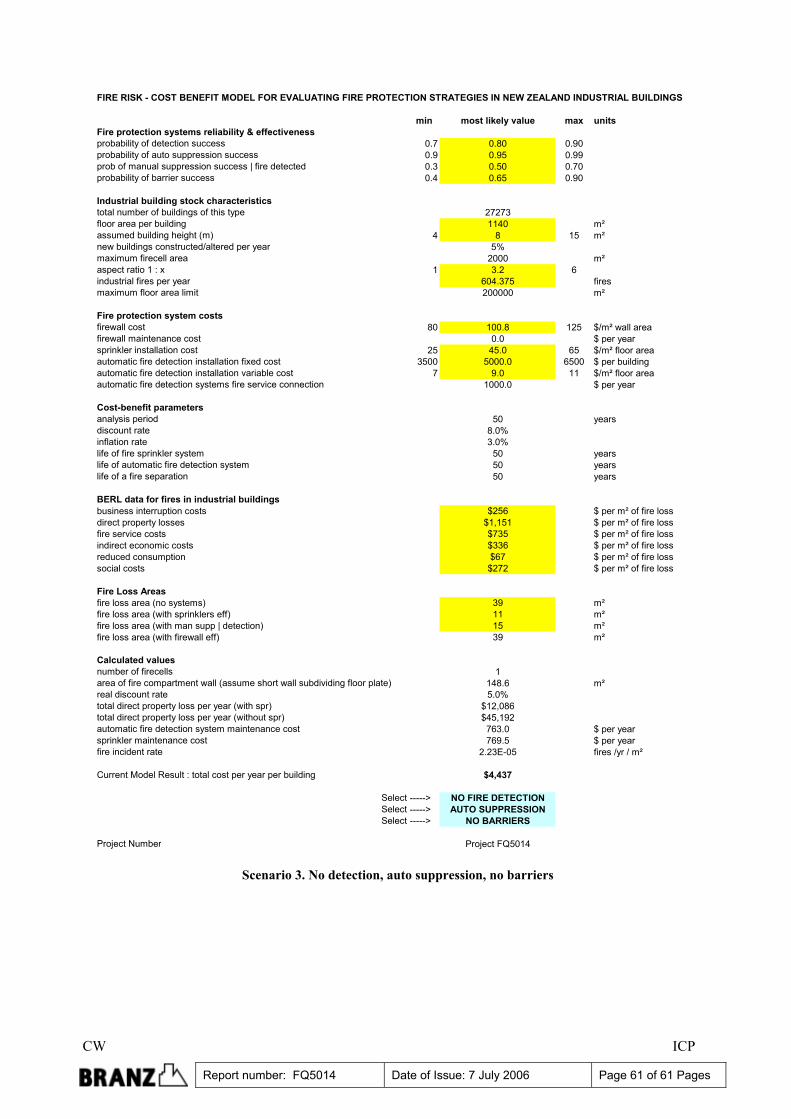
CW ICP
Report number: FQ5014 Date of Issue: 7 July 2006 Page 61 of 61 Pages
FIRE RISK - COST BENEFIT MODEL FOR EVALUATING FIRE PROTECTION STRATEGIES IN NEW ZEALAND INDUSTRIAL BUILDINGS
min most likely value max unitsFire protection systems reliability & effectivenessprobability of detection success 0.7 0.80 0.90probability of auto suppression success 0.9 0.95 0.99prob of manual suppression success | fire detected 0.3 0.50 0.70probability of barrier success 0.4 0.65 0.90
Industrial building stock characteristicstotal number of buildings of this type 27273floor area per building 1140 m²assumed building height (m) 4 8 15 m²new buildings constructed/altered per year 5%maximum firecell area 2000 m²aspect ratio 1 : x 1 3.2 6industrial fires per year 604.375 fires maximum floor area limit 200000 m²
Fire protection system costsfirewall cost 80 100.8 125 $/m² wall areafirewall maintenance cost 0.0 $ per yearsprinkler installation cost 25 45.0 65 $/m² floor areaautomatic fire detection installation fixed cost 3500 5000.0 6500 $ per buildingautomatic fire detection installation variable cost 7 9.0 11 $/m² floor areaautomatic fire detection systems fire service connection 1000.0 $ per year
Cost-benefit parametersanalysis period 50 yearsdiscount rate 8.0%inflation rate 3.0%life of fire sprinkler system 50 yearslife of automatic fire detection system 50 yearslife of a fire separation 50 years
BERL data for fires in industrial buildingsbusiness interruption costs $256 $ per m² of fire lossdirect property losses $1,151 $ per m² of fire lossfire service costs $735 $ per m² of fire lossindirect economic costs $336 $ per m² of fire lossreduced consumption $67 $ per m² of fire losssocial costs $272 $ per m² of fire loss
Fire Loss Areasfire loss area (no systems) 39 m²fire loss area (with sprinklers eff) 11 m²fire loss area (with man supp | detection) 15 m²fire loss area (with firewall eff) 39 m²
Calculated valuesnumber of firecells 1area of fire compartment wall (assume short wall subdividing floor plate) 148.6 m²real discount rate 5.0%total direct property loss per year (with spr) $12,086total direct property loss per year (without spr) $45,192automatic fire detection system maintenance cost 763.0 $ per yearsprinkler maintenance cost 769.5 $ per yearfire incident rate 2.23E-05 fires /yr / m²
Current Model Result : total cost per year per building $4,437
Select -----> NO FIRE DETECTIONSelect -----> AUTO SUPPRESSIONSelect -----> NO BARRIERS
Project Number Project FQ5014
Scenario 3. No detection, auto suppression, no barriers
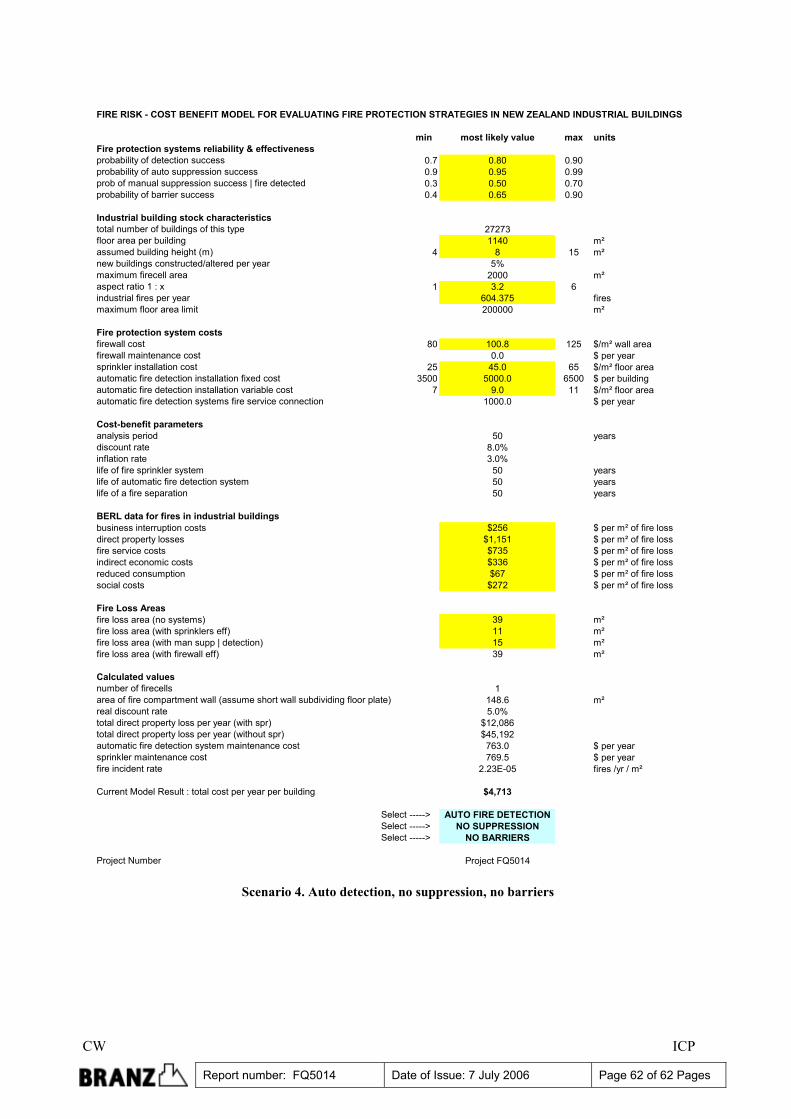
CW ICP
Report number: FQ5014 Date of Issue: 7 July 2006 Page 62 of 62 Pages
FIRE RISK - COST BENEFIT MODEL FOR EVALUATING FIRE PROTECTION STRATEGIES IN NEW ZEALAND INDUSTRIAL BUILDINGS
min most likely value max unitsFire protection systems reliability & effectivenessprobability of detection success 0.7 0.80 0.90probability of auto suppression success 0.9 0.95 0.99prob of manual suppression success | fire detected 0.3 0.50 0.70probability of barrier success 0.4 0.65 0.90
Industrial building stock characteristicstotal number of buildings of this type 27273floor area per building 1140 m²assumed building height (m) 4 8 15 m²new buildings constructed/altered per year 5%maximum firecell area 2000 m²aspect ratio 1 : x 1 3.2 6industrial fires per year 604.375 fires maximum floor area limit 200000 m²
Fire protection system costsfirewall cost 80 100.8 125 $/m² wall areafirewall maintenance cost 0.0 $ per yearsprinkler installation cost 25 45.0 65 $/m² floor areaautomatic fire detection installation fixed cost 3500 5000.0 6500 $ per buildingautomatic fire detection installation variable cost 7 9.0 11 $/m² floor areaautomatic fire detection systems fire service connection 1000.0 $ per year
Cost-benefit parametersanalysis period 50 yearsdiscount rate 8.0%inflation rate 3.0%life of fire sprinkler system 50 yearslife of automatic fire detection system 50 yearslife of a fire separation 50 years
BERL data for fires in industrial buildingsbusiness interruption costs $256 $ per m² of fire lossdirect property losses $1,151 $ per m² of fire lossfire service costs $735 $ per m² of fire lossindirect economic costs $336 $ per m² of fire lossreduced consumption $67 $ per m² of fire losssocial costs $272 $ per m² of fire loss
Fire Loss Areasfire loss area (no systems) 39 m²fire loss area (with sprinklers eff) 11 m²fire loss area (with man supp | detection) 15 m²fire loss area (with firewall eff) 39 m²
Calculated valuesnumber of firecells 1area of fire compartment wall (assume short wall subdividing floor plate) 148.6 m²real discount rate 5.0%total direct property loss per year (with spr) $12,086total direct property loss per year (without spr) $45,192automatic fire detection system maintenance cost 763.0 $ per yearsprinkler maintenance cost 769.5 $ per yearfire incident rate 2.23E-05 fires /yr / m²
Current Model Result : total cost per year per building $4,713
Select -----> AUTO FIRE DETECTIONSelect -----> NO SUPPRESSIONSelect -----> NO BARRIERS
Project Number Project FQ5014
Scenario 4. Auto detection, no suppression, no barriers
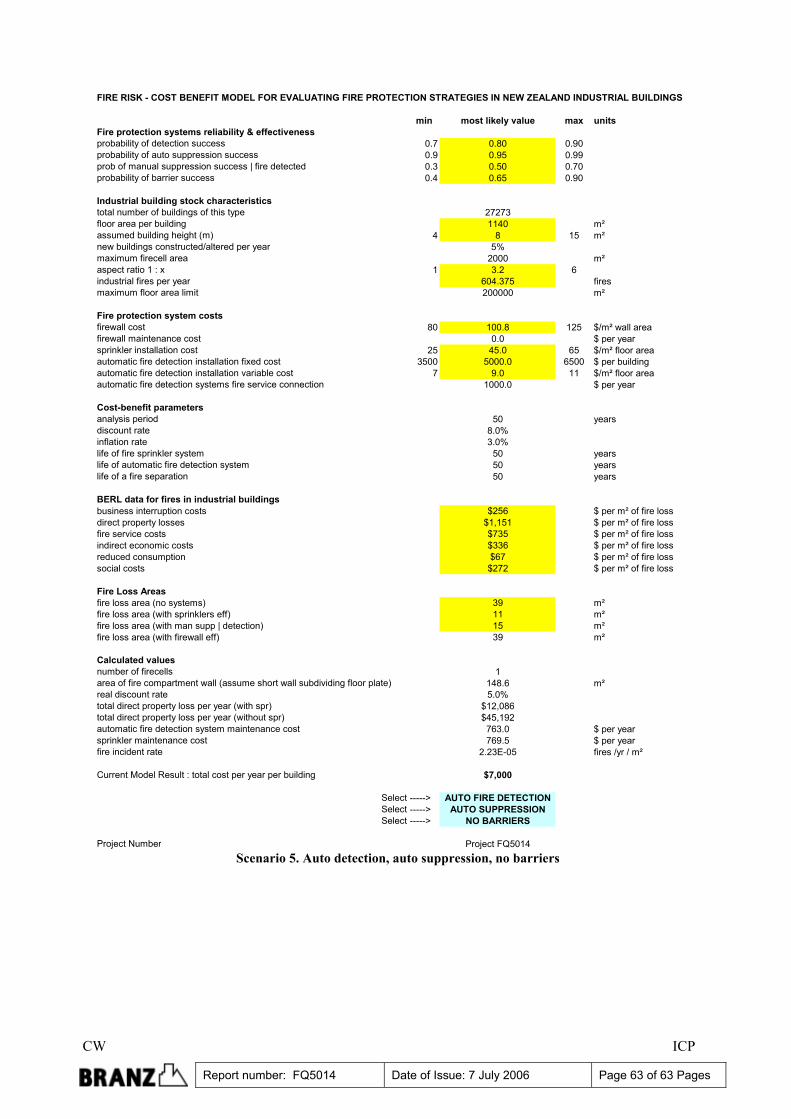
CW ICP
Report number: FQ5014 Date of Issue: 7 July 2006 Page 63 of 63 Pages
FIRE RISK - COST BENEFIT MODEL FOR EVALUATING FIRE PROTECTION STRATEGIES IN NEW ZEALAND INDUSTRIAL BUILDINGS
min most likely value max unitsFire protection systems reliability & effectivenessprobability of detection success 0.7 0.80 0.90probability of auto suppression success 0.9 0.95 0.99prob of manual suppression success | fire detected 0.3 0.50 0.70probability of barrier success 0.4 0.65 0.90
Industrial building stock characteristicstotal number of buildings of this type 27273floor area per building 1140 m²assumed building height (m) 4 8 15 m²new buildings constructed/altered per year 5%maximum firecell area 2000 m²aspect ratio 1 : x 1 3.2 6industrial fires per year 604.375 fires maximum floor area limit 200000 m²
Fire protection system costsfirewall cost 80 100.8 125 $/m² wall areafirewall maintenance cost 0.0 $ per yearsprinkler installation cost 25 45.0 65 $/m² floor areaautomatic fire detection installation fixed cost 3500 5000.0 6500 $ per buildingautomatic fire detection installation variable cost 7 9.0 11 $/m² floor areaautomatic fire detection systems fire service connection 1000.0 $ per year
Cost-benefit parametersanalysis period 50 yearsdiscount rate 8.0%inflation rate 3.0%life of fire sprinkler system 50 yearslife of automatic fire detection system 50 yearslife of a fire separation 50 years
BERL data for fires in industrial buildingsbusiness interruption costs $256 $ per m² of fire lossdirect property losses $1,151 $ per m² of fire lossfire service costs $735 $ per m² of fire lossindirect economic costs $336 $ per m² of fire lossreduced consumption $67 $ per m² of fire losssocial costs $272 $ per m² of fire loss
Fire Loss Areasfire loss area (no systems) 39 m²fire loss area (with sprinklers eff) 11 m²fire loss area (with man supp | detection) 15 m²fire loss area (with firewall eff) 39 m²
Calculated valuesnumber of firecells 1area of fire compartment wall (assume short wall subdividing floor plate) 148.6 m²real discount rate 5.0%total direct property loss per year (with spr) $12,086total direct property loss per year (without spr) $45,192automatic fire detection system maintenance cost 763.0 $ per yearsprinkler maintenance cost 769.5 $ per yearfire incident rate 2.23E-05 fires /yr / m²
Current Model Result : total cost per year per building $7,000
Select -----> AUTO FIRE DETECTIONSelect -----> AUTO SUPPRESSIONSelect -----> NO BARRIERS
Project Number Project FQ5014 Scenario 5. Auto detection, auto suppression, no barriers
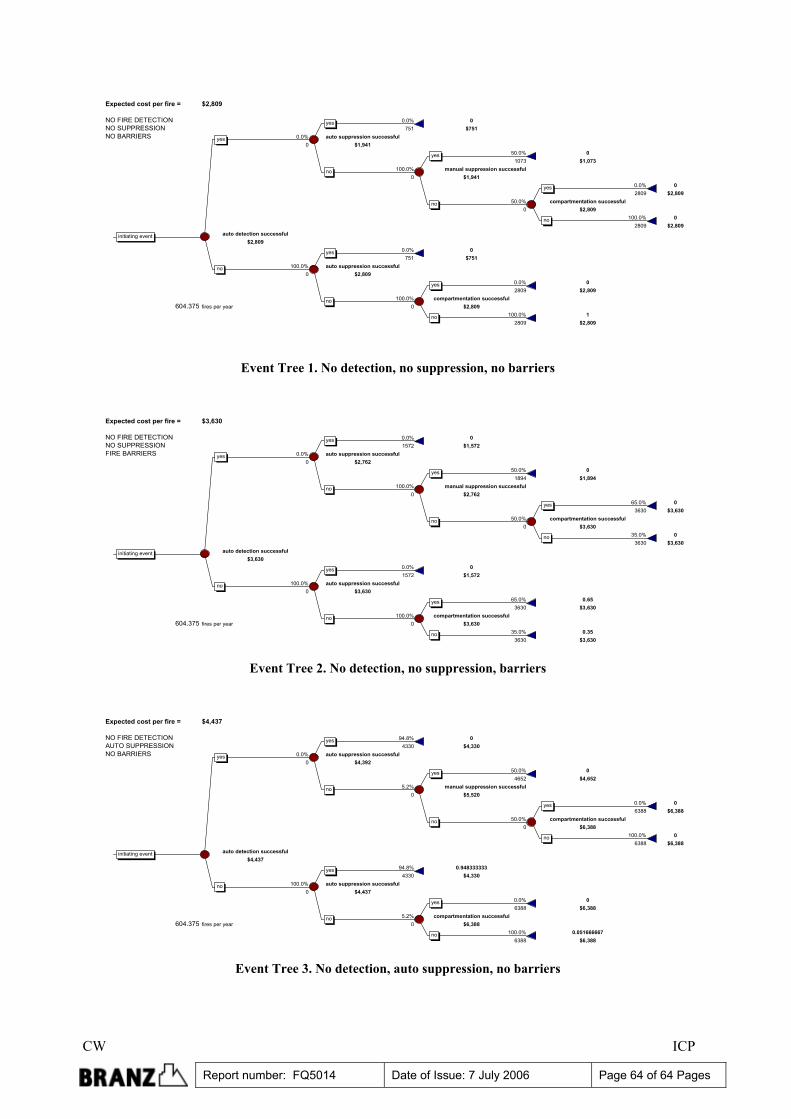
CW ICP
Report number: FQ5014 Date of Issue: 7 July 2006 Page 64 of 64 Pages
Expected cost per fire = $2,809
NO FIRE DETECTION 0.0% 0NO SUPPRESSION 751 $751NO BARRIERS 0.0% auto suppression successful
0 $1,94150.0% 0
1073 $1,073100.0% manual suppression successful
0 $1,9410.0% 02809 $2,809
50.0% compartmentation successful0 $2,809
100.0% 02809 $2,809
auto detection successful$2,809
0.0% 0751 $751
100.0% auto suppression successful0 $2,809
0.0% 02809 $2,809
100.0% compartmentation successful604.375 fires per year 0 $2,809
100.0% 12809 $2,809
initiating event
yes
no
yes
no
yes
no
yes
no
yes
no
yes
no
Event Tree 1. No detection, no suppression, no barriers
Expected cost per fire = $3,630
NO FIRE DETECTION 0.0% 0NO SUPPRESSION 1572 $1,572FIRE BARRIERS 0.0% auto suppression successful
0 $2,76250.0% 0
1894 $1,894100.0% manual suppression successful
0 $2,76265.0% 0
3630 $3,63050.0% compartmentation successful
0 $3,63035.0% 0
3630 $3,630auto detection successful
$3,6300.0% 01572 $1,572
100.0% auto suppression successful0 $3,630
65.0% 0.653630 $3,630
100.0% compartmentation successful604.375 fires per year 0 $3,630
35.0% 0.353630 $3,630
initiating event
yes
no
yes
no
yes
no
yes
no
yes
no
yes
no
Event Tree 2. No detection, no suppression, barriers
Expected cost per fire = $4,437
NO FIRE DETECTION 94.8% 0AUTO SUPPRESSION 4330 $4,330NO BARRIERS 0.0% auto suppression successful
0 $4,39250.0% 0
4652 $4,6525.2% manual suppression successful
0 $5,5200.0% 06388 $6,388
50.0% compartmentation successful0 $6,388
100.0% 06388 $6,388
auto detection successful$4,437
94.8% 0.9483333334330 $4,330
100.0% auto suppression successful0 $4,437
0.0% 06388 $6,388
5.2% compartmentation successful604.375 fires per year 0 $6,388
100.0% 0.0516666676388 $6,388
initiating event
yes
no
yes
no
yes
no
yes
no
yes
no
yes
no
Event Tree 3. No detection, auto suppression, no barriers
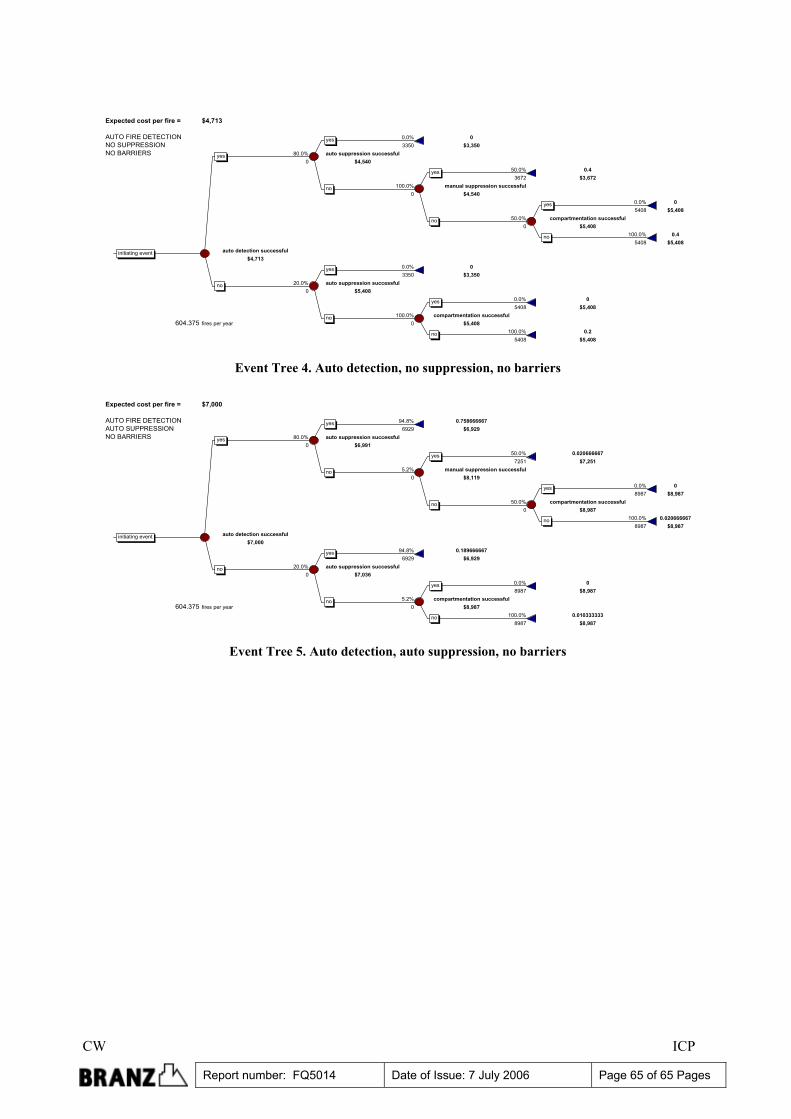
CW ICP
Report number: FQ5014 Date of Issue: 7 July 2006 Page 65 of 65 Pages
Expected cost per fire = $4,713
AUTO FIRE DETECTION 0.0% 0NO SUPPRESSION 3350 $3,350NO BARRIERS 80.0% auto suppression successful
0 $4,54050.0% 0.4
3672 $3,672100.0% manual suppression successful
0 $4,5400.0% 05408 $5,408
50.0% compartmentation successful0 $5,408
100.0% 0.45408 $5,408
auto detection successful$4,713
0.0% 03350 $3,350
20.0% auto suppression successful0 $5,408
0.0% 05408 $5,408
100.0% compartmentation successful604.375 fires per year 0 $5,408
100.0% 0.25408 $5,408
initiating event
yes
no
yes
no
yes
no
yes
no
yes
no
yes
no
Event Tree 4. Auto detection, no suppression, no barriers
Expected cost per fire = $7,000
AUTO FIRE DETECTION 94.8% 0.758666667AUTO SUPPRESSION 6929 $6,929NO BARRIERS 80.0% auto suppression successful
0 $6,99150.0% 0.020666667
7251 $7,2515.2% manual suppression successful
0 $8,1190.0% 08987 $8,987
50.0% compartmentation successful0 $8,987
100.0% 0.0206666678987 $8,987
auto detection successful$7,000
94.8% 0.1896666676929 $6,929
20.0% auto suppression successful0 $7,036
0.0% 08987 $8,987
5.2% compartmentation successful604.375 fires per year 0 $8,987
100.0% 0.0103333338987 $8,987
initiating event
yes
no
yes
no
yes
no
yes
no
yes
no
yes
no
Event Tree 5. Auto detection, auto suppression, no barriers


![Report on Proposals A2007— Copyright, NFPA NFPA 96 · John W. Rudd, Delaware State Fire Marshal Office, DE [E] (Alt. to R. T. Leicht) Rep. International Fire Marshals Association](https://img.pdfslide.us/doc/110x75/5e772625cdc5871398799907/report-on-proposals-a2007a-copyright-nfpa-nfpa-96-john-w-rudd-delaware-state.jpg)


![10-ROP-2002-Standard for Portable Fire Extinguishers · Gary A. Nadolny, Ansul Fire Protection/Tyco, WI [M] Rep. Fire Equipment Manufacturers’ Association ... can be applied to](https://img.pdfslide.us/doc/110x75/5b5385587f8b9a5a578c18a6/10-rop-2002-standard-for-portable-fire-extinguishers-gary-a-nadolny-ansul.jpg)

![[u] - NFPA · Louisiana State University, LA [ E] LouisJ. Amabili, Delaware State Fire School, DE [SEa Rep.'rhe Alliance for Fire and Emergency Mgrnt. Steven T. Edwards, Maryland](https://img.pdfslide.us/doc/110x75/5ec72d7f38d8e86675544ad3/u-nfpa-louisiana-state-university-la-e-louisj-amabili-delaware-state-fire.jpg)