Embed Size (px)
Citation preview
United StatesDepartmentof Agriculture
Forest Service
Rocky MountainRocky MountainRocky MountainRocky MountainRocky MountainResearch StationResearch StationResearch StationResearch StationResearch Station
General TechnicalReport RMRS-87
April 2002
Development of Coarse-ScaleSpatial Data for Wildland Fire
and Fuel ManagementKirsten M. SchmidtJames P. Menakis
Colin C. HardyWendel J. HannDavid L. Bunnell
Abstract
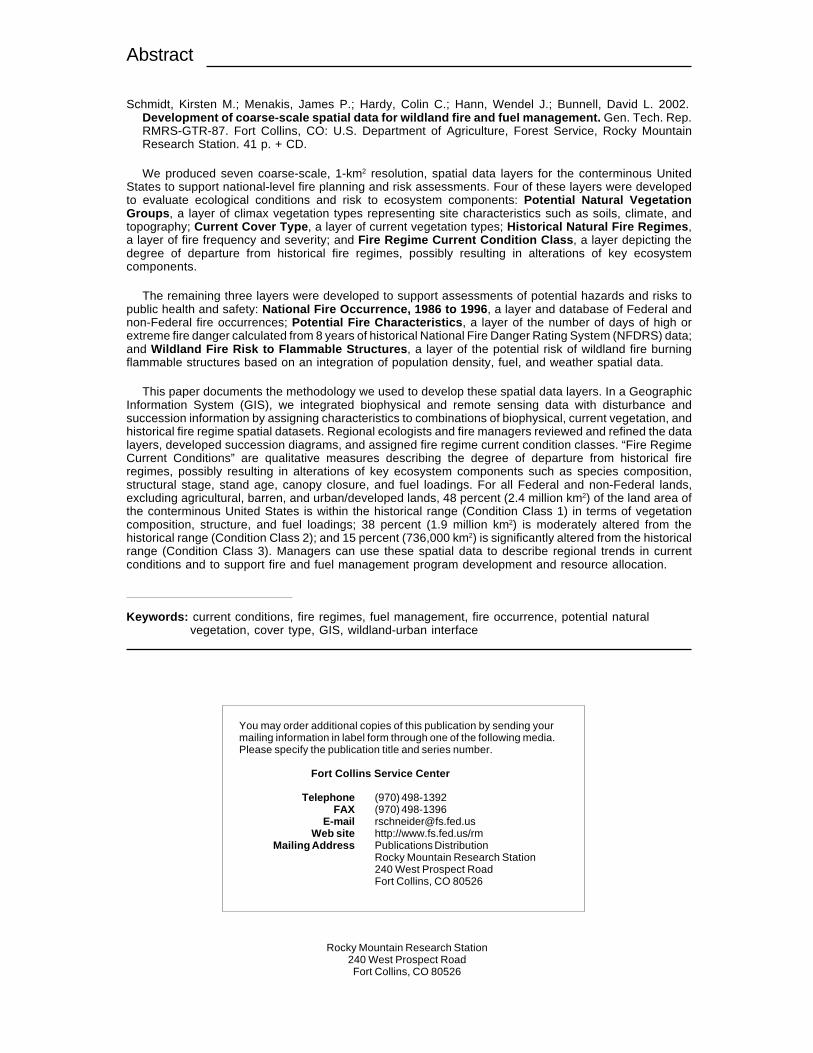
Schmidt, Kirsten M.; Menakis, James P.; Hardy, Colin C.; Hann, Wendel J.; Bunnell, David L. 2002.Development of coarse-scale spatial data for wildland fire and fuel management. Gen. Tech. Rep.RMRS-GTR-87. Fort Collins, CO: U.S. Department of Agriculture, Forest Service, Rocky MountainResearch Station. 41 p. + CD.
We produced seven coarse-scale, 1-km2 resolution, spatial data layers for the conterminous UnitedStates to support national-level fire planning and risk assessments. Four of these layers were developedto evaluate ecological conditions and risk to ecosystem components: Potential Natural VegetationGroups , a layer of climax vegetation types representing site characteristics such as soils, climate, andtopography; Current Cover Type , a layer of current vegetation types; Historical Natural Fire Regimes ,a layer of fire frequency and severity; and Fire Regime Current Condition Class , a layer depicting thedegree of departure from historical fire regimes, possibly resulting in alterations of key ecosystemcomponents.
The remaining three layers were developed to support assessments of potential hazards and risks topublic health and safety: National Fire Occurrence, 1986 to 1996 , a layer and database of Federal andnon-Federal fire occurrences; Potential Fire Characteristics , a layer of the number of days of high orextreme fire danger calculated from 8 years of historical National Fire Danger Rating System (NFDRS) data;and Wildland Fire Risk to Flammable Structures , a layer of the potential risk of wildland fire burningflammable structures based on an integration of population density, fuel, and weather spatial data.
This paper documents the methodology we used to develop these spatial data layers. In a GeographicInformation System (GIS), we integrated biophysical and remote sensing data with disturbance andsuccession information by assigning characteristics to combinations of biophysical, current vegetation, andhistorical fire regime spatial datasets. Regional ecologists and fire managers reviewed and refined the datalayers, developed succession diagrams, and assigned fire regime current condition classes. “Fire RegimeCurrent Conditions” are qualitative measures describing the degree of departure from historical fireregimes, possibly resulting in alterations of key ecosystem components such as species composition,structural stage, stand age, canopy closure, and fuel loadings. For all Federal and non-Federal lands,excluding agricultural, barren, and urban/developed lands, 48 percent (2.4 million km2) of the land area ofthe conterminous United States is within the historical range (Condition Class 1) in terms of vegetationcomposition, structure, and fuel loadings; 38 percent (1.9 million km2) is moderately altered from thehistorical range (Condition Class 2); and 15 percent (736,000 km2) is significantly altered from the historicalrange (Condition Class 3). Managers can use these spatial data to describe regional trends in currentconditions and to support fire and fuel management program development and resource allocation.
Keywords: current conditions, fire regimes, fuel management, fire occurrence, potential naturalvegetation, cover type, GIS, wildland-urban interface
You may order additional copies of this publication by sending yourmailing information in label form through one of the following media.Please specify the publication title and series number.
Fort Collins Service Center
Telephone (970) 498-1392FAX (970) 498-1396
E-mail [email protected] site http://www.fs.fed.us/rm
Mailing Address Publications DistributionRocky Mountain Research Station240 West Prospect RoadFort Collins, CO 80526
Rocky Mountain Research Station240 West Prospect RoadFort Collins, CO 80526
Authors
Kirsten M. Schmidt is a Resource Information Specialist with the USDA Forest Service at the Rocky Mountain ResearchStation, Fire Sciences Laboratory, P.O. Box 8089, Missoula, MT 59807; Phone 406-329-4957; FAX 406-329-4877; e-mail:[email protected]. She has worked on several research projects for the Fire Effects Research Unit involving GIS analysis andfield sampling for ecosystem management, gradient modeling, and fire behavior and effects modeling. She received her B.A.degree in biology from the University of Montana, Missoula, and is pursuing her Ph.D. degree in remote sensing from theUniversity of Montana.
James P. Menakis is a GIS Specialist with the USDA Forest Service at the Rocky Mountain Research Station, Fire SciencesLaboratory, P.O. Box 8089, Missoula, MT 59807; Phone 406-329-4958; FAX 406-329-4877; e-mail: [email protected]. Since1990, he has worked on various research projects relating to fire ecology at a community and landscape level for the Fire EffectsResearch Unit. He was the GIS Coordinator for the Landscape Ecology Team for the Interior Columbia River Basin ScientificAssessment Project, and was involved with mapping FARSITE layers for the Gila Wilderness and the Selway-BitterrootWilderness. He received his B.S. degree in forestry and his M.S. degree in environmental studies from the University of Montana,Missoula.
Colin C. Hardy is a Supervisory Research Forester in the Fire Effects Research Work Unit, Rocky Mountain Research Station,Fire Sciences Laboratory, Missoula, MT 59807. He is Team Leader for Landscape Analysis and Assessment, with emphasison remote sensing applications. His earlier work involved the characterization of smoke from wildland fires. He holds a B.S.degree in resource conservation from the University of Montana, School of Forestry, and an M.S. degree in forest managementfrom the University of Washington, College of Forest Resources. He is currently pursuing a Ph.D. degree in remote sensing atthe University of Montana, School of Forestry.
Wendel J. Hann is a Fire/Landscape Ecologist for the USDA Forest Service, Washington Office, Fire and Aviation Management,Pike-San Isabel National Forests, Leadville, CO 80461; Phone 719-486-3214; FAX 719-486-0928; e-mail: [email protected] 1998, his primary responsibilities have been in national ecosystem and fire risk assessment, technology development andtransfer, and land management planning and implementation. He was a member of the Interior Columbia Basin Science Teamand Lead for Landscape Assessment at the Pacific Northwest Research Station. He worked for the Northern Region of the ForestService in the Ecosystem Management Group, developing and implementing ecological and fire management applications. Hetaught ecology at the University of Idaho and served in the U.S. Navy for 4 years. He received a B.S. degree in range and wildlifemanagement, and an M.S. degree in forest and watershed science from Washington State University, Pullman, and a Ph.D.degree in forest, wildlife, and range ecology from the University of Idaho, Moscow.
David L. Bunnell is the National Fire Use Program Manager with the USDA Forest Service at the National Interagency FireCenter (NIFC), 3833 S. Development Ave., Boise, ID 83705; Phone 208-387-5218; FAX 208-387-5398; e-mail: [email protected] started his career in the Forest Service as a seasonal Fire Guard, Biological Technician, Forestry Technician, and ResearchTechnician in Alaska and Montana. From 1972 to 1978, he worked in wilderness fire planning, fire effects, and physical fuelproperties. He was a Forest Fuel Specialist at the Lolo National Forest where he assisted in the early development of aerialignition devices, prescribed fire planning, and economic risk considerations of prescribed fire applications. He was Fire Staff,Wildlife and Fisheries Staff, and Fire and Ecology Staff Officer on the Flathead National Forest, working in interagencycentralized dispatch and on implementation of prescribed natural fire policy in wilderness areas. As National Fuel Specialist atNIFC, his responsibilities included prescribed fire applications and fire policy implementation. In 1999, he became the NationalFire Use Program Manager with responsibilities in prescribed fire applications and wildland fire use. He received a B.S. degreein forestry from the University of Montana.

Development of Coarse-Scale Spatial Data for WildlandFire and Fuel Management
Kirsten M. SchmidtJames P. MenakisColin C. HardyWendel J. Hann
David L. Bunnell
Rocky Mountain Research StationUSDA Forest Service
Fire Sciences LaboratoryP.O. Box 8089
Missoula, MT 59807Phone: (406) 329-4957, FAX: (406) 329-4877
USDA Forest ServiceGeneral Technical Report RMRS-GTR-87. April 2002
iii

Contents
INTRODUCTION ..................................................................................................................................................... 1Scale and Use of Data............................................................................................................................................ 2
METHODS ................................................................................................................................................................ 2Data Layer Development ....................................................................................................................................... 2
Vegetation and Biophysical Data Layer Development ......................................................................................21. Integrate multiple data layers................................................................................................................ 2
ECOHUC Sections ................................................................................................................................ 3ECORegions .......................................................................................................................................... 3Küchler Potential Natural Vegetation Groups ....................................................................................... 3Historical Natural Fire Regimes ............................................................................................................ 4Current Cover Types .............................................................................................................................. 6Forest Density Classes ........................................................................................................................... 6
2. Develop succession diagrams.................................................................................................................. 63. Map spatial data layers from succession diagrams.............................................................................. 74. Review and refine final maps................................................................................................................. 7
Version 2000 .......................................................................................................................................... 8Supplementary Data Layer Development.......................................................................................................... 8
National fire occurrence, 1986 to 1996...................................................................................................... 8Federal Fire Occurrence Database ........................................................................................................ 8Non-Federal Fire Database .................................................................................................................... 9
Potential fire characteristics..................................................................................................................... 10Wildland fire risk to flammable structures ............................................................................................. 12
RESULTS ................................................................................................................................................................ 12Vegetation and Biophysical Data Layers ............................................................................................................. 12Supplementary Data Layers ................................................................................................................................ 15
National Fire Occurrence, 1986 to 1996......................................................................................................... 15Potential Fire Characteristics......................................................................................................................... 15Wildland Fire Risk to Flammable Structures.................................................................................................. 15
DISCUSSION.......................................................................................................................................................... 16Vegetation and Biophysical Data Layers ............................................................................................................. 16Supplementary Data Layers ................................................................................................................................ 16
National Fire Occurrence, 1986 to 1996......................................................................................................... 16Potential Fire Characteristics......................................................................................................................... 17Wildland Fire Risk to Flammable Structures.................................................................................................. 17
Accuracy and Verification ................................................................................................................................... 17
MANAGEMENT IMPLICATIONS........................................................................................................................ 18
CONCLUSIONS ..................................................................................................................................................... 18
ACKNOWLEDGMENTS ....................................................................................................................................... 18
REFERENCES ........................................................................................................................................................ 19
APPENDIX A: Potential Natural Vegetation Groups (after Küchler 1975)........................................................... 22
APPENDIX B: Current Cover Types (from LCC database, 1990, and RPA Forest Cover Types, 1992). ............. 28
APPENDIX C: Example of a Succession Diagram Summary Report ................................................................... 29
APPENDIX D: Federal and Non-Federal Fire Occurrence Per State, 1986 to 1996 ............................................. 30
APPENDIX E: National Fire Occurrence GIS Database Fields ............................................................................ 31
APPENDIX F: Non-Federal Fire Data Completeness ........................................................................................... 32
APPENDIX G: All Maps........................................................................................................................................ 34
v

USDA Forest Service General Technical Report RMRS-GTR-87. 2002. 1
INTRODUCTION
Over 90 years of fire exclusion, grazing by domestic live-stock, logging, and widespread establishment of exotic specieshave altered fire regimes, fuel loadings, and vegetation com-position and structure (Barrett and others 1991; Brown andothers 1994; Ford and McPherson 1999; West 1994; Whisenant1990). As a result, the number, size, and intensity of wildfireshave been altered (U.S. GAO 1999; Vail 1994). Fire managersrecognize the need to reduce excessive fuel accumulations todecrease the threat of catastrophic wildfires (USDA ForestService 2000), but lack national-level spatial data to supportmanagement plans to reduce fuels as well as to conserve andrestore ecosystems. To accomplish fire and fuel managementgoals, managers need answers to the following questions:
• How do current vegetation and fuels differ from those thatexisted historically?
• Where on the landscape do vegetation and fuels differ fromhistorical levels? In particular, where are high fuel accu-mulations?
• When considered at a coarse scale, which areas estimatedto have high fuel accumulations represent the highest pri-orities for treatment?
The objective of this study was to provide managers withnational-level data on current conditions of vegetation and fuelsdeveloped from ecologically based methods to address thesequestions.
This mapping effort was initiated as two associated projectsunder the auspices of the Fire Modeling Institute at the FireSciences Laboratory, Rocky Mountain Research Station,Missoula, MT. The first project, Fire Regimes for Fuels Man-agement and Fire Use, began in 1997 through an agreementwith the U.S. Department of Agriculture, Forest Service(USFS), State and Private Forestry, and USFS Fire and Avia-tion Management. The second project, Ecosystems at Risk,was undertaken to add a fire-related component to the USFS’sForests at Risk project. The Joint Fire Sciences Program sub-sequently funded these two projects to develop several
additional spatial data layers (in other words, coverages, a setof thematic data, usually representing a single subject mat-ter). In the context of these projects, risk was defined as “therelative risk of losing key components that define an ecosystem.”
We mapped fire regime current condition classes and his-torical fire regimes using the methodology of assigningecosystem characteristics to combinations of biophysical andvegetation spatial data layers. “Biophysical data” describesphysiographic and ecological characteristics of the landscape.“Fire Regime Current Conditions” are qualitative measuresdescribing the degree of departure from historical fire regimes,possibly resulting in alterations of key ecosystem componentssuch as species composition, structural stage, stand age, canopyclosure, and fuel loadings. One or more activities may havecaused this departure: fire exclusion, timber harvesting, live-stock grazing, introduction and establishment of exotic plantspecies, introduced insects and disease, or other managementactivities. The advantages of the methodology of assigningecosystem characteristics to combinations of biophysical andvegetation spatial data layers include the familiarity that manyland managers have with biophysical and vegetation classifi-cations, the large body of research that utilizes thismethodology, and the applicability of this methodology tomultiple spatial scales. Quigley and others (1996) used a bio-physical layer, potential vegetation, and two vegetation layers,cover type and structural stage, to describe ecosystem charac-teristics such as fuel characteristics, wildlife habitat, firepotential, and hydrology. Keane and others (1998, 2000) useda similar suite of biophysical and vegetation layers to assignfuel characteristics to the Selway-Bitterroot Wilderness, Mon-tana, and the Gila Wilderness, New Mexico.
To assess fire regime current conditions, we needed abaseline of conditions from which to compare. A critical datalayer developed to assess current conditions and departure fromhistorical conditions was the “Historical Natural Fire Regimes”layer. Fire regimes describe historical fire conditions underwhich vegetation communities have evolved and have beenmaintained (Hardy and others 1998). Historical natural fireregime data are not exact reconstructions of historical condi-tions, defined here as conditions existing before extensive
Development of Coarse-Scale Spatial Data forWildland Fire and Fuel Management
Kirsten M. SchmidtJames P. MenakisColin C. HardyWendel J. Hann
David L. Bunnell
2 USDA Forest Service General Technical Report RMRS-GTR-87. 2002.
pre-Euro-American settlement (pre-1900), but rather reflecttypical fire frequencies and effects that evolved in the absenceof fire suppression (Hardy and others 1998). We used fire fre-quency and severity measures to determine departure fromhistorical conditions, a context necessary to construct succes-sion diagrams and assign fire regime current condition classes.Regional ecologists and fire managers assigned current con-dition classes to succession diagrams for combinations ofpotential vegetation type, current cover type, forest density,and historical fire regime spatial data. Managers will use thespatial data from this project to allocate resources to maintainor restore areas to historical conditions.
Scale and Use of Data
The objectives of this mapping project were to providenational-level data on the current condition of fuel and veg-etation. Therefore, the data are most useful at that scale. Theend products were not intended to be used at scales other thana coarse scale. While aggregating spatial data from fine scalesto coarse scales is a well-documented practice, convertingcoarse scale data to finer scales is not recommended (Bian1997; Bian and Butler 1999; Turner and others 1989; Weins1989). The large cell size (1-km2) combined with the coarsemap scale (approximately 1:2,000,000) of these data prod-ucts provide appropriate detail when viewed in their entiretyor at a regional scale, but details expected at finer scales willbe lacking. Zhu and Evans (1992) explicitly stated that the“end products are not intended to be absolute or precise interms of accuracy in minute detail. It is the regional perspec-tive and analysis that are most important in using the maps.”This statement addresses the appropriate use of the ResourcePlanning Act’s Forest Type Groups and Forest Density layers,two of the primary data layers used to develop our products.Our data products carry the same qualification.
METHODS
Data Layer Development
This section describes the methods used to develop theseven fuel management spatial data layers. Five of these sevenlayers were the result of integrating and modifying severalpre-existing vegetation and biophysical spatial data layers:
• Potential Natural Vegetation Groups, a spatial layer ofclimax vegetation types representing site characteristicssuch as soils, climate, and topography.
• Current Cover Type, a spatial layer of current vegetationtypes.
• Historical Natural Fire Regimes, a spatial layer of firefrequency and severity.
• Fire Regime Current Condition Class, a spatial layerdepicting the degree of departure from historical fire
regimes, possibly resulting in alterations of key ecosystemcomponents.
• Wildland Fire Risk to Flammable Structures, a spatiallayer of the potential risk of wildland fire burning flam-mable structures based on an integration of populationdensity, fuel, and weather spatial data.
In addition to the five vegetation and biophysical layers,two additional layers were developed to support assessmentsof potential hazards and risks to public health and safety:
• National Fire Occurrence, 1986 to 1996, a spatial layerand database of Federal and non-Federal fire occurrences.
• Potential Fire Characteristics, a spatial layer of the num-ber of days of high or extreme fire danger calculated from 8years of historical National Fire Danger Rating System(NFDRS) data.
Four steps were used to develop the five vegetation andbiophysical layers (Potential Natural Vegetation Groups, Cur-rent Cover Types, Historical Natural Fire Regimes, and FireRegime Current Condition Classes):
1. Integrate multiple spatial data layers.
2. Regional experts develop succession diagrams.Transfer spatial data to succession diagrams.Assign relative departure index.Assign current condition classes.
3. Map spatial data layers from succession diagrams.
4. Review and refine final maps.
Vegetation and Biophysical Data LayerDevelopment
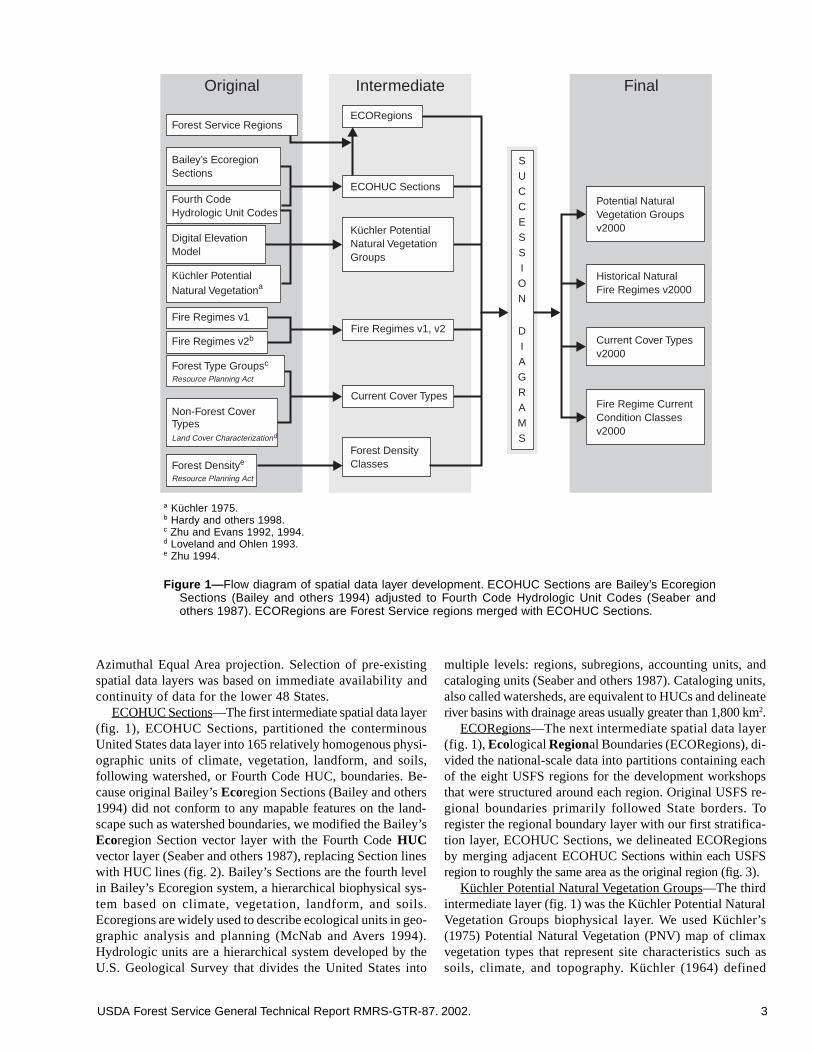
1. Integrate multiple data layers—We integrated andmodified several pre-existing spatial data layers, Bailey’sEcoregion Sections (Bailey and others 1994), Fourth CodeHydrologic Units (HUC) (Seaber and others 1987), USFS re-gional boundaries, a Digital Elevation Model (DEM) (USGS1994), Küchler’s Potential Natural Vegetation map (1975), ear-lier versions of fire regime maps, Forest and Range ResourcePlanning Act’s (RPA) layer of U.S. Forest Types Groups (Zhuand Evans 1992,1994; Powell and others 1992) for forest covertypes, the Land Cover Characteristics Database (Loveland andothers 1991) layer for nonforest cover types, and the RPA For-est Density layer, to derive final vegetation and biophysicallayers (fig. 1). We developed six intermediate layers, two(ECOHUC and ECORegion) of which were not final prod-ucts but were used to partition the landscape into coarsebiophysical units (fig. 1). Three of the intermediate layers (Po-tential Natural Vegetation Groups, Current Cover Types, andHistorical Natural Fire Regimes) were modified in the suc-cession diagram process detailed below to become the finallayers (fig. 1). The last intermediate layer (Forest Density Classes)was used in the succession diagram process, but was not a finallayer (fig. 1). All working and final spatial data layers were con-verted to 1-km2 pixel raster layers and projected to the Lambert
USDA Forest Service General Technical Report RMRS-GTR-87. 2002. 3
Azimuthal Equal Area projection. Selection of pre-existingspatial data layers was based on immediate availability andcontinuity of data for the lower 48 States.
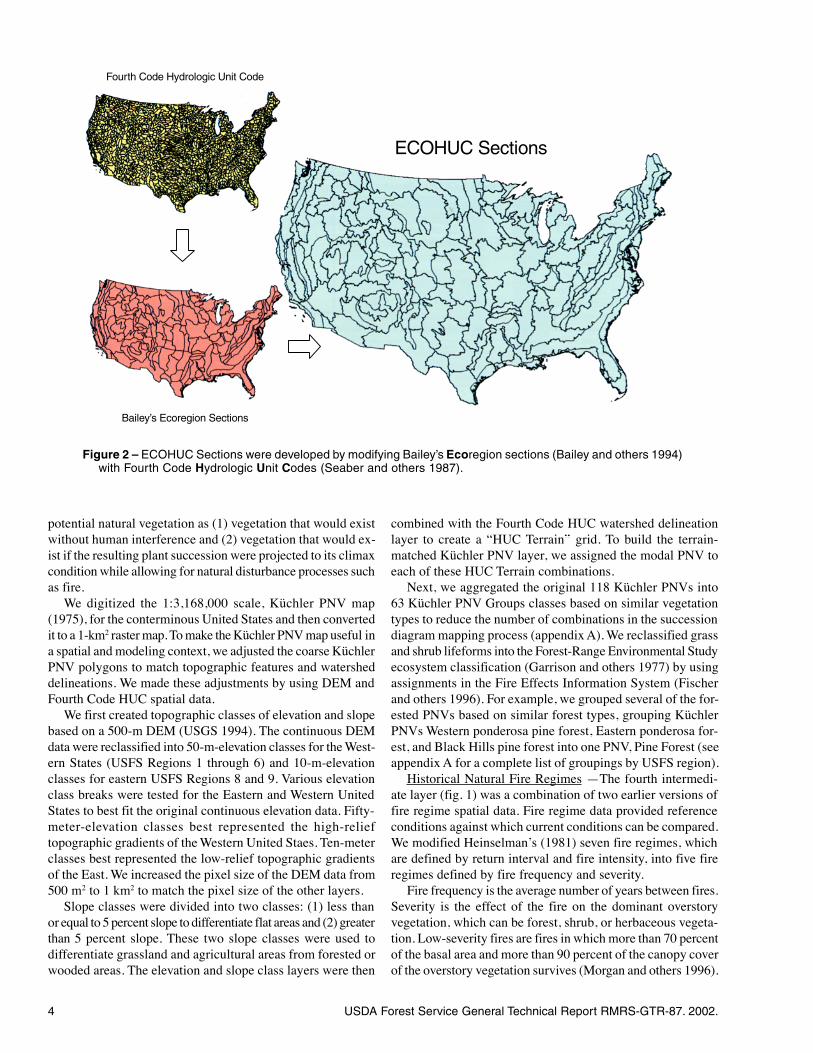
ECOHUC Sections—The first intermediate spatial data layer(fig. 1), ECOHUC Sections, partitioned the conterminousUnited States data layer into 165 relatively homogenous physi-ographic units of climate, vegetation, landform, and soils,following watershed, or Fourth Code HUC, boundaries. Be-cause original Bailey’s Ecoregion Sections (Bailey and others1994) did not conform to any mapable features on the land-scape such as watershed boundaries, we modified the Bailey’sEcoregion Section vector layer with the Fourth Code HUCvector layer (Seaber and others 1987), replacing Section lineswith HUC lines (fig. 2). Bailey’s Sections are the fourth levelin Bailey’s Ecoregion system, a hierarchical biophysical sys-tem based on climate, vegetation, landform, and soils.Ecoregions are widely used to describe ecological units in geo-graphic analysis and planning (McNab and Avers 1994).Hydrologic units are a hierarchical system developed by theU.S. Geological Survey that divides the United States into
multiple levels: regions, subregions, accounting units, andcataloging units (Seaber and others 1987). Cataloging units,also called watersheds, are equivalent to HUCs and delineateriver basins with drainage areas usually greater than 1,800 km2.
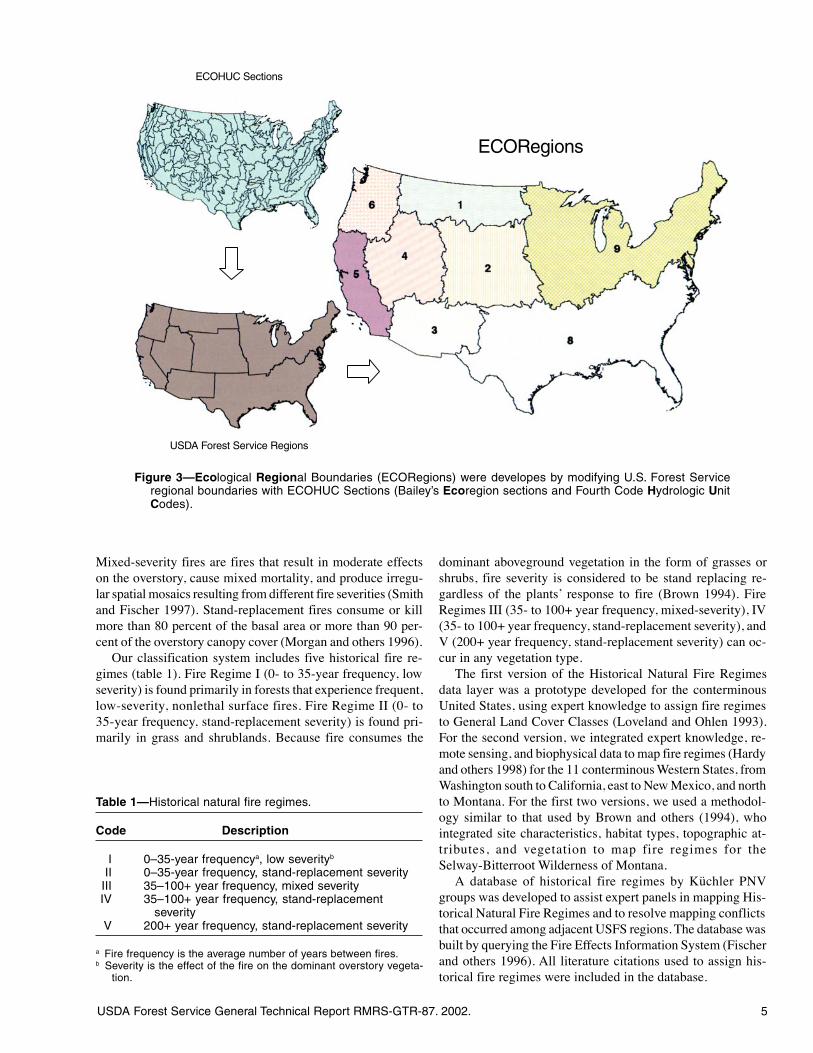
ECORegions—The next intermediate spatial data layer(fig. 1), Ecological Regional Boundaries (ECORegions), di-vided the national-scale data into partitions containing eachof the eight USFS regions for the development workshopsthat were structured around each region. Original USFS re-gional boundaries primarily followed State borders. Toregister the regional boundary layer with our first stratifica-tion layer, ECOHUC Sections, we delineated ECORegionsby merging adjacent ECOHUC Sections within each USFSregion to roughly the same area as the original region (fig. 3).
Küchler Potential Natural Vegetation Groups—The thirdintermediate layer (fig. 1) was the Küchler Potential NaturalVegetation Groups biophysical layer. We used Küchler’s(1975) Potential Natural Vegetation (PNV) map of climaxvegetation types that represent site characteristics such assoils, climate, and topography. Küchler (1964) defined
a Küchler 1975.b Hardy and others 1998.c Zhu and Evans 1992, 1994.d Loveland and Ohlen 1993.e Zhu 1994.
Figure 1— Flow diagram of spatial data layer development. ECOHUC Sections are Bailey’s EcoregionSections (Bailey and others 1994) adjusted to Fourth Code Hydrologic Unit Codes (Seaber andothers 1987). ECORegions are Forest Service regions merged with ECOHUC Sections.
Forest Service Regions
Fire Regimes v1
Non-Forest CoverTypes
Resource Planning Act
Resource Planning Act
Land Cover Characterizationd
Fire Regimes v2b
Forest Type Groupsc
Forest Densitye
Bailey’s EcoregionSections
Fourth CodeHydrologic Unit Codes
Digital ElevationModel
Küchler PotentialNatural Vegetationa
ECOHUC Sections
ECORegions
Küchler PotentialNatural VegetationGroups
Potential NaturalVegetation Groupsv2000
Historical NaturalFire Regimes v2000
Current Cover Typesv2000
Fire Regime CurrentCondition Classesv2000
Forest DensityClasses
Fire Regimes v1, v2
Current Cover Types
SUCCESSION
DIAGRAMS
Original Intermediate Final
4 USDA Forest Service General Technical Report RMRS-GTR-87. 2002.
potential natural vegetation as (1) vegetation that would existwithout human interference and (2) vegetation that would ex-ist if the resulting plant succession were projected to its climaxcondition while allowing for natural disturbance processes suchas fire.
We digitized the 1:3,168,000 scale, Kuchler PNV map(1975), for the conterminous United States and then convertedit to a 1-km2 raster map. To make the Kuchler PNV map useful ina spatial and modeling context, we adjusted the coarse KuchlerPNV polygons to match topographic features and watersheddelineations. We made these adjustments by using DEM andFourth Code HUC spatial data.
We first created topographic classes of elevation and slopebased on a 500-m DEM (USGS 1994). The continuous DEMdata were reclassified into 50-m-elevation classes for the West-ern States (USFS Regions 1 through 6) and 10-m-elevationclasses for eastern USFS Regions 8 and 9. Various elevationclass breaks were tested for the Eastern and Western UnitedStates to best fit the original continuous elevation data. Fifty-meter-elevation classes best represented the high-relieftopographic gradients of the Western United Staes. Ten-meterclasses best represented the low-relief topographic gradientsof the East. We increased the pixel size of the DEM data from500 m2 to 1 km2 to match the pixel size of the other layers.
Slope classes were divided into two classes: (1) less thanor equal to 5 percent slope to differentiate flat areas and (2) greaterthan 5 percent slope. These two slope classes were used todifferentiate grassland and agricultural areas from forested orwooded areas. The elevation and slope class layers were then
combined with the Fourth Code HUC watershed delineationlayer to create a “HUC Terrain” grid. To build the terrain-matched Kuchler PNV layer, we assigned the modal PNV toeach of these HUC Terrain combinations.
Next, we aggregated the original 118 Kuchler PNVs into63 Kuchler PNV Groups classes based on similar vegetationtypes to reduce the number of combinations in the successiondiagram mapping process (appendix A). We reclassified grassand shrub lifeforms into the Forest-Range Environmental Studyecosystem classification (Garrison and others 1977) by usingassignments in the Fire Effects Information System (Fischerand others 1996). For example, we grouped several of the for-ested PNVs based on similar forest types, grouping KuchlerPNVs Western ponderosa pine forest, Eastern ponderosa for-est, and Black Hills pine forest into one PNV, Pine Forest (seeappendix A for a complete list of groupings by USFS region).
Historical Natural Fire Regimes —The fourth intermedi-ate layer (fig. 1) was a combination of two earlier versions offire regime spatial data. Fire regime data provided referenceconditions against which current conditions can be compared.We modified Heinselman’s (1981) seven fire regimes, whichare defined by return interval and fire intensity, into five fireregimes defined by fire frequency and severity.
Fire frequency is the average number of years between fires.Severity is the effect of the fire on the dominant overstoryvegetation, which can be forest, shrub, or herbaceous vegeta-tion. Low-severity fires are fires in which more than 70 percentof the basal area and more than 90 percent of the canopy coverof the overstory vegetation survives (Morgan and others 1996).
Figure 2 – ECOHUC Sections were developed by modifying Bailey’s Ecoregion sections (Bailey and others 1994)with Fourth Code Hydrologic Unit Codes (Seaber and others 1987).
Fourth Code Hydrologic Unit Code
Bailey’s Ecoregion Sections
ECOHUC Sections
¨
¨¨
¨
¨¨
¨
USDA Forest Service General Technical Report RMRS-GTR-87. 2002. 5
Mixed-severity fires are fires that result in moderate effectson the overstory, cause mixed mortality, and produce irregu-lar spatial mosaics resulting from different fire severities (Smithand Fischer 1997). Stand-replacement fires consume or killmore than 80 percent of the basal area or more than 90 per-cent of the overstory canopy cover (Morgan and others 1996).
Our classification system includes five historical fire re-gimes (table 1). Fire Regime I (0- to 35-year frequency, lowseverity) is found primarily in forests that experience frequent,low-severity, nonlethal surface fires. Fire Regime II (0- to35-year frequency, stand-replacement severity) is found pri-marily in grass and shrublands. Because fire consumes the
dominant aboveground vegetation in the form of grasses orshrubs, fire severity is considered to be stand replacing re-gardless of the plants’ response to fire (Brown 1994). FireRegimes III (35- to 100+ year frequency, mixed-severity), IV(35- to 100+ year frequency, stand-replacement severity), andV (200+ year frequency, stand-replacement severity) can oc-cur in any vegetation type.
The first version of the Historical Natural Fire Regimesdata layer was a prototype developed for the conterminousUnited States, using expert knowledge to assign fire regimesto General Land Cover Classes (Loveland and Ohlen 1993).For the second version, we integrated expert knowledge, re-mote sensing, and biophysical data to map fire regimes (Hardyand others 1998) for the 11 conterminous Western States, fromWashington south to California, east to New Mexico, and northto Montana. For the first two versions, we used a methodol-ogy similar to that used by Brown and others (1994), whointegrated site characteristics, habitat types, topographic at-tributes, and vegetation to map fire regimes for theSelway-Bitterroot Wilderness of Montana.
A database of historical fire regimes by Kuchler PNVgroups was developed to assist expert panels in mapping His-torical Natural Fire Regimes and to resolve mapping conflictsthat occurred among adjacent USFS regions. The database wasbuilt by querying the Fire Effects Information System (Fischerand others 1996). All literature citations used to assign his-torical fire regimes were included in the database.
Table 1—Historical natural fire regimes.
Code Description
I 0–35-year frequencya, low severityb
II 0–35-year frequency, stand-replacement severityIII 35–100+ year frequency, mixed severityIV 35–100+ year frequency, stand-replacement
severityV 200+ year frequency, stand-replacement severity
a Fire frequency is the average number of years between fires.b Severity is the effect of the fire on the dominant overstory vegeta-
tion.
Figure 3—Ecological Regional Boundaries (ECORegions) were developes by modifying U.S. Forest Serviceregional boundaries with ECOHUC Sections (Bailey’s Ecoregion sections and Fourth Code Hydrologic UnitCodes).
USDA Forest Service Regions
ECOHUC Sections
ECORegions
¨
6 USDA Forest Service General Technical Report RMRS-GTR-87. 2002.
Current Cover Types—The fifth intermediate layer (fig. 1)was the Current Cover Type layer (appendix B). We used twoexisting remote sensing vegetation data layers to develop anintegrated Current Cover Type layer: (1) the Forest and RangeResource Planning Act’s layer of U.S. Forest Type Groups(Powell and others 1992; Zhu and Evans 1992, 1994) forforest cover types and (2) the Land Cover Characteristics Da-tabase (Loveland and others 1991; conterminous U.S. landcover characteristics dataset 1990) for nonforest cover types.Both data layers were derived from 1-km2 resolution AdvancedVery High Resolution Radiometry (AVHRR) satellite imag-ery. The Forest Type Groups layer was selected for forest covertypes because it was based on intensive field data. Also, de-scriptions of the Forest Type Groups could be found in ForestResources of the United States (Powell and others 1992). For-est types were also cross-referenced with the Society ofAmerican Foresters’ Forest Cover Types of the United Statesand Canada (Eyre 1980).
In 1992, the USFS Southern Forest Experiment Station,Forest Inventory and Analysis Unit, developed a layer of for-est types of the United States under the Forest and RangelandRenewable Resources Planning Act (RPA) (Powell and others1992; Zhu and Evans 1992, 1994). Because the Forest TypeGroups layer represented only forested areas, we used thenonforest cover types of the Land Cover CharacterizationDatabase (Loveland and others 1991), to fill in the remainingnonforested areas.
In the development of the Western States fire regime layerdescribed above, Hardy and others (1998) used the 26 Gen-eral Land Cover Types (GLCTs) (Loveland and Ohlen 1993)aggregated from the 159 Land Cover Characterization Classes,expanding one of the classes, Western Coniferous Forest, intothree subclasses: short-needle conifer, long needle conifer, andmixed short- and long-needle conifer. We combined the Hardyand others (1998) GLCT layer with the Forest Type Groupslayer to produce an intermediate cover type layer. All nonforestareas of the Forest Type Groups layer were replaced with for-est GLCTs.
Forest Density Classes—The last intermediate layer (fig. 1)was a classification of forest density developed for the 1992RPA assessment. We used this forest density data as a surro-gate for forest structure because no spatial layer of foreststructure for the conterminous United States existed and it wasbeyond the scope of this project to develop such a product.The layer was developed from several regression analysesbetween coregistered 1991 AVHRR data and classifiedLANDSAT Thematic Mapper data (Zhu 1994). Forest densitywas defined as the proportion of 28.5-m2 LANDSAT ThematicMapper cells per 1-km2 AVHRR cell that was forested (Zhu1994). We classified the continuous forest density values,which ranged from 0 to 100 percent, into four density classes:0 = nonforest, 1 = 0 to 32 percent, 2 = 33 to 66 percent, and3 = 67 to 100 percent. All nonforest cover types were assignedthe nonforest density class.
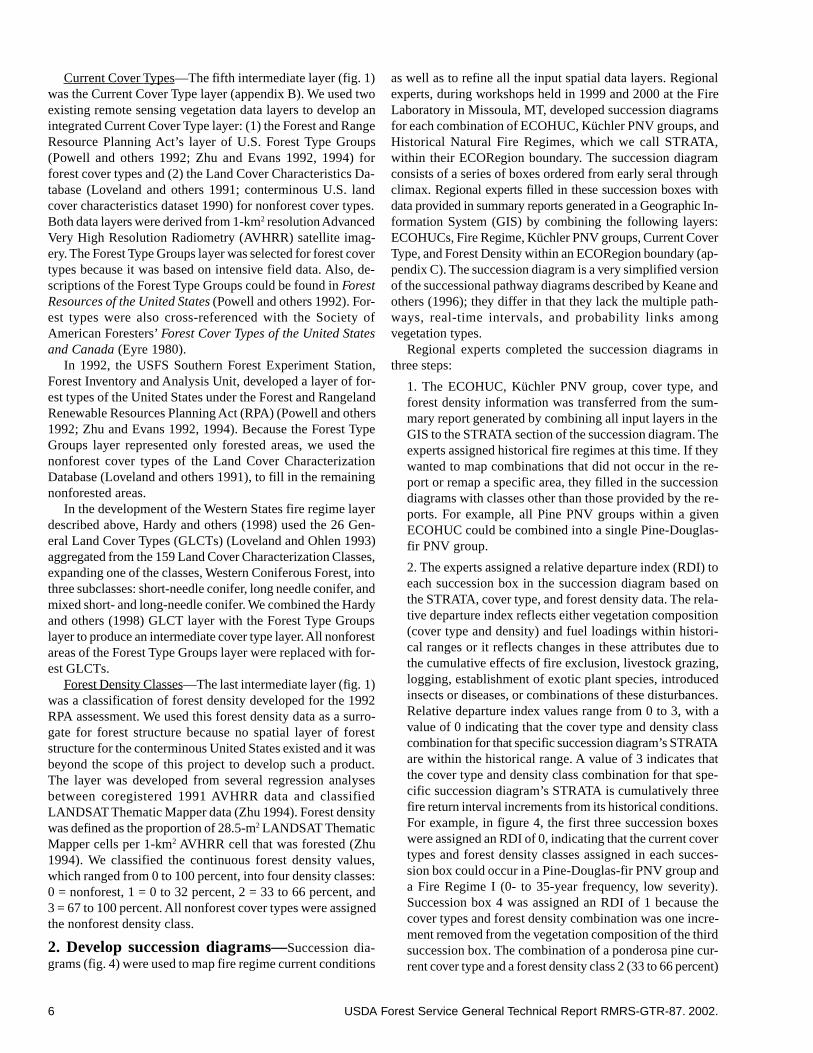
2. Develop succession diagrams—Succession dia-grams (fig. 4) were used to map fire regime current conditions
as well as to refine all the input spatial data layers. Regionalexperts, during workshops held in 1999 and 2000 at the FireLaboratory in Missoula, MT, developed succession diagramsfor each combination of ECOHUC, Küchler PNV groups, andHistorical Natural Fire Regimes, which we call STRATA,within their ECORegion boundary. The succession diagramconsists of a series of boxes ordered from early seral throughclimax. Regional experts filled in these succession boxes withdata provided in summary reports generated in a Geographic In-formation System (GIS) by combining the following layers:ECOHUCs, Fire Regime, Küchler PNV groups, Current CoverType, and Forest Density within an ECORegion boundary (ap-pendix C). The succession diagram is a very simplified versionof the successional pathway diagrams described by Keane andothers (1996); they differ in that they lack the multiple path-ways, real-time intervals, and probability links amongvegetation types.
Regional experts completed the succession diagrams inthree steps:
1. The ECOHUC, Küchler PNV group, cover type, andforest density information was transferred from the sum-mary report generated by combining all input layers in theGIS to the STRATA section of the succession diagram. Theexperts assigned historical fire regimes at this time. If theywanted to map combinations that did not occur in the re-port or remap a specific area, they filled in the successiondiagrams with classes other than those provided by the re-ports. For example, all Pine PNV groups within a givenECOHUC could be combined into a single Pine-Douglas-fir PNV group.
2. The experts assigned a relative departure index (RDI) toeach succession box in the succession diagram based onthe STRATA, cover type, and forest density data. The rela-tive departure index reflects either vegetation composition(cover type and density) and fuel loadings within histori-cal ranges or it reflects changes in these attributes due tothe cumulative effects of fire exclusion, livestock grazing,logging, establishment of exotic plant species, introducedinsects or diseases, or combinations of these disturbances.Relative departure index values range from 0 to 3, with avalue of 0 indicating that the cover type and density classcombination for that specific succession diagram’s STRATAare within the historical range. A value of 3 indicates thatthe cover type and density class combination for that spe-cific succession diagram’s STRATA is cumulatively threefire return interval increments from its historical conditions.For example, in figure 4, the first three succession boxeswere assigned an RDI of 0, indicating that the current covertypes and forest density classes assigned in each succes-sion box could occur in a Pine-Douglas-fir PNV group anda Fire Regime I (0- to 35-year frequency, low severity).Succession box 4 was assigned an RDI of 1 because thecover types and forest density combination was one incre-ment removed from the vegetation composition of the thirdsuccession box. The combination of a ponderosa pine cur-rent cover type and a forest density class 2 (33 to 66 percent)
USDA Forest Service General Technical Report RMRS-GTR-87. 2002. 7
could not have occurred unless at least one fire return in-terval was missed. Succession box 5 was assigned an RDIof 2 because the combination of a ponderosa pine currentcover type and a forest density class 3 (67 to 100 percent)was one increment from succession box 4, which was as-signed an RDI of 1.
3. Once the relative departure index was assigned, the re-gional experts completed the succession diagram byassigning a fire regime current condition class (table 2),which was based on the STRATA, species composition,forest density, and RDI found in each succession box. Forexample, succession box 4 (fig. 4) was assigned CurrentCondition class 2, indicating that the ecosystem compo-nents have been moderately altered from historicalconditions due to the disturbances mentioned above.
3. Map spatial data layers from succession dia-grams—All succession diagram assignments and changeswere loaded into a database containing all STRATA, currentcover types, and forest density combinations within theECORegion boundaries and linked to a master spatial layer.This database also contained changes made to the cover type,potential natural vegetation groups, and fire regime layerscompleted during the succession diagram development. We
generated new spatial data layers of historical natural fireregime, Küchler PNV groups, current cover types, and cur-rent condition classes for each ECORegion from the masterspatial layer and database, then merged all ECORegions tocreate the conterminous United States layers of PotentialNatural Vegetation Groups, Current Cover Types, Histori-cal Natural Fire Regimes, and Current Condition Classes(appendix G).
4. Review and refine final maps—The final steps inthe development of the vegetation-based data layers involvedsending the maps produced from the workshops to the regionalexperts for review and refinement. Maps included theirECORegion boundary and the surrounding regions, allowingthe experts to review how their assignments compared to otherregions.
The final step in the editing process was to resolve edgeeffects among ECORegion boundaries. Edge effects resultedfrom different groups of experts making layer assignments,causing disagreement between adjacent region boundaries.Edge effects were resolved by one or more of the followingsteps: (1) literature review of the Fire Effects InformationSystem, (2) expert knowledge of a specific area, or (3) major-ity opinion of regional experts from two or more ECORegions.
Figure 4— Succession diagram example. Fields filled out in italics indicate information provided by sum-mary reports (appendix C). Fields filled out in bold indicate information filled in by regional experts.
Grassland
Douglas-fir Douglas-fir
Other shrubPonderosa
PinePonderosa
PinePonderosa
PinePonderosa
PineDouglas-fir
0:Non-forest
2.33%-66% 3.67%-100%
Successional Box
STRATA:
ECOHUC:
Fuel Management Succession Diagram
Küchler PNV Groups: 3: Pine Douglas-fir
1: 0-35 year, low severityHistorical Fire Regime:
All
Cover Type:
Forest Density:
Relative DepartureIndex:
Condition Class:
Condition Class:
Relative DepartureIndex:
Succession BoxSuccession Box
Directions
1.2.
4.
3.
Fill in STRATA from worksheet.Fill in Cover Type and Forest Density from worksheet.
Assign Condition Class to STRATA, Cover Type, Forest Density,and Relative Departure Index combinations for each Succession Box.
Assign Relative Departure Index to STRATA, Cover Type, andForest Density combinations for each Succession Box.
Cover Type:
Forest Density:
0
0 1
0 0 1 2 0
1
1 2
1 1 2 3 1
0:Non-forest 1: 0%-32% 2:33%-66% 3:67%-100% 1:0%-32%
Can Agriculture Occur
Yes Noin this Strata?
1
7
2
8
3 4 5 6
8 USDA Forest Service General Technical Report RMRS-GTR-87. 2002.
Version 2000—After the release of all the data products inNovember 1999, some inconsistencies were found acrossECORegional boundaries because the data were compiledseparately for each ECORegion. To eliminate these inconsis-tencies, we conducted another series of workshops in thesummer of 2000 with participants from adjacent ECORegionswho repeated the steps described above. For Version 2000products, succession diagram assignments were made toECOHUC sections (average size 2,400 km2) instead of toECORegions (average size 970,000 km2) as was done for thefirst versions. Once all refinements were incorporated into themaster database and GIS, final Version 2000 spatial data lay-ers (appendix G) were completed.
Supplementary Data Layer Development
Three additional spatial data layers were developed thatwere not directly associated with the biophysical and vegeta-tion-based layers. Development of these supplementary layerswas in response to risk assessment needs identified both inthe Joint Fire Sciences Program funding agreement and in theUSFS’s Forests at Risk project charter. In contrast to the focuson ecological conditions and risks to ecosystem componentsinherent in the biophysical and vegetation-based layers, the
three supplementary layers were developed specifically to sup-port assessments of potential hazards and risks to public healthand safety. These include an 11-year National Fire Occurrencedatabase, a Potential Fire Characteristics layer, and a layerexpressing Wildland Fire Risk to Flammable Structures. Thelayers are based on syntheses of historical fire and weatherdata and their associated fire-related indices. These layers pro-vide the probability component of a formal risk assessment,and can be used as such by agencies or administrative units.
National fire occurrence, 1986 to 1996—The NationalFire Occurrence database and GIS coverage (appendix G) is aGIS database of natural and human-caused fire occurrencesfor the years 1986 to 1996. It includes Federal data from theUSDA Forest Service and four Department of the Interior(DOI) agencies: Bureau of Land Management (BLM), Bu-reau of Indian Affairs (BIA), National Park Service (NPS),and U.S. Fish and Wildlife Service (FWS). It also includesnon-Federal data from all conterminous States except Nevada(appendix D).
Federal Fire Occurrence Database—The USDA Forest Ser-vice administrative units submitted fire occurrence data to thenational database, which is called the National InteragencyFire Management Integrated Database (NIFMID) (USDA
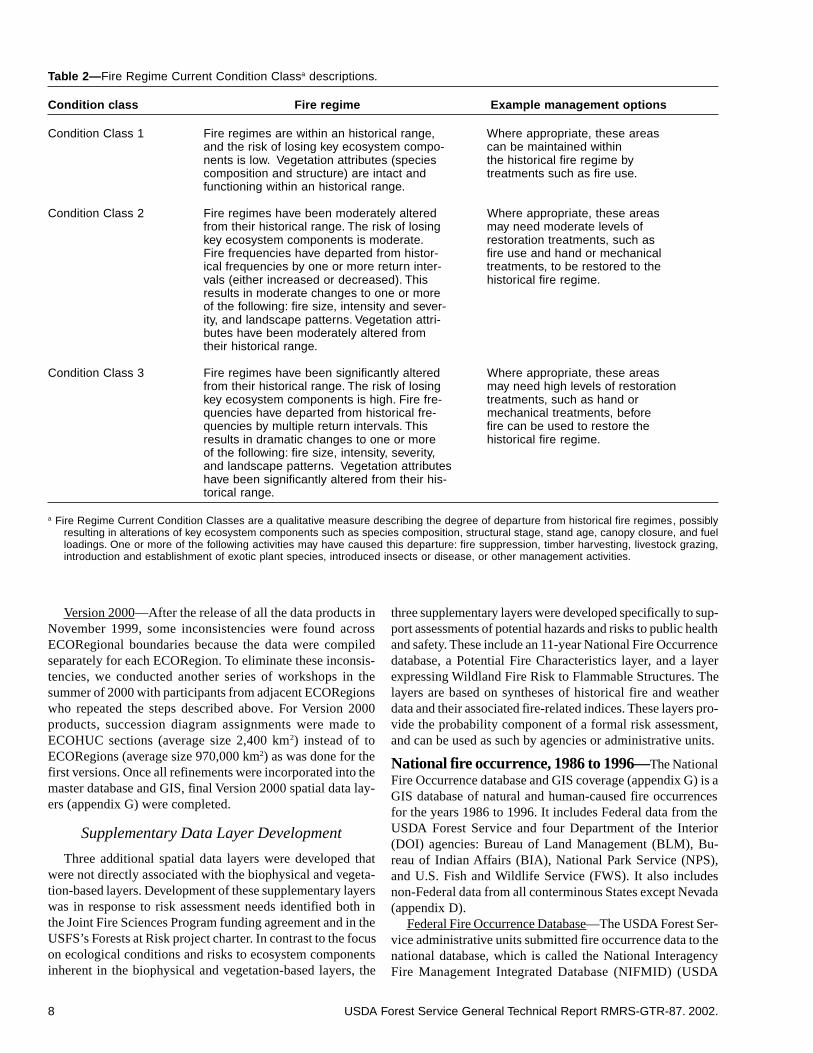
Table 2—Fire Regime Current Condition Classa descriptions.
Condition class Fire regime Example management options
Condition Class 1 Fire regimes are within an historical range, Where appropriate, these areasand the risk of losing key ecosystem compo- can be maintained withinnents is low. Vegetation attributes (species the historical fire regime bycomposition and structure) are intact and treatments such as fire use.functioning within an historical range.
Condition Class 2 Fire regimes have been moderately altered Where appropriate, these areasfrom their historical range. The risk of losing may need moderate levels ofkey ecosystem components is moderate. restoration treatments, such asFire frequencies have departed from histor- fire use and hand or mechanicalical frequencies by one or more return inter- treatments, to be restored to thevals (either increased or decreased). This historical fire regime.results in moderate changes to one or moreof the following: fire size, intensity and sever-ity, and landscape patterns. Vegetation attri-butes have been moderately altered fromtheir historical range.
Condition Class 3 Fire regimes have been significantly altered Where appropriate, these areasfrom their historical range. The risk of losing may need high levels of restorationkey ecosystem components is high. Fire fre- treatments, such as hand orquencies have departed from historical fre- mechanical treatments, beforequencies by multiple return intervals. This fire can be used to restore theresults in dramatic changes to one or more historical fire regime.of the following: fire size, intensity, severity,and landscape patterns. Vegetation attributeshave been significantly altered from their his-torical range.
a Fire Regime Current Condition Classes are a qualitative measure describing the degree of departure from historical fire regimes, possiblyresulting in alterations of key ecosystem components such as species composition, structural stage, stand age, canopy closure, and fuelloadings. One or more of the following activities may have caused this departure: fire suppression, timber harvesting, livestock grazing,introduction and establishment of exotic plant species, introduced insects or disease, or other management activities.
USDA Forest Service General Technical Report RMRS-GTR-87. 2002. 9
Forest Service 1993), located at the USDA National Informa-tion Technology Center in Kansas City, MO. USDA ForestService data were extracted from NIFMID for USFS Regionscovering the conterminous United States (USFS Regions 1through 6, 8 and 9) for the years 1986 to 1996. A GIS cover-age was generated from the latitude-longitude coordinates, anddatabase attributes were adjusted to conform to database itemschosen for this project (appendix E).
Department of the Interior Agencies submitted fire occur-rence data to the common Shared Applications ComputerSystem, located at the National Interagency Fire Center inBoise, ID. We obtained new data directly from the DOIcentral database in October 1999 and worked closely with theFWS to summarize appropriate fire types and acreages. Thesenew data were used in the final product. A GIS coverage wasgenerated from the database’s latitude-longitude coordinates,recorded in the database to the nearest second.
We performed several processing steps on both the USFSand DOI layers. We removed incorrectly recorded latitude orlongitude coordinates from the USFS and DOI databases.Records from these databases were removed that containeddata not needed for this analysis, such as pre-1986 data andrecords of false alarms. In addition, a GIS layer of State bound-aries was overlaid with the point layers to identify those pointsthat did not occur within the recorded State. If the point oc-curred further than 10 km from the nearest State boundary towhich it was assigned, or if the point occurred within 10 kmof the State boundary but was not recorded as being in theadjacent State, it was removed from the GIS database.
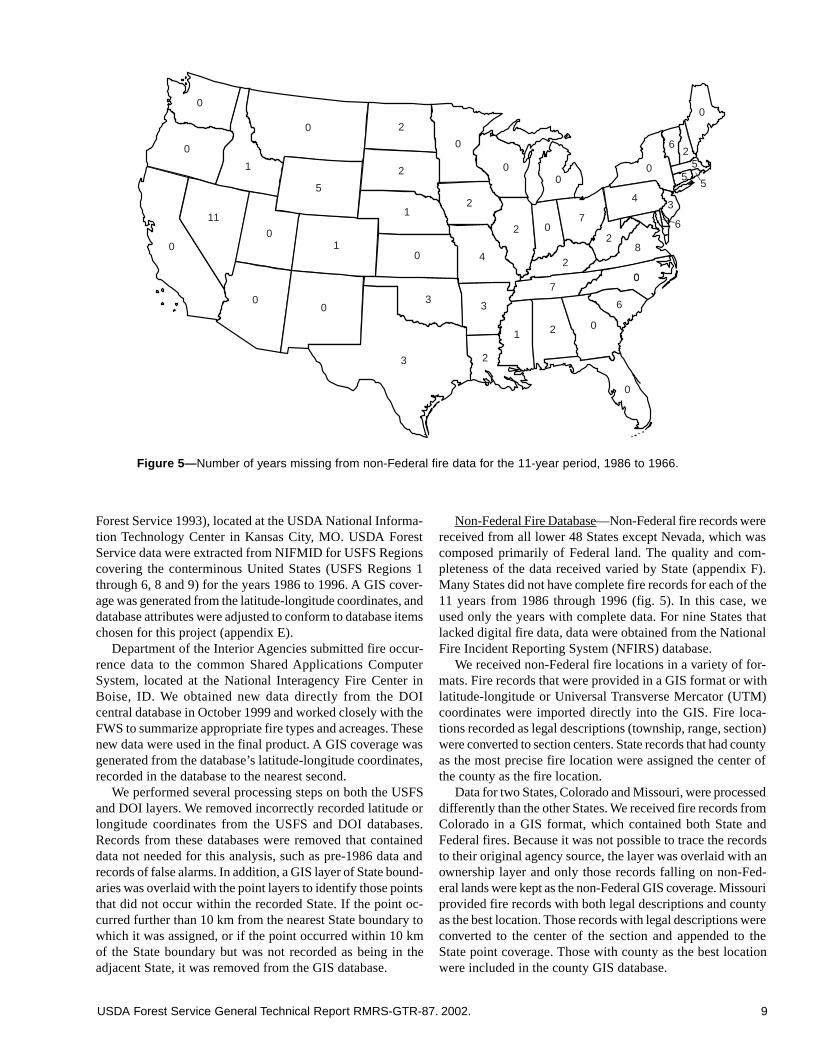
Non-Federal Fire Database—Non-Federal fire records werereceived from all lower 48 States except Nevada, which wascomposed primarily of Federal land. The quality and com-pleteness of the data received varied by State (appendix F).Many States did not have complete fire records for each of the11 years from 1986 through 1996 (fig. 5). In this case, weused only the years with complete data. For nine States thatlacked digital fire data, data were obtained from the NationalFire Incident Reporting System (NFIRS) database.
We received non-Federal fire locations in a variety of for-mats. Fire records that were provided in a GIS format or withlatitude-longitude or Universal Transverse Mercator (UTM)coordinates were imported directly into the GIS. Fire loca-tions recorded as legal descriptions (township, range, section)were converted to section centers. State records that had countyas the most precise fire location were assigned the center ofthe county as the fire location.
Data for two States, Colorado and Missouri, were processeddifferently than the other States. We received fire records fromColorado in a GIS format, which contained both State andFederal fires. Because it was not possible to trace the recordsto their original agency source, the layer was overlaid with anownership layer and only those records falling on non-Fed-eral lands were kept as the non-Federal GIS coverage. Missouriprovided fire records with both legal descriptions and countyas the best location. Those records with legal descriptions wereconverted to the center of the section and appended to theState point coverage. Those with county as the best locationwere included in the county GIS database.
Figure 5— Number of years missing from non-Federal fire data for the 11-year period, 1986 to 1966.
0
0
00
00
1
1
0
0
00
0
0
70
2
43
8
6
6
55
5
6
2
0
0
00
2
4
3
2
1 2
7
2
2
5
2
2
1
0
3
3
11
10 USDA Forest Service General Technical Report RMRS-GTR-87. 2002.
Records from the NFIRS database were used for States fromwhich we were unable to obtain data directly. Because par-ticipation in NFIRS is voluntary, the database does notrepresent all wildland fires within the State within a given timeperiod. After attempting to contact State Foresters from eachof the nine States for which only NFIRS data were available,State Foresters from Kentucky, Louisiana, Alabama, and WestVirginia responded with reviews. The NFIRS data were deter-mined to be an inadequate representation of State fireoccurrence (table 3). All States with NFIRS data were given astatus of unsatisfactory, but were included in the database asthe only available data (appendix F).
Potential fire characteristics—The Potential Fire Char-acteristics layer, Version 1999 (appendix G), is a spatialrepresentation of the number of days of high or extreme firedanger calculated from 8 years of historical National FireDanger Rating System (NFDRS) data. The basis for the Po-tential Fire Characteristics layer is the Burning Index (BI),which was developed to assess containment problems at a fire’sflaming front. Burning Index describes the magnitude of thefire containment problem in the context of coarse-scale, non-specific fire potential (Andrews and Rothermel 1981). Thefire potential interpretations shown in table 4 can be appliedto corresponding BI values. These flame length classes andinterpretations are familiar to fire managers and are widelyaccepted as an intuitive communications tool. Fires with flamelengths exceeding 8 feet present serious control problems suchas torching, crowning, and spotting. Control efforts at the headof such fires are mostly ineffective, and major runs can occurin more extreme cases. Therefore, the 8-foot flame lengththreshold was selected for this project to indicate high or ex-treme fire potential.
National Fire Danger Rating System data characterize thenear worst-case scenario of fire danger or potential for firesthat could occur during a specific time period, and are intendedfor mid- to large-scale applications. Deeming and others (1977)note that “fire-danger rating areas are typically greater than100,000 acres. Weather is observed and predicted for one spe-cific time during the day at one specific location.” The 1978NFDRS indices are used throughout the lower 48 States toguide fire management planning activities (Deeming and oth-ers 1977). The primary NFDRS indices include SpreadComponent, Energy Release Component, and Burning Index(Bradshaw and others 1983).
The flame length inputs to the Potential Fire Characteris-tics map layer were derived from 180 days of interpolated BIdata (April to September) for each of 8 years (1989 to 1996).Each daily map layer was individually processed in two steps:
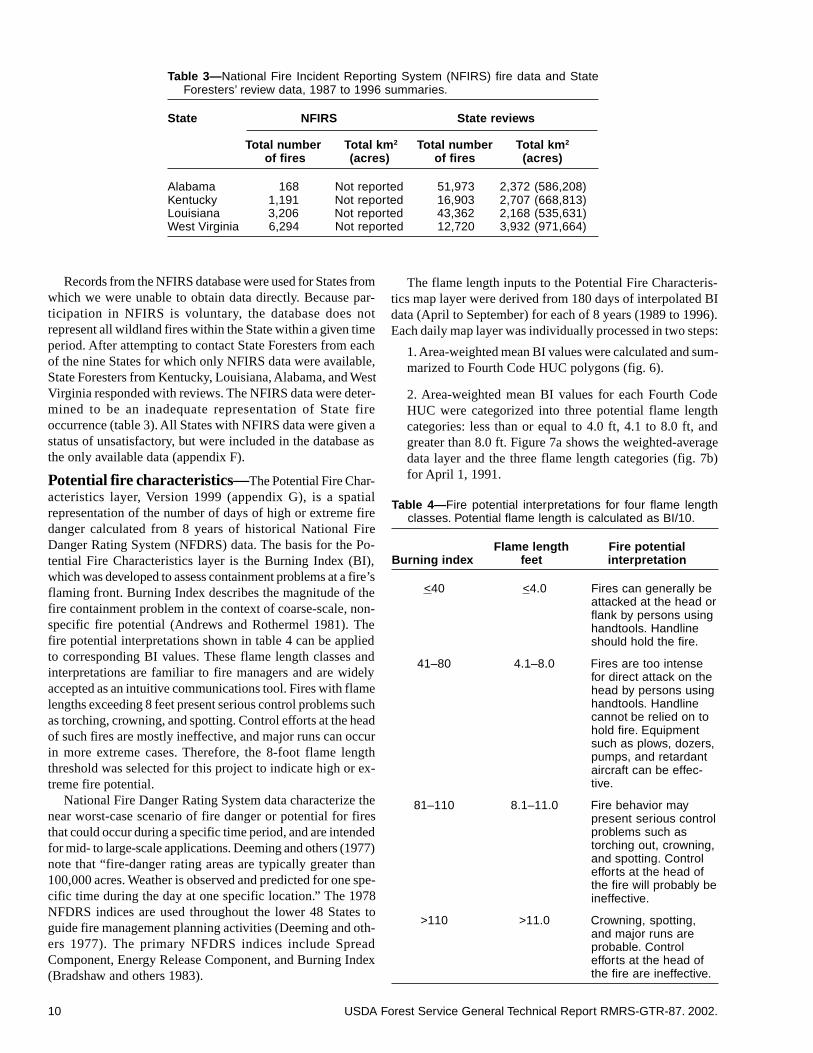
1. Area-weighted mean BI values were calculated and sum-marized to Fourth Code HUC polygons (fig. 6).
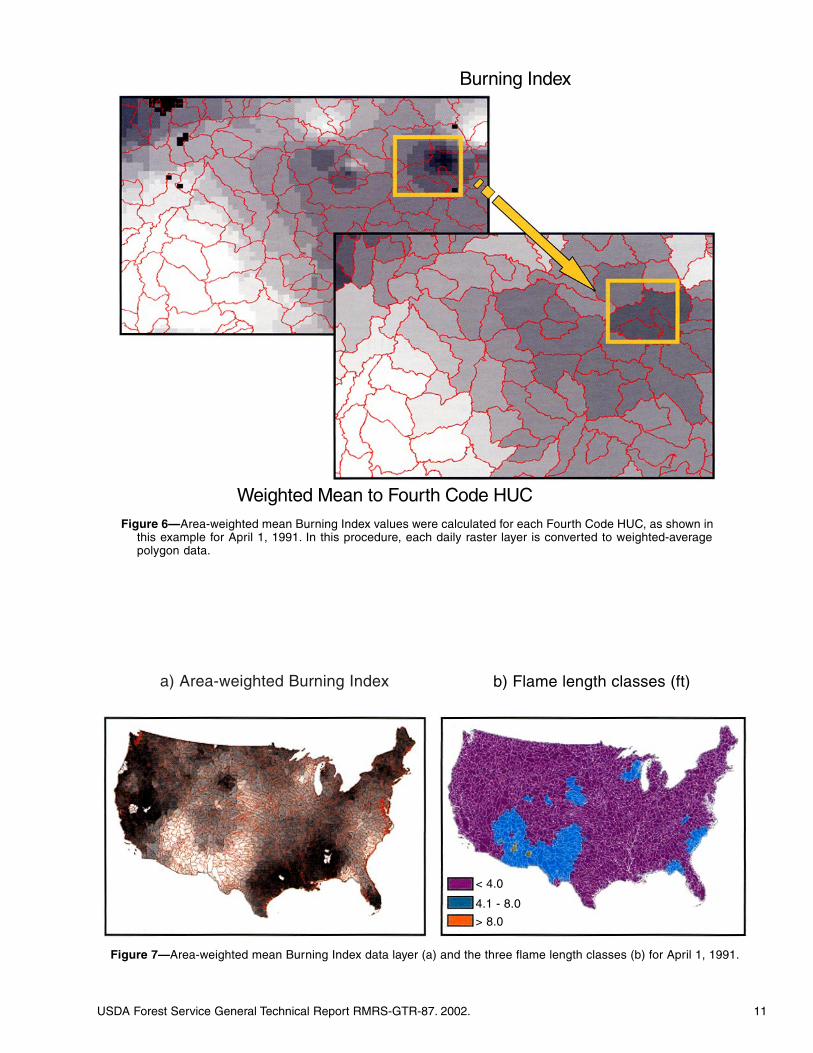
2. Area-weighted mean BI values for each Fourth CodeHUC were categorized into three potential flame lengthcategories: less than or equal to 4.0 ft, 4.1 to 8.0 ft, andgreater than 8.0 ft. Figure 7a shows the weighted-averagedata layer and the three flame length categories (fig. 7b)for April 1, 1991.
Table 4—Fire potential interpretations for four flame lengthclasses. Potential flame length is calculated as BI/10.
Flame length Fire potentialBurning index feet interpretation
<40 <4.0 Fires can generally beattacked at the head orflank by persons usinghandtools. Handlineshould hold the fire.
41–80 4.1–8.0 Fires are too intensefor direct attack on thehead by persons usinghandtools. Handlinecannot be relied on tohold fire. Equipmentsuch as plows, dozers,pumps, and retardantaircraft can be effec-tive.
81–110 8.1–11.0 Fire behavior maypresent serious controlproblems such astorching out, crowning,and spotting. Controlefforts at the head ofthe fire will probably beineffective.
>110 >11.0 Crowning, spotting,and major runs areprobable. Controlefforts at the head ofthe fire are ineffective.
Table 3—National Fire Incident Reporting System (NFIRS) fire data and StateForesters’ review data, 1987 to 1996 summaries.
State NFIRS State reviews
Total number Total km 2 Total number Total km 2
of fires (acres) of fires (acres)
Alabama 168 Not reported 51,973 2,372 (586,208)Kentucky 1,191 Not reported 16,903 2,707 (668,813)Louisiana 3,206 Not reported 43,362 2,168 (535,631)West Virginia 6,294 Not reported 12,720 3,932 (971,664)
USDA Forest Service General Technical Report RMRS-GTR-87. 2002. 11
Figure 6—Area-weighted mean Burning Index values were calculated for each Fourth Code HUC, as shown inthis example for April 1, 1991. In this procedure, each daily raster layer is converted to weighted-averagepolygon data.
Burning Index
Weighted Mean to Fourth Code HUC
Figure 7—Area-weighted mean Burning Index data layer (a) and the three flame length classes (b) for April 1, 1991.
a) Area-weighted Burning Index b) Flame length classes (ft)
< 4.0
4.1 - 8.0
> 8.0
12 USDA Forest Service General Technical Report RMRS-GTR-87. 2002.
After each daily map layer was processed for a given year,the annual number of days that potential flame length exceeded8 feet was counted for each sub-basin. Finally, the maximumannual number of days when 8-foot flame lengths were ex-ceeded was determined for each sub-basin from the 8 years ofdata. The resulting map is Potential Fire Characteristics,Version 1999 (appendix G).
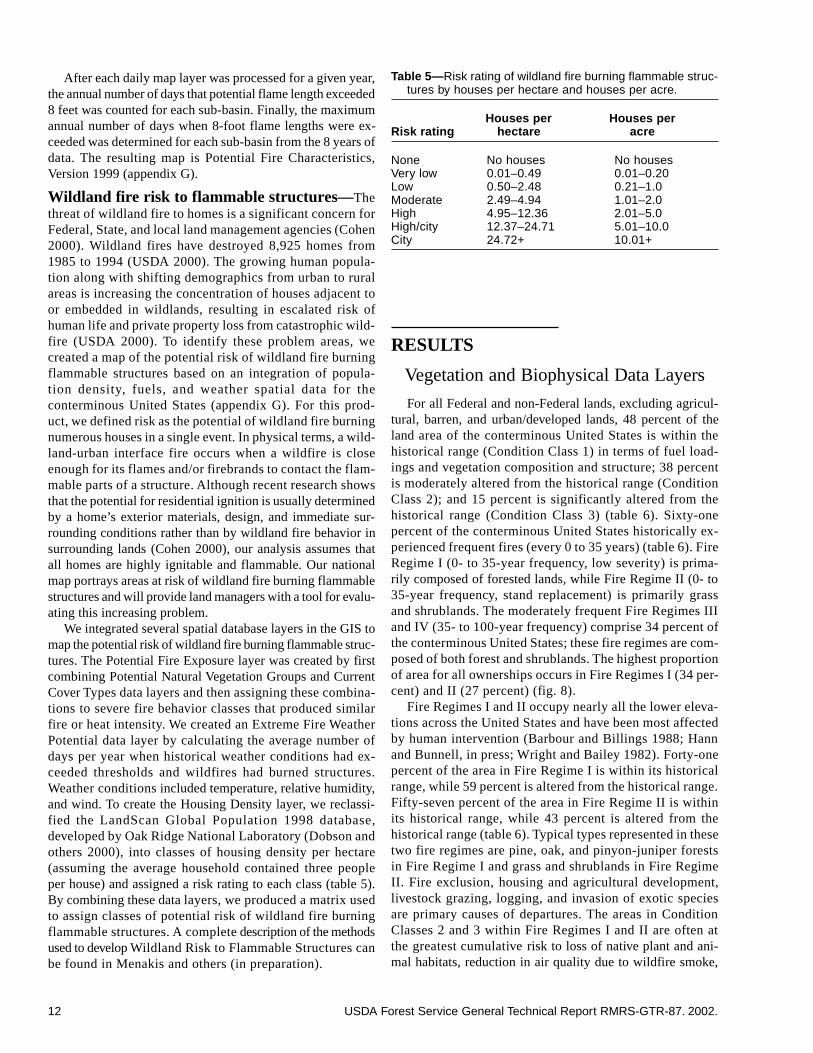
Wildland fire risk to flammable structures— Thethreat of wildland fire to homes is a significant concern forFederal, State, and local land management agencies (Cohen2000). Wildland fires have destroyed 8,925 homes from1985 to 1994 (USDA 2000). The growing human popula-tion along with shifting demographics from urban to ruralareas is increasing the concentration of houses adjacent toor embedded in wildlands, resulting in escalated risk ofhuman life and private property loss from catastrophic wild-fire (USDA 2000). To identify these problem areas, wecreated a map of the potential risk of wildland fire burningflammable structures based on an integration of popula-tion density, fuels, and weather spatial data for theconterminous United States (appendix G). For this prod-uct, we defined risk as the potential of wildland fire burningnumerous houses in a single event. In physical terms, a wild-land-urban interface fire occurs when a wildfire is closeenough for its flames and/or firebrands to contact the flam-mable parts of a structure. Although recent research showsthat the potential for residential ignition is usually determinedby a home’s exterior materials, design, and immediate sur-rounding conditions rather than by wildland fire behavior insurrounding lands (Cohen 2000), our analysis assumes thatall homes are highly ignitable and flammable. Our nationalmap portrays areas at risk of wildland fire burning flammablestructures and will provide land managers with a tool for evalu-ating this increasing problem.
We integrated several spatial database layers in the GIS tomap the potential risk of wildland fire burning flammable struc-tures. The Potential Fire Exposure layer was created by firstcombining Potential Natural Vegetation Groups and CurrentCover Types data layers and then assigning these combina-tions to severe fire behavior classes that produced similarfire or heat intensity. We created an Extreme Fire WeatherPotential data layer by calculating the average number ofdays per year when historical weather conditions had ex-ceeded thresholds and wildfires had burned structures.Weather conditions included temperature, relative humidity,and wind. To create the Housing Density layer, we reclassi-fied the LandScan Global Population 1998 database,developed by Oak Ridge National Laboratory (Dobson andothers 2000), into classes of housing density per hectare(assuming the average household contained three peopleper house) and assigned a risk rating to each class (table 5).By combining these data layers, we produced a matrix usedto assign classes of potential risk of wildland fire burningflammable structures. A complete description of the methodsused to develop Wildland Risk to Flammable Structures canbe found in Menakis and others (in preparation).
RESULTS
Vegetation and Biophysical Data Layers
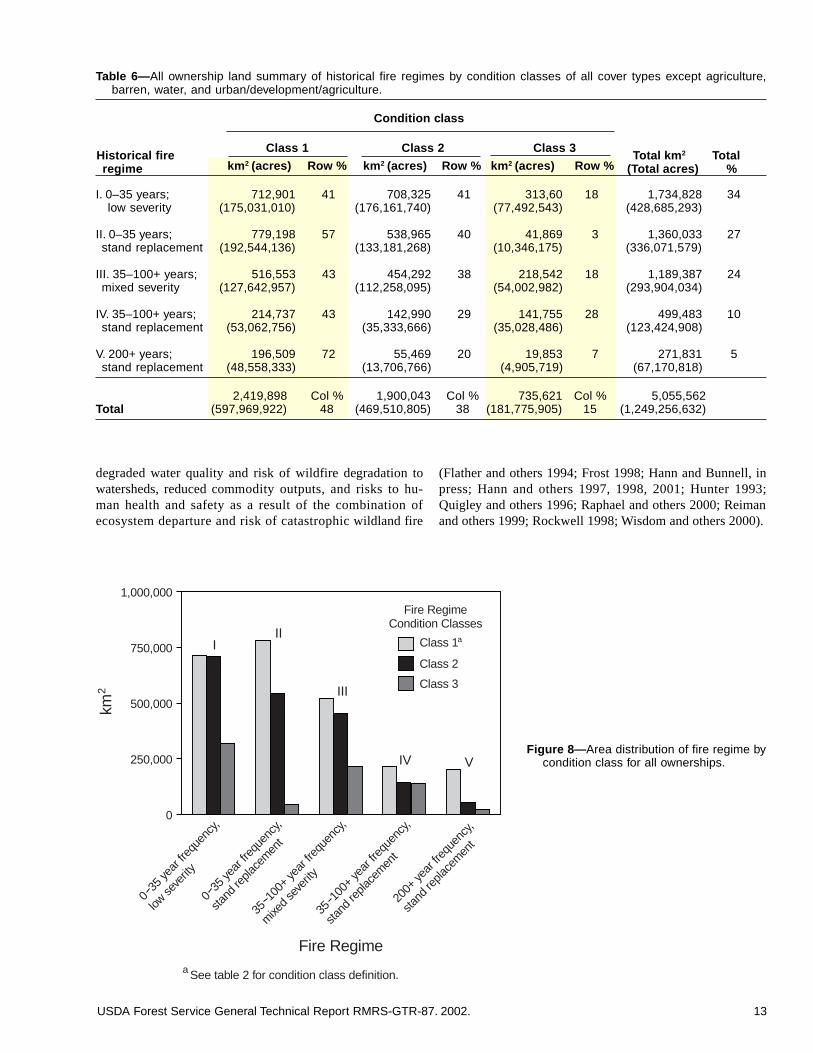
For all Federal and non-Federal lands, excluding agricul-tural, barren, and urban/developed lands, 48 percent of theland area of the conterminous United States is within thehistorical range (Condition Class 1) in terms of fuel load-ings and vegetation composition and structure; 38 percentis moderately altered from the historical range (ConditionClass 2); and 15 percent is significantly altered from thehistorical range (Condition Class 3) (table 6). Sixty-onepercent of the conterminous United States historically ex-perienced frequent fires (every 0 to 35 years) (table 6). FireRegime I (0- to 35-year frequency, low severity) is prima-rily composed of forested lands, while Fire Regime II (0- to35-year frequency, stand replacement) is primarily grassand shrublands. The moderately frequent Fire Regimes IIIand IV (35- to 100-year frequency) comprise 34 percent ofthe conterminous United States; these fire regimes are com-posed of both forest and shrublands. The highest proportionof area for all ownerships occurs in Fire Regimes I (34 per-cent) and II (27 percent) (fig. 8).
Fire Regimes I and II occupy nearly all the lower eleva-tions across the United States and have been most affectedby human intervention (Barbour and Billings 1988; Hannand Bunnell, in press; Wright and Bailey 1982). Forty-onepercent of the area in Fire Regime I is within its historicalrange, while 59 percent is altered from the historical range.Fifty-seven percent of the area in Fire Regime II is withinits historical range, while 43 percent is altered from thehistorical range (table 6). Typical types represented in thesetwo fire regimes are pine, oak, and pinyon-juniper forestsin Fire Regime I and grass and shrublands in Fire RegimeII. Fire exclusion, housing and agricultural development,livestock grazing, logging, and invasion of exotic speciesare primary causes of departures. The areas in ConditionClasses 2 and 3 within Fire Regimes I and II are often atthe greatest cumulative risk to loss of native plant and ani-mal habitats, reduction in air quality due to wildfire smoke,
Table 5—Risk rating of wildland fire burning flammable struc-tures by houses per hectare and houses per acre.
Houses per Houses perRisk rating hectare acre
None No houses No housesVery low 0.01–0.49 0.01–0.20Low 0.50–2.48 0.21–1.0Moderate 2.49–4.94 1.01–2.0High 4.95–12.36 2.01–5.0High/city 12.37–24.71 5.01–10.0City 24.72+ 10.01+
USDA Forest Service General Technical Report RMRS-GTR-87. 2002. 13
Table 6—All ownership land summary of historical fire regimes by condition classes of all cover types except agriculture,barren, water, and urban/development/agriculture.
Condition class
Class 1 Class 2 Class 3
km 2 (acres) Row % km 2 (acres) Row % km 2 (acres) Row %
I. 0–35 years; 712,901 41 708,325 41 313,60 18 1,734,828 34low severity (175,031,010) (176,161,740) (77,492,543) (428,685,293)
II. 0–35 years; 779,198 57 538,965 40 41,869 3 1,360,033 27stand replacement (192,544,136) (133,181,268) (10,346,175) (336,071,579)
III. 35–100+ years; 516,553 43 454,292 38 218,542 18 1,189,387 24mixed severity (127,642,957) (112,258,095) (54,002,982) (293,904,034)
IV. 35–100+ years; 214,737 43 142,990 29 141,755 28 499,483 10stand replacement (53,062,756) (35,333,666) (35,028,486) (123,424,908)
V. 200+ years; 196,509 72 55,469 20 19,853 7 271,831 5stand replacement (48,558,333) (13,706,766) (4,905,719) (67,170,818)
2,419,898 Col % 1,900,043 Col % 735,621 Col % 5,055,562Total (597,969,922) 48 (469,510,805) 38 (181,775,905) 15 (1,249,256,632)
Historical fireregime
Total km 2 Total(Total acres) %
degraded water quality and risk of wildfire degradation towatersheds, reduced commodity outputs, and risks to hu-man health and safety as a result of the combination ofecosystem departure and risk of catastrophic wildland fire
(Flather and others 1994; Frost 1998; Hann and Bunnell, inpress; Hann and others 1997, 1998, 2001; Hunter 1993;Quigley and others 1996; Raphael and others 2000; Reimanand others 1999; Rockwell 1998; Wisdom and others 2000).
Figure 8— Area distribution of fire regime bycondition class for all ownerships.
1,000,000
a See table 2 for condition class definition.
Class 1a
Class 2
Class 3
Fire Regime
III
III
IV V
Fire RegimeCondition Classes
750,000
500,000km2
250,000
0
0 35
year
freq
uenc
y,
low se
verit
y
0 35
year
freq
uenc
y,
stand
repla
cemen
t
35 1
00+
year
freq
uenc
y,
mixed s
ever
ity
35 1
00+
year
freq
uenc
y,
stand
repla
cemen
t
200+
year
freq
uenc
y,
stand
repla
cemen
t
14 USDA Forest Service General Technical Report RMRS-GTR-87. 2002.
The highest percentage of Condition Class 3 (28 percent)is found in Fire Regime IV (35- to 100-year frequency, standreplacement), while 18 percent of Condition Class 3 is foundin Fire Regime III (35- to 100-year frequency, mixed sever-ity). Typical types represented in these two fire regimes areshrublands, lodgepole pine forests, mixed deciduous-coniferforests of the upper Midwest and Northeast, and Douglas-firforests of the Pacific Northwest and Intermountain West. FireRegimes III and IV have been less dramatically affected byhuman intervention as compared to Fire Regimes I and II, butthe more subtle effects of homogenization and increased woodydensity have substantial risks to ecosystems (Barbour andBillings 1988; Hann and Bunnell, in press; Wright and Bailey1982). Fire exclusion, establishment of exotic species, live-stock grazing, and logging are primary causes of departurefor Fire Regimes III and IV.
Lands in Fire Regime V (200-year frequency, stand re-placement) are closest to historical conditions with 72percent in Condition Class 1; 28 percent of the area is be-yond its historical range. These areas typically occur inhigher elevation and wetter forests of the United States.The high elevation types, where human population is scarce,have been least affected by human intervention, as com-pared to Fire Regimes I and II. High-elevation spruce/firtypes, whitebark pine, and moist coastal spruce and Dou-glas fir-hemlock associations represent these types. Somehigh-elevation lodgepole pine and northeast conifer/hard-wood forests are also included in this fire regime. Incontrast, timber harvest and road effects have extensivelyaffected the wet and productive forests of the coastal and
Northern Rocky Mountain areas and have increased the riskof losing key ecosystem components.
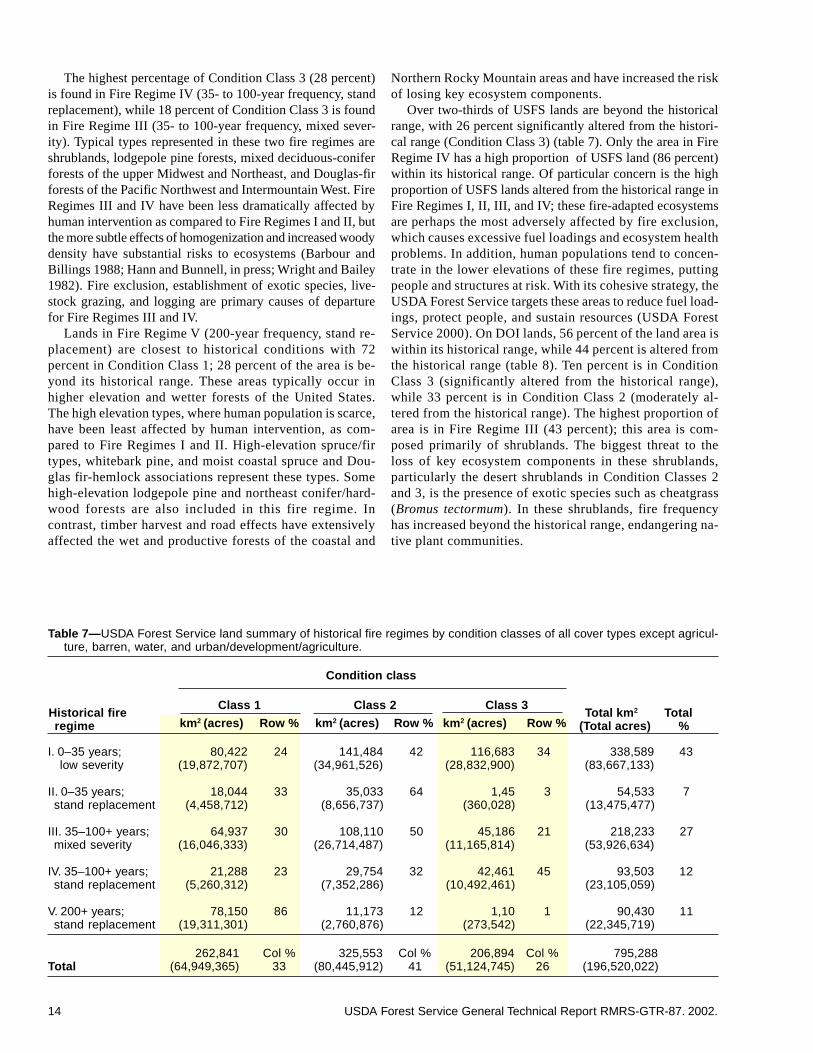
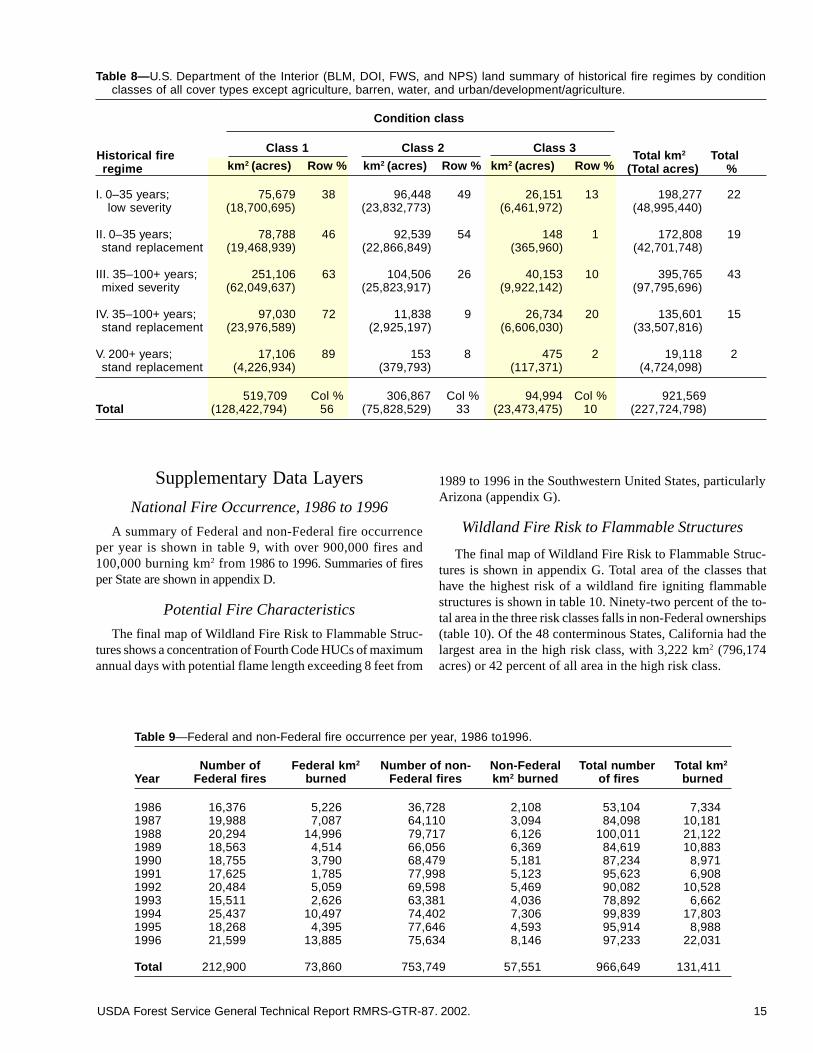
Over two-thirds of USFS lands are beyond the historicalrange, with 26 percent significantly altered from the histori-cal range (Condition Class 3) (table 7). Only the area in FireRegime IV has a high proportion of USFS land (86 percent)within its historical range. Of particular concern is the highproportion of USFS lands altered from the historical range inFire Regimes I, II, III, and IV; these fire-adapted ecosystemsare perhaps the most adversely affected by fire exclusion,which causes excessive fuel loadings and ecosystem healthproblems. In addition, human populations tend to concen-trate in the lower elevations of these fire regimes, puttingpeople and structures at risk. With its cohesive strategy, theUSDA Forest Service targets these areas to reduce fuel load-ings, protect people, and sustain resources (USDA ForestService 2000). On DOI lands, 56 percent of the land area iswithin its historical range, while 44 percent is altered fromthe historical range (table 8). Ten percent is in ConditionClass 3 (significantly altered from the historical range),while 33 percent is in Condition Class 2 (moderately al-tered from the historical range). The highest proportion ofarea is in Fire Regime III (43 percent); this area is com-posed primarily of shrublands. The biggest threat to theloss of key ecosystem components in these shrublands,particularly the desert shrublands in Condition Classes 2and 3, is the presence of exotic species such as cheatgrass(Bromus tectormum). In these shrublands, fire frequencyhas increased beyond the historical range, endangering na-tive plant communities.
Table 7—USDA Forest Service land summary of historical fire regimes by condition classes of all cover types except agricul-ture, barren, water, and urban/development/agriculture.
Condition class
Class 1 Class 2 Class 3
km 2 (acres) Row % km 2 (acres) Row % km 2 (acres) Row %
I. 0–35 years; 80,422 24 141,484 42 116,683 34 338,589 43low severity (19,872,707) (34,961,526) (28,832,900) (83,667,133)
II. 0–35 years; 18,044 33 35,033 64 1,45 3 54,533 7stand replacement (4,458,712) (8,656,737) (360,028) (13,475,477)
III. 35–100+ years; 64,937 30 108,110 50 45,186 21 218,233 27mixed severity (16,046,333) (26,714,487) (11,165,814) (53,926,634)
IV. 35–100+ years; 21,288 23 29,754 32 42,461 45 93,503 12stand replacement (5,260,312) (7,352,286) (10,492,461) (23,105,059)
V. 200+ years; 78,150 86 11,173 12 1,10 1 90,430 11stand replacement (19,311,301) (2,760,876) (273,542) (22,345,719)
262,841 Col % 325,553 Col % 206,894 Col % 795,288Total (64,949,365) 33 (80,445,912) 41 (51,124,745) 26 (196,520,022)
Historical fireregime
Total km 2 Total(Total acres) %
USDA Forest Service General Technical Report RMRS-GTR-87. 2002. 15
Supplementary Data Layers
National Fire Occurrence, 1986 to 1996
A summary of Federal and non-Federal fire occurrenceper year is shown in table 9, with over 900,000 fires and100,000 burning km2 from 1986 to 1996. Summaries of firesper State are shown in appendix D.
Potential Fire Characteristics
The final map of Wildland Fire Risk to Flammable Struc-tures shows a concentration of Fourth Code HUCs of maximumannual days with potential flame length exceeding 8 feet from
1989 to 1996 in the Southwestern United States, particularlyArizona (appendix G).
Wildland Fire Risk to Flammable Structures
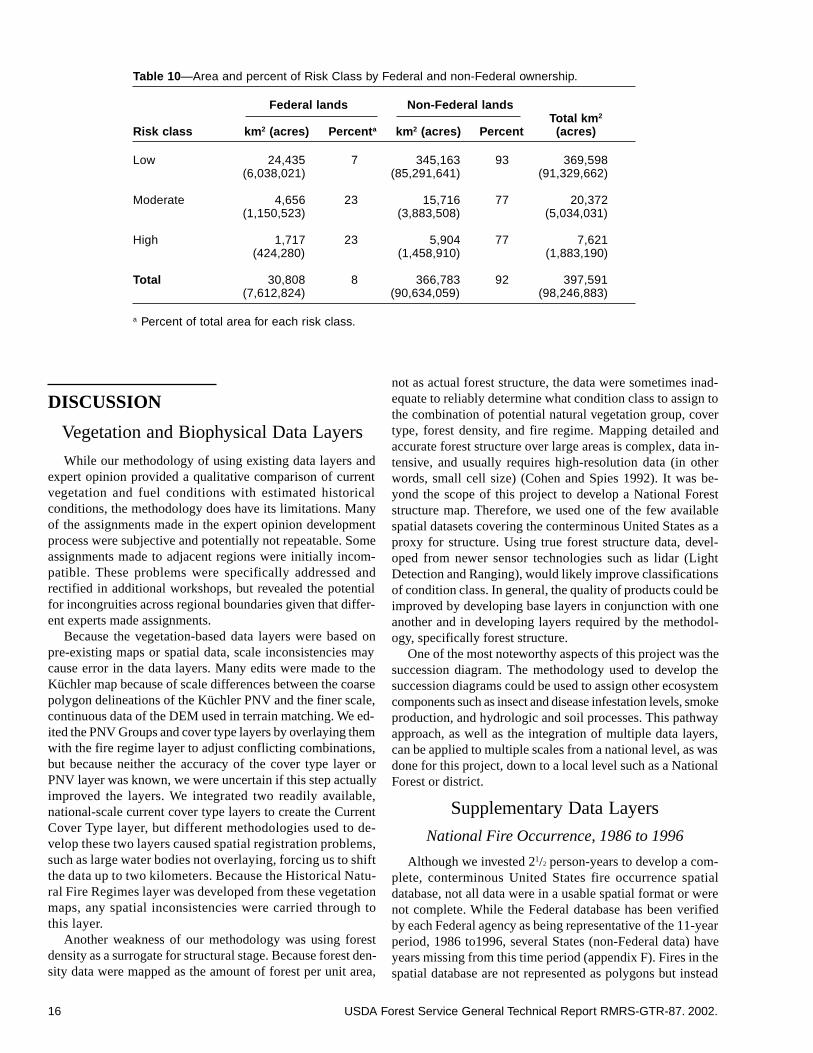
The final map of Wildland Fire Risk to Flammable Struc-tures is shown in appendix G. Total area of the classes thathave the highest risk of a wildland fire igniting flammablestructures is shown in table 10. Ninety-two percent of the to-tal area in the three risk classes falls in non-Federal ownerships(table 10). Of the 48 conterminous States, California had thelargest area in the high risk class, with 3,222 km2 (796,174acres) or 42 percent of all area in the high risk class.
Table 9—Federal and non-Federal fire occurrence per year, 1986 to1996.
Number of Federal km 2 Number of non- Non-Federal Total number Total km 2
Year Federal fires burned Federal fires km 2 burned of fires burned
1986 16,376 5,226 36,728 2,108 53,104 7,3341987 19,988 7,087 64,110 3,094 84,098 10,1811988 20,294 14,996 79,717 6,126 100,011 21,1221989 18,563 4,514 66,056 6,369 84,619 10,8831990 18,755 3,790 68,479 5,181 87,234 8,9711991 17,625 1,785 77,998 5,123 95,623 6,9081992 20,484 5,059 69,598 5,469 90,082 10,5281993 15,511 2,626 63,381 4,036 78,892 6,6621994 25,437 10,497 74,402 7,306 99,839 17,8031995 18,268 4,395 77,646 4,593 95,914 8,9881996 21,599 13,885 75,634 8,146 97,233 22,031
Total 212,900 73,860 753,749 57,551 966,649 131,411
Table 8—U.S. Department of the Interior (BLM, DOI, FWS, and NPS) land summary of historical fire regimes by conditionclasses of all cover types except agriculture, barren, water, and urban/development/agriculture.
Condition class
Class 1 Class 2 Class 3
km 2 (acres) Row % km 2 (acres) Row % km 2 (acres) Row %
I. 0–35 years; 75,679 38 96,448 49 26,151 13 198,277 22low severity (18,700,695) (23,832,773) (6,461,972) (48,995,440)
II. 0–35 years; 78,788 46 92,539 54 148 1 172,808 19stand replacement (19,468,939) (22,866,849) (365,960) (42,701,748)
III. 35–100+ years; 251,106 63 104,506 26 40,153 10 395,765 43mixed severity (62,049,637) (25,823,917) (9,922,142) (97,795,696)
IV. 35–100+ years; 97,030 72 11,838 9 26,734 20 135,601 15stand replacement (23,976,589) (2,925,197) (6,606,030) (33,507,816)
V. 200+ years; 17,106 89 153 8 475 2 19,118 2stand replacement (4,226,934) (379,793) (117,371) (4,724,098)
519,709 Col % 306,867 Col % 94,994 Col % 921,569Total (128,422,794) 56 (75,828,529) 33 (23,473,475) 10 (227,724,798)
Historical fireregime
Total km 2 Total(Total acres) %
16 USDA Forest Service General Technical Report RMRS-GTR-87. 2002.
DISCUSSION
Vegetation and Biophysical Data Layers
While our methodology of using existing data layers andexpert opinion provided a qualitative comparison of currentvegetation and fuel conditions with estimated historicalconditions, the methodology does have its limitations. Manyof the assignments made in the expert opinion developmentprocess were subjective and potentially not repeatable. Someassignments made to adjacent regions were initially incom-patible. These problems were specifically addressed andrectified in additional workshops, but revealed the potentialfor incongruities across regional boundaries given that differ-ent experts made assignments.
Because the vegetation-based data layers were based onpre-existing maps or spatial data, scale inconsistencies maycause error in the data layers. Many edits were made to theKüchler map because of scale differences between the coarsepolygon delineations of the Küchler PNV and the finer scale,continuous data of the DEM used in terrain matching. We ed-ited the PNV Groups and cover type layers by overlaying themwith the fire regime layer to adjust conflicting combinations,but because neither the accuracy of the cover type layer orPNV layer was known, we were uncertain if this step actuallyimproved the layers. We integrated two readily available,national-scale current cover type layers to create the CurrentCover Type layer, but different methodologies used to de-velop these two layers caused spatial registration problems,such as large water bodies not overlaying, forcing us to shiftthe data up to two kilometers. Because the Historical Natu-ral Fire Regimes layer was developed from these vegetationmaps, any spatial inconsistencies were carried through tothis layer.
Another weakness of our methodology was using forestdensity as a surrogate for structural stage. Because forest den-sity data were mapped as the amount of forest per unit area,
not as actual forest structure, the data were sometimes inad-equate to reliably determine what condition class to assign tothe combination of potential natural vegetation group, covertype, forest density, and fire regime. Mapping detailed andaccurate forest structure over large areas is complex, data in-tensive, and usually requires high-resolution data (in otherwords, small cell size) (Cohen and Spies 1992). It was be-yond the scope of this project to develop a National Foreststructure map. Therefore, we used one of the few availablespatial datasets covering the conterminous United States as aproxy for structure. Using true forest structure data, devel-oped from newer sensor technologies such as lidar (LightDetection and Ranging), would likely improve classificationsof condition class. In general, the quality of products could beimproved by developing base layers in conjunction with oneanother and in developing layers required by the methodol-ogy, specifically forest structure.
One of the most noteworthy aspects of this project was thesuccession diagram. The methodology used to develop thesuccession diagrams could be used to assign other ecosystemcomponents such as insect and disease infestation levels, smokeproduction, and hydrologic and soil processes. This pathwayapproach, as well as the integration of multiple data layers,can be applied to multiple scales from a national level, as wasdone for this project, down to a local level such as a NationalForest or district.
Supplementary Data Layers
National Fire Occurrence, 1986 to 1996
Although we invested 21/2 person-years to develop a com-plete, conterminous United States fire occurrence spatialdatabase, not all data were in a usable spatial format or werenot complete. While the Federal database has been verifiedby each Federal agency as being representative of the 11-yearperiod, 1986 to1996, several States (non-Federal data) haveyears missing from this time period (appendix F). Fires in thespatial database are not represented as polygons but instead
Table 10—Area and percent of Risk Class by Federal and non-Federal ownership.
Federal lands Non-Federal landsTotal km 2
Risk class km 2 (acres) Percent a km 2 (acres) Percent (acres)
Low 24,435 7 345,163 93 369,598(6,038,021) (85,291,641) (91,329,662)
Moderate 4,656 23 15,716 77 20,372(1,150,523) (3,883,508) (5,034,031)
High 1,717 23 5,904 77 7,621(424,280) (1,458,910) (1,883,190)
Total 30,808 8 366,783 92 397,591(7,612,824) (90,634,059) (98,246,883)
a Percent of total area for each risk class.
USDA Forest Service General Technical Report RMRS-GTR-87. 2002. 17
are represented as points. Therefore, summaries of area burnedare limited to nonspatial summaries, but even these nonspatialsummaries, if summarized for the entire conterminous UnitedStates, are limited because some States did not report acresburned (appendix F). Also missing from some non-Federalrecords are fields such as fire name, date of control, and cause(appendix F). Several States, such as Alabama, Oklahoma,Texas, and Ohio, did not send spatially complete databases,with some counties having few or no fire records.
Duplicate non-Federal and Federal records for the samefire may exist in the databases. Fires on Federal land may alsobe recorded by State (Bunton 1999). Because fire locationsare generally imprecise (to the nearest section) and not alldatabase fields that could aid in tracking duplicates are fullypopulated, we were unable to track fires duplicated betweenFederal and non-Federal databases.
While problems like different cause codes or absence ofkey data fields can be documented, it is not known to whatextent wildland fires from States’ urban and rural jurisdictionsgo unreported. Fires from volunteer rural firefighting organi-zations may not be reported to a centralized agency such asState Fire Marshals or State Foresters (Stuever and others1995). For instance, the Forestry Division of Montana’s De-partment of Natural Resources and Conservation in westernMontana rarely receives fire reports from central or easternMontana rural fire departments.
Despite the time invested in acquiring and synthesizing data,inconsistencies in the database still exist, primarily becausemost fire data are managed as databases, not as GIS spatialdatabases. While the fire occurrence data in its present statemay illustrate trends, the usefulness of this type of productwill be limited until fire reporting is standardized and consis-tently collected across all jurisdictions with spatial informationsuch as fire perimeter as a requirement.
Potential Fire Characteristics
The Potential Fire Characteristics data have limited appli-cation at any level other than national planning. Although theconcept and application of NFDRS indices has been widelyaccepted since the late 1970s, continuous spatial layers of thesedata clearly bring out “the worst” in the data. Perhaps the mostlimiting factor is the low spatial and temporal density ofweather observations. Spatial density is defined by the num-ber and distribution of acceptable NFDRS reporting stations;only about 2,000 are used for the entire conterminous UnitedStates. Values between stations are estimated with an inversedistance-squared technique on a 10-km grid. Burgan and oth-ers (1997) have noted that this works reasonably well in areasof relatively high station density, such as in the Western UnitedStates, but has obvious shortcomings in other areas, particu-larly for the Central and Eastern States. These shortcomingsare also noted on the Web site for the Wildland Fire Assess-ment System: http://www.fs.fed.us/land/wfas (USDA ForestService 1998). The NFDRS weather observation protocol isreported once a day at 2:00 p.m., the theoretical worst-casefire-weather period. This limits the temporal resolution of thedynamic fire-related weather observations.
Wildland Fire Risk to Flammable Structures
The classes used to assign risk to flammable structures fromwildland fire were designed to target areas where a single fireevent could destroy many homes. These single events aredriven by a combination of extreme fire weather occurrenceand high fire intensity. Areas with moderate to high popula-tions but with low to very low hazard to flammable structureswere missing one or both of these combinations. Though theseareas were classified as low risk, it does not mean a single fireevent could not occur and be a risk to structures. In 2000,wildland fires burned over 70 structures in western Montana.These areas were classified as low or very low risk becausewestern Montana averages less than 10 days per year ofextreme fire weather, compared to parts of New Mexico, whichaverages 27 to 90 days per year. The classification provides arelative comparison of areas from high to low risk across theconterminous United States.
Each of the input data layers used to develop the WildlandFire Hazard to Flammable Structures layer has irregularitiesassociated with them that may be compounded when com-bined (Menakis and others, in preparation). By classifying riskinto general classes of low, moderate, and high, we smoothedsome of these irregularities and presented information in arelative fashion (Menakis and others, in preparation). Our wild-land fire risk analysis assumes that all homes are highlyignitable. This analysis does not consider home exterior ma-terials, design, or ignition zone characteristics, but assessesthe potential and degree of ignitable structure exposure to wild-land fire (Menakis and others, in preparation).
Accuracy and Verification
No accuracy assessment or field verification of the spatialdata layers developed for this project was conducted. Kloditzand others (1998) stated that classification accuracies for 1-km2
resolution or coarser data are not feasible because obtainingground truth data would not only be difficult and expensivebut would represent only a very small portion of the image.Loveland and others (1991) stated that because developedclasses are based on heterogeneous rather than homogeneousregions and because there is a lack of consistent ground-truthdata, there are limitations to verifying coarse-resolution data.One potential method to verify coarse-scale data is to use high-resolution images in place of ground-truth data (Kloditz andothers 1998), but it was beyond the scope of this project toacquire and classify high-resolution images as ground-truthdata. Because condition classes are qualitative rather than quan-titative attributes and because no similar fine-scale data exists,no such comparison could be made. Moreover, not all inputdata layers have quantitative accuracies associated with them.For one of the input data layers, the LCC nonforest cover types,Loveland and others (1991) verified the dataset by comparingit to other datasets such as Omernik’s (1987) ecoregions, Ma-jor Land Resource Areas, and Land Use and Land Cover, butno quantitative assessment was attempted. Accuracy tests wereperformed on the Forest Type Groups and Forest Density datalayers, but the tests were either performed in small areas
18 USDA Forest Service General Technical Report RMRS-GTR-87. 2002.
relative to the entire study area or accuracies were reportedfor very broad classes (for example, forest and nonforest) (Zhuand Evans 1994).
MANAGEMENT IMPLICATIONS
Land management agencies need to initiate proactive mea-sures to address combinations of natural resource, political,and social concerns. Obviously, not all lands can be treatedduring any given timeframe. Local criteria have been used inthe past to select areas for treatment. This study provides thefirst national-level comparison of current vegetation and fuelconditions with estimated historical conditions. These dataprovide management with an ecological basis for identifying,then selecting, priority treatment areas based on both the op-portunity and need to alter vegetation and fuel conditions.
The dynamic nature of vegetation and dead fuel conditionsof forests and grasslands predisposes large areas of the coun-try to increasing threats to loss of key components that defineecosystems, increased severity of wildland fires, and contin-ued risk to human lives and property. Recently completedmanagement plans, such as the Review and Update of the 1995Federal Wildland Fire Management Policy (U.S. 2001) andCohesive Strategy (USDA Forest Service 2000), highlight theneed for proactive management to modify existing vegetationand fuel conditions to provide long-term relief from escalat-ing risk to both societal and natural resource values (USDAForest Service 2000).
Fire Regimes I and II and the Pacific coastal shrub com-munities included in Fire Regime III will be the focus of themajority of Federal land management actions. The greatestdeparture from historical conditions has occurred in these re-gimes. The areas in these fire regimes occur primarily in thehighest population centers in the wildland urban interface, aswell as in the most productive growing sites on forest andrangelands. Addressing social and political objectives of in-creased protection in wildland urban interface areas will be acontinuing challenge in all fire regimes. The use of fire toalter vegetation and fuel conditions will be a secondary man-agement option in most of these areas, due primarily to socialsensitivity to smoke production and potential loss from escapedfires. Primary treatments of mechanical fuel manipulation shouldprecede fire use applications to reduce the potential damagefrom fire restoration or maintenance management actions.
Where natural resource objectives are the primary man-agement focus, aggressive use of fire can be highlighted as apriority to maintain existing Condition Class 1 areas in fire-adapted systems. Treatment with fire in these areas providesthe greatest return for the investment, minimizes long-termrisk to the environment, minimizes social impacts, and offersthe greatest management flexibility for the future.
Depending on each situation, restorative management ac-tions to reverse the vegetative trend in Condition Class 2environments may require a combination of both fire use andmechanical treatments to effectively and safely restore
conditions to the maintenance level. Multiple treatments forareas in Fire Regimes I and II in Condition Class 2 may berequired over one or more historical fire intervals before amaintenance level, Condition Class 1, is achieved.
Area of fire regimes III, IV, and V in Condition Classes 2and 3 will receive some focus from wildland managementagencies. Risks in these systems also occur primarily in asso-ciation with departure of vegetation and fuel composition,structure, and landscape patterns, but changes are often not asdramatic as in Fire Regimes I and II. However, fire regimesdo not exist as unlinked entities to the other fire regimes in awildfire risk, landscape, watershed, or airshed context. To avoidlandscape scale fragmentation of ecosystem processes, hydro-logic regimes, or native species habitats, it is important toprioritize and design restoration projects from an integratedecological and human perspective and to restore whole land-scapes using a watershed approach (Hann and Bunnell, inpress; Hann and others 1997, 1998, 2001; Haynes and others1996; Reiman and others 1999).
Future land management goals should include reducing therate of change from lower risk levels of losing key ecosystemcomponents (Condition Classes 1 and 2) to those with in-creased risk and loss of management flexibility (ConditionClasses 2 and 3). This study and these data strongly suggestthat continued protection from the natural disturbance ele-ment of periodic wildland fire provides only short-termsocietal benefits, and delays inevitable changes to vege-tation and fuel conditions, producing more severe conse-quences to all values.
CONCLUSIONS
The coarse-scale mapping project described in this papersuccessfully provided land managers with national-level dataon current conditions of vegetation and fuels developed fromecologically based methods to accomplish fire managementgoals and to maintain and restore ecosystems. Key to theproject was the integration of biophysical and remote sensingdata with disturbance and succession information. Data prod-ucts produced from this project can also be used as input intorisk assessments and other national-level analyses. The meth-odology used in this project could be applied to finer scales,using finer input data.
ACKNOWLEDGMENTS
This project was a success because of the assistance of manyindividuals. We thank all those who helped with the comple-tion of this project, including Janice Garner, Dalice McIntyre,Roberta Bartlette, Don Long, Cameron Johnston, DennySimmerman, Bob Burgan, Larry Bradshaw, Jane Kapler-Smith,Janet Howard, and Jack Cohen of the U.S. Department ofAgriculture, Forest Service, Rocky Mountain Research
USDA Forest Service General Technical Report RMRS-GTR-87. 2002. 19
Station, Fire Sciences Laboratory; Jim Brown and DuncanLutes, Systems for Environmental Management; SusanGoodman, Bureau of Land Management; and Delvin Bunton,John Skeels, and Lowell Lewis, USDA Forest Service. Wealso thank the condition class workshop participants: RichLasko, Barry Bollenbacher, Pat Green, Mark Grant, GlendaScott, Byron Bonney, Jeff Jones, Henry Goehle, Clint Dawson,Ron Moody, Wayne Robbie, Reggie Fletcher, Steven Zachry,Dave Thomas, Tim Belton, Kathy Geier-Hayes, Joe Carvelho,Lynn Bennett, Sue Husari, Neil Sugihara, Bernie Bahro, MarkBorchert, Tim Rich, Peter Teensma, Dave Powell, John Stivers,Finis Harris, Andi Koonce, Sybill Amelon, Clint Williams, JonRegelbrugge, Louisa Evers, Jeff Rose, Jane Kertis, Paul Tine,Dave Cleland, and Thomas Phillips with the USDA ForestService; Joe Burns with the U.S. Fish and Wildlife Service;Karen Ogle with the Bureau of Land Management; and DaveSapsis with the California Department of Forestry and FireProtection.
We also wish to thank our technical reviewers: EmilyHeyerdahl, Russ Parsons, and Bob Keane with the U.S. De-partment of Agriculture, Forest Service, Rocky MountainResearch Station, Fire Sciences Laboratory; Cristina Milesiwith the University of Montana; and Mike Hilbruner with theForest Service Washington Office.
REFERENCES
Andrews, Patricia L.; Rothermel, Richard C. 1981. Charts for inter-preting wildland fire behavior characteristics. Gen. Tech. Rep.INT-131. Ogden, UT: U.S. Department of Agriculture, ForestService, Intermountain Forest and Range Experiment Station.21 p.
Bailey, R. G.; Avers, P. E.; King, T.; McNab, W. H., eds. 1994.Ecoregions and subregions of the United States (map). Washing-ton, DC: U.S. Department of Agriculture, Forest Service.1:7,500,000. With supplementary table of map unit descriptions,compiled and edited by W. H. McNab and R. G. Bailey.
Barbour, Michael G.; Billings, William Dwight, eds. 1988. NorthAmerican terrestrial vegetation. New York: Cambridge Univer-sity Press. 434 p.
Barrett, Stephen W; Arno, Stephen F.; Key, Carl H. 1991. Fire re-gimes of western larch-lodgepole pine forests in Glacier Na-tional Park, Montana. Canadian Journal of Forest Research.21: 1711–1720.
Bian, Ling. 1997. Multiscale nature of spatial data in scaling upenvironmental models. In: Quaattrochi, Dale A.; Goodchild,Michael F., eds. Scale in remote sensing and GIS. Boca Raton,FL: Lewis Publishers: 13–26.
Bian, Ling; Butler, Rachel. 1999. Comparing effects of aggrega-tion methods on statistical and spatial properties of simulatedspatial data. Photogrammetric Engineering and Remote Sens-ing. 65(1): 73–84.
Bradshaw, Larry S.; Deeming, John E.; Burgan, Robert E.; Cohen,Jack D., comps. 1983. The 1978 National Fire-Danger RatingSystem: technical documentation. Gen. Tech. Rep. INT-169.Ogden, UT: U.S. Department of Agriculture, Forest Service,Intermountain Forest and Range Experiment Station. 44 p.
Brown, James K. 1994. Fire regimes and their relevance to ecosys-tem management. In: Proceedings of the 1994 Society of Ameri-can Foresters/Canadian Institute of Forestry Convention; 1994
September 18–22; Anchorage, AK. Bethesda, MD: Society ofAmerican Foresters: 171–178.
Brown, James K.; Arno, Stephen F.; Barrett, Stephen W.; Menakis,James P. 1994. Comparing the prescribed natural fire programwith presettlement fires in the Selway-Bitterroot Wilderness. In-ternational Journal of Wildland Fire. 4(3): 157–168.
Bunton, Delvin R. 1999. Sharing information through fire report-ing. Fire Management Notes. 59(2): 37–42.
Burgan, R. E.; Andrews, P. L.; Chase, C. H.; Hartford, R. A.; Latham,D. J. 1997. Current status of the Wildland Fire AssessmentSystem (WFAS). Fire Management Notes. 57(2): 14–17.
Cohen, Jack D. 2000. Preventing disaster: home ignitability in thewildland-urban interface. Journal of Forestry. 98(3): 15–21.
Cohen, Warren B.; Spies, Thomas A. 1992. Estimating structuralattributes of Douglas-fir/western hemlock forest stands fromLANDSAT and SPOT imagery. Remote Sensing of the Environ-ment. 41: 1–17.
Deeming, John E.; Burgan, Robert E.; Cohen, Jack D. 1977. TheNational Fire-Danger Rating System—1978. Gen. Tech. Rep.INT-39. Ogden, UT: U.S. Department of Agriculture, Forest Ser-vice, Intermountain Forest and Range Experiment Station. 63 p.
Dobson, Jerome E.; Bright, Edward A.; Coleman, Phillip R.; Durfee,Richard C.; Worley, Brian A. 2000. A global population databasefor estimating populations at risk. Photogrammetric Engineeringand Remote Sensing. Vol. 66.
Eyre, F. H., ed. 1980. Forest cover types of the United States andCanada. Washington, DC: Society of American Foresters. 147 p.
Fischer, W. C.; Miller, M.; Johnston, C. M.; Smith, J. K.;Simmerman, D. G.; Brown, J. K. 1996. Fire Effects Informa-tion System: user’s guide. Gen. Tech. Rep. INT-GTR-327.Ogden, UT: U.S. Department of Agriculture, Forest Service,Intermountain Research Station. 131 p.
Flather C. H.; Joyce, L. A.; Bloomgarden, C. A. 1994. Species en-dangerment patterns in the United States. Gen. Tech. Rep. RM-GTR-241. Fort Collins, CO: U.S. Department of Agriculture,Forest Service, Rocky Mountain Forest and Range ExperimentStation. 42 p.
Ford, P. L.; McPherson, G. R. 1999. Ecology of fire in shortgrasscommunities of the Kiowa National Grassland. In: Warwick, C.,ed. Fifteenth North American prairie conference proceedings;1996 October; St. Charles, IL. Bend, OR: The Natural AreasAssociation: 71–76.
Frost, Cecil C. 1998. Presettlement fire frequency regimes of theUnited States: a first approximation. In: Pruden, Teresa L.;Brennan, Leonard A., eds. Fire in ecosystem management: shift-ing the paradigm from suppression to prescription. Tall TimbersFire Ecology Conference Proceedings No. 20. Tallahassee, FL:Tall Timbers Research Station: 70–81.
Garrison, George A.; Bjugstad, Ardell J.; Duncan, Don A.; Lewis,Mont E.; Smith, Dixie. 1977. Vegetation and environmentalfeatures of forest and range ecosystems. Agric. Handb. 475.Washington, DC: U.S. Department of Agriculture, Forest )Ser-vice. 68 p.
Hann, W. J.; Bunnell, D. L. [In press]. Fire and land managementplanning and implementation across multiple scales. InternationalJournal of Wildland Fire. 27 p.
Hann, W. J.; Hemstrom, M. A.; Haynes, R. W.; Clifford, J. L;Gravenmier, R. A. 2001. Cost and effectiveness of multi-scaleintegrated management. Forest Ecology and Management.153: 127–145.
Hann, W. J.; Jones, J. L; Keane, R. I.; Hessburg, P. F.; Gravenmier,R. A. 1998. Landscape dynamics. Journal of Forestry.96(10): 10–15.
Hann, Wendel J.; Jones, Jeffrey L.; Karl, Michael G.; [and others].1997. Landscape dynamics of the Basin. Chapter 3. In: Quigley,Thomas M.; Arbelbide, Sylvia J., tech. eds. An assessment ofecosystem components in the Interior Columbia Basin and por-tions of the Klamath and Great Basins: Vol. 2. Gen. Tech. Rep.
20 USDA Forest Service General Technical Report RMRS-GTR-87. 2002.
PNW-GTR-405. Portland, OR: U.S. Department of Agriculture,Forest Service, Pacific Northwest Research Station.
Hardy, C. C.; Menakis, J. P.; Long, D. G.; Brown, J. K.; Bunnell,D. L. 1998. Mapping historic fire regimes for the Western UnitedStates: integrating remote sensing and biophysical data. In: Pro-ceedings of the seventh biennial Forest Service remote sensingapplications conference; 1998 April 6–9; Nassau Bay, TX.Bethesda, MD: American Society for Photogrammetry andRemote Sensing: 288–300.
Haynes, R. W.; Graham, R. T.; Quigley, T. M., tech. eds. 1996. Aframework for ecosystem management in the Interior Colum-bia Basin and portions of the Klamath and Great Basins. Gen.Tech. Rep. PNW-GTR-374. Portland, OR: U.S. Departmentof Agriculture, Forest Service, Pacific Northwest ResearchStation. 66 p.
Heinselman, Miron L. 1981. Fire intensity and frequency as factorsin the distribution and structure of Northern ecosystems. In: Fireregimes and ecosystem properties: proceedings of the conference;1978 December 11–15; Honolulu, HI. Gen Tech. Rep. WO-26.Washington, DC: U.S. Department of Agriculture, Forest Ser-vice: 7–57.
Hunter, M. L., Jr. 1993. Natural fire regimes as spatial models formanaging boreal forests. Biological Conservation. 65: 115–120.
Keane, R. E.; Garner, Janice L.; Schmidt, Kirsten M.; Long, DonaldG.; Menakis, James P.; Finney, Mark A. 1998. Development ofthe input data layers for the FARSITE fire growth model for theSelway-Bitterroot Wilderness Complex, USA. Gen. Tech. Rep.RMRS-GTR-3. Ogden, UT: U.S. Department of Agriculture,Forest Service. Rocky Mountain Research Station. 121 p.
Keane, R. E.; Long, D. G.; Menakis, J. P.; Hann, W. J.; Bevins, C. D.1996. Simulating coarse-scale vegetation dynamics using theColumbia River Basin Succession Model—CRBSUM. Gen. Tech.Rep. INT-GTR-340. Ogden, UT: U.S. Department of Agricul-ture, Forest Service, Intermountain Research Station. 50 p.
Keane, Robert E.; Mincemoyer, Scott A.; Schmidt, Kirsten M.; Long,Donald G.; Garner, Janice L. 2000. Mapping vegetation and fu-els for fire management on the Gila National Forest Complex,New Mexico, [CD-ROM]. Gen. Tech. Rep. RMRS-GTR-46-CD.Ogden, UT: U.S. Department of Agriculture, Forest Service,Rocky Mountain Research Station. 131 p.
Kloditz, Christiane; Boxtel, Angelien; Carfagna, Elisabetta; vanDeursen, William. 1998. Estimating the accuracy of coarse scaleclassification using high scale information. PhotogrammetricEngineering and Remote Sensing. 64(2): 127–133.
Küchler, A. W. 1964. Potential natural vegetation of the contermi-nous United States (manual and map.) Special Publ. 36, 1965rev. New York: American Geographical Society. 116 p.
Küchler, A. W. 1975. Potential natural vegetation of the contermi-nous United States. 2d ed. Map 1:3,168,000. American Geo-graphical Society.
Loveland, T. R.; Merchant, J. M.; Ohlen, D. O.; Brown, J. F. 1991.Development of a landcover characteristics database for the con-terminous U.S. Photogrammetric Engineering and Remote Sens-ing. 57(11): 1453–1463.
Loveland, T. R.; Ohlen, D. O. 1993. Experimental AVHRR landdata sets for environmental monitoring and modeling. In:Goodchild, M. F.; Parks, B. O.; Steyaert, L. T., comps., eds.Environmental modeling with GIS. New York: Oxford Uni-versity Press: 379–385.
McNab, W. Henry; Avers, Peter E., comps. 1994. Ecological subre-gions of the United States: section descriptions. WO-WSA-5.Washington, DC: U.S. Department of Agriculture, Forest Ser-vice, Ecosytem Management. 52 p.
Menakis, J. P.; Cohen, J. D.; Bradshaw, L. S. [In preparation]. Map-ping wildland fire risk to flammable structures for the conter-minous United States. In: Brennan, L. A.; [and others], eds.National Congress on Fire Ecology, Prevention, and Manage-
ment Proceedings No. 1. Tallahassee, FL: Tall Timbers Re-search Station.
Morgan, P.; Bunting, S. C.; Black, A. E.; Merrill, T.; Barrett, S. 1996.Fire regimes in the Interior Columbia River Basin: past andpresent. Final Report for RJVA-INT-94913. On file at: U.S. De-partment of Agriculture, Forest Service, Rocky Mountain Re-search Station, Fire Sciences Laboratory, Missoula, MT. 31 p.
Omernik, J. M. 1987. Ecoregions of the conterminous UnitedStates: annals of the Association of American Geographers.77(1): 188–125.
Powell, Douglas S.; Faulkner, Joanne; Darr, David R.; Zhu, Zhiliang;MacCleery, Douglas W. 1992. Forest resources of the UnitedStates, 1992. Gen. Tech. Rep. RM-234. Fort Collins, CO: U.S.Department of Agriculture, Forest Service, Rocky MountainForest and Range Experiment Station. 132 p.
Quigley, Thomas M.; Graham, Russell T.; Haynes, Richard W. 1996.An integrated scientific assessment for ecosystem managementin the Interior Columbia River Basin and portions of theKlamath and Great Basins. Gen. Tech. Rep. PNW-GTR-382. Port-land, OR: U.S. Department of Agriculture, Forest Service,Pacific Northwest Research Station. 303 p.
Raphael, Martin G.; Holthausen, Richard S.; Marcot, Bruce G.; [andothers]. 2000. Effects of SDEIS alternatives on selected terres-trial vertebrates of conservation concern within the InteriorColumbia River Basin Ecosystem Management Project. In:Quigley; [and others], tech. eds. Draft science advisory groupeffects analysis for the SDEIS alternatives. Internal Working Draft.On file with: U.S. Department of Agriculture, Forest Service;U.S. Department of Interior, Bureau of Land Management,Interior Columbia Basin Ecosystem Management Project, Port-land, OR.
Rieman, Bruce; Howell, Phil; Clayton, Jim; [and others]. 1999. Draftaquatic effects analysis of the SDEIS alternatives. In: Quigley;[and others], tech. eds. Draft science advisory group effects analy-sis for the SDEIS alternatives. Internal Working Draft. On filewith: U.S. Department of Agriculture, Forest Service; U.S.Department of Interior, Bureau of Land Management, InteriorColumbia Basin Ecosystem Management Project, Portland, OR.
Rockwell, D. 1998. The nature of North America: rocks, plants, andanimals. New York: The Berkley Publishing Group. 379 p.
Seaber, P. R; Kapinos, F. Paul; Knapp, G. L. 1987. Hydrologic unitmaps. Water Supply Paper 2294. U.S. Geologic Survey. 63 p.
Smith, Jane Kapler; Fischer, William C. 1997. Fire ecology of theforest habitat types of northern Idaho. Gen. Tech. Rep. INT-363.Ogden, UT: U.S. Department of Agriculture, Forest Service, In-termountain Research Station. 142 p.
Stuever, Mary C.; Crawford, Clifford S.; Molles, Manuel C.; White,Carleton S.; Muldavin, Esteban. 1997. Initial assessment of therole of fire in the middle Rio Grande bosque. In: Greenlee, J. M.,ed. Proceedings: first conference on fire effects on rare and en-dangered species and habitats; 1995 November 13–16; Coeur d’Alene, ID. Fairfield, WA: International Association of WildlandFire: 275–283.
Turner, Monica G.; O’Neill, Robert V.; Gardner, Robert H.; Milne,Bruce T. 1989. Effects of changing spatial scale on the analy-sis of landscape pattern. Landscape Ecology. 3(3,4): 153-162.
U.S. Department of Agriculture. 2001. Review and update of the1995 Federal wildland fire management policy report. On file at:National Interagency Fire Center, External Affairs Office, 3833South Development Avenue, Boise, ID 83705. 78 p.
U.S. Department of Agriculture, Forest Service. 1993. NationalInteragency Fire Management Integrated Database (NIFMID)reference manual. Washington, DC: U.S. Department of Agri-culture, Forest Service, Fire and Aviation Management. 58 p.
U.S. Department of Agriculture, Forest Service. 1998. Wildland FireAssessment System. [Online] Fire Behavior Research Work Unit,Rocky Mountain Research Station (producer). Available: http://www.fs.fed.us/land/wfas [1999, December].
USDA Forest Service General Technical Report RMRS-GTR-87. 2002. 21
U.S. Department of Agriculture, Forest Service. 2000. Protectingpeople and sustaining resources in fire-adapted ecosystems: acohesive strategy. The Forest Service management response tothe General Accounting Office Report GAO/RCED-99-65, April13, 2000. 89 p.
United States General Accounting Office. 1999. Western NationalForests: a cohesive strategy is needed to address catastrophicwildfire threats. Report to the subcommittee on forests and for-est health, committee on resources, House of Representatives.GAO/RCED-99-65. 60 p.
United States Geological Survey. 1994. A 500-meter resolution digitalelevation model of the U.S. and Southern Canada. Oklahoma City,OK: U.S. Geological Survey.
Vail, Delmar. 1994. Symposium introduction: management of semi-arid rangelands—impacts of annual weeds on resource values.In: Monsen, Stephen B.; Kitchen, Stanley G., eds. Proceedings—ecology and management of annual rangelands; 1992 May 18–22;Boise, ID: Gen. Tech. Rep. INT-GTR-313. Ogden, UT: U.S.Department of Agriculture, Forest Service, Intermountain Re-search Station: 3–4.
Weins, J. A. 1989. Spatial scaling in ecology. Functional Ecology.3: 385–397.
West, Neil E. 1994. Effects of fire on salt-desert shrub rangelands.In: Monsen, Stephen B.; Kitchen, Stanley G., eds. Proceedings—ecology and management of annual rangelands; 1992 May 18–22; Boise, ID: Gen. Tech. Rep. INT-GTR-313. Ogden, UT: U.S.Department of Agriculture, Forest Service, IntermountainResearch Station: 71–74.
Whisenant, S. G. 1990. Changing fire frequencies on Idaho’s SnakeRiver plains: ecological and management implications. In:McArthur, E. Durant; Romney, Evan M.; Smith, Stanley D.;Tueller, Dave T., comps. Proceedings—symposium on cheatgrassinvasion, shrub die-off and other aspects of shrub biology andmanagement; 1989 April 5–7; Las Vegas, NV. Gen. Tech. Rep.INT-276. Ogden, UT: U.S. Department of Agriculture, ForestService, Intermountain Research Station: 4–10.
Wisdom, Michael J.; Holthausen, Richard S.; Lee, Danny C.; [andothers]. 2000. Source habitats for terrestrial vertebrates of focusin the Interior Columbia Basin: broad-scale trends and manage-ment implications. Working Draft. 4 Vol. On file with: U.S. De-partment of Agriculture, Forest Service; U.S. Department ofInterior, Bureau of Land Management; Interior Columbia BasinEcosystem Management Project, 112 E. Poplar, Walla Walla, WA99362.
Wright, Henry A.; Bailey, Arthur W. 1982. Fire ecology: UnitedStates and Southern Canada. New York: John Wiley & Sons.501 p.
Zhu, Zhiliang. 1994. Forest density mapping in the lower 48 States:a regression procedure. Res. Pap. SO-280. New Orleans, LA:U.S. Department of Agriculture, Forest Service, Southern ForestExperiment Station. 11 p.
Zhu, Zhiliang; Evans, David L. 1992. Mapping midsouth forestdistributions. Journal of Forestry. 90(12): 27–30.
Zhu, Zhiliang; Evans, David L. 1994. U.S. forest types and pre-dicted percent forest cover from AVHRR data. PhotogrammetricEngineering and Remote Sensing. 60(5): 525–531.
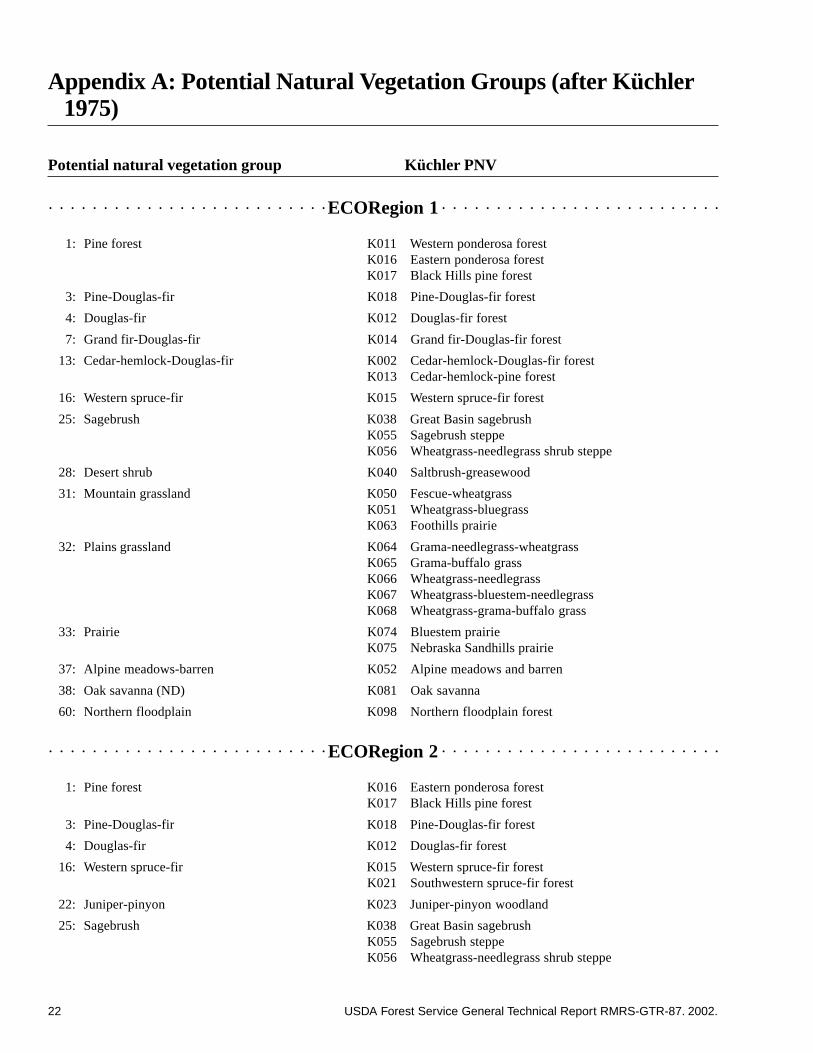
22 USDA Forest Service General Technical Report RMRS-GTR-87. 2002.
Appendix A: Potential Natural Vegetation Groups (after Küchler1975)
Potential natural vegetation group Küchler PNV
ECORegion 1
1: Pine forest K011 Western ponderosa forestK016 Eastern ponderosa forestK017 Black Hills pine forest
3: Pine-Douglas-fir K018 Pine-Douglas-fir forest
4: Douglas-fir K012 Douglas-fir forest
7: Grand fir-Douglas-fir K014 Grand fir-Douglas-fir forest
13: Cedar-hemlock-Douglas-fir K002 Cedar-hemlock-Douglas-fir forestK013 Cedar-hemlock-pine forest
16: Western spruce-fir K015 Western spruce-fir forest
25: Sagebrush K038 Great Basin sagebrushK055 Sagebrush steppeK056 Wheatgrass-needlegrass shrub steppe
28: Desert shrub K040 Saltbrush-greasewood
31: Mountain grassland K050 Fescue-wheatgrassK051 Wheatgrass-bluegrassK063 Foothills prairie
32: Plains grassland K064 Grama-needlegrass-wheatgrassK065 Grama-buffalo grassK066 Wheatgrass-needlegrassK067 Wheatgrass-bluestem-needlegrassK068 Wheatgrass-grama-buffalo grass
33: Prairie K074 Bluestem prairieK075 Nebraska Sandhills prairie
37: Alpine meadows-barren K052 Alpine meadows and barren
38: Oak savanna (ND) K081 Oak savanna
60: Northern floodplain K098 Northern floodplain forest
ECORegion 2
1: Pine forest K016 Eastern ponderosa forestK017 Black Hills pine forest
3: Pine-Douglas-fir K018 Pine-Douglas-fir forest
4: Douglas-fir K012 Douglas-fir forest
16: Western spruce-fir K015 Western spruce-fir forestK021 Southwestern spruce-fir forest
22: Juniper-pinyon K023 Juniper-pinyon woodland
25: Sagebrush K038 Great Basin sagebrushK055 Sagebrush steppeK056 Wheatgrass-needlegrass shrub steppe
○ ○ ○ ○ ○ ○ ○ ○ ○ ○ ○ ○ ○ ○ ○ ○ ○ ○ ○ ○ ○ ○ ○ ○ ○ ○ ○ ○ ○ ○ ○ ○ ○ ○ ○ ○ ○ ○ ○ ○ ○ ○ ○ ○ ○ ○ ○ ○ ○ ○ ○ ○
○ ○ ○ ○ ○ ○ ○ ○ ○ ○ ○ ○ ○ ○ ○ ○ ○ ○ ○ ○ ○ ○ ○ ○ ○ ○ ○ ○ ○ ○ ○ ○ ○ ○ ○ ○ ○ ○ ○ ○ ○ ○ ○ ○ ○ ○ ○ ○ ○ ○ ○ ○
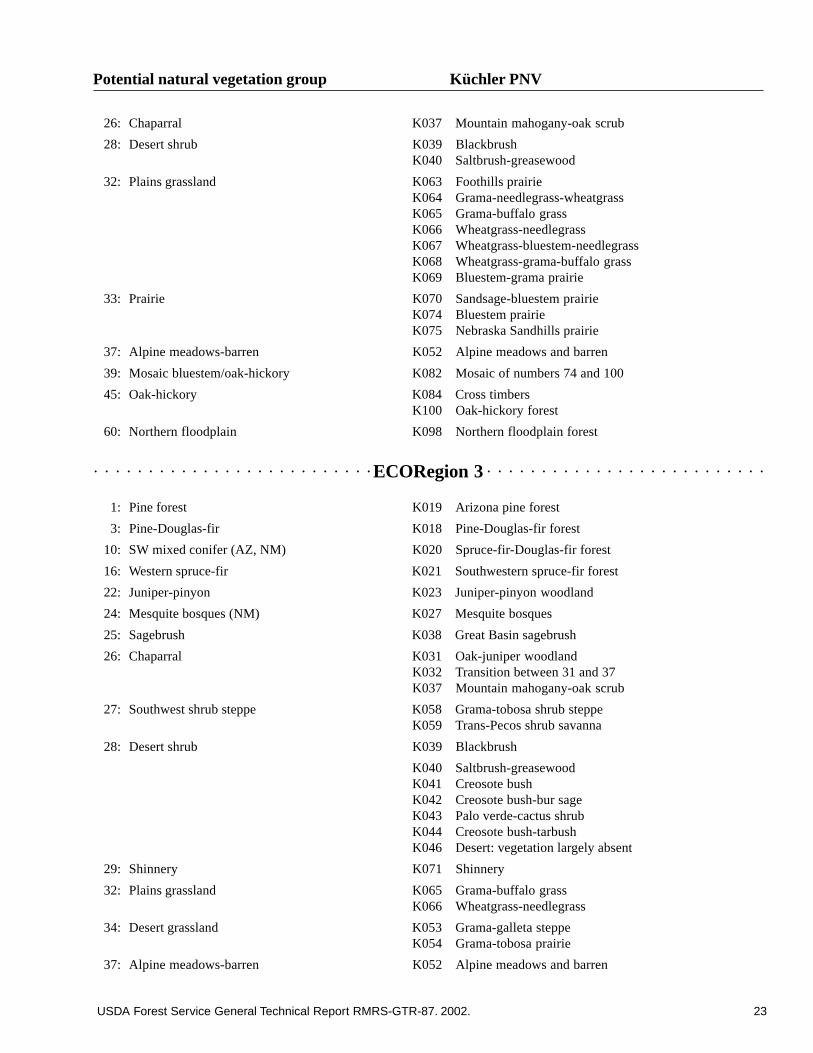
USDA Forest Service General Technical Report RMRS-GTR-87. 2002. 23
Potential natural vegetation group Küchler PNV
26: Chaparral K037 Mountain mahogany-oak scrub
28: Desert shrub K039 BlackbrushK040 Saltbrush-greasewood
32: Plains grassland K063 Foothills prairieK064 Grama-needlegrass-wheatgrassK065 Grama-buffalo grassK066 Wheatgrass-needlegrassK067 Wheatgrass-bluestem-needlegrassK068 Wheatgrass-grama-buffalo grassK069 Bluestem-grama prairie
33: Prairie K070 Sandsage-bluestem prairieK074 Bluestem prairieK075 Nebraska Sandhills prairie
37: Alpine meadows-barren K052 Alpine meadows and barren
39: Mosaic bluestem/oak-hickory K082 Mosaic of numbers 74 and 100
45: Oak-hickory K084 Cross timbersK100 Oak-hickory forest
60: Northern floodplain K098 Northern floodplain forest
ECORegion 3
1: Pine forest K019 Arizona pine forest
3: Pine-Douglas-fir K018 Pine-Douglas-fir forest
10: SW mixed conifer (AZ, NM) K020 Spruce-fir-Douglas-fir forest
16: Western spruce-fir K021 Southwestern spruce-fir forest
22: Juniper-pinyon K023 Juniper-pinyon woodland
24: Mesquite bosques (NM) K027 Mesquite bosques
25: Sagebrush K038 Great Basin sagebrush
26: Chaparral K031 Oak-juniper woodlandK032 Transition between 31 and 37K037 Mountain mahogany-oak scrub
27: Southwest shrub steppe K058 Grama-tobosa shrub steppeK059 Trans-Pecos shrub savanna
28: Desert shrub K039 Blackbrush
K040 Saltbrush-greasewoodK041 Creosote bushK042 Creosote bush-bur sageK043 Palo verde-cactus shrubK044 Creosote bush-tarbushK046 Desert: vegetation largely absent
29: Shinnery K071 Shinnery
32: Plains grassland K065 Grama-buffalo grassK066 Wheatgrass-needlegrass
34: Desert grassland K053 Grama-galleta steppeK054 Grama-tobosa prairie
37: Alpine meadows-barren K052 Alpine meadows and barren
○ ○ ○ ○ ○ ○ ○ ○ ○ ○ ○ ○ ○ ○ ○ ○ ○ ○ ○ ○ ○ ○ ○ ○ ○ ○ ○ ○ ○ ○ ○ ○ ○ ○ ○ ○ ○ ○ ○ ○ ○ ○ ○ ○ ○ ○ ○ ○ ○ ○ ○ ○
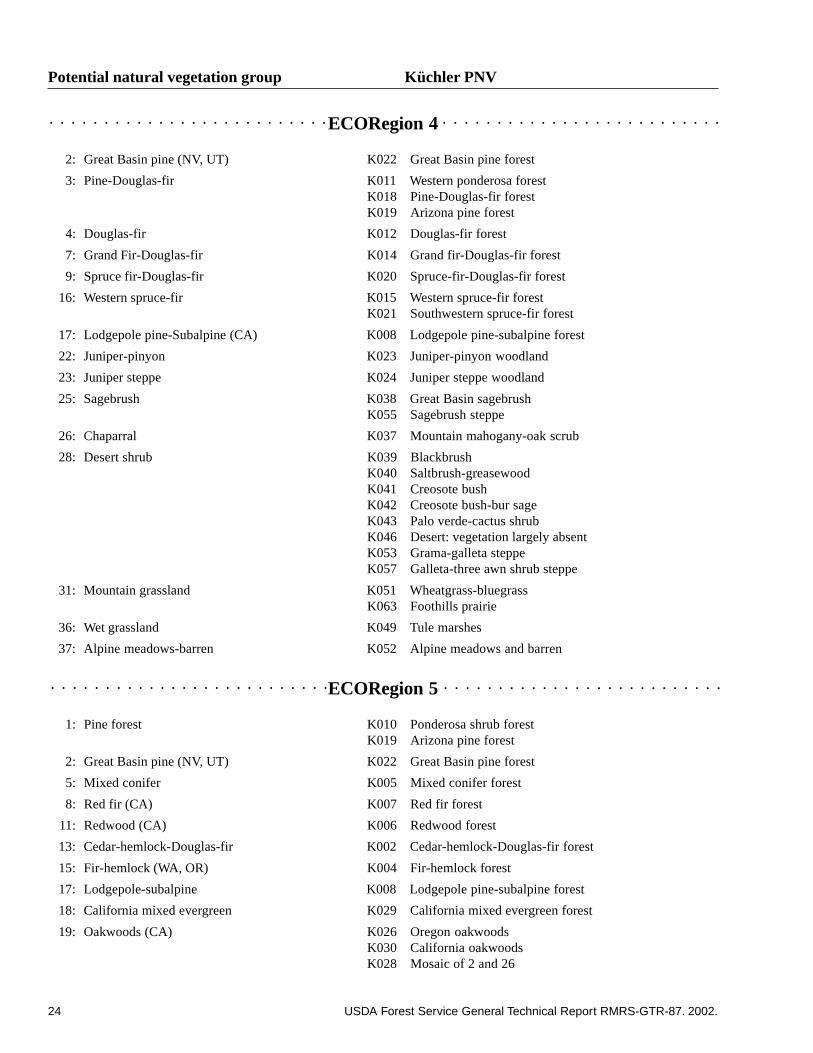
24 USDA Forest Service General Technical Report RMRS-GTR-87. 2002.
Potential natural vegetation group Küchler PNV
ECORegion 4
2: Great Basin pine (NV, UT) K022 Great Basin pine forest
3: Pine-Douglas-fir K011 Western ponderosa forestK018 Pine-Douglas-fir forestK019 Arizona pine forest
4: Douglas-fir K012 Douglas-fir forest
7: Grand Fir-Douglas-fir K014 Grand fir-Douglas-fir forest
9: Spruce fir-Douglas-fir K020 Spruce-fir-Douglas-fir forest
16: Western spruce-fir K015 Western spruce-fir forestK021 Southwestern spruce-fir forest
17: Lodgepole pine-Subalpine (CA) K008 Lodgepole pine-subalpine forest
22: Juniper-pinyon K023 Juniper-pinyon woodland
23: Juniper steppe K024 Juniper steppe woodland
25: Sagebrush K038 Great Basin sagebrushK055 Sagebrush steppe
26: Chaparral K037 Mountain mahogany-oak scrub
28: Desert shrub K039 BlackbrushK040 Saltbrush-greasewoodK041 Creosote bushK042 Creosote bush-bur sageK043 Palo verde-cactus shrubK046 Desert: vegetation largely absentK053 Grama-galleta steppeK057 Galleta-three awn shrub steppe
31: Mountain grassland K051 Wheatgrass-bluegrassK063 Foothills prairie
36: Wet grassland K049 Tule marshes
37: Alpine meadows-barren K052 Alpine meadows and barren
ECORegion 5
1: Pine forest K010 Ponderosa shrub forestK019 Arizona pine forest
2: Great Basin pine (NV, UT) K022 Great Basin pine forest
5: Mixed conifer K005 Mixed conifer forest
8: Red fir (CA) K007 Red fir forest
11: Redwood (CA) K006 Redwood forest
13: Cedar-hemlock-Douglas-fir K002 Cedar-hemlock-Douglas-fir forest
15: Fir-hemlock (WA, OR) K004 Fir-hemlock forest
17: Lodgepole-subalpine K008 Lodgepole pine-subalpine forest
18: California mixed evergreen K029 California mixed evergreen forest
19: Oakwoods (CA) K026 Oregon oakwoodsK030 California oakwoodsK028 Mosaic of 2 and 26
○ ○ ○ ○ ○ ○ ○ ○ ○ ○ ○ ○ ○ ○ ○ ○ ○ ○ ○ ○ ○ ○ ○ ○ ○ ○ ○ ○ ○ ○ ○ ○ ○ ○ ○ ○ ○ ○ ○ ○ ○ ○ ○ ○ ○ ○ ○ ○ ○ ○ ○ ○
○ ○ ○ ○ ○ ○ ○ ○ ○ ○ ○ ○ ○ ○ ○ ○ ○ ○ ○ ○ ○ ○ ○ ○ ○ ○ ○ ○ ○ ○ ○ ○ ○ ○ ○ ○ ○ ○ ○ ○ ○ ○ ○ ○ ○ ○ ○ ○ ○ ○ ○ ○
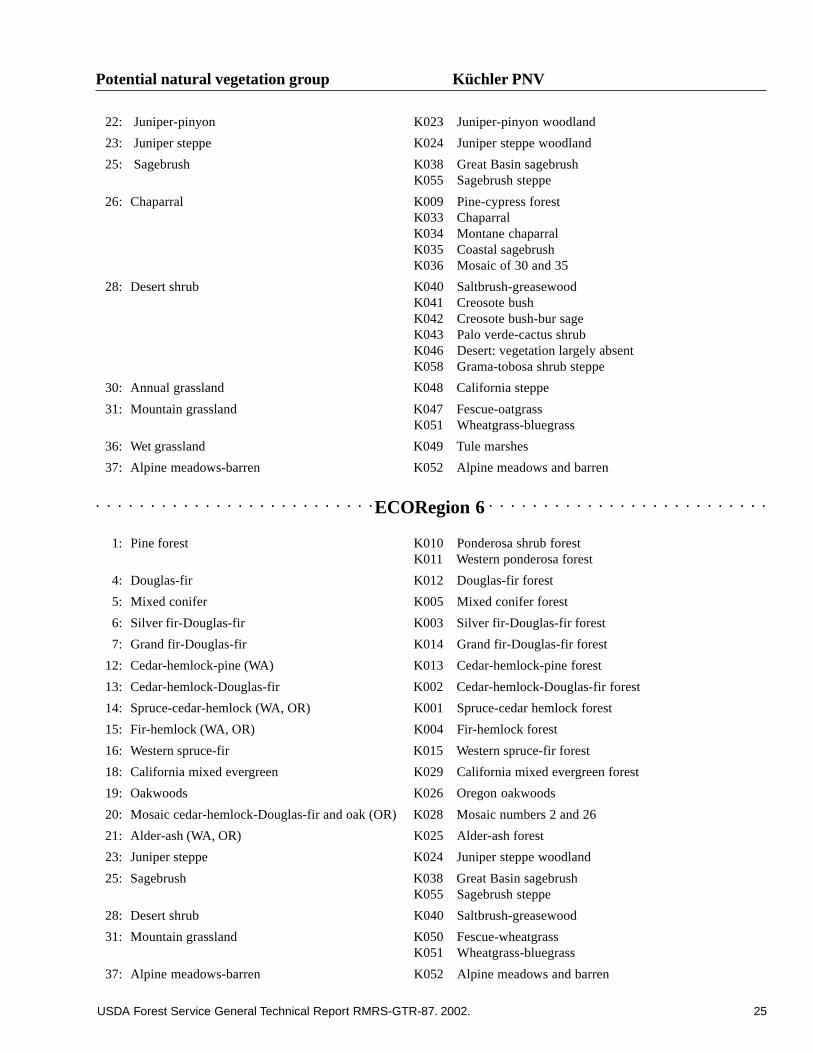
USDA Forest Service General Technical Report RMRS-GTR-87. 2002. 25
Potential natural vegetation group Küchler PNV
22: Juniper-pinyon K023 Juniper-pinyon woodland
23: Juniper steppe K024 Juniper steppe woodland
25: Sagebrush K038 Great Basin sagebrushK055 Sagebrush steppe
26: Chaparral K009 Pine-cypress forestK033 ChaparralK034 Montane chaparralK035 Coastal sagebrushK036 Mosaic of 30 and 35
28: Desert shrub K040 Saltbrush-greasewoodK041 Creosote bushK042 Creosote bush-bur sageK043 Palo verde-cactus shrubK046 Desert: vegetation largely absentK058 Grama-tobosa shrub steppe
30: Annual grassland K048 California steppe
31: Mountain grassland K047 Fescue-oatgrassK051 Wheatgrass-bluegrass
36: Wet grassland K049 Tule marshes
37: Alpine meadows-barren K052 Alpine meadows and barren
ECORegion 6
1: Pine forest K010 Ponderosa shrub forestK011 Western ponderosa forest
4: Douglas-fir K012 Douglas-fir forest
5: Mixed conifer K005 Mixed conifer forest
6: Silver fir-Douglas-fir K003 Silver fir-Douglas-fir forest
7: Grand fir-Douglas-fir K014 Grand fir-Douglas-fir forest
12: Cedar-hemlock-pine (WA) K013 Cedar-hemlock-pine forest
13: Cedar-hemlock-Douglas-fir K002 Cedar-hemlock-Douglas-fir forest
14: Spruce-cedar-hemlock (WA, OR) K001 Spruce-cedar hemlock forest
15: Fir-hemlock (WA, OR) K004 Fir-hemlock forest
16: Western spruce-fir K015 Western spruce-fir forest
18: California mixed evergreen K029 California mixed evergreen forest
19: Oakwoods K026 Oregon oakwoods
20: Mosaic cedar-hemlock-Douglas-fir and oak (OR) K028 Mosaic numbers 2 and 26
21: Alder-ash (WA, OR) K025 Alder-ash forest
23: Juniper steppe K024 Juniper steppe woodland
25: Sagebrush K038 Great Basin sagebrushK055 Sagebrush steppe
28: Desert shrub K040 Saltbrush-greasewood
31: Mountain grassland K050 Fescue-wheatgrassK051 Wheatgrass-bluegrass
37: Alpine meadows-barren K052 Alpine meadows and barren
○ ○ ○ ○ ○ ○ ○ ○ ○ ○ ○ ○ ○ ○ ○ ○ ○ ○ ○ ○ ○ ○ ○ ○ ○ ○ ○ ○ ○ ○ ○ ○ ○ ○ ○ ○ ○ ○ ○ ○ ○ ○ ○ ○ ○ ○ ○ ○ ○ ○ ○ ○
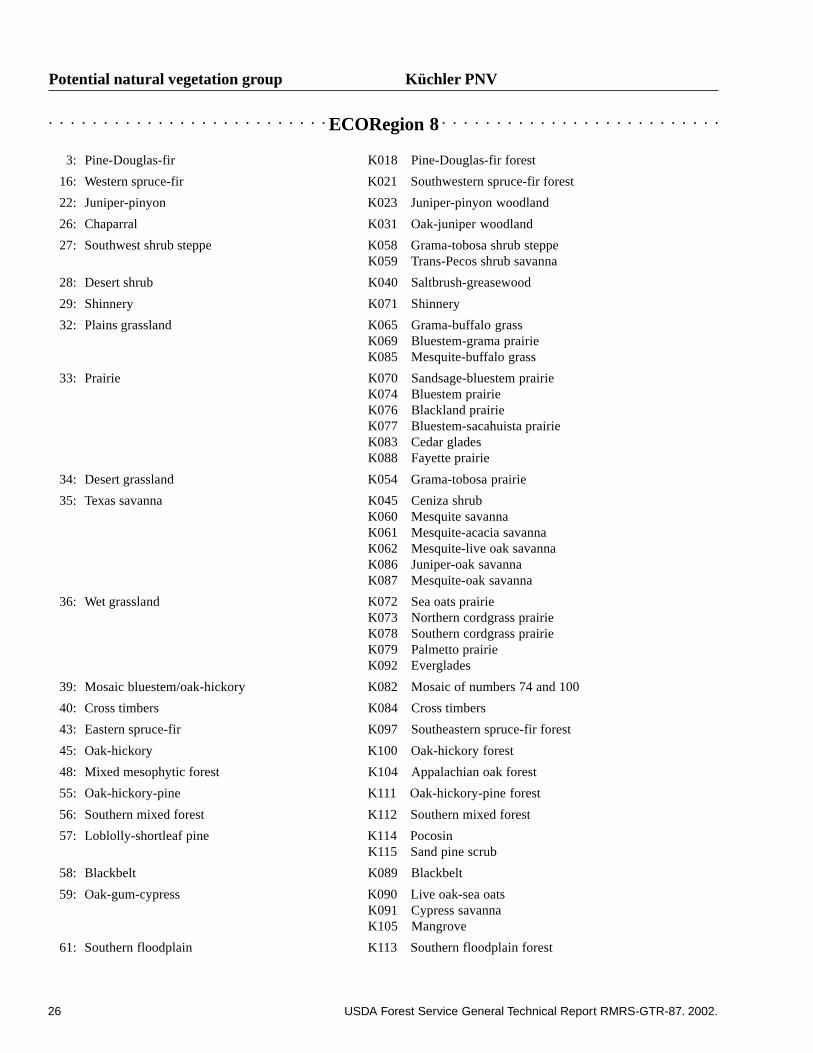
26 USDA Forest Service General Technical Report RMRS-GTR-87. 2002.
Potential natural vegetation group Küchler PNV
ECORegion 8
3: Pine-Douglas-fir K018 Pine-Douglas-fir forest
16: Western spruce-fir K021 Southwestern spruce-fir forest
22: Juniper-pinyon K023 Juniper-pinyon woodland
26: Chaparral K031 Oak-juniper woodland
27: Southwest shrub steppe K058 Grama-tobosa shrub steppeK059 Trans-Pecos shrub savanna
28: Desert shrub K040 Saltbrush-greasewood
29: Shinnery K071 Shinnery
32: Plains grassland K065 Grama-buffalo grassK069 Bluestem-grama prairieK085 Mesquite-buffalo grass
33: Prairie K070 Sandsage-bluestem prairieK074 Bluestem prairieK076 Blackland prairieK077 Bluestem-sacahuista prairieK083 Cedar gladesK088 Fayette prairie
34: Desert grassland K054 Grama-tobosa prairie
35: Texas savanna K045 Ceniza shrubK060 Mesquite savannaK061 Mesquite-acacia savannaK062 Mesquite-live oak savannaK086 Juniper-oak savannaK087 Mesquite-oak savanna
36: Wet grassland K072 Sea oats prairieK073 Northern cordgrass prairieK078 Southern cordgrass prairieK079 Palmetto prairieK092 Everglades
39: Mosaic bluestem/oak-hickory K082 Mosaic of numbers 74 and 100
40: Cross timbers K084 Cross timbers
43: Eastern spruce-fir K097 Southeastern spruce-fir forest
45: Oak-hickory K100 Oak-hickory forest
48: Mixed mesophytic forest K104 Appalachian oak forest
55: Oak-hickory-pine K111 Oak-hickory-pine forest
56: Southern mixed forest K112 Southern mixed forest
57: Loblolly-shortleaf pine K114 PocosinK115 Sand pine scrub
58: Blackbelt K089 Blackbelt
59: Oak-gum-cypress K090 Live oak-sea oatsK091 Cypress savannaK105 Mangrove
61: Southern floodplain K113 Southern floodplain forest
○ ○ ○ ○ ○ ○ ○ ○ ○ ○ ○ ○ ○ ○ ○ ○ ○ ○ ○ ○ ○ ○ ○ ○ ○ ○ ○ ○ ○ ○ ○ ○ ○ ○ ○ ○ ○ ○ ○ ○ ○ ○ ○ ○ ○ ○ ○ ○ ○ ○ ○ ○
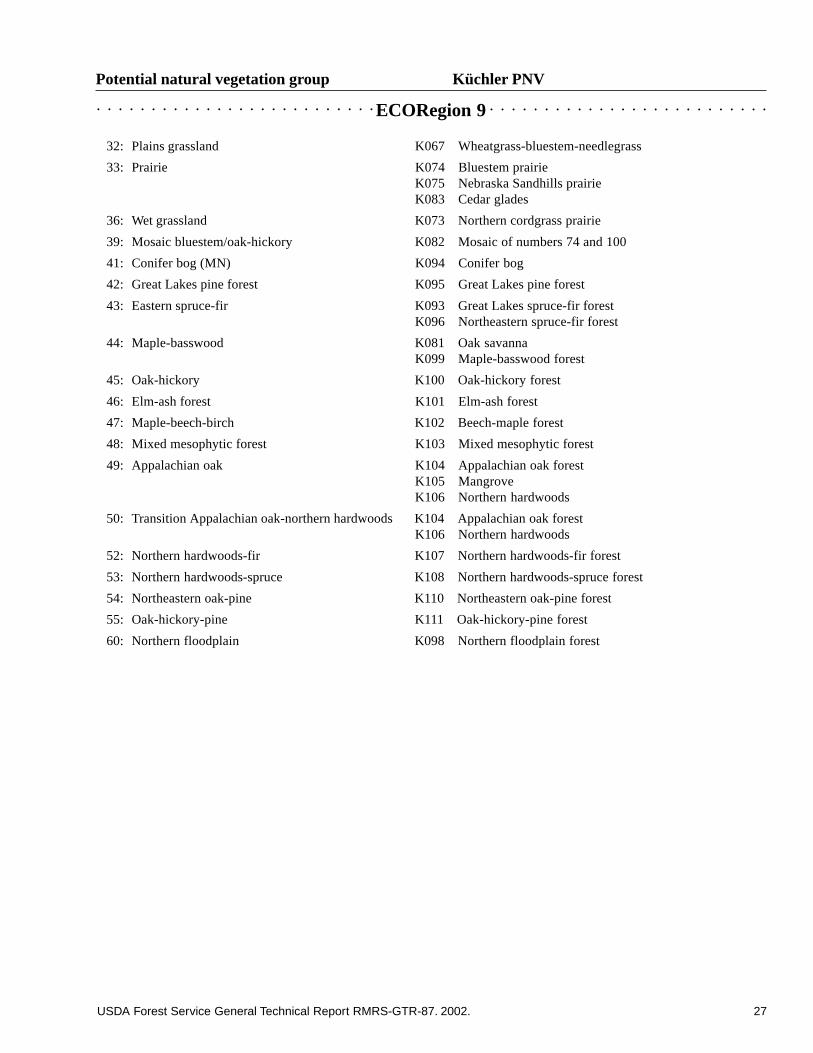
USDA Forest Service General Technical Report RMRS-GTR-87. 2002. 27
Potential natural vegetation group Küchler PNV
ECORegion 9
32: Plains grassland K067 Wheatgrass-bluestem-needlegrass
33: Prairie K074 Bluestem prairieK075 Nebraska Sandhills prairieK083 Cedar glades
36: Wet grassland K073 Northern cordgrass prairie
39: Mosaic bluestem/oak-hickory K082 Mosaic of numbers 74 and 100
41: Conifer bog (MN) K094 Conifer bog
42: Great Lakes pine forest K095 Great Lakes pine forest
43: Eastern spruce-fir K093 Great Lakes spruce-fir forestK096 Northeastern spruce-fir forest
44: Maple-basswood K081 Oak savannaK099 Maple-basswood forest
45: Oak-hickory K100 Oak-hickory forest
46: Elm-ash forest K101 Elm-ash forest
47: Maple-beech-birch K102 Beech-maple forest
48: Mixed mesophytic forest K103 Mixed mesophytic forest
49: Appalachian oak K104 Appalachian oak forestK105 MangroveK106 Northern hardwoods
50: Transition Appalachian oak-northern hardwoods K104 Appalachian oak forestK106 Northern hardwoods
52: Northern hardwoods-fir K107 Northern hardwoods-fir forest
53: Northern hardwoods-spruce K108 Northern hardwoods-spruce forest
54: Northeastern oak-pine K110 Northeastern oak-pine forest
55: Oak-hickory-pine K111 Oak-hickory-pine forest
60: Northern floodplain K098 Northern floodplain forest
○ ○ ○ ○ ○ ○ ○ ○ ○ ○ ○ ○ ○ ○ ○ ○ ○ ○ ○ ○ ○ ○ ○ ○ ○ ○ ○ ○ ○ ○ ○ ○ ○ ○ ○ ○ ○ ○ ○ ○ ○ ○ ○ ○ ○ ○ ○ ○ ○ ○ ○ ○
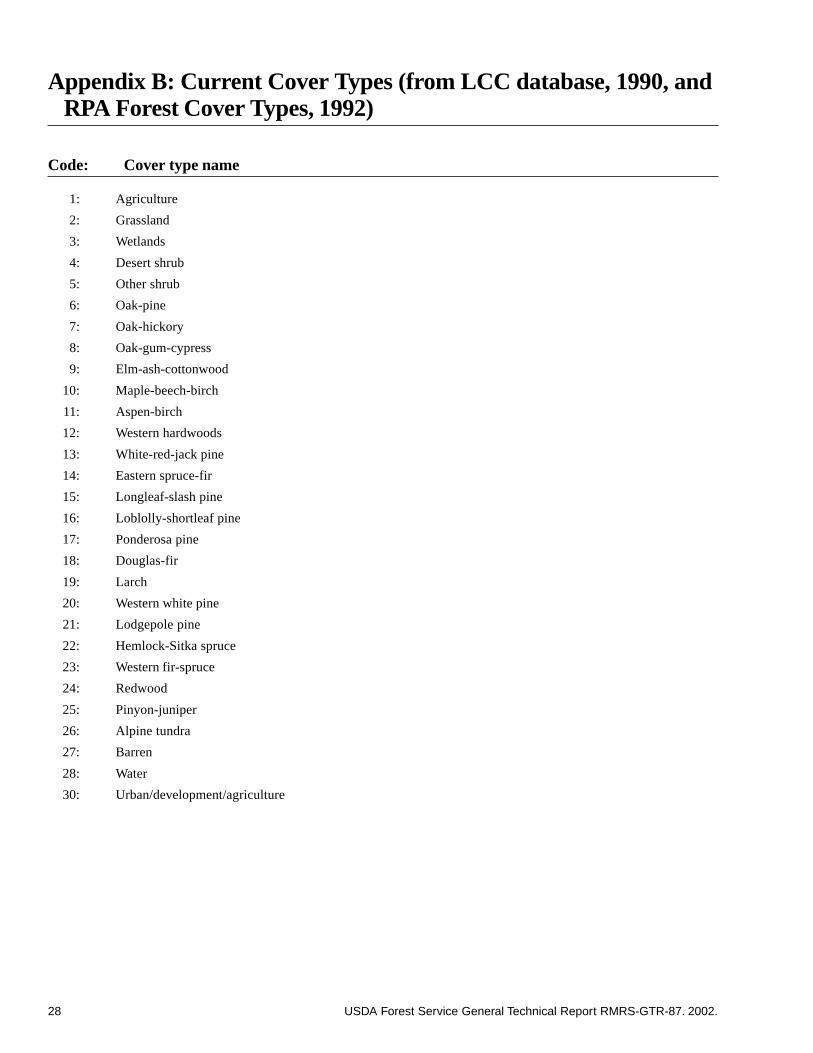
28 USDA Forest Service General Technical Report RMRS-GTR-87. 2002.
Appendix B: Current Cover Types (from LCC database, 1990, andRPA Forest Cover Types, 1992)
Code: Cover type name
1: Agriculture
2: Grassland
3: Wetlands
4: Desert shrub
5: Other shrub
6: Oak-pine
7: Oak-hickory
8: Oak-gum-cypress
9: Elm-ash-cottonwood
10: Maple-beech-birch
11: Aspen-birch
12: Western hardwoods
13: White-red-jack pine
14: Eastern spruce-fir
15: Longleaf-slash pine
16: Loblolly-shortleaf pine
17: Ponderosa pine
18: Douglas-fir
19: Larch
20: Western white pine
21: Lodgepole pine
22: Hemlock-Sitka spruce
23: Western fir-spruce
24: Redwood
25: Pinyon-juniper
26: Alpine tundra
27: Barren
28: Water
30: Urban/development/agriculture
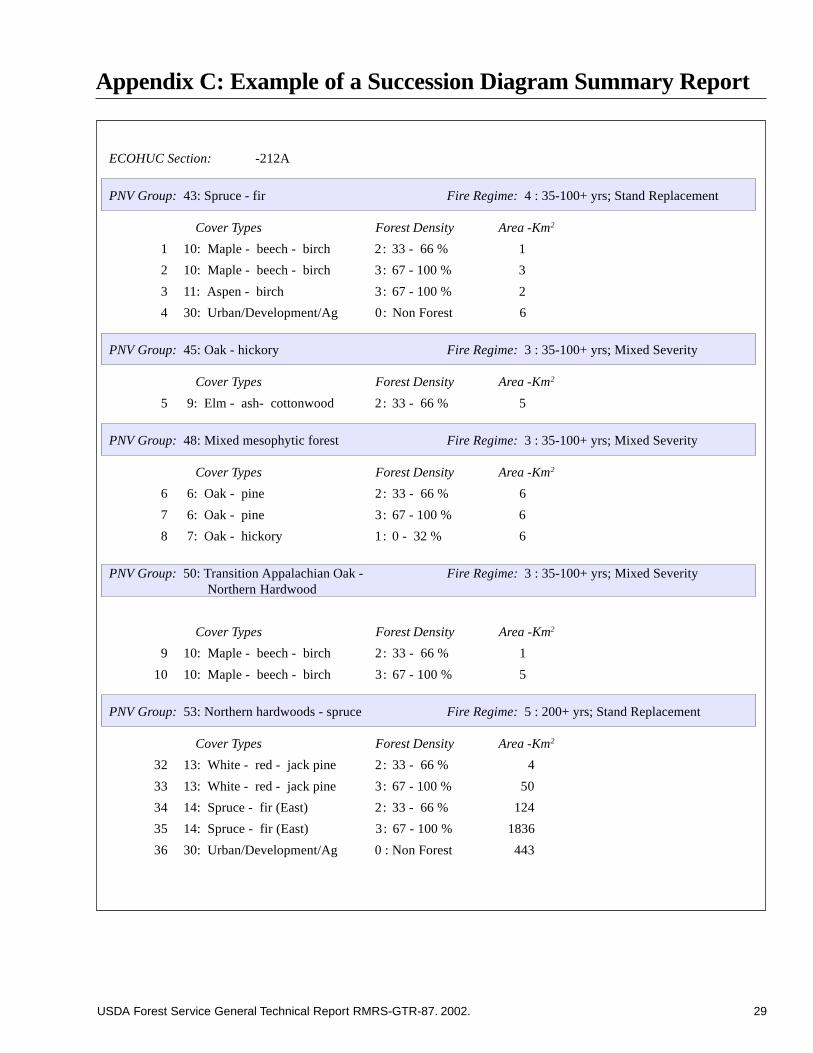
USDA Forest Service General Technical Report RMRS-GTR-87. 2002. 29
Appendix C: Example of a Succession Diagram Summary Report
ECOHUC Section: -212A
PNV Group: 43: Spruce - fir Fire Regime:4 : 35-100+ yrs; Stand Replacement
Cover Types Forest Density Area -Km2
1 10: Maple - beech - birch 2: 33 - 66 % 1
2 10: Maple - beech - birch 3: 67 - 100 % 3
3 11: Aspen - birch 3: 67 - 100 % 2
4 30: Urban/Development/Ag 0: Non Forest 6
PNV Group: 45: Oak - hickory Fire Regime:3 : 35-100+ yrs; Mixed Severity
Cover Types Forest Density Area -Km2
5 9: Elm - ash- cottonwood 2: 33 - 66 % 5
PNV Group: 48: Mixed mesophytic forest Fire Regime:3 : 35-100+ yrs; Mixed Severity
Cover Types Forest Density Area -Km2
6 6: Oak - pine 2: 33 - 66 % 6
7 6: Oak - pine 3: 67 - 100 % 6
8 7: Oak - hickory 1: 0 - 32 % 6
PNV Group: 50: Transition Appalachian Oak - Fire Regime:3 : 35-100+ yrs; Mixed SeverityNorthern Hardwood
Cover Types Forest Density Area -Km2
9 10: Maple - beech - birch 2: 33 - 66 % 1
10 10: Maple - beech - birch 3: 67 - 100 % 5
PNV Group: 53: Northern hardwoods - spruce Fire Regime:5 : 200+ yrs; Stand Replacement
Cover Types Forest Density Area -Km2
32 13: White - red - jack pine 2: 33 - 66 % 4
33 13: White - red - jack pine 3: 67 - 100 % 50
34 14: Spruce - fir (East) 2: 33 - 66 % 124
35 14: Spruce - fir (East) 3: 67 - 100 % 1836
36 30: Urban/Development/Ag 0 : Non Forest 443
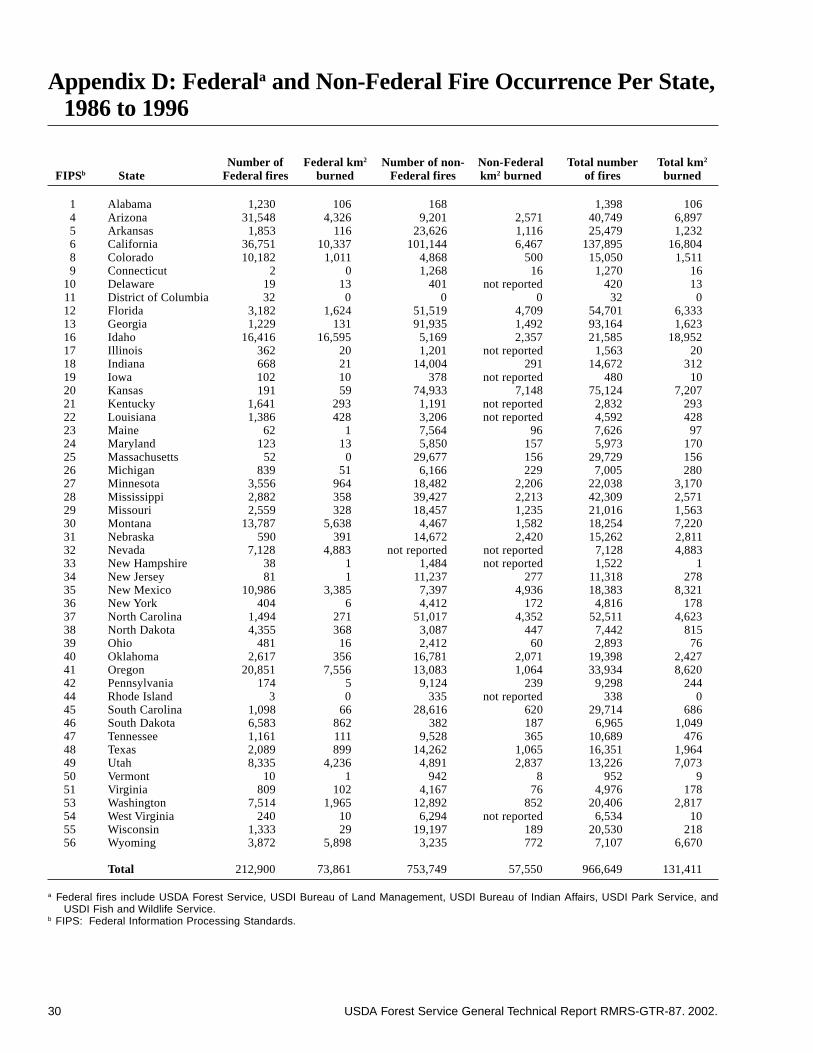
30 USDA Forest Service General Technical Report RMRS-GTR-87. 2002.
Appendix D: Federala and Non-Federal Fire Occurrence Per State,1986 to 1996
Number of Federal km2 Number of non- Non-Federal Total number Total km2
FIPSb State Federal fires burned Federal fires km2 burned of fires burned
1 Alabama 1,230 106 168 1,398 1064 Arizona 31,548 4,326 9,201 2,571 40,749 6,8975 Arkansas 1,853 116 23,626 1,116 25,479 1,2326 California 36,751 10,337 101,144 6,467 137,895 16,8048 Colorado 10,182 1,011 4,868 500 15,050 1,5119 Connecticut 2 0 1,268 16 1,270 16
10 Delaware 19 13 401 not reported 420 1311 District of Columbia 32 0 0 0 32 012 Florida 3,182 1,624 51,519 4,709 54,701 6,33313 Georgia 1,229 131 91,935 1,492 93,164 1,62316 Idaho 16,416 16,595 5,169 2,357 21,585 18,95217 Illinois 362 20 1,201 not reported 1,563 2018 Indiana 668 21 14,004 291 14,672 31219 Iowa 102 10 378 not reported 480 1020 Kansas 191 59 74,933 7,148 75,124 7,20721 Kentucky 1,641 293 1,191 not reported 2,832 29322 Louisiana 1,386 428 3,206 not reported 4,592 42823 Maine 62 1 7,564 96 7,626 9724 Maryland 123 13 5,850 157 5,973 17025 Massachusetts 52 0 29,677 156 29,729 15626 Michigan 839 51 6,166 229 7,005 28027 Minnesota 3,556 964 18,482 2,206 22,038 3,17028 Mississippi 2,882 358 39,427 2,213 42,309 2,57129 Missouri 2,559 328 18,457 1,235 21,016 1,56330 Montana 13,787 5,638 4,467 1,582 18,254 7,22031 Nebraska 590 391 14,672 2,420 15,262 2,81132 Nevada 7,128 4,883 not reported not reported 7,128 4,88333 New Hampshire 38 1 1,484 not reported 1,522 134 New Jersey 81 1 11,237 277 11,318 27835 New Mexico 10,986 3,385 7,397 4,936 18,383 8,32136 New York 404 6 4,412 172 4,816 17837 North Carolina 1,494 271 51,017 4,352 52,511 4,62338 North Dakota 4,355 368 3,087 447 7,442 81539 Ohio 481 16 2,412 60 2,893 7640 Oklahoma 2,617 356 16,781 2,071 19,398 2,42741 Oregon 20,851 7,556 13,083 1,064 33,934 8,62042 Pennsylvania 174 5 9,124 239 9,298 24444 Rhode Island 3 0 335 not reported 338 045 South Carolina 1,098 66 28,616 620 29,714 68646 South Dakota 6,583 862 382 187 6,965 1,04947 Tennessee 1,161 111 9,528 365 10,689 47648 Texas 2,089 899 14,262 1,065 16,351 1,96449 Utah 8,335 4,236 4,891 2,837 13,226 7,07350 Vermont 10 1 942 8 952 951 Virginia 809 102 4,167 76 4,976 17853 Washington 7,514 1,965 12,892 852 20,406 2,81754 West Virginia 240 10 6,294 not reported 6,534 1055 Wisconsin 1,333 29 19,197 189 20,530 21856 Wyoming 3,872 5,898 3,235 772 7,107 6,670
Total 212,900 73,861 753,749 57,550 966,649 131,411
a Federal fires include USDA Forest Service, USDI Bureau of Land Management, USDI Bureau of Indian Affairs, USDI Park Service, andUSDI Fish and Wildlife Service.
b FIPS: Federal Information Processing Standards.
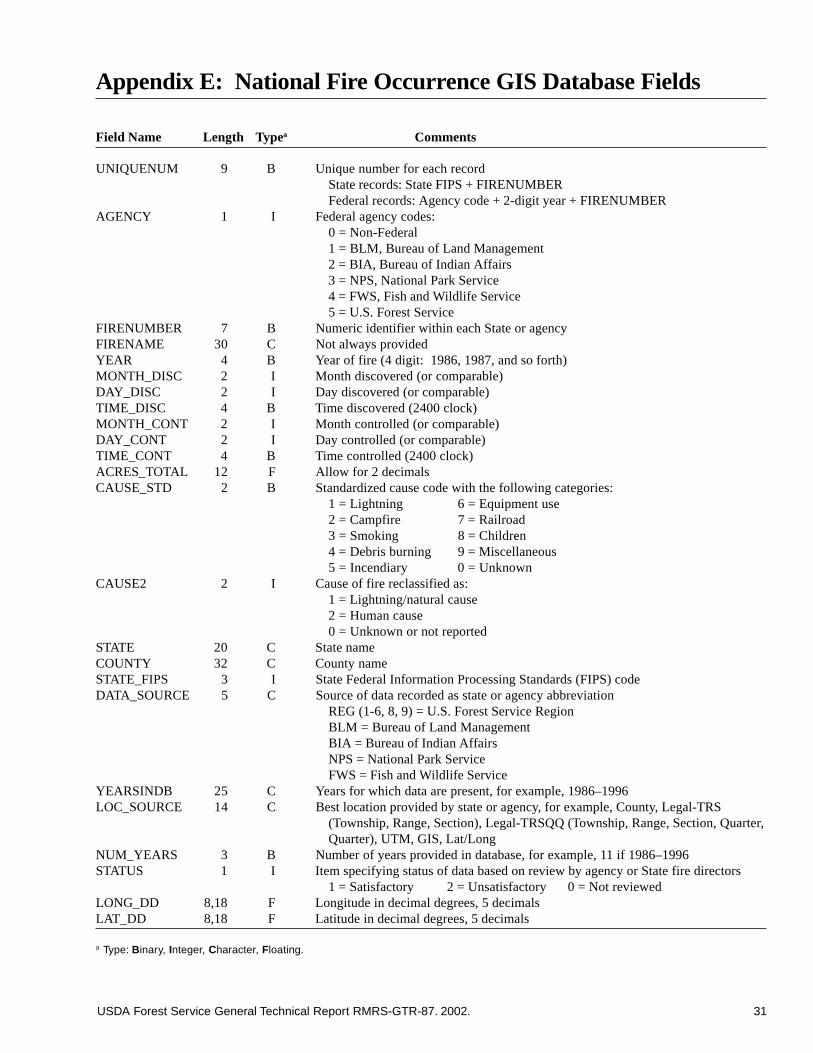
USDA Forest Service General Technical Report RMRS-GTR-87. 2002. 31
Appendix E: National Fire Occurrence GIS Database Fields
Field Name Length Typea Comments
UNIQUENUM 9 B Unique number for each recordState records: State FIPS + FIRENUMBERFederal records: Agency code + 2-digit year + FIRENUMBER
AGENCY 1 I Federal agency codes:0 = Non-Federal1 = BLM, Bureau of Land Management2 = BIA, Bureau of Indian Affairs3 = NPS, National Park Service4 = FWS, Fish and Wildlife Service5 = U.S. Forest Service
FIRENUMBER 7 B Numeric identifier within each State or agencyFIRENAME 30 C Not always providedYEAR 4 B Year of fire (4 digit: 1986, 1987, and so forth)MONTH_DISC 2 I Month discovered (or comparable)DAY_DISC 2 I Day discovered (or comparable)TIME_DISC 4 B Time discovered (2400 clock)MONTH_CONT 2 I Month controlled (or comparable)DAY_CONT 2 I Day controlled (or comparable)TIME_CONT 4 B Time controlled (2400 clock)ACRES_TOTAL 12 F Allow for 2 decimalsCAUSE_STD 2 B Standardized cause code with the following categories:
1 = Lightning 6 = Equipment use2 = Campfire 7 = Railroad3 = Smoking 8 = Children4 = Debris burning 9 = Miscellaneous5 = Incendiary 0 = Unknown
CAUSE2 2 I Cause of fire reclassified as:1 = Lightning/natural cause2 = Human cause0 = Unknown or not reported
STATE 20 C State nameCOUNTY 32 C County nameSTATE_FIPS 3 I State Federal Information Processing Standards (FIPS) codeDATA_SOURCE 5 C Source of data recorded as state or agency abbreviation
REG (1-6, 8, 9) = U.S. Forest Service RegionBLM = Bureau of Land ManagementBIA = Bureau of Indian AffairsNPS = National Park ServiceFWS = Fish and Wildlife Service
YEARSINDB 25 C Years for which data are present, for example, 1986–1996LOC_SOURCE 14 C Best location provided by state or agency, for example, County, Legal-TRS
(Township, Range, Section), Legal-TRSQQ (Township, Range, Section, Quarter,Quarter), UTM, GIS, Lat/Long
NUM_YEARS 3 B Number of years provided in database, for example, 11 if 1986–1996STATUS 1 I Item specifying status of data based on review by agency or State fire directors
1 = Satisfactory 2 = Unsatisfactory 0 = Not reviewedLONG_DD 8,18 F Longitude in decimal degrees, 5 decimalsLAT_DD 8,18 F Latitude in decimal degrees, 5 decimals
a Type: B inary, Integer, Character, Floating.
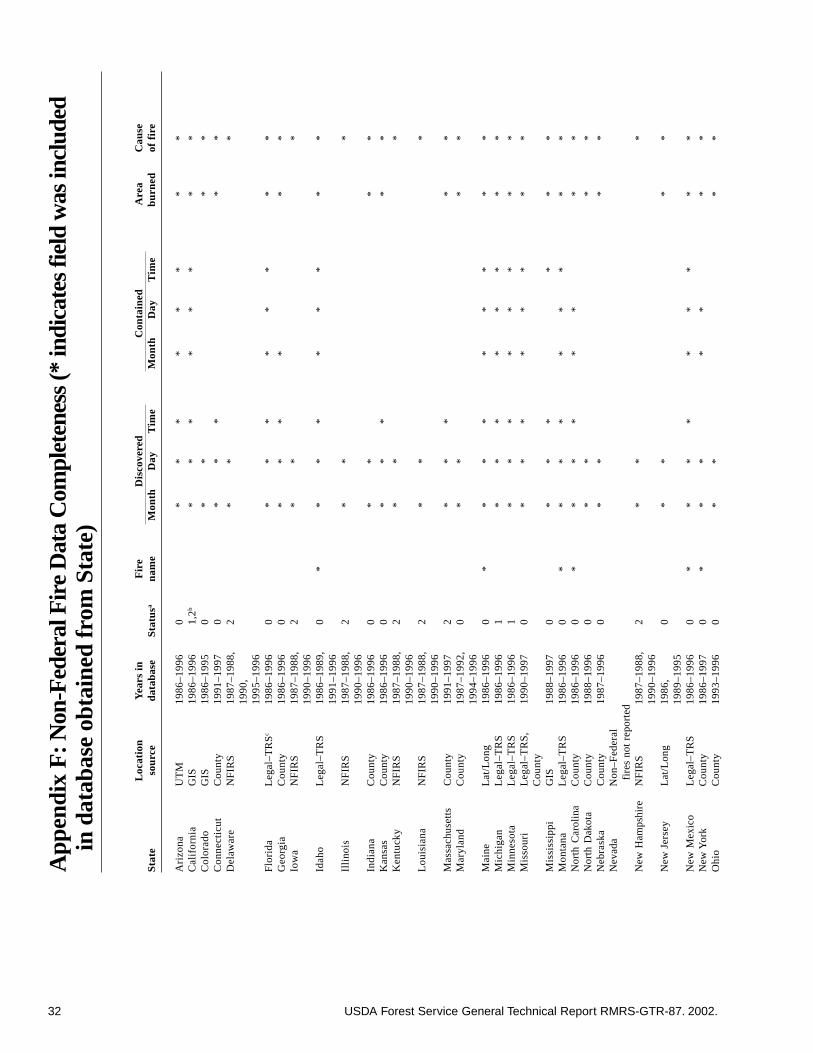
32 USDA Forest Service General Technical Report RMRS-GTR-87. 2002.
App
endi
x F
: Non
-Fed
eral
Fire
Dat
a C
ompl
eten
ess
(* in
dica
tes
field
was
incl
uded
in d
atab
ase
obta
ined
from
Sta
te)
Loca
tion
Year
s in
Fire
Dis
cove
red
Con
tain
edA
rea
Cau
seS
tate
sour
ceda
taba
seS
tatu
sa
nam
eM
onth
Day
Tim
eM
onth
Day
Tim
ebu
rned
of f
ire
Ari
zon
aU
TM
19
86
–1
99
60
**
**
**
**
Ca
lifo
rnia
GIS
19
86
–1
99
61
,2b*
**
**
**
*C
olo
rad
oG
IS1
98
6–
19
95
0*
**
*C
on
ne
ctic
ut
Co
un
ty1
99
1–
19
97
0*
**
**
De
law
are
NF
IRS
19
87
–1
98
8,
2*
**
19
90
,1
99
5–
19
96
Flo
rid
aL
eg
al–
TR
Sc1
98
6–
19
96
0*
**
**
**
*G
eo
rgia
Co
un
ty1
98
6–
19
96
0*
**
**
*Io
wa
NF
IRS
19
87
–1
98
8,
2*
**
19
90
–1
99
6Id
ah
oL
eg
al–
TR
S1
98
6–
19
89
,0
**
**
**
**
*1
99
1–
19
96
Illin
ois
NF
IRS
19
87
–1
98
8,
2*
**
19
90
–1
99
6In
dia
na
Co
un
ty1
98
6–
19
96
0*
**
*K
an
sas
Co
un
ty1
98
6–
19
96
0*
**
**
Ke
ntu
cky
NF
IRS
19
87
–1
98
8,
2*
**
19
90
–1
99
6L
ou
isia
na
NF
IRS
19
87
–1
98
8,
2*
**
19
90
–1
99
6M
ass
ach
use
tts
Co
un
ty1
99
1–
19
97
2*
**
**
Ma
ryla
nd
Co
un
ty1
98
7–
19
92
,0
**
**
19
94
–1
99
6M
ain
eL
at/
Lo
ng
19
86
–1
99
60
**
**
**
**
*M
ich
iga
nL
eg
al–
TR
S1
98
6–
19
96
1*
**
**
**
*M
inn
eso
taL
eg
al–
TR
S1
98
6–
19
96
1*
**
**
**
*M
isso
uri
Le
ga
l–T
RS
,1
99
0–
19
97
0*
**
**
**
*C
ou
nty
Mis
siss
ipp
iG
IS1
98
8–
19
97
0*
**
**
*M
on
tan
aL
eg
al–
TR
S1
98
6–
19
96
0*
**
**
**
**
No
rth
Ca
rolin
aC
ou
nty
19
86
–1
99
60
**
**
**
**
No
rth
Da
kota
Co
un
ty1
98
8–
19
96
0*
**
*N
eb
rask
aC
ou
nty
19
87
–1
99
60
**
**
Ne
vad
aN
on
–F
ed
era
l
fire
s n
ot
rep
ort
ed
Ne
w H
am
psh
ire
NF
IRS
19
87
–1
98
8,
2*
**
19
90
–1
99
6N
ew
Je
rse
yL
at/
Lo
ng
19
86
,0
**
**
19
89
–1
99
5N
ew
Me
xico
Le
ga
l–T
RS
19
86
–1
99
60
**
**
**
**
*N
ew
Yo
rkC
ou
nty
19
86
–1
99
70
**
**
**
*O
hio
Co
un
ty1
99
3–
19
96
0*
**
*
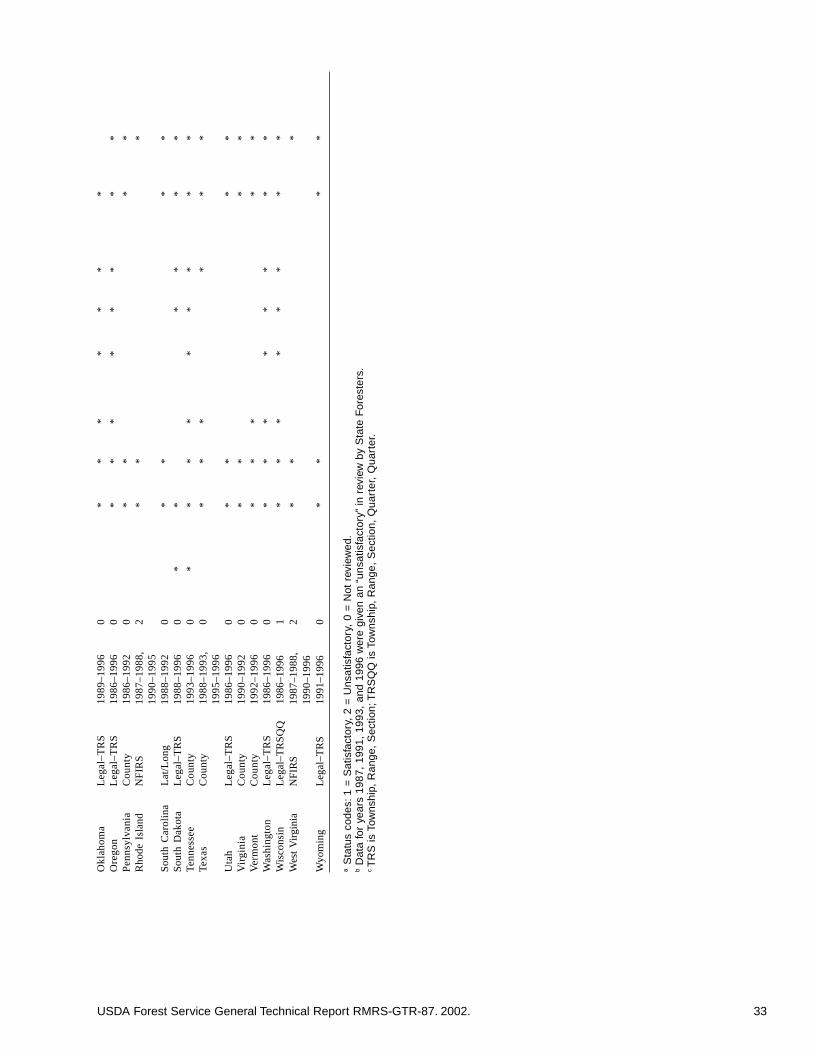
USDA Forest Service General Technical Report RMRS-GTR-87. 2002. 33
Okl
ah
om
aL
eg
al–
TR
S1
98
9–
19
96
0*
**
**
**
Ore
go
nL
eg
al–
TR
S1
98
6–
19
96
0*
**
**
**
*P
en
nsy
lva
nia
Co
un
ty1
98
6–
19
92
0*
**
*R
ho
de
Isl
an
dN
FIR
S1
98
7–
19
88
,2
**
*1
99
0–
19
95
So
uth
Ca
rolin
aL
at/
Lo
ng
19
88
–1
99
20
**
**
So
uth
Da
kota
Le
ga
l–T
RS
19
88
–1
99
60
**
**
**
Ten
ne
sse
eC
ou
nty
19
93
–1
99
60
**
**
**
**
*Te
xas
Co
un
ty1
98
8–
19
93
,0
**
**
**
19
95
–1
99
6U
tah
Le
ga
l–T
RS
19
86
–1
99
60
**
**
Vir
gin
iaC
ou
nty
19
90
–1
99
20
**
**
Ve
rmo
nt
Co
un
ty1
99
2–
19
96
0*
**
**
Wa
shin
gto
nL
eg
al–
TR
S1
98
6–
19
96
0*
**
**
**
*W
isco
nsi
nL
eg
al–
TR
SQ
Q1
98
6–
19
96
1*
**
**
**
*W
est
Virg
inia
NF
IRS
19
87
–1
98
8,
2*
**
19
90
–1
99
6W
yom
ing
Le
ga
l–T
RS
19
91
–1
99
60
**
**
a S
tatu
s co
des:
1 =
Sat
isfa
ctor
y, 2
= U
nsat
isfa
ctor
y, 0
= N
ot r
evie
wed
.b
Dat
a fo
r ye
ars
1987
, 19
91,
1993
, an
d 19
96 w
ere
give
n an
“un
satis
fact
ory”
in r
evie
w b
y S
tate
For
este
rs.
c T
RS
is T
owns
hip,
Ran
ge,
Sec
tion;
TR
SQ
Q is
Tow
nshi
p, R
ange
, S
ectio
n, Q
uart
er,
Qua
rter
.
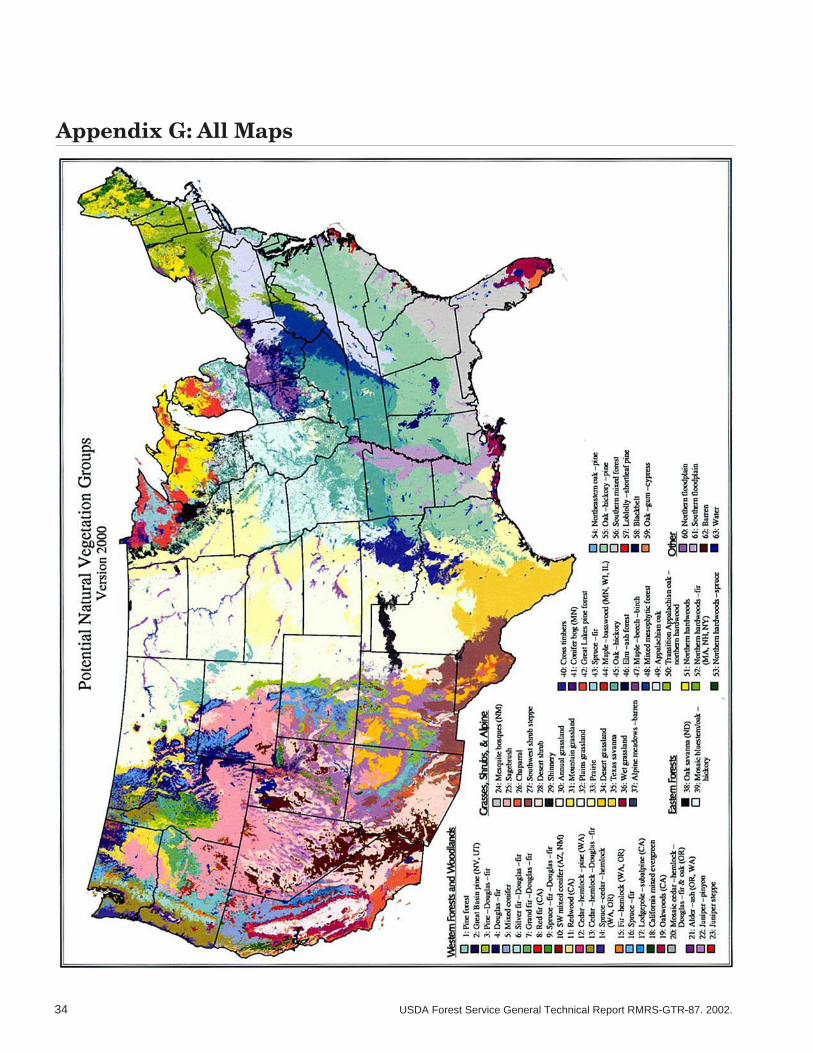
34 USDA Forest Service General Technical Report RMRS-GTR-87. 2002.
Appendix G: All Maps

USDA Forest Service General Technical Report RMRS-GTR-87. 2002. 35
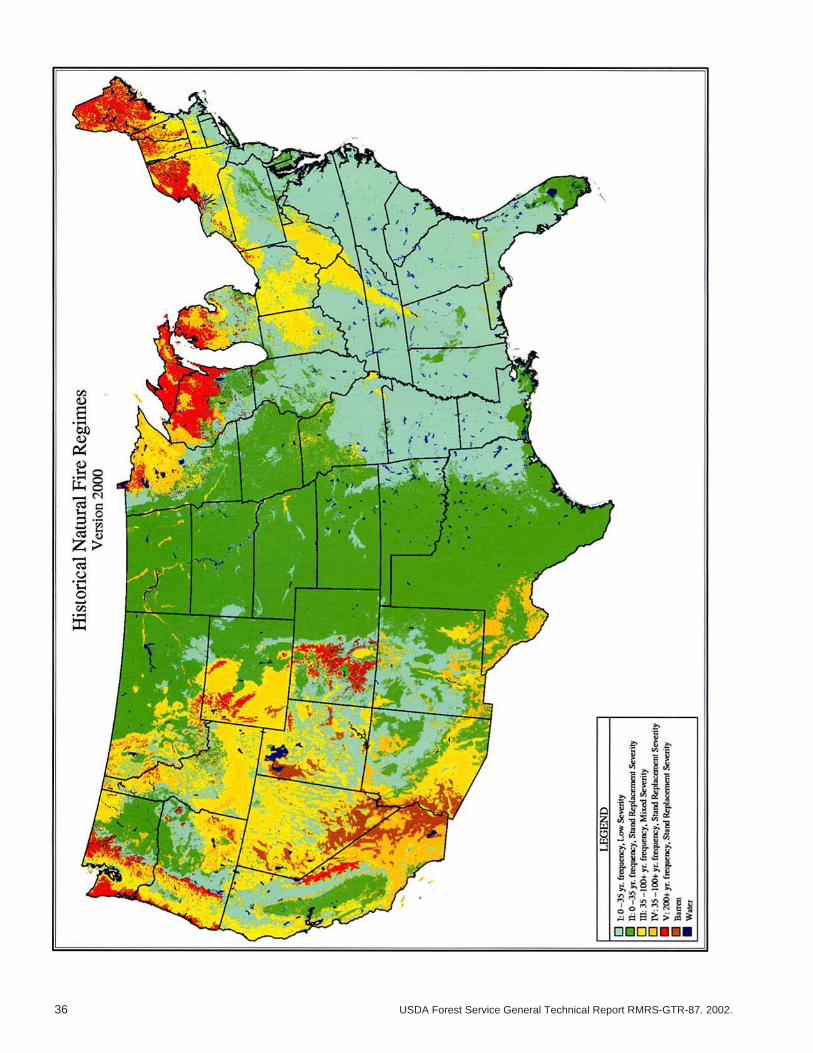
36 USDA Forest Service General Technical Report RMRS-GTR-87. 2002.
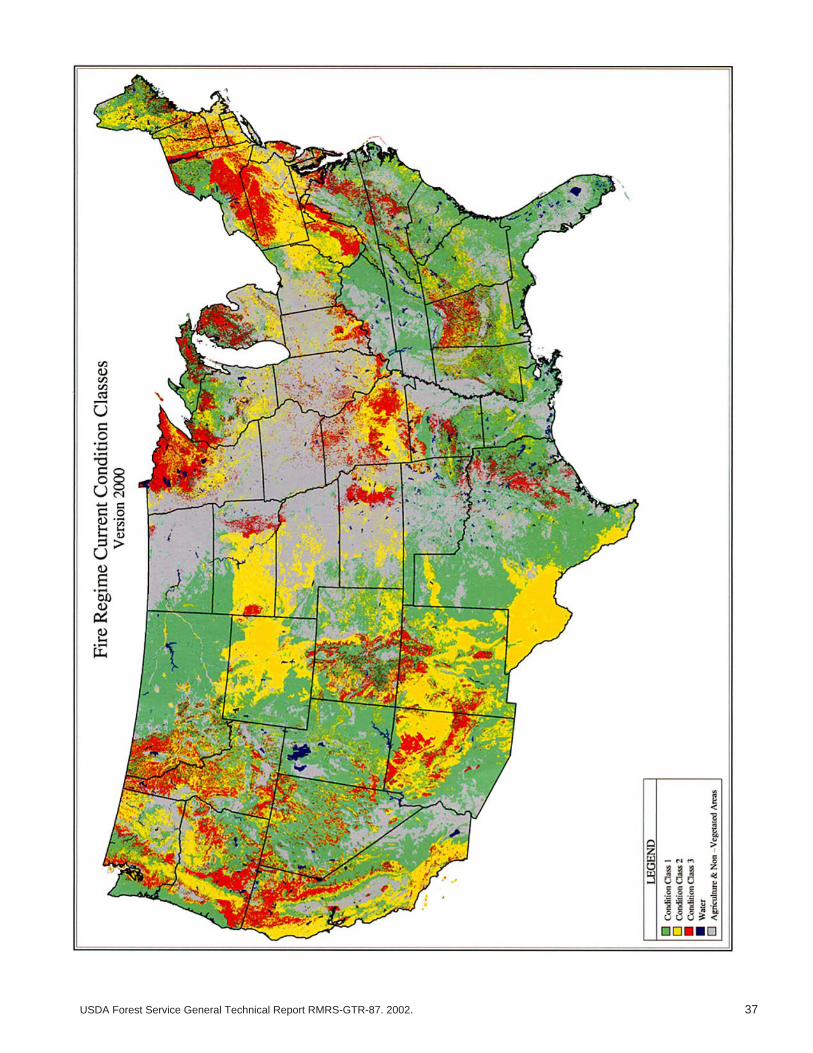
USDA Forest Service General Technical Report RMRS-GTR-87. 2002. 37
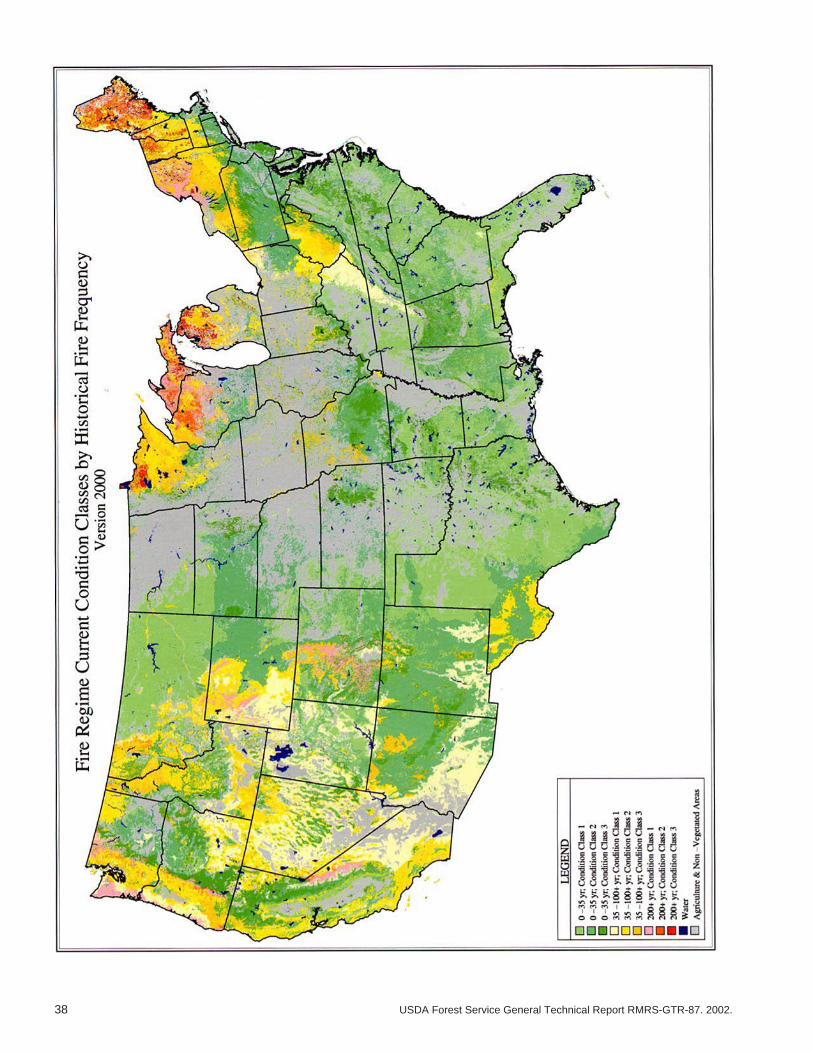
38 USDA Forest Service General Technical Report RMRS-GTR-87. 2002.
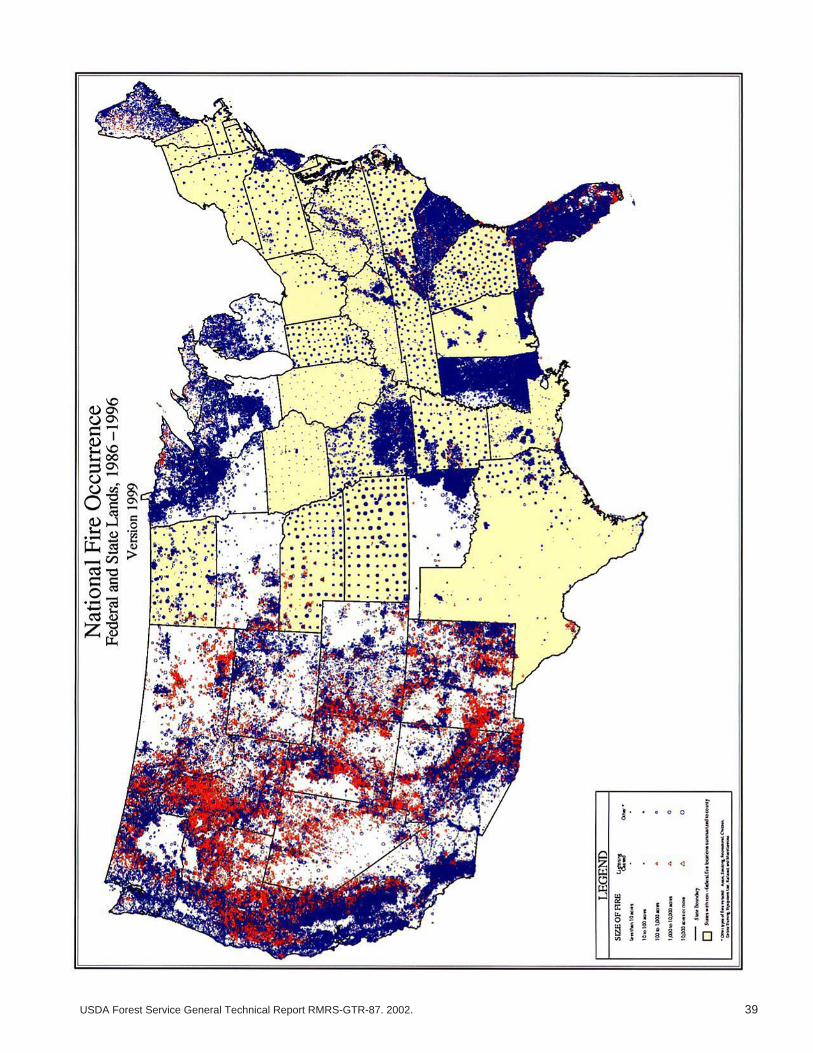
USDA Forest Service General Technical Report RMRS-GTR-87. 2002. 39
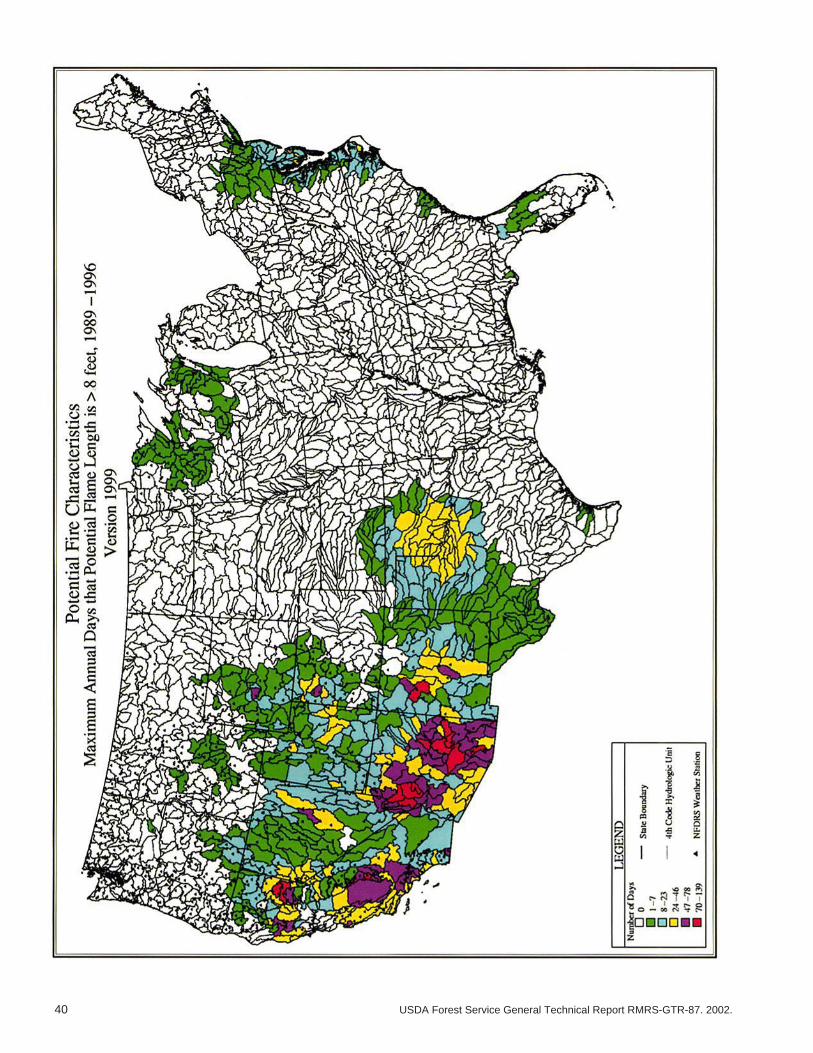
40 USDA Forest Service General Technical Report RMRS-GTR-87. 2002.
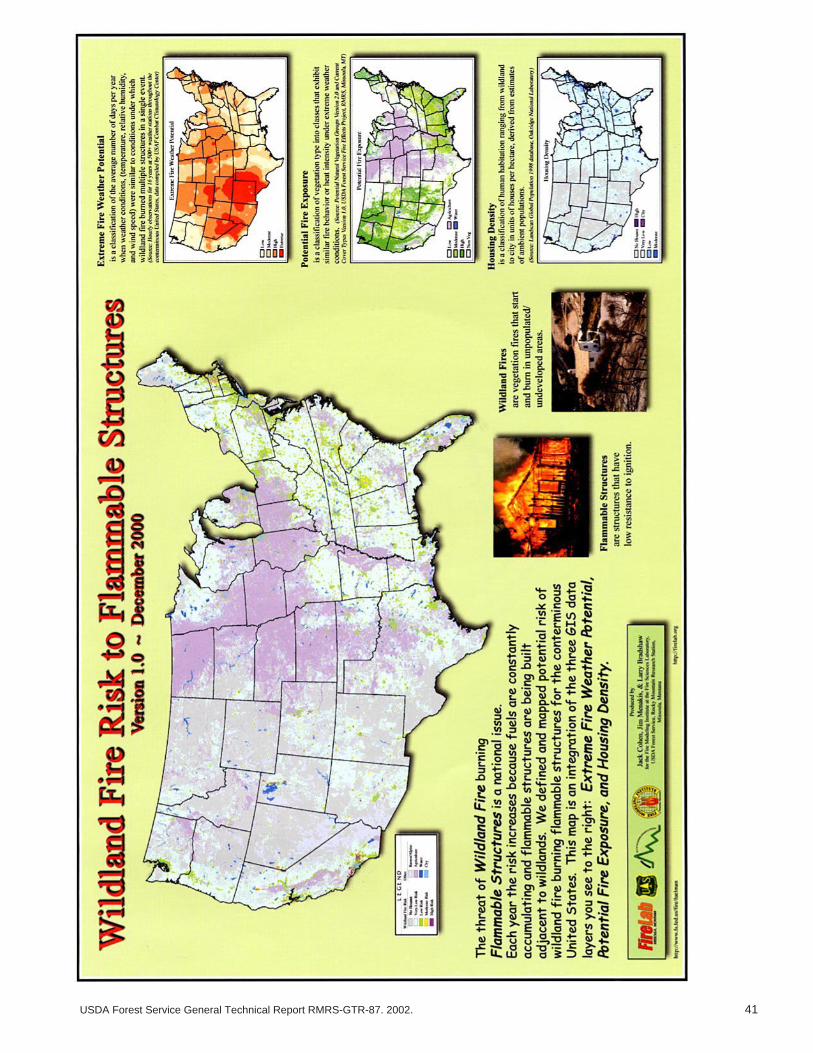
USDA Forest Service General Technical Report RMRS-GTR-87. 2002. 41
The Rocky Mountain Research Station develops scientificinformation and technology to improve management, protec-tion, and use of the forests and rangelands. Research isdesigned to meet the needs of National Forest managers,Federal and State agencies, public and private organizations,academic institutions, industry, and individuals.
Studies accelerate solutions to problems involving ecosys-tems, range, forests, water, recreation, fire, resource inven-tory, land reclamation, community sustainability, forest engi-neering technology, multiple use economics, wildlife and fishhabitat, and forest insects and diseases. Studies are con-ducted cooperatively, and applications may be found world-wide.
Research Locations
Flagstaff, Arizona Reno, NevadaFort Collins, Colorado* Albuquerque, New MexicoBoise, Idaho Rapid City, South DakotaMoscow, Idaho Logan, UtahBozeman, Montana Ogden, UtahMissoula, Montana Provo, UtahLincoln, Nebraska Laramie, Wyoming
*Station Headquarters, Natural Resources Research Center,2150 Centre Avenue, Building A, Fort Collins, CO 80526
The U.S. Department of Agriculture (USDA) prohibits discriminationin all its programs and activities on the basis of race, color, national origin,sex, religion, age, disability, political beliefs, sexual orientation, or maritalor family status. (Not all prohibited bases apply to all programs.) Personswith disabilities who require alternative means for communication ofprogram information (Braille, large print, audiotape, etc.) should contactUSDA's TARGET Center at (202) 720-2600 (voice and TDD).
To file a complaint of discrimination, write USDA, Director, Office ofCivil Rights, Room 326-W, Whitten Building, 1400 Independence Av-enue, SW, Washington, DC 20250-9410 or call (202) 720-5964 (voice orTDD). USDA is an equal opportunity provider and employer.
ROCKY MOUNTAIN RESEARCH STATION
RMRS
Federal Recycling Program Printed on Recycled Paper