Embed Size (px)
Citation preview

Fire Environments Typical of Navy Ships
by David LeBlanc
A Thesis Submitted to the Faculty
of the WORCESTER POLYTECHNIC INSTITUTE in partial fulfillment of the requirements for the
Degree of Master of Science in
Fire Protection Engineering
May 1998
ii
Abstract Current test methodologies used to evaluate the performance of protective clothing do not adequately
determine the provided level of protection. The heat fluxes imposed by current evaluation methods are not
specifically related to fire environments typical to those the clothing is designed provide protection against.
The U.S. Navy is in the process of developing an improved process for testing the fire resistance of daily wear
uniforms and protective gear. The first phase of this project involves evaluating currently used evaluation
methods and identifying the severity of fire environments that would be expected aboard Navy ships. The
examination of the test protocols currently in use identifies major weaknesses, providing the justification for a
new test protocol.
The first step in developing an improved test protocol is to determine the types of fire scenarios that
would be expected aboard Navy vessels. The nearly infinite number of possible fires are reduced to 6 typical
cases involving spray fires, pool fires and furniture fires in both compartmented and unconfined cases. An
analysis of the environments produced by these types of fires is presented. The effects of compartmentation
parameters are also investigated to determine the critical factors that affect the expected fire environment.
Expected heat fluxes for all scenarios are presented at a number of distances from the fire.

iii
Executive Summary
The development of a comprehensive test protocol that will allow the comparison of the fire
performance of equipment during typical navy fire scenarios will ultimately improve the safety provided by
Navy issue uniforms. The primary objective of this project is to evaluate existing fabric performance tests in
order to identify strengths and weaknesses and identify fire scenarios that would be typical of those found
aboard Navy ships.
Current Test Methods Tests currently in use by the Navy include:
ASTM F 1358-95 Standard Test Method for Effects of Flame Impingement on Materials Used in Protective Clothing Not Designated Primarily for Flame Resistance [1] FTMS 5903.1 Standard Test Method for Flame Resistance of Cloth; Vertical [14] Thermal Protective Performance (TPP) Test [6,7] Instrumented Manikin Test [4,5,10] The three bench top methods are very limited in that they can only test fabrics or layers of fabric. The
performance of a garment can not be directly extrapolated from the information determined from this
evaluation. Furthermore, the heat fluxes used in these tests are not related to heat fluxes that would be expected
in a fire. The full size test is limited in the fire scenarios that are investigated. Only a small range of flash and
pool fires, where there is direct flame impingement on the clothing are available.
Burn Injury Parameters
Before fire environments can be determined for a test protocol, it is important to specify the
parameters that directly effect the extent of burn injuries to an individual. These factors can be divided into two
major categories. Factors unrelated to the protective fabric, which include items such as the fire intensity and
the ratio of convective to radiative heat flux. The second category is factors related to the fabric, which include
parameters such as barrier and insulating properties.
Justification for Improved Test Method
None of the fabric evaluation methods currently available accurately investigates the performance of
clothing designed to provide protection against heat and flames. Exposure times, heat fluxes and modes of heat
transfer are difficult to predict in a real fire, but all the tests investigate very specific thermal environments.
None of the test methods currently in use addresses the diversity of potential shipboard fires.

iv
The bench top tests offer little value in testing behavior of a garment and are best suited for selecting
an appropriate fabric when designing protective garments. Data collected from these types of tests can not be
used to predict the performance of the completed garment in a real fire scenario. Perhaps the best test would
incorporate the robotic manikin and a test chamber similar to the NCSU chamber that is set up to allow a wide
range of fire scenarios, from pool fires to flash fires to simulated structure fires. A test sequence that involves a
wide range of fire environments could then be developed.
Shipboard Fire Environments
The complete evaluation of existing test methods and the development of new ones require the
characterization of the expected fire exposures. Judicious examination of typical ship fires allows careful
selection of a smaller number of fire scenarios that cover the spectrum of reasonable survivable fires. In this
study, efforts were made to select widely varying fire scenarios to cover all possible types of fires. One
important factor to consider when developing fire scenarios for full scale testing is the survivability of the
scenario assuming the fabric provides adequate levels of protection. The fire scenarios presented here do not
consider these important factors. A test protocol that involves a wide range of fire scenarios will allow the
characterization of the overall performance of new clothing. This will allow the best overall performers to be
selected based on concrete scientific principals.
Predicted Fire Environments
Fire intensity depends exclusively upon the fire scenario that is being recreated in the test chamber. A
fire size needs to be selected that challenges the protection provided by the garment while remaining within the
appropriate design range of fires. The major difficulty with fire intensity comes from attempting to recreate the
design fires.
Convective and Radiative Heat Transfer
The exact modes of heat transfer to a test specimen are extremely difficult to both predict and
control.[30] Furthermore, determining these values for design fires can also be difficult. The only way to be
certain that the fire is being recreated to a high level of accuracy is to run full-scale tests identical to the design
fire utilizing the same compartment configuration and fuel source. Although exact reproductions of the fire
scenario will not be made, the environment created in the test chamber will be a close approximation providing
a reasonable comparison between test chamber results and real fire performance.
Engine Compartment Fires
Two types of fires are common in the engine room, pool fires and jet or spray fires. Flammable
liquids are likely to be the fuel source for nearly all machinery space fires. Engine room fires are the most
v
common due to the large quantities of flammable liquids, the likelihood of leaks resulting from equipment
failure, and the number of ignition sources.
Supply Area Fires
These areas include mess halls, lounges, storage areas and galleys. These areas are the second most
likely to be involved in a fire. Cellulosic materials including tables and chairs, wall coverings, and stored
goods typically fuel fires in these compartments. Ignition sources are usually traced to faulty wiring or
carelessly discarded smoking materials
Berthing Area Fires Fires in berthing areas typically involve cellulosic materials, especially mattresses. Ignition sources
are carelessly discarded smoking materials and in many cases as the result of arson. Studies have shown that a
small amount of alcohol can easily ignite a mattress. Fires in these compartments typically behave in a manner
similar to other furniture fires.
Deck Storage Area Fires Fuel sources on the deck are typically fresh paint, cleaning agents, or aviation fuels. Ignition sources
include faulty electrical equipment and sparks resulting from repair activities, particularly welding. Although
this is the least likely area for a fire to occur, the potential for a very large fire is great due to the large volumes
of fuel carried by aircraft. Fires on the deck are usually similar to pool fires.
Specific Fire Scenarios Three specific fire scenarios were selected for quantitative analysis; spray fires, pool fires and bunk
fires.
Hydraulic Oil Spray Fire
An attempt can be made to use the existing research on spray fires and apply it to the Navy application to
predict a range of spray fire scenarios suitable for clothing performance testing. However, the wide range of
pipe sizes and pressures typical of Navy ships have not been investigated. Spray fire heat release rates are
highly dependent upon droplet size, which can not be analytically determined. The pipe diameter and the pipe
pressure can be used to crudely define the heat release rate of a spray fire. Bernoulli’s equation was used to
calculate the fluid exit velocity from which a fluid mass flow rate can be determined. Pipe sizes from 1 to 10
cm and pressures from 101 kPa to 13600 kPa were investigated. These result in a range of heat release rates
from a low of 50 kW to a high of 100 MW for the largest pipe diameter at the highest pressure.
The heat flux to a planar target parallel to the fire at varying distances was determined for a spray fire
resulting from a 5 cm discharge diameter at a pressure of 7000 kPa. Average heat fluxes over the whole of the
vi
target ranged from a maximum of 100 kW/m2 at a distance of 0.5 meters from the fire to a minimum of 4
kW/m2 at a distance of 6 meters from the fire.
The same fire was modeled using CFAST, a zone fire model to represent the compartmentalized case.
The fire was specified as a constant heat release rate. Spray fires with a heat release rate of 1000, 5000 and
10,000 kW were modeled. Target heat fluxes ranged from a low of 4 kW/m2 for the 1000 kW fire at a distance
of 4.24 m from the flame to a high of 31 kW/m2 for the 10,000 kW fire at a distance of 1.41 m from the flame.
3.4.2 Pool Fires
Pool fires are divided into two major classifications, confined and unconfined. Confined pool fires are
pool fires that can not spread in an unobstructed manner. Confined pool fires would result from oil and other
flammable liquid spills in small machinery spaces. Although it is possible for the confined fire case, the
unconfined fire is the more conservative approach and the most likely scenario. Five fuels were investigated
for their behavior in pool fire situations; Fuel Oil #6, Gasoline, Kerosene, JP-4, and Hydraulic Oil. Pool
diameters from 0.25 m to 10 meters were investigated. It was determined that the most critical parameter for
determining the heat release rate is the pool diameter. The hydrocarbon fuels presented here had very similar
heat release rates for a given pool size. Heat release rates ranged from 20-25 kW for 0.25 m diameter pools to
100 MW for 10 m diameter pools.
The heat flux to a plane perpendicular to the pool and facing the floor was calculated for a variety of
distances. The pool used in these calculations was a 5 m diameter JP-4 pool fire. The average target heat flux
5.5 m from the center of the fire was 50 kW/m2. The average target heat flux 15 m from the pool was 2 kW/m2.
Pool fires were also modeled for the compartmentalized case. Heat fluxes for a 2.5 m diameter JP-4 pool fire
where between 26-30 kW/m2 throughout the compartment.
Bunk Fires
Bunk fire heat release rates were taken from studies conducted by the Navy [29]. Bunk fires were
only investigated in the compartmentalized case. Peak heat release rates of 6 MW for 4 burning bunks and 7.5
MW for 10 burning bunks were calculated. Peak target heat fluxes ranged from 10 kW/m2 to 17 kW/m2 for the
4 bunk case and 21 kW/m2 to 28 kW/m2 for the 10 bunk case.
Heat Flux Measurements One difficulty in recreating fire environments is measuring the heat fluxes that are being produced by
the test equipment. Improperly placed or poorly installed heat flux gauges can easily result in errors in excess
of 50% of the measured value [30]. If temperature readings from the test chamber are used to control the
furnace, small measurement errors can greatly influence the test specimen due to the T4 relationship between
temperature and radiation. These factors will need to be considered when designing the test equipment to
reproduce the fire scenarios presented.
vii
Future Work One important compartment configuration that could not be investigated due to the lack of
experimental data is compartments with only a horizontal vent on the ceiling. This is a venting situation very
typical of ship compartments but not likely for land structures, and thus has not been studied. No predictions of
the fire environment resulting from this venting configuration can be made until this research has been
conducted.
Another limitation is the lack of reliable flame temperature data. The radiant flux calculations are
based on accurate flame temperature values, but very little data is available for flame temperatures of diffusion
flames for the fuels investigated. Furthermore, the flame temperatures that are available are not consistent.
The accuracy of the results collected from any future test protocol will depend on three major factors;
accurately identifying real fire scenarios, accurately reproducing these fire environments, and accurately
representing the behavior of a real human with the mannequin. The work done here begins the process of
identifying fire scenarios, but does not attempt to narrow the possible choices to be used for fabric evaluation.
Selecting appropriate design fires can only be accomplished when the purpose of the clothing being tested is
known.

viii
Acknowledgements I would like to express my gratitude and appreciation to the people who have directly and indirectly
helped me through this project. Professor Jonathan Barnett made this project possible, as well as putting up
with my extremely independent work habits. Attempting to do an entire thesis is no easy task for either student
or advisor, and I am grateful for his latitude in allowing me do this. Ed Claugherty was instrumental in his
understanding of the test procedures and deserves praise for his clear, concise criticism of the work presented
here. This project would have not been possible without the people from the Navy Fabric Research Center,
particularly Richard Wojtaszek, Harry Winer and Robert Hall whose ability to be available to meet at the drop
of a hat still amazes me.
I would also like to thank all of those people who did not directly affect the content of the thesis but
nonetheless played an important role. I would be remiss if I didn’t mention my parents and family. It would
appear that the constant badgering about “getting my homework done” in elementary and high school may have
had some effect after all! My girlfriend Adele deserves thanks for knowing when to push me to get the thesis
done, and when to remind me that there was still a world beyond the little square of the computer screen.
Lastly, I need to mention my dog Tucker who was always available for a little chat when the stress level got to
high. He would patiently listen to my ranting and ravings….tail wagging - toy in mouth….and then demand a
walk as payment for listening. Often times all it takes is a stroll around the block to clear your head and
remember why you’re doing all of this after all.
ix
Contents ABSTRACT ................................................................................................................................................... i
EXECUTIVE SUMMARY......................................................................................................................... iii CURRENT TEST METHODS.......................................................................................................................... iii
Burn Injury Parameters......................................................................................................................... iii Justification for Improved Test Method................................................................................................. iii
SHIPBOARD FIRE ENVIRONMENTS .............................................................................................................. iv Predicted Fire Environments .................................................................................................................iv Convective and Radiative Heat Transfer................................................................................................iv Engine Compartment Fires ....................................................................................................................iv Supply Area Fires....................................................................................................................................v Berthing Area Fires.................................................................................................................................v Deck Storage Area Fires .........................................................................................................................v
SPECIFIC FIRE SCENARIOS........................................................................................................................... v Hydraulic Oil Spray Fire.........................................................................................................................v 3.4.2 Pool Fires ......................................................................................................................................vi Bunk Fires ..............................................................................................................................................vi
HEAT FLUX MEASUREMENTS ..................................................................................................................... vi FUTURE WORK.......................................................................................................................................... vii
ACKNOWLEDGEMENTS...................................................................................................................... viii
CONTENTS................................................................................................................................................. ix
LIST OF FIGURES..................................................................................................................................... xi
LIST OF TABLES..................................................................................................................................... xiii
NOMENCLATURE .................................................................................................................................. xiv
SUBSCRIPTS ............................................................................................................................................. xv
1.0 STATEMENT OF WORK .................................................................................................................... 1
2.0 EXAMINATION OF EXISTING TEST METHODS......................................................................... 2 2.1 FACTORS AFFECTING BURN INJURIES.................................................................................................... 2
2.1.1 Factors Unrelated to Protective Fabric ........................................................................................ 2 2.1.2 Factors Related to Protective Fabric ............................................................................................ 3
2.2 CURRENT TEST METHODS ..................................................................................................................... 3 2.2.1 Test ASTM F 1358 95................................................................................................................... 4 2.2.2 Standard Test Method for Flame Resistance of Cloth; Vertical (FTMS 5903.1) ......................... 4 2.2.3 Thermal Protective Performance Test [6,7] ................................................................................ 5
2.2.4 INSTRUMENTED MANIKIN TEST [4,5,10] ............................................................................................ 6 2.2.5 Instrumented Robotic Manikin Test............................................................................................... 8
2.3 JUSTIFICATION FOR AN IMPROVED NAVY TEST ..................................................................................... 9 3.0 PREDICTION OF FIRE ENVIRONMENTS TYPICAL OF U.S. NAVY SHIPS......................... 10
3.1 CRITICAL PARAMETERS REQUIRED TO DETERMINE CLOTHING EXPOSURE.......................................... 10 3.1.1 Duration of Exposure .................................................................................................................. 10 3.1.2 Fire Intensity ............................................................................................................................... 11 3.1.3 Convective and Radiative Heat Transfer..................................................................................... 11
x
3.2 POSSIBLE SHIPBOARD FIRE SCENARIOS............................................................................................... 12 3.2.1 Machinery Spaces........................................................................................................................ 12 3.2.2 Supply Areas................................................................................................................................ 12 3.2.3 Habitability Spaces...................................................................................................................... 12 3.2.4 Deck Storage Areas ..................................................................................................................... 12
3.3 PREDICTED FIRE ENVIRONMENTS........................................................................................................ 13 3.3.1 Engine Room ............................................................................................................................... 13 3.3.2 Berthing Areas and Supply Areas................................................................................................ 14 3.3.3 Deck Storage ............................................................................................................................... 14
3.4 SPECIFIC FIRE SCENARIOS ................................................................................................................... 15 3.4.1 Hydraulic Oil Spray Fire............................................................................................................. 15 3.4.2 Pool Fires .................................................................................................................................... 27
4.1 REFERENCE MODEL............................................................................................................................. 38 4.2 COMPARTMENT MODEL VARIABLES ................................................................................................... 43
4.2.1 Compartment Dimensions ........................................................................................................... 43 4.2.2 Effects of Fire Size....................................................................................................................... 45 4.2.3 Vent Areas ................................................................................................................................... 52 4.2.4 Orientation of Targets ................................................................................................................. 54
4.3 SPRAY FIRE COMPARTMENT MODEL ................................................................................................... 55 4.4 BUNK FIRE COMPARTMENT MODEL .................................................................................................... 57
5.0 MEASUREMENT OF HEAT FLUXES ............................................................................................ 60
6.0 CONCLUSION..................................................................................................................................... 62
SOURCES CITED ..................................................................................................................................... 66
xi
List of Figures Figure 3.4.1-1: Virtual Nozzle Configuration 17 Figure 3.4.1-2: Hydraulic Oil Theoretical Discharge Velocity 19 Figure 3.4.1-3: Spray Fire Heat Release Rate 20 Figure 3.4.1-4: Spray Fire Flame Lengths 21 Figure 3.4.1-5: Spray Fire Flame Emissive Power 22 Figure 3.4.1: Relationship between Flame and Target Plane 23 Figure 3.4.1-6: Radiative Heat Flux to Vertical Plane 0.50 m from Jet Flame 24 Figure 3.4.1-7: Radiative Heat Flux to Vertical Plane 0.75 m from Jet Flame 24 Figure 3.4.1-8: Radiative Heat Flux to Vertical Plane 1.00 m from Jet Flame 25 Figure 3.4.1-9: Radiative Heat Flux to Vertical Plane 2.00 m from Jet Flame 25 Figure 3.4.1-10: Radiative Heat Flux to Vertical Plane 4.00 m from Jet Flame 26 Figure 3.4.1-11: Radiative Heat Flux to Vertical Plane 6.00 m from Jet Flame 26 Figure 3.4.1-12: Radiative Heat Flux to Vertical Plane 10.00 m from Jet Flame 27 Figure 3.4.1-13: Heat Flux to Target vs Distance 27 Figure 3.4.2-1: Predicted Heat Release Rate vs Pool Diameter 30 Figure 3.4.2-2: Pool Fire Mass Burning Rate Per Unit Surface Area 31 Figure 3.4.2-3: Pool Fire Growth Time to Peak Heat Release Rate 32 Figure 3.4.2-4: Pool Fire Flame Heights 33 Figure 3.4.2.1-1: Radiative Heat Flux to Vertical Plane 5.5 m From JP-4 Pool Fire 35 Figure 3.4.2.1-2: Radiative Heat Flux to Vertical Plane 5.75 m From JP-4 Pool Fire 35 Figure 3.4.2.1-3: Radiative Heat Flux to Vertical Plane 6.0 m From JP-4 Pool Fire 36 Figure 3.4.2.1-4: Radiative Heat Flux to Vertical Plane 8.0 m From JP-4 Pool Fire 36 Figure 3.4.2.1-5: Radiative Heat Flux to Vertical Plane 10.0 m From JP-4 Pool Fire 37 Figure 3.4.2.1-6: Radiative Heat Flux to Vertical Plane 15.0 m From JP-4 Pool Fire 37 Figure 3.4.2.1-7: Radiative Heat Flux to Vertical Plane 20.0 m From JP-4 Pool Fire 38 Figure 4.1-1: Fire Heat Release Rate 41 Figure 4.1-2: Compartment Gas Layer Temperatures 42 Figure 4.1-3: Layer Interface Height 42 Figure 4.1-4: Radiant Heat Flux to Targets 43 Figure 4.1-5: Target Heat Flux vs Distance from Fire 43 Figure 4.2.1-1: Heat Release Rate Variation with Compartment Dimensions 44 Figure 4.2.1-2: Layer Temperature for Varying Compartment Sizes 45 Figure 4.2.1-3: Heat Fluxes to Vertical Target 15x15 Meter Compartment 46 Figure 4.2.1-4: Heat Flux to Vertical Target 5x5 Meter Compartment 46 Figure 4.2.2-1: Convective Heat Release Rate for Varying Fire Size 47 Figure 4.2.2-2: Radiative Heat Release Rate for Varying Fire Size 47 Figure 4.2.2-3: Steady State Heat Release Rate vs Fire Diameter 48 Figure 4.2.2-4: Upper Layer Temperature for Varying Fire Size 48 Figure 4.2.2-5: Lower Layer Temperature for Varying Fire Size 49 Figure 4.2.2-6: Steady State Layer Temperature vs Fire Diameter 49 Figure 4.2.2-7: Target Heat Flux for 2.5 Meter Diameter Fire 50 Figure 4.2.2-8: Target Flux for 2.0 Meter Diameter Fire 51 Figure 4.2.2-9: Target Flux for 1.5 Meter Diameter Fire 51

xii
Figure 4.2.2-10: Target Flux for 1.0 Meter Diameter Fire 52 Figure 4.2.2-11: Target Flux for 0.5 Meter Diameter Fire 52 Figure 4.2.2-12: Target Flux vs Fire Diameter 53 Figure 4.2.3-1: Heat Release Rate for Varying Vent Areas 54 Figure 4.2.3-2: Layer Temperatures for Varying Vent Size 55 Figure 4.2.3-3: Steady State Target Heat Flux vs Vertical Vent Area 55 Figure 4.2.4-1: Target Heat Flux with Target Face at 45 Degree Angle with Compartment Floor 56 Figure 4.2.4-2: Target Heat Flux with Target Facing Compartment Ceiling 56 Figure 4.3-1: Spray Fire Layer Temperature 57 Figure 4.3-2: Spray Fire Steady State Target Heat Flux 58 Figure 4.4-1: Bunk Fires Heat Release Rates 59 Figure 4.4-2: Layer Temperature- Bunk Fire Scenarios 59 Figure 4.4-3: Target Heat Flux – 4 Bunk Fire 60 Figure 4.4-4: Target Heat Flux – 10 Bunk Fire 60

xiii
List of Tables Table 3.4.1-1: Properties of Hydraulic Oil Used in Calculations 19 Table 3.4.1-1: Properties of Fuels used in Pool Fire Calculations 29 Table 4.1-1: Steel Wall Material Properties 40

xiv
Nomenclature Aexit area (m2) c specific heat (J/kg C) (cp)b volumetric heat capacity of the blood (J/m3 K) D Diameter (m) ∆E activation energy for skin (J/mole) E flame emissive power (kW/m2) g acceleration due to gravity (9.81 m/sec2) G blood perfusion rate (m3/sec/m3 of tissue volume) Hf flame height (m) ∆Hc heat of combustion (kJ/kg) k thermal conductivity (W/mK) k’ effective absorption coefficient kemis effective emission/absorption coefficient (m-1) Lf flame length (m) Lbeam mean equivalent beam length of the flame (m) m mass flow rate (kg/sec) m’’ mass burning rate per unit surface area (g/m2-sec) m’’∞ asymptotic mass burning rate for large pool fires (g/m2-sec) P frequency factor, (sec-1) p pressure (Pa) ρ density (kg/m3) Q heat release rate (kW) q heat flux per unit surface area (W/m2) R universal gas constant (8.315 J/kmol K) t elapsed time (seconds) T Temperature (K) Tb blood perfusion temperature (K) V fluid velocity (m/sec) Vs Volumetric spill rate (m3/sec) xch chemical combustion efficiency y liquid pool fire regression rate (m/s) Φ flame-element shape factor correction τ atmospheric transmissivity (taken as 1) Ω quantitative measure of burn damage at the basal layer in the dermis Φ flame-element shape factor correction

xv
Subscripts amb ambient b Blood beam equivalent beam length ch chemical exit nozzle exit emis emission/absorption coefficient f flame inlet nozzle inlet line flammable liquid pipe line max maximum rad radiation skin skin tc thermocouple tcinitial thermocouple initial

1
1.0 Statement of Work The ultimate goal of this project is to develop a test methodology that will determine the level of
protection against heat and flames offered by Navy issue clothing. This test is to cover both protective gear and
uniforms whose primary purpose is not to provide protection. The development of a comprehensive test
protocol that will allow the comparison of the fire performance of equipment during typical navy fire scenarios
will ultimately improve the safety provided by navy issue uniforms.
The purpose of this report is twofold. The first is to evaluate current test methodologies used to
determine the protection provided by articles of clothing, including daily wear uniforms and garments designed
specifically for protection from heat and flames. The following test methodologies are examined to determine
their advantages and limitations, as well as their applicability to the requirements of the U.S. Navy.
• ASTM F 1358-95 Standard Test Method for Effects of Flame Impingement on Materials Used in Protective Clothing Not Designated Primarily for Flame Resistance [1]
• FTMS 5903.1 Standard Test Method for Flame Resistance of Cloth; Vertical [14] • Thermal Protective Performance (TPP) Test [6,7] • Instrumented Manikin Test [4,5,10] Additionally, the feasibility of introducing a fully instrumented robotic mannequin test is discussed.
The strength and weaknesses of each of these methods were examined as well as the ability to correlate the
results from each test to fabric behavior in actual fire environments. A critical appraisal of these methods is
required to justify the development of an improved test for the U.S. Navy.
The second part of this report presents fires typical of Navy vessels and the environments generated by
these fires. Using the results of this study, a range of appropriate fire conditions can be selected. These fires
may then be reproduced in a future test apparatus. This goal is accomplished by reducing the complexity of
naval vessels to a smaller number of compartments representative of the variety of compartment configurations
possible. Once the contents of characteristic compartments as well as unenclosed spaces are known, it becomes
possible to predict the types of fires that would be expected in these compartments as well as the pyrolysis rates
of the fuels. The pyrolysis rates can then be used with a variety of modeling tools including zone type models
to predict the fire environments created.
To determine the effect of different variables on the fire scenarios, a parametric study of many of the
critical model input variables was conducted. The purpose of this study was to develop an understanding of the
effects of critical parameters on the development and severity of the fire environment. The results of this
investigation can then be used to predict a wide range of fire scenarios that could be incorporated into any
future test platform.

2
2.0 Examination of Existing Test Methods
One of the challenges of this project is determining the level of protection that can be
provided by Navy uniforms when exposed to typical shipboard fire scenarios. The fire environments
encountered on a military vessel are unique compared to fires that normally occur on land and an improved test
methodology that addresses the peculiarities of these fires needs to be developed. An examination of the
existing test methods will demonstrate the advantages and limitations of current test procedures and provide the
basis for the development of a test more appropriate to Navy applications.
Two aspects concerning the fire performance of selected fabrics must be considered.[7] The first is
the flammability of the fabric. How susceptible is the material to combustion, smoldering or melting when
exposed to an ignition source. All materials will burn given a high enough heat flux, thus some reasonable
resistance to combustion needs to be selected based on the fire environment that the wearer of the garment
might encounter.[1] Also, the method used to test the flammability of a fabric can greatly influence the
performance of that fabric in a given test. An examination of existing tests will determine if a single test, or a
combination of several will give results that can be used to determine the suitability of a particular fabric for
use in Navy uniforms.
The second aspect of the fabric that needs to be examined is the transmission of energy through the
material.[2,6] Fire conditions could potentially subject the wearer to convective, radiative and possibly
conductive heat sources. A test of the materials ability to insulate the wearer from these sources is imperative
to determining the performance of the fabric. Again, the test needs to take into account the peculiarities of the
Navy’s specific applications.
Many additional variables need to be considered when testing fabrics. Dirt and moisture in the fabric
can greatly alter the performance of the material. The fit of the garment as well as trim and metal fasteners can
also have an effect on thermal penetration resistance. While test methods can not completely replace
experience gained by observing real world performance they are the only feasible method for generating a
meaningful data set for selecting the fabric that will provide the greatest level of thermal protection.
2.1 Factors Affecting Burn Injuries In the process of developing test methodologies for determining the level of safety provided by any
protective fabric an investigation of the key factors leading to burn injuries must be conducted. These factors
can be broken down into two major categories, factors related to the protective fabric and factors unrelated to
the protective fabric.
2.1.1 Factors Unrelated to Protective Fabric
Two major elements unrelated to the protective fabric warrant consideration when determining the
likelihood of burn injuries. The first is the type and intensity of heat flux exposure and the second is the
duration of exposure.[4,8] The intensity of exposure is extremely crucial and often extremely difficult to define

3
when a wide range of fire scenarios exist. Intensity levels can vary from a level where no protection is required
to a level where no clothing exists that would provide an adequate level of protection.
Another factor that must be investigated and is related directly to the level of intensity is the type of
heat transfer involved. Different protective properties are needed to protect against a heat flux that is
predominately radiative as opposed to a heat flux that is predominantly convective. Conductive heat transfer,
while often not encountered for the clothing whose primary purpose is not protection from burn injuries,
requires different fabric properties than the other modes of heat transfer.[4,8]
2.1.2 Factors Related to Protective Fabric
The properties of the fabric used to assemble the garment are crucial to the performance of the apparel.
These properties can be broken down into three major categories; barrier properties, insulating properties, and
chemical/physical properties.[4]
The barrier properties of the material apply only to heat transfer through conduction, and thus are
probably not important for the applications being investigated. The insulating properties determine the rate of
heat transfer through the material. As the outer surface of a material is heated, a temperature gradient exists
from the outer surface to the inner surface of the fabric. This gradient can be affected by air trapped in
insulation in the garment or air trapped between the garment and the wearer.[27] The insulating properties of
the garment can be greatly influenced by the construction and fit of the garment and changes in the fit due to
shrinkage resulting from heat exposure. These parameters are important when the material is exposed to a
convective heat source, or the surface of the fabric is heated by radiation. The greater the fabric’s ability to
resist the heat transfer through to the wearers’ skin, the greater the level of burn protection provided.
Furthermore, substantially different properties are required to protect against convective versus radiative heat
sources. The factor of greatest importance when protecting against convective sources is the insulating ability
of the fabric. The factor of greatest importance when protecting against radiative sources is the thermal
absorbtivity of the outer layer of the fabric.
The chemical and physical properties of the fabric determine the effects of heat and radiation on the
properties of the material.[27] These properties may increase or decrease the heat exposure of the wearer. For
example, a product that pyrolyses when exposed to heat may increase the heat transfer to the skin of the wearer.
This would result in a burn injury that would not have been present if the fabric did not behave in this manner.
2.2 Current Test Methods Currently four tests are used to determine the performance of clothing not designed primarily for
thermal protection and flame resistance. Three of the methods are bench top tests, testing the performance of
the fabric only. The fourth method is a full-scale test of the finished garment. Each of these methods will be
described briefly and then the strengths and weaknesses of each test examined.
4
2.2.1 Test ASTM F 1358 95
The Standard Test Method for Effects of Flame Impingement on Materials Used in Protective Clothing
Not Designated Primarily for Flame Resistance (ASTM F 1358-95)[1] examines the ease of ignition and
burning behavior of materials not designed primarily for flame resistance. This method utilizes a test cabinet
containing a small pilot flame, a Bunsen burner burning methane at a specified pressure of 17.2 ± 1.7 kPa
(2.494 ± 0.247 psi), a specimen holder and appropriate measurement instruments. The pilot flame is adjusted to
a height of approximately 3 mm (0.1179 in). The Bunsen burner flame source is adjusted to a height of 38 mm
(1.49 in) with no premixing of the fuel and air. A sample of cloth is folded over a 6 mm (0.236 in) diameter
metal rod and clamped in the specimen holder. Once the sample has been fastened the rod is removed, leaving
a “loop” of fabric at the bottom of the test specimen. The pilot flame and Bunsen burner are calibrated prior to
placement of the specimen in the test cabinet.
Before the test all fabric samples are conditioned by being placed in an atmosphere of 45% to 70%
humidity and a temperature of 20 to 25 °C (68 to 77 °F) for a minimum of 24 hours prior to testing. The folded
edge of the specimen is exposed to the Bunsen burner flame for 3 ± 0.1 seconds, at the end of which the gas
source is closed. The specimen is observed to determine if ignition has occurred. If sustained ignition is not
evident after the three second test, the flame is reapplied for an additional 12 ± 0.1 seconds. When ignition is
observed, after either the 3 second or 12 second test interval, the time interval required for fabric combustion to
self extinguish is measured, as well as the time of any additional afterglow. The apparent cause of
extinguishment is also noted. The specimen is removed from the test cabinet and the burn distance measured to
the nearest 1 mm. The test is repeated until a total of 10 specimens have been tested.[1]
The major advantage with this test is it’s low cost and ease of reproduction. The equipment necessary
to perform this evaluation should be available at any flammability testing facility. Because of the small scale of
the test and minimal per-sample test costs, many samples may be tested to eliminate any statistically irregular
behavior. The procedure allows fabrics to be ranked by their performance in this particular test. Comparisons
between, and ranking of a wide range of fabrics would not be difficult.[1]
The major disadvantage with this test is that the results are not useful in determining fabric
performance when exposed to real fire scenarios. The results of this method can not be extrapolated to predict
the behavior of a full garment in an actual fire. Therefore, any rankings of protective fabrics generated from
the test can not be used to rank the level of protection offered by garments constructed from these fabrics. The
rigorously defined configuration of the fabric specimen does not include configurations that would likely be
used in a garment such as seams or single layers of fabric. The test can be used as part of a methodology used
to determine the level of protection provided by a garment. However, it does not result in any information that
would be useful in predicting the performance of a particular garment.
2.2.2 Standard Test Method for Flame Resistance of Cloth; Vertical (FTMS 5903.1)
This test method [14] is similar to the test discussed in section 2.1 of this report. The same test
cabinet, and flame source/fuel delivery system is used. The major difference is the configuration of the test

5
specimen and the examination of the specimen after the test. In this test method, a single layer of fabric 70 mm
x 305 mm (0.472 x 11.99 in) is placed in the specimen holder and subjected to the flame of the Bunsen burner
for 12 ± 0.1 seconds. The after flame and after glow times are measured. The char length is measured by
making a small tear in the fabric at the highest point of charring and then suspending weights from the fabric
until the fabric rips and fails completely. The distance from the bottom of the test specimen to the tear as
measured along the edge of the specimen is the char length. While this process is somewhat complex, it is
necessary to eliminate the guesswork associated with determining the edges of the fabric in areas that have been
damaged by the test.[14]
Advantages of this test method are its low cost and repeatability. Fabrics may be ranked according to
their performance in this test which, in combination with other tests, will help determine which fabrics have the
best fire resistant properties. Because the conditions of the test are easily reproducible, and the test is not
expensive or complicated to conduct, a large number of samples may be tested to eliminate any statistical
irregularities.
The primary disadvantage of the test is that the results are not meaningful outside the conditions of the
test. No predictions can be made about the level of protection offered by a garment from data collected using
this test methodology. A ranking of fabrics tested using this method will not correlate to an equivalent ranking
of the protection offered by garments created using these fabrics. While the results of the test can be useful
when combined with other test methods, this single test itself is only valid for comparing the performance of
other fabrics when subjected to these same test conditions.
2.2.3 Thermal Protective Performance Test [6,7]
The thermal protective performance test rates textile materials for thermal resistance and insulation
when exposed to flux levels of 8.4 W/m2 (2.0 cal/cm2sec) for a short duration [6]. The Thermal Protective
Performance Test used to determine if the layers of material that comprise the protective clothing are adequate
to protect the wearer from burn injury. The TPP test is conducted by exposing a material or multiple layers of
material to heat from a standard source and measuring the amount of energy passing through the sample. This
is then correlated with experimental data developed by Stoll to determine the extent of burn injuries that would
result from the exposure. The heat source consists of a flame, which provides the convective portion of the
heat, and a quartz heater, which provides the radiative component. An equal 50/50 split between the radiative
and convective components of the heat load is maintained.[6] Discussions with the engineers conducting this
evaluation at the Navy Fabric Research Center in Natick, Massachusetts indicates that although an equal 50/50
split is specified in the protocol for this procedure, the actual ratio of convective to radiative flux is unknown
and can vary widely. This lack of consistency renders any results from this test procedure highly questionable.
The greatest advantage of this particular test is that the rate of heat transfer through the fabric is
measured, which can be used to determine the likelihood of burns. Utilizing both a convective and radiative
source also allows greater measurement of the overall performance of the fabric. Fabrics tested in this method
can be ranked according to the likelihood of a burn injury given the environmental conditions generated during
6
the test. Also, this test gives materials a rating, “The thermal protective performance rating is the exposure
energy required to cause the accumulated heat received by the sensor to equal the heat that will cause a second-
degree burn in human tissue.” [6] One major improvement to this procedure when compared to the previously
mentioned protocols is the ability to evaluate multiple layers of fabric. Most protective clothing is not
comprised of a single layer of fabric, thus the ability to test all of the layers together represents a significant
advancement from procedures which only evaluate single layers of fabric. However, as with the other bench
top protocols, the behavior of the garment can not be directly extrapolated from the behavior of the fabric.
The most important disadvantage to this test is the effect of fabric mounting on the results of the test.
Typically, an air gap is left between the test specimen and the calorimeter to simulate loose fitting clothing.
The deformation of the fabric can alter this air gap considerably resulting in unpredictable results. If the
specimen is mounted flat against the calorimeter then the heat transfer to the mass of the calorimeter keeps the
specimen cool resulting artificially long times to develop burn injuries.[17] An additional problem with this
method is the single level of exposure specified in the protocol. By testing at only one exposure, no
information concerning the performance of the fabric at other exposures is generated. Furthermore, the
likelihood of the actual exposure used during fabric evaluations matching the criteria defined in the test
protocol is very low. Because of this, no extrapolations of the performance of the fabric, and ultimately the
garments can be made.
There are other variations of the Thermal Protective Performance test. However, the above procedure
is the one used by the Navy in their test program. The similar test, ASTM test method D 4108-87: Test Method
for Thermal Protective Performance of Materials for Clothing by Open-Flame method utilizes a simple Bunsen
burner for the heat source, eliminating the radiant portion provided by the quartz heater.[2]
2.2.4 Instrumented Manikin Test [4,5,10] The instrumented manikin procedure is different from the previous process because it does not simply
evaluate the material used in the manufacturing of the garment, but tests the complete ensemble of garments on
a life size manikin. The development of this protocol began in the 1960’s. It continues today at the College of
Textiles at North Carolina State University (NCSU). The most common fire environment that the mannequin is
subjected to is the test conducted in the NCSU chamber simulating a flash fire exposure. The Navy has
experimented with other mannequin test methodologies with some success but difficulties in reproducing
results have been encountered.
The NCSU test set up relies on a test chamber containing propane burners, fans to simulate wind
conditions, the manikin and necessary instrumentation to record the conditions within the chamber. The test
chamber is designed to simulate a flash fire exposure. This scenario is created using eight propane burners
calibrated to generate a level of exposure of about 8.4 W/m2 (2 cal/cm2 sec). The duration of the exposure can
be varied with typical times ranging from 2.5 to 10 seconds. The burners are arranged to fully engulf the
manikin in highly luminous flames.[5]
7
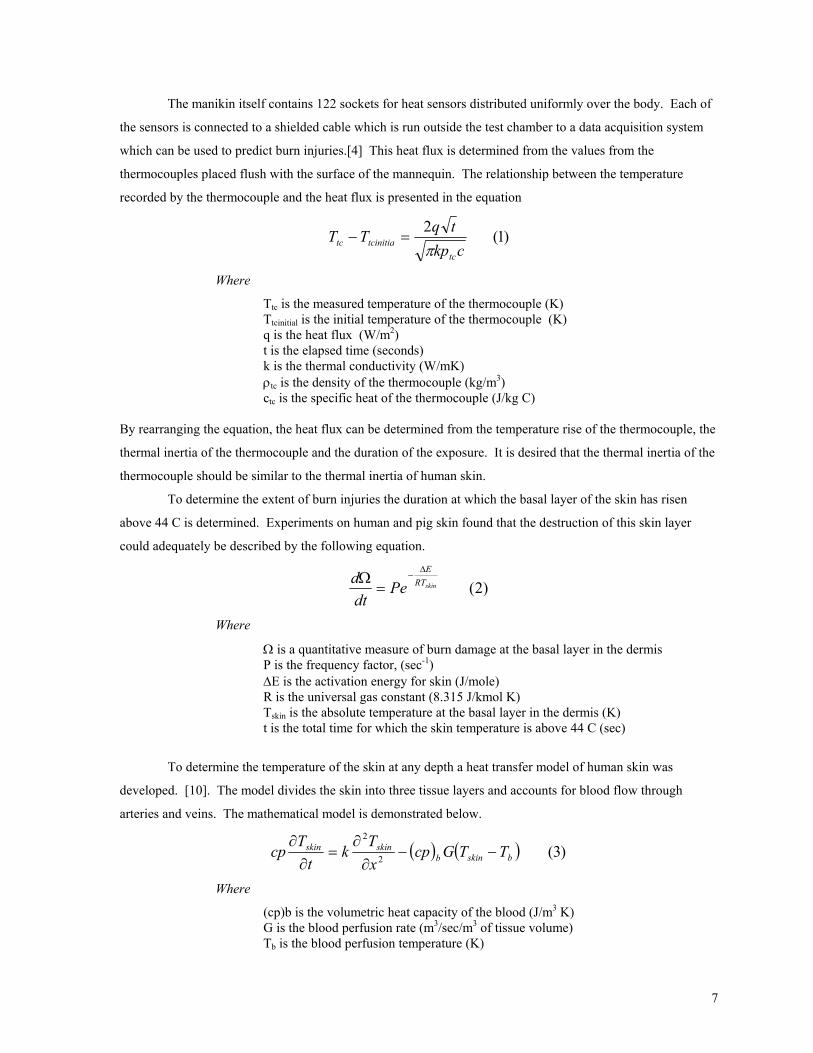
The manikin itself contains 122 sockets for heat sensors distributed uniformly over the body. Each of
the sensors is connected to a shielded cable which is run outside the test chamber to a data acquisition system
which can be used to predict burn injuries.[4] This heat flux is determined from the values from the
thermocouples placed flush with the surface of the mannequin. The relationship between the temperature
recorded by the thermocouple and the heat flux is presented in the equation
)1(2ckp
tqTTtc
tcinitiatc π=−
Where
Ttc is the measured temperature of the thermocouple (K) Ttcinitial is the initial temperature of the thermocouple (K) q is the heat flux (W/m2) t is the elapsed time (seconds) k is the thermal conductivity (W/mK) ρtc is the density of the thermocouple (kg/m3) ctc is the specific heat of the thermocouple (J/kg C) By rearranging the equation, the heat flux can be determined from the temperature rise of the thermocouple, the
thermal inertia of the thermocouple and the duration of the exposure. It is desired that the thermal inertia of the
thermocouple should be similar to the thermal inertia of human skin.
To determine the extent of burn injuries the duration at which the basal layer of the skin has risen
above 44 C is determined. Experiments on human and pig skin found that the destruction of this skin layer
could adequately be described by the following equation.
)2(skinRTE
Pedtd
∆−
=Ω
Where
Ω is a quantitative measure of burn damage at the basal layer in the dermis P is the frequency factor, (sec-1) ∆E is the activation energy for skin (J/mole) R is the universal gas constant (8.315 J/kmol K) Tskin is the absolute temperature at the basal layer in the dermis (K) t is the total time for which the skin temperature is above 44 C (sec)
To determine the temperature of the skin at any depth a heat transfer model of human skin was
developed. [10]. The model divides the skin into three tissue layers and accounts for blood flow through
arteries and veins. The mathematical model is demonstrated below.
( ) ( ) )3(2
2
bskinbskinskin TTGcp
xT
kt
Tcp −−
∂∂
=∂
∂
Where
(cp)b is the volumetric heat capacity of the blood (J/m3 K) G is the blood perfusion rate (m3/sec/m3 of tissue volume) Tb is the blood perfusion temperature (K)

8
Tskin is the tissue temperature (K) x is the depth into the skin (m)
During a typical simulation, the temperature measured by each of the thermocouples is used to determine the
heat flux to the skin. This value is then used to calculate the temperature of the interior layers of the basal skin
layer from which burn injuries can be calculated.
An additional use of the thermal manikin has been developed by the Navy and Air Force for scenarios
where a flash fire exposure is not suitable. In this test, the heat exposure is created using a pool fire burning
Heptane. The manikin is suspended from a movable assembly and separated from the burning pool fire by
fireproof curtains. The assembly is propelled along a track at a calculated velocity that results in the desired
exposure time. After the manikin passes through the fire, there is additional set of curtains on the opposite side
of the fire to protect against additional exposure. Another variation of the test uses a mannequin suspended
from a boom that moves in a large arc using a rotational boom instead of the straight track.[28]
The advantages of both of these tests are that they investigate the behavior of the entire garment in the
same fashion that it will be worn. In addition, burn injury to a simulated wearer is predicted providing a
quantification of the level of protection offered. The data acquisition system allows the observation of the
development of burns as a function of time, which will assist in future garment design by identifying burn
prone areas.
There are numerous disadvantages to this system. The first is that only one type of fire scenario is
tested for each type of manikin test. The NCSU test simulates only a flash fire of highly luminescent flames
while the test conditions used by the Air Force and Navy only simulate a stationary mannequin passing through
a pool fire. Additionally, no significant study has been conducted to determine if the placement of the burners
have any significant impact upon the results of the test, or even how closely the burner configuration simulates
the environment encountered in a flash fire scenario. In addition, the mannequins are static, they do not move
like real human beings. As a wearer moves, the fit of the garment against different parts of the body can
change which could greatly alter the protection offered by that garment.[16] Additional biological
consideration such as sweat can also play important factors and are not considered.
2.2.5 Instrumented Robotic Manikin Test
Researchers at the Pacific Northwest Laboratories have attempted to overcome the shortcomings
associated with the traditional thermal manikin by developing a robotic manikin. This manikin can simulate the
movement of a wearer as well as simulating several biological processes such as perspiration and respiration.
[13] These have been used to determine the effectiveness of protective clothing in the same manner as the
traditional manikin but efforts are under way to develop thermophysiological controls. This would be a great
leap forward because it would incorporate simulated tissues as opposed to direct interpolation from surface
mounted heat sensors. Furthermore, these would allow body core temperature and skin surface temperature
simulation. Efforts are currently in place to couple all of the physiological systems in such a way as they
realistically simulate human physiological behavior. For example, a high rate of activity would increase the

9
perspiration and respiration rate. Currently this particular mannequin has not been used in fire tests but
adapting the mannequin to handle this environment would not be difficult.
The major hurdle facing this apparatus is acceptance in the scientific community. The test data from
the mannequin have not been substantiated against additional data, and no accepted usage guidelines for the
technology exist. These hurdles could easily be overcome by the endorsement of this technology by a
recognized authority.
2.3 Justification for an Improved Navy Test None of the tests presented here accurately investigates the performance of clothing designed to
provide protection against heat and flames. Exposure times, heat fluxes and modes of heat transfer are difficult
to predict in a real fire, but all the tests investigate very specific thermal environments. Some variation is
allowed in some of the tests, but not enough to rank the protection provided by an article of clothing. In the
case of the Navy, there are a large number of likely fire scenarios, each one radically different from the other.
None of the test methods currently in use addresses the diversity of potential shipboard fires.
The bench top tests offer little value in testing behavior of a garment and are best suited for selecting
an appropriate fabric when designing protective garments. They are also useful as quality control checks when
manufacturing protective fabrics. Data collected from these types of tests can not be used to predict the
performance of the completed garment in a real fire scenario. Furthermore, just because a fabric performs well
in one test does not mean that it will perform well in another test, and it doesn’t mean that it will be the best
performer for general protection from heat and flame. These tests are useful only when combined with other
tests and the results analyzed and compared to the level of protection desired. This data can then be used to
select an appropriate fabric but it would still be difficult to predict the performance of the completed garment
until full-scale tests were conducted.
The two manikin tests are much better at evaluating performance of a protective garment. However,
they are hampered by the inability to test a wide range of fire scenarios. Garment fit is an important factor in
burn injuries. Because fit changes as a wearer moves, the robotic manikin is a more accurate test than the
simple manikin but has not yet been widely accepted as a valid test.
Perhaps the best test would incorporate the robotic manikin and a test chamber similar to the NCSU
chamber that is set up to allow a wide range of fire scenarios, from pool fires to flash fires to simulated
structure fires. A test sequence that involves a wide range of fire environments could be developed. If enough
fire scenarios were investigated, it could become possible to predict the behavior of the garment under different
scenarios by observing trends in protective behavior. This comprehensive testing along with the motion of the
mannequin would allow the performance of a garment to be quantified with much more confidence than current
test methods.
10
3.0 Prediction of Fire Environments Typical of U.S. Navy Ships
The complete evaluation of existing test methods and the development of new ones require the
characterization of the expected fire exposures. With an infinite number of fire scenarios possible, it is
impossible to investigate all of them. Judicious examination of typical ship fires allows careful selection of a
smaller number of fire scenarios that cover the spectrum of reasonable survivable fires. In this study, efforts
were made to select widely varying fire scenarios to cover all possible types of fires. This should allow
qualitative analyses of scenarios not specifically examined but which are analogous to one of the investigated
fire scenarios. This report presents possible fire scenarios and then selects the most reasonable and likely
scenarios for extensive investigation.
One important factor to consider when developing fire scenarios for full scale testing is the
survivability of the scenario assuming the fabric provides adequate levels of protection. For very high heat
fluxes or long exposures, burn injuries are not the only factor that could result in death or injury. In many
cases, death would not result from burn injuries but from inhalation of hot products of combustion, resulting in
carbon monoxide poisoning or irreversible damage to lung tissue. Designing clothing to provide protection
from environments so severe that death will result from other causes is neither cost effective or logical. The
fire scenarios presented here do not consider these important factors.
3.1 Critical Parameters Required to Determine Clothing Exposure The investigation of protective clothing is dependent upon three major variables that are characterized
by a fire. These three variables directly and indirectly define the exposure to which the test specimen is
subjected. These parameters are; Fire Intensity measured as heat release rate, Convective and Radiative heat
transfer to the test specimen, and the duration of exposure of the test specimen.
3.1.1 Duration of Exposure
The duration of exposure can be difficult to classify, depending upon the actions of the crewmember
wearing the apparel including time of egress and the mental capacity of the individual. Determining the time to
failure of a garment given a particular fire scenario can circumvent this problem. The failure criterion depends
upon the exact usage of the apparel being tested. A reasonable failure for a daily wear uniform may be 10% of
the body burned value selected by the appropriate individuals. Failure for fire fighting gear might be a 75-
degree temperature rise on the inside of the fabric. Regardless of the criteria used to define the failure of the
garment, the total elapsed time between initial exposure and failure can be used to compare the level of safety
provided by each tested garment. With computerized data acquisition systems, comparisons between fabrics
can be much more complex involving a much greater number of variables, but often times this analysis is not
possible due to monetary constraints. For these conditions, a time to failure can be a reasonable measure to the
level of protection offered by a garment. After the garments undergoing evaluation have been exposed to a

11
variety of fire scenarios, the results can be compared. This allows the garment providing the best overall
protection to be selected.
3.1.2 Fire Intensity
Fire Intensity depends exclusively upon the fire scenario that is being recreated in the test chamber.
The difficulty in selecting this parameter come in determining appropriate design fires based on the fuel load
and fuel type in a given compartment. Careful consideration is needed to determine reasonable sizes of a
simulated fire based on both the available fuel and ventilation in the compartment, and the level of protection
the tested garment is designed to provide. Fires that are much larger than the garment is intended to provide
protection from will quickly cause a failure in the garment and little will be learned. On the other had, the
design fire needs to be large enough to represent a considerable hazard to the occupants in the compartment to
evaluate the protectiveness of the clothing. A fire size needs to be selected that challenges the protection
provided by the garment while remaining within the appropriate design range of fires. The major difficulty
with fire intensity comes from attempting to recreate the design fires. It has been demonstrated that specific
heat fluxes are difficult to reproduce due to variations in furnace refractory materials, placement of furnace
measurement devices, and differences between the fuels used in the test chamber and the characteristics of the
fuels that would be burned in an actual fire.[30] Actual fires are very susceptible to uncontrollable variables
and thus are inappropriate for laboratory experiments. However, artificial fires created with radiant panels and
convective heat sources such as laboratory burners often do not provide sufficiently accurate recreations of the
actual fires that are being simulated.
3.1.3 Convective and Radiative Heat Transfer
The exact modes of heat transfer to a test specimen are extremely difficult to both predict and
control.[30] Furthermore, determining these values for design fires can be difficult as well. Very small
changes in the orientation of clothing, the type of fuel burning, the ventilation in the room and many other
variables can change these modes of heat transfer very drastically. To circumvent these difficulties relatively
simple geometric relationships between the fire and the target are used, and for the more complex
compartmented fire scenarios, zone models are used to predict these values. The only way to be certain that the
fire is being recreated to a high level of accuracy is to run full-scale tests identical to the design fire utilizing the
same compartment configuration and fuel source. Unfortunately, this is an expensive process, which cannot be
conducted extensively. An alternative to this process is to use the calculated values and attempt to recreate
them as accurately as possible for each test. By accurately reproducing the selected value for every performance
evaluation, the reliability of cross test comparisons will be greatly enhanced. Although exact reproductions of
the fire scenario will not be made, the environment created in the test chamber will be a close approximation
providing a reasonable comparison between test chamber results and real fire performance.
12
3.2 Possible Shipboard Fire Scenarios An analysis of shipboard fire scenarios was conducted to determine the types of fires that could be
expected. Over a six year period from 1974-1969 major shipboard fires could be categorized into the four
following categories listed in order of decreasing fire occurrences; (1) Machinery Spaces, (2) Supply Areas, (3)
habitability spaces, and (4) deck storage areas. [20] The types of fires expected are unique for each of these
spaces, and in the case of machinery spaces and deck storage the fire environment can be extremely difficult to
predict.[20-25]
3.2.1 Machinery Spaces
Machinery Spaces include engine spaces, steering gear spaces, generator spaces, auxiliary machine
spaces, repair shops and any other area where machinery is housed. These types of spaces have resulted in the
greatest number of fire incidents and fire fatalities due to the abundance of ignition sources in close proximity
with flammable liquids. Ignition sources include hot or overheated equipment, faulty wiring, and repair
activities such as cutting and welding. Ignitable liquids include engine fuel, lubrication oils and greases,
hydraulic fluids, and cleaning solutions. Flammable liquids can accumulate as the result of an engine
component failure, poor housekeeping, or accidental spillage.
3.2.2 Supply Areas
Supply areas include the mess hall, laundry room, galley, and other storage areas similar in nature.
Typically, these compartments contain predominantly solid fuel sources with limited amounts of flammable
liquids in small quantities. With the exclusion of the galley, ignition sources are typically faulty electrical
equipment or smoking paraphernalia. Cooking activities typically provide ignition sources in the galley, with
grease fires being the most common occurrence in this space. Fuel sources are always present in the form of
furniture and clothing, although poor housekeeping can increase the likelihood of a fire.
3.2.3 Habitability Spaces
Berthing areas include both crews’ quarters and officer wardrooms. The predominant sources of
combustible material in these spaces are mattresses and bedding materials. Additionally there is expected to be
clothing and other combustibles contained within metal lockers but these lockers are typically closed and are
not expected to contribute significantly to the fuel load. [15] Ignition sources have historically been smoking
paraphernalia or arson activities although faulty electrical equipment could be another potential source of
ignition. It has been demonstrated that a serious fire could result in these areas even when the fire initiation
source is small due to the extreme flammability of mattress materials and abundance of easily ignited materials.
3.2.4 Deck Storage Areas
Deck Storage areas can be extremely difficult to classify due to the dynamic nature of topside
activities. Furthermore, the role of the ship plays a large part in determining the combustible materials that will
13
be available on deck. Common source of deck fires have been painting and cleaning activities, when
flammable liquids used in these operations are ignited by smoking or faulty electrical equipment. Welding
during repairs has also been a source of ignition for these types of fires. Another potential source of fuel is jet
propellant spilled during aircraft refueling operations or as the result of an aircraft crash.
3.3 Predicted Fire Environments 3.3.1 Engine Room
Two types of fires are common in the engine room, pool fires and jet or spray fires. Flammable
liquids are likely to be the fuel source for nearly all machinery space fires. Engine oil, Diesel oil and hydraulic
fluid are the flammable liquids that typically ignite in these areas. The review of several marine accidents
indicates that engine lubricating oil or hydraulic fluid leaking under pressure can easily be ignited by the
multitude of hot surfaces found in these compartments.[8] In cases where these fluids are under very high
pressure a jet fire can be produced. If the pressure is not great enough to cause these combustibles to form a
droplet spray or the spray is not ignited, then the fuel can collect on the floor of the compartment resulting in a
pool fire or a combination pool/spray fire. Depending on the fuel used for the engines, a leak in the fuel
delivery system could also result in a jet or pool fire.
One of the difficulties is determining the appropriate scenarios for the development of these fires. For
flaming jet fires, the fuel delivery rate can be determined if the size of the failure through which the fuel is
flowing as well as the pressure at which it is being released is specified. For the pool fires an additional
variable, the time between the start of the leaking combustible and ignition also needs to be specified. This
allows the size of the initial pool of flammable liquids to be determined.
Khan, et al, determined a variety of correlation’s in the paper “Characterization of Hydraulic Fluid
Spray Combustion” [18] for a number of different types of hydraulic oil and flow rates. An empirical
relationship was developed that determines the total heat release rate is proportional to the product of the
combustion efficiency, net heat of combustion, and fluid exit velocity.
)4(11.0 exitCchCH VHxQ ∆=
Where
Qch is the chemical heat release rate (kW) xch is the combustion efficiency ∆Hc is the heat of combustion (kJ/kg) Vexit is the fluid exit velocity (m/sec)
The nozzle used to generate this empirical relationship had an exit diameter of 0.38 mm (0.015 in). This is a
very small opening, much smaller than those expected aboard a Navy Vessel. Consequently, this equation is
not useful for this application.
Combustion efficiencies were shown dependent upon discharge orifice type and exit velocity. Typical
values ranged from a low of 0.2 using a solid cone nozzle, Polyglycol in Water hydraulic oil and an exit
14
velocity of 65 m/s (213 ft/sec), to a high of over 0.95 using a hollow cone nozzle, a variety of different
hydraulic oils, and fluid exit velocities between 20 and 70 m/s (65.6 and 229.6 ft/sec). Typical values for the
radiant fraction of the total heat release rate vary from a high of 0.40 for phosphate esters to a low of 0.12 for
water-in-oil emulsions.
3.3.2 Berthing Areas and Supply Areas
These two areas can be lumped together because of the similarities in fuel types that exist in these
spaces. Fires in these types of compartments closely mimic those typically found in land based structure fires.
This is a significant advantage because it allows the large body of knowledge that has been developed for these
fires to be applied to equivalent shipboard fires. The major differences between the two are the metal
bulkheads typically used in ships. The emissivity of the bulkheads is much higher than the emissivity of typical
structures and increases the radiative feedback to the pool. The metal bulkheads can also be an advantage as
they allow heat to conduct out of the compartment reducing gas temperatures. In this case, concentration will
be placed on the berthing areas because of the considerable fuel loads contained in these areas. Fires in supply
areas such as the mess hall will be similar in nature but less severe because of these differences in total
combustible loads.
Extensive full-scale experiments have been conducted on berthing compartment fires aboard Navy
ships [29]. This information can be used to determine the fire scenarios that are reasonable for this
compartment. Since the development of these fires are well defined and relatively predictable, it would be
desirable for garments to be subjected to the growth of the fire from ignition until a reasonable level of fabric
failure. With steady state fires, exposure duration needs to be selected, oftentimes somewhat arbitrarily. By
subjecting the clothing to the full growth of the fire, the elapsed time between fuel ignition and unacceptable
burn injuries can be measured. This will provide a better understanding of the level of protection offered by a
given article of clothing.
Full scale fire tests of ship accommodation quarters utilizing a single three tier bunk indicates that fire
sizes of approximately 100 kW (23.9 kgcal/sec) are possible during a five minute period after the onset of self
sustained ignition. Depending upon the ventilation condition and contents of the berthing compartment,
maximum rates of heat release as high as 1400 kW (334.6 kgcal/sec) and as low as 11 kW (2.63 kgcal/sec)
were observed. The radiant fraction of these fires is close to those seen in structure fires, with an emissivity of
approximately 0.2 to 0.3
3.3.3 Deck Storage
Deck fires are similar to engine room fires, but can not be treated the same due to differences in fuels
and the lack of compartmentation effects. Pool fires, and to a lesser extent, jet fires would be expected on the
surface of the deck. It is expected that the majority of fires on the deck would be the result of cleaning and
painting of the deck or the refueling of aircraft. Therefore, expected fuels are paint, cleaning fluids, and
aviation gas. Pool fires can occur from painting and cleaning activities or the spillage of jet fuel. Jet fires could
15
develop as the result of leaks developing in high-pressure fuel delivery systems for aircraft refueling. The size
of a pool fire that results from painting or cleaning can be determined by determining the average amount of
paint or cleaning fluid that is still flammable during a painting operation. For a fuel spill or jet fire, the same
variables needed for the engine compartment must be specified; i.e. pressure, size of fuel line rupture, and time
between the initiation of the leak and ignition.
Full-scale tests of pool fires are readily discovered in the literature and their behavior well
documented. Heat release rates are highly dependent upon the fuel type, size of the pool, and the surface on
which the pool is burning. Radiant fractions can be as low as 0.1 for small, clean flames to as high as 0.8 for
large pool fires with highly luminescent flames. Predictions of an exact fire environment are highly dependent
upon accurately specifying the conditions under which the fire occurs. For a fire on the deck, additional
atmospheric factors such as wind speed and direction need to be considered when determining exposure
conditions. The loss of heat from the burning pool into the metal decking plates will effect the burning rate of
the pool, but this effect will be difficult to quantify and is ignored.
3.4 Specific Fire Scenarios Three specific fire scenarios were selected for quantitative analysis. Spray and Pool fires for a variety
of fuels are investigated in both enclosed spaces and out in the open. Bunk fires are investigated in enclosed
spaces only.
3.4.1 Hydraulic Oil Spray Fire
Spray fires have not been extensively studied and can be very difficult to predict. The controlling
factor in spray fires is often the droplet size, which is highly dependent upon the conditions of the release of the
flammable liquid. Khan et al indicates that there are three distinct classes of spray fires; Vapor jet diffusion
flames defined by a high proportion of droplets vaporized in a distance very short compared with the overall
flame length; droplet spray flame occurring when droplets flight length is longer than the flame length and
turbulent diffusion flame characterized by a mixed region of spray combustion with droplets existing along all
or almost all of the flame length [18]. The ability to predict the type of flame is beyond the scope of this project
as it is not possible without knowing the precise configuration of the discharge orifice and the atomization
properties of the fuel. An attempt can be made to use the existing research on spray fires and apply it to the
Navy application to predict a range of spray fire scenarios suitable for clothing performance testing. The
inability to precisely determine spray fire parameters given a fire scenario does not effect the usefulness of
recreating a calculated fire environment if it can be determined that the predicted values are within the range of
reasonable values for this fire configuration. From the standpoint of fabric testing the ability to consistently
reproduce the calculated environment is of greater importance for making accurate comparisons between
different fabrics or clothing configurations.
The most likely spray fire scenario involves the bursting of a high-pressure oil or hydraulic line, with
the resulting spray of flammable liquid ignited by adjacent hot surfaces. The total heat release rate will depend

16
upon three major factors, the net heat of combustion of the liquid, the size of the discharge orifice, and the
discharge pressure. To simplify the analysis and generate the worst case scenario it was assumed that the
failure mode would be the complete severing of a given oil or hydraulic line. The failure mode would be
equivalent to a weakness in a line resulting in a bulging and subsequent failure of the line. The burst hose end
would have the shape of a slightly diverging nozzle, as the hose would stretch during the failure at the weak
point in the line. From this type of failure, a pressurized hose can assume to be terminating at a virtual nozzle.
In this study, the average net heat of combustion for typical hydraulic oils was calculated to be 130
kW/m3. A range of discharge diameters from 1 to 10 cm (0.39 to 3.9 in) and a range of pressures from 101 kPa
(6.9 psi) to 13600 kPa (2000 psi) were investigated. The combustion process was assumed 90% efficient
because efficiency is in large part influenced by the configuration of the fluid release point, which is not
known, and thus a high number is selected to remain conservative. Khan demonstrated combustion efficiencies
of 0.90 for flows above 30 m/sec (98.4 ft/sec), thus assuming a combustion efficiency of 0.9 will yield
conservative, yet reasonable results.[18]
To determine the heat release rate from a spray fire the volumetric flow rate must be
calculated from the exit velocity of the flammable liquid and the pipe diameter. To determine the exit velocity
given the pressure the Bernoulli equation is used for flow through a diverging nozzle, applied at the inlet
diameter of the nozzle, considered equal to the hose diameter and the exit diameter of the nozzle, considered to
be 115% of the hose diameter (15% increase in diameter at burst point). Figure 3.4.1-1 below demonstrates
this configuration.
Figure 3.4.1-1: Virtual Nozzle Configuration
The Bernoulli equation applied in this manner can be rearranged to solve for the exit velocity in the following
manner.
)7(22
)6(
)5(22
22
22
exitambinletline
outin
outexitamb
ininletline
VpVp
zz
gzVp
gzVp
+=+
=
++=++
ρρ
ρρ
The above applies the Bernoulli equation at the inlet and outlet to the virtual nozzle ignoring any effects
resulting in elevation changes. If the continuity equation is then applied, the exit velocity may be solved.
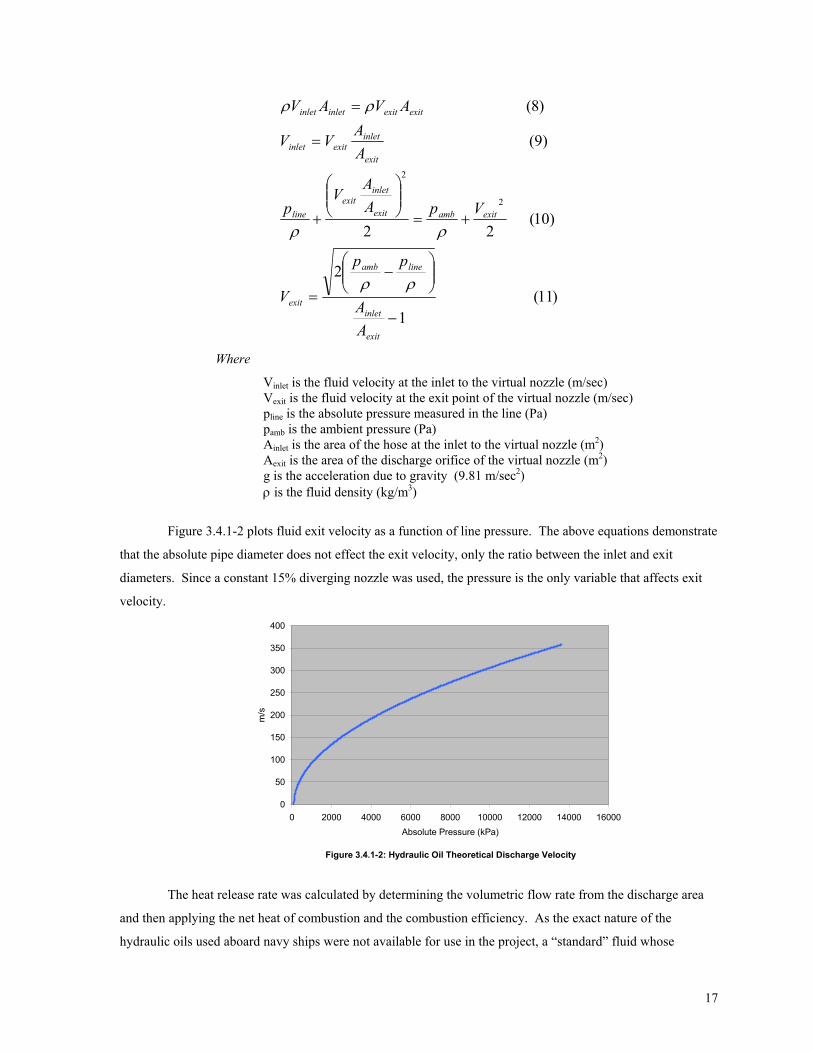
17
)11(1
2
)10(22
)9(
)8(
2
2
−
−
=
+=
+
=
=
exit
inlet
lineamb
exit
exitambexit
inletexit
line
exit
inletexitinlet
exitexitinletinlet
AA
pp
V
VpAA
Vp
AA
VV
AVAV
ρρ
ρρ
ρρ
Where
Vinlet is the fluid velocity at the inlet to the virtual nozzle (m/sec) Vexit is the fluid velocity at the exit point of the virtual nozzle (m/sec) pline is the absolute pressure measured in the line (Pa) pamb is the ambient pressure (Pa) Ainlet is the area of the hose at the inlet to the virtual nozzle (m2) Aexit is the area of the discharge orifice of the virtual nozzle (m2) g is the acceleration due to gravity (9.81 m/sec2) ρ is the fluid density (kg/m3)
Figure 3.4.1-2 plots fluid exit velocity as a function of line pressure. The above equations demonstrate
that the absolute pipe diameter does not effect the exit velocity, only the ratio between the inlet and exit
diameters. Since a constant 15% diverging nozzle was used, the pressure is the only variable that affects exit
velocity.
Figure 3.4.1-2: Hydraulic Oil Theoretical Discharge Velocity
0
50
100
150
200
250
300
350
400
0 2000 4000 6000 8000 10000 12000 14000 16000Absolute Pressure (kPa)
m/s
The heat release rate was calculated by determining the volumetric flow rate from the discharge area
and then applying the net heat of combustion and the combustion efficiency. As the exact nature of the
hydraulic oils used aboard navy ships were not available for use in the project, a “standard” fluid whose
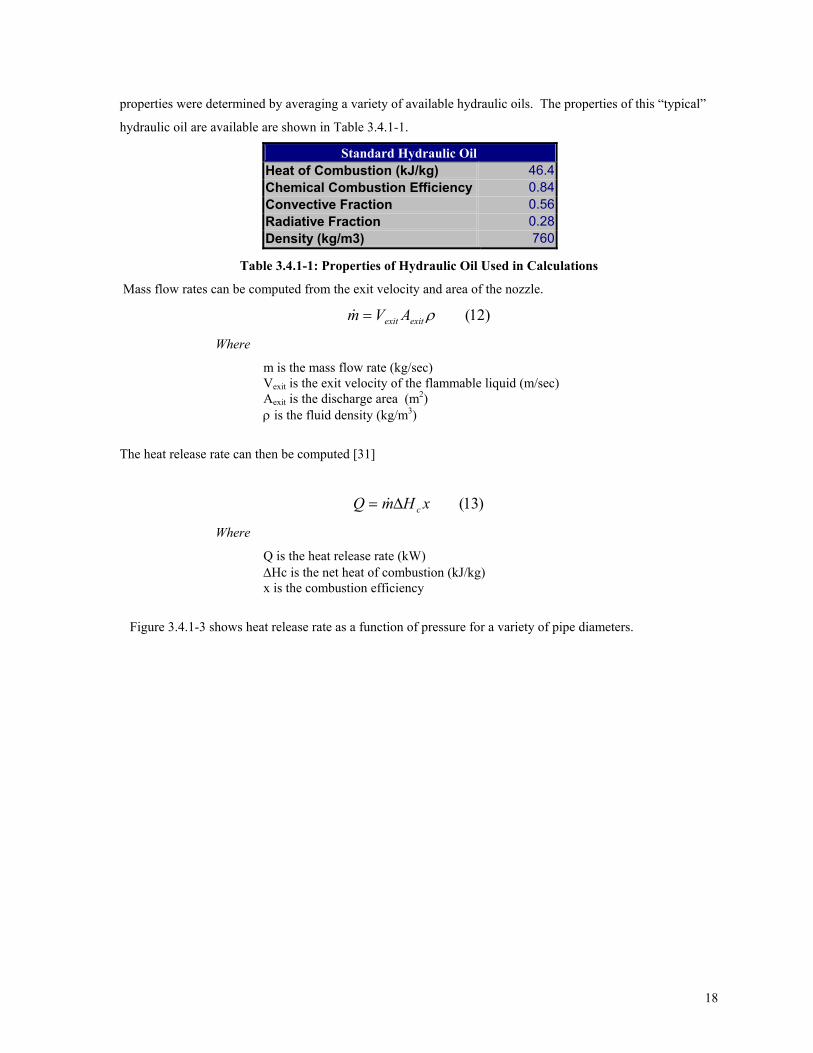
18
properties were determined by averaging a variety of available hydraulic oils. The properties of this “typical”
hydraulic oil are available are shown in Table 3.4.1-1.
Standard Hydraulic Oil Heat of Combustion (kJ/kg) 46.4Chemical Combustion Efficiency 0.84Convective Fraction 0.56Radiative Fraction 0.28Density (kg/m3) 760
Table 3.4.1-1: Properties of Hydraulic Oil Used in Calculations
Mass flow rates can be computed from the exit velocity and area of the nozzle.
)12(ρexitexit AVm =&
Where
m is the mass flow rate (kg/sec) Vexit is the exit velocity of the flammable liquid (m/sec) Aexit is the discharge area (m2) ρ is the fluid density (kg/m3)
The heat release rate can then be computed [31]
)13(xHmQ c∆= &
Where
Q is the heat release rate (kW) ∆Hc is the net heat of combustion (kJ/kg) x is the combustion efficiency
Figure 3.4.1-3 shows heat release rate as a function of pressure for a variety of pipe diameters.
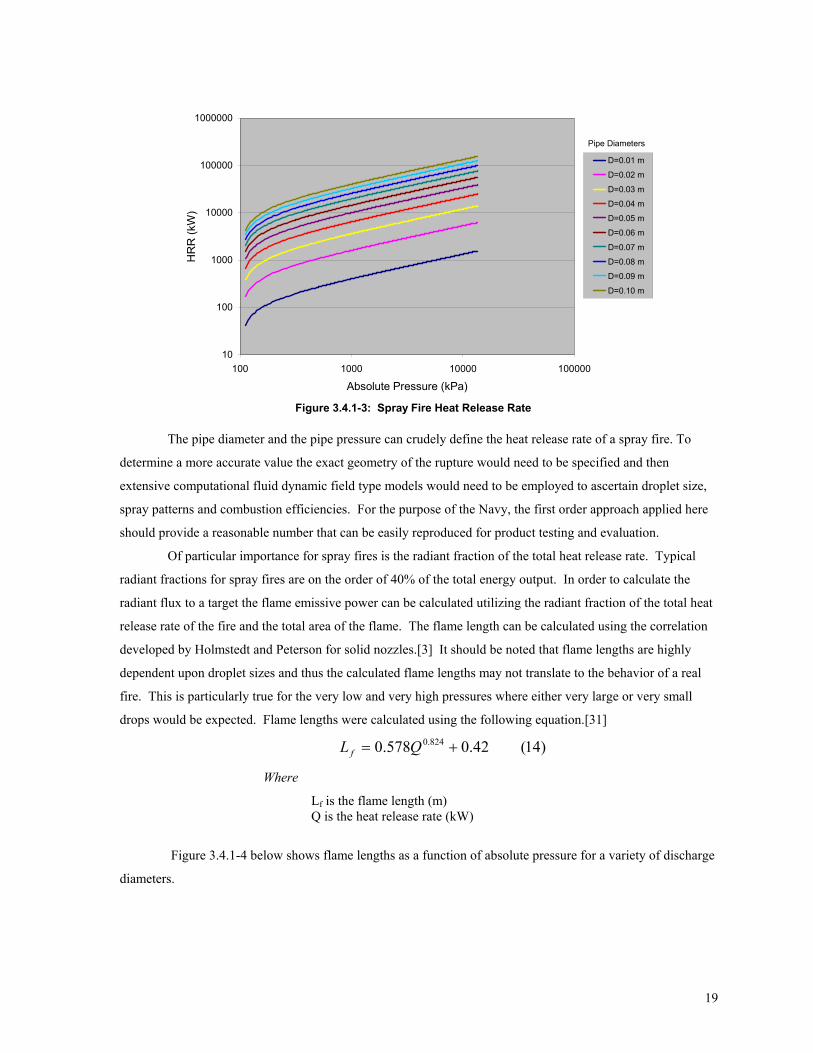
19
Figure 3.4.1-3: Spray Fire Heat Release Rate
10
100
1000
10000
100000
1000000
100 1000 10000 100000
Absolute Pressure (kPa)
HR
R (k
W)
D=0.01 m
D=0.02 m
D=0.03 m
D=0.04 m
D=0.05 m
D=0.06 m
D=0.07 m
D=0.08 m
D=0.09 m
D=0.10 m
Pipe Diameters
The pipe diameter and the pipe pressure can crudely define the heat release rate of a spray fire. To
determine a more accurate value the exact geometry of the rupture would need to be specified and then
extensive computational fluid dynamic field type models would need to be employed to ascertain droplet size,
spray patterns and combustion efficiencies. For the purpose of the Navy, the first order approach applied here
should provide a reasonable number that can be easily reproduced for product testing and evaluation.
Of particular importance for spray fires is the radiant fraction of the total heat release rate. Typical
radiant fractions for spray fires are on the order of 40% of the total energy output. In order to calculate the
radiant flux to a target the flame emissive power can be calculated utilizing the radiant fraction of the total heat
release rate of the fire and the total area of the flame. The flame length can be calculated using the correlation
developed by Holmstedt and Peterson for solid nozzles.[3] It should be noted that flame lengths are highly
dependent upon droplet sizes and thus the calculated flame lengths may not translate to the behavior of a real
fire. This is particularly true for the very low and very high pressures where either very large or very small
drops would be expected. Flame lengths were calculated using the following equation.[31]
)14(42.0578.0 824.0 += QL f
Where
Lf is the flame length (m) Q is the heat release rate (kW)
Figure 3.4.1-4 below shows flame lengths as a function of absolute pressure for a variety of discharge
diameters.

20
Figure 3.4.1-4: Spray Fire Flame Lengths
0.1
1
10
100
100 1000 10000 100000
Absolute Pressure (kPa)
Flam
e Le
ngth
(m)
D=0.01 mD=0.02 mD=0.03 mD=0.04 mD=0.05 mD=0.06 mD=0.07 mD=0.08 mD=0.09 mD=0.10 m
Pipe Diameters
The radiant portion of energy transferred from the jet flame to other objects in the compartment is
dependent upon the geometry of the object. A shape factor for radiant transfer from a cylinder to a differential
element was used to calculate the radiation field to a plane at a specified distance from the fire, which is
modeled as a cylinder. This configuration will result in the maximum radiant exposure to the individual. The
convective heat transfer to the individual is significantly more difficult to predict as this depends upon the
configuration of both the compartment and the target subject. Computing this value directly is very difficult
requiring computation fluid dynamics. Simpler field models are available that approach the problem
empirically and give reasonable results. For situations where the compartmentation effects are not present, the
convective portion of the total heat flux to a target will be minimal. This is only true when the subject is far
enough away from the fire so that the exposure to the fire plume will be minimal.
The radiant heat flux to a target can be calculated by relating the flame emissive power to the radiant
energy impinging on a differential target area through a shape factor correction. [31]
)15('' τΦ= Eq
Where
q’’ is the radiant heat flux to the target element (kW/m2) E is the flame emissive power (kW/m2) Φ is the flame-element shape factor correction τ is the atmospheric transmissivity (taken as 1) The flame emissive power was computed using the formula [31]
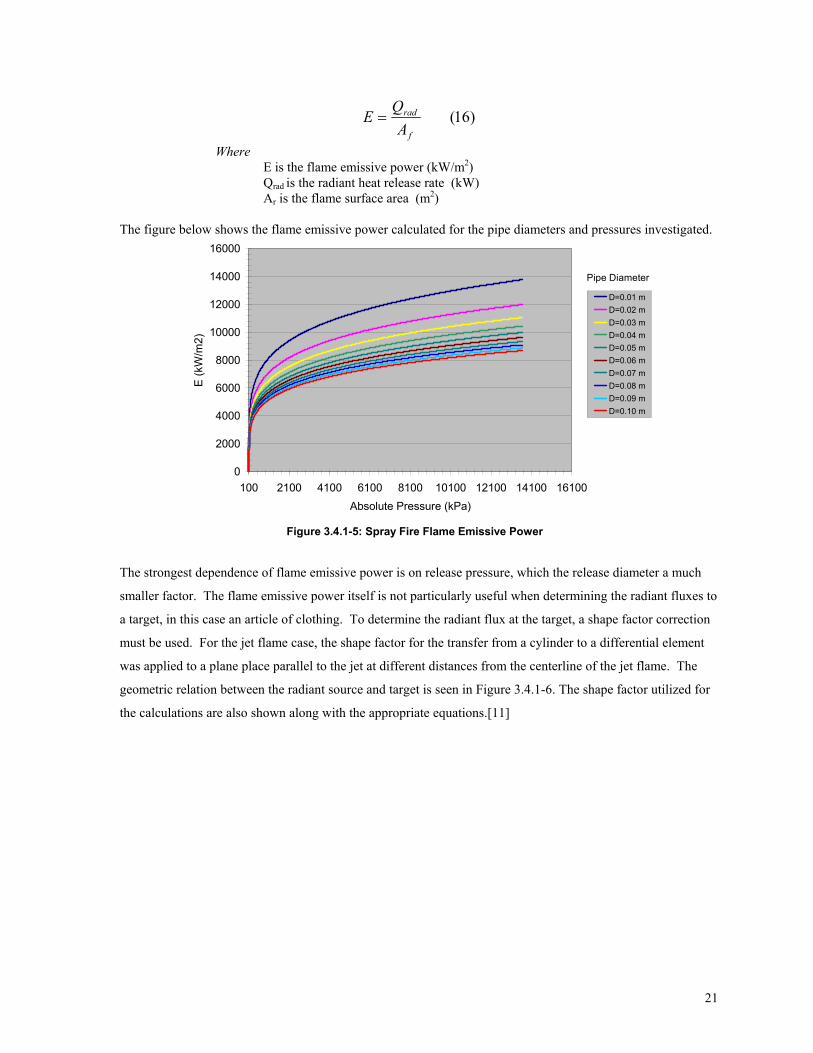
21
)16(f
rad
AQ
E =
Where E is the flame emissive power (kW/m2) Qrad is the radiant heat release rate (kW) Ar is the flame surface area (m2) The figure below shows the flame emissive power calculated for the pipe diameters and pressures investigated.
Figure 3.4.1-5: Spray Fire Flame Emissive Power
0
2000
4000
6000
8000
10000
12000
14000
16000
100 2100 4100 6100 8100 10100 12100 14100 16100Absolute Pressure (kPa)
E (k
W/m
2)
D=0.01 mD=0.02 mD=0.03 mD=0.04 mD=0.05 mD=0.06 mD=0.07 mD=0.08 mD=0.09 mD=0.10 m
Pipe Diameter
The strongest dependence of flame emissive power is on release pressure, which the release diameter a much
smaller factor. The flame emissive power itself is not particularly useful when determining the radiant fluxes to
a target, in this case an article of clothing. To determine the radiant flux at the target, a shape factor correction
must be used. For the jet flame case, the shape factor for the transfer from a cylinder to a differential element
was applied to a plane place parallel to the jet at different distances from the centerline of the jet flame. The
geometric relation between the radiant source and target is seen in Figure 3.4.1-6. The shape factor utilized for
the calculations are also shown along with the appropriate equations.[11]

22
Figure 3.4.1: Relationship between Flame and Target Plane
( )
( ) )17(21
cos5.0tantan11
tan1cos21
41
22
11
22
2
1121
2222
22
1
−++
−+−
−+=Φ
−++===
−−−−
− RRLRX
XRL
RRR
RRLXrhL
rrR
dd ππ
A variety of configurations was investigated with the result available in Appendix A. The results demonstrated
here are for a pipe diameter of 5 cm (1.95 in) and a release pressure of 7000 kPa (1015 psi), which is equivalent
to a flame emissive power of 8540 kW/m2 (2041 kgcal/m2sec). Plots are shown for separation distances of 0.5
m, 0.75 m, 1 m, 2 m, 4 m, 6m, and 10 m (1.64,2.46,3.28,6.56,13.12,19.68,32.8 ft).
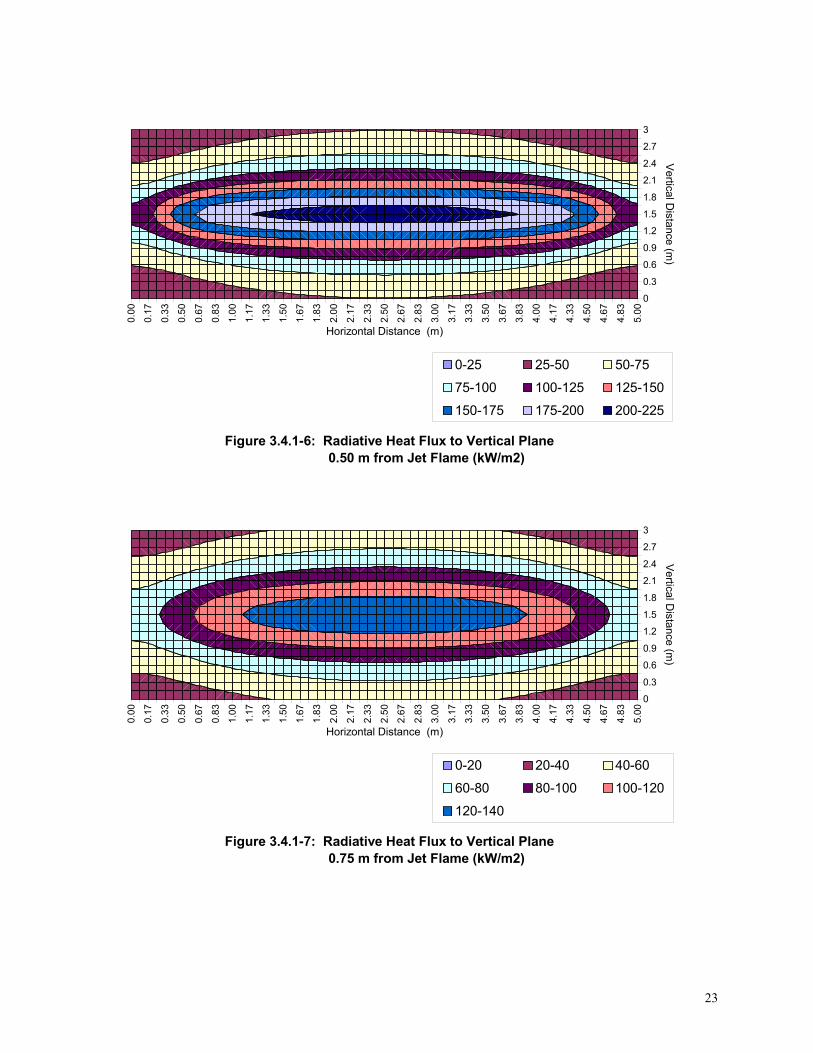
23
0.00
0.17
0.33
0.50
0.67
0.83
1.00
1.17
1.33
1.50
1.67
1.83
2.00
2.17
2.33
2.50
2.67
2.83
3.00
3.17
3.33
3.50
3.67
3.83
4.00
4.17
4.33
4.50
4.67
4.83
5.00
0
0.3
0.6
0.9
1.2
1.5
1.8
2.1
2.4
2.7
3
Horizontal Distance (m)
Vertical Distance (m
)
Figure 3.4.1-6: Radiative Heat Flux to Vertical Plane 0.50 m from Jet Flame (kW/m2)
0-25 25-50 50-7575-100 100-125 125-150
150-175 175-200 200-225
0.00
0.17
0.33
0.50
0.67
0.83
1.00
1.17
1.33
1.50
1.67
1.83
2.00
2.17
2.33
2.50
2.67
2.83
3.00
3.17
3.33
3.50
3.67
3.83
4.00
4.17
4.33
4.50
4.67
4.83
5.00
0
0.3
0.6
0.9
1.2
1.5
1.8
2.1
2.4
2.7
3
Horizontal Distance (m)
Vertical Distance (m
)
Figure 3.4.1-7: Radiative Heat Flux to Vertical Plane 0.75 m from Jet Flame (kW/m2)
0-20 20-40 40-6060-80 80-100 100-120
120-140

24
0.00
0.17
0.33
0.50
0.67
0.83
1.00
1.17
1.33
1.50
1.67
1.83
2.00
2.17
2.33
2.50
2.67
2.83
3.00
3.17
3.33
3.50
3.67
3.83
4.00
4.17
4.33
4.50
4.67
4.83
5.00
0
0.3
0.6
0.9
1.2
1.5
1.8
2.1
2.4
2.7
3
Horizontal Distance (m)
Vertical Distance (m
)
Figure 3.4.1-8: Radiative Heat Flux to Vertical Plane 1.00 m from Jet Flame (kW/m2)
0-10 10-20 20-30 30-4040-50 50-60 60-70 70-80
80-90 90-100
0.00
0.17
0.33
0.50
0.67
0.83
1.00
1.17
1.33
1.50
1.67
1.83
2.00
2.17
2.33
2.50
2.67
2.83
3.00
3.17
3.33
3.50
3.67
3.83
4.00
4.17
4.33
4.50
4.67
4.83
5.00
0
0.3
0.6
0.9
1.2
1.5
1.8
2.1
2.4
2.7
3
Horizontal Distance (m)
Vertical Distance (m
)
Figure 3.4.1-9: Radiative Heat Flux to Vertical Plane 2.00 m from Jet Flame (kW/m2)
0-5 5-10 10-15 15-20
20-25 25-30 30-35

25
0.00
0.17
0.33
0.50
0.67
0.83
1.00
1.17
1.33
1.50
1.67
1.83
2.00
2.17
2.33
2.50
2.67
2.83
3.00
3.17
3.33
3.50
3.67
3.83
4.00
4.17
4.33
4.50
4.67
4.83
5.00
0
0.3
0.6
0.9
1.2
1.5
1.8
2.1
2.4
2.7
3
Horizontal Distance (m)
Vertical Distance (m
)
Figure 3.4.1-10: Radiative Heat Flux to Vertical Plane 4.00 m from Jet Flame (kW/m2)
6-6.5 6.5-7 7-7.5 7.5-8
0.00
0.17
0.33
0.50
0.67
0.83
1.00
1.17
1.33
1.50
1.67
1.83
2.00
2.17
2.33
2.50
2.67
2.83
3.00
3.17
3.33
3.50
3.67
3.83
4.00
4.17
4.33
4.50
4.67
4.83
5.00
0
0.3
0.6
0.9
1.2
1.5
1.8
2.1
2.4
2.7
3
Horizontal Distance (m)
Vertical Distance (m
)
Figure 3.4.1-11: Radiative Heat Flux to Vertical Plane 6.00 m from Jet Flame (kW/m2)
0-1 1-2 2-3 3-4

26
0.00
0.17
0.33
0.50
0.67
0.83
1.00
1.17
1.33
1.50
1.67
1.83
2.00
2.17
2.33
2.50
2.67
2.83
3.00
3.17
3.33
3.50
3.67
3.83
4.00
4.17
4.33
4.50
4.67
4.83
5.00
0
0.3
0.6
0.9
1.2
1.5
1.8
2.1
2.4
2.7
3
Horizontal Distance (m)
Vertical Distance (m
)
Figure 3.4.1-12: Radiative Heat Flux to Vertical Plane 10.00 m from Jet Flame (kW/m2)
0-0.5 0.5-1 1-1.5
Figure 3.4.1-13 below shows the average and maximum heat flux to the vertical plane as a function of distance
from the fire centerline. For distances less than 0.5 meters, direct impingement by the flame and convective
heat transfer by the flame becomes an issue, as the plane would be located within the fire.
Figure 3.4.1-13: Heat Flux to Target vs Distance
0
50
100
150
200
250
0 1 2 3 4 5 6Distance from Fire Centerline (m)
Hea
t Flu
x (k
W/m
2)
Average Heat FluxMaximum Heat Flux
27
For situations in which there is direct impingement of the jet flame onto the fabric the flame
temperature is important to determine. In addition, the convective heat transfer becomes important due to the
high exit velocity of the fuel. Flame temperatures are dependent upon the fuel but typically are in the range of
1100-1600 K.[31] Some fuels can have much higher flame temperatures, but those that would be commonly
found aboard a navy ship fall within these ranges. The highest flame temperatures would be expected from
burning Kerosene or Jet Fuel, with a flame temperature of 1600K. Gasoline and Fuel Oil have flame
temperatures of around 1200 K.
3.4.2 Pool Fires
Pool fires are divided into two major classifications, confined and unconfined. Unconfined pool fires
exist in areas were the formation of circular pools will not be impeded by barriers such as walls, dykes and
drains. Confined pool fires are pool fires that can not spread in an unobstructed manner. Both of these
configurations are possible on board U.S. navy ships. Unconfined pool fires are characteristics of those
resulting from aircraft refueling accidents or aircraft crash landing damage. Confined pool fires would result
from oil and other flammable liquid spills in small machinery spaces. Fuel sources range from very low flash
point flammable liquids such as Kerosene and Jet fuels (JP-4 and JP-5) to very high flash point liquids such as
lubricating oils. The most likely fire scenario on board a U.S. Naval Vessel is an unconfined pool. Although it
is possible for the confined fire case, the unconfined fire is the more conservative approach and the most likely
scenario. For pool sizes large enough to completely fill the floor surface area of a compartment, the likelihood
of survival would be very small.
Five fuels were investigated for their behavior in pool fire situations. JP-4 and Kerosene are very
similar and represent the different types of jet fuel that would be found on board navy ships. Fuel Oil #6 is
equivalent to heavier oil hydrocarbons such as diesel fuels used for generators and propulsion engines as well
as heavy lubrication oils. Gasoline is a lighter fuel that would be used for hand tools or other portable tools
also would be used in some propeller type aircraft. This is the least likely fuel to be involved in a major spill,
as it would exist in quantities that would not permit a large-scale spill. The final combustible shares properties
that are similar to a variety of hydraulic oils and other light lubricants. Reference [31] lists “transformer oil”
but not “hydraulic oil”. However, transformer oil compares very well to a large variety of lighter lubricating
and hydraulic oils and thus was selected to represent all of these types of flammable liquids. Properties of these
fuels are shown in Table 3.4.1-1.
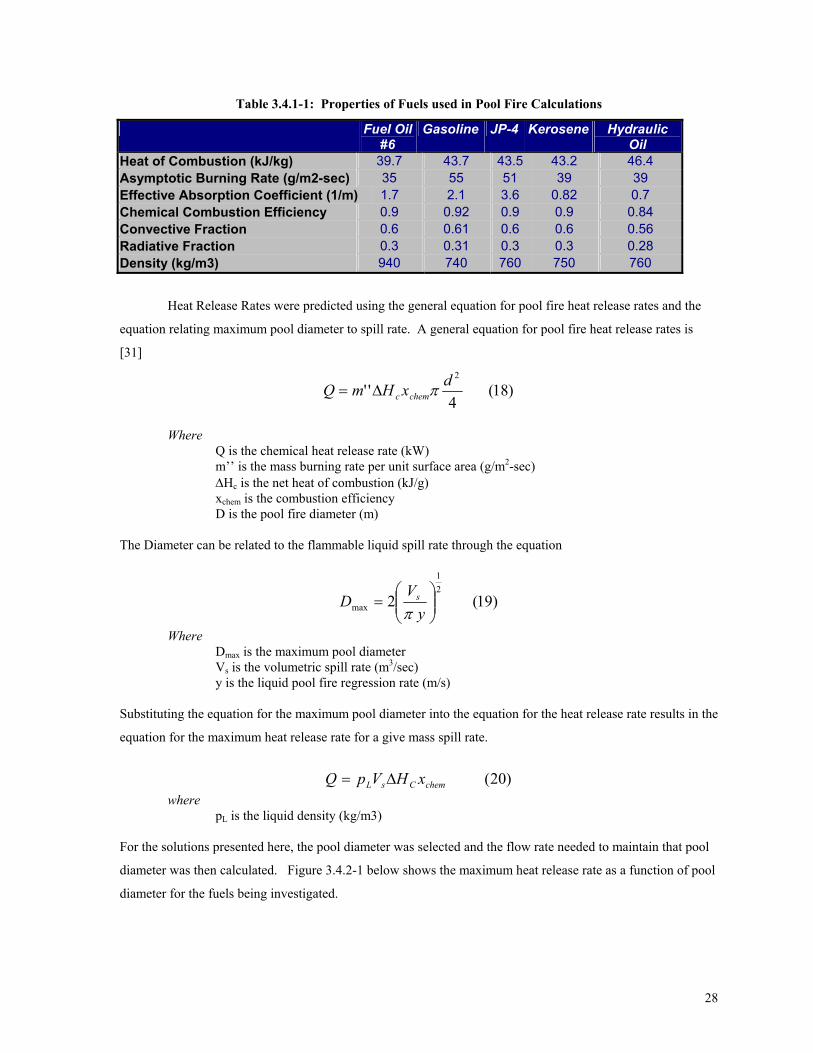
28
Table 3.4.1-1: Properties of Fuels used in Pool Fire Calculations
Fuel Oil #6
Gasoline JP-4 Kerosene Hydraulic Oil
Heat of Combustion (kJ/kg) 39.7 43.7 43.5 43.2 46.4 Asymptotic Burning Rate (g/m2-sec) 35 55 51 39 39 Effective Absorption Coefficient (1/m) 1.7 2.1 3.6 0.82 0.7 Chemical Combustion Efficiency 0.9 0.92 0.9 0.9 0.84 Convective Fraction 0.6 0.61 0.6 0.6 0.56 Radiative Fraction 0.3 0.31 0.3 0.3 0.28 Density (kg/m3) 940 740 760 750 760
Heat Release Rates were predicted using the general equation for pool fire heat release rates and the
equation relating maximum pool diameter to spill rate. A general equation for pool fire heat release rates is
[31]
)18(4
''2dxHmQ chemc π∆=
Where Q is the chemical heat release rate (kW) m’’ is the mass burning rate per unit surface area (g/m2-sec) ∆Hc is the net heat of combustion (kJ/g) xchem is the combustion efficiency D is the pool fire diameter (m) The Diameter can be related to the flammable liquid spill rate through the equation
)19(221
max
=
yV
D s
π
Where Dmax is the maximum pool diameter Vs is the volumetric spill rate (m3/sec) y is the liquid pool fire regression rate (m/s) Substituting the equation for the maximum pool diameter into the equation for the heat release rate results in the
equation for the maximum heat release rate for a give mass spill rate.
)20(chemCsL xHVpQ ∆=
where pL is the liquid density (kg/m3) For the solutions presented here, the pool diameter was selected and the flow rate needed to maintain that pool
diameter was then calculated. Figure 3.4.2-1 below shows the maximum heat release rate as a function of pool
diameter for the fuels being investigated.
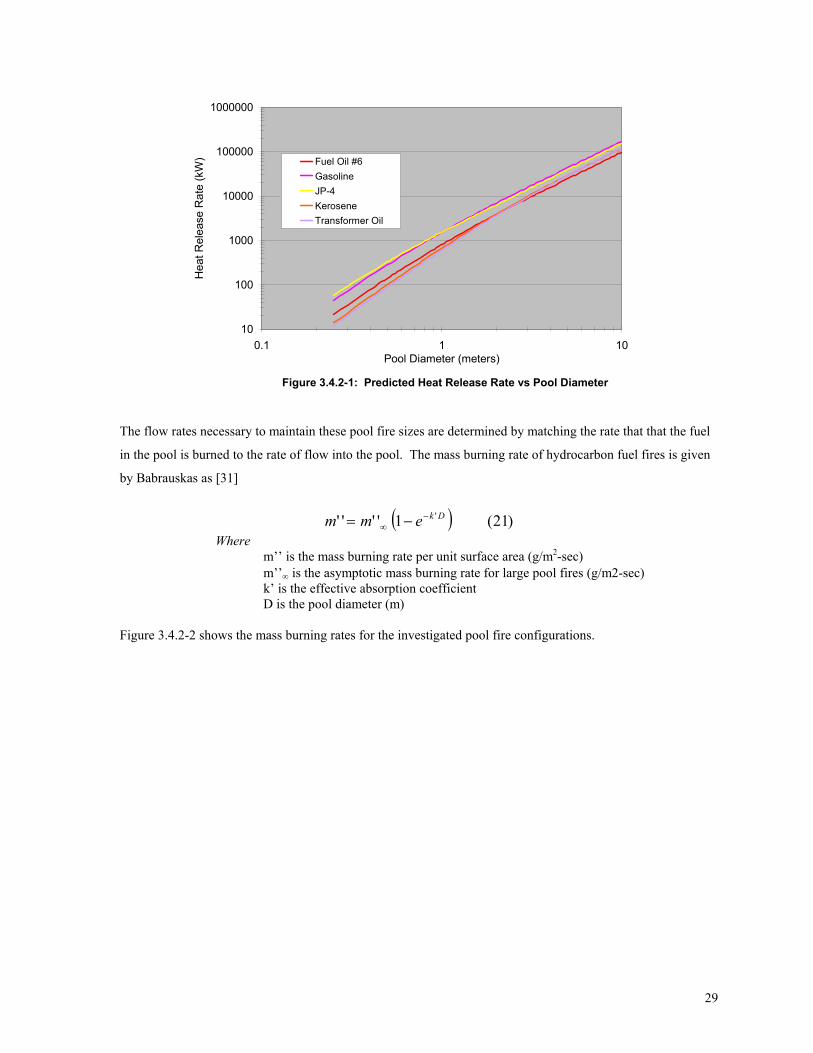
29
Figure 3.4.2-1: Predicted Heat Release Rate vs Pool Diameter
10
100
1000
10000
100000
1000000
0.1 1 10Pool Diameter (meters)
Hea
t Rel
ease
Rat
e (k
W) Fuel Oil #6
GasolineJP-4KeroseneTransformer Oil
The flow rates necessary to maintain these pool fire sizes are determined by matching the rate that that the fuel
in the pool is burned to the rate of flow into the pool. The mass burning rate of hydrocarbon fuel fires is given
by Babrauskas as [31]
( ) )21(1'''' ' Dkemm −
∞ −= Where m’’ is the mass burning rate per unit surface area (g/m2-sec) m’’∞ is the asymptotic mass burning rate for large pool fires (g/m2-sec) k’ is the effective absorption coefficient D is the pool diameter (m) Figure 3.4.2-2 shows the mass burning rates for the investigated pool fire configurations.
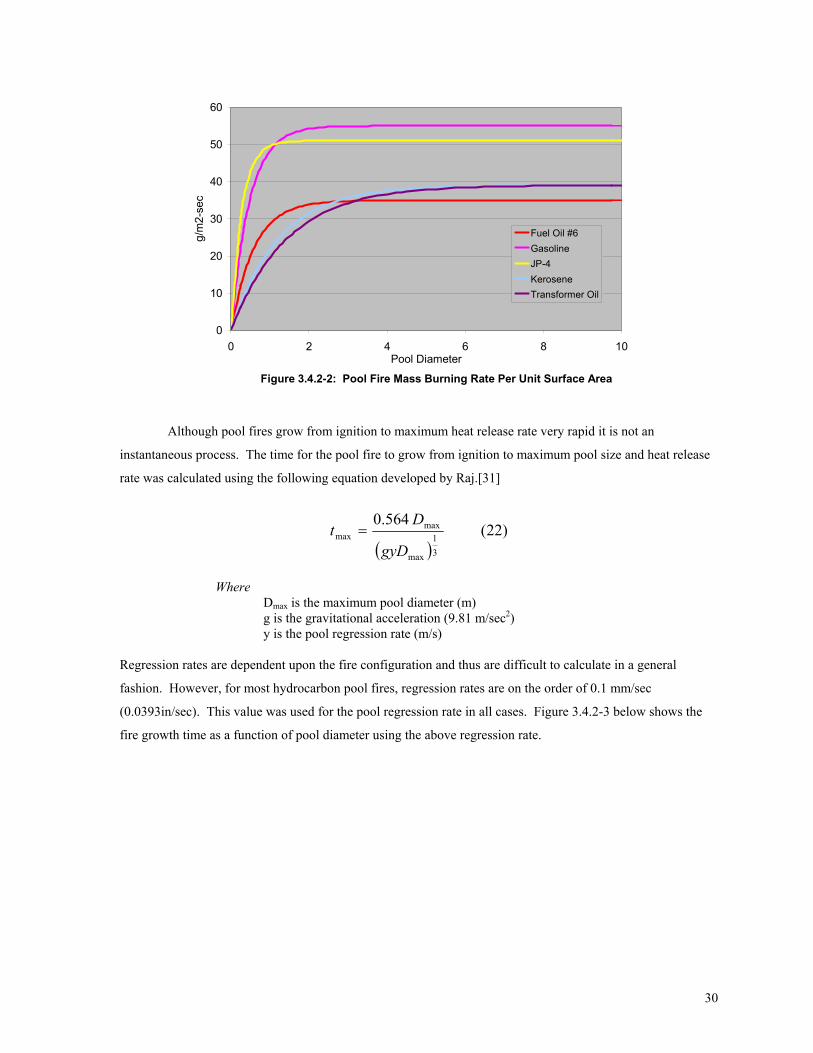
30
Figure 3.4.2-2: Pool Fire Mass Burning Rate Per Unit Surface Area
0
10
20
30
40
50
60
0 2 4 6 8 10Pool Diameter
g/m
2-se
c
Fuel Oil #6GasolineJP-4KeroseneTransformer Oil
Although pool fires grow from ignition to maximum heat release rate very rapid it is not an
instantaneous process. The time for the pool fire to grow from ignition to maximum pool size and heat release
rate was calculated using the following equation developed by Raj.[31]
( ))22(
564.0
31
max
maxmax
gyD
Dt =
Where Dmax is the maximum pool diameter (m) g is the gravitational acceleration (9.81 m/sec2) y is the pool regression rate (m/s) Regression rates are dependent upon the fire configuration and thus are difficult to calculate in a general
fashion. However, for most hydrocarbon pool fires, regression rates are on the order of 0.1 mm/sec
(0.0393in/sec). This value was used for the pool regression rate in all cases. Figure 3.4.2-3 below shows the
fire growth time as a function of pool diameter using the above regression rate.

31
Figure 3.4.2-3: Pool Fire Growth Time to Peak Heat Release Rate
0
5
10
15
20
25
30
0 2 4 6 8 10Pool Diameter (m)
Gro
wth
Tim
e (s
ec)
For small pool fires the growth time is not a significant factor, however larger pool fires would not reach
maximum heat release rate during the time it would take for evacuation of the fire area. Thus utilizing the
maximum heat release rate for these scenarios would be inappropriate and the growth of the fire would need to
be modeled.
Another factor that needs to be determined before pool fire radiation can be considered is the flame
heights. Flame heights were calculated utilizing the Heskestadt correlation [31].
)23(02.123.0 52
DQH f −=
Where Hf is the flame height (m) Q is the heat release rate (kW) D is the fire diameter (m) Figure 3.4.2-4 shows flame heights as a function of fire diameter for the investigated fuels.
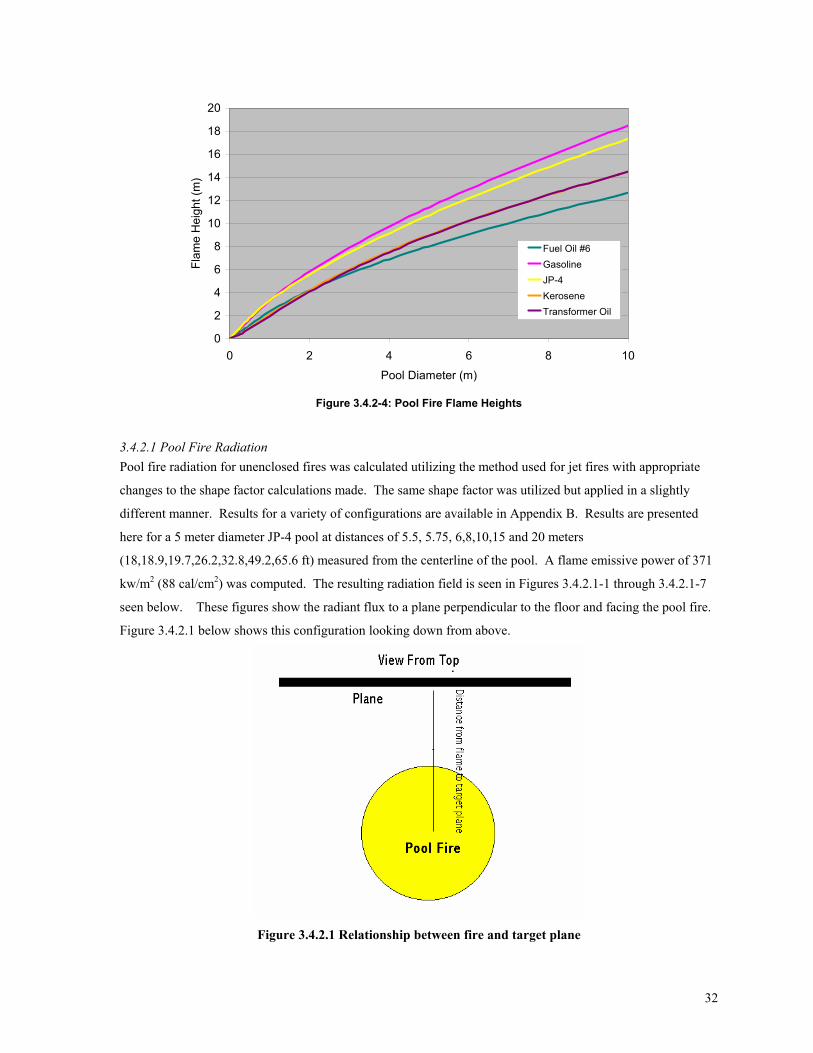
32
Figure 3.4.2-4: Pool Fire Flame Heights
0
2
4
6
8
10
12
14
16
18
20
0 2 4 6 8 10Pool Diameter (m)
Flam
e H
eigh
t (m
)
Fuel Oil #6GasolineJP-4KeroseneTransformer Oil
3.4.2.1 Pool Fire Radiation Pool fire radiation for unenclosed fires was calculated utilizing the method used for jet fires with appropriate
changes to the shape factor calculations made. The same shape factor was utilized but applied in a slightly
different manner. Results for a variety of configurations are available in Appendix B. Results are presented
here for a 5 meter diameter JP-4 pool at distances of 5.5, 5.75, 6,8,10,15 and 20 meters
(18,18.9,19.7,26.2,32.8,49.2,65.6 ft) measured from the centerline of the pool. A flame emissive power of 371
kw/m2 (88 cal/cm2) was computed. The resulting radiation field is seen in Figures 3.4.2.1-1 through 3.4.2.1-7
seen below. These figures show the radiant flux to a plane perpendicular to the floor and facing the pool fire.
Figure 3.4.2.1 below shows this configuration looking down from above.
Figure 3.4.2.1 Relationship between fire and target plane
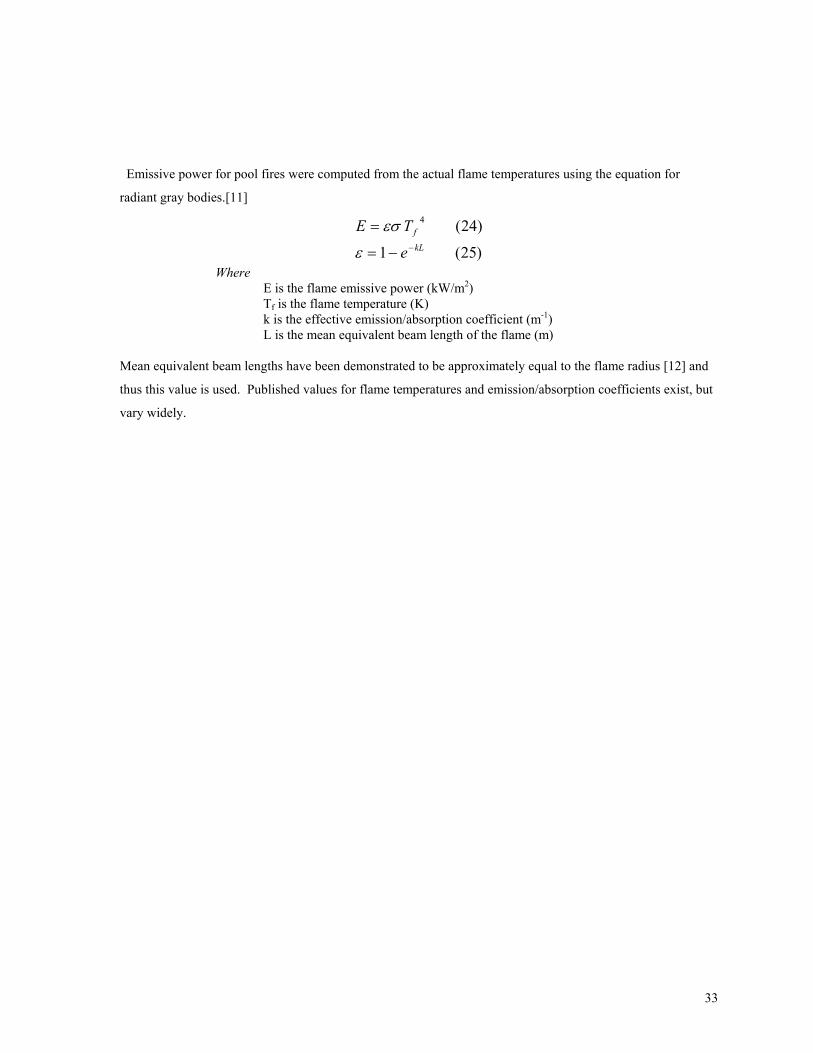
33
Emissive power for pool fires were computed from the actual flame temperatures using the equation for
radiant gray bodies.[11]
)24(4fTE εσ=
)25(1 kLe−−=ε Where E is the flame emissive power (kW/m2) Tf is the flame temperature (K) k is the effective emission/absorption coefficient (m-1) L is the mean equivalent beam length of the flame (m) Mean equivalent beam lengths have been demonstrated to be approximately equal to the flame radius [12] and
thus this value is used. Published values for flame temperatures and emission/absorption coefficients exist, but
vary widely.
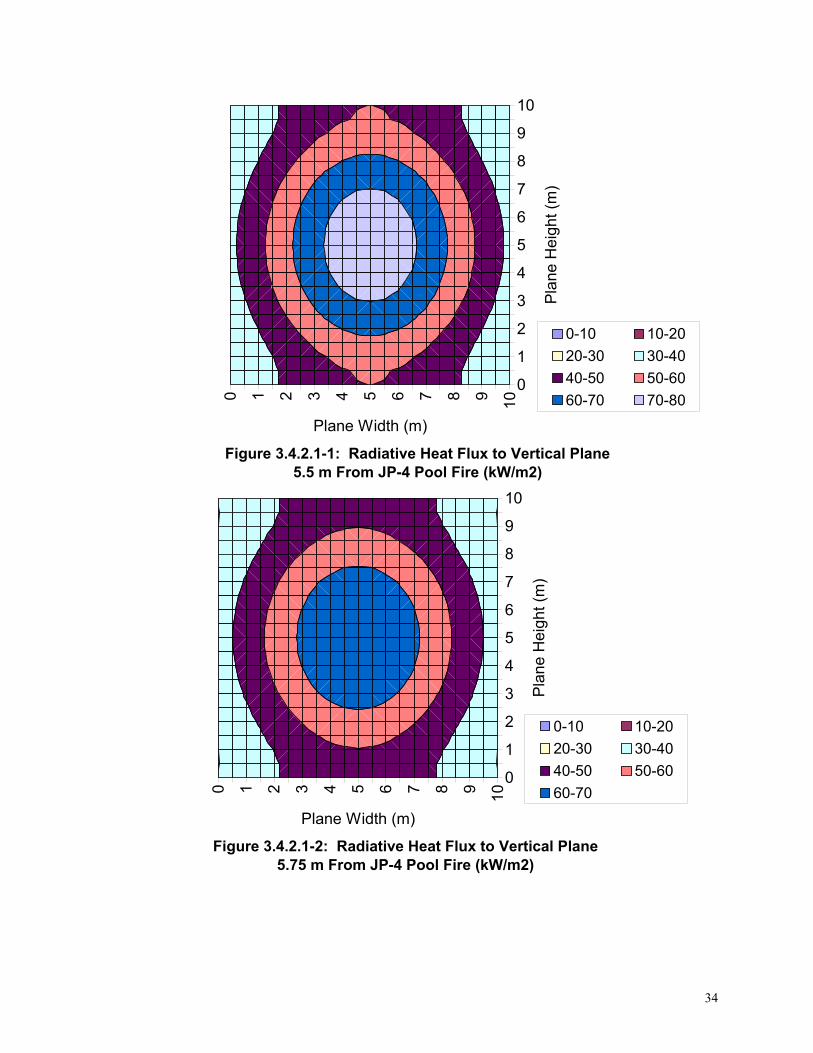
34
0 1 2 3 4 5 6 7 8 9 10
0
1
2
3
4
5
6
7
8
9
10
Plane Width (m)
Plan
e H
eigh
t (m
)
Figure 3.4.2.1-1: Radiative Heat Flux to Vertical Plane5.5 m From JP-4 Pool Fire (kW/m2)
0-10 10-2020-30 30-4040-50 50-6060-70 70-80
0 1 2 3 4 5 6 7 8 9 10
0
1
2
3
4
5
6
7
8
9
10
Plane Width (m)
Plan
e H
eigh
t (m
)
Figure 3.4.2.1-2: Radiative Heat Flux to Vertical Plane5.75 m From JP-4 Pool Fire (kW/m2)
0-10 10-2020-30 30-4040-50 50-6060-70
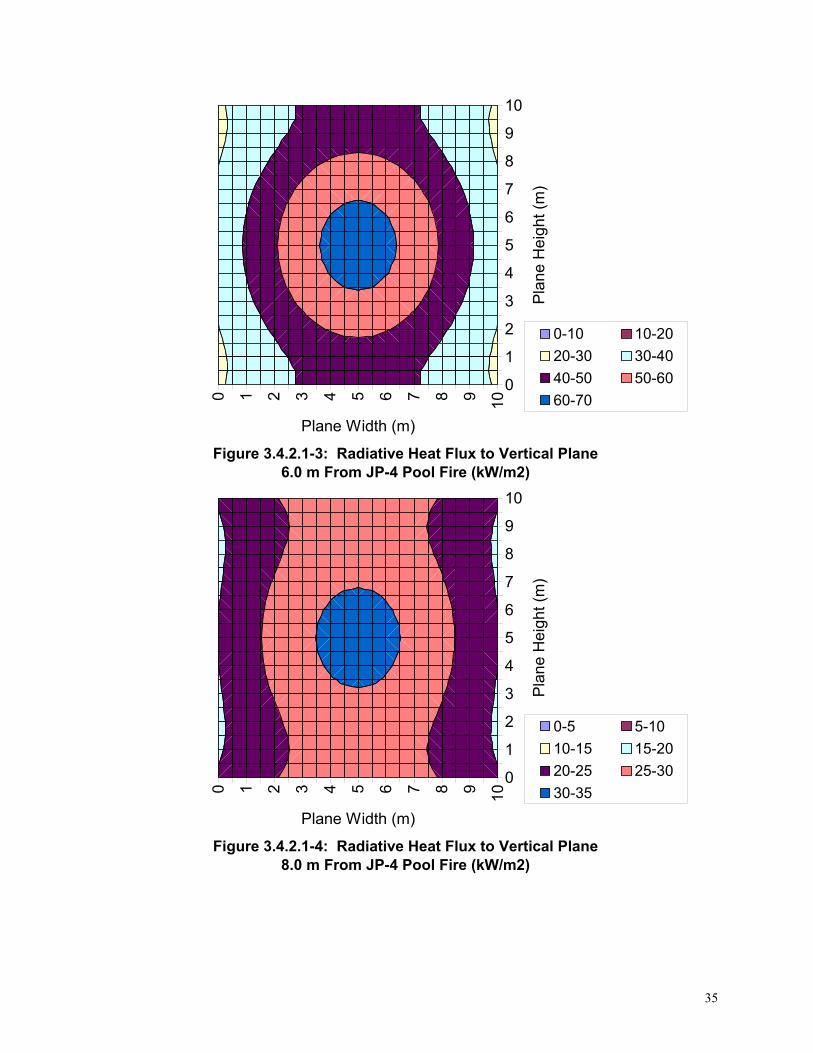
35
0 1 2 3 4 5 6 7 8 9 10
0
1
2
3
4
5
6
7
8
9
10
Plane Width (m)
Plan
e H
eigh
t (m
)
Figure 3.4.2.1-3: Radiative Heat Flux to Vertical Plane6.0 m From JP-4 Pool Fire (kW/m2)
0-10 10-2020-30 30-4040-50 50-6060-70
0 1 2 3 4 5 6 7 8 9 10
0
1
2
3
4
5
6
7
8
9
10
Plane Width (m)
Plan
e H
eigh
t (m
)
Figure 3.4.2.1-4: Radiative Heat Flux to Vertical Plane8.0 m From JP-4 Pool Fire (kW/m2)
0-5 5-1010-15 15-2020-25 25-3030-35

36
0 1 2 3 4 5 6 7 8 9 10
0
1
2
3
4
5
6
7
8
9
10
Plane Width (m)
Plan
e H
eigh
t (m
)
Figure 3.4.2.1-5: Radiative Heat Flux to Vertical Plane10.0 m From JP-4 Pool Fire (kW/m2)
0-2 2-44-6 6-88-10 10-1212-14 14-1616-18 18-20
0 1 2 3 4 5 6 7 8 9 10
0
1
2
3
4
5
6
7
8
9
10
Plane Width (m)
Plan
e H
eigh
t (m
)
Figure 3.4.2.1-6: Radiative Heat Flux to Vertical Plane15.0 m From JP-4 Pool Fire (kW/m2)
0-1 1-2 2-3 3-4
4-5 5-6 6-7 7-8
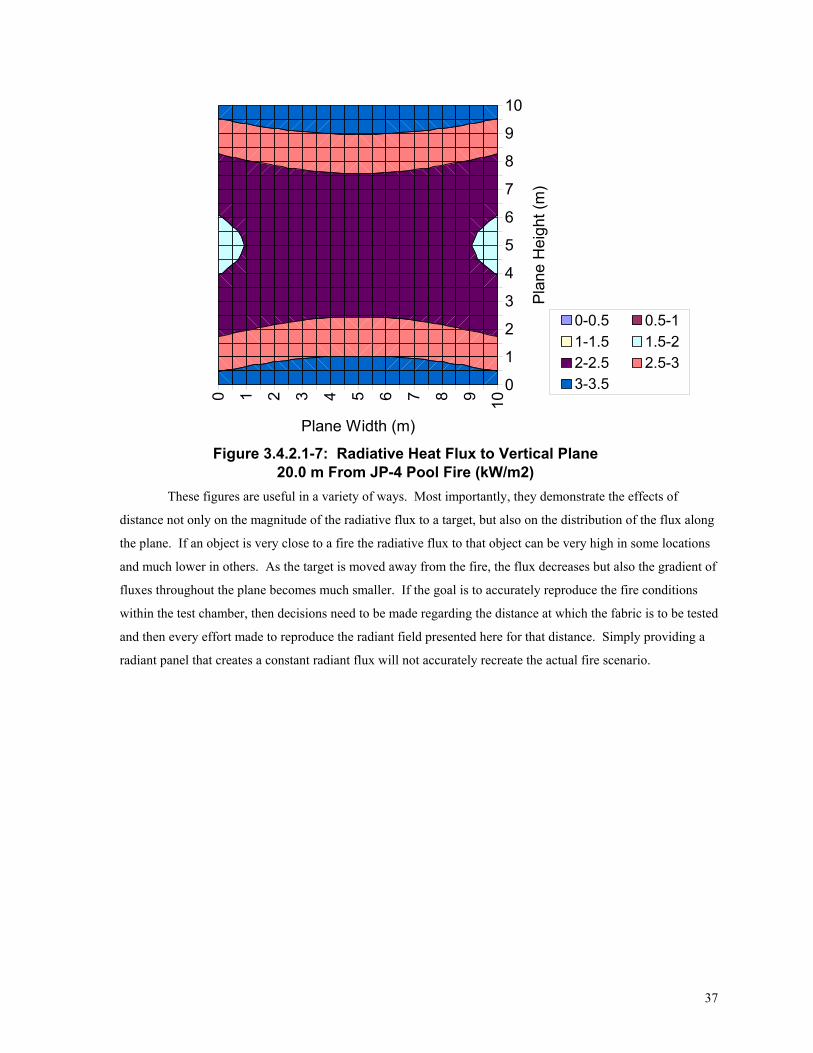
37
0 1 2 3 4 5 6 7 8 9 10
0
1
2
3
4
5
6
7
8
9
10
Plane Width (m)
Plan
e H
eigh
t (m
)
Figure 3.4.2.1-7: Radiative Heat Flux to Vertical Plane20.0 m From JP-4 Pool Fire (kW/m2)
0-0.5 0.5-11-1.5 1.5-22-2.5 2.5-33-3.5
These figures are useful in a variety of ways. Most importantly, they demonstrate the effects of
distance not only on the magnitude of the radiative flux to a target, but also on the distribution of the flux along
the plane. If an object is very close to a fire the radiative flux to that object can be very high in some locations
and much lower in others. As the target is moved away from the fire, the flux decreases but also the gradient of
fluxes throughout the plane becomes much smaller. If the goal is to accurately reproduce the fire conditions
within the test chamber, then decisions need to be made regarding the distance at which the fabric is to be tested
and then every effort made to reproduce the radiant field presented here for that distance. Simply providing a
radiant panel that creates a constant radiant flux will not accurately recreate the actual fire scenario.
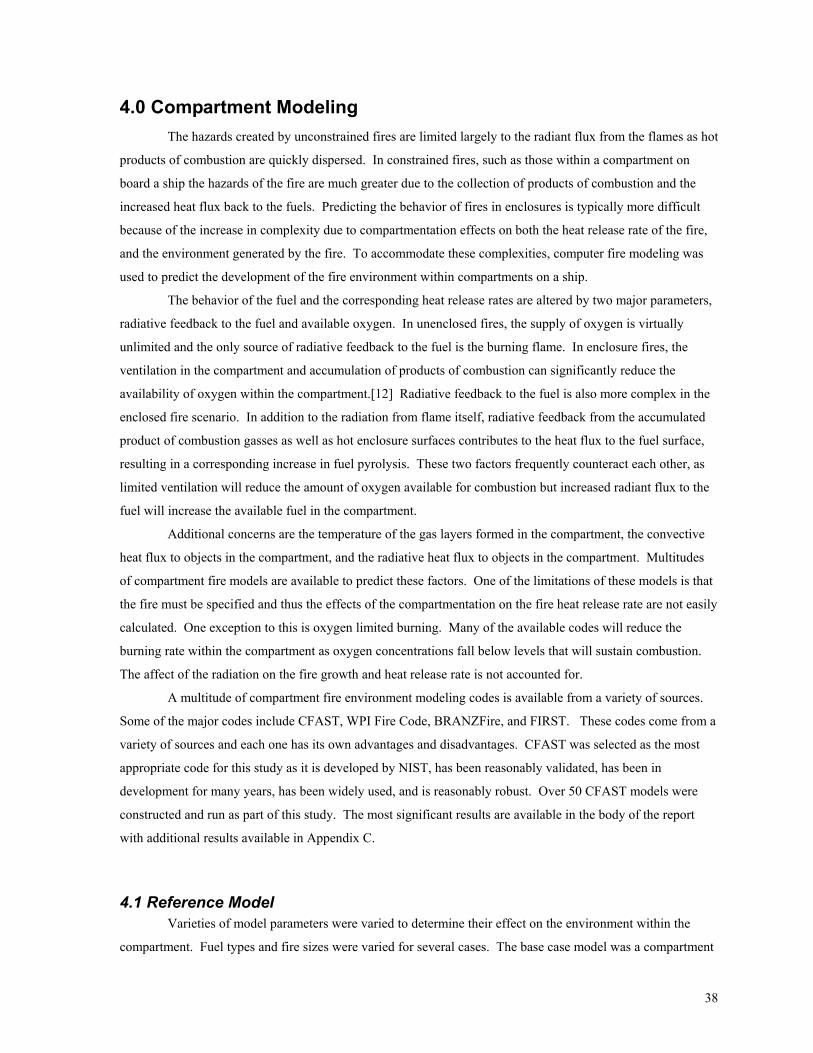
38
4.0 Compartment Modeling
The hazards created by unconstrained fires are limited largely to the radiant flux from the flames as hot
products of combustion are quickly dispersed. In constrained fires, such as those within a compartment on
board a ship the hazards of the fire are much greater due to the collection of products of combustion and the
increased heat flux back to the fuels. Predicting the behavior of fires in enclosures is typically more difficult
because of the increase in complexity due to compartmentation effects on both the heat release rate of the fire,
and the environment generated by the fire. To accommodate these complexities, computer fire modeling was
used to predict the development of the fire environment within compartments on a ship.
The behavior of the fuel and the corresponding heat release rates are altered by two major parameters,
radiative feedback to the fuel and available oxygen. In unenclosed fires, the supply of oxygen is virtually
unlimited and the only source of radiative feedback to the fuel is the burning flame. In enclosure fires, the
ventilation in the compartment and accumulation of products of combustion can significantly reduce the
availability of oxygen within the compartment.[12] Radiative feedback to the fuel is also more complex in the
enclosed fire scenario. In addition to the radiation from flame itself, radiative feedback from the accumulated
product of combustion gasses as well as hot enclosure surfaces contributes to the heat flux to the fuel surface,
resulting in a corresponding increase in fuel pyrolysis. These two factors frequently counteract each other, as
limited ventilation will reduce the amount of oxygen available for combustion but increased radiant flux to the
fuel will increase the available fuel in the compartment.
Additional concerns are the temperature of the gas layers formed in the compartment, the convective
heat flux to objects in the compartment, and the radiative heat flux to objects in the compartment. Multitudes
of compartment fire models are available to predict these factors. One of the limitations of these models is that
the fire must be specified and thus the effects of the compartmentation on the fire heat release rate are not easily
calculated. One exception to this is oxygen limited burning. Many of the available codes will reduce the
burning rate within the compartment as oxygen concentrations fall below levels that will sustain combustion.
The affect of the radiation on the fire growth and heat release rate is not accounted for.
A multitude of compartment fire environment modeling codes is available from a variety of sources.
Some of the major codes include CFAST, WPI Fire Code, BRANZFire, and FIRST. These codes come from a
variety of sources and each one has its own advantages and disadvantages. CFAST was selected as the most
appropriate code for this study as it is developed by NIST, has been reasonably validated, has been in
development for many years, has been widely used, and is reasonably robust. Over 50 CFAST models were
constructed and run as part of this study. The most significant results are available in the body of the report
with additional results available in Appendix C.
4.1 Reference Model Varieties of model parameters were varied to determine their effect on the environment within the
compartment. Fuel types and fire sizes were varied for several cases. The base case model was a compartment

39
10 meters by 10 meters (32.8 x 32.8 ft) in plan with a ceiling height of 3 meters (9.84 ft). All walls of the
compartment were composed of 1/8-inch thick plain carbon steel. The properties of this material may be seen
in Table 4.1-1.
Table 4.1-1: Steel Wall Material Properties
Steel Wall Properties Conductivity (W/m-K) 48Specific Heat (J/kg-K) 559Density (kg/m3) 7854Thickness (m) 0.003
One door opening 0.91 meters (2.98 ft) wide by 2 meters (6.56 ft) high and one square roof vent of dimension
0.5 m by 0.5 m (1.64 x 1.64 ft) were specified. The fire consisted of a 2 meter (6.56 ft) diameter pool fire of
Kerosene specified as a pyrolysis rate of 0.051 kg/sec (0.112 lbm/sec) and located at floor level in the
geometric center of the room. The heat of combustion of the kerosene was taken as 1.228x10⁸ J/kg, The initial
fuel temperature was ambient and the gaseous ignition temperature was specified as 493 K, which is consistent
with moderately low flashpoint hydrocarbons. The radiative fraction was specified as 30% of the total heat
release rate.
The objectives of this project require that the heat flux to objects located throughout the compartment
be known. Four targets composed of the same materials as the compartment walls were set up at varying
distances from the fire. These targets were needed to represent virtual people in the modeled environment. The
heat flux to these steel targets is used to calculate the exposure heat flux to people wearing protective clothing.
Each target was facing the fire and located at a height of 1 meter. This is illustrated in Figure 4.1-1 below. The
targets were located at distances of 1.41, 2.82, 3.65, and 4.24 meters (4.62,9.25,11.97,13.9 ft) from the fire
centerline.
Ambient conditions were specified as 20 degrees C and a relative humidity of 50%. Each simulation
was run for a total of 2009 seconds, although for nearly all cases a steady state scenario was observed within
the first 1000 seconds of the simulation. The base case results are exhibited in the following figures.
Figure 4.1-1 shows the convective and radiative heat release rate of the pool fire within the
compartment. Note that the peak heat release rate is not equivalent to the steady state heat release rate. The
peak heat release rate occurs before all of the initially available oxygen in the compartment has been utilized.
After all of the initial oxygen has been consumed, the only source of additional oxygen is from the vent inflow.
This becomes the limiting factor in the determination of the sustained heat release rate. Notice that the radiative
portion of the heat release rate is 33% larger than the convective component. This particular percentage will be
largely dependent upon the fuel being burned. Heavy hydrocarbons that produce sooty flames will have a
much greater radiative portion than alcohol type fuels that have very small radiative components.
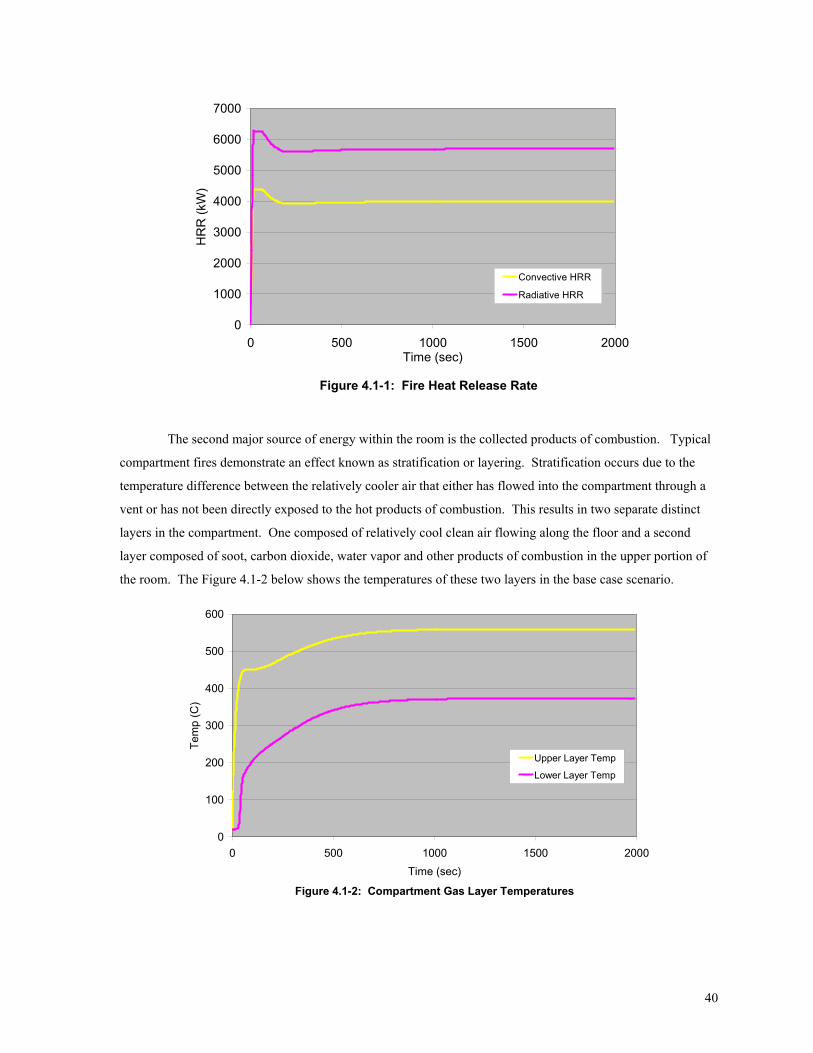
40
Figure 4.1-1: Fire Heat Release Rate
0
1000
2000
3000
4000
5000
6000
7000
0 500 1000 1500 2000Time (sec)
HR
R (k
W)
Convective HRR
Radiative HRR
The second major source of energy within the room is the collected products of combustion. Typical
compartment fires demonstrate an effect known as stratification or layering. Stratification occurs due to the
temperature difference between the relatively cooler air that either has flowed into the compartment through a
vent or has not been directly exposed to the hot products of combustion. This results in two separate distinct
layers in the compartment. One composed of relatively cool clean air flowing along the floor and a second
layer composed of soot, carbon dioxide, water vapor and other products of combustion in the upper portion of
the room. The Figure 4.1-2 below shows the temperatures of these two layers in the base case scenario.
Figure 4.1-2: Compartment Gas Layer Temperatures
0
100
200
300
400
500
600
0 500 1000 1500 2000Time (sec)
Tem
p (C
)
Upper Layer Temp
Lower Layer Temp
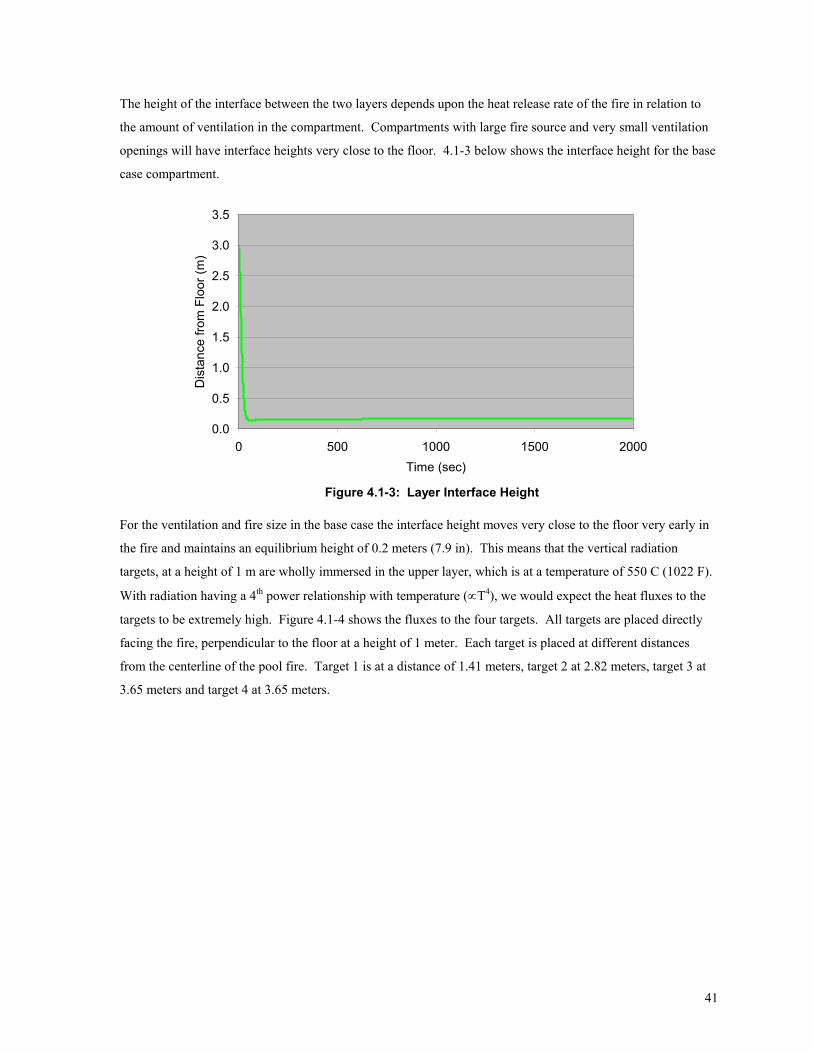
41
The height of the interface between the two layers depends upon the heat release rate of the fire in relation to
the amount of ventilation in the compartment. Compartments with large fire source and very small ventilation
openings will have interface heights very close to the floor. 4.1-3 below shows the interface height for the base
case compartment.
Figure 4.1-3: Layer Interface Height
0.0
0.5
1.0
1.5
2.0
2.5
3.0
3.5
0 500 1000 1500 2000Time (sec)
Dis
tanc
e fro
m F
loor
(m)
For the ventilation and fire size in the base case the interface height moves very close to the floor very early in
the fire and maintains an equilibrium height of 0.2 meters (7.9 in). This means that the vertical radiation
targets, at a height of 1 m are wholly immersed in the upper layer, which is at a temperature of 550 C (1022 F).
With radiation having a 4th power relationship with temperature (∝T4), we would expect the heat fluxes to the
targets to be extremely high. Figure 4.1-4 shows the fluxes to the four targets. All targets are placed directly
facing the fire, perpendicular to the floor at a height of 1 meter. Each target is placed at different distances
from the centerline of the pool fire. Target 1 is at a distance of 1.41 meters, target 2 at 2.82 meters, target 3 at
3.65 meters and target 4 at 3.65 meters.
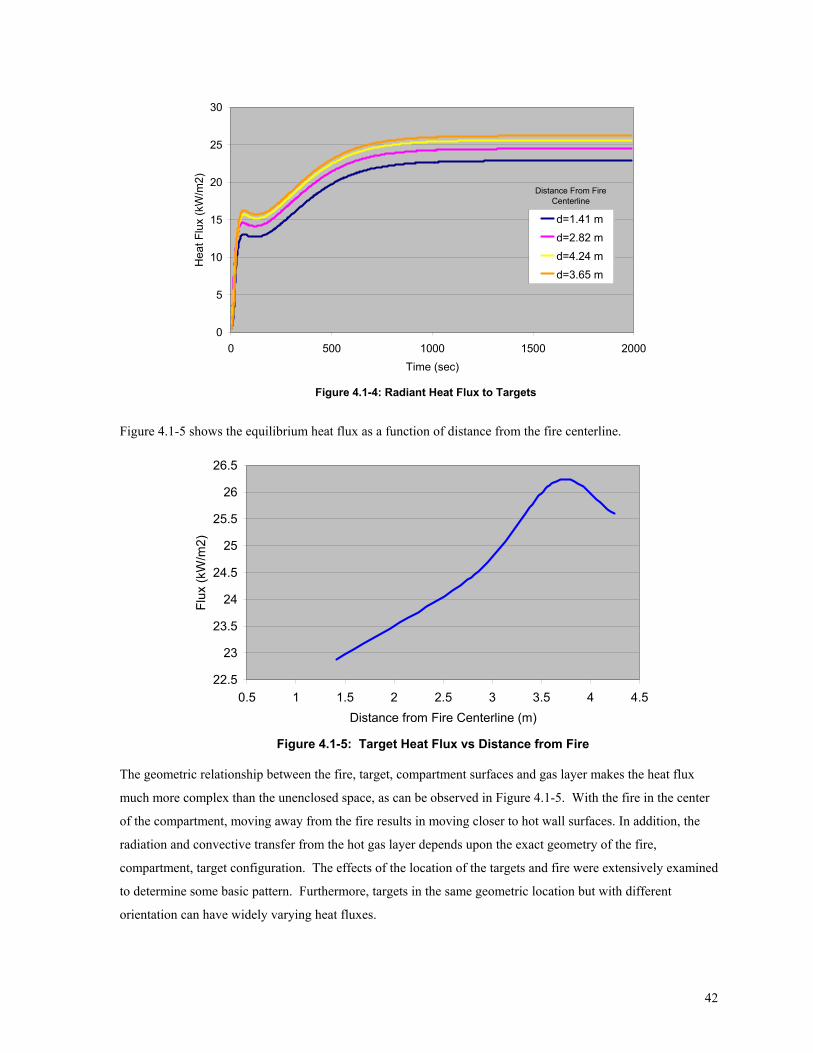
42
Figure 4.1-4: Radiant Heat Flux to Targets
0
5
10
15
20
25
30
0 500 1000 1500 2000Time (sec)
Hea
t Flu
x (k
W/m
2)
d=1.41 md=2.82 md=4.24 md=3.65 m
Distance From Fire Centerline
Figure 4.1-5 shows the equilibrium heat flux as a function of distance from the fire centerline.
Figure 4.1-5: Target Heat Flux vs Distance from Fire
22.5
23
23.5
24
24.5
25
25.5
26
26.5
0.5 1 1.5 2 2.5 3 3.5 4 4.5Distance from Fire Centerline (m)
Flux
(kW
/m2)
The geometric relationship between the fire, target, compartment surfaces and gas layer makes the heat flux
much more complex than the unenclosed space, as can be observed in Figure 4.1-5. With the fire in the center
of the compartment, moving away from the fire results in moving closer to hot wall surfaces. In addition, the
radiation and convective transfer from the hot gas layer depends upon the exact geometry of the fire,
compartment, target configuration. The effects of the location of the targets and fire were extensively examined
to determine some basic pattern. Furthermore, targets in the same geometric location but with different
orientation can have widely varying heat fluxes.
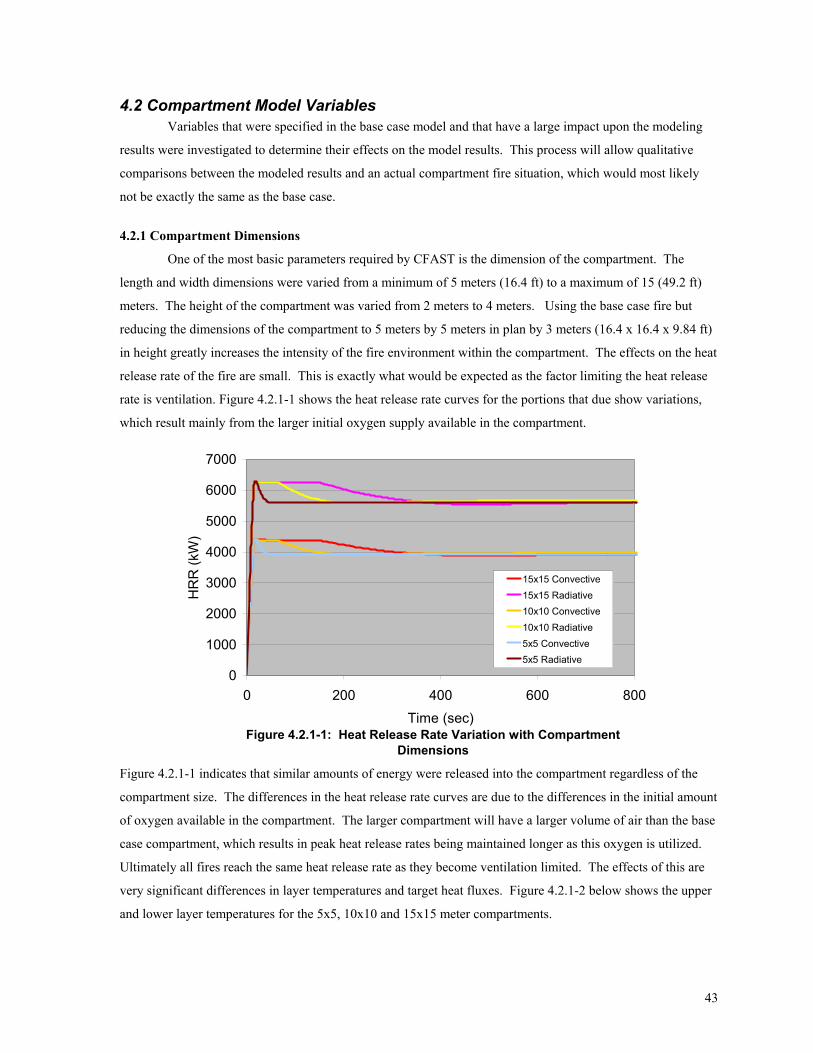
43
4.2 Compartment Model Variables Variables that were specified in the base case model and that have a large impact upon the modeling
results were investigated to determine their effects on the model results. This process will allow qualitative
comparisons between the modeled results and an actual compartment fire situation, which would most likely
not be exactly the same as the base case.
4.2.1 Compartment Dimensions
One of the most basic parameters required by CFAST is the dimension of the compartment. The
length and width dimensions were varied from a minimum of 5 meters (16.4 ft) to a maximum of 15 (49.2 ft)
meters. The height of the compartment was varied from 2 meters to 4 meters. Using the base case fire but
reducing the dimensions of the compartment to 5 meters by 5 meters in plan by 3 meters (16.4 x 16.4 x 9.84 ft)
in height greatly increases the intensity of the fire environment within the compartment. The effects on the heat
release rate of the fire are small. This is exactly what would be expected as the factor limiting the heat release
rate is ventilation. Figure 4.2.1-1 shows the heat release rate curves for the portions that due show variations,
which result mainly from the larger initial oxygen supply available in the compartment.
Figure 4.2.1-1: Heat Release Rate Variation with Compartment Dimensions
0
1000
2000
3000
4000
5000
6000
7000
0 200 400 600 800Time (sec)
HR
R (k
W)
15x15 Convective15x15 Radiative10x10 Convective10x10 Radiative5x5 Convective5x5 Radiative
Figure 4.2.1-1 indicates that similar amounts of energy were released into the compartment regardless of the
compartment size. The differences in the heat release rate curves are due to the differences in the initial amount
of oxygen available in the compartment. The larger compartment will have a larger volume of air than the base
case compartment, which results in peak heat release rates being maintained longer as this oxygen is utilized.
Ultimately all fires reach the same heat release rate as they become ventilation limited. The effects of this are
very significant differences in layer temperatures and target heat fluxes. Figure 4.2.1-2 below shows the upper
and lower layer temperatures for the 5x5, 10x10 and 15x15 meter compartments.
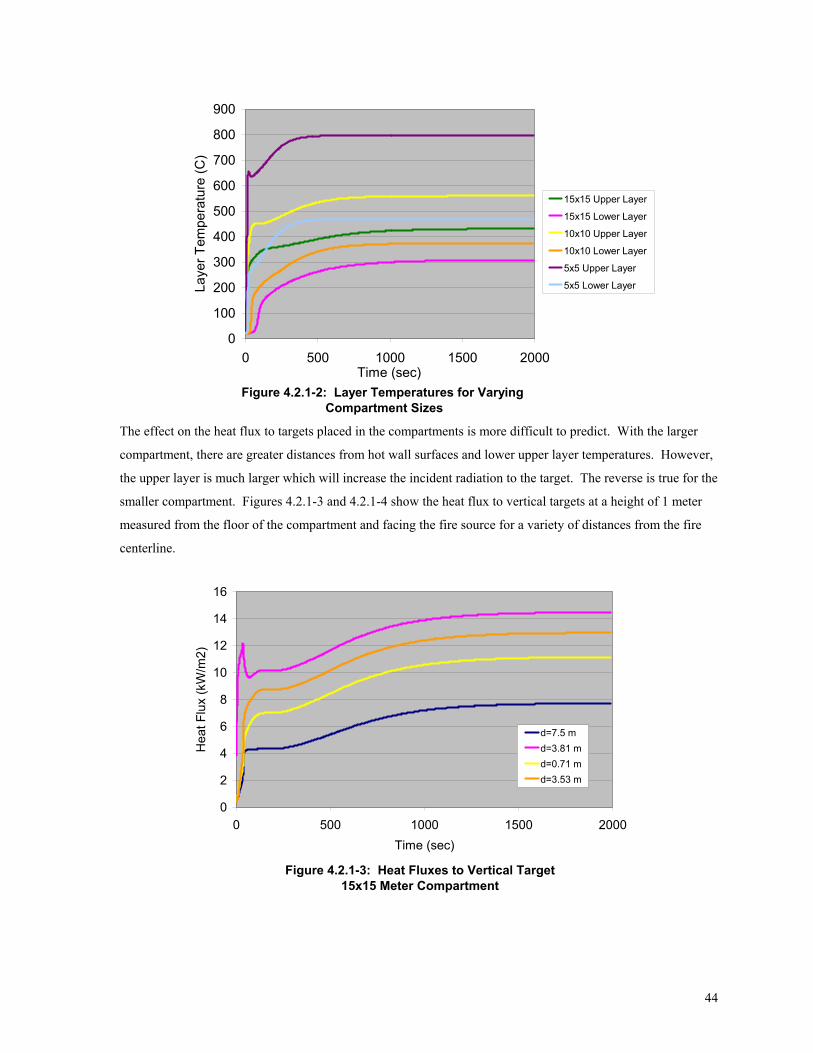
44
Figure 4.2.1-2: Layer Temperatures for Varying Compartment Sizes
0
100
200
300
400
500
600
700
800
900
0 500 1000 1500 2000Time (sec)
Laye
r Tem
pera
ture
(C)
15x15 Upper Layer
15x15 Lower Layer
10x10 Upper Layer
10x10 Lower Layer
5x5 Upper Layer
5x5 Lower Layer
The effect on the heat flux to targets placed in the compartments is more difficult to predict. With the larger
compartment, there are greater distances from hot wall surfaces and lower upper layer temperatures. However,
the upper layer is much larger which will increase the incident radiation to the target. The reverse is true for the
smaller compartment. Figures 4.2.1-3 and 4.2.1-4 show the heat flux to vertical targets at a height of 1 meter
measured from the floor of the compartment and facing the fire source for a variety of distances from the fire
centerline.
Figure 4.2.1-3: Heat Fluxes to Vertical Target 15x15 Meter Compartment
0
2
4
6
8
10
12
14
16
0 500 1000 1500 2000Time (sec)
Hea
t Flu
x (k
W/m
2)
d=7.5 md=3.81 md=0.71 md=3.53 m

45
Figure 4.2.1-4: Heat Flux to Vertical Target 5x5 Meter Compartment
0
10
20
30
40
50
60
70
0 500 1000 1500 2000Time (sec)
Hea
t Flu
x (k
W/m
2)
d=1.50 md=0.71 md=1.41 md=2.83 m
4.2.2 Effects of Fire Size
Another significant variable is the size of the fire. Reducing the fire size will result in lower heat
release rates, lower layer temperatures and smaller incident heat fluxes. The magnitude of these changes was
investigated by utilizing the base case scenario with fire diameters of 0.5,1, 1.5,2 and 2.5 meters
(1.64,3.28,4.92,6.56,8.2 ft). Figure 4.2.2-1 below shows the convective heat release rate of the fire and Figure
4.2.2-2 shows the radiative heat release rate from the different fire sizes.
Figure 4.2.2-1: Convective Heat Release Rate for Varying Fire Size
0
1000
2000
3000
4000
5000
6000
7000
8000
0 500 1000 1500 2000Time (sec)
HR
R (k
W)
d=0.5d=1.0d=1.5d=2.0d=2.5
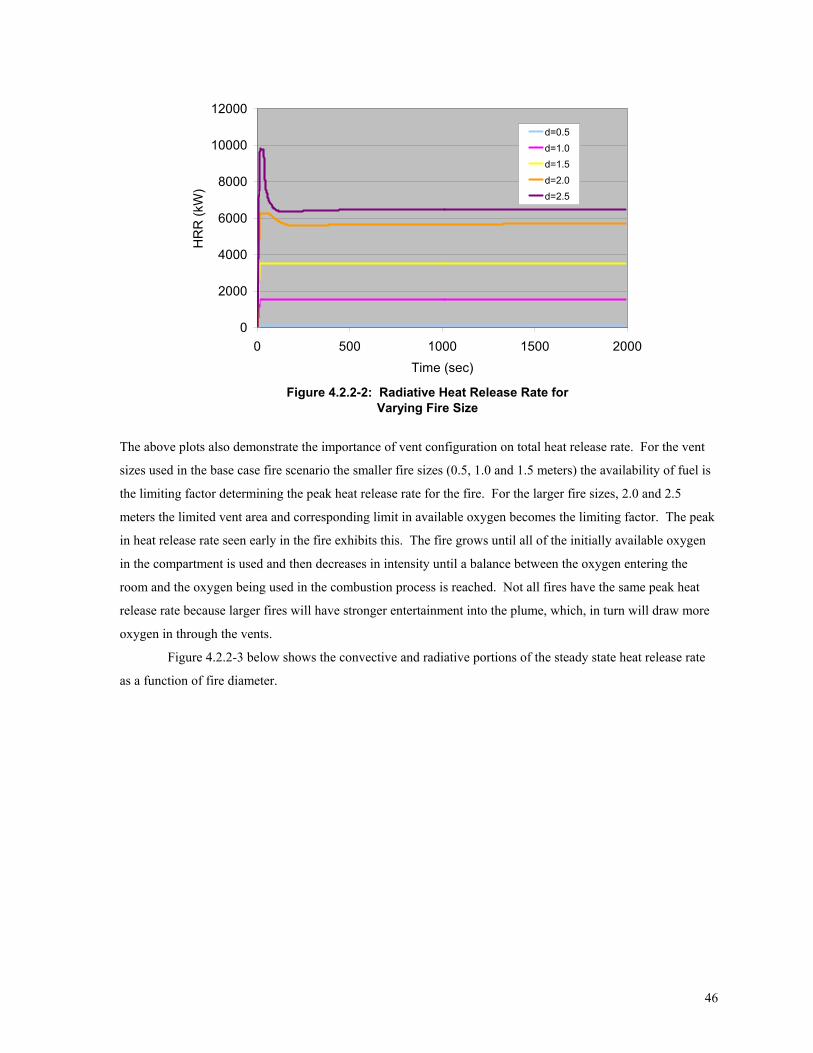
46
Figure 4.2.2-2: Radiative Heat Release Rate forVarying Fire Size
0
2000
4000
6000
8000
10000
12000
0 500 1000 1500 2000Time (sec)
HR
R (k
W)
d=0.5d=1.0d=1.5d=2.0d=2.5
The above plots also demonstrate the importance of vent configuration on total heat release rate. For the vent
sizes used in the base case fire scenario the smaller fire sizes (0.5, 1.0 and 1.5 meters) the availability of fuel is
the limiting factor determining the peak heat release rate for the fire. For the larger fire sizes, 2.0 and 2.5
meters the limited vent area and corresponding limit in available oxygen becomes the limiting factor. The peak
in heat release rate seen early in the fire exhibits this. The fire grows until all of the initially available oxygen
in the compartment is used and then decreases in intensity until a balance between the oxygen entering the
room and the oxygen being used in the combustion process is reached. Not all fires have the same peak heat
release rate because larger fires will have stronger entertainment into the plume, which, in turn will draw more
oxygen in through the vents.
Figure 4.2.2-3 below shows the convective and radiative portions of the steady state heat release rate
as a function of fire diameter.
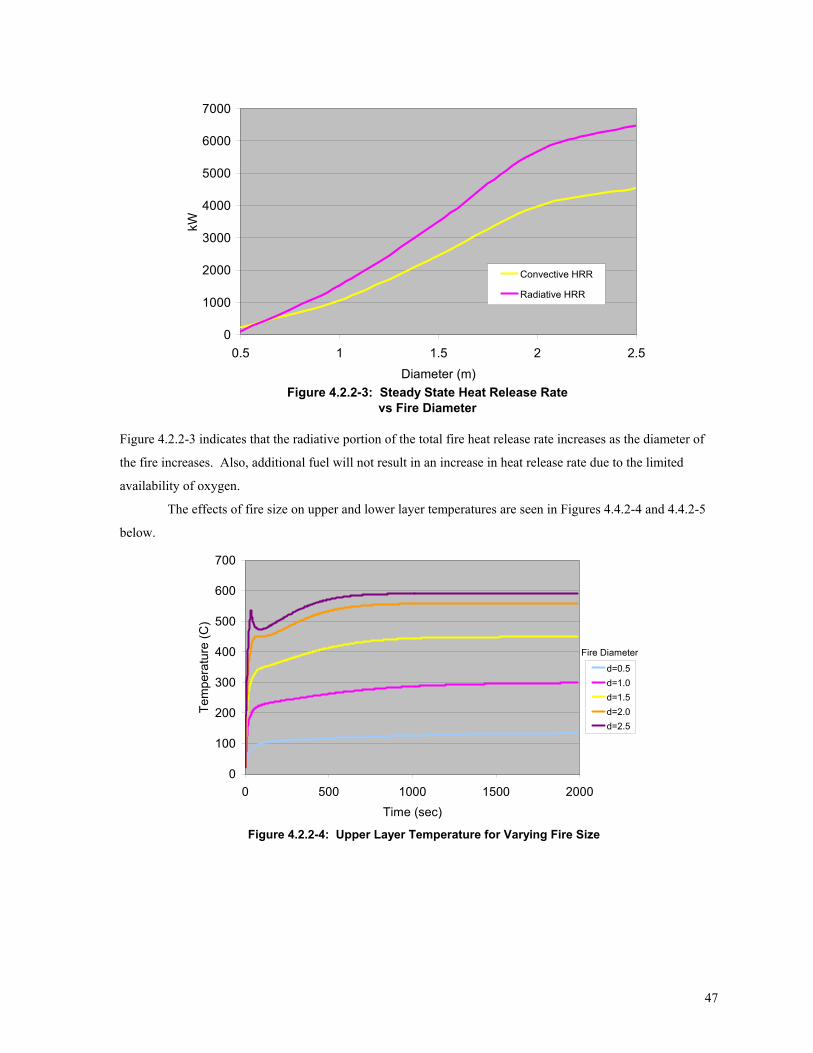
47
Figure 4.2.2-3: Steady State Heat Release Rate vs Fire Diameter
0
1000
2000
3000
4000
5000
6000
7000
0.5 1 1.5 2 2.5Diameter (m)
kW
Convective HRR
Radiative HRR
Figure 4.2.2-3 indicates that the radiative portion of the total fire heat release rate increases as the diameter of
the fire increases. Also, additional fuel will not result in an increase in heat release rate due to the limited
availability of oxygen.
The effects of fire size on upper and lower layer temperatures are seen in Figures 4.4.2-4 and 4.4.2-5
below.
Figure 4.2.2-4: Upper Layer Temperature for Varying Fire Size
0
100
200
300
400
500
600
700
0 500 1000 1500 2000Time (sec)
Tem
pera
ture
(C)
d=0.5d=1.0d=1.5d=2.0d=2.5
Fire Diameter
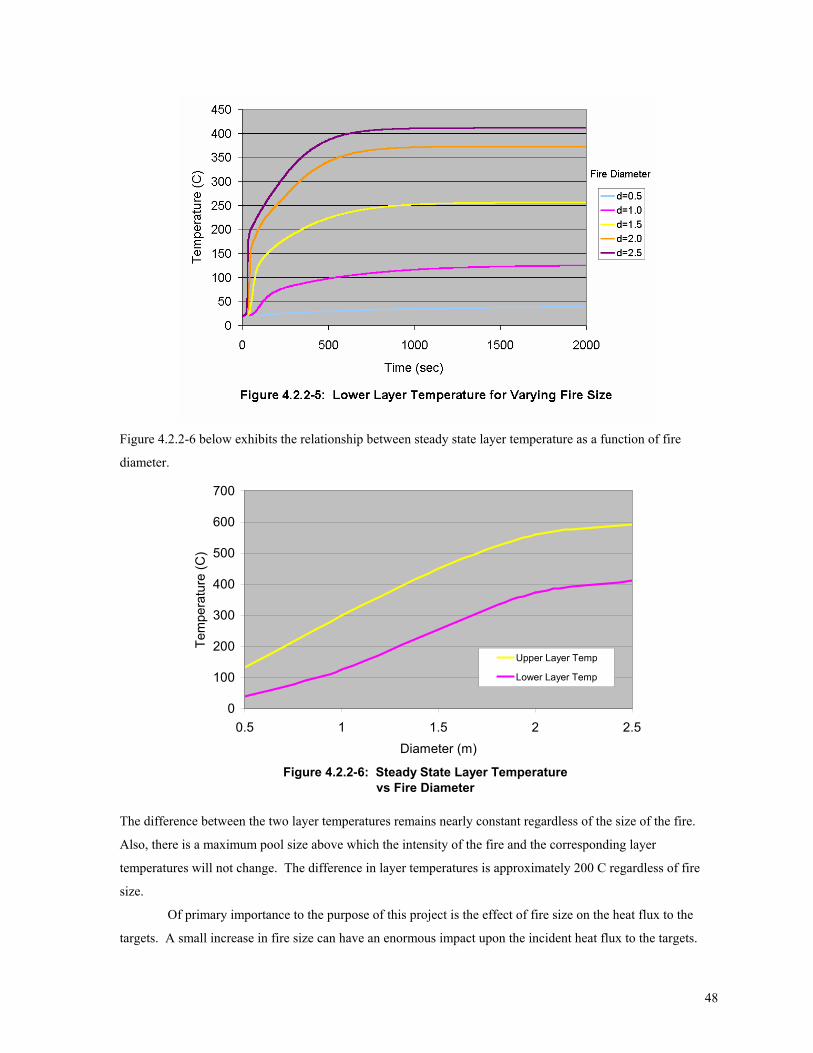
48
Figure 4.2.2-6 below exhibits the relationship between steady state layer temperature as a function of fire
diameter.
Figure 4.2.2-6: Steady State Layer Temperature vs Fire Diameter
0
100
200
300
400
500
600
700
0.5 1 1.5 2 2.5Diameter (m)
Tem
pera
ture
(C)
Upper Layer Temp
Lower Layer Temp
The difference between the two layer temperatures remains nearly constant regardless of the size of the fire.
Also, there is a maximum pool size above which the intensity of the fire and the corresponding layer
temperatures will not change. The difference in layer temperatures is approximately 200 C regardless of fire
size.
Of primary importance to the purpose of this project is the effect of fire size on the heat flux to the
targets. A small increase in fire size can have an enormous impact upon the incident heat flux to the targets.

49
Because the fire is the driving force behind the compartment environment, a change in the fire results in
corresponding changes to all of the variables that are driven by the fire. The heat flux to the targets is the sum
of many different sources other than the actual fire. A larger fire will indeed increase the portion of the target
heat flux resulting directly from the fire, but also will increase the wall temperatures and layer temperatures,
which also influence the target heat flux. Figures 4.2.2-7 through 4.2.2-11 demonstrates the target heat flux for
the investigated fire sizes.
Figure 4.2.2-7: Target Heat Flux for 2.5 Meter Diameter Fire
0
5
10
15
20
25
30
35
0 500 1000 1500Time (sec)
Hea
t Flu
x (k
W/m
2)
d=1.41 md=2.82 md=4.24 md=3.65 m
Figure 4.2.2-8: Target Flux for 2.0 Meter Diameter Fire
0
5
10
15
20
25
30
0 500 1000 1500 2000Time (sec)
Hea
t Flu
x (k
W/m
2)
d=1.41 md=2.82 md=4.24 md=3.65 m
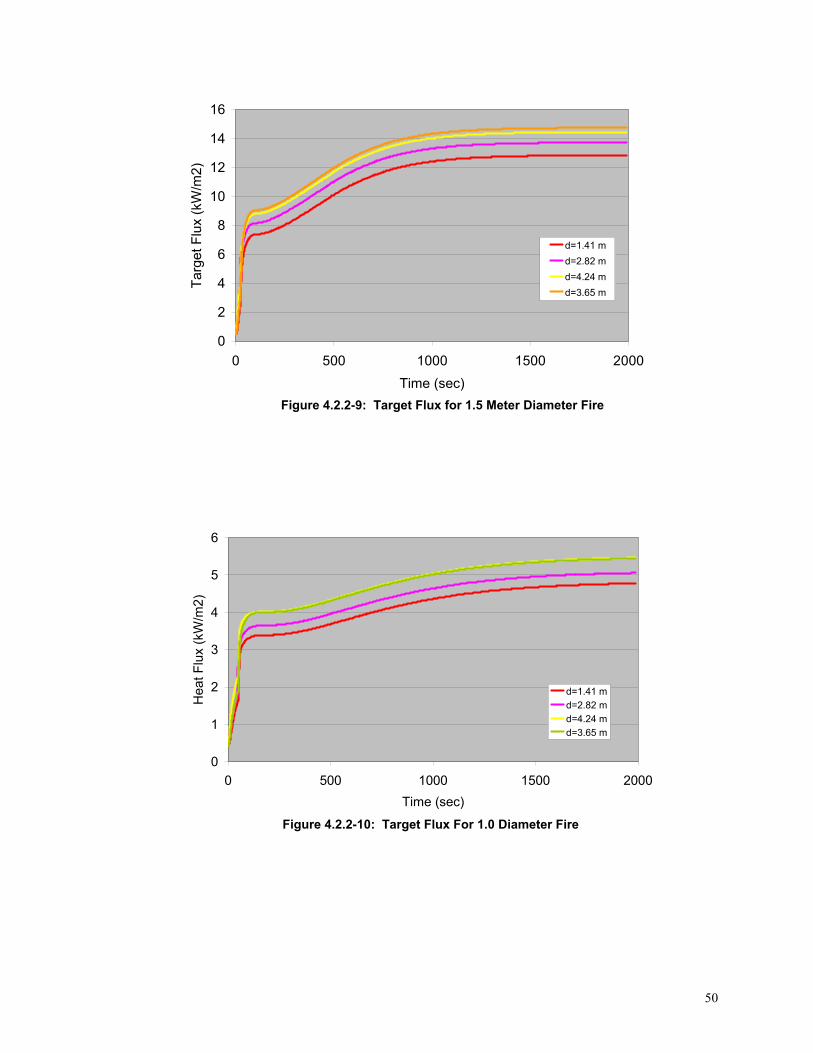
50
Figure 4.2.2-9: Target Flux for 1.5 Meter Diameter Fire
0
2
4
6
8
10
12
14
16
0 500 1000 1500 2000Time (sec)
Targ
et F
lux
(kW
/m2)
d=1.41 md=2.82 md=4.24 md=3.65 m
Figure 4.2.2-10: Target Flux For 1.0 Diameter Fire
0
1
2
3
4
5
6
0 500 1000 1500 2000Time (sec)
Hea
t Flu
x (k
W/m
2)
d=1.41 md=2.82 md=4.24 md=3.65 m
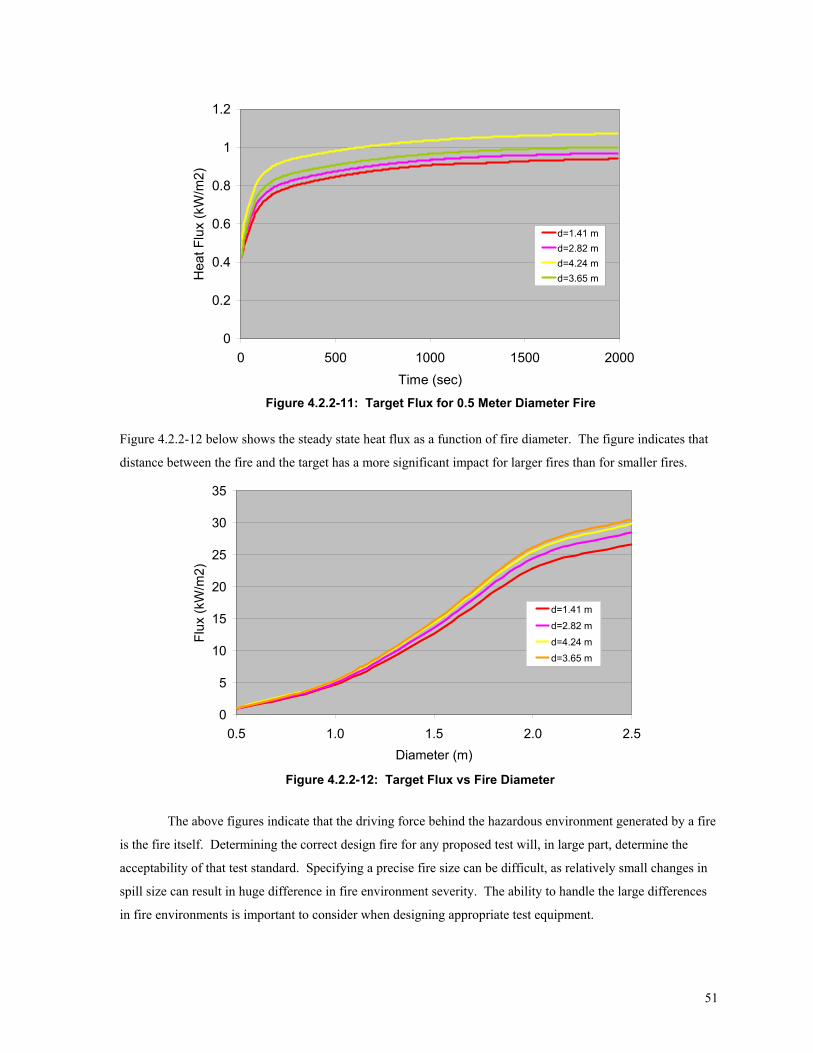
51
Figure 4.2.2-11: Target Flux for 0.5 Meter Diameter Fire
0
0.2
0.4
0.6
0.8
1
1.2
0 500 1000 1500 2000Time (sec)
Hea
t Flu
x (k
W/m
2)
d=1.41 md=2.82 md=4.24 md=3.65 m
Figure 4.2.2-12 below shows the steady state heat flux as a function of fire diameter. The figure indicates that
distance between the fire and the target has a more significant impact for larger fires than for smaller fires.
Figure 4.2.2-12: Target Flux vs Fire Diameter
0
5
10
15
20
25
30
35
0.5 1.0 1.5 2.0 2.5Diameter (m)
Flux
(kW
/m2)
d=1.41 md=2.82 md=4.24 md=3.65 m
The above figures indicate that the driving force behind the hazardous environment generated by a fire
is the fire itself. Determining the correct design fire for any proposed test will, in large part, determine the
acceptability of that test standard. Specifying a precise fire size can be difficult, as relatively small changes in
spill size can result in huge difference in fire environment severity. The ability to handle the large differences
in fire environments is important to consider when designing appropriate test equipment.

52
Additional variables were investigated and the results are available in Appendix C. All vent sizes
were varied and different fuels were utilized. The results of these variations result in no surprises. Increasing
the vent size allows sufficient oxygen to enter the compartment to maintain higher heat release rate, increasing
the severity of the fire environment. Decreasing the total vent area has the opposite effect. Changing the fuel
has very little effect on the total heat release rate as most hydrocarbons require roughly the same amount of
oxygen for a specified heat release rate, and all of the larger fires are oxygen limited. Altering the compartment
height has the same effect as changing the compartment size.
4.2.3 Vent Areas
Two components are required to have a fire, fuel and oxygen. Often there is significantly more fuel
than can be burned given the oxygen supply in a compartment. The rate of oxygen flow into the room is
controlled by the configuration of the vent in the compartment, particularly the size of the vents. To determine
the effects of the vents on maximum heat release rate the standard compartment was modeled with vent areas of
3.0 m2, 1.8 m2, and 1.1 m2 (32.25,19.35,11.83 ft2). The effects of vent area on the heat release rate are seen in
Figure 4.2.3-1.
Figure 4.2.3-1: Heat Release Rate for Varying Vent Areas
0
1000
2000
3000
4000
5000
6000
7000
0 500 1000 1500 2000Time (sec)
kW
3.0 m2 Vent 1.8 m2 Vent
1.1 m2 Vent
The effects of vent size on heat release rate can be clearly seen in the above figure. The 3.0 m2 vent area
allows sufficient oxygen into the room so that available fuel is the limiting factor for the heat release rate. The
1.8 m2 allows nearly the precise amount of oxygen required for the available fuel supply. This can be
determined by noticing the peak at the beginning of the heat release rate curve. At the onset of a fire, there is a
predetermined amount of oxygen in the compartment available for consumption. After all of this oxygen is
consumed then the only supply is the inflow through compartment vents. Regardless of the vent size the peak
heat release rate is the same because this value is limited by available fuel. As the initially available oxygen is
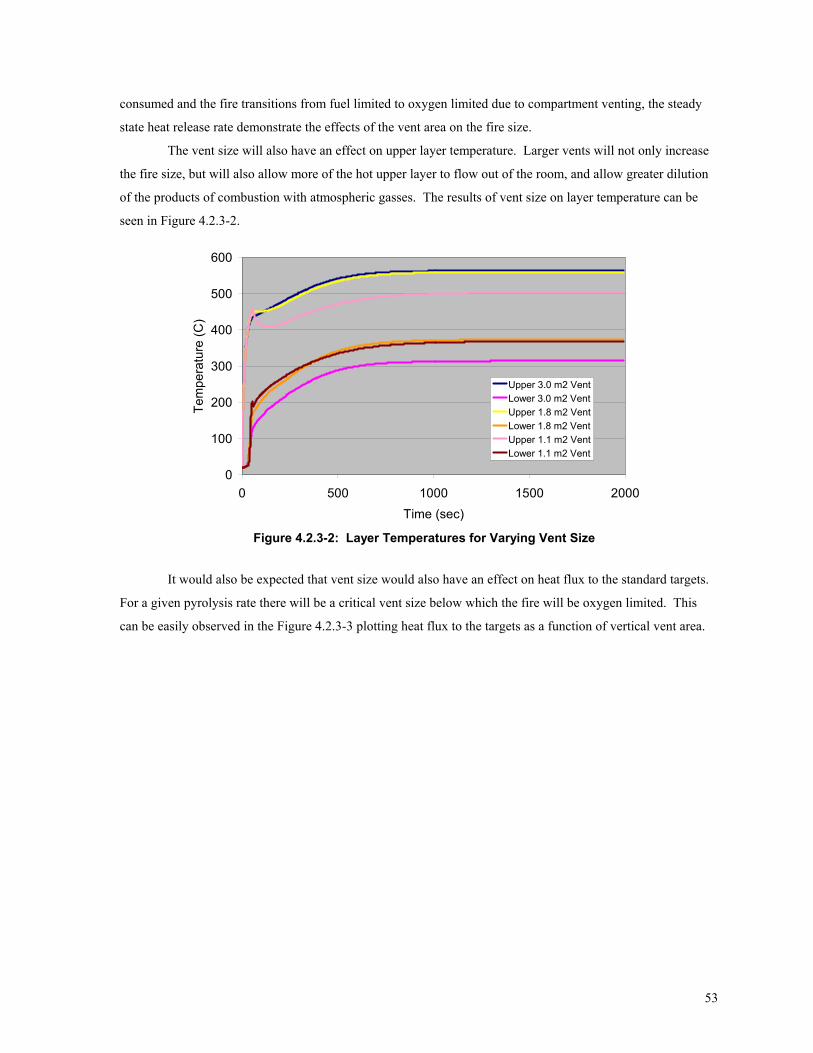
53
consumed and the fire transitions from fuel limited to oxygen limited due to compartment venting, the steady
state heat release rate demonstrate the effects of the vent area on the fire size.
The vent size will also have an effect on upper layer temperature. Larger vents will not only increase
the fire size, but will also allow more of the hot upper layer to flow out of the room, and allow greater dilution
of the products of combustion with atmospheric gasses. The results of vent size on layer temperature can be
seen in Figure 4.2.3-2.
Figure 4.2.3-2: Layer Temperatures for Varying Vent Size
0
100
200
300
400
500
600
0 500 1000 1500 2000Time (sec)
Tem
pera
ture
(C)
Upper 3.0 m2 VentLower 3.0 m2 VentUpper 1.8 m2 VentLower 1.8 m2 VentUpper 1.1 m2 VentLower 1.1 m2 Vent
It would also be expected that vent size would also have an effect on heat flux to the standard targets.
For a given pyrolysis rate there will be a critical vent size below which the fire will be oxygen limited. This
can be easily observed in the Figure 4.2.3-3 plotting heat flux to the targets as a function of vertical vent area.

54
Figure 4.2.3-3: Steady State Target Heat Flux vs Vertical Vent Area
0
5
10
15
20
25
30
1.0 1.5 2.0 2.5 3.0Vent Area (m2)
Targ
et F
lux
(kW
/m2)
d=1.41 md=2.82 md=4.24 md=3.65 m
4.2.4 Orientation of Targets
For all of the scenarios presented above, the target surface was oriented vertically and facing the fire. This
allows the maximum possible radiant energy from the fire to reach the target. However, it is not clear if this is
the extreme scenario. To determine if the heat flux would be more severe if the target orientation was different
models with the targets at 45-degree angles from the floor and parallel to the floor were created. Figure 4.2.4-1
shows target heat fluxes for the base case scenario with the face of the targets at a 45-degree angle to the floor.
This configuration increases the portion of the heat flux received from the upper layer and the ceiling and
decreases the heat flux from the fire and walls. Figure 4.2.4-2 shows targets parallel to the floor and facing the
ceiling. This configuration minimizes the portion of the flux from the fire and maximizes the portion of the
flux from the upper layer gasses and ceiling.

55
Figure 4.2.4-1: Target Heat Flux with Target Face at 45 Degree Angle With Compartment Floor
0.00
5.00
10.00
15.00
20.00
25.00
30.00
0 500 1000 1500 2000Time (sec)
Hea
t Flu
x (k
W/m
2)d=1.41 md=2.82 md=4.24 md=3.65 m
Figure 4.2.4-2: Target Heat Flux with Target Facing Compartment Ceiling.
0.00
5.00
10.00
15.00
20.00
25.00
30.00
0 500 1000 1500 2000Time (sec)
Hea
t Flu
x (k
W/m
2)
d=1.41 md=2.82 md=4.24 md=3.65 m
The above figures indicate that the precise orientation of a planar target does not greatly influence the heat flux
to the target. However, this should not be extrapolated to include all shape configurations. The precise shape
of an object can greatly influence both the convective and radiative heat transfer to that object.
4.3 Spray Fire Compartment Model Of particular interest is the modeling of a spray fire confined inside a compartment. This is difficult to
accomplish directly as none of the currently available zone models has directly tackled the problem of modeling
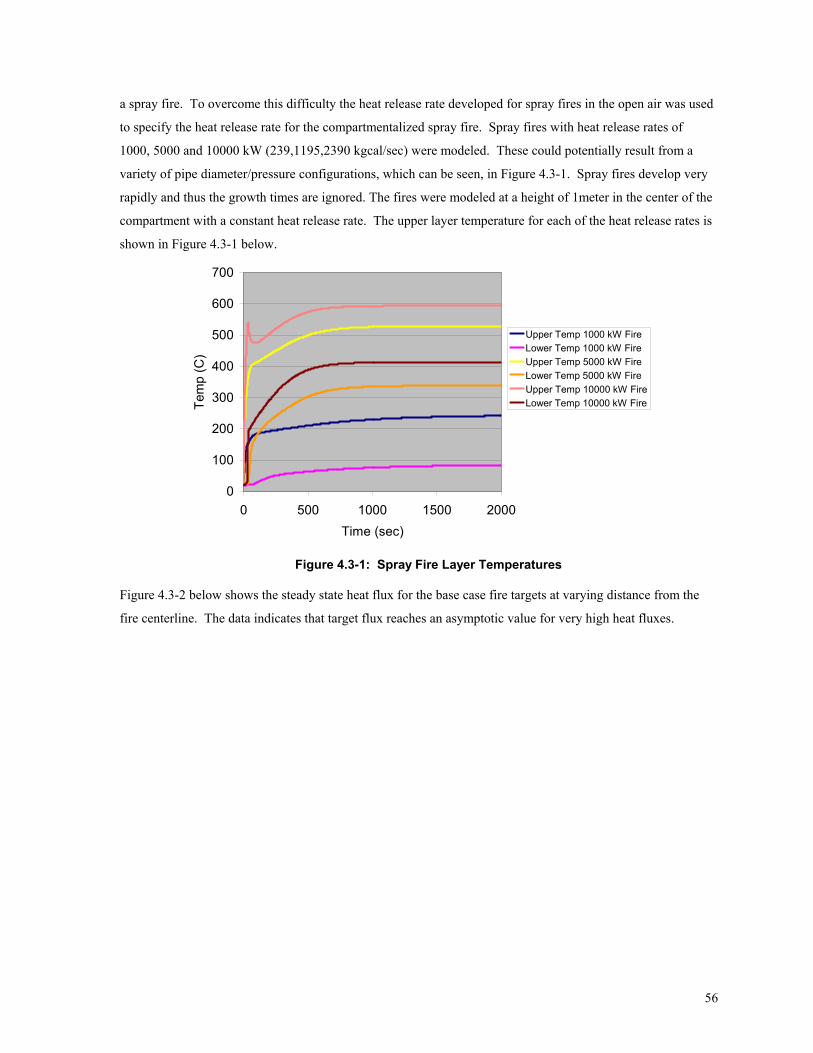
56
a spray fire. To overcome this difficulty the heat release rate developed for spray fires in the open air was used
to specify the heat release rate for the compartmentalized spray fire. Spray fires with heat release rates of
1000, 5000 and 10000 kW (239,1195,2390 kgcal/sec) were modeled. These could potentially result from a
variety of pipe diameter/pressure configurations, which can be seen, in Figure 4.3-1. Spray fires develop very
rapidly and thus the growth times are ignored. The fires were modeled at a height of 1meter in the center of the
compartment with a constant heat release rate. The upper layer temperature for each of the heat release rates is
shown in Figure 4.3-1 below.
Figure 4.3-1: Spray Fire Layer Temperatures
0
100
200
300
400
500
600
700
0 500 1000 1500 2000Time (sec)
Tem
p (C
)
Upper Temp 1000 kW FireLower Temp 1000 kW FireUpper Temp 5000 kW FireLower Temp 5000 kW FireUpper Temp 10000 kW FireLower Temp 10000 kW Fire
Figure 4.3-2 below shows the steady state heat flux for the base case fire targets at varying distance from the
fire centerline. The data indicates that target flux reaches an asymptotic value for very high heat fluxes.
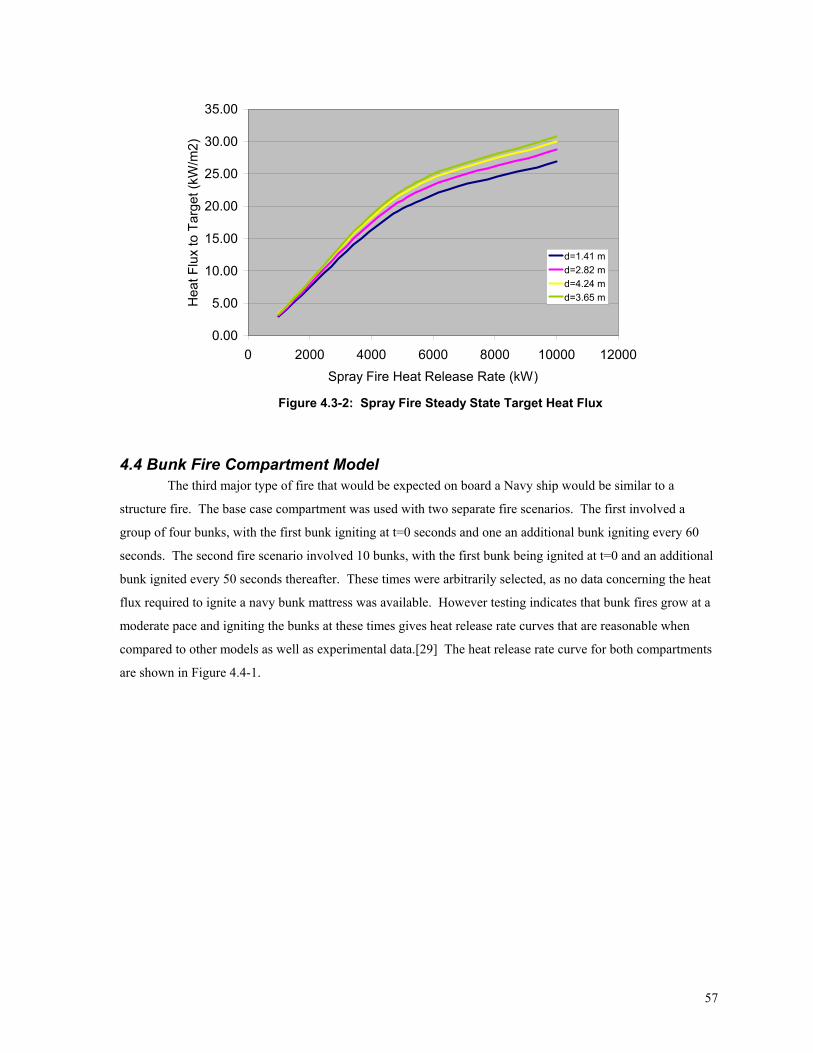
57
Figure 4.3-2: Spray Fire Steady State Target Heat Flux
0.00
5.00
10.00
15.00
20.00
25.00
30.00
35.00
0 2000 4000 6000 8000 10000 12000Spray Fire Heat Release Rate (kW)
Hea
t Flu
x to
Tar
get (
kW/m
2)
d=1.41 md=2.82 md=4.24 md=3.65 m
4.4 Bunk Fire Compartment Model The third major type of fire that would be expected on board a Navy ship would be similar to a
structure fire. The base case compartment was used with two separate fire scenarios. The first involved a
group of four bunks, with the first bunk igniting at t=0 seconds and one an additional bunk igniting every 60
seconds. The second fire scenario involved 10 bunks, with the first bunk being ignited at t=0 and an additional
bunk ignited every 50 seconds thereafter. These times were arbitrarily selected, as no data concerning the heat
flux required to ignite a navy bunk mattress was available. However testing indicates that bunk fires grow at a
moderate pace and igniting the bunks at these times gives heat release rate curves that are reasonable when
compared to other models as well as experimental data.[29] The heat release rate curve for both compartments
are shown in Figure 4.4-1.

58
Figure 4.4-1: Bunk Fires Heat Release Rates
0
1000
2000
3000
4000
5000
6000
7000
8000
9000
0 500 1000 1500 2000Time (sec)
HR
R (k
W)
4 Bunk Case
10 Bunk Case
Figure 4.4-2 below shows layer temperatures for both fire scenarios. The model demonstrates that the
difference between the 4-bunk case and the 10-bunk case are not as large as might be expected. This again
demonstrates that the oxygen entering the room becomes the limiting factor for large fire sizes.
Figure 4.4-2: Layer Temperature - Bunk Fire Scenarios
0
100
200
300
400
500
600
700
800
0 500 1000 1500 2000Time (sec)
Tem
pera
ture
(C)
Upper Temp - 4 Bunk CaseLower Temp - 4 Bunk CaseUpper Temp - 10 Bunk CaseLower Temp - 10 Bunk Case
Heat flux to the targets in the compartment base case configurations can be seen in Figures 4.4-3 and 4.4-4
below.
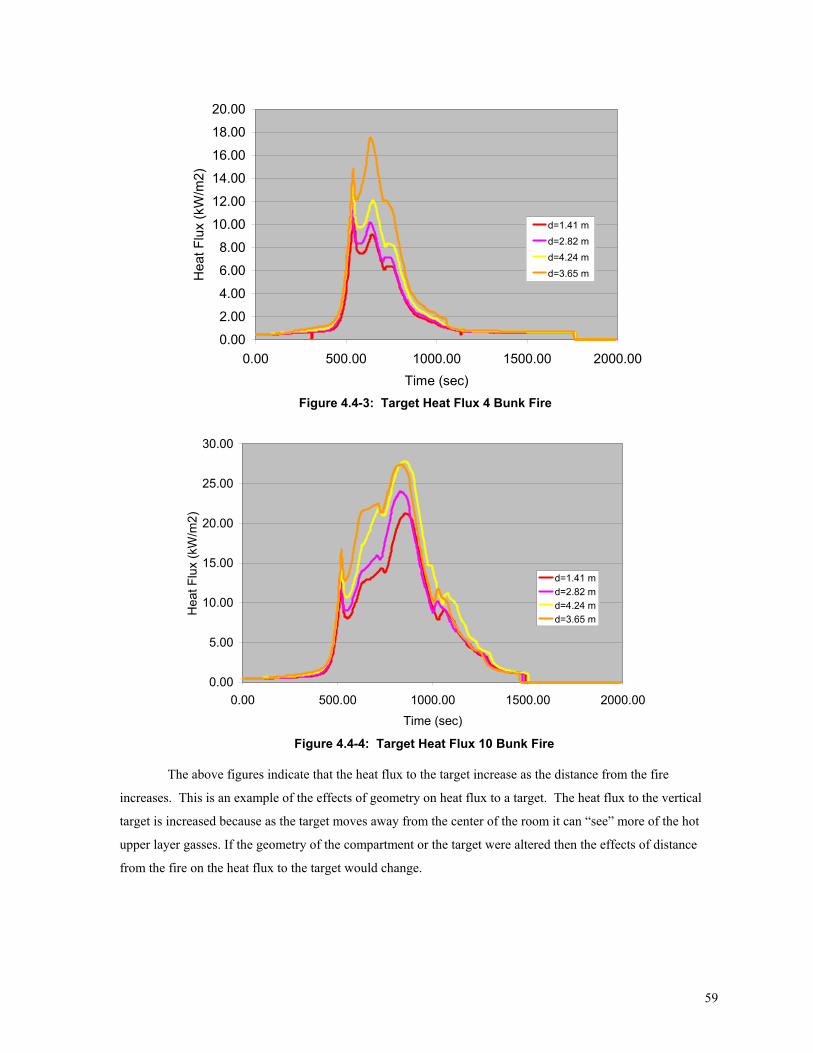
59
Figure 4.4-3: Target Heat Flux 4 Bunk Fire
0.00
2.00
4.00
6.00
8.00
10.00
12.00
14.00
16.00
18.00
20.00
0.00 500.00 1000.00 1500.00 2000.00Time (sec)
Hea
t Flu
x (k
W/m
2)
d=1.41 md=2.82 md=4.24 md=3.65 m
Figure 4.4-4: Target Heat Flux 10 Bunk Fire
0.00
5.00
10.00
15.00
20.00
25.00
30.00
0.00 500.00 1000.00 1500.00 2000.00Time (sec)
Hea
t Flu
x (k
W/m
2)
d=1.41 md=2.82 md=4.24 md=3.65 m
The above figures indicate that the heat flux to the target increase as the distance from the fire
increases. This is an example of the effects of geometry on heat flux to a target. The heat flux to the vertical
target is increased because as the target moves away from the center of the room it can “see” more of the hot
upper layer gasses. If the geometry of the compartment or the target were altered then the effects of distance
from the fire on the heat flux to the target would change.

60
5.0 Measurement of Heat Fluxes Typically, fire tests have been conducted in a furnace type enclosure. Many assumptions were made
when determining the comparability between the furnace tests and actual compartment fires. These
assumptions may result in discrepancies between an actual fire environment and the fire environment created in
the test chamber. The major assumptions differentiating furnace environment comparability to an actual fire
environment are presented by Wittasek [30] and include
♦ All boundary surfaces on the interior of the furnace are diffuse and spectrally gray. The absorptivites are
assumed to be equal to the emissivities ♦ A constant temperature exists over each surface element ♦ The furnace gas is gray ♦ The principal mode of heat transfer in the furnace is via radiation
The first three assumptions are required to simplify the mathematical models used to characterize a test
furnace. The validity of these assumptions has been extensively studies and it has been concluded that errors
introduced by these assumptions are not large enough to greatly effect test results. The simplifications in the
mathematics allowed by these assumptions far outweighs the errors that are introduced into the test results.
The effects of the final assumption have been significantly more controversial thus deserves greater
attention. Research by Harmathy has indicated that ignoring convective heat transfer is valid as long as the
ratio of conductive to convective resistances (the Biot number) is greater than 10.[30]
10>khl
Traditionally most of the material in test furnaces has been refractory cement, which has a very small k
value (1.5 to 2 W/mK) which allows them to easily meet the above criteria. Difficulties arise when the
materials used in the furnace are metals such as steel or aluminum. These materials have thermal
conuctivitiesas high as 73 W/mK for steel and upwards of 200 W/mK for aluminum. Ignoring the effects of
convective heat transfer for these materials introduces significant error into the calculations.
Regardless of the assumptions made when calculating the fire environment contained in a test furnace,
measurement of the variables used to control the furnace or determine the conditions within the test chamber
are also subject to substantial measurement error. Installation and placement of heat flux gauges greatly
influence the accuracy of these devices. Improperly placed or poorly installed heat flux gauges can easily result
in error in excess of 50%[30]. If temperature readings from thermocouples are used to control the furnace,
even small measurement errors can greatly influence the exposure to the test specimen due to the fourth power
relationship between temperature and radiant flux. Examinations of different types of thermocouples have
found differences in measured flame temperatures of 550 °C (1022 °F) during the first five minutes of a fire

61
test. Nathan Wittaseck in his Thesis “Analysis and Comparison of Marine Fire Testing Regulations and
Procedures” presents a thorough examination of errors present in furnace environment measurements. [30] The
comparability between laboratory testing and actual fire conditions will be very dependent upon accurately
determining and controlling the environment within the test chamber therefore every effort should be made to
reduce any sources of measurement error.

62
6.0 Conclusion An examination of the existing test method used to assess the level of protection offered by clothing,
whether it be protective or daily wear articles, indicates that current test methods do not correlate behavior in
the tests to behavior in actual fire scenarios. Identifying typical fire scenarios and subjecting the completed
clothing to the environments generated by these fire scenarios can eliminate these deficiencies. The
development of both a test mechanism and a test protocol designed specifically to conduct these kinds of testing
will allow comparison between the performance of different clothing and fabrics under real fire conditions
which will ultimately enhance sailor safety.
One of the unique problems associated with shipboard fires is the tremendous number of possible fire
scenarios that need to be considered. For the purpose of this project, it was demonstrated that the infinite
number of possibilities could be reduced to a few representative fires representing engine room fires, storage
and berthing area fires, and deck fires. Furthermore, the number of fuels on board a typical naval vessel can be
characterized by investigating a much smaller but representative cross section of flammable liquids and solids.
While the goal of this project was to determine a reasonable range of fire environments, the most severe
environments were not directly dealt with. These scenarios would typically be limited to wartime activities and
would be so severe that no amount of protective clothing would provide substantial protection. The analysis
presented here is weighted heavily towards controllable fires resulting from accidental fuel spills or ignition,
which would be more typical of peacetime type fires. These are the fires that clothing could be expected to
protect an individual from substantial harm.
Results are presented for both the compartment fire environments and open fire environments. As is
expected, the compartment environments are substantially more severe than open fires despite the peak heat
release rate limitations created by the limited venting capacity of internal spaces. It is important to recognize
however, that for many of the compartment cases the hazard to the individual quickly switches from the heat of
the fire to the toxic products of combustion. While these considerations are important for determining the
survivability of a fire environment, they are not important from the standpoint of determining the effectiveness
of protective fabrics and thus are not presented during the course of this report.
One of the advantages of identifying a select number of fire scenarios representing a comprehensive
cross section of all possible fires is the ability to compare the protection provided by an article of clothing.
None of the currently available test protocols will result in a comprehensive performance evaluation for such a
wide variety of fire scenarios. The results of this report indicate the wide variations that can be expected
aboard a U.S. Navy vessel and it is crucial that any performance evaluation consider this range of exposures.
This will alleviate the problems associated with bench top testing where it is impossible to determine the level
of performance provided directly from the results of the test. The types of exposures differ depending upon the
nature of the fire, the nature of the fuel and the location of the fire (in a compartment or in the open).
One of the difficulties with predicting fires and fire environments is the inherent instability of any fire
scenario. Any calculations conducted can only approximate one of the possible fire scenarios, which typically

63
is the most likely fire scenario. Unfortunately, fires are notoriously unpredictable and when viewing any
calculations that attempt to predict either a fire or the environment generated by the fire must be viewed with
this point in mind. For this particular case, this does not present a major problem, as the intent of the project is
to identify likely fire scenarios that can then be reproduced in a test apparatus. As long as the calculated values
are reasonable and can be consistently reproduced by the test apparatus then comparisons between fabrics can
be made.
As this project progresses, reproducing the calculated environments will become the major hurdle to
overcome. Several variables have not been investigated in this project that could directly impact the fire
environment within a test chamber. Most notably, heat conduction through the steel walls has been ignored. It
has been shown however that fire environments within test furnaces are not greatly influenced by refractory
cement lining materials, but can be greatly affected by materials such as steel that have high heats of
conduction. These problems will be left to future work as this project continues.
Although this project has only begun, and much work remains to be accomplished before a final test
procedure and apparatus are approved, it is not difficult to see the value of such a test procedure. While the
direct scope of the project is to improve the safety of the nations sailors, direct applications to all types of
clothing designed to protect against heat and flames are easy to visualize. Furthermore, the enhanced
understanding generated by studying the behavior of fabrics under lifelike conditions will ultimately lead to
advances in the design of these garments, further improving the safety. The ability to easily compare
competitors protective clothing offerings will enhance competition within this market and limit unsubstantiated
claims by manufacturers. The ultimate goal of all fire protection engineering is to save lives and property, and
this project will directly impact the former of those two objectives and should be vigorously pursued.
One isssue that was not examined in this work is the survivability of the fire scenarios presented.
While protecting from burn injuries is important, for the more severe cases presented in this study death or
serious injury would result from factors not related to the burn injury. These factors include lack of oxygen,
carbon monoxide poisoning, lung damage due to hot products of combustion and many others. Testing
clothing under fire situations that would not be survivable regardless of the burn injuries is not necessary.
When selecting specific fire scenarios to reproduce in a test apparatus the survivability of the environment with
respect to the protective equipment being examined needs to be considered.

64
7.0 Recommendation for Future Work During the course of the project, several gaps in the available research were discovered to limit the
completeness of the analysis. One of the primary weaknesses is the availability of flame temperatures for the
particular fuels used aboard naval vessels. The second major limitation was the lack of experimental work
concerning compartment vent flows when all vent openings are horizontal.
The lack of reliable flame temperature data inhibits the accuracy of the radiation calculations, as this is
a crucial parameter for determining flame emissivity. A large amount of data is available for premixed flames,
but the inherent variations in the combustion process when concerned with diffusion flames result in difficulties
in generating consistent values. However, these values are easily measured and could be determined through
small laboratory experiments for the particular fuels used by the navy. Any increase in the values used for this
report will have a significant impact on the values of the calculated radiation due to the power relationship
between flame temperature and flame emissivity.
An important variable concerning the protection offered by clothing, whether designed specifically for
fire fighting or otherwise, is the duration of exposure to the hazardous environment that the article of clothing
will be subjected. To determine this important parameter a risk assessment which might include a statistical
study of the behavior of crewmembers under fire conditions needs to be conducted with particular emphasis
placed upon the duration of any fire exposure experienced by crewmembers not associated with damage control
parties. For clothing whose primary purpose is not protection from heat and flames, the time of exposure will
depend upon the time it takes an individual to evacuate the compartment or the time required passing through a
flaming region. These values mightbe determined for stereotypical sailors by timed evacuation drills and
measurements designed to determine the maximum running speed of a typical sailor. This would allow a
thorough determination of the expected time of exposure.
One of the unique aspects of ships when compared with land based structures is the possibility of
compartments with no vertical openings but a substantial horizontal opening such as a hatch or scuttle. This
particular vent configuration has not been studied and results in fairly complex vent flow with smoke exiting
the center of the vent and fresh air entering around the edges of the opening. With venting being one of the
primary factors controlling sustainable heat release rates this is a major weakness in the modeling results. No
attempt could even be made for this particular vent scheme. An ambitious research program to develop
experimentally based algorithms that deal with this particular vent configuration would be a substantial
contribution to ship fire modeling.
One of the greatest limitations to the results presented in this report is the lack of generally available
information concerning the exact nature of the fuels used aboard U.S. Naval vessels. The range of expected
results could be narrowed considerably if the precise properties of these fuels were known. As precise fire
scenarios are adopted for use in the proposed test chamber full-scale tests of these fire scenarios should be
conducted to determine the accuracy of any models used to predict these results.

65
These limitations should not inhibit the progress of this project, as reasonable fire environments can be
predicted without this additional work. Furthermore, the eventual test device will need to be adjustable to
accommodate the range of fires presented in this report. As the understanding of these types of environments
increased, the environments created by the apparatus can be fine-tuned to more closely match the expected real
life scenario.
66
Sources Cited [1] American Society for Testing and Materials: Standard Test Method for Effects of Flame Impingement on Materials Used in Protective Clothing Not Designated Primarily for Flame Resistance. ASTM Designation: F 1358-95. [2] American Society for Testing and Materials Committee E-5 on Fire Standards, ASTM Fire Test Standards., American Society for Testing and Materials, Philadelphia, 1988 [3] Bagster, D. F., and Schuback, S. A., “The prediction of jet-fire dimensions” Journal of Loss Prevention in the Process Industry. No 3, Volume 9 (1996). [4] Barker, R.L., Hamouda, H., Behnke, Wallace P., “Applying Instrumented Manikin Technology for Testing the Fire Resistance of Protective Clothing” Performance of Protective Clothing: Fourth Volume, ASTM STP 1133, McBriarty, James P., Henry, Norman W., editors, American Society for Testing and Materials, Philadelphia, 1992. [5] Behnke, Wallace P., “Thermal Protective Performance Test for Clothing.” Fire Technology, February 1977. [6] Behnke, W. P., Geshury, A. J., Barker, R. L., “Thermo-Man and Thermo-Leg: Large Scale Test Methods for Evaluating Thermal Protective Performance” Performance of Protective Clothing: Fourth Volume, ASTM STP 1133, McBriarty, James P., Henry, Norman W., editors, American Society for Testing and Materials, Philadelphia, 1992. [7] Bomberg, M., “Application of Three ASTM Test Methods to Measure Thermal Resistance of Clothing” Performance of Protective Clothing: Fourth Volume, ASTM STP 1133, McBriarty, James P., Henry, Norman W., editors, American Society for Testing and Materials, Philadelphia, 1992. [8] Brewster, Elissa P., Barker, Roger L., “A Summary of Research on Heat Resistant Fabrics for Protective Clothing” American Industrial Hygiene Association Journal, February 1983. [9] Cowley, L. T., and Johnson, A. D., “Oil and Gas Fires: Characteristics and Impacts” Fire Loading Series, Shell Research Ltd. Work Package No. FL1. [10] Crown, E. M., Ackerman, M. Y., Leung., E., Rigakis, K. B., “Instrumented Mannequin Evaluation of Thermal Protective Clothing” Performance of Protective Clothing: Fourth Volume, ASTM STP 1133, McBriarty, James P., Henry, Norman W., editors, American Society for Testing and Materials, Philadelphia, 1992. [11] DiNenno, editor. SFPE Handbook of Fire Protection Engineering. Society of Fire Protect8ion Engineers and National Fire Protection Association, second edition, 1995. [12] Drysdale, D.. An Introduction to Fire Dynamics. Wiley Interscience, first edition, 1985. [13] Fecht, B. A., Bennett., D.W., “Robotic Mannequin Technology for Enhanced Product Testing” Performance of Protective Clothing: Fourth Volume, ASTM STP 1133, McBriarty, James P., Henry, Norman W., editors, American Society for Testing and Materials, Philadelphia, 1992. [14] Federal Test Method Standard No. 191A, Method 5903.1 Flame Resistance of Clothing; Vertical December 28, 1989 [15] Gross, Daniel and Davis, William, D., “Burning Characteristics of Combat Ship Compartments and
67
Vertical Fire Spread”, National Bureau of Standards (U.S.), NBSIR 88-3897 December 1988. [16] Holcombe, B. V., Hoschke, B. N.,, “Do Test Methods Yield Meaningful Performance Specifications” Performance of Protective Clothing ASTM STP 900, Barker, R. L., Coletta, G. C., editors, American Society for Testing and Materials, Philadelphia, 1984 [17] Hoschke. B. N., Holcombe, B. V., Plante, A. M., “A Critical Appraisal of Test Methods for Thermal Protective Clothing Fabrics” Performance of Protective Clothing ASTM STP 900, Barker, R. L., Coletta, G. C., editors, American Society for Testing and Materials, Philadelphia, 1984 [18] Khan, M. M., and Tewarson, A., “Characterization of Hydraulic Fluid Spray Combustion” Fire Technology, November 1, 1991. [19] Koski, J.A., Gritzo, L. A., Kent, L.A., and Wix, S. D., “ Actively Cooled Calorimeter Measurements and Environment Characterization In a Large Pool Fire “ MORE MORE MORE [20] Lee, B.T. and Parker W. J., “Fire Buildup in Shipboard Compartments - Characterization of Some Vulberable Spaces and The Status of Prediction Analysis”, National Bureau of Standards (U.S.), NBSIR 79-1714 (May 1979). [21] National Transportation Safety Board, “Fire On Board the U.S. Fish Processing Vessel Alaska Spirit, Seward, Alaska, May 27, 1995” National Transportation Safety Board (U.S.) Marine Accident Report. PB96-916401. [22] National Transportation Safety Board, “Engineroom Fire On Board The Liberian Tankship Seal Island While Moored At The Amerada Hess Oil Terminal In St. Croix, U.S. Virgin Islands, October 9, 1994” National Transportation Safety Board (U.S.) Marine Accident Report. PB95-916404. [23] National Transportation Safety Board, “Fire Aboard U.S. Small Passenger Vessel Argo Commodore In San Francisco Bay California, December 3, 1994” National Transportation Safety Board (U.S.) Marine Accident Report. PB95-916403 [24] National Transportation Safety Board, “Explosion and Fire On The U.S. Tank Ship Surf City, Persian Gulf, February 22, 1990” National Transportation Safety Board (U.S.) Marine Accident Report. PB92-916402 [25] National Transportation Safety Board, “Explosion and Fire Aboard The U.S. Tankship Jupiter, Bay City, Michigan, September 16, 1990” National Transportation Safety Board (U.S.) Marine Accident Report. PB91-916404. [26] Planas-Cuchi, Eulalia., Casal, Joaquim., Lancia, Antonio., and Bordignon, Leo., “Protection of Equipment Engulfed in a Pool Fire” Journal of Loss Prevention in the Process Industry. No 3, Volume 9 (1996). [27] Schoppe, M. M., Welsford, J.M., Abbott, N. J., “Protection Offered by Lightweight Clothing Materials to the Heat of a Fire” Performance of Protective Clothing ASTM STP 900, Barker, R. L., Coletta, G. C., editors, American Society for Testing and Materials, Philadelphia, 1984 [28] Spindola, K. J. Audet, N. F., “U.S. Navy Protective Clothing Program” Performance of Protective Clothing ASTM STP 900, Barker, R. L., Coletta, G. C., editors, American Society for Testing and Materials, Philadelphia, 1984 [29] Steward, F. R., Morrison, L., and Mehaffey, J., “Full Scale Fire Tests for Ship Accommodation Quarters”, Fire Technology, February 1992. [30] Wittasek, Nathan. Analysis and Comparison of Marine Fire Testing Regulations and Procedures.

68
Master’s thesis, Worcester Polytechnic Institute, Center for Firesafety Studies, 1996. [31] Zalosh, Robert G, An Engineering Approach to Industrial Fire Protection. John Wiley & Sons, Unpublished 8th Draft, 1.


![· rates used in the 1984 edition of NFPA 72E Appendix C Guide for Automatic Fire Detector Spacing [3] . 2 Heat Release Rate Test Configuration The heat release rate tests, using](https://img.pdfslide.us/doc/110x75/5e9114eda9311f30b05dc262/rates-used-in-the-1984-edition-of-nfpa-72e-appendix-c-guide-for-automatic-fire-detector.jpg)