Embed Size (px)
Citation preview

FIRE PATTERNS ANALYSIS WITH LOW HEAT
RELEASE RATE INITIAL FUELS
Gregory E. Gorbett, MScFPE, MSc, CFEI, CFPS, IAAI-CFI, MIFireE
Assistant Professor
William Hicks, MSc, CFEI, CFPS, IAAI-CFI, EFO, CFO, MIFireE
Assistant Professor
Ron Hopkins, MSc, CFEI, CFPS
Associate Professor (Ret)
Eastern Kentucky University, USA
Patrick M. Kennedy, BSc (Hons), BSc, CFEI, CFPS, MIFireE
Principal Fire and Explosion Analysis Expert
John A. Kennedy & Associates
ABSTRACT Twelve full-scale research burns into the nature of fire effects and fire patterns in compartment fires were
conducted at the research facility of Eastern Kentucky University. This series of tests was an evolution of the
previous eight full-scale tests performed at this facility. The purpose of this test series was to evaluate the damage
caused by an initial, low heat release rate fuel and the influence on this initial damage when a secondary fuel that is
substantially higher in heat release rate and total energy output was involved. Key fire effects observed and
measured are reported here, along with the test parameters and variables altered throughout testing.
These tests demonstrate a remarkable resemblance of fire effects and patterns in minimal variable testing methods.
The observable and measurable damage still present in all of the tests was sufficient to lead investigators to the first
fuel ignited. In these tests, the higher heat release rate fuels did not obscure or alter the fire effects from the initial
item. *This paper as published is a combination of two, separately accepted proposals. However, due to their
common discussion points ISFI has graciously permitted their combination into one single publication.
* * *
INTRODUCTION
Fire investigation plays a critical role in identifying potentially faulty or improperly designed
and installed products, which may have played a role in the fire, and in identifying persons that
deliberately started a fire with malicious intent. In the end, proper fire investigation should determine
the fire cause, the cause of the resulting property damage, and most importantly, the cause of bodily
injury or loss of life to civilians and firefighters. To meet this objective, an accurate cause assessment
is essential, and an accurate cause assessment depends on a correct origin determination. Therefore,
correct identification of the origin of the fire is the scene investigator’s most important hypothesis.
Since the beginning of organized fire investigation in the late 1940’s, fire investigators have relied on
fire burn patterns as their basis for determining the fire origin (Rethoret, 1945). Fire patterns are
defined as the “visible or measurable physical changes, or identifiable shapes, formed by a fire effect
or group of fire effects” (NFPA 921, 2008, p. 12). Absent the testimony of reliable eyewitnesses to
the fire’s inception, the investigator is required to determine the origin by observation and expert
interpretation of the physical evidence: the fire patterns. As such, fire origin determination is largely
a matter of fire pattern recognition and analysis (NFPA 921, 2008).
DYNAMICS OF FIRE PATTERN DEVELOPMENT
As a result of the previous research conducted into the development of fire patterns, as well
as the report recommendations of USFA and NIJ it was decided that the next series of tests would be
conducted in the same test facility with identical furniture for each series of two test burns (Shanley,
1997, Milke, 1996). Factors, such as ventilation, would be controlled as much as possible.
General Theory
Recent research into the development of fire patterns has shown that the primary mode
behind fire pattern creation stems from the amount of heat flux on a materials surface over the
duration of the fire (Gorbett, G, 2006; Hopkins, R. 2009; Icove, 2006; Madryzkowski, 2010).
Therefore, the fire plume and the various fluxes generated by it are the primary means of pattern
production in the early stages of a fire. As the fire develops, a substantial upper layer begins to form
and starts transferring heat to the wall and ceiling surfaces. This heat transfer can be regarded as
relatively uniform throughout the upper portions of the compartment, except at the plume interface
with any building or contents surface. Obviously, at the interface of the plume the heat transferred
will be greater and possibly for a longer duration. As the temperature in the upper layer increases and
the duration of contact between the upper layer and the lining surfaces increase, the heat flux
imposed on these surfaces reaches a critical threshold that begins damaging the material and creating
patterns.
Any ceiling jet formed by the intersection of the plume will cause greater heat to be transferred first
to the ceiling surface and later to the wall surfaces assuming the centerline of the plume is located
away from the wall. The heat flux will be greater at the location where the ceiling jet passes over
these surfaces and lessens as the velocity of the jet diminishes as it flows away from the centerline of
the plume. In other words, the temperature of the affected surface is highest near the plume centerline
and becomes cooler as the distance (r) from the centerline of the plume increases due to the cooling
by heat losses to the ceiling (Figures 1 & 2). Also, the velocity of the ceiling jet affects how quickly
heat can be transferred. The velocity of the ceiling jet is highest near the centerline of the plume and
lessens as it moves outward. Consequently, these two heat transfer factors combine to inflict more
damage and create more distinct patterns at the centerline of the plume with lesser damage the further
away from the centerline. The ceiling jet and the gases from the upper layer begin to have a
combined effect on the surfaces nearest the plume (Figure 2).
Figure 1: Plume Temperatures
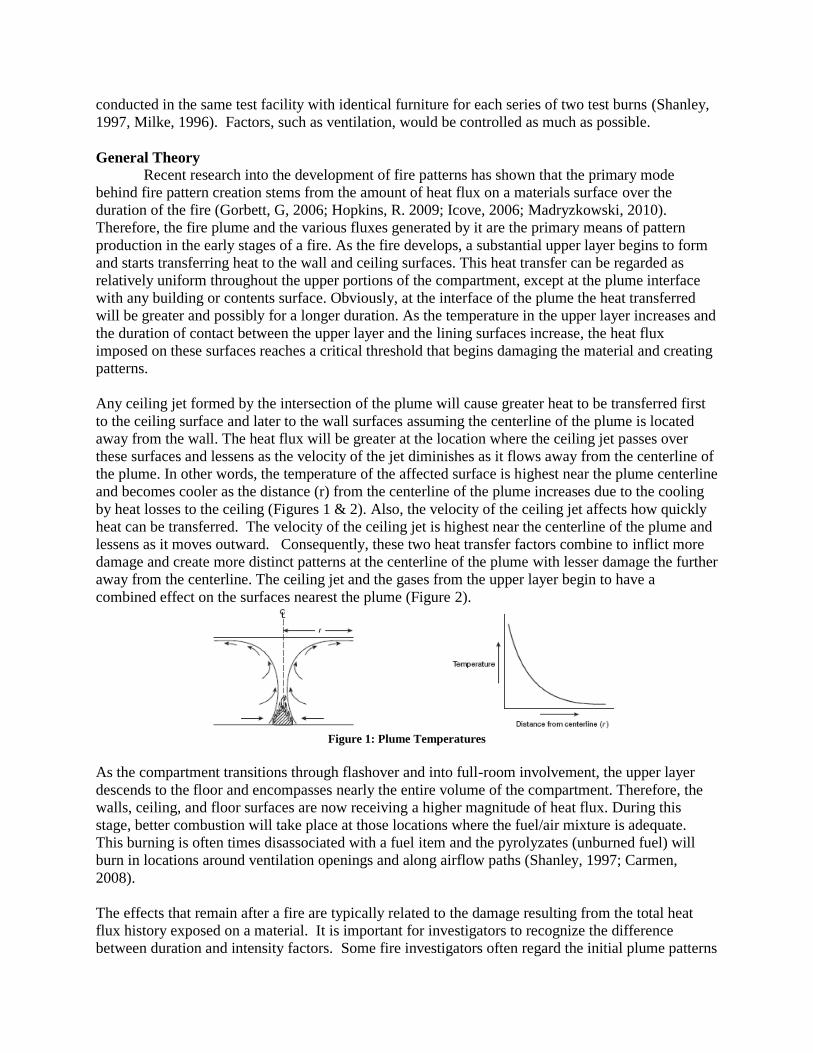
As the compartment transitions through flashover and into full-room involvement, the upper layer
descends to the floor and encompasses nearly the entire volume of the compartment. Therefore, the
walls, ceiling, and floor surfaces are now receiving a higher magnitude of heat flux. During this
stage, better combustion will take place at those locations where the fuel/air mixture is adequate.
This burning is often times disassociated with a fuel item and the pyrolyzates (unburned fuel) will
burn in locations around ventilation openings and along airflow paths (Shanley, 1997; Carmen,
2008).
The effects that remain after a fire are typically related to the damage resulting from the total heat
flux history exposed on a material. It is important for investigators to recognize the difference
between duration and intensity factors. Some fire investigators often regard the initial plume patterns
as being destroyed or obscured after a fire transitions to full room involvement or when larger fuel
packages become involved. Other investigators interpret the greatest damage as being the area of
origin. Neither approach is appropriate based on the available research.
Figure 2: Ideal 3-dimensional Fire Pattern Development (Truncated Cone)
PURPOSE
A frequent question that arises in fire patterns analysis is whether the damage observed or
measured after a fire event is a result of a larger fuel package obscuring or wiping out initial damage
that may have existed from an initial, lower heat release rate fuel package. The purpose of this test
series was to evaluate the damage caused by an initial, low heat release rate fuel and the influence on
this initial damage when a secondary fuel of substantially higher heat release rate and total energy
output becomes involved. NFPA 921 (2008) cautions investigators regarding this in the following:
“17.4.1.3.1 The size, location, and heat release rate of a fuel package may have as much
effect on the extent of damage as the length of time the fuel package was burning. An area of
extensive damage may simply mean that there was a significant fuel package at that
location. The investigator should consider whether the fire at such a location might have
spread there from another location where the fuel load was smaller” [emphasis added].
NFPA 921 further cautions the investigator that when analyzing fire patterns, it is imperative that the
investigator determine the sequence of pattern generation in determining the area of origin. Thus, the
primary question of the obscuration of the initial damage must be taken into consideration when
using fire patterns to arrive at an area of origin. However, this research question has not be
sufficiently addressed in the current literature.
It was the researcher’s hypothesis that the damage created by the smaller fuel item would be
significantly obscured once the larger fuel became involved and started to impart damage on the
lining surfaces. It was further hypothesized that the area of origin may still be determinable, but the
evolution of the effects may make it more difficult or unable to be observed by a scene investigator.
FULL SCALE FIRE TESTS
Previous full-scale fire tests have been conducted at Eastern Kentucky University analyzing
the general reproducibility, usage, reliability, and persistence of fire patterns for fire investigation
(Gorbett, 2006; Hopkins, 2007, 2008, 2009; Hicks, 2008). A total of 8 full-scale and forty-eight
small-scale tests were completed and reported on in the above listed references. Twelve additional
full-scale tests were completed for this series, bringing the total full-scale tests to 20. For a complete
listing of the full-scale tests that have been completed and their relevant variables, please refer to
Table 7.
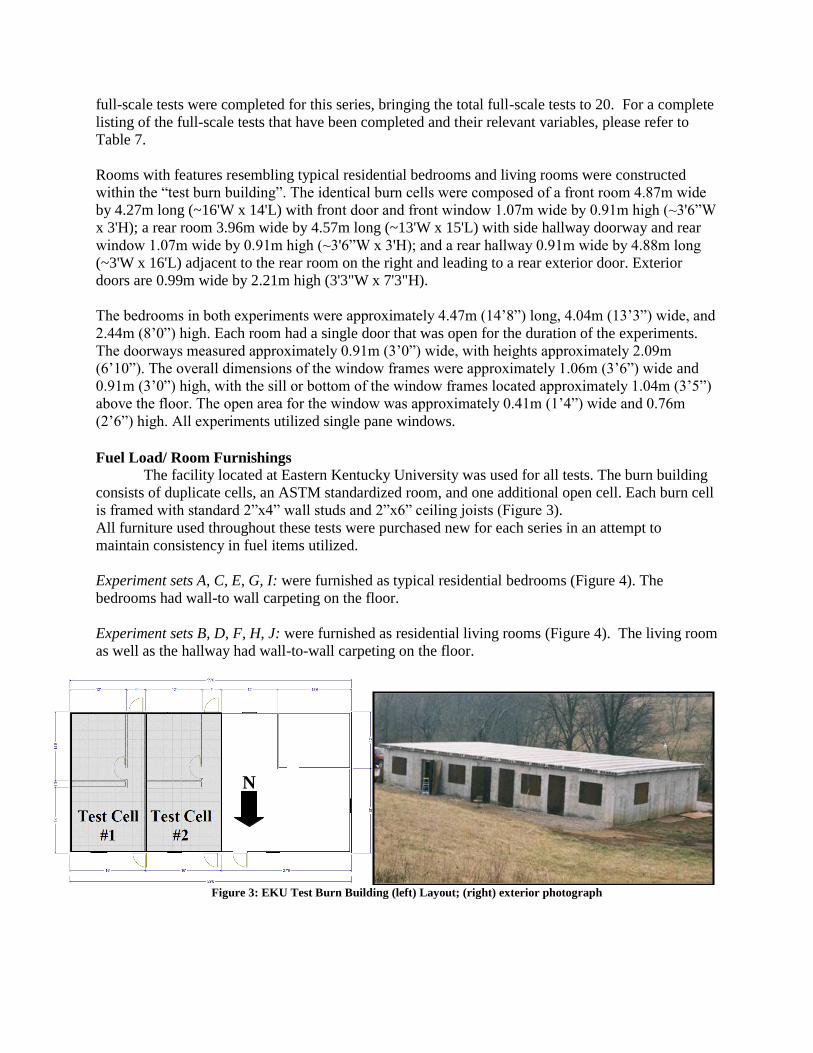
Rooms with features resembling typical residential bedrooms and living rooms were constructed
within the “test burn building”. The identical burn cells were composed of a front room 4.87m wide
by 4.27m long (~16'W x 14'L) with front door and front window 1.07m wide by 0.91m high (~3'6”W
x 3'H); a rear room 3.96m wide by 4.57m long (~13'W x 15'L) with side hallway doorway and rear
window 1.07m wide by 0.91m high (~3'6”W x 3'H); and a rear hallway 0.91m wide by 4.88m long
(~3'W x 16'L) adjacent to the rear room on the right and leading to a rear exterior door. Exterior
doors are 0.99m wide by 2.21m high (3'3"W x 7'3"H).
The bedrooms in both experiments were approximately 4.47m (14’8”) long, 4.04m (13’3”) wide, and
2.44m (8’0”) high. Each room had a single door that was open for the duration of the experiments.
The doorways measured approximately 0.91m (3’0”) wide, with heights approximately 2.09m
(6’10”). The overall dimensions of the window frames were approximately 1.06m (3’6”) wide and
0.91m (3’0”) high, with the sill or bottom of the window frames located approximately 1.04m (3’5”)
above the floor. The open area for the window was approximately 0.41m (1’4”) wide and 0.76m
(2’6”) high. All experiments utilized single pane windows.
Fuel Load/ Room Furnishings
The facility located at Eastern Kentucky University was used for all tests. The burn building
consists of duplicate cells, an ASTM standardized room, and one additional open cell. Each burn cell
is framed with standard 2”x4” wall studs and 2”x6” ceiling joists (Figure 3).
All furniture used throughout these tests were purchased new for each series in an attempt to
maintain consistency in fuel items utilized.
Experiment sets A, C, E, G, I: were furnished as typical residential bedrooms (Figure 4). The
bedrooms had wall-to wall carpeting on the floor.
Experiment sets B, D, F, H, J: were furnished as residential living rooms (Figure 4). The living room
as well as the hallway had wall-to-wall carpeting on the floor.
Figure 3: EKU Test Burn Building (left) Layout; (right) exterior photograph
N
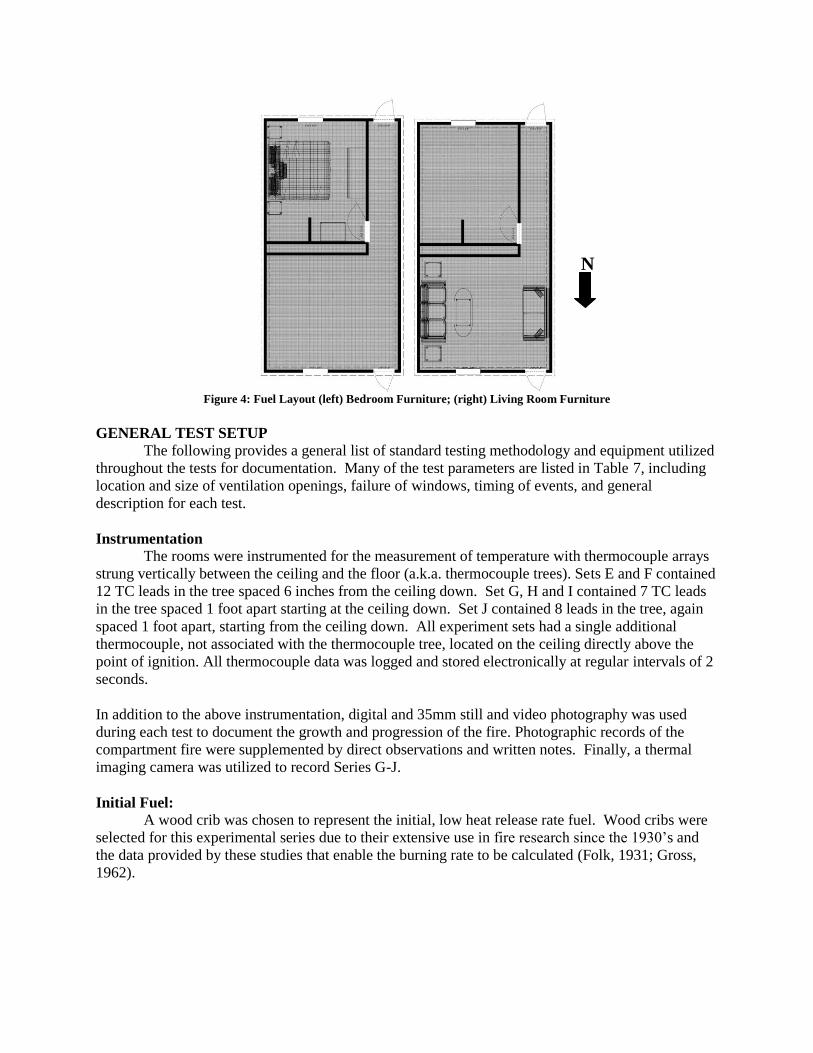
Figure 4: Fuel Layout (left) Bedroom Furniture; (right) Living Room Furniture
GENERAL TEST SETUP
The following provides a general list of standard testing methodology and equipment utilized
throughout the tests for documentation. Many of the test parameters are listed in Table 7, including
location and size of ventilation openings, failure of windows, timing of events, and general
description for each test.
Instrumentation
The rooms were instrumented for the measurement of temperature with thermocouple arrays
strung vertically between the ceiling and the floor (a.k.a. thermocouple trees). Sets E and F contained
12 TC leads in the tree spaced 6 inches from the ceiling down. Set G, H and I contained 7 TC leads
in the tree spaced 1 foot apart starting at the ceiling down. Set J contained 8 leads in the tree, again
spaced 1 foot apart, starting from the ceiling down. All experiment sets had a single additional
thermocouple, not associated with the thermocouple tree, located on the ceiling directly above the
point of ignition. All thermocouple data was logged and stored electronically at regular intervals of 2
seconds.
In addition to the above instrumentation, digital and 35mm still and video photography was used
during each test to document the growth and progression of the fire. Photographic records of the
compartment fire were supplemented by direct observations and written notes. Finally, a thermal
imaging camera was utilized to record Series G-J.
Initial Fuel:
A wood crib was chosen to represent the initial, low heat release rate fuel. Wood cribs were
selected for this experimental series due to their extensive use in fire research since the 1930’s and
the data provided by these studies that enable the burning rate to be calculated (Folk, 1931; Gross,
1962).
N
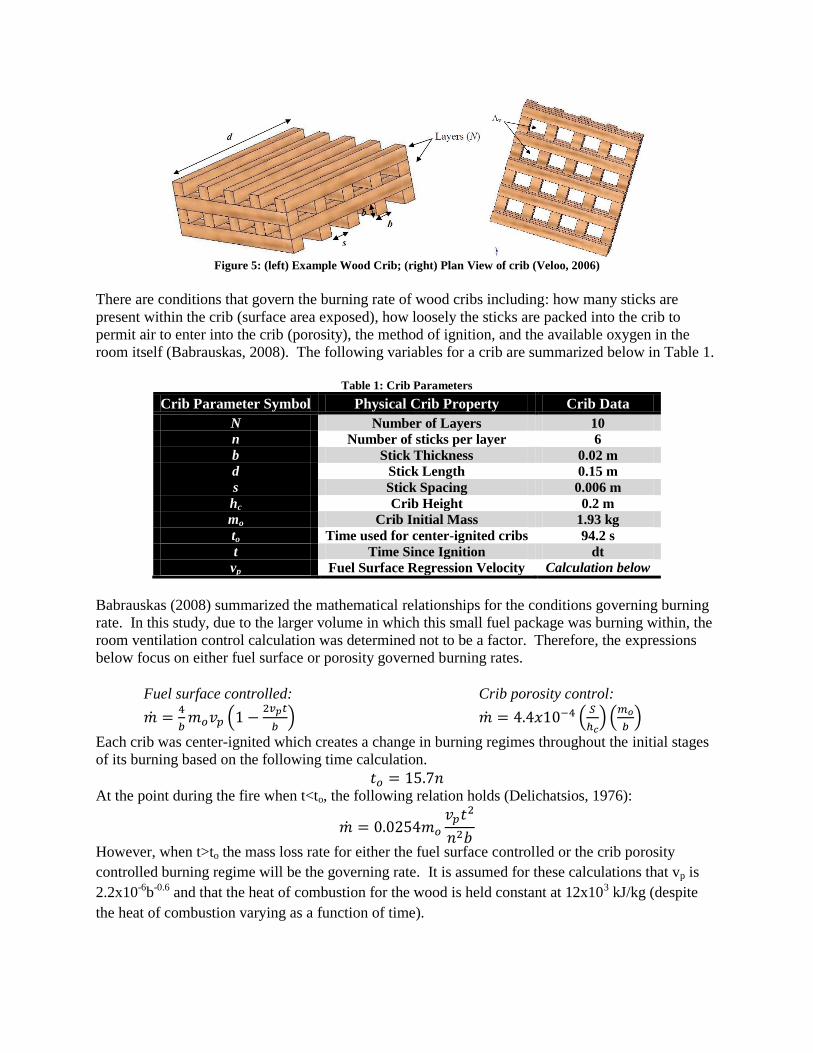
Figure 5: (left) Example Wood Crib; (right) Plan View of crib (Veloo, 2006)
There are conditions that govern the burning rate of wood cribs including: how many sticks are
present within the crib (surface area exposed), how loosely the sticks are packed into the crib to
permit air to enter into the crib (porosity), the method of ignition, and the available oxygen in the
room itself (Babrauskas, 2008). The following variables for a crib are summarized below in Table 1.
Table 1: Crib Parameters
Crib Parameter Symbol Physical Crib Property Crib Data
N Number of Layers 10
n Number of sticks per layer 6
b Stick Thickness 0.02 m
d Stick Length 0.15 m
s Stick Spacing 0.006 m
hc Crib Height 0.2 m
mo Crib Initial Mass 1.93 kg
to Time used for center-ignited cribs 94.2 s
t Time Since Ignition dt
vp Fuel Surface Regression Velocity Calculation below
Babrauskas (2008) summarized the mathematical relationships for the conditions governing burning
rate. In this study, due to the larger volume in which this small fuel package was burning within, the
room ventilation control calculation was determined not to be a factor. Therefore, the expressions
below focus on either fuel surface or porosity governed burning rates.
Fuel surface controlled: Crib porosity control:
Each crib was center-ignited which creates a change in burning regimes throughout the initial stages
of its burning based on the following time calculation.
At the point during the fire when t<to, the following relation holds (Delichatsios, 1976):
However, when t>to the mass loss rate for either the fuel surface controlled or the crib porosity
controlled burning regime will be the governing rate. It is assumed for these calculations that vp is
2.2x10⁻⁶b-0.6 and that the heat of combustion for the wood is held constant at 12x103 kJ/kg (despite
the heat of combustion varying as a function of time).
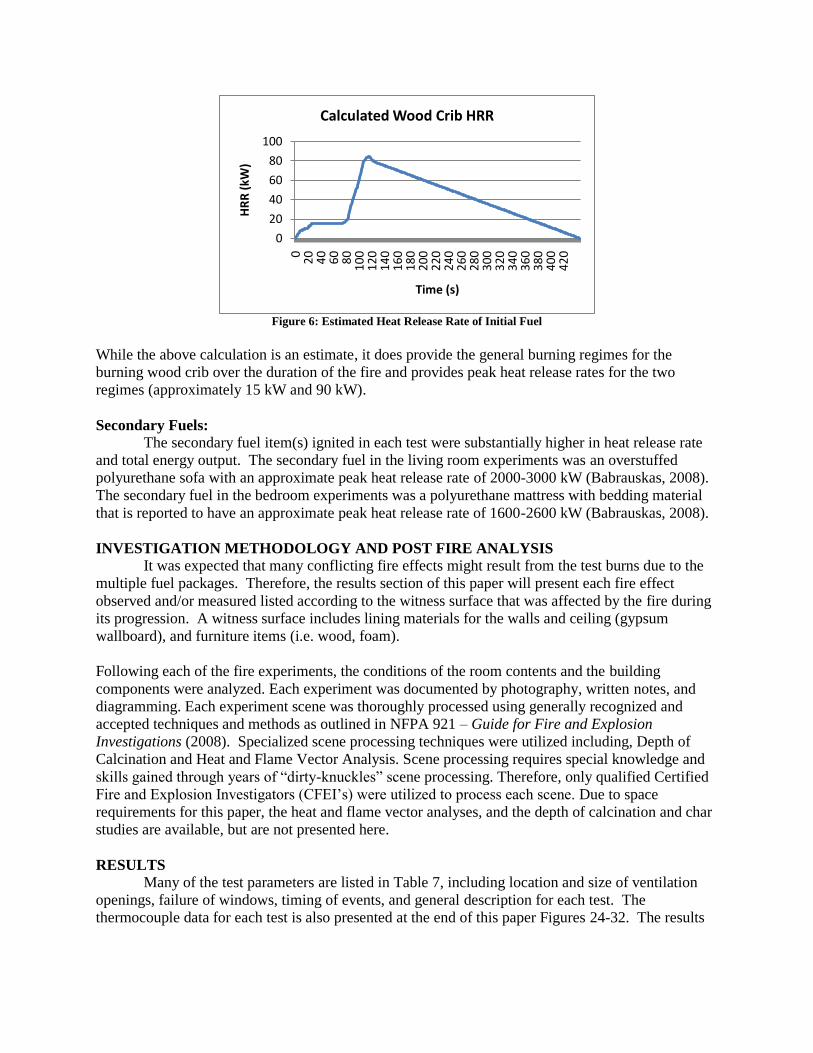
Figure 6: Estimated Heat Release Rate of Initial Fuel
While the above calculation is an estimate, it does provide the general burning regimes for the
burning wood crib over the duration of the fire and provides peak heat release rates for the two
regimes (approximately 15 kW and 90 kW).
Secondary Fuels:
The secondary fuel item(s) ignited in each test were substantially higher in heat release rate
and total energy output. The secondary fuel in the living room experiments was an overstuffed
polyurethane sofa with an approximate peak heat release rate of 2000-3000 kW (Babrauskas, 2008).
The secondary fuel in the bedroom experiments was a polyurethane mattress with bedding material
that is reported to have an approximate peak heat release rate of 1600-2600 kW (Babrauskas, 2008).
INVESTIGATION METHODOLOGY AND POST FIRE ANALYSIS
It was expected that many conflicting fire effects might result from the test burns due to the
multiple fuel packages. Therefore, the results section of this paper will present each fire effect
observed and/or measured listed according to the witness surface that was affected by the fire during
its progression. A witness surface includes lining materials for the walls and ceiling (gypsum
wallboard), and furniture items (i.e. wood, foam).
Following each of the fire experiments, the conditions of the room contents and the building
components were analyzed. Each experiment was documented by photography, written notes, and
diagramming. Each experiment scene was thoroughly processed using generally recognized and
accepted techniques and methods as outlined in NFPA 921 – Guide for Fire and Explosion
Investigations (2008). Specialized scene processing techniques were utilized including, Depth of
Calcination and Heat and Flame Vector Analysis. Scene processing requires special knowledge and
skills gained through years of “dirty-knuckles” scene processing. Therefore, only qualified Certified
Fire and Explosion Investigators (CFEI’s) were utilized to process each scene. Due to space
requirements for this paper, the heat and flame vector analyses, and the depth of calcination and char
studies are available, but are not presented here.
RESULTS
Many of the test parameters are listed in Table 7, including location and size of ventilation
openings, failure of windows, timing of events, and general description for each test. The
thermocouple data for each test is also presented at the end of this paper Figures 24-32. The results
0
20
40
60
80
100
02
04
06
08
01
00
12
01
40
16
01
80
20
02
20
24
02
60
28
03
00
32
03
40
36
03
80
40
04
20
HR
R (
kW)
Time (s)
Calculated Wood Crib HRR
for each test have been provided in a table and represent those key fire effects found in both tests,
unless otherwise noted.
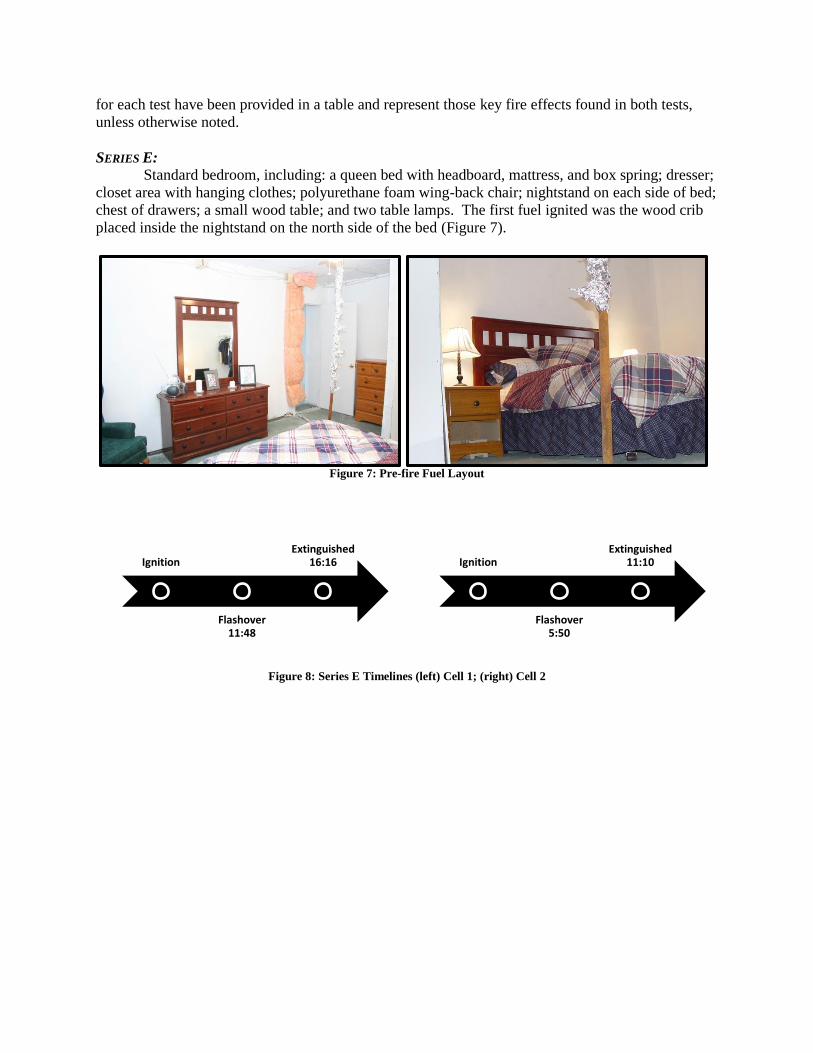
SERIES E:
Standard bedroom, including: a queen bed with headboard, mattress, and box spring; dresser;
closet area with hanging clothes; polyurethane foam wing-back chair; nightstand on each side of bed;
chest of drawers; a small wood table; and two table lamps. The first fuel ignited was the wood crib
placed inside the nightstand on the north side of the bed (Figure 7).
Figure 7: Pre-fire Fuel Layout
Figure 8: Series E Timelines (left) Cell 1; (right) Cell 2
Ignition
Flashover 11:48
Extinguished 16:16 Ignition
Flashover 5:50
Extinguished 11:10
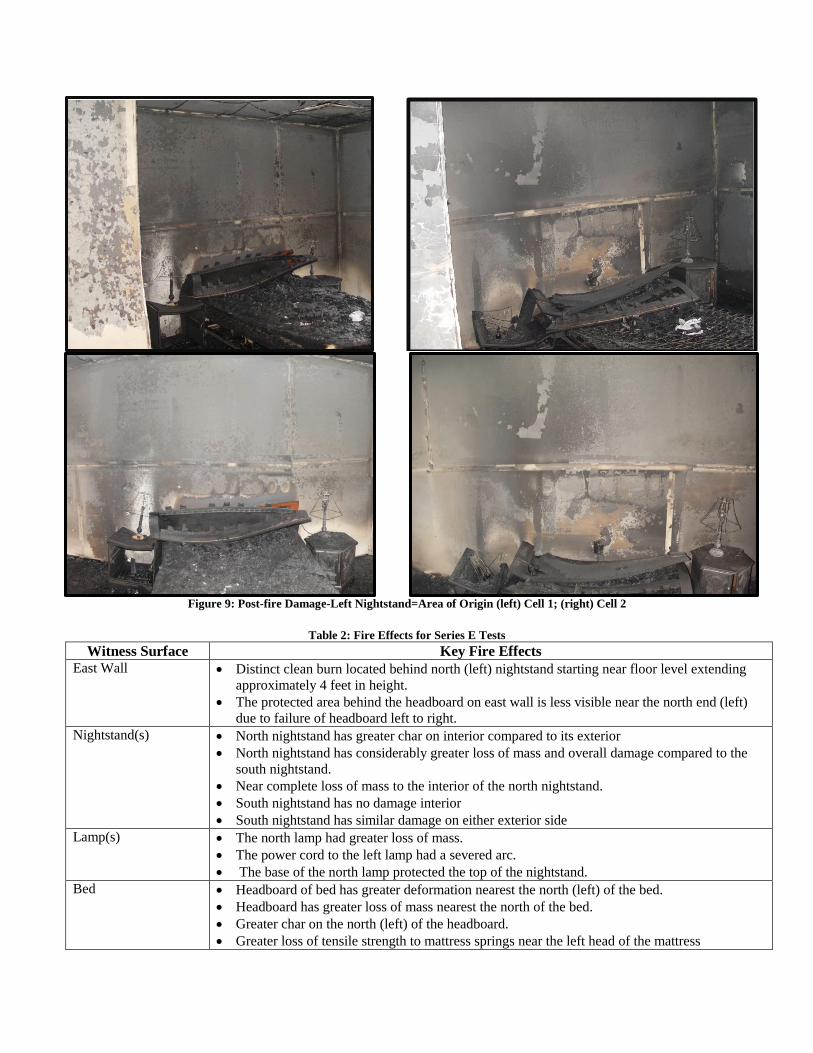
Figure 9: Post-fire Damage-Left Nightstand=Area of Origin (left) Cell 1; (right) Cell 2
Table 2: Fire Effects for Series E Tests
Witness Surface Key Fire Effects
East Wall Distinct clean burn located behind north (left) nightstand starting near floor level extending
approximately 4 feet in height.
The protected area behind the headboard on east wall is less visible near the north end (left)
due to failure of headboard left to right.
Nightstand(s) North nightstand has greater char on interior compared to its exterior
North nightstand has considerably greater loss of mass and overall damage compared to the
south nightstand.
Near complete loss of mass to the interior of the north nightstand.
South nightstand has no damage interior
South nightstand has similar damage on either exterior side
Lamp(s) The north lamp had greater loss of mass.
The power cord to the left lamp had a severed arc.
The base of the north lamp protected the top of the nightstand.
Bed Headboard of bed has greater deformation nearest the north (left) of the bed.
Headboard has greater loss of mass nearest the north of the bed.
Greater char on the north (left) of the headboard.
Greater loss of tensile strength to mattress springs near the left head of the mattress
Greater oxidation near the head of the on north side of bed frame (cell 2)
North Wall West half of wall has greater heat exposure (charring and loss of paper).
Top half of wall has greater damage.
Chest Greater loss of mass and char to top of dresser. Greater char on the front of the chest and
lesser towards back.
West Wall Protected area behind the dresser and the dresser mirror
Greater depth of calcination near south corner above chair.
Dresser Increasing line of demarcation height from front to back on both ends of the dresser
Greater overall damage, including char, at the top of the dresser and lesser at the base.
South Wall Greater calcination around window
Chair Complete loss of mass
Even charring and loss of mass over entire chair.
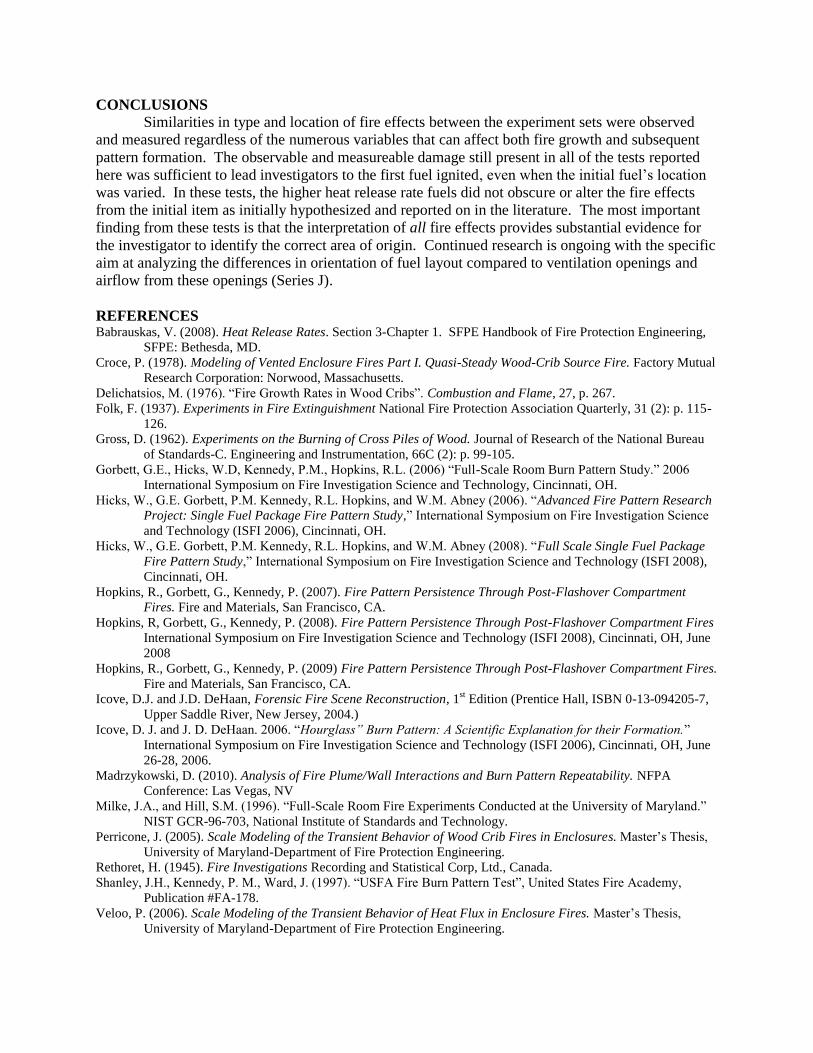
The tests in series E were similar in the type and location of fire effects observed and measured
compared to each other (Table 2). In previous tests when the mattress was ignited directly, a distinct
plume effect was present on the east wall directly above the bed for all four experiments (Gorbett, et.
al., 2006). However, in these two tests, the plume effect was not similarly present, even when the
majority of the mass from the mattress was consumed (Figure 9). The fire effects from the initial
fuel package (wood crib) are still obvious in these two tests, evidenced by the distinct clean burn
damage to the wall behind the nightstand and the directional fire effects on the mattress, headboard,
and box springs all emanating from the north (left) side of the bed. Despite the presence of a high
heat release rate fuel (mattress), the nightstands both show char indicative of the fire originating from
inside the nightstand itself. The fire effects produced from the Series E tests provide substantial data
to substantiate a fire starting in the north (left) nightstand.
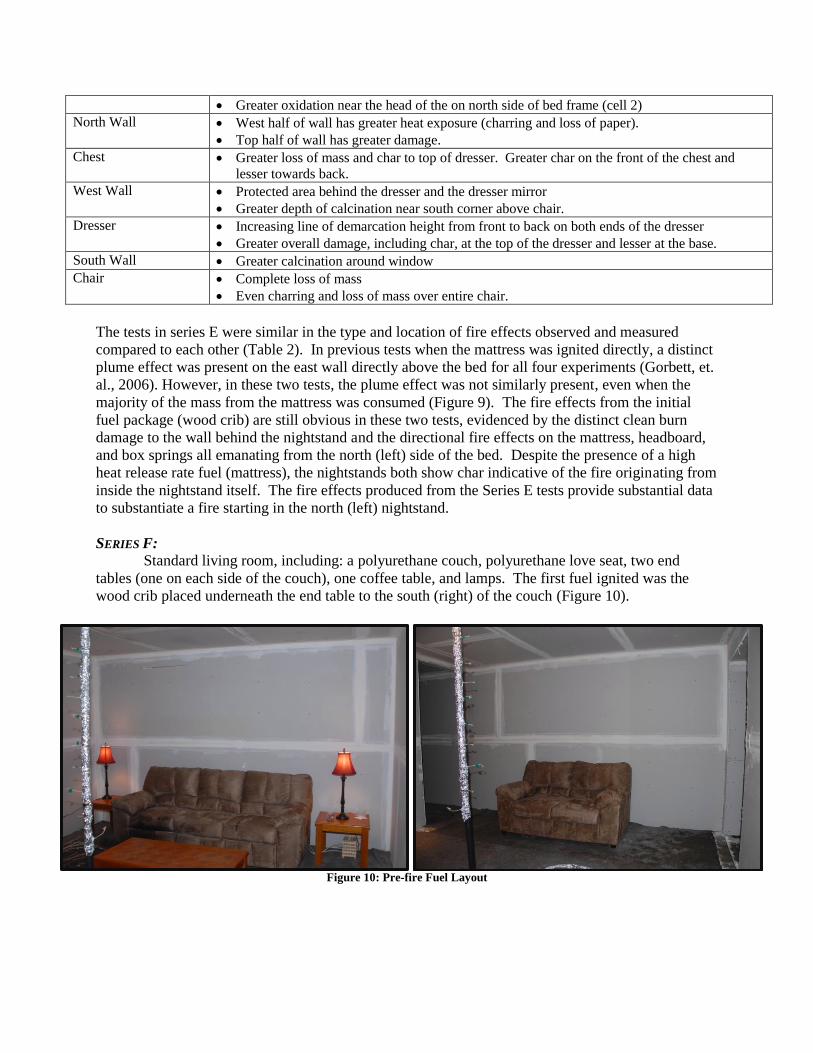
SERIES F:
Standard living room, including: a polyurethane couch, polyurethane love seat, two end
tables (one on each side of the couch), one coffee table, and lamps. The first fuel ignited was the
wood crib placed underneath the end table to the south (right) of the couch (Figure 10).
Figure 10: Pre-fire Fuel Layout
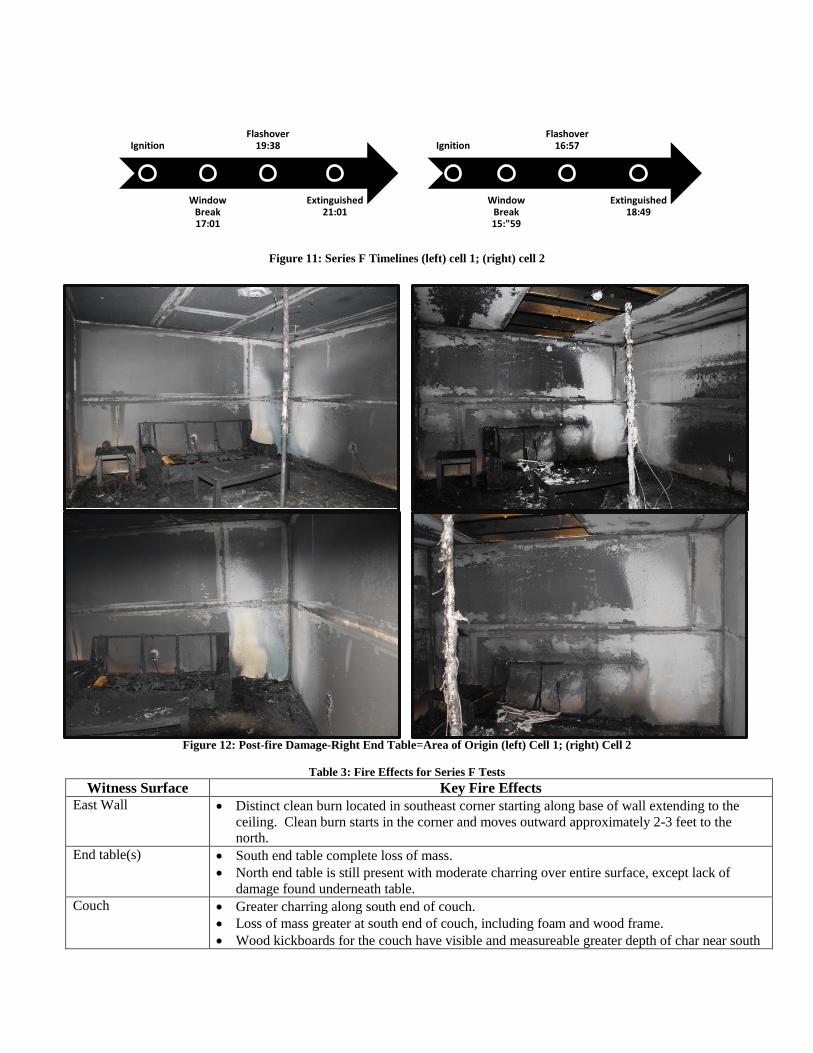
Figure 11: Series F Timelines (left) cell 1; (right) cell 2
Figure 12: Post-fire Damage-Right End Table=Area of Origin (left) Cell 1; (right) Cell 2
Table 3: Fire Effects for Series F Tests
Witness Surface Key Fire Effects
East Wall Distinct clean burn located in southeast corner starting along base of wall extending to the
ceiling. Clean burn starts in the corner and moves outward approximately 2-3 feet to the
north.
End table(s) South end table complete loss of mass.
North end table is still present with moderate charring over entire surface, except lack of
damage found underneath table.
Couch Greater charring along south end of couch.
Loss of mass greater at south end of couch, including foam and wood frame.
Wood kickboards for the couch have visible and measureable greater depth of char near south
Ignition
Window Break 17:01
Flashover 19:38
Extinguished 21:01
Ignition
Window Break 15:"59
Flashover 16:57
Extinguished 18:49
end and lesser moving towards the north.
Coffee Table Greater depth of charring on southeast table leg and trim of table
Table top has greater charring along southeast corner.
North Wall Cell 1-soot deposit over the entire wall
Cell 2-areas of clean burn uniformly over the entire wall
Areas of greater clean burn located near ceiling and near the window and doorway
West Wall Increasing line of demarcation height starting at floor level near door with greatest damage
near door and above the north end (right) of the love seat. Pattern represents the flow of air
over the loveseat
Clean burn located in NW corner near door that extends to above north end (right) of the love
seat.
Love seat Greater loss of mass on north side (right) nearest doorway.
Greater char on the north side (right).
South Wall Increasing line of demarcation between clean burn area and soot deposited areas coming from
the SE corner extending from floor to ceiling.
Ceiling Cell 1-Nearly uniform soot deposited over the entire area, except in SE corner an area of clean
burn exists.
Cell 2-Clean burn relatively uniform over entire area. Greatest depth of calcination is found
in the SE corner with lesser damage in the hallway.
Series F tests were similar in the type and location of fire effects observed and measured compared to
each other (Table 3). The fire effects from the initial fuel package (wood crib) are still obvious in
these two tests, evidenced by the distinct clean burn damage in the SE corner and the directional fire
effects observed and measured on the fuel items surrounding this area (i.e. couch, tables).
In previous tests, the couch was ignited in the center and resulted in a plume shaped clean burn
damage directly above the couch on the east wall (Gorbett, et. al, 2006). Series F tests did not
replicate a similar damage along the east wall above the couch. The fire effects located on the west
wall near the love seat and door were almost identical to the previous tests. The fire effects
produced from the Series F tests provide substantial data to substantiate a fire starting in the corner.
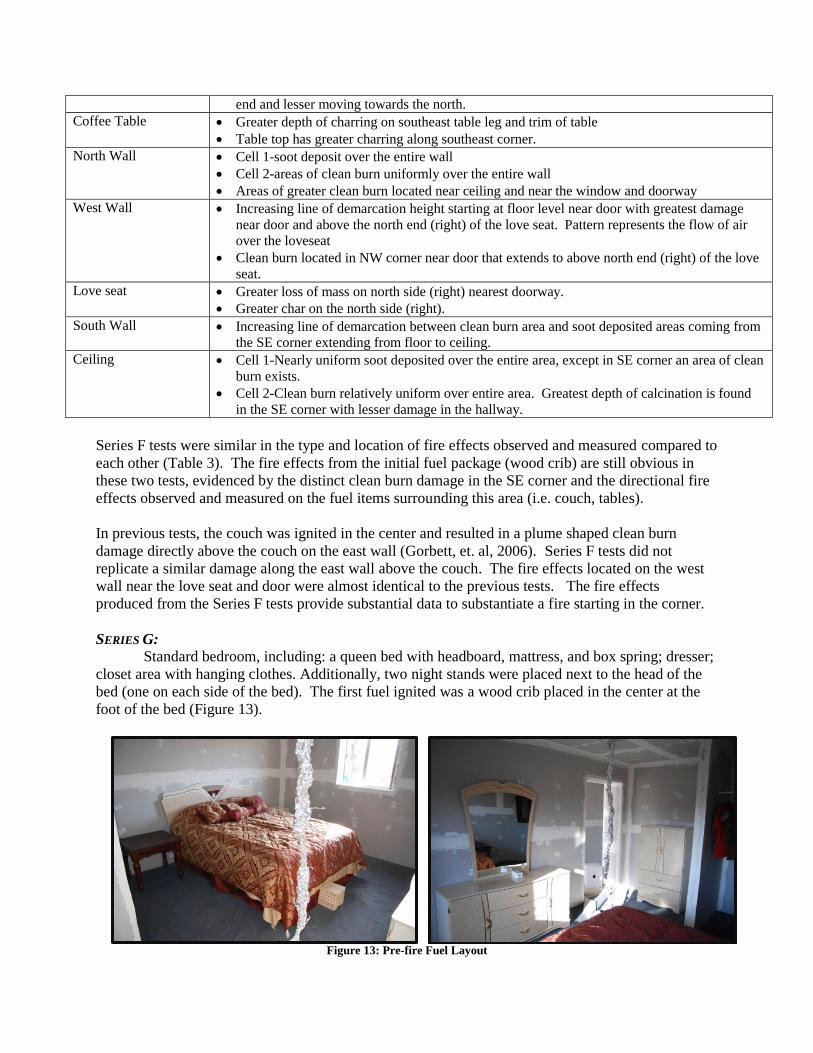
SERIES G:
Standard bedroom, including: a queen bed with headboard, mattress, and box spring; dresser;
closet area with hanging clothes. Additionally, two night stands were placed next to the head of the
bed (one on each side of the bed). The first fuel ignited was a wood crib placed in the center at the
foot of the bed (Figure 13).
Figure 13: Pre-fire Fuel Layout
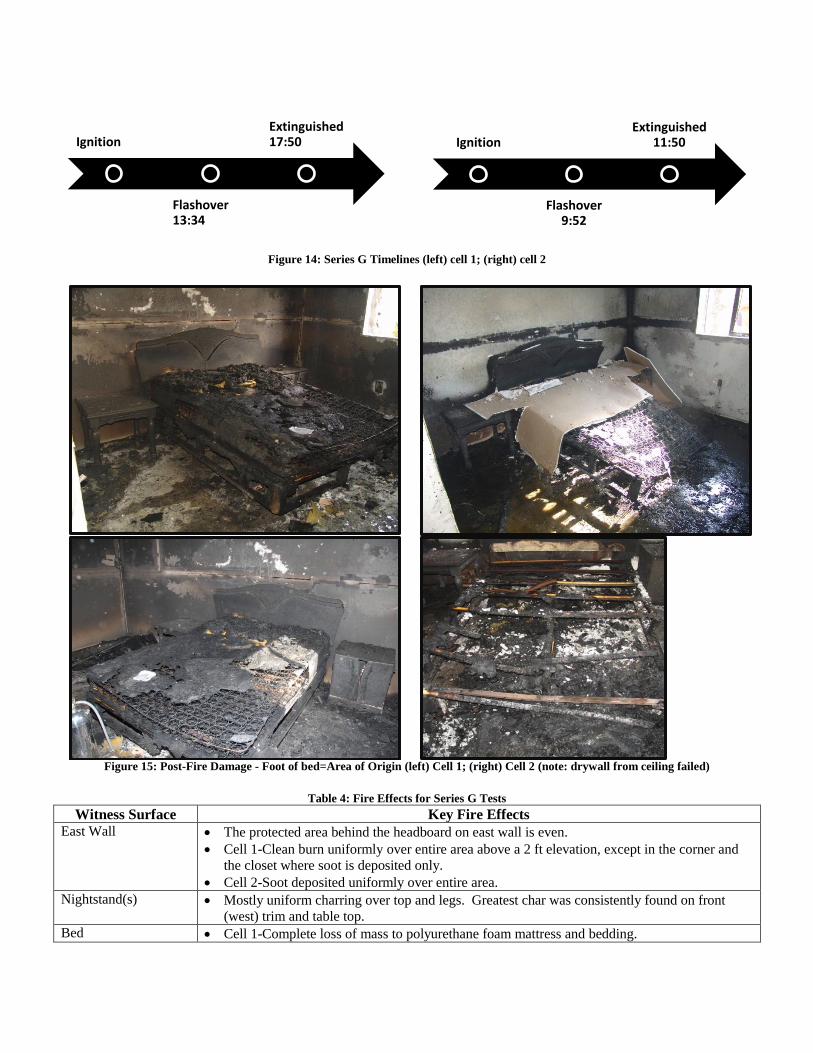
Figure 14: Series G Timelines (left) cell 1; (right) cell 2
Figure 15: Post-Fire Damage - Foot of bed=Area of Origin (left) Cell 1; (right) Cell 2 (note: drywall from ceiling failed)
Table 4: Fire Effects for Series G Tests
Witness Surface Key Fire Effects
East Wall The protected area behind the headboard on east wall is even.
Cell 1-Clean burn uniformly over entire area above a 2 ft elevation, except in the corner and
the closet where soot is deposited only.
Cell 2-Soot deposited uniformly over entire area.
Nightstand(s) Mostly uniform charring over top and legs. Greatest char was consistently found on front
(west) trim and table top.
Bed Cell 1-Complete loss of mass to polyurethane foam mattress and bedding.
Ignition
Flashover 13:34
Extinguished 17:50 Ignition
Flashover 9:52
Extinguished 11:50
Cell 2-Complete loss of mass to the southwest corner of mattress and bedding.
Complete loss of mass of wood box frame at foot of bed.
Greater charring to wood box frame near the foot of the bed with lesser moving towards the
head of the bed.
Cell 1-Loss of tensile strength to springs and collapse of springs at foot of bed.
Even char across entire headboard.
North Wall Lowest damage near doorway: cell 1-soot deposition; cell 2-burning off of craft paper
Uniform line of demarcation approximately 2ft elevation above floor; cell 1-soot deposition;
cell 2: craft paper burned off and greater heating
Chest Greater char on west (left) side compared to east (right) side
Greater to lesser char from top to bottom
Increasing line of demarcation height starting at the front (south) face moving to back
West Wall Uniform protected area where mirror once stood.
Cell 1-Soot uniformly distributed along wall. Soot and heat damage found in SW corner.
Cell 2-Greatest depth of calcination near door and in southwest corner. Area of clean burn
located at floor level in SW corner.
Dresser Greater char from top down on front of dresser
Char found along base trim from center to the south (left) end.
Slightly greater char to south (left) of dresser
Loss of mass/tensile strength of mirror frame
Greater damage found to south side (left) compared to north (right).
Increasing line of demarcation height starting at front face moving back
South Wall Predominately clean burn extending out from window in cell 1; Cell 2 predominantly soot
deposited on the wall
Series G tests were similar in the type and location of fire effects observed and measured between the
two, despite the difference in the duration of burning (Table 4). Moving the initial fuel away from a
boundary surface (i.e. wall) to the base of a large fuel package was expected to cause the obscuration
of the initial fire effects.
Cell 1 did not burn for as long of a duration as Cell 2. Due to this, the fire effects that remained were
easily determined to have emanated from the foot of the bed. Cell 2, on the other hand, was
significantly more involved. The fire effects on all of the walls were similar to those that were
witnessed in previous tests where the fire originate on the bed, especially the plume generated pattern
found on the east wall above the bed. However, the damage to the mattress, box spring, headboard,
and dresser were considerably different from those found in the previous tests. The loss of tensile
strength and collapse of the mattress spring at the foot of the bed, the loss of mass to the foot of the
box spring, and the low level damage to the base of the dresser were not witnessed in the previous
tests.
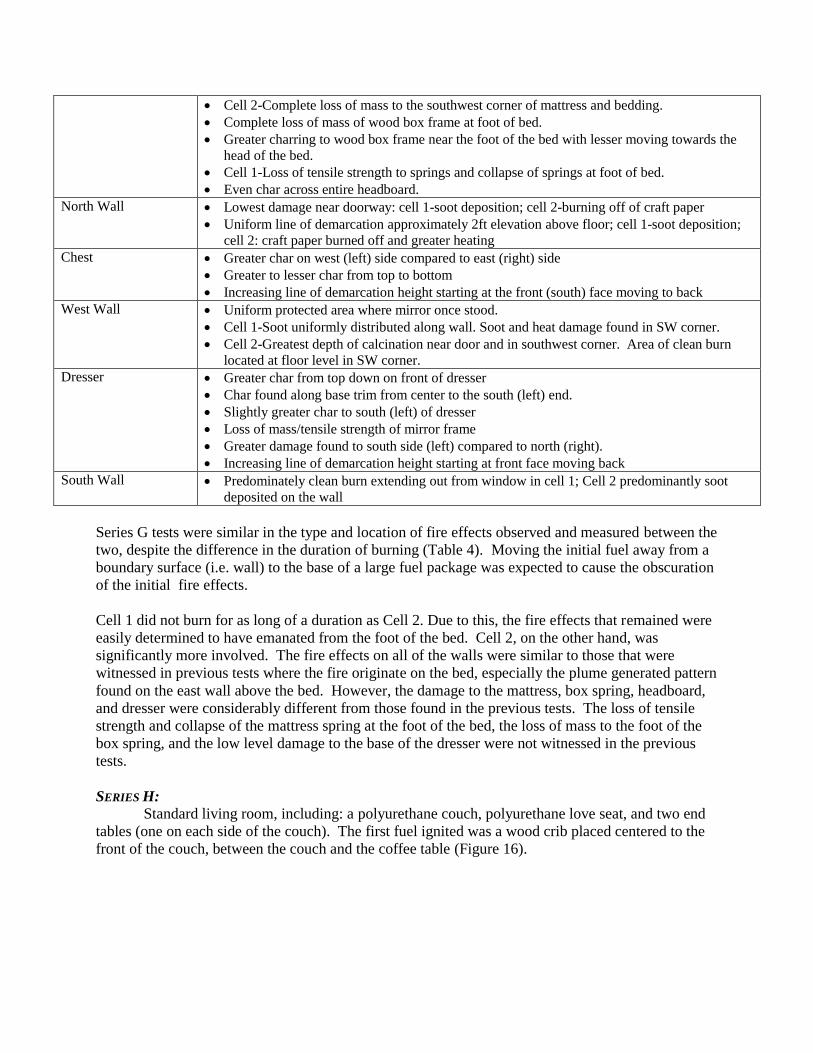
SERIES H:
Standard living room, including: a polyurethane couch, polyurethane love seat, and two end
tables (one on each side of the couch). The first fuel ignited was a wood crib placed centered to the
front of the couch, between the couch and the coffee table (Figure 16).
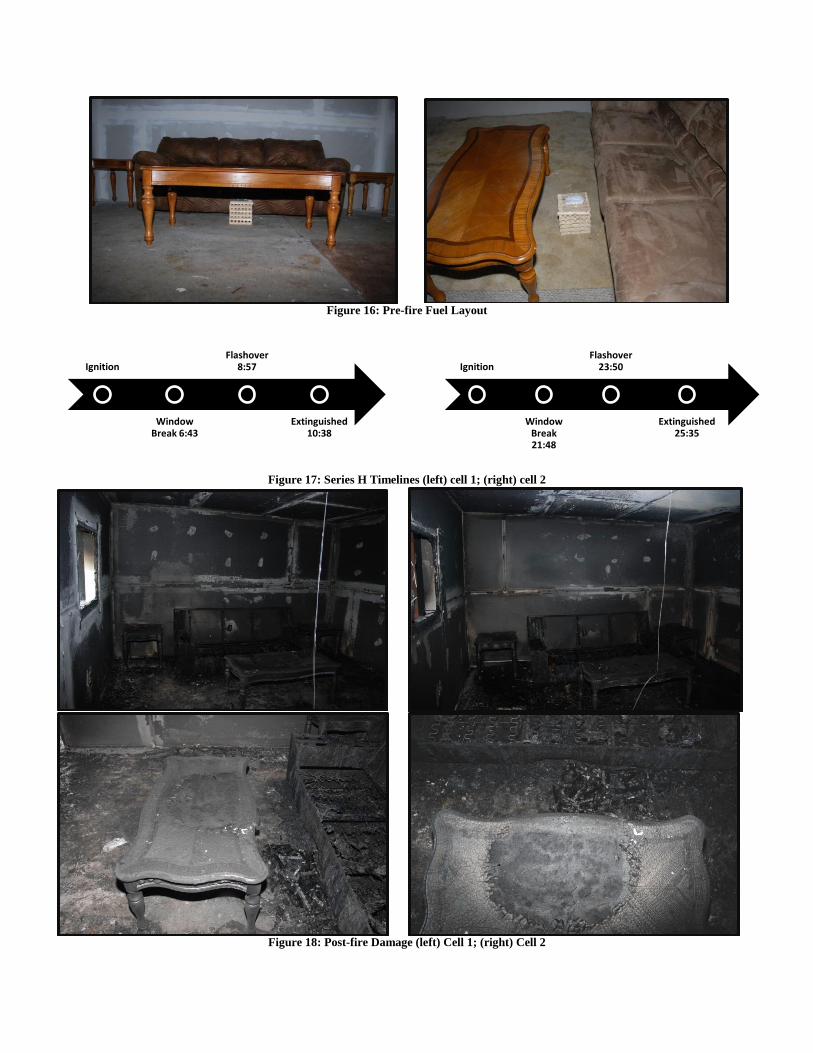
Figure 16: Pre-fire Fuel Layout
Figure 17: Series H Timelines (left) cell 1; (right) cell 2
Figure 18: Post-fire Damage (left) Cell 1; (right) Cell 2
Ignition
Window Break 6:43
Flashover 8:57
Extinguished 10:38
Ignition
Window Break 21:48
Flashover 23:50
Extinguished 25:35
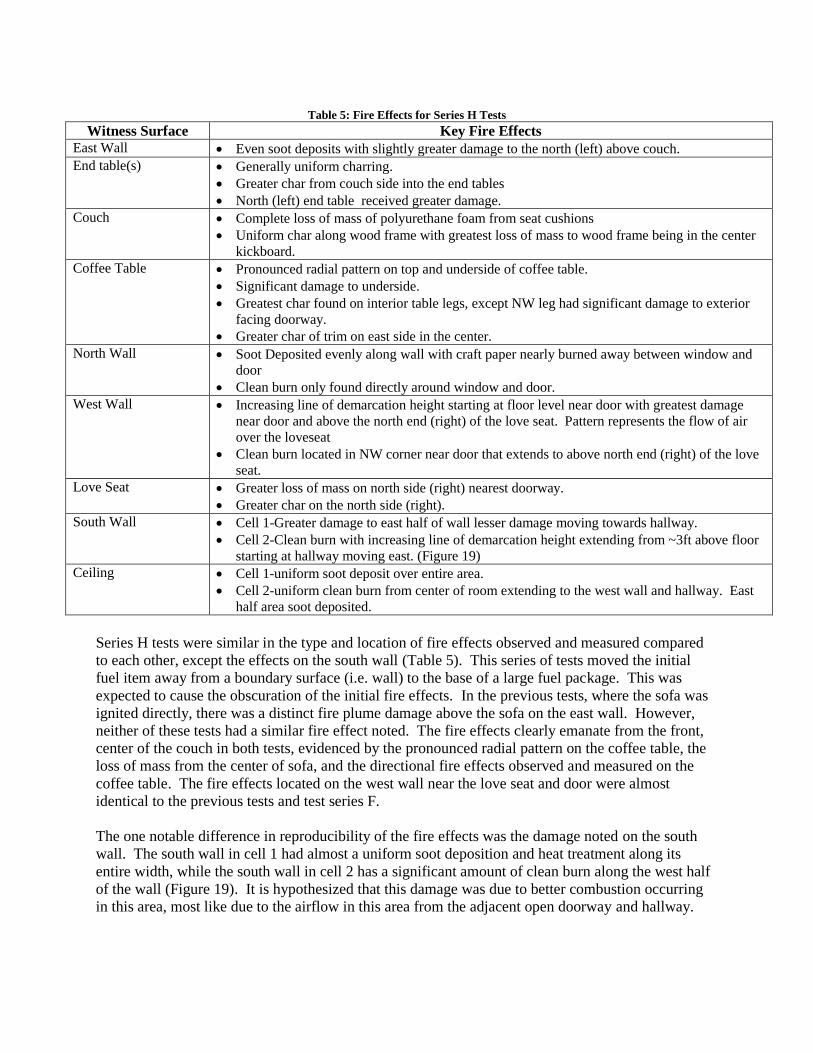
Table 5: Fire Effects for Series H Tests
Witness Surface Key Fire Effects
East Wall Even soot deposits with slightly greater damage to the north (left) above couch.
End table(s) Generally uniform charring.
Greater char from couch side into the end tables
North (left) end table received greater damage.
Couch Complete loss of mass of polyurethane foam from seat cushions
Uniform char along wood frame with greatest loss of mass to wood frame being in the center
kickboard.
Coffee Table Pronounced radial pattern on top and underside of coffee table.
Significant damage to underside.
Greatest char found on interior table legs, except NW leg had significant damage to exterior
facing doorway.
Greater char of trim on east side in the center.
North Wall Soot Deposited evenly along wall with craft paper nearly burned away between window and
door
Clean burn only found directly around window and door.
West Wall Increasing line of demarcation height starting at floor level near door with greatest damage
near door and above the north end (right) of the love seat. Pattern represents the flow of air
over the loveseat
Clean burn located in NW corner near door that extends to above north end (right) of the love
seat.
Love Seat Greater loss of mass on north side (right) nearest doorway.
Greater char on the north side (right).
South Wall Cell 1-Greater damage to east half of wall lesser damage moving towards hallway.
Cell 2-Clean burn with increasing line of demarcation height extending from ~3ft above floor
starting at hallway moving east. (Figure 19)
Ceiling Cell 1-uniform soot deposit over entire area.
Cell 2-uniform clean burn from center of room extending to the west wall and hallway. East
half area soot deposited.
Series H tests were similar in the type and location of fire effects observed and measured compared
to each other, except the effects on the south wall (Table 5). This series of tests moved the initial
fuel item away from a boundary surface (i.e. wall) to the base of a large fuel package. This was
expected to cause the obscuration of the initial fire effects. In the previous tests, where the sofa was
ignited directly, there was a distinct fire plume damage above the sofa on the east wall. However,
neither of these tests had a similar fire effect noted. The fire effects clearly emanate from the front,
center of the couch in both tests, evidenced by the pronounced radial pattern on the coffee table, the
loss of mass from the center of sofa, and the directional fire effects observed and measured on the
coffee table. The fire effects located on the west wall near the love seat and door were almost
identical to the previous tests and test series F.
The one notable difference in reproducibility of the fire effects was the damage noted on the south
wall. The south wall in cell 1 had almost a uniform soot deposition and heat treatment along its
entire width, while the south wall in cell 2 has a significant amount of clean burn along the west half
of the wall (Figure 19). It is hypothesized that this damage was due to better combustion occurring
in this area, most like due to the airflow in this area from the adjacent open doorway and hallway.
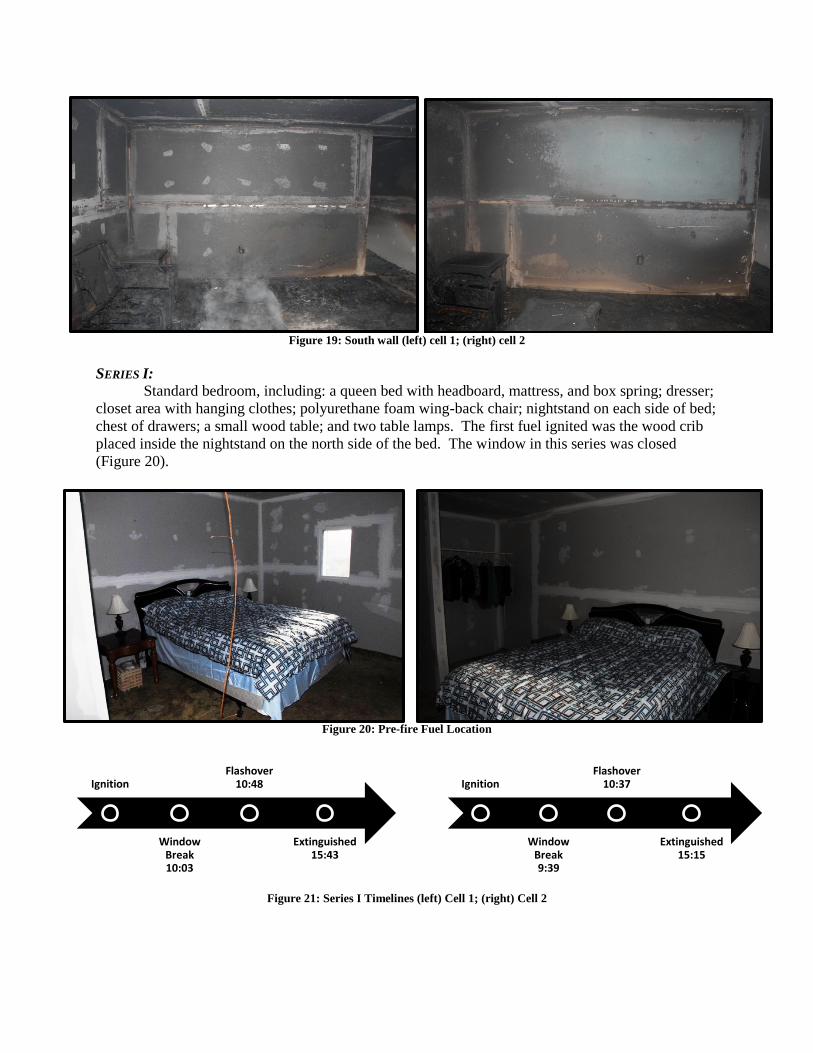
Figure 19: South wall (left) cell 1; (right) cell 2
SERIES I:
Standard bedroom, including: a queen bed with headboard, mattress, and box spring; dresser;
closet area with hanging clothes; polyurethane foam wing-back chair; nightstand on each side of bed;
chest of drawers; a small wood table; and two table lamps. The first fuel ignited was the wood crib
placed inside the nightstand on the north side of the bed. The window in this series was closed
(Figure 20).
Figure 20: Pre-fire Fuel Location
Figure 21: Series I Timelines (left) Cell 1; (right) Cell 2
Ignition
Window Break 10:03
Flashover 10:48
Extinguished 15:43
Ignition
Window Break 9:39
Flashover 10:37
Extinguished 15:15
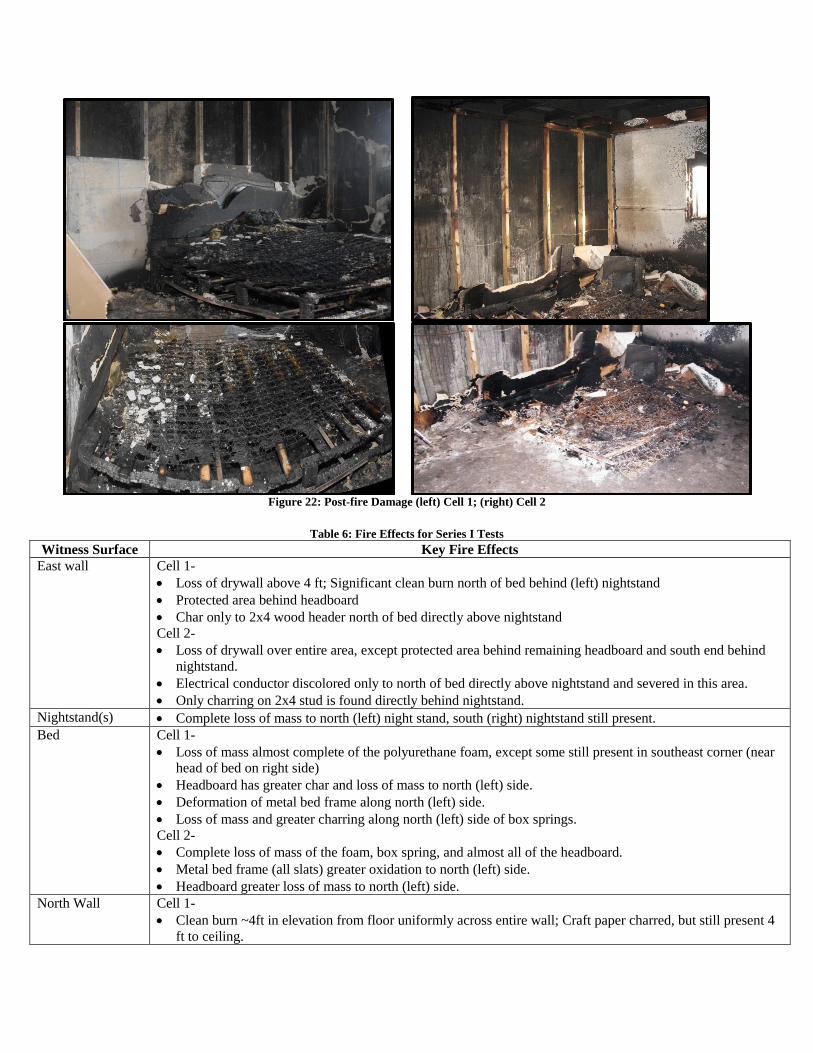
Figure 22: Post-fire Damage (left) Cell 1; (right) Cell 2
Table 6: Fire Effects for Series I Tests
Witness Surface Key Fire Effects
East wall Cell 1-
Loss of drywall above 4 ft; Significant clean burn north of bed behind (left) nightstand
Protected area behind headboard
Char only to 2x4 wood header north of bed directly above nightstand
Cell 2-
Loss of drywall over entire area, except protected area behind remaining headboard and south end behind
nightstand.
Electrical conductor discolored only to north of bed directly above nightstand and severed in this area.
Only charring on 2x4 stud is found directly behind nightstand.
Nightstand(s) Complete loss of mass to north (left) night stand, south (right) nightstand still present.
Bed Cell 1-
Loss of mass almost complete of the polyurethane foam, except some still present in southeast corner (near
head of bed on right side)
Headboard has greater char and loss of mass to north (left) side.
Deformation of metal bed frame along north (left) side.
Loss of mass and greater charring along north (left) side of box springs.
Cell 2-
Complete loss of mass of the foam, box spring, and almost all of the headboard.
Metal bed frame (all slats) greater oxidation to north (left) side.
Headboard greater loss of mass to north (left) side.
North Wall Cell 1-
Clean burn ~4ft in elevation from floor uniformly across entire wall; Craft paper charred, but still present 4
ft to ceiling.
Cell 2-
Clean burn over entire area. Soot deposition in NW corner; Protected area behind chest
Chest Cell 1-
Greater char at top and lesser at the base.
Increasing line of demarcation height starting at the front (south) face moving to back
Cell 2-
Greater damage right to left.
Complete loss of integrity with almost even charring from top to base.
West Wall Cell 1-
Uniform protected area where mirror once stood.
Cell 2-
Lowest clean burn near door; Uniform damage to craft paper consumed and clean burn above 3 ft elevation.
Dresser Cell 1-
Greater loss of mass (to laminate) of wood facia from north side (right) moving to the south side (left)
Protected area behind mirror
Increasing line of demarcation height starting at front face moving back
Cell 2-
Loss of both doors. Protected area behind mirror gone; Greater char top down
South Wall Cell 1-
Suppression damage in SE corner; Loss of craft paper total east half, lesser towards west wall.
Cell 2-
Clean burn and depth of calcination greatest in SE corner and around window.
Ceiling Cell 2-
Depth of char greatest to north side of bed lesser moving outward.
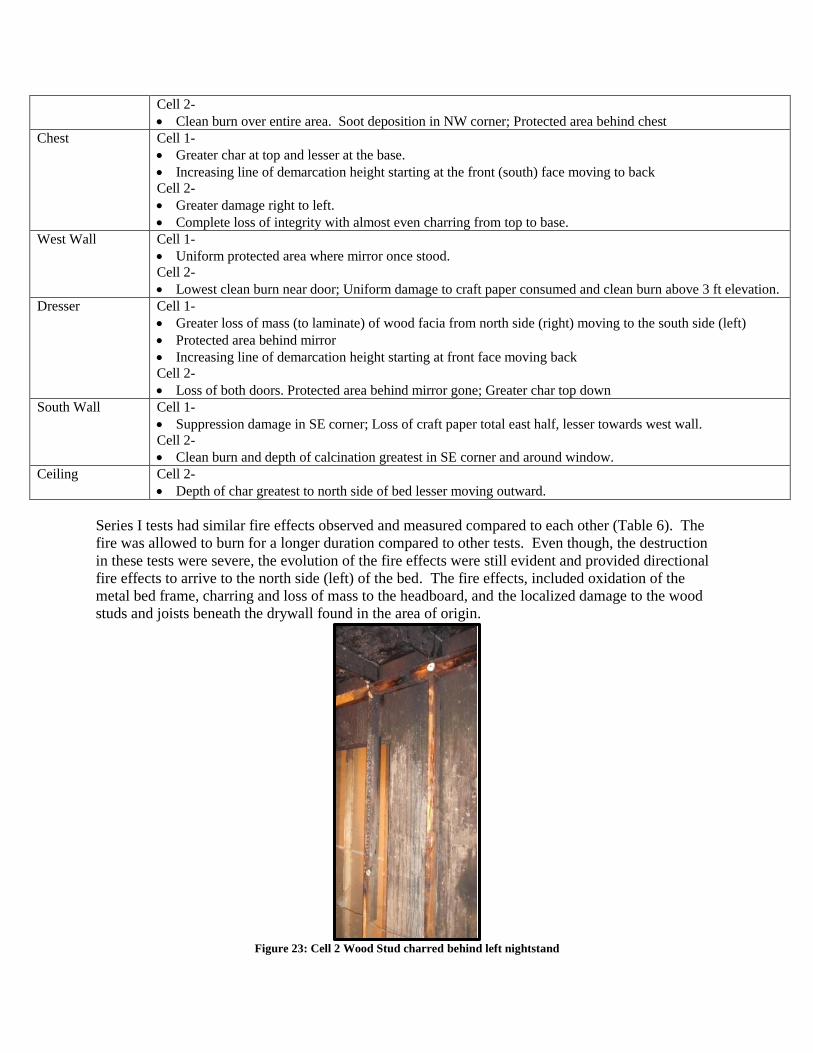
Series I tests had similar fire effects observed and measured compared to each other (Table 6). The
fire was allowed to burn for a longer duration compared to other tests. Even though, the destruction
in these tests were severe, the evolution of the fire effects were still evident and provided directional
fire effects to arrive to the north side (left) of the bed. The fire effects, included oxidation of the
metal bed frame, charring and loss of mass to the headboard, and the localized damage to the wood
studs and joists beneath the drywall found in the area of origin.
Figure 23: Cell 2 Wood Stud charred behind left nightstand
CONCLUSIONS
Similarities in type and location of fire effects between the experiment sets were observed
and measured regardless of the numerous variables that can affect both fire growth and subsequent
pattern formation. The observable and measureable damage still present in all of the tests reported
here was sufficient to lead investigators to the first fuel ignited, even when the initial fuel’s location
was varied. In these tests, the higher heat release rate fuels did not obscure or alter the fire effects
from the initial item as initially hypothesized and reported on in the literature. The most important
finding from these tests is that the interpretation of all fire effects provides substantial evidence for
the investigator to identify the correct area of origin. Continued research is ongoing with the specific
aim at analyzing the differences in orientation of fuel layout compared to ventilation openings and
airflow from these openings (Series J).
REFERENCES Babrauskas, V. (2008). Heat Release Rates. Section 3-Chapter 1. SFPE Handbook of Fire Protection Engineering,
SFPE: Bethesda, MD.
Croce, P. (1978). Modeling of Vented Enclosure Fires Part I. Quasi-Steady Wood-Crib Source Fire. Factory Mutual
Research Corporation: Norwood, Massachusetts.
Delichatsios, M. (1976). “Fire Growth Rates in Wood Cribs”. Combustion and Flame, 27, p. 267.
Folk, F. (1937). Experiments in Fire Extinguishment National Fire Protection Association Quarterly, 31 (2): p. 115-
126.
Gross, D. (1962). Experiments on the Burning of Cross Piles of Wood. Journal of Research of the National Bureau
of Standards-C. Engineering and Instrumentation, 66C (2): p. 99-105.
Gorbett, G.E., Hicks, W.D, Kennedy, P.M., Hopkins, R.L. (2006) “Full-Scale Room Burn Pattern Study.” 2006
International Symposium on Fire Investigation Science and Technology, Cincinnati, OH.
Hicks, W., G.E. Gorbett, P.M. Kennedy, R.L. Hopkins, and W.M. Abney (2006). “Advanced Fire Pattern Research
Project: Single Fuel Package Fire Pattern Study,” International Symposium on Fire Investigation Science
and Technology (ISFI 2006), Cincinnati, OH.
Hicks, W., G.E. Gorbett, P.M. Kennedy, R.L. Hopkins, and W.M. Abney (2008). “Full Scale Single Fuel Package
Fire Pattern Study,” International Symposium on Fire Investigation Science and Technology (ISFI 2008),
Cincinnati, OH.
Hopkins, R., Gorbett, G., Kennedy, P. (2007). Fire Pattern Persistence Through Post-Flashover Compartment
Fires. Fire and Materials, San Francisco, CA.
Hopkins, R, Gorbett, G., Kennedy, P. (2008). Fire Pattern Persistence Through Post-Flashover Compartment Fires
International Symposium on Fire Investigation Science and Technology (ISFI 2008), Cincinnati, OH, June
2008
Hopkins, R., Gorbett, G., Kennedy, P. (2009) Fire Pattern Persistence Through Post-Flashover Compartment Fires.
Fire and Materials, San Francisco, CA.
Icove, D.J. and J.D. DeHaan, Forensic Fire Scene Reconstruction, 1st Edition (Prentice Hall, ISBN 0-13-094205-7,
Upper Saddle River, New Jersey, 2004.)
Icove, D. J. and J. D. DeHaan. 2006. “Hourglass” Burn Pattern: A Scientific Explanation for their Formation.”
International Symposium on Fire Investigation Science and Technology (ISFI 2006), Cincinnati, OH, June
26-28, 2006.
Madrzykowski, D. (2010). Analysis of Fire Plume/Wall Interactions and Burn Pattern Repeatability. NFPA
Conference: Las Vegas, NV
Milke, J.A., and Hill, S.M. (1996). “Full-Scale Room Fire Experiments Conducted at the University of Maryland.”
NIST GCR-96-703, National Institute of Standards and Technology.
Perricone, J. (2005). Scale Modeling of the Transient Behavior of Wood Crib Fires in Enclosures. Master’s Thesis,
University of Maryland-Department of Fire Protection Engineering.
Rethoret, H. (1945). Fire Investigations Recording and Statistical Corp, Ltd., Canada.
Shanley, J.H., Kennedy, P. M., Ward, J. (1997). “USFA Fire Burn Pattern Test”, United States Fire Academy,
Publication #FA-178.
Veloo, P. (2006). Scale Modeling of the Transient Behavior of Heat Flux in Enclosure Fires. Master’s Thesis,
University of Maryland-Department of Fire Protection Engineering.
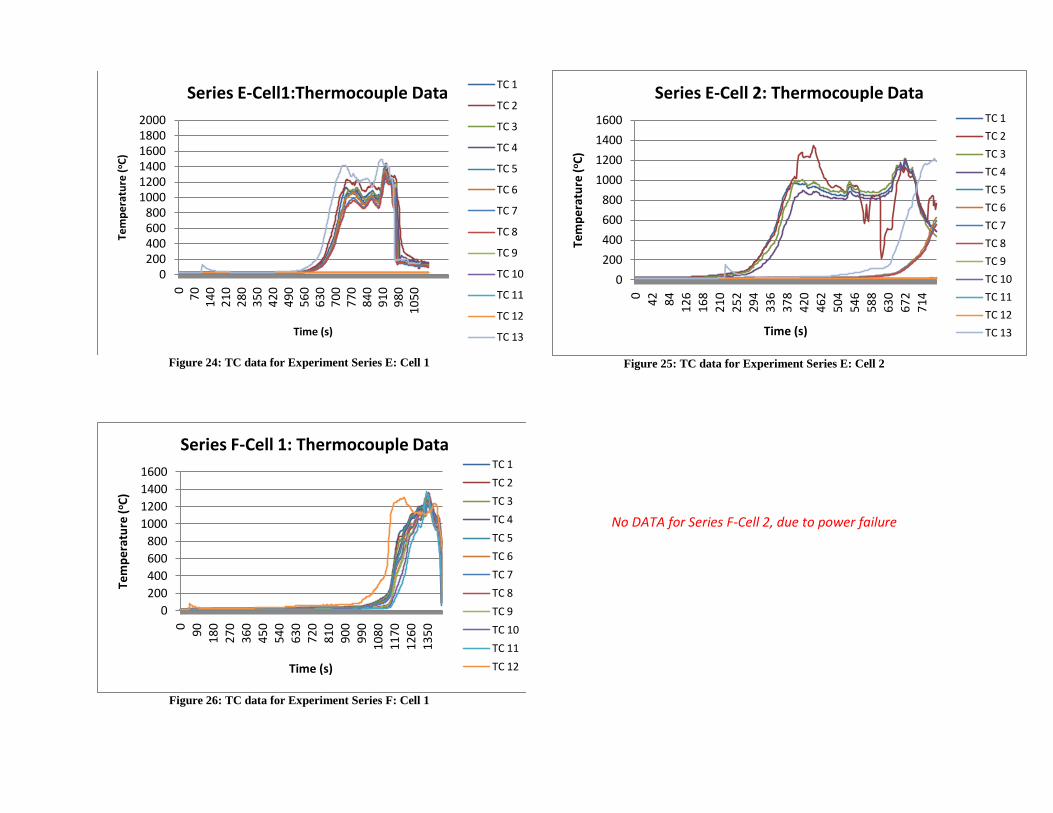
Figure 24: TC data for Experiment Series E: Cell 1
Figure 26: TC data for Experiment Series F: Cell 1
Figure 25: TC data for Experiment Series E: Cell 2
No DATA for Series F-Cell 2, due to power failure
0200400600800
100012001400160018002000
07
01
40
21
02
80
35
04
20
49
05
60
63
07
00
77
08
40
91
09
80
10
50
Tem
pe
ratu
re (
oC
)
Time (s)
Series E-Cell1:Thermocouple DataTC 1
TC 2
TC 3
TC 4
TC 5
TC 6
TC 7
TC 8
TC 9
TC 10
TC 11
TC 12
TC 13
0
200
400
600
800
1000
1200
1400
1600
09
01
80
27
03
60
45
05
40
63
07
20
81
09
00
99
01
08
01
17
01
26
01
35
0
Tem
pe
ratu
re (
oC
)
Time (s)
Series F-Cell 1: Thermocouple DataTC 1
TC 2
TC 3
TC 4
TC 5
TC 6
TC 7
TC 8
TC 9
TC 10
TC 11
TC 12
0
200
400
600
800
1000
1200
1400
1600
0
42
84
12
6
16
8
21
0
25
2
29
4
33
6
37
8
42
0
46
2
50
4
54
6
58
8
63
0
67
2
71
4
Tem
pe
ratu
re (
oC
)
Time (s)
Series E-Cell 2: Thermocouple DataTC 1
TC 2
TC 3
TC 4
TC 5
TC 6
TC 7
TC 8
TC 9
TC 10
TC 11
TC 12
TC 13
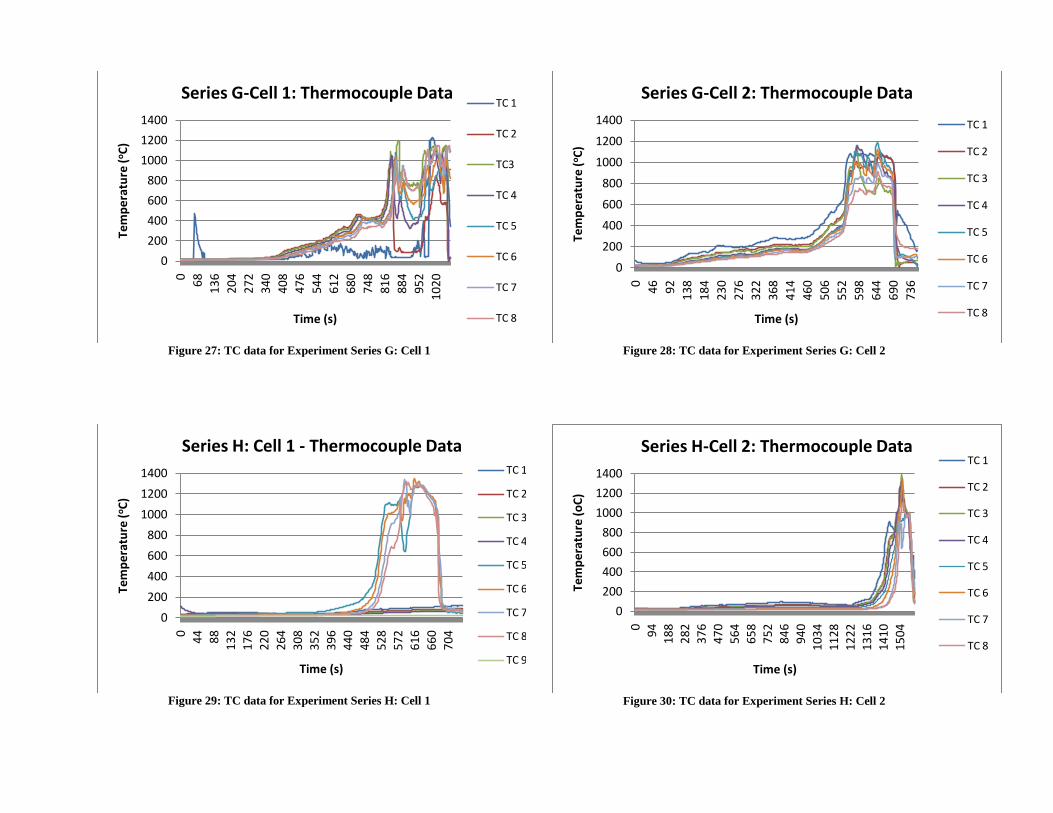
Figure 27: TC data for Experiment Series G: Cell 1
Figure 29: TC data for Experiment Series H: Cell 1
Figure 28: TC data for Experiment Series G: Cell 2
Figure 30: TC data for Experiment Series H: Cell 2
0
200
400
600
800
1000
1200
1400
0
68
13
6
20
4
27
2
34
0
40
8
47
6
54
4
61
2
68
0
74
8
81
6
88
4
95
2
10
20
Tem
pe
ratu
re (
oC
)
Time (s)
Series G-Cell 1: Thermocouple DataTC 1
TC 2
TC3
TC 4
TC 5
TC 6
TC 7
TC 8
0
200
400
600
800
1000
1200
1400
0
44
88
13
2
17
6
22
0
26
4
30
8
35
2
39
6
44
0
48
4
52
8
57
2
61
6
66
0
70
4
Tem
pe
ratu
re (
oC
)
Time (s)
Series H: Cell 1 - Thermocouple DataTC 1
TC 2
TC 3
TC 4
TC 5
TC 6
TC 7
TC 8
TC 9
0
200
400
600
800
1000
1200
1400
0
46
92
13
8
18
4
23
0
27
6
32
2
36
8
41
4
46
0
50
6
55
2
59
8
64
4
69
0
73
6
Tem
pe
ratu
re (
oC
)
Time (s)
Series G-Cell 2: Thermocouple Data
TC 1
TC 2
TC 3
TC 4
TC 5
TC 6
TC 7
TC 8
0
200
400
600
800
1000
1200
1400
0
94
18
82
82
37
64
70
56
4
65
87
52
84
6
94
01
03
41
12
8
12
22
13
16
14
10
15
04
Tem
pe
ratu
re (
oC
)
Time (s)
Series H-Cell 2: Thermocouple DataTC 1
TC 2
TC 3
TC 4
TC 5
TC 6
TC 7
TC 8
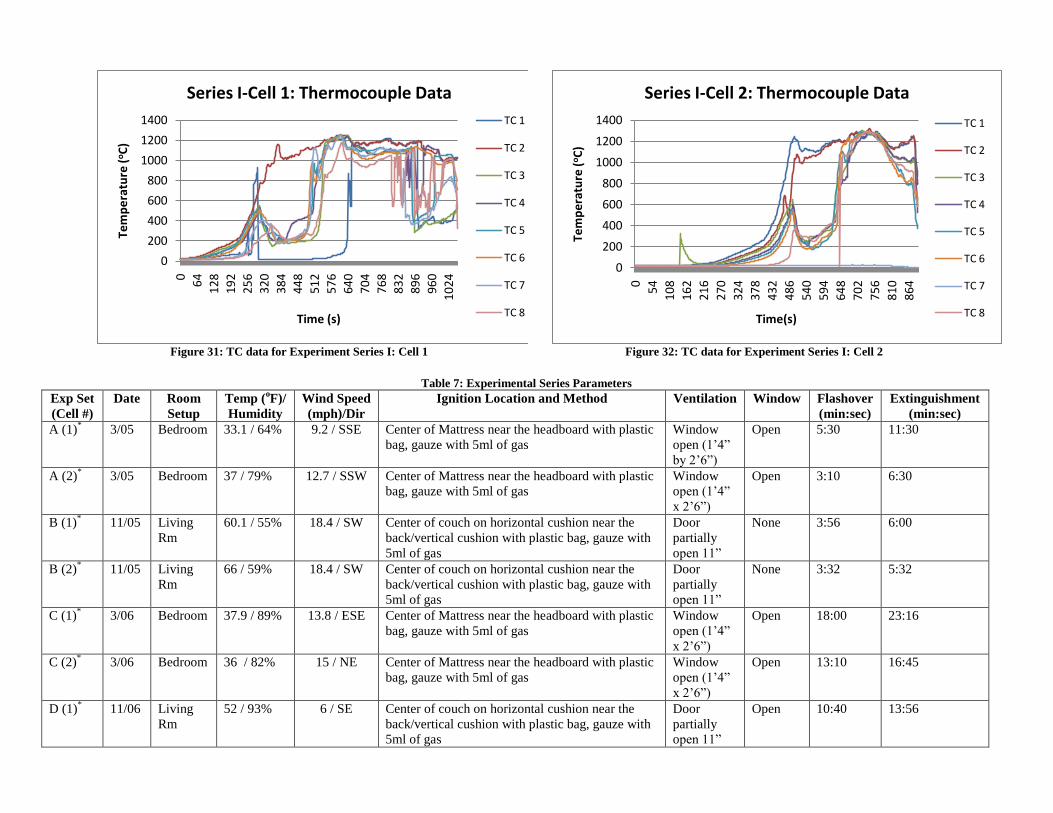
Figure 31: TC data for Experiment Series I: Cell 1
Figure 32: TC data for Experiment Series I: Cell 2
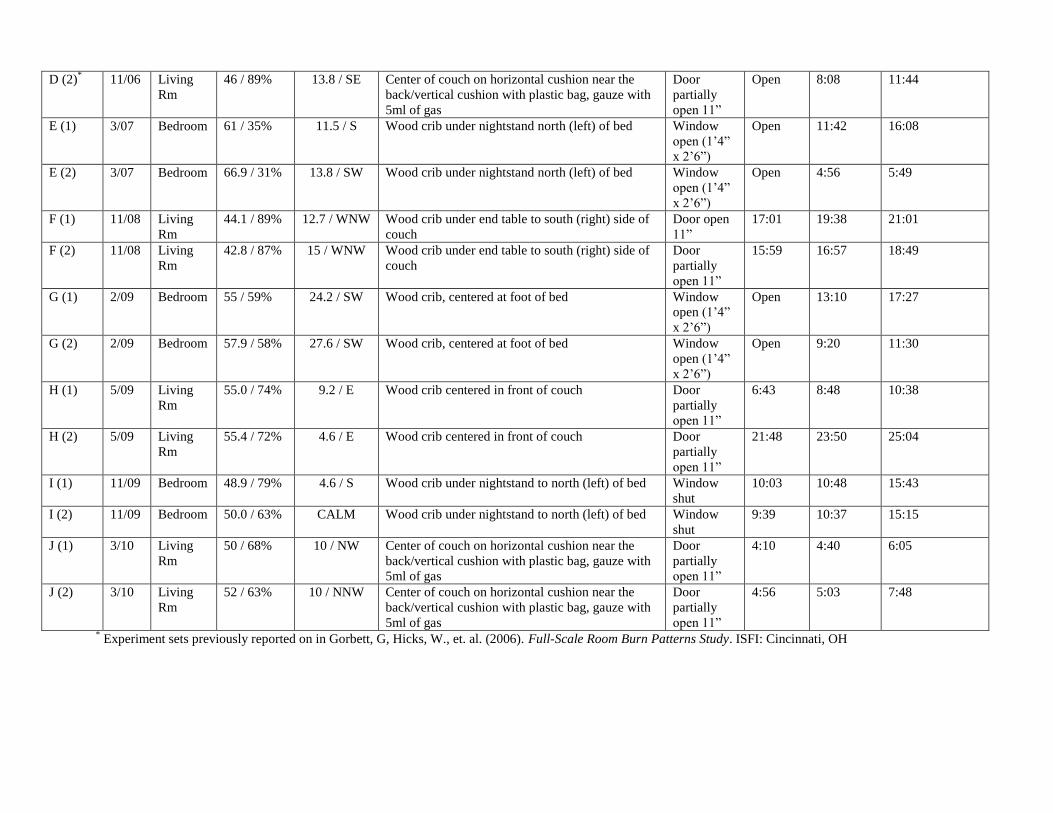
Table 7: Experimental Series Parameters
Exp Set
(Cell #)
Date Room
Setup
Temp (oF)/
Humidity
Wind Speed
(mph)/Dir
Ignition Location and Method Ventilation Window Flashover
(min:sec)
Extinguishment
(min:sec)
A (1)*
3/05 Bedroom 33.1 / 64% 9.2 / SSE Center of Mattress near the headboard with plastic
bag, gauze with 5ml of gas
Window
open (1’4”
by 2’6”)
Open 5:30 11:30
A (2)*
3/05 Bedroom 37 / 79% 12.7 / SSW Center of Mattress near the headboard with plastic
bag, gauze with 5ml of gas
Window
open (1’4”
x 2’6”)
Open 3:10 6:30
B (1)*
11/05 Living
Rm
60.1 / 55% 18.4 / SW Center of couch on horizontal cushion near the
back/vertical cushion with plastic bag, gauze with
5ml of gas
Door
partially
open 11”
None 3:56 6:00
B (2)*
11/05 Living
Rm
66 / 59% 18.4 / SW Center of couch on horizontal cushion near the
back/vertical cushion with plastic bag, gauze with
5ml of gas
Door
partially
open 11”
None 3:32 5:32
C (1)*
3/06 Bedroom 37.9 / 89% 13.8 / ESE Center of Mattress near the headboard with plastic
bag, gauze with 5ml of gas
Window
open (1’4”
x 2’6”)
Open 18:00 23:16
C (2)*
3/06 Bedroom 36 / 82% 15 / NE Center of Mattress near the headboard with plastic
bag, gauze with 5ml of gas
Window
open (1’4”
x 2’6”)
Open 13:10 16:45
D (1)*
11/06 Living
Rm
52 / 93% 6 / SE Center of couch on horizontal cushion near the
back/vertical cushion with plastic bag, gauze with
5ml of gas
Door
partially
open 11”
Open 10:40 13:56
0
200
400
600
800
1000
1200
1400
0
64
12
8
19
2
25
6
32
0
38
4
44
8
51
2
57
6
64
0
70
4
76
8
83
2
89
6
96
0
10
24
Tem
pe
ratu
re (
oC
)
Time (s)
Series I-Cell 1: Thermocouple Data
TC 1
TC 2
TC 3
TC 4
TC 5
TC 6
TC 7
TC 8
0
200
400
600
800
1000
1200
1400
0
54
10
8
16
2
21
6
27
0
32
4
37
8
43
2
48
6
54
0
59
4
64
8
70
2
75
6
81
0
86
4
Tem
pe
ratu
re (
oC
)
Time(s)
Series I-Cell 2: Thermocouple Data
TC 1
TC 2
TC 3
TC 4
TC 5
TC 6
TC 7
TC 8
D (2)*
11/06 Living
Rm
46 / 89% 13.8 / SE Center of couch on horizontal cushion near the
back/vertical cushion with plastic bag, gauze with
5ml of gas
Door
partially
open 11”
Open 8:08 11:44
E (1) 3/07 Bedroom 61 / 35% 11.5 / S Wood crib under nightstand north (left) of bed Window
open (1’4”
x 2’6”)
Open 11:42 16:08
E (2) 3/07 Bedroom 66.9 / 31% 13.8 / SW Wood crib under nightstand north (left) of bed Window
open (1’4”
x 2’6”)
Open 4:56 5:49
F (1) 11/08 Living
Rm
44.1 / 89% 12.7 / WNW Wood crib under end table to south (right) side of
couch
Door open
11”
17:01 19:38 21:01
F (2) 11/08 Living
Rm
42.8 / 87% 15 / WNW Wood crib under end table to south (right) side of
couch
Door
partially
open 11”
15:59 16:57 18:49
G (1) 2/09 Bedroom 55 / 59% 24.2 / SW Wood crib, centered at foot of bed Window
open (1’4”
x 2’6”)
Open 13:10 17:27
G (2) 2/09 Bedroom 57.9 / 58% 27.6 / SW Wood crib, centered at foot of bed Window
open (1’4”
x 2’6”)
Open 9:20 11:30
H (1) 5/09 Living
Rm
55.0 / 74% 9.2 / E Wood crib centered in front of couch Door
partially
open 11”
6:43 8:48 10:38
H (2) 5/09 Living
Rm
55.4 / 72% 4.6 / E Wood crib centered in front of couch Door
partially
open 11”
21:48 23:50 25:04
I (1) 11/09 Bedroom 48.9 / 79% 4.6 / S Wood crib under nightstand to north (left) of bed Window
shut
10:03 10:48 15:43
I (2) 11/09 Bedroom 50.0 / 63% CALM Wood crib under nightstand to north (left) of bed Window
shut
9:39 10:37 15:15
J (1) 3/10 Living
Rm
50 / 68% 10 / NW Center of couch on horizontal cushion near the
back/vertical cushion with plastic bag, gauze with
5ml of gas
Door
partially
open 11”
4:10 4:40 6:05
J (2) 3/10 Living
Rm
52 / 63% 10 / NNW Center of couch on horizontal cushion near the
back/vertical cushion with plastic bag, gauze with
5ml of gas
Door
partially
open 11”
4:56 5:03 7:48
* Experiment sets previously reported on in Gorbett, G, Hicks, W., et. al. (2006). Full-Scale Room Burn Patterns Study. ISFI: Cincinnati, OH